Attached files
| file | filename |
|---|---|
| EX-23.1 - CONSENT OF KPMG LLP - PENN VIRGINIA CORP | pva-20141231xex231.htm |
| EX-31.1 - EXHIBIT 31.1 - PENN VIRGINIA CORP | pva-20141231xex311.htm |
| EX-32.1 - EXHIBIT 32.1 - PENN VIRGINIA CORP | pva-20141231xex321.htm |
| EX-31.2 - EXHIBIT 31.2 - PENN VIRGINIA CORP | pva-20141231xex312.htm |
| EX-23.2 - CONSENT OF WRIGHT & COMPANY, INC. - PENN VIRGINIA CORP | pva-20141231xex232.htm |
| EX-21.1 - SUBSIDIARIES OF PENN VIRGINIA CORPORATION - PENN VIRGINIA CORP | pva-20141231xex211.htm |
| EX-32.2 - EXHIBIT 32.2 - PENN VIRGINIA CORP | pva-20141231xex322.htm |
| EX-10.56 - EXHIBIT 10.56 - PENN VIRGINIA CORP | pva-20141231xex1056.htm |
| EX-10.55 - EXHIBIT 10.55 - PENN VIRGINIA CORP | pva-20141231xex1055.htm |
| EXCEL - IDEA: XBRL DOCUMENT - PENN VIRGINIA CORP | Financial_Report.xls |
| EX-99.1 - REPORT OF WRIGHT & COMPANY, INC. - PENN VIRGINIA CORP | pva-20141231xex991.htm |
| EX-12.1 - EXHIBIT 12.1 - PENN VIRGINIA CORP | pva-20141231xex121.htm |
| EX-10.57 - EXHIBIT 10.57 - PENN VIRGINIA CORP | pva-20141231xex1057.htm |
UNITED STATES
SECURITIES AND EXCHANGE COMMISSION
Washington, D.C. 20549
________________________________________________________
FORM 10-K
________________________________________________________
ANNUAL REPORT PURSUANT TO SECTION 13 OR 15(d) OF THE
SECURITIES EXCHANGE ACT OF 1934
For the fiscal year ended December 31, 2014
Commission file number: 1-13283
_________________________________________________________

PENN VIRGINIA CORPORATION
(Exact name of registrant as specified in its charter)
Virginia | 23-1184320 | |
(State or other jurisdiction of incorporation or organization) | (I.R.S. Employer Identification Number) | |
Four Radnor Corporate Center, Suite 200
100 Matsonford Road
Radnor, Pennsylvania 19087
(Address of principal executive offices)
Registrant’s telephone number, including area code: (610) 687-8900
Securities registered pursuant to Section 12(b) of the Act: None
Securities registered pursuant to Section 12(g) of the Act:
Title of each class | Name of exchange on which registered | |
Common Stock, $0.01 Par Value | New York Stock Exchange | |
__________________________________________________________
Indicate by check mark if the registrant is a well-known seasoned issuer, as defined in Rule 405 of the Securities Act. Yes ý No ¨
Indicate by check mark if the registrant is not required to file reports pursuant to Section 13 or Section 15(d) of the Securities Exchange Act of 1934 (“Exchange Act”). Yes ¨ No ý
Indicate by check mark whether the registrant (1) has filed all reports required to be filed by Section 13 or 15(d) of the Exchange Act during the preceding 12 months (or for such shorter period that the registrant was required to file such reports), and (2) has been subject to such filing requirements for the past 90 days. Yes ý No ¨
Indicate by check mark whether the registrant has submitted electronically and posted on its corporate Web site, if any, every Interactive Data File required to be submitted and posted pursuant to Rule 405 of Regulation S-T during the preceding 12 months (or for such shorter period that the registrant was required to submit and post such files). Yes ý No ¨
Indicate by check mark if disclosure of delinquent filers pursuant to Item 405 of Regulation S-K is not contained herein, and will not be contained, to the best of the registrant’s knowledge, in definitive proxy or information statements incorporated by reference in Part III of this Form 10-K or any amendment to this Form 10-K. ý
Indicate by check mark whether the registrant is a large accelerated filer, an accelerated filer, a non-accelerated filer or a smaller reporting company. See the definitions of “large accelerated filer,” “accelerated filer” and “smaller reporting company” in Rule 12b-2 of the Exchange Act. (Check One)
Large accelerated filer | ý | Accelerated filer | o | Non-accelerated filer | o | Smaller reporting company | o | |||
Indicate by check mark whether the registrant is a shell company (as defined in Rule 12b-2 of the Exchange Act). Yes ¨ No ý
The aggregate market value of common stock held by non-affiliates of the registrant was $1,152,221,812 as of June 30, 2014 (the last business day of its most recently completed second fiscal quarter), based on the last sale price of such stock as quoted on the New York Stock Exchange. For purposes of making this calculation only, the registrant has defined affiliates as including all directors and executive officers of the registrant. This determination of affiliate status is not necessarily a conclusive determination for other purposes.
As of February 20, 2015, 71,581,690 shares of common stock of the registrant were outstanding.
DOCUMENTS INCORPORATED BY REFERENCE
Portions of the Proxy Statement relating to the registrant’s Annual Meeting of Shareholders, to be held on May 7, 2015, are incorporated by reference in Part III of this Form 10-K.
PENN VIRGINIA CORPORATION AND SUBSIDIARIES
ANNUAL REPORT ON FORM 10-K
For the Fiscal Year Ended December 31, 2014
Table of Contents
Page | ||
Forward-Looking Statements | ||
Glossary of Certain Industry Terminology | ||
Part I | ||
Item | ||
1. | Business | |
1A. | Risk Factors | |
1B. | Unresolved Staff Comments | |
2. | Properties | |
3. | Legal Proceedings | |
4. | Mine Safety Disclosures | |
Part II | ||
5. | Market for Registrant’s Common Equity, Related Shareholder Matters and Issuer Purchases of Equity Securities | |
6. | Selected Financial Data | |
7. | Management’s Discussion and Analysis of Financial Condition and Results of Operations: | |
Overview and Executive Summary | ||
Key Developments | ||
Results of Operations | ||
Financial Condition | ||
Off-Balance Sheet Arrangements | ||
Contractual Obligations | ||
Critical Accounting Estimates | ||
7A. | Quantitative and Qualitative Disclosures About Market Risk | |
8. | Financial Statements and Supplementary Data | |
9. | Changes in and Disagreements With Accountants on Accounting and Financial Disclosure | |
9A. | Controls and Procedures | |
9B. | Other Information | |
Part III | ||
10. | Directors, Executive Officers and Corporate Governance | |
11. | Executive Compensation | |
12. | Security Ownership of Certain Beneficial Owners and Management and Related Shareholder Matters | |
13. | Certain Relationships and Related Transactions, and Director Independence | |
14. | Principal Accountant Fees and Services | |
Part IV | ||
15. | Exhibits and Financial Statement Schedules | |
Signatures | ||
Forward-Looking Statements
Certain statements contained herein that are not descriptions of historical facts are “forward-looking” statements within the meaning of Section 27A of the Securities Act of 1933, as amended, and Section 21E of the Securities Exchange Act of 1934, as amended, or the Exchange Act. Because such statements include risks, uncertainties and contingencies, actual results may differ materially from those expressed or implied by such forward-looking statements. These risks, uncertainties and contingencies include, but are not limited to, the following:
• | the volatility of commodity prices for oil, natural gas liquids and natural gas; |
• | our ability to develop, explore for, acquire and replace oil and gas reserves and sustain production; |
• | our ability to generate profits or achieve targeted reserves in our development and exploratory drilling and well operations; |
• | any impairments, write-downs or write-offs of our reserves or assets; |
• | the projected demand for and supply of oil, natural gas liquids and natural gas; |
• | reductions in the borrowing base under our revolving credit facility; |
• | our ability to contract for drilling rigs, supplies and services at reasonable costs; |
• | our ability to obtain adequate pipeline transportation capacity for our oil and gas production at reasonable cost and to sell the production at, or at reasonable discounts to, market prices; |
• | the uncertainties inherent in projecting future rates of production for our wells and the extent to which actual production differs from estimated proved oil and gas reserves; |
• | drilling and operating risks; |
• | our ability to compete effectively against other oil and gas companies; |
• | our ability to successfully monetize select assets and repay our debt; |
• | leasehold terms expiring before production can be established; |
• | environmental obligations, costs and liabilities that are not covered by an effective indemnity or insurance; |
• | the timing of receipt of necessary regulatory permits; |
• | the effect of commodity and financial derivative arrangements; |
• | our ability to maintain adequate financial liquidity and to access adequate levels of capital on reasonable terms; |
• | the occurrence of unusual weather or operating conditions, including force majeure events; |
• | our ability to retain or attract senior management and key technical employees; |
• | counterparty risk related to the ability of these parties to meet their future obligations; |
• | compliance with and changes in governmental regulations or enforcement practices, especially with respect to environmental, health and safety matters; |
• | physical, electronic and cybersecurity breaches; |
• | uncertainties relating to general domestic and international economic and political conditions; and |
• | other factors set forth in our periodic filings with the Securities and Exchange Commission, including the risks set forth in Item 1A of this Annual Report on Form 10-K for the year ended December 31, 2014. |
Additional information concerning these and other factors can be found in our press releases and public periodic filings with the Securities and Exchange Commission. Many of the factors that will determine our future results are beyond the ability of management to control or predict. Readers should not place undue reliance on forward-looking statements, which reflect management’s views only as of the date hereof. All subsequent written and oral forward-looking statements attributable to us or persons acting on our behalf are expressly qualified in their entirety by these cautionary statements. We undertake no obligation to revise or update any forward-looking statements, or to make any other forward-looking statements, whether as a result of new information, future events or otherwise, except as may be required by applicable law.
1
Glossary of Certain Industry Terminology
The following abbreviations, terms and definitions are commonly used in the oil and gas industry and are used within this Annual Report on Form 10-K.
AMI. Area of mutual interest.
Bbl. A standard barrel of 42 U.S. gallons liquid volume of oil or other liquid hydrocarbons.
Bcf. One billion cubic feet of natural gas.
Bcfe. One billion cubic feet of natural gas equivalent with one barrel of crude oil, condensate or natural gas liquids converted to six thousand cubic feet of natural gas based on the estimated relative energy content.
BOE. One barrel of oil equivalent with six thousand cubic feet of natural gas converted to one barrel of crude oil based on the estimated relative energy content.
BOEPD. Barrels of oil equivalent per day.
Borrowing base. The value assigned to a collection of borrower’s assets used by lenders to determine an initial and/or continuing amount for loans. In the case of oil and gas exploration and development companies, the borrowing base is generally based on proved developed reserves.
Completion. A process of treating a drilled well, including hydraulic fracturing among other stimulation processes, followed by the installation of permanent equipment for the production of oil or gas.
Condensate. A mixture of hydrocarbons that exists in the gaseous phase at original reservoir temperature and pressure, but that, when produced, is in the liquid phase at surface temperature and pressure.
Development well. A well drilled within the proved area of an oil or gas reservoir to the depth of a stratigraphic horizon known to be productive.
Dry hole. A well found to be incapable of producing either oil or gas in sufficient commercial quantities to justify completion of the well.
Drilling carry. A working interest that will be carried through the drilling and completion of a well.
Exploratory well. A well drilled to find a new field or to find a new reservoir in a field previously found to be productive of oil or gas in another reservoir. Generally, an exploratory well is any well that is not a development well, a service well or a stratigraphic test well.
EUR. Estimated ultimate reserves, the sum of reserves remaining as of a given date and cumulative production as of that date.
GAAP. Accounting principles generally accepted in the Unites States of America.
Gas lift. A method of artificial lift that uses an external source of high-pressure gas for supplementing formation gas for lifting the well fluids.
Gross acre or well. An acre or well in which a working interest is owned.
HBP. Held by production is a provision in an oil and gas or mineral lease that perpetuates the leaseholder’s right to operate the property as long as the property produces a minimum paying quantity of oil or gas.
Henry Hub. The Erath, Louisiana settlement point price for natural gas.
IP. Initial production, a measurement of a well’s production at the outset.
LLS. Light Louisiana Sweet is a crude oil pricing index reference.
LIBOR. London Interbank Offered Rate.
MBbl. One thousand barrels of oil or other liquid hydrocarbons.
MBOE. One thousand barrels of oil equivalent.
Mcf. One million barrels of oil or other liquid hydrocarbons.
MMBbl. One million barrels of oil or other liquid hydrocarbons.
MMBOE. One million barrels of oil equivalent.
MMBtu. One million British thermal units, a measure of energy content.
MMcf. One million cubic feet of natural gas.
Net acre or well. The number of gross acres or wells multiplied by the owned working interest in such gross acres or wells.
NGL. Natural gas liquid.
NYMEX. New York Mercantile Exchange.
2
NYSE. New York Stock Exchange.
Operator. The entity responsible for the exploration and/or production of a lease or well.
Play. A geological formation with potential oil and gas reserves.
Preferential rights. The rights that nonselling participating parties have in a lease, well or unit to proportionately acquire the interest that a participating party proposes to sell to a third party.
Productive wells. Wells that are not dry holes.
Possible reserves. Those additional reserves that are less certain to be recovered than probable reserves. When probabilistic methods are used, there should be at least a 10% probability that the total quantities ultimately recovered will equal or exceed the proved plus probable plus possible reserves estimates.
Probable reserves. Those additional reserves that are less certain to be recovered than proved reserves but which, together with proved reserves, are as likely as not to be recovered. When probabilistic methods are used, there should be at least a 50% probability that the actual quantities recovered will equal or exceed the proved plus probable reserves estimates.
Proved reserves. Those quantities of oil and gas which, by analysis of geoscience and engineering data, can be estimated with reasonable certainty to be economically producible from a given date forward, from known reservoirs, and under existing economic conditions, operating methods and government regulations before the time at which contracts providing the right to operate expire, unless evidence indicates that renewal is reasonably certain, regardless of whether deterministic or probabilistic methods are used for the estimation.
Proved developed reserves. Proved reserves that can be expected to be recovered: (a) through existing wells with existing equipment and operating methods or in which the cost of the required equipment is relatively minor compared with the cost of a new well or (b) through installed extraction equipment and infrastructure operational at the time of the reserves estimate if the extraction is by means not involving a well.
Proved undeveloped reserves. Proved reserves that are expected to be recovered from new wells on undrilled acreage, or from existing wells where a relatively major expenditure is required for recompletion. Reserves on undrilled acreage are limited to those directly offsetting development spacing areas that are reasonably certain of production when drilled.
PV10. Present value of estimated future oil and gas revenues, net of estimated direct expenses, discounted at an annual discount rate of 10%.
Reservoir. A porous and permeable underground formation containing a natural accumulation of hydrocarbons that is confined by impermeable rock or water barriers and is separate from other reservoirs.
SEC. United States Securities and Exchange Commission.
Standardized measure. The present value, discounted at 10% per year, of estimated future cash inflows from the production of proved reserves, computed by applying prices used in estimating proved oil and gas reserves to the year-end quantities of those reserves (except for consideration of future price changes to the extent provided by contractual arrangements in existence at year-end), reduced by estimated future development and production costs, computed by estimating the expenditures to be incurred in developing and producing the proved oil and gas reserves at the end of the year (including the settlement of asset retirement obligations), based on year-end costs and assuming continuation of existing economic conditions, further reduced by estimated future income tax expenses, computed by applying the appropriate year-end statutory tax rates, with consideration of future tax rates already legislated, to the future pretax net cash flows relating to the proved oil and gas reserves, less the tax basis of the properties involved and giving effect to the tax deductions and tax credits and allowances relating to the proved oil and gas reserves.
Revenue interest. An economic interest in production of hydrocarbons from a specified property.
Royalty interest. An interest in the production of a well entitling the owner to a share of production generally free of the costs of exploration, development and production.
Unconventional. Generally refers to hydrocarbon reservoirs that lack discrete boundaries that typically define conventional reservoirs. They are typically referred to as shales, tight sands or coal beds.
Undeveloped acreage. Lease acreage on which wells have not been drilled or completed to a point that would permit the production of economic quantities of oil or gas, regardless of whether such acreage contains proved reserves.
WTI. West Texas Intermediate, a crude oil pricing index reference.
Working interest. A cost-bearing interest under an oil and gas lease that gives the holder the right to develop and produce the minerals under the lease.
3
Part I
Item 1 | Business |
Unless the context requires otherwise, references to the “Company,” “Penn Virginia,” “we,” “us” or “our” in this Annual Report on Form 10-K refer to Penn Virginia Corporation and its subsidiaries.
Description of Business
Penn Virginia Corporation is an independent oil and gas company engaged in the exploration, development and production of crude oil, NGLs and natural gas in various onshore regions of the United States, primarily the Eagle Ford Shale, or Eagle Ford, in South Texas. We were incorporated in the Commonwealth of Virginia in 1882. Our common stock is publicly traded on the NYSE under the symbol “PVA.” Our headquarters and corporate office is located in Radnor, Pennsylvania, and our operations are conducted primarily from our office in Houston, Texas. We also have district operations facilities at various locations in Texas and Oklahoma.
We operate in and report our financial results and disclosures as one segment, which is the exploration, development and production of crude oil, NGLs and natural gas. Each of our operating regions has similar economic characteristics and meets the criteria for aggregation as one reporting segment. Prior to June 2010, we were also engaged in the coal and natural resource management and natural gas midstream businesses. We completely disposed of our interests in those businesses in 2010 and have reported them as discontinued operations where applicable.
We own a highly contiguous position of approximately 102,000 net acres in the core liquids rich area or “volatile oil window” of the Eagle Ford, which we believe contains a substantial number of drilling locations and an approximate 15-year drilling inventory. In 2014, we spent approximately $785 million, or 99 percent, of our capital expenditures on our Eagle Ford operations and it accounted for 5.9 MMBOE, or 74 percent, of our 7.9 MMBOE total production. We also have operations in the Haynesville Shale and Cotton Valley in East Texas and the Granite Wash in Oklahoma.
We produce predominantly crude oil and NGLs. In 2014, our total production was comprised of 73 percent crude oil and NGLs and 27 percent natural gas, and crude oil and NGLs accounted for 89 percent of our product revenues. We generally sell our crude oil, NGL and natural gas products using short-term floating price physical and spot market contracts. Our crude oil sales are generally committed at the wellhead and are priced based on the NYMEX quoted price for WTI crude oil plus any differential for LLS less deductions for transportation and quality. Our NGLs are sold to interstate and midstream pipelines with pricing based on the Mont Belvieu, Texas or Conway, Kansas indices less deductions for transportation and fractionation and a marketing fee. Our natural gas production is also sold to interstate and midstream pipelines with pricing based on the NYMEX quoted price for Henry Hub natural gas adjusted for any basis differential or as a percentage of certain regional reference prices.
As of December 31, 2014, our proved reserves were approximately 115 MMBOE, of which 40 percent were proved developed reserves and 77 percent were oil and NGLs. We drilled 84 gross (51.6 net) wells, all in the Eagle Ford, in 2014. As of December 31, 2014, we had 738 gross (478.8 net) productive wells, approximately 90 percent of which we operate, and owned approximately 224,000 gross (158,600 net) acres of leasehold and royalty interests, approximately 45 percent of which were undeveloped. For a more detailed discussion of our production, reserves, drilling activities, wells and acreage, see Item 2, “Properties.”
Since 2010, we have disposed of an aggregate of approximately $232 million of primarily natural gas assets located in Mississippi, Appalachia, the Arkoma Basin and the Gulf Coast regions of South Texas and Louisiana. In addition, in 2014, we sold our natural gas gathering and gas lift assets in South Texas and the rights to construct an oil gathering system in South Texas for proceeds of approximately $243 million.
For additional financial and other information, see Item 7, “Management’s Discussion and Analysis of Financial Condition and Results of Operations—Key Developments” and our Consolidated Financial Statements and Notes thereto included in Item 8, “Financial Statements and Supplementary Data.”
Business Strategy
Our goal is to enhance long-term shareholder value. In 2015, we plan to focus on conserving an adequate level of liquidity, which we believe is approximately $150 million, operating with acceptable leverage and growing our business in a disciplined manner. We have taken, or intend to take, the following actions to accomplish our goal:
• | Maintain disciplined flexible capital spending. Crude oil prices have declined more than 45 percent since October 2014. As a result, we have reduced the number of rigs we are operating from eight in December 2014 to three currently. We plan to increase, or decrease, the number of rigs we operate depending upon the commodity price environment. In furtherance of this plan, we have entered into drilling and completion contracts with shorter terms, which afford us greater flexibility. |
4
• | Focus on high return projects. We intend to invest principally in our highest return development projects - those that we believe have significant resource potential discoverable at a low cost. We plan to continue to improve drilling and completion efficiencies and costs, including by using multi-well pad drilling, decreasing the number of frac stages per well by increasing the distance between stages, decreasing the amount of proppant per stage and renegotiating service sector costs. |
• | Protect cash flow with hedges. In 2014, we were able to execute additional hedge contracts for an average of 9,500 BOPD at a weighted-average price of $89.47 per Bbl for 2015 and 4,000 BOPD at a price of $88.12 per Bbl for 2016. The addition of these contracts has increased our total hedged crude oil production to 13,000 BOPD at a weighted-average price of $90.48 per Bbl for the first half of 2015 and 11,000 BOPD at a weighted-average price of $89.86 per Bbl for the second half of 2015, or approximately 80 to 90 percent of our total estimated crude oil production for 2015. |
At this time, we also plan to retain our substantial natural gas properties in the Haynesville Shale and Cotton Valley in East Texas, which are largely HBP and which provide us with an option to increase our natural gas production should prices increase.
Key Contractual Arrangements
In the ordinary course of operating our business, we enter into a number of key contracts for services that are critical with respect to our ability to develop, produce and bring our production to market. The following is a summary of our most significant contractual arrangements.
Drilling and Completion. We have agreements with vendors to provide oil and gas well drilling and well completion services. Generally, these agreements are on a month-to-month basis, but certain agreements extend for terms up to one year. Certain of these agreements include early termination provisions that require us to pay penalties if we terminate the agreements prior to the end of their original terms. We also purchase a substantial volume of well materials, including tubular products.
Natural gas contracts. In 2014, we entered into an agreement that will provide gathering, compression and transportation services for a portion of our natural gas production in the South Texas region until 2029. We have also entered into contracts that provide firm transportation capacity rights for specified volumes of natural gas on various other pipeline systems for terms ranging from one to 15 years. The contracts require us to pay transportation demand charges regardless of the amount of pipeline capacity we use. We may sell excess capacity to third parties at our discretion.
Oil transportation contracts. In 2014, we also entered into agreements to provide us gathering and intermediate pipeline transportation services for a substantial portion of our South Texas crude oil and condensate production. The gathering agreement has a 25-year term and the intermediation transportation agreement has a 10-year term, both of which will commence upon completion of construction of the gathering system, which is expected in the third quarter of 2015.
Major Customers
We sell a significant portion of our oil and gas production to a relatively small number of customers. For the year ended December 31, 2014, approximately 50 percent of our consolidated product revenues were attributable to three customers: Sunoco Refining and Marketing, Inc.; Phillips 66 Company; and Gulfmark Energy Inc.
Seasonality
Our sales volumes of oil and gas are dependent upon the number of producing wells and, therefore, are not seasonal by nature. We do not believe that the pricing of our oil and NGL production is subject to any meaningful seasonal effects. Historically, the pricing of natural gas is seasonal, typically with higher pricing in the winter months.
Competition
The oil and gas industry is very competitive, and we compete with a substantial number of other companies, many of which are large, well-established and have greater financial and operational resources than we do, which may adversely affect our ability to compete or grow our business. Some of our competitors not only engage in the acquisition, exploration, development and production of oil and gas reserves, but also carry on refining operations, electricity generation and the marketing of refined products. In addition, the oil and gas industry in general competes with other industries supplying energy and fuel to industrial, commercial and individual consumers. Competition is particularly intense in the acquisition of prospective oil and gas properties. We may incur higher costs or be unable to acquire and develop desirable properties at costs we consider reasonable because of this competition. We also compete with other oil and gas companies to secure drilling rigs and other equipment necessary for the drilling and completion of wells and in the recruiting and retaining of qualified personnel. Such equipment and labor may be in short supply from time to time. Shortages of equipment, labor or materials may result in increased costs or the inability to obtain such resources as needed. In addition, many of our larger competitors may have a competitive advantage when responding to commodity price volatility and overall industry cycles.
5
Government Regulation and Environmental Matters
Our operations are subject to extensive federal, state and local laws that govern oil and gas operations, regulate the discharge of materials into the environment or otherwise relate to the protection of the environment. Numerous governmental departments issue rules and regulations to implement and enforce such laws that are often difficult and costly to comply with and which carry substantial administrative, civil and even criminal penalties as well as the issuance of injunctions limiting or prohibiting our activities for failure to comply. Some laws, rules and regulations relating to protection of the environment may, in certain circumstances, impose “strict liability” for environmental contamination, rendering a person liable for environmental and natural resource damages and cleanup costs without regard to negligence or fault on the part of such person. Other laws, rules and regulations may restrict the rate of oil and gas production below the rate that would otherwise exist or even prohibit exploration or production activities in sensitive areas. In addition, state laws often require some form of remedial action to prevent pollution from former operations, such as plugging of abandoned wells. As of December 31, 2014, we have recorded asset retirement obligations of $5.9 million attributable to these activities. The regulatory burden on the oil and gas industry increases its cost of doing business and consequently affects its profitability. These laws, rules and regulations affect our operations, as well as the oil and gas exploration and production industry in general. We believe that we are in substantial compliance with current applicable environmental laws, rules and regulations and that continued compliance with existing requirements will not have a material impact on our financial condition, results of operations and cash flows. Nevertheless, changes in existing environmental laws or regulations or the adoption of new environmental laws or regulations, including any significant limitation on the use of hydraulic fracturing, could have the potential to adversely affect our financial condition, results of operations and cash flows.
The following is a summary of the significant environmental laws to which our business operations are subject.
CERCLA. The Comprehensive Environmental Response, Compensation, and Liability Act, or CERCLA, is also known as the “Superfund” law. CERCLA and comparable state laws impose liability, without regard to fault or the legality of the original conduct, on parties that are considered to have contributed to the release of a “hazardous substance” into the environment. Such “responsible parties” may be subject to joint and several liability under CERCLA for the costs of cleaning up the hazardous substances that have been released into the environment and for damages to natural resources. It is not uncommon for neighboring landowners and other third parties to file claims for personal injury and property damage allegedly caused by the hazardous substances released into the environment. We currently own or lease properties that have been used for the exploration and production of oil and gas for a number of years. Many of these properties have been operated by third parties whose treatment or release of hydrocarbons or other wastes was not under our control. These properties, and any wastes that may have been released on them, may be subject to CERCLA, and we could potentially be required to investigate and remediate such properties, including soil or groundwater contamination by prior owners or operators, or to perform remedial plugging or pit closure operations to prevent future contamination.
RCRA. The Resource Conservation and Recovery Act, or RCRA, and comparable state statutes regulate the generation, transportation, treatment, storage, disposal and clean up of hazardous and non-hazardous wastes. Under the auspices of the United States Environmental Protection Agency, or the EPA, the individual states administer some or all of the provisions of RCRA. While there is currently an exclusion from RCRA for drilling fluids, produced waters and most of the other wastes associated with the exploration and production of oil or gas, it is possible that some of these wastes could be classified as hazardous waste in the future, and therefore be subject to RCRA.
Oil Pollution Act. The Oil Pollution Act of 1990, or the OPA, contains numerous restrictions relating to the prevention of and response to oil spills into waters of the United States. The term “waters of the United States” has been interpreted broadly to include inland water bodies, including wetlands and intermittent streams. The OPA subjects owners of facilities to strict, joint and several liability for all containment and clean up costs, and certain other damages arising from a spill.
Clean Water Act. The Federal Water Pollution Control Act, or the Clean Water Act, governs the discharge of certain pollutants into waters of the United States. The discharge of pollutants into regulated waters without a permit issued by the EPA or the state is prohibited. The Clean Water Act also requires the preparation and implementation of Spill Prevention, Control and Countermeasure Plans in connection with on-site storage of significant quantities of oil. Notably, in Pennsylvania, wastewater from the hydraulic fracturing process can no longer be sent to publicly owned treatment works directly. New wastewater discharges must be treated at a centralized waste treatment facility and comply with certain Total Dissolved Solids standards prior to being discharged to publicly owned treatment works. This restriction of disposal options for hydraulic fracturing waste may result in increased costs. The EPA is also developing a proposed rule to amend the Effluent Limitations Guidelines and Standards for the oil and gas industry, an effort expected to require analogous pretreatment standards on the federal level. The EPA’s proposed rule is scheduled for publication in early 2015.
Safe Drinking Water Act. The Safe Drinking Water Act, or the SDWA, and the Underground Injection Control Program promulgated under the SDWA, establish the requirements for salt water disposal well activities and prohibit the migration of fluid containing contaminants into underground sources of drinking water. We engage third parties to provide hydraulic fracturing or other well stimulation services to us in connection with the wells in which we act as operator. Hydraulic fracturing is an important and commonly used process in the completion of oil and gas wells, particularly in unconventional
6
plays like the Eagle Ford, Granite Wash, Haynesville Shale and the Marcellus Shale formations. The Fracturing Responsibility and Awareness of Chemicals Act that was introduced in both the 111th and 112th Congresses would subject hydraulic fracturing operations to federal regulation under the SDWA and require the disclosure of chemicals used by us and others in the oil and gas industry in the hydraulic fracturing process. Sponsors of these bills have asserted that chemicals used in the fracturing process could adversely affect drinking water supplies. Proposed legislation would require, among other things, the reporting and public disclosure of chemicals used in the fracturing process, which could make it easier for third parties opposing the hydraulic fracturing process to initiate legal proceedings against producers and service providers. In addition, these bills, if adopted, could establish an additional level of regulation and permitting of hydraulic fracturing operations at the federal level, which could lead to operational delays, increased operating and compliance costs and additional regulatory burdens that could make it more difficult or commercially impracticable for us to perform hydraulic fracturing. Such costs and burdens could delay the development of unconventional gas resources from shale formations, which are not commercial without the use of hydraulic fracturing. Additionally, the EPA has commenced a comprehensive research study to investigate the potential adverse impacts of hydraulic fracturing on drinking water and ground water. The EPA last released a progress report on its study on December 21, 2012. A draft of the study was expected to be released to the public in 2014, but has yet to be issued.
Chemical Disclosures Related to Hydraulic Fracturing. Certain states in which we operate have adopted regulations requiring the disclosure of chemicals used in the hydraulic fracturing process. For instance, Oklahoma, Pennsylvania and Texas have implemented chemical disclosure requirements for hydraulic fracturing operations. In May 2014, the EPA issued an advance notice of proposed rulemaking relating to the collection of information on various chemicals and mixtures used in hydraulic fracturing. Additionally, in 2015, several environmental groups filed suit in the District of Columbia federal district court against the EPA seeking a response to plaintiffs’ October 2012 petition to the EPA to bring the oil and gas industry within the scope of the Toxic Release Inventory (“TRI”) reporting requirements under the Emergency Planning and Community Right-to-Know Act (“EPCRA”). The TRI provisions of EPCRA require covered facilities to report, on an annual basis, releases into the environment of specifically-listed chemicals. We currently disclose all hydraulic fracturing additives we use on www.FracFocus.org, a website created by the Ground Water Protection Council and Interstate Oil and Gas Compact Commission.
Prohibitions and Other Regulatory Limitations on Hydraulic Fracturing. There have been a variety of regulatory initiatives at the state level to restrict oil and gas drilling operations in certain locations. For example, Pennsylvania has instituted a moratorium on leasing state forest land for gas drilling, and municipalities in New York have banned or limited hydraulic fracturing within their borders. In December 2014, the administration of Gov. Andrew Cuomo announced that it will ban high volume hydraulic fracturing (“HVHF”) in New York in 2015 on the grounds that there is insufficient information to assess the risks to public health associated with HVHF and whether any such risks can be adequately managed. In November 2014, voters in the City of Denton, Texas, approved a local ordinance banning fracking. This has resulted in two separate lawsuits, one filed by the Texas Oil & Gas Association and the other by the State Land Commissioner, challenging the local ban. Like the similar suits in other states, the claims in these cases focus on the issue of whether state law - through regulation by the Texas Railroad Commission and other state agencies - preempts the local ordinance.
A recent decision by the Pennsylvania Supreme Court addressing preemption may empower local governments to limit and/or regulate hydraulic fracturing, which could complicate and delay hydraulic fracturing activity. In February 2012, Pennsylvania passed Act 13, which, among other things, provided for new well fees assessed and collected on unconventional wells, substantial revisions to environmental protections for both surface and subsurface activities, and prevented local zoning rules from imposing burdens on oil and gas activities beyond those required by the state. However, in December 2013, the court struck down portions of Act 13, including deeming the statewide preemption of local zoning rules and the setback requirement waiver provisions unconstitutional. On remand, the lower court held that several other provisions of Act 13 could not be severed from those ruled as unconstitutional. As a result of these decisions, whether a state-wide approach to regulating oil and gas drilling and hydraulic fracturing may preempt local limitations in Pennsylvania remains an open question. If, through future jurisprudence or legislative action, such preemption does not apply under Pennsylvania law (or the law of other jurisdictions in which we operate), the net effect may be to subject hydraulic fracturing activities to local limitations and potentially duplicative and inconsistent regulations.
In addition to chemical disclosure rules, some states have implemented permitting, well construction or water withdrawal regulations that may increase the costs of hydraulic fracturing operations. Pennsylvania and West Virginia have issued setback regulations for wells. Colorado recently enacted new setback restrictions as well as requirements to conduct sampling on water wells before and after drilling. In addition, states such as Texas and Pennsylvania have water withdrawal restrictions allowing suspension of withdrawal rights in times of shortages while other states require reporting on the amount of water used and its source.
Increased regulation of and attention given by environmental interest groups, as well as state and federal regulatory authorities, to the hydraulic fracturing process could lead to greater opposition to oil and gas production activities using hydraulic fracturing techniques. Additional legislation or regulation could also lead to operational delays or increased operating costs in the production of oil and gas, including from the developing shale plays, or could make it more difficult to
7
perform hydraulic fracturing. These developments could also lead to litigation challenging proposed or operating wells. The adoption of federal, state or local laws or the implementation of regulations regarding hydraulic fracturing that are more stringent could cause a decrease in the completion of new oil and gas wells, as well as increased compliance costs and time, which could adversely affect our financial position, results of operations and cash flows. We use hydraulic fracturing extensively and any increased federal, state, or local regulation of hydraulic fracturing could reduce the volumes of oil and gas that we can economically recover.
Clean Air Act. Our operations are subject to the Clean Air Act, or the CAA, and comparable state and local requirements. In 1990, the U.S. Congress adopted amendments to the CAA containing provisions that have resulted in the gradual imposition of certain pollution control requirements with respect to air emissions from our operations. The EPA and states have developed, and continue to develop, regulations to implement these requirements. We may be required to incur certain capital expenditures in the next several years for air pollution control equipment in connection with maintaining or obtaining operating permits and approvals addressing other air emission-related issues. Further, stricter requirements could negatively impact our production and operations. For example, the Texas Commission on Environmental Quality and the Railroad Commission of Texas have been evaluating possible additional regulation of air emissions in response to concerns about allegedly high concentrations of benzene in the air near drilling sites and natural gas processing facilities. These initiatives could lead to more stringent air permitting, increased regulation and possible enforcement actions at the local, state and federal levels.
Additionally, on April 17, 2012, the EPA issued new rules subjecting all oil and gas operations (production, processing, transmission, storage and distribution) to regulation under the New Source Performance Standards, or NSPS, and National Emission Standards for Hazardous Air Pollutants, or NESHAPS, programs. These rules restrict volatile organic compound emissions from three subcategories of fractured and refractured gas wells for which well completion operations are conducted: wildcat (exploratory) and delineation gas wells; low reservoir pressure non wildcat and non delineation gas wells; and all “other” fractured and refractured gas wells. All three subcategories of wells must route flow back emissions to a gathering line or be captured and combusted using a combustion device such as a flare. “Other” wells, however, must use reduced emission completions, also known as “green completions,” with or without combustion devices. These regulations also establish specific requirements regarding emissions from production related wet seal and reciprocating compressors, pneumatic controllers, and storage vessels. In September 2013 and December 2014, the EPA published updates to the 2012 performance standards, which, among other things, set the compliance deadline for tanks based upon when they were put into use. The EPA received numerous requests for reconsideration of these rules, and court challenges to the rules were also filed. The EPA has issued, and will likely continue to issue, revised rules responsive to some of these requests. These rules, as well as any future laws and their implementing regulations may require a number of modifications to our operations, including the installation of new equipment to control emissions from our compressors at initial startup or by the applicable compliance deadline. We may also be required to obtain pre-approval for the expansion or modification of existing facilities or the construction of new facilities. Compliance with such rules could result in significant costs, including increased capital expenditures and operating costs, and could adversely impact our business. We are currently researching the effect these new rules will have on our business, but generally expect them to add to the cost and expense of our operations.
There have been recent claims asserted that individual wells and other facilities should be “aggregated” together and their collective emissions considered in determining whether major source permitting requirements apply under the CAA. If we were required to aggregate individual wells and other facilities, it could bring us within the ambit of the Title V permitting program, and we could be considered a major source for MACT applicability. For example, though the Sixth Circuit recently vacated an EPA determination to aggregate natural gas wells and a sweetening plant in Summit Petroleum Corp. v. EPA et al., the EPA released a December 21, 2012 memorandum stating that although the EPA will follow the court’s interpretation when considering aggregation in the Sixth Circuit, it will continue to follow its current practice of considering interrelatedness in other jurisdictions. In May 2014, the United States Circuit Court of Appeals for the District of Columbia, in National Environmental Development Association’s Clean Air Project v. EPA, ruled that the EPA cannot by policy memorandum direct the use of differing Clean Air Act interpretations in different regions of the country, thereby invalidating the December 21, 2012 memorandum. As a result of this decision, in order to comply with the various decisions described above, the EPA must follow the Summit court’s narrow interpretation when considering aggregation or revise its regulations to modify its test for aggregation. In addition, in Citizens for Pennsylvania’s Future v. Ultra Resources, Inc., a case challenging a decision not to aggregate certain facilities in Pennsylvania, the court allowed the case to move forward by denying defendant’s motion to dismiss, even though the plaintiff had not exhausted review procedures with the administrative agency.
Greenhouse Gas Emissions. Both in the United States and worldwide, there is increasing attention being paid to the issue of climate change and the contributing effect of greenhouse gas, or GHG, emissions. On June 28, 2010, the EPA issued the “Final Mandatory Reporting of Greenhouse Gases” Rule, or the Reporting Rule, requiring all stationary sources that emit more than 25,000 tons of GHGs per year to collect and report to the EPA data regarding such emissions. The Reporting Rule establishes a new comprehensive scheme, which began in 2011, requiring operators of stationary sources emitting more than established annual thresholds of carbon dioxide-equivalent GHGs to inventory and report their GHG emissions occurring in the prior calendar year on a facility-by-facility basis. On November 9, 2010, the EPA issued final rules applying these regulations
8
to the oil and gas source category, including oil and gas production, natural gas processing, transmission, distribution and storage facilities (Subpart W). More recently, in a December 2014 proposed rule, the EPA proposed to require GHG reporting by yet additional petroleum and natural gas systems, including various equipment and systems associated with hydraulic fracturing operations. This action does not require control of GHGs. However, the EPA has indicated that it will use data collected through the reporting rules to decide whether to promulgate future GHG limits.
In addition, in 2009, the EPA issued a final rule known as the EPA’s Endangerment Finding finding that current and projected concentrations of six key GHGs in the atmosphere threaten public health and the environment, as well as the welfare of current and future generations. Legal challenges to these findings have been asserted, and the U.S. Congress is considering legislation to delay or repeal the EPA’s actions, but we cannot predict the outcome of this litigation or these efforts. The EPA has begun adopting and implementing regulations to restrict emissions of GHGs under existing provisions of the CAA. These rules were subject to judicial challenge, but on June 26, 2012, the U.S. Court of Appeals for the District of Columbia Circuit rejected challenges to the tailoring rule and other EPA rules relating to the regulation of GHGs under the CAA.
Starting July 1, 2011, the EPA required facilities that must already obtain New Source Review permits for other pollutants to include GHGs in their permits for new construction projects that emit at least 100,000 tons per year of GHGs and existing facilities that increase their emissions by at least 75,000 tons per year. On March 27, 2012, the EPA issued its proposed NSPS for carbon dioxide emissions standard from new and modified power plants and held public hearings on the rule in May 2012 and accepted written comments until June 25, 2012. In its June 2013 Climate Action Plan, the Obama Administration announced its intent to issue regulations under Section 111(b) and Section 111(d) of the CAA to set NSPS for both new and existing power plants by June 2015. In January 2014, the EPA formally published re-proposed GHG NSPS for new and modified electric generating units (“EGUs”). The Climate Action Plan also directs federal agencies to develop a strategy for the reduction of methane emissions, including emissions from the oil and natural gas agency. More recently, it has been reported that the EPA will issue a proposed rule in the summer of 2015 that would cut methane emissions from oil and gas production by up to 45 percent by 2025 from the levels recorded in 2012.
On June 2, 2014, the EPA released the Clean Power Plan. Though the plan does not regulate hydraulic fracturing operations, it sets a national carbon pollution standard that is projected to cut emissions produced by United States power plants by 30% by 2030 as compared to 2005 levels. Although states can choose to rely on the four measures set by the EPA to meet this goal, the states themselves will ultimately decide the means to use. States can develop individual plans, or they can collaborate with other states. These measures states may employ include: renewable energy standards, efficiency improvements at plants, switching to natural gas, transmission efficiency improvements, energy storage technology, and expanding renewables or nuclear, and energy conservation programs. Under the proposed rule, states will have until June 2016 to submit final plans, although extensions may be allotted if needed. The final rule is expected to be issued in June 2015 and the emissions reductions are scheduled to commence in 2020. An Ohio-based coal company has already filed a legal challenge to the proposed rulemaking in the D.C. Circuit, and nine states have joined.
The U.S. Supreme Court, in a decision issued on June 23, 2014, addressed whether the EPA’s regulation of GHG emissions from new motor vehicles properly triggered GHG permitting requirements for stationary sources under the Clean Air Act. Through its Prevention of Significant Deterioration (“PSD”) and Title V Greenhouse Gas Tailoring Rule, the EPA sought to require large industrial facilities, including coal-fired power plants, to obtain permits to emit, and to use best available control technology to curb, GHG emissions. The decision reversed, in part, and affirmed, in part, a 2012 D.C. Circuit decision that upheld the EPA’s GHG-related regulations. Specifically, the court held that the EPA exceeded its statutory authority when it interpreted the Clean Air Act to require Prevention of Significant Deterioration and Title V permitting for stationary sources based on their potential GHG emissions. However, the Court also held that the EPA’s determination that a source already subject to the PSD program due to its emission of conventional pollutants may be required to limit its GHG emissions by employing the “best available control technology” was permissible.
As a result of this continued regulatory focus, future federal GHG regulations of the oil and gas industry remain a possibility. Also, many states and regions have adopted GHG initiatives and certain governmental bodies have or are considering the imposition of fees or taxes based on the emission of GHGs by certain facilities. While it is not possible to predict how any regulations to restrict GHG emissions may come into force, these and other legislative and regulatory proposals for restricting GHG emissions or otherwise addressing climate change could require us to incur additional operating costs or curtail oil and gas operations in certain areas and could also adversely affect demand for the oil and gas we sell.
Finally, it should be noted that some scientists have concluded that increasing concentrations of GHGs in the Earth’s atmosphere may produce climate changes that have significant physical effects, such as increased frequency and severity of storms, floods and other climatic events; if any such effects were to occur, they could have an adverse effect on our operations.
OSHA. We are subject to the requirements of the Occupational Safety and Health Act, or OSHA, and comparable state laws that regulate the protection of the health and safety of workers. In addition, the OSHA hazard communication standard requires maintenance of information about hazardous materials used or produced in operations, and the provision of such information to employees, state and local government authorities and citizens. Other OSHA standards regulate specific worker safety aspects of our operations.
9
Endangered Species Act. The Endangered Species Act restricts activities that may affect endangered species or their habitats. While some of our facilities are in areas that may be designated as a habitat for endangered species, we believe that we are in substantial compliance with the Endangered Species Act. Moreover, the U.S. Fish and Wildlife Service continues its six-year effort to make listing decisions and critical habitat designations where necessary for over 250 species before the end of the agency’s 2017 fiscal year, as required under a 2011 settlement approved by the U.S. District Court for the District of Columbia, and many hundreds of additional anticipated listing decisions have already been identified beyond those recognized in the 2011 settlement. The presence of any protected species or the final designation of previously unprotected species as threatened or endangered in areas where we operate could result in increased costs from species protection measures or could result in limitations, delays, or prohibitions on our exploration and production activities that could have an adverse effect on our ability to develop and produce our reserves.
Employees and Labor Relations
We had a total of 164 employees as of December 31, 2014. We consider our current employee relations to be favorable. We and our employees are not subject to any collective bargaining agreements.
Available Information
Our internet address is http://www.pennvirginia.com. We make available free of charge on or through our website our Corporate Governance Principles, Code of Business Conduct and Ethics, Executive and Financial Officer Code of Ethics, Audit Committee Charter, Compensation and Benefits Committee Charter and Nominating and Governance Committee Charter, and we will provide copies of such documents to any shareholder who so requests. We also make available free of charge on or through our website our Annual Report on Form 10-K, Quarterly Reports on Form 10-Q, Current Reports on Form 8-K and any amendments to those reports filed or furnished pursuant to Section 13(a) or 15(d) of the Exchange Act, as soon as reasonably practicable after we electronically file such material with, or furnish it to, the SEC.
Item 1A Risk Factors
Our business and operations are subject to a number of risks and uncertainties as described below. However, the risks and uncertainties described below are not the only ones we face. Additional risks and uncertainties that we are unaware of, or that we may currently deem immaterial, may become important factors that harm our business, financial condition, results of operations and cash flows. If any of the following risks actually occur, our business, financial condition, results of operations and cash flows could suffer and the trading price of our common stock could decline.
Crude oil, NGL and natural gas prices are volatile, and a substantial or extended decline in prices would hurt our profitability and financial condition.
Our revenues, operating results, cash flows, profitability, future rate of growth and the carrying value of our oil and gas properties depend heavily on prevailing market prices for crude oil, NGLs and natural gas. Historically, crude oil, NGL and natural gas prices have been volatile, and they are likely to continue to be volatile. In particular, average monthly WTI crude oil prices have decreased from over $105 per barrel in June 2014 to less than $45 per barrel in January 2015. Decreases in commodity prices have led us to curtail drilling and other exploration activities in 2015. Even relatively modest drops in prices can affect significantly our financial results and impede our growth. Wide fluctuations in crude oil, NGLs and natural gas prices may result from relatively minor changes in the supply of and demand for oil and gas, market demand and other factors that are beyond our control, including:
• | domestic and foreign supplies of crude oil, NGLs and natural gas; |
• | domestic and foreign consumer demand for crude oil, NGLs and natural gas; |
• | political and economic conditions in oil or gas producing regions; |
• | the ability of the members of the Organization of Petroleum Exporting Countries and other exporting nations to agree upon and maintain production constraints and oil price controls; |
• | overall domestic and foreign economic conditions; |
• | prices and availability of, and demand for, alternative fuels; |
• | technological advances affecting energy consumption; |
• | speculation by investors in oil and gas; |
• | the availability, proximity and capacity of gathering, processing, refining and transportation facilities; |
• | weather conditions; and |
• | domestic and foreign governmental regulation and taxation. |
It is impossible to predict future oil and gas price movements with certainty. However, many of our projections and estimates are based on assumptions as to the future prices of crude oil, NGLs and natural gas. These price assumptions are used for planning purposes. We expect our assumptions will change over time and that actual prices in the future will likely differ
10
from our estimates. Any substantial or extended decline in the actual prices of crude oil, NGLs or natural gas would have a material adverse effect on our business, financial position, results of operations and cash flows and borrowing capacity, the quantities of oil and gas reserves that we can economically produce, the quantity of estimated proved reserves that may be attributed to our properties and our ability to fund our capital program. In addition, if we expect or experience significant sustained decreases in crude oil and natural gas prices such that the expected future cash flows from our crude oil and natural gas properties falls below the net book value of our properties, we may be required to write down the value of our crude oil and natural gas properties. Any such asset impairments could materially and adversely affect our results of operations and, in turn, the trading price of our common stock
Our future performance depends on our ability to find or acquire additional oil and gas reserves that are economically recoverable.
Unless we successfully replace the reserves that we produce, our reserves will decline, eventually resulting in a decrease in oil and gas production and lower revenues and cash flows from operating activities. We have historically succeeded in substantially replacing reserves primarily through exploration and development and, to a lesser extent, acquisitions. We have conducted such activities on our existing oil and gas properties as well as on newly acquired properties. We may not be able to continue to replace reserves and production from such activities at acceptable costs. Lower prices also decrease our cash flows from operating activities and may cause us to reduce capital expenditures.
The business of exploring for, developing or acquiring reserves is capital intensive. We may not be able to make the necessary capital investments to maintain or expand our oil and gas reserves if cash flows from operating activities are reduced and external sources of capital are limited. In addition, exploration and development activities involve numerous risks that may result in dry holes, the failure to produce oil and gas in commercial quantities and the inability to fully produce discovered reserves.
We are continually identifying and evaluating acquisition opportunities. Competition for oil and gas properties can be intense, however, and many of our competitors have financial and other resources substantially greater than those available to us. In the event we are successful in completing an acquisition, we cannot ensure that such acquisition will consist of properties that contain economically recoverable reserves or that such acquisition will be profitably integrated into our operations.
We may not be able to fund our planned capital expenditures.
We must make substantial capital expenditures to find, acquire, develop and produce oil and gas reserves. In 2015, we anticipate making capital expenditures, excluding acquisitions, of up to approximately $345 million compared to $794 million in 2014.
If crude oil or NGL prices continue to decrease, natural gas prices fail to recover or we encounter operating difficulties that result in our cash flow from operations being less than expected, we may have to further reduce our capital expenditures unless we have sufficient borrowing capacity under our revolving credit agreement, or the Revolver, or we obtain alternative financing.
Future cash flows and the availability of financing will also be subject to a number of variables, such as our success in locating and producing new reserves, the level of production from existing wells and prices of crude oil, NGLs and natural gas.
If our revenues were to decrease due to lower crude oil, NGL and natural gas prices, decreased production or other reasons, and if we could not obtain capital through the Revolver, or otherwise on acceptable terms, our ability to execute our development plans, replace our reserves or maintain production levels could be greatly limited.
We have a significant amount of indebtedness and our ability to service our indebtedness depends on certain financial, business and other factors, many of which are beyond our control.
As of December 31, 2014, we had an aggregate of approximately $1.1 billion of debt outstanding and would have been able to incur an additional $413.2 million (net of $1.8 million of letters of credit) under the Revolver. We may incur additional indebtedness in the future. Any increase in our level of indebtedness will have several important effects on our future operations, including, without limitation:
• | we will have additional cash requirements in order to support the payment of interest on our outstanding indebtedness; |
• | increases in our outstanding indebtedness and leverage will increase our vulnerability to adverse changes in general economic and industry conditions, as well as to competitive pressure; and |
• | depending on the levels of our outstanding debt, our ability to obtain additional financing for working capital, capital expenditures, general corporate and other purposes may be limited. |
Our ability to make scheduled payments of principal and interest on our indebtedness or to refinance our debt obligations depends on our future financial condition and operating performance, which will be subject to general economic conditions and to certain financial, business and other factors affecting our operations, many of which are beyond our control. If we are unable
11
to generate sufficient cash flows from operating activities in the future to service our debt, we may be forced, among other things, to:
• | seek additional financing in the debt or equity markets; |
• | refinance or restructure all or a portion of our indebtedness; |
• | sell selected assets; |
• | reduce or delay planned capital expenditures; or |
• | reduce or delay planned operating expenditures. |
Such measures might not be successful and might not enable us to service our debt. In addition, any such financing, refinancing or sale of assets might not be available on economically favorable terms or at all.
The borrowing base under the Revolver may be reduced in the future if commodity prices remain below recent historical averages.
The borrowing base under the Revolver was $500 million as of December 31, 2014. Our borrowing base is redetermined twice each year and is scheduled to be redetermined during May 2015. If crude oil, NGL or natural gas prices decline or fail to recover to prior levels, the borrowing base under the Revolver may be reduced. As a result, we may be unable to obtain funding under the Revolver. If funding is not available when or in the amounts needed, or is available only on unfavorable terms, it might adversely affect our development plan as currently anticipated and our ability to make new acquisitions, each of which could have a material adverse effect on our production, financial condition, results of operations and cash flows.
The Revolver and our other debt instruments have restrictive covenants that could limit our financial flexibility and our ability to borrow.
The Revolver and the indentures related to our outstanding senior notes contain financial and other restrictive covenants that limit our ability to engage in activities that may be in our long-term best interests.
Our ability to borrow under the Revolver is subject to compliance with certain financial covenants, including leverage and current ratios. Under our current 2015 business plan, we are projected to be operating near the limits of the leverage permitted by the Revolver. If at any time we anticipate that we may exceed such limits, we would be forced to seek a means to cure the potential breach such as requesting a Revolver amendment to increase the permitted leverage, decreasing the pace or magnitude of our capital program or considering a capital markets transaction. There can be no assurance that any of these potential solutions would be successful and, if we were to exceed our leverage limits, we would be in breach of the Revolver.
The Revolver includes other restrictions that, among other things, limit our ability to incur indebtedness; grant liens; engage in mergers, consolidations and liquidations; make asset dispositions, restricted payments and investments; enter into transactions with affiliates; and amend, modify or prepay certain indebtedness. The indentures related to our outstanding senior notes contain limitations on our ability to effect mergers and change of control events, as well as other limitations, including:
• | limitations on the declaration and payment of dividends or other restricted payments; |
• | limitations on incurring additional indebtedness or issuing preferred stock; |
• | limitations on the creation or existence of certain liens; |
• | limitations on incurring restrictions on the ability of certain of our subsidiaries to pay dividends or other payments; |
• | limitations on transactions with affiliates; and |
• | limitations on the sale of assets. |
Our business plan and our compliance with these covenants are based on a number of assumptions, the most important of which is relatively stable oil and gas prices at economically sustainable levels. If the price that we receive for our oil and gas production deteriorates significantly from current levels it could lead to lower revenues, cash flow and earnings, which in turn could lead to a default under certain financial covenants contained in our revolving credit facility. Because the calculations of the financial ratios are made as of certain dates, the financial ratios can fluctuate significantly from period to period as the amounts outstanding under our revolving credit facility are dependent on the timing of cash flows related to operations, capital expenditures, sales of oil and gas properties and securities offerings. Our failure to comply with these covenants could result in an event of default that, if not cured or waived, could result in the acceleration of all of our debts. We do not have sufficient working capital to satisfy our debt obligations in the event of an acceleration of all or a significant portion of our outstanding indebtedness.
Exploration and development drilling may not result in commercially productive reserves.
Oil and gas drilling and production activities are subject to numerous risks, including the risk that no commercially productive oil or gas reserves will be found. The costs of drilling, completing and operating wells are often substantial and uncertain, and drilling operations may be curtailed, delayed or canceled as a result of a variety of factors, many of which are beyond our control. These factors include:
• | unexpected drilling conditions; |
12
• | elevated pressure or irregularities in geologic formations; |
• | title problems; |
• | equipment failures or accidents; |
• | costs, shortages or delays in the availability of drilling rigs, crews, equipment and materials; |
• | shortages in experienced labor; |
• | surface access restrictions; |
• | failure to or delays in securing necessary regulatory approvals and permits, including delays due to potential hydraulic fracturing regulations; |
• | fires, explosions, blow-outs and surface cratering; and |
• | adverse weather conditions. |
The prevailing prices of crude oil, NGLs and natural gas also affect the cost of and the demand for drilling rigs, production equipment and related services. The availability of drilling rigs and equipment can vary significantly from region to region at any particular time. Although land drilling rigs can be moved from one region to another in response to changes in levels of demand, an undersupply of rigs in any region may result in drilling delays and higher drilling costs for the rigs that are available in that region.
The wells we drill may not be productive and we may not recover all or any portion of our investment in such wells. The seismic data and other technologies we use do not allow us to know conclusively prior to drilling a well that oil or gas is present or may be produced economically. The cost of drilling, completing and operating a well is often uncertain, and cost factors can adversely affect the economics of a project. In addition, limitations on the use of hydraulic fracturing could have an adverse effect on our ability to develop and produce oil and gas from new wells, which would reduce our rate of return on these wells and our cash flows. Drilling activities can result in dry wells or wells that are productive but do not produce sufficient net revenues after operating and other costs to cover initial drilling costs.
Our future drilling activities may not be successful, nor can we be sure that our overall drilling success rate or our drilling success rate within a particular area will not decline. Unsuccessful drilling activities could have a material adverse effect on our business, financial condition, results of operations and cash flows. Also, we may not be able to obtain any options or lease rights in potential drilling locations that we identify. Although we have identified numerous potential drilling locations, we may not be able to economically produce oil or natural gas from all of them.
We are exposed to the credit risk of our customers, and nonpayment or nonperformance by these parties would reduce our cash flows.
We are subject to risk from loss resulting from our customers’ nonperformance or nonpayment. We depend on a limited number of customers for a significant portion of revenues. In 2014, approximately 50 percent of our total consolidated product revenues resulted from three of our customers. Any nonpayment or nonperformance by our customers would reduce our cash flows.
We participate in oil and gas leases with third parties and these third parties may not be able to fulfill their commitments to our projects.
We frequently own less than 100% of the working interest in the oil and gas leases on which we conduct operations, and other parties own the remaining portion of the working interest. Financial risks are inherent in any operation where the cost of drilling, equipping, completing and operating wells is shared by more than one party. We could be held liable for joint activity obligations of other working interest owners, such as nonpayment of costs and liabilities arising from the actions of the other working interest owners. In addition, the possibility of an economic downturn and the volatility in commodity prices may increase the likelihood that some of these working interest owners, particularly those that are smaller and less established than we, are not able to fulfill their joint activity obligations. Some of our project partners have experienced liquidity and cash flow problems. These problems may lead our partners to attempt to delay the pace of drilling or project development in order to preserve cash. A partner may be unable or unwilling to pay its share of project costs. In some cases, a partner may declare bankruptcy. In the event any of our project partners do not pay their share of such costs, we would likely have to pay those costs, and we may be unsuccessful in any efforts to recover these costs from our partners, which could materially adversely affect our financial condition, results of operations and cash flows.
Our business and prospects for future success depend to a significant extent upon the continued service and performance of our management team.
Our business and prospects for future success, including the successful implementation of our strategies and handling of issues integral to our future success, depend to a significant extent upon the continued service and performance of our management team. The loss of any member of our management team, and our inability to attract, motivate and retain substitute management personnel with comparable experience and skills, could materially and adversely affect our business, financial condition, results of operations and cash flows.
13
Our business depends on gathering, processing, refining and transportation facilities owned by others.
We deliver substantially all of our oil and gas production through pipelines and trucks that we do not own. The marketability of our production depends upon the availability, proximity and capacity of these pipelines and trucks, as well as gathering systems, gas processing facilities and downstream refineries. The unavailability of or lack of available capacity on these systems and facilities could result in the shut-in of producing wells, the reduction in wellhead pricing or the delay or discontinuance of development plans for properties. Federal, state and local regulation of oil and gas production and transportation, tax and energy policies, changes in supply and demand, pipeline pressures, damage to or destruction of pipelines and general economic conditions could adversely affect our ability to produce, gather, process, refine and market our oil and gas.
We rely on third-party service providers to conduct the drilling and completion operations on properties we operate.
Where we are the operator of a property, we rely on third-party service providers to perform necessary drilling and completion operations. The ability of third-party service providers to perform such drilling and completion operations will depend on those service providers’ ability to compete for and retain qualified personnel, financial condition, economic performance, and access to capital, which in turn will depend upon the supply and demand for oil, natural gas liquids and natural gas, prevailing economic conditions and financial, business and other factors. The failure of a third-party service provider to adequately perform operations could delay drilling or completion, reduce production from the property or cause other damage to operations, each of which could adversely affect our business, financial condition, results of operations and cash flows.
Certain of our undeveloped leasehold assets are subject to leases that will expire over the next several years unless production is established on the acreage.
Leases on oil and natural gas properties typically have a term after which they expire unless, prior to expiration, a well is drilled and production of hydrocarbons in paying quantities is established. If our leases expire and we are unable to renew the leases, we will lose our right to develop the related properties. While we seek to actively manage our leasehold inventory through drilling wells to hold the leasehold acreage that we believe is material to our operations, our drilling plans for these areas are subject to change.
Estimates of oil and gas reserves and future net cash flows are not precise.
This Annual Report on Form 10-K contains estimates of our proved oil and gas reserves and the estimated future net cash flows from such reserves. These estimates are based upon various assumptions, including assumptions required by the SEC relating to crude oil, NGL and natural gas prices, drilling and operating expenses, capital expenditures, taxes and availability of funds. The process of estimating oil and gas reserves is complex. This process requires significant decisions and assumptions in the evaluation of available geological, geophysical, engineering and economic data for each reservoir. These estimates are dependent on many variables and, therefore, changes often occur as these variables evolve and commodity prices fluctuate. Any material inaccuracies in these reserve estimates or underlying assumptions could materially affect the estimated quantities and present value of our reserves.
Actual future production, crude oil, NGL and natural gas prices, revenues, taxes, development expenditures, operating expenses and quantities of recoverable oil and gas reserves will most likely vary from those estimated. Any significant variance could materially affect the estimated quantities and present value of reserves disclosed by us. In addition, we may adjust estimates of proved reserves to reflect production history, results of exploration and development, prevailing crude oil, NGL and natural gas prices and other factors, many of which are beyond our control.
At December 31, 2014, approximately 60 percent of our estimated proved reserves were proved undeveloped. Estimation of proved undeveloped reserves and proved developed non-producing reserves is based on volumetric calculations and adjacent reserve performance data. Recovery of proved undeveloped reserves requires significant capital expenditures and successful drilling operations. Production revenues from proved developed non-producing reserves will not be realized until some time in the future. The reserve data assumes that we will make significant capital expenditures to develop our reserves. Although we have prepared estimates of our reserves and the costs associated with these reserves in accordance with industry standards, these estimated costs may not be accurate, development may not occur as scheduled and actual results may not occur as estimated.
The reserve estimation standards provide that, subject to limited exceptions, proved undeveloped reserves may only be booked if they relate to wells scheduled to be drilled within five years of the date of booking. These standards may limit our potential to book additional proved undeveloped reserves as we pursue our drilling program. Moreover, we may be required to write down our proved undeveloped reserves if we do not develop those reserves within the required five-year time frame or cannot demonstrate that we could do so. We removed approximately 20.7 MMBOE of proved undeveloped reserves in 2014 as a result of the five-year limitation.
You should not assume that the present value of estimated future net cash flows (standardized measure) referred to herein is the current fair value of our estimated oil and gas reserves. In accordance with SEC requirements, we base the
14
estimated discounted future net cash flows from our proved reserves on prices and costs on the date of the estimate. Actual current and future prices and costs may be materially higher or lower than the prices and costs as of the date of the estimate. As a result, net present value estimates using actual prices and costs may be significantly less than the SEC estimate that is provided herein. Actual future net cash flows may also be affected by the amount and timing of actual production, supply and demand for oil and gas, increases or decreases in consumption of oil and gas and changes in governmental regulations or taxation. In addition, the 10% discount factor, which is required by the SEC to be used in calculating discounted future net cash flows for reporting purposes, is not necessarily the most accurate discount factor for us.
We may record impairment losses on our oil and gas properties.
Quantities of proved reserves are estimated based on economic conditions in existence in the period of assessment. Lower crude oil, NGL and natural gas prices may have the impact of shortening the economic lives on certain fields because it becomes uneconomic to produce all recoverable reserves on such fields, thus reducing proved property reserve estimates. If such revisions in the estimated quantities of proved reserves occur, it will have the effect of increasing the rates of depreciation, depletion and amortization, or DD&A, on the affected properties, which would decrease earnings or result in losses through higher DD&A expense. The revisions may also be sufficient enough to cause impairment losses on certain properties that would result in a further non-cash charge to reported earnings.
GAAP requires that the carrying value of oil and gas properties be reviewed on a periodic basis for possible impairment. An impairment charge is recognized when the carrying value of oil and gas properties is greater than the undiscounted future net cash flows attributable to the property. In addition to revisions to reserves and the impact of lower commodity prices, impairments may occur due to increases in estimated operating and development costs and other factors. During the past several years, we have been required to impair certain of our oil and gas properties and related assets. If crude oil, NGL and natural gas prices decline or we drill uneconomic wells, it is reasonably possible that we will have to record a significant impairment in the future. While an impairment charge reflects our ability to recover the carrying value of our investments, it does not impact our cash flows from operating activities.
We have limited control over the activities on properties we do not operate.
In 2014, other companies operated approximately 10 percent of our net production. Our success in properties operated by others will depend upon a number of factors outside of our control, including timing and amount of capital expenditures, the operator’s expertise and financial resources, approval of other participants in drilling wells, selection of technology and maintenance of safety and environmental standards. We have limited ability to influence or control the operation or future development of these non-operated properties or the amount of capital expenditures that we are required to fund for their operation. Our dependence on the operator and other working interest owners for these projects and our limited ability to influence or control the operation and future development of these properties could have a material adverse effect on the realization of our targeted returns or lead to unexpected future costs.
Our property acquisitions carry significant risks.
Acquisition of oil and gas properties is a key element of maintaining and growing reserves and production. Competition for these assets has been and will continue to be intense. In the event we do complete an acquisition, its success will depend on a number of factors, many of which are beyond our control. These factors include the purchase price, future crude oil, NGL and natural gas prices, the ability to reasonably estimate or assess the recoverable volumes of reserves, rates of future production and future net revenues attainable from reserves, future operating and capital costs, results of future exploration, exploitation and development activities on the acquired properties and future abandonment and possible future environmental or other liabilities. There are numerous uncertainties inherent in estimating quantities of proved oil and gas reserves, actual future production rates and associated costs and potential liabilities with respect to prospective acquisition targets. Actual results may vary substantially from those assumed in the estimates. A customary review of subject properties will not necessarily reveal all existing or potential problems.
Additionally, significant acquisitions can change the nature of our operations and business depending upon the character of the acquired properties if they have substantially different operating and geological characteristics or are in different geographic locations than our existing properties. To the extent that acquired properties are substantially different than our existing properties, our ability to efficiently realize the expected economic benefits of such transactions may be limited.
Integrating acquired businesses and properties involves a number of special risks. These risks include the possibility that management may be distracted from regular business concerns by the need to integrate operations and systems and that unforeseen difficulties can arise in integrating operations and systems and in retaining and assimilating employees. Any of these or other similar risks could lead to potential adverse short-term or long-term effects on our operating results, and may cause us to not be able to realize any or all of the anticipated benefits of the acquisitions.
We are a relatively small company and therefore may not be able to compete effectively.
Compared to many of our competitors in the oil and gas industry, we are a small company. We face difficulties in competing with larger companies. The costs of doing business in the exploration and production industry, including such costs
15
as those required to explore new oil and natural gas plays, to acquire new acreage, and to develop attractive oil and natural gas projects, are significant. We face intense competition in all areas of our business from companies with greater and more productive assets, substantially larger staffs and greater financial and operating resources than we have. Our limited size has placed us at a disadvantage with respect to funding our operating costs, and means that we are more vulnerable to commodity price volatility and overall industry cycles, are less able to absorb the burden of changes in laws and regulations, and that poor results in any single exploration, development or production play can have a disproportionately negative impact on us.
We also compete for people, including experienced geologists, geophysicists, engineers and other professionals. Our limited size has placed us at a disadvantage with respect to attracting and retaining management and other professionals with the technical abilities necessary to successfully operate our business.
Our lack of diversification increases the risk of an investment in us and we are vulnerable to risks associated with operating primarily in one major contiguous area.
Our current business is focused primarily in the Eagle Ford in South Texas. Due to the concentrated nature of our business activities, a number of our properties could experience any of the same conditions at the same time, resulting in a relatively greater impact on our results of operations than they might have on other companies that have a more diversified. In particular, we may be disproportionately exposed to the impact of delays or interruptions of production from wells in which we have an interest that are caused by transportation capacity constraints, curtailment of production, availability of equipment, facilities, personnel or services, significant governmental regulation, natural disasters, adverse weather conditions, plant closures for scheduled maintenance or interruption of transportation of crude oil or natural gas produced from wells in the Eagle Ford
We are subject to complex laws and regulations that can adversely affect the cost, manner or feasibility of doing business.
Exploration, development, production and sale of oil and gas are subject to extensive federal, state and local laws and regulations, including complex environmental laws. Future laws or regulations, any adverse changes in the interpretation of existing laws and regulations, inability to obtain necessary regulatory approvals or a failure to comply with existing legal requirements may harm our business, results of operations or financial condition. We may be required to make large expenditures to comply with environmental and other governmental regulations. Failure to comply with these laws and regulations may result in the suspension or termination of operations and subject us to administrative, civil and criminal penalties. Matters subject to regulation include discharge permits for drilling operations, drilling bonds, spacing of wells, unitization and pooling of properties, environmental protection and taxation. Our operations create the risk of environmental liabilities to the government or third parties for any unlawful discharge of oil, gas or other pollutants into the air, soil or water. In the event of environmental violations, we may be charged with remedial costs and land owners may file claims for alternative water supplies, property damage or bodily injury. Laws and regulations protecting the environment have become more stringent in recent years, and may, in some circumstances, result in liability for environmental damage regardless of negligence or fault. In addition, pollution and similar environmental risks generally are not fully insurable. These liabilities and costs could have a material adverse effect on our business, financial condition, results of operations and cash flows. See Item 1, “Business — Government Regulation and Environmental Matters.”
Our business involves many operating risks, including hydraulic fracturing, that may result in substantial losses for which insurance may be unavailable or inadequate.
Our operations are subject to all of the risks and hazards typically associated with the exploitation, development and exploration for and the production and transportation of oil and gas, including well stimulation and completion activities such as hydraulic fracturing. These operating risks include:
• | fires, explosions, blowouts, cratering and casing collapses; |
• | formations with abnormal pressures; |
• | pipeline ruptures or spills; |
• | uncontrollable flows of oil, natural gas or well fluids; |
• | migration of fracturing fluids into surrounding groundwater; |
• | spills or releases of fracturing fluids including from trucks sometimes used to deliver these materials; |
• | spills or releases of brine or other produced water that may go off-site; |
• | subsurface conditions that prevent us from (i) stimulating the planned number of stages, (ii) accessing the entirety of the wellbore with our tools during completion or (iii) removing all fracturing materials from the wellbore to allow production to begin; |
• | environmental hazards such as natural gas leaks, oil spills and discharges of toxic gases; and |
• | natural disasters and other adverse weather conditions, terrorism, vandalism and physical, electronic and cyber security breaches. |
16
Any of these risks could result in substantial losses resulting from injury or loss of life, damage to or destruction of property, natural resources and equipment, pollution and other environmental damages, clean-up responsibilities, regulatory investigations and penalties and suspension of operations. In addition, under certain circumstances, we may be liable for environmental damage caused by previous owners or operators of properties that we own, lease or operate. As a result, we may incur substantial liabilities to third parties or governmental entities, which could reduce or eliminate funds available for exploration, development or acquisitions or cause us to incur losses.
If we experience any problems with well stimulation and completion activities, such as hydraulic fracturing, our ability to explore for and produce oil or natural gas may be adversely affected. We could incur substantial losses or otherwise fail to realize reserves in particular formations as a result of:
• | delays imposed by or resulting from compliance with environmental and other governmental or regulatory requirements, which may include limitations on hydraulic fracturing or the discharge of GHGs; and |
• | the need to shut down, abandon and relocate drilling operations; |
• | the need to sample, test and monitor drinking water in particular areas and to provide filtration or other drinking water supplies to users of water supplies that may have been impacted or threatened by potential contamination from fracturing fluids; |
• | the need to modify drill sites to ensure there are no spills or releases off-site and to investigate and/or remediate any spills or releases that might have occurred; or |
• | suspension of our operations. |
In accordance with industry practice, we maintain insurance at a level that balances the cost of insurance with our assessment of the risk and our ability to achieve a reasonable rate of return on our investments. We cannot assure you that our insurance will be adequate to cover losses or liabilities or that we will purchase insurance against all possible losses or liabilities. Also, we cannot predict the continued availability of insurance at premium levels that justify its purchase. The occurrence of a significant event, not fully insured or indemnified against, could have a material adverse effect on our business, financial condition, results of operations and cash flows.
Access to water to conduct hydraulic fracturing may not be available if water sources become scarce.
The availability of water is crucial to conduct hydraulic fracturing. Approximately 80,000-100,000 gallons of water are necessary for drilling and completing one well with hydraulic fracturing in Texas. In recent years, Texas has experienced severe droughts that have limited the water supplies that are necessary to conduct hydraulic fracturing. Although we have taken measures to secure our water supply, we can make no assurances that sufficient water resources will be available in the short or long term to carry out our current activities.
Laws and regulations restricting emissions of greenhouse gases could force us to incur increased capital and operating costs and could have a material adverse effect on our financial condition, results of operations and cash flows.
In December 2009, the EPA determined that emissions of carbon dioxide, methane and other GHGs endanger public health and the environment because emissions of such gases are, according to the EPA, contributing to warming of the Earth’s atmosphere and other climatic changes. Based on these findings, the EPA has begun adopting and implementing regulations to restrict emissions of GHGs under existing provisions of the CAA. For example, EPA implemented rules requiring annual reporting of GHG emissions from specified large GHG emission sources in the United States for emissions occurring after January 1, 2010. In a December 2014 proposed rule, the EPA proposed to add GHG reporting requirements applicable to petroleum and natural gas systems, including various equipment and systems associated with hydraulic fracturing operations. Moreover, the Obama administration has announced in its Climate Action Plan that it intends to adopt additional regulations to reduce emissions of GHGs in the coming years, likely including further restrictions on emissions of methane from oil and gas operations. More specifically, it has been reported that the EPA will issue a proposed rule in the summer of 2015 that would cut methane emissions from oil and gas production by up to 45 percent by 2025 from the levels recorded in 2012. In addition, the U.S. Congress has from time to time considered adopting legislation to reduce emissions of GHGs, and almost one-half of the states have already taken legal measures to reduce emissions of GHGs primarily through the planned development of GHG emission inventories and/or regional GHG cap-and-trade programs.
In addition, some scientists have concluded that increasing concentrations of GHGs in the Earth’s atmosphere may produce climate changes that have significant physical effects, such as increased frequency and severity of storms, droughts, floods and other climatic events. If any such events were to occur, they could have an adverse effect on our financial condition, results of operations and cash flows. For a fulsome discussion of environmental laws and regulations intended to address climate change and their impact on our business and operations, please see “Business-Environmental Regulation-Climate Change.”
17
Federal and state legislation and regulatory initiatives relating to hydraulic fracturing could result in increased costs and additional operating restrictions or delays.
The practice of hydraulic fracturing has come under increased scrutiny by the environmental community. Hydraulic fracturing involves the injection of water, sand and chemicals under pressure into prospective rock formations to stimulate oil and gas production. We use this completion technique on all of our wells. The EPA is studying the potential environmental impacts of hydraulic fracturing and its potential impact on drinking water resources. A draft of the study was expected to be released to the public in 2014, but has yet to be issued. In May 2014, the EPA issued an advance notice of proposed rulemaking relating to the collection of information on various chemicals and mixtures used in hydraulic fracturing. The EPA is also developing a proposed rule to amend the Effluent Limitations Guidelines and Standards for the oil and gas industry. The proposal is expected to address discharges of wastewater pollutants from onshore unconventional oil and gas extraction facilities to publicly-owned treatment works. The proposed rule is scheduled for publication in early 2015. The EPA has issued final rules under the CAA that subject oil and natural gas production, processing, transmission, and storage operations to regulation under the NSPS and National Emission Standards for Hazardous Air Pollutants (“NESHAP”) programs. In light of concerns about seismic activity being triggered by the injection of produced waters into underground wells, certain regulators are also considering additional requirements related to seismic safety for hydraulic fracturing activities. In addition, some states and local governments have enacted legislation or adopted regulations, and the U.S. Congress and other states are considering enacting legislation or adopting regulations, that could impose more stringent permitting, disclosure, monitoring, well construction and water use requirements on hydraulic fracturing operations. Individually or collectively, such new legislation or regulation could result in increased compliance and operating costs, delays or additional operating restrictions. These standards, as well as any future laws and their implementing regulations, may require us to obtain pre-approval for the expansion or modification of existing facilities or the construction of new facilities, or utilize specific equipment or technologies to control emissions. Our failure to comply with these requirements could subject us to monetary penalties, injunctions, conditions or restrictions on operations and, potentially, criminal enforcement actions. While we do not believe that compliance with such requirements will have a material adverse effect on our operations, these requirements may result in increased operating and compliance costs, increased regulatory burdens and delays in our operations, any of which could be significant.
If the use of hydraulic fracturing is limited, prohibited or subjected to further regulation, these requirements could delay or effectively prevent the extraction of oil and gas from formations which would not be economically viable without the use of hydraulic fracturing. This could have a material adverse effect on our business, financial condition, results of operations and cash flows.
Restrictions on drilling activities intended to protect certain species of wildlife or their habitat may adversely affect our ability to conduct drilling activities in some of the areas where we operate.
Various federal and state statutes prohibit certain actions that harm endangered or threatened species and their habitats, migratory birds, wetlands and natural resources. These statutes include the Endangered Species Act, the Migratory Bird Treaty Act, the Clean Water Act, CERCLA and the OPA. The U.S. Fish and Wildlife Service may designate critical habitat and suitable habitat areas that it believes are necessary for survival of threatened or endangered species. A critical habitat or suitable habitat designation could result in further material restrictions to federal land use and private land use and could delay or prohibit land access or oil and gas development. If harm to species or damages to wetlands, habitat or natural resources occur or may occur, government entities or, at times, private parties may act to prevent oil and gas exploration or development activities or seek damages for harm to species, habitat or natural resources resulting from drilling, construction or releases of oil, wastes, hazardous substances or other regulated materials, and in some cases, may seek criminal penalties.
Derivative transactions may limit our potential gains and involve other risks.
In order to manage our exposure to price risks in the sale of our crude oil, NGLs and natural gas, we periodically enter into commodity price hedging arrangements with respect to a portion of our expected production. Our hedges are limited in duration, usually for periods of two years or less. While intended to reduce the effects of volatile crude oil, NGL and natural gas prices, such transactions may limit our potential gains if crude oil, NGL or natural gas prices were to rise over the price established by the hedging arrangements. In trying to maintain an appropriate balance, we may end up hedging too much or too little, depending upon how crude oil, NGL or natural gas prices fluctuate in the future.
In addition, derivative transactions may expose us to the risk of financial loss in certain circumstances, including instances in which:
• | our production is less than expected; |
• | there is a widening of price basis differentials between delivery points for our production and the delivery point assumed in the hedge arrangement; |
• | the counterparties to our futures contracts fail to perform under the contracts; or |
• | a sudden, unexpected event materially impacts crude oil, NGL or natural gas prices. |
18
In addition, derivative instruments involve basis risk. Basis risk in a derivative contract occurs when the index upon which the contract is based is more or less variable than the index upon which the hedged asset is based, thereby making the hedge less effective. For example, a NYMEX index used for hedging certain volumes of production may have more or less variability than the regional price index used for the sale of that production.
Our ability to use net operating loss carryforwards to offset future taxable income may be subject to certain limitations.
Our ability to utilize U.S. net operating loss, or NOL, carryforwards to reduce future taxable income is subject to various limitations under the Internal Revenue Code of 1986, as amended, or the Code. The utilization of such carryforwards may be limited upon the occurrence of certain ownership changes, including the purchase or sale of our stock by 5% shareholders and our offering of stock during any three-year period resulting in an aggregate change of more than 50% in our beneficial ownership. In the event of an ownership change, Section 382 of the Code imposes an annual limitation on the amount of our taxable income that can be offset by these carryforwards. As of December 31, 2014, we do not believe that an ownership change has occurred; however, to the extent an ownership change has occurred or were to occur in the future, it is possible that the limitations imposed on our ability to use pre-ownership change losses could cause a significant net increase in our U.S. federal income tax liability and could cause U.S. federal income taxes to be paid earlier than they otherwise would be paid if such limitations were not in effect.
Certain U.S. federal income tax deductions currently available with respect to oil and gas exploration and development may be eliminated as a result of proposed legislation.
President Obama’s budget proposal for fiscal year 2015 recommended the elimination of certain key U.S. federal income tax incentives currently available to oil and gas exploration and production companies. These changes include, but are not limited to, the repeal of the percentage depletion allowance for oil and gas properties, the elimination of current deductions for intangible drilling and development costs, the elimination of the deduction for United States production activities for oil and gas production, and an extension of the amortization period for certain geological and geophysical expenditures. It is unclear whether these or similar changes will be enacted and, if enacted, how soon any such changes could become effective. The passage of this legislation or any other similar changes in U.S. federal income tax laws could eliminate or postpone certain tax deductions that are currently available with respect to oil and gas exploration and development, and any such change could have a material adverse effect on us.
We may not be able to keep pace with technological developments in our industry.
The oil and gas industry is characterized by rapid and significant technological advancements and introductions of new products and services using new technologies. As others use or develop new technologies, we may be placed at a competitive disadvantage, and competitive pressures may force us to implement those new technologies at substantial cost. In addition, other oil and gas companies may have greater financial, technical and personnel resources that allow them to enjoy technological advantages and may in the future allow them to implement new technologies before we can. We may not be able to respond to these competitive pressures and implement new technologies on a timely basis or at an acceptable cost. If one or more of the technologies we use now or in the future were to become obsolete or if we are unable to use the most advanced commercially available technology, our business, financial condition and results of operations could be materially adversely affected.
A cyber incident could result in theft of confidential information, data corruption or operational disruption.
The oil and gas industry is dependent on digital technologies to conduct certain exploration, development and production activities. Software programs are used for, among other things, reserve estimates, seismic interpretation, modeling and compliance reporting. In addition, the use of mobile communication is widespread. Increasingly, we must protect our business against potential cyber incidents including attacks.
If our systems for protecting against cyber incidents prove not to be sufficient, we could be adversely affected by unauthorized access to our digital systems which could result in theft of confidential information, data corruption or operational disruption. As cyber threats continue to evolve, we may be required to expend additional resources to continue to modify and enhance our protective systems or to investigate and remediate any vulnerabilities.
Item 1B | Unresolved Staff Comments |
We have received no written SEC staff comments regarding our periodic or current reports under the Exchange Act that were issued 180 days or more preceding the end of our 2014 fiscal year and remain unresolved.
19
Item 2 | Properties |
The following map shows the general locations of our oil and gas assets as of December 31, 2014:
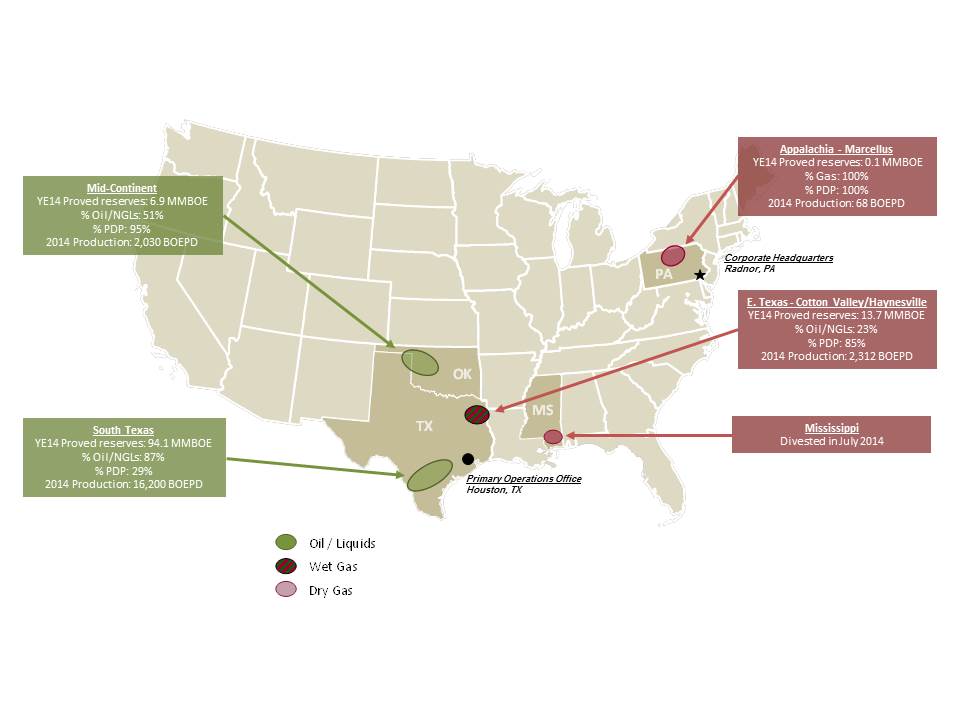
Facilities
All of our office facilities are leased with the exception of our district operations facilities in Scottsville, Texas. We believe that our facilities are adequate for our current needs.
Title to Oil and Gas Properties
Prior to completing an acquisition of producing oil and gas assets, we review title opinions on all material leases. However, as is customary in the oil and gas industry, we make a cursory review of title to farmout acreage and when we acquire undeveloped oil and gas leases. Prior to the commencement of drilling operations, a thorough title examination is conducted. To the extent the title examination reflects defects, we cure such title defects. If we are unable to cure any title defect of a nature such that it would not be prudent to commence drilling operations on a property, we could suffer a loss of our investment in the property. Our oil and gas properties are subject to customary royalty interests, liens for debt obligations, current taxes and other burdens that we believe do not materially interfere with the use or materially affect the value of such properties. We believe that we have satisfactory title to all of our properties and the associated oil and gas in accordance with standards generally accepted in the oil and gas industry.
20
Summary of Oil and Gas Reserves
Proved Reserves
The following tables summarize certain information regarding our estimated proved reserves as of December 31 for each of the years presented:
Crude Oil | NGLs | Natural Gas | Oil Equivalents | Standardized Measure | Price Measurement Used 1 | ||||||||||||||||||||||
(MMBbl) | (MMBbl) | (Bcf) | (MMBOE) | $ in millions | $/Bbl of Oil | $/Bbl of NGLs | $/MMBtu | ||||||||||||||||||||
2014 | |||||||||||||||||||||||||||
Developed | |||||||||||||||||||||||||||
Producing | 21.8 | 7.4 | 77.9 | 42.1 | $ | 794.9 | |||||||||||||||||||||
Non-producing | 0.3 | 0.7 | 16.6 | 3.8 | 8.6 | ||||||||||||||||||||||
22.1 | 8.1 | 94.5 | 45.9 | 803.5 | |||||||||||||||||||||||
Undeveloped | 47.0 | 11.1 | 64.7 | 68.9 | 378.9 | ||||||||||||||||||||||
69.0 | 19.2 | 159.2 | 114.8 | $ | 1,182.4 | $ | 92.91 | $ | 25.49 | $ | 4.32 | ||||||||||||||||
2013 | |||||||||||||||||||||||||||
Developed | |||||||||||||||||||||||||||
Producing | 19.0 | 7.5 | 146.5 | 50.9 | $ | 701.7 | |||||||||||||||||||||
Non-producing | 0.3 | 1.0 | 16.7 | 4.1 | 7.3 | ||||||||||||||||||||||
19.3 | 8.5 | 163.2 | 55.0 | 709.0 | |||||||||||||||||||||||
Undeveloped | 41.4 | 13.4 | 158.9 | 81.3 | 554.8 | ||||||||||||||||||||||
60.7 | 21.9 | 322.1 | 136.3 | $ | 1,263.8 | $ | 103.11 | $ | 31.10 | $ | 3.47 | ||||||||||||||||
2012 | |||||||||||||||||||||||||||
Developed | |||||||||||||||||||||||||||
Producing | 10.2 | 7.0 | 152.0 | 42.5 | $ | 408.5 | |||||||||||||||||||||
Non-producing | 0.3 | 1.2 | 17.4 | 4.5 | 43.0 | ||||||||||||||||||||||
10.5 | 8.3 | 169.4 | 47.0 | 451.5 | |||||||||||||||||||||||
Undeveloped | 14.4 | 12.4 | 238.1 | 66.5 | 46.4 | ||||||||||||||||||||||
24.9 | 20.7 | 407.5 | 113.5 | $ | 497.9 | $ | 102.24 | $ | 39.48 | $ | 2.47 | ||||||||||||||||
1 Crude oil and natural gas prices were based on average (beginning of month basis) sales prices per Bbl and MMBtu with the representative price of natural gas adjusted for basis premium and energy content to arrive at the appropriate net price. NGL prices were estimated as a percentage of the base crude oil price.
All of our reserves are located in the continental United States. The following table sets forth by region the estimated quantities of proved reserves and the percentages thereof that are represented by proved developed reserves as of December 31, 2014:
Proved | % of Total Proved | % Proved | |||||||
Region | Reserves | Reserves | Developed | ||||||
(MMBOE) | |||||||||
Texas | |||||||||
South Texas | 94.1 | 82 | % | 29 | % | ||||
East Texas | 13.7 | 12 | % | 85 | % | ||||
Mid-Continent | 6.9 | 6 | % | 95 | % | ||||
Other 1 | 0.1 | — | % | 100 | % | ||||
114.8 | 100 | % | 40 | % | |||||
___________________
1 Comprised of our three active Marcellus Shale wells.
21
Proved Undeveloped Reserves
The proved undeveloped reserves included in our reserve estimates relate to wells that are forecasted to be drilled within the next five years. The following tables set forth the changes in our proved undeveloped reserves during the year ended December 31, 2014 and the total proved undeveloped reserves as of December 31, 2014 by region:
Crude Oil | NGLs | Natural Gas | Oil Equivalents | ||||||||
(MMBbl) | (MMBbl) | (Bcf) | (MMBOE) | ||||||||
Proved undeveloped reserves at beginning of year | 41.4 | 13.4 | 158.9 | 81.3 | |||||||
Revisions of previous estimates | (5.1 | ) | (5.4 | ) | (84.2 | ) | (24.5 | ) | |||
Extensions, discoveries and other additions | 18.4 | 5.1 | 26.5 | 28.0 | |||||||
Sale of reserves in place | — | — | (26.1 | ) | (4.4 | ) | |||||
Conversion to proved developed reserves | (7.7 | ) | (2.0 | ) | (10.5 | ) | (11.5 | ) | |||
Proved undeveloped reserves at end of year | 47.0 | 11.1 | 64.7 | 68.9 | |||||||
Texas | |||||||||||
South Texas | 46.7 | 10.7 | 54.7 | 66.5 | |||||||
East Texas | 0.2 | 0.3 | 8.9 | 2.0 | |||||||
Mid-Continent | 0.1 | 0.1 | 1.1 | 0.4 | |||||||
47.0 | 11.1 | 64.7 | 68.9 | ||||||||
In 2014, our proved undeveloped reserves decreased by 12.4 MMBOE. We experienced negative revisions due to locations that are not expected to be drilled during a five-year period primarily in the Cotton Valley and Haynesville Shale (19.1 MMBOE) and the Granite Wash (1.6 MMBOE). We also experienced downward revisions in the Eagle Ford due primarily to the elimination of certain locations (3.8 MMBOE). Extensions, discoveries and other additions of 28.0 MMBOE were attributable to our activities in the Eagle Ford. We sold our Selma Chalk assets in Mississippi resulting in a decrease of 4.4 MMBOE. In addition, we converted 11.5 MMBOE from proved undeveloped to proved developed reserves in the Eagle Ford. During 2014, we incurred capital expenditures of approximately $381 million in connection with the conversion of proved undeveloped reserves to proved developed reserves.
Preparation of Reserves Estimates and Internal Controls
The proved reserve estimates were prepared by Wright & Company, Inc., our independent third party petroleum engineers. For additional information regarding estimates of proved reserves and other information about our oil and gas reserves, see the Supplemental Information on Oil and Gas Producing Activities (Unaudited) in our Notes to the Consolidated Financial Statements and the report of Wright & Company, Inc., prepared for us and dated January 9, 2015, which is included as an Exhibit to this Annual Report on Form 10-K. We did not file any reports during the year ended December 31, 2014 with any federal authority or agency with respect to our estimate of oil and gas reserves.
Our policies and practices regarding the recording of reserves are structured to objectively and accurately estimate our oil and gas reserve quantities and present values in compliance with the SEC’s regulations and GAAP. Our Vice President, Operations & Engineering is primarily responsible for overseeing the preparation of the reserve estimate by Wright & Company, Inc. Our Vice President, Operations & Engineering has over 29 years of industry experience in the estimation and evaluation of reserve information, holds a B.S. degree in Petroleum Engineering from Texas A&M University and is licensed by the State of Texas as a Professional Engineer. Our internal controls over reserve estimates include reconciliation and review controls, including an independent internal review of assumptions used in the estimation.
There are numerous uncertainties inherent in estimating quantities of reserves and in projecting future rates of production and timing of development expenditures, including many factors beyond our control. For additional information about the risks inherent in our estimates of proved reserves, see Item 1A, “Risk Factors.”
Qualifications of Third Party Petroleum Engineers
The technical person primarily responsible for review of our reserve estimates at Wright & Company, Inc. meets the requirements regarding qualifications, independence, objectivity and confidentiality set forth in the Standards Pertaining to the Estimating and Auditing of Oil and Gas Reserves Information promulgated by the Society of Petroleum Engineers. Wright & Company, Inc. is an independent firm of petroleum engineers, geologists, geophysicists and petro physicists; they do not own an interest in our properties and are not employed on a contingent fee basis.
22
Oil and Gas Production, Production Prices and Production Costs
Oil and Gas Production by Region
The following tables set forth by region the total production and average daily production for the periods presented:
Total Production for the Year Ended December 31, | |||||||||||||||
Region | 2014 | 2013 | 2012 | ||||||||||||
(MBOE) | |||||||||||||||
Texas | |||||||||||||||
South Texas 1 | 5,913 | 4,091 | 2,334 | ||||||||||||
East Texas | 844 | 1,020 | 1,337 | ||||||||||||
Mid-Continent | 741 | 937 | 1,211 | ||||||||||||
Other 2 | 437 | 776 | 1,631 | ||||||||||||
7,934 | 6,824 | 6,513 | |||||||||||||
Average Daily Production for the Year Ended December 31, | |||||||||||||||
2014 | 2013 | 2012 | |||||||||||||
(BOEPD) | |||||||||||||||
Texas | |||||||||||||||
South Texas 1 | 16,201 | 11,208 | 6,377 | ||||||||||||
East Texas | 2,311 | 2,795 | 3,653 | ||||||||||||
Mid-Continent | 2,029 | 2,567 | 3,309 | ||||||||||||
Other 2 | 1,196 | 2,126 | 4,456 | ||||||||||||
21,738 | 18,696 | 17,795 | |||||||||||||
1 We completed the EF Acquisition in April 2013.
2 Currently consists of our three active Marcellus Shale wells. We sold all of our properties in the Selma Chalk in Mississippi in July 2014, which represented annual production and average daily production of approximately 412 MBOE (1,946 BOEPD), 751 MBOE (2,058 BOEPD) and 847 MBOE (2,314 BOEPD) in 2014, 2013 and 2012, respectively. We sold all of our properties in West Virginia, Kentucky and Virginia in July 2012, which represented annual production and average daily production of approximately 741 MBOE (2,100 BOEPD) in 2012.
Production Prices and Production Costs
The following table sets forth the average sales prices per unit of volume and our average production costs, not including ad valorem and production/severance taxes, per unit of production for the periods presented:
Year Ended December 31, | |||||||||||
2014 | 2013 | 2012 | |||||||||
Average prices: | |||||||||||
Crude oil ($ per Bbl) | $ | 90.50 | $ | 101.13 | $ | 101.95 | |||||
NGLs ($ per Bbl) | $ | 31.14 | $ | 31.30 | $ | 35.13 | |||||
Natural gas ($ per Mcf) | $ | 4.44 | $ | 3.64 | $ | 2.46 | |||||
Aggregate ($ per BOE) | $ | 64.64 | $ | 63.11 | $ | 47.67 | |||||
Average production and lifting cost ($ per BOE): | |||||||||||
Lease operating | $ | 6.09 | $ | 5.20 | $ | 4.80 | |||||
Gathering processing and transportation | 2.31 | 1.88 | 2.18 | ||||||||
$ | 8.40 | $ | 7.08 | $ | 6.98 | ||||||
23
Significant Fields
Our properties in the Eagle Ford in South Texas, which contain primarily oil reserves, represent approximately 82 percent of our total equivalent proved reserve quantities and approximately 93 percent of our total crude oil and NGL reserves as of December 31, 2014. This is the only field that comprises 15% or more of our total proved reserves as of that date.
The following table sets forth certain information with respect to this field for the periods presented:
Year Ended December 31, | |||||||||||
2014 | 2013 | 2012 | |||||||||
Production: | |||||||||||
Crude oil (MBbl) | 4,450 | 3,197 | 1,960 | ||||||||
NGLs (MBbl) | 773 | 478 | 205 | ||||||||
Natural gas (MMcf) | 4,070 | 2,406 | 1,015 | ||||||||
Total (MBOE) | 5,901 | 4,077 | 2,334 | ||||||||
Percent of total company production | 74 | % | 60 | % | 36 | % | |||||
Average prices: | |||||||||||
Crude oil ($ per Bbl) | $ | 90.57 | $ | 101.55 | $ | 103.33 | |||||
NGLs ($ per Bbl) | $ | 25.23 | $ | 26.68 | $ | 31.43 | |||||
Natural gas ($ per Mcf) | $ | 4.20 | $ | 3.52 | $ | 2.56 | |||||
Aggregate ($ per BOE) | $ | 74.49 | $ | 84.85 | $ | 90.63 | |||||
Average production and lifting cost ($ per BOE)1: | |||||||||||
Lease operating | $ | 5.36 | $ | 4.30 | $ | 3.12 | |||||
Gathering processing and transportation | 1.76 | 1.08 | 0.72 | ||||||||
$ | 7.12 | $ | 5.38 | $ | 3.84 | ||||||
1 Excludes production/severance and ad valorem taxes.
Drilling and Other Exploratory and Development Activities
The following table sets forth the gross and net development and exploratory wells that we drilled during the years ended December 31, 2014, 2013 and 2012 and wells that were in progress at the end of each year. The number of wells drilled refers to the number of wells completed at any time during the year, regardless of when drilling was initiated.
2014 | 2013 | 2012 | |||||||||||||||
Gross | Net | Gross | Net | Gross | Net | ||||||||||||
Development | |||||||||||||||||
Productive | 83 | 50.8 | 58 | 34.1 | 36 | 27.8 | |||||||||||
Non-productive | 1 | 0.8 | — | — | — | — | |||||||||||
Under evaluation | — | — | 1 | 0.5 | — | — | |||||||||||
Total development | 84 | 51.6 | 59 | 34.6 | 36 | 27.8 | |||||||||||
Exploratory | |||||||||||||||||
Productive | — | — | — | — | 5 | 3.9 | |||||||||||
Non-productive | — | — | — | — | — | — | |||||||||||
Under evaluation | — | — | — | — | 1 | 1.0 | |||||||||||
Total exploratory | — | — | — | — | 6 | 4.9 | |||||||||||
Total | 84 | 51.6 | 59 | 34.6 | 42 | 32.7 | |||||||||||
Wells in progress at end of year1 | 28 | 14.3 | 16 | 11.5 | 3 | 2.7 | |||||||||||
1 Includes 12 gross (5.4 net) wells completing or flowing back, 11 gross (5.9 net) waiting on completion and five gross (3.0 net) wells being drilled as of December 31, 2014.
24
The following table sets forth the regions in which we drilled our wells for the periods presented:
2014 | 2013 | 2012 | ||||||||||||||||
Region | Gross | Net | Gross | Net | Gross | Net | ||||||||||||
Texas | ||||||||||||||||||
South Texas 1 | 84 | 51.6 | 57 | 34.1 | 35 | 29.5 | ||||||||||||
East Texas | — | — | — | — | — | — | ||||||||||||
Mid-Continent | — | — | 2 | 0.5 | 7 | 3.2 | ||||||||||||
Other | — | — | — | — | — | — | ||||||||||||
84 | 51.6 | 59 | 34.6 | 42 | 32.7 | |||||||||||||
1 Includes six gross (2.2 net) wells acquired in 2013 in connection with the EF Acquisition that were in progress when acquired.
Present Activities
As of December 31, 2014, we had 28 gross (14.3 net) wells in progress, all of which were located in the Eagle Ford in South Texas. As of February 20, 2015, 17 gross (8.6 net) of these wells had been successfully completed and were producing.
Delivery Commitments
We generally sell our oil, NGL and natural gas products using short-term floating price physical and spot market contracts. Although it is not our general practice, from time to time we enter into certain transactions in which we provide production commitments extending beyond one month. As of December 31, 2014, we did not have any material commitments to provide a fixed and determinable quantity of our products beyond the current month.
Productive Wells
The following table sets forth by region the productive wells in which we had a working interest as of December 31, 2014:
Primarily Oil | Primarily Natural Gas | Total | ||||||||||||||||
Region | Gross | Net | Gross | Net | Gross | Net | ||||||||||||
Texas | ||||||||||||||||||
South Texas 1 | 275 | 175.2 | — | — | 275 | 175.2 | ||||||||||||
East Texas | — | — | 356 | 254.9 | 356 | 254.9 | ||||||||||||
Mid-Continent | 5 | 3.1 | 99 | 42.6 | 104 | 45.7 | ||||||||||||
Other 2 | — | — | 3 | 3.0 | 3 | 3.0 | ||||||||||||
280 | 178.3 | 458 | 300.5 | 738 | 478.8 | |||||||||||||
_______________________
1 Includes wells in both the lower and upper Eagle Ford, or Marl, as well as the Pearsall Shale and Austin Chalk.
2 Consists of our three active Marcellus wells.
Of the total wells presented in the table above, we are the operator of 607 gross (246 oil and 361 gas) and 433.0 net (165.3 oil and 267.7 gas) wells. In addition to the above working interest wells, we own royalty interests in nine gross wells.
Acreage
The following table sets forth by region our developed and undeveloped acreage as of December 31, 2014 (in thousands):
Developed | Undeveloped | Total | ||||||||||||||||
Region | Gross | Net | Gross | Net | Gross | Net | ||||||||||||
Texas | ||||||||||||||||||
South Texas | 70.4 | 45.2 | 69.3 | 56.6 | 139.7 | 101.8 | ||||||||||||
East Texas | 45.3 | 32.0 | 2.1 | 0.6 | 47.4 | 32.6 | ||||||||||||
Mid-Continent | 16.5 | 8.0 | 5.0 | 1.8 | 21.5 | 9.8 | ||||||||||||
Other | 1.7 | 1.3 | 13.7 | 13.1 | 15.4 | 14.4 | ||||||||||||
133.9 | 86.5 | 90.1 | 72.1 | 224.0 | 158.6 | |||||||||||||
25
The primary terms of our leases generally range from three to five years and we do not have any concessions. As of December 31, 2014, our net undeveloped acreage is scheduled to expire as shown in the table below, unless the primary lease terms are, where appropriate, extended, HBP or otherwise changed:
2015 | 2016 | 2017 | Thereafter | ||||||||
Percent of gross undeveloped acreage | 20 | % | 44 | % | 24 | % | 12 | % | |||
Percent of net undeveloped acreage | 15 | % | 45 | % | 26 | % | 14 | % | |||
We do not believe that the scheduled expiration of our undeveloped acreage will substantially affect our ability or plans to conduct our exploration and development activities.
Item 3 | Legal Proceedings |
See Note 12 to our Consolidated Financial Statements included in Item 8,“Financial Statements and Supplementary Data,” for a more detailed discussion of our legal contingencies. We are not aware of any material legal or governmental proceedings against us, or contemplated to be brought against us, under the various environmental protection statutes to which we are subject.
Item 4 | Mine Safety Disclosures |
Not applicable.
Part II
Item 5 | Market for Registrant’s Common Equity, Related Shareholder Matters and Issuer Purchases of Equity Securities |
Market Information
Our common stock is traded on the NYSE under the symbol “PVA.” The high and low sales prices (composite transactions) related to each fiscal quarter in 2014 and 2013 were as follows:
Sales Price | ||||||||||
Quarter Ended | High | Low | ||||||||
December 31, 2014 | $ | 12.89 | $ | 4.32 | ||||||
September 30, 2014 | $ | 17.20 | $ | 11.53 | ||||||
June 30, 2014 | $ | 18.20 | $ | 13.54 | ||||||
March 31, 2014 | $ | 18.04 | $ | 8.91 | ||||||
December 31, 2013 | $ | 11.21 | $ | 6.50 | ||||||
September 30, 2013 | $ | 6.72 | $ | 4.50 | ||||||
June 30, 2013 | $ | 5.17 | $ | 3.56 | ||||||
March 31, 2013 | $ | 5.00 | $ | 3.97 | ||||||
Equity Holders
As of February 20, 2015, there were 378 record holders and 17,927 beneficial owners (held in street name) of our common stock.
Dividends
In July 2012, we discontinued the quarterly dividend on our common stock. Although our future dividend policy is within the discretion of our board of directors and will depend on various factors, we do not anticipate declaring or paying dividends in the foreseeable future.
Securities Authorized for Issuance Under Equity Compensation Plans
See Item 12, “Security Ownership of Certain Beneficial Owners and Management and Related Shareholder Matters” and Note 14 to our Consolidated Financial Statements included in Item 8. “Financial Statements and Supplementary Data” for information regarding shares of common stock authorized for issuance under our stock compensation plans.
26
Issuer Purchases of Equity Securities
We did not repurchase any shares of our common stock in the fourth quarter of 2014.
A portion of the compensation paid to certain non-employee members of our board of directors is paid in deferred common stock units. Each deferred common stock unit represents one share of common stock, vests immediately upon issuance, and is available to the holder upon retirement from our board of directors. Deferred common stock units that have not been converted into common stock are presented for financial reporting purposes as treasury stock carried at cost.
Performance Graph
The following graph compares our five-year cumulative total shareholder return (assuming reinvestment of dividends) with the cumulative total return of the Standard & Poor’s 600 Oil & Gas Exploration & Production Index and the Standard & Poor’s Small Cap 600 Index. As of December 31, 2014, there were eleven exploration and production companies in the Standard & Poor’s 600 Oil & Gas Exploration & Production Index: Approach Resources Inc., Bill Barret Corporation, Bonanza Creek Energy Inc, Carrizo Oil & Gas, Inc., Comstock Resources, Inc., Contango Oil & Gas Company, Northern Oil & Gas, Inc., PDC Energy, Inc., Penn Virginia Corporation, PetroQuest Energy, Inc., Stone Energy Corporation, Swift Energy Company and Synergy Resources Corporation. The graph assumes $100 is invested on January 1, 2010 in us and each index at December 31, 2009 closing prices.
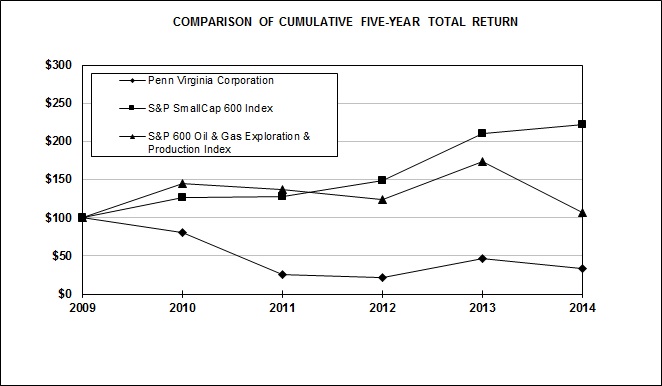
December 31, | |||||||||||||||||||
2010 | 2011 | 2012 | 2013 | 2014 | |||||||||||||||
Penn Virginia Corporation | $ | 79.99 | $ | 25.78 | $ | 21.96 | $ | 46.96 | $ | 33.26 | |||||||||
S&P Small Cap 600 Index | $ | 126.31 | $ | 127.59 | $ | 148.42 | $ | 209.74 | $ | 221.81 | |||||||||
S&P 600 Oil & Gas Exploration & Production Index | $ | 145.40 | $ | 139.60 | $ | 123.73 | $ | 173.52 | $ | 106.22 | |||||||||
27
Item 6 | Selected Financial Data |
The following selected historical financial and operating information was derived from our Consolidated Financial Statements as of and for the years ended December 31, 2014, 2013, 2012, 2011 and 2010. The selected financial data should be read in conjunction with our Consolidated Financial Statements and the accompanying Notes and Supplementary Data in Item 7, “Management’s Discussion and Analysis of Financial Condition and Results of Operations,” and Item 8, “Financial Statements and Supplementary Data.”
2014 | 2013 | 2012 | 2011 | 2010 | |||||||||||||||
(in thousands, except per share amounts) | |||||||||||||||||||
Statements of Operations Data: | |||||||||||||||||||
Revenues | $ | 636,773 | $ | 431,468 | $ | 317,149 | $ | 306,005 | $ | 254,438 | |||||||||
Operating loss 1 | $ | (615,985 | ) | $ | (92,046 | ) | $ | (147,091 | ) | $ | (155,419 | ) | $ | (98,808 | ) | ||||
Loss from continuing operations | $ | (409,592 | ) | $ | (143,070 | ) | $ | (104,589 | ) | $ | (132,915 | ) | $ | (65,327 | ) | ||||
Net income (loss) | $ | (409,592 | ) | $ | (143,070 | ) | $ | (104,589 | ) | $ | (132,915 | ) | $ | 19,667 | |||||
Loss attributable to Penn Virginia Corporation | $ | (409,592 | ) | $ | (143,070 | ) | $ | (104,589 | ) | $ | (132,915 | ) | $ | (8,423 | ) | ||||
Preferred stock dividends | $ | 17,148 | $ | 6,900 | $ | 1,687 | $ | — | $ | — | |||||||||
Loss attributable to common shareholders | $ | (430,996 | ) | $ | (149,970 | ) | $ | (106,276 | ) | $ | (132,915 | ) | $ | (8,423 | ) | ||||
Common Stock Data 2: | |||||||||||||||||||
Earnings (loss) per common share, basic | |||||||||||||||||||
Continuing operations | $ | (6.26 | ) | $ | (2.41 | ) | $ | (2.22 | ) | $ | (2.90 | ) | $ | (1.44 | ) | ||||
Discontinued operations | $ | — | $ | — | $ | — | $ | — | $ | 0.12 | |||||||||
Gain on sale of discontinued operations | $ | — | $ | — | $ | — | $ | — | $ | 1.13 | |||||||||
Net income (loss) | $ | (6.26 | ) | $ | (2.41 | ) | $ | (2.22 | ) | $ | (2.90 | ) | $ | (0.19 | ) | ||||
Earnings (loss) per common share, diluted | |||||||||||||||||||
Continuing operations | $ | (6.26 | ) | $ | (2.41 | ) | $ | (2.22 | ) | $ | (2.90 | ) | $ | (1.44 | ) | ||||
Discontinued operations | $ | — | $ | — | $ | — | $ | — | $ | 0.12 | |||||||||
Gain on sale of discontinued operations | $ | — | $ | — | $ | — | $ | — | $ | 1.13 | |||||||||
Net income (loss) | $ | (6.26 | ) | $ | (2.41 | ) | $ | (2.22 | ) | $ | (2.90 | ) | $ | (0.19 | ) | ||||
Weighted-average shares outstanding: | |||||||||||||||||||
Basic | 68,887 | 62,335 | 47,919 | 45,784 | 45,553 | ||||||||||||||
Diluted | 68,887 | 62,335 | 47,919 | 45,784 | 45,553 | ||||||||||||||
Actual shares outstanding at year-end | 71,569 | 65,307 | 55,117 | 45,714 | 45,557 | ||||||||||||||
Dividends declared per share of common stock | $ | — | $ | — | $ | 0.1125 | $ | 0.225 | $ | 0.225 | |||||||||
Market value at year-end | $ | 6.68 | $ | 9.43 | $ | 4.41 | $ | 5.29 | $ | 16.82 | |||||||||
Number of shareholders | 18,306 | 11,335 | 7,656 | 6,787 | 6,708 | ||||||||||||||
Preferred Stock Data3: | |||||||||||||||||||
Actual shares outstanding at year-end | 19,445 | 11,500 | 11,500 | — | — | ||||||||||||||
Dividends declared per share of preferred stock | $ | 600.00 | $ | 600.00 | $ | 146.67 | $ | — | $ | — | |||||||||
Balance Sheet and Other Financial Data: | |||||||||||||||||||
Property and equipment, net | $ | 1,825,098 | $ | 2,237,304 | $ | 1,723,359 | $ | 1,777,575 | $ | 1,705,584 | |||||||||
Total assets | $ | 2,226,434 | $ | 2,507,087 | $ | 1,842,989 | $ | 1,943,053 | $ | 1,944,600 | |||||||||
Total debt | $ | 1,110,000 | $ | 1,281,000 | $ | 594,759 | $ | 697,307 | $ | 506,536 | |||||||||
Shareholders’ equity | $ | 675,817 | $ | 788,804 | $ | 895,116 | $ | 846,309 | $ | 980,276 | |||||||||
Cash provided by operating activities | $ | 282,724 | $ | 261,512 | $ | 241,458 | $ | 144,741 | $ | 79,839 | |||||||||
Cash paid for capital expenditures | $ | 774,139 | $ | 504,203 | $ | 370,907 | $ | 445,623 | $ | 405,994 | |||||||||
Other Statistical Data: | |||||||||||||||||||
Total production (MBOE) | 7,934 | 6,824 | 6,513 | 7,759 | 7,867 | ||||||||||||||
Proved reserves (MMBOE) | 115 | 136 | 113 | 147 | 157 | ||||||||||||||
1 Operating loss for 2014, 2013, 2012, 2011 and 2010 included impairment charges of $791.8 million, $132.2 million, $104.5 million, $104.7 million and $46.0 million respectively.
2 Our former coal and natural resource management and natural gas midstream businesses are reported as discontinued operations for 2010.
3 Outstanding preferred stock is in the form of 794,463 depositary shares each representing a 1/100th ownership interest in a share of our 6% Series A Convertible Perpetual Preferred Stock, or Series A Preferred Stock, and 3,250,000 depositary shares each representing a 1/100th ownership interest in a share of our 6% Series B Convertible Perpetual Preferred Stock, or Series B Preferred Stock. Each share of the Series A and B Preferred Stock has a liquidation preference of $10,000 per share or $100 per depositary share.
28
Item 7 | Management’s Discussion and Analysis of Financial Condition and Results of Operations |
The following discussion and analysis of our financial condition and results of operations should be read in conjunction with our Consolidated Financial Statements and Notes thereto included in Item 8, “Financial Statements and Supplementary Data.” All dollar amounts presented in the tables that follow are in thousands unless otherwise indicated. Certain year-over-year changes are presented as not meaningful, or “NM,” where disclosure of the actual value does not otherwise enhance the analysis. Also, due to the combination of different units of volumetric measure and the number of decimal places presented, certain results may not calculate explicitly from the values presented in the tables.
Overview and Executive Summary
We are an independent oil and gas company engaged in the exploration, development and production of oil, NGLs and natural gas in various onshore regions of the United States. Our current operations consist primarily of drilling unconventional horizontal development wells in the Eagle Ford Shale in South Texas. We also have operations in the Granite Wash in Oklahoma and the Haynesville Shale and Cotton Valley in East Texas. As of December 31, 2014, we had proved oil and gas reserves of approximately 115 MMBOE.
The following table sets forth certain summary operating and financial statistics for the periods presented:
Year Ended December 31, | |||||||||||
2014 | 2013 | 2012 | |||||||||
Total production (MBOE) | 7,934 | 6,824 | 6,513 | ||||||||
Average daily production (BOEPD) | 21,738 | 18,696 | 17,795 | ||||||||
Crude oil and NGL production (MBbl) | 5,754 | 4,417 | 3,136 | ||||||||
Crude oil and NGL production as a percent of total | 73 | % | 65 | % | 48 | % | |||||
Product revenues, as reported | $ | 512,882 | $ | 430,693 | $ | 310,484 | |||||
Product revenues, adjusted for derivatives | $ | 505,458 | $ | 429,651 | $ | 338,802 | |||||
Crude oil and NGL revenues as a percent of total, as reported | 89 | % | 88 | % | 84 | % | |||||
Realized prices: | |||||||||||
Crude oil ($/Bbl) | $ | 90.50 | $ | 101.13 | $ | 101.95 | |||||
NGL ($/Bbl) | $ | 31.14 | $ | 31.30 | $ | 35.13 | |||||
Natural gas ($/Mcf) | $ | 4.44 | $ | 3.64 | $ | 2.46 | |||||
Aggregate ($/BOE) | $ | 64.64 | $ | 63.11 | $ | 47.67 | |||||
Production and lifting costs ($/BOE): | |||||||||||
Lease operating | $ | 6.09 | $ | 5.20 | $ | 4.80 | |||||
Gathering, processing and transportation | $ | 2.31 | $ | 1.88 | $ | 2.18 | |||||
Production and ad valorem taxes ($/BOE) | $ | 3.53 | $ | 3.28 | $ | 1.63 | |||||
General and administrative ($/BOE) 1 | $ | 5.15 | $ | 6.46 | $ | 5.96 | |||||
Total operating costs ($/BOE) | $ | 17.08 | $ | 16.82 | $ | 14.57 | |||||
Depreciation, depletion and amortization ($/BOE) | $ | 37.85 | $ | 35.99 | $ | 31.68 | |||||
Cash provided by operating activities 2 | $ | 282,724 | $ | 261,512 | $ | 241,458 | |||||
Cash paid for capital expenditures, excluding 2013 EF Acquisition | $ | 774,139 | $ | 504,203 | $ | 370,907 | |||||
Cash and cash equivalents at end of period | $ | 6,252 | $ | 23,474 | $ | 17,650 | |||||
Debt outstanding, net of discount, at end of period | $ | 1,110,000 | $ | 1,281,000 | $ | 594,759 | |||||
Credit available under revolving credit facility at end of period 3 | $ | 413,196 | $ | 191,346 | $ | 297,922 | |||||
Proved reserves (MMBOE) | 115 | 136 | 113 | ||||||||
Net development wells drilled | 51.6 | 34.6 | 27.8 | ||||||||
Net exploratory wells drilled | — | — | 4.9 | ||||||||
1 Excludes equity-classified share-based compensation, which is a non-cash expense, of $0.46, $0.84 and $0.98 and liability-classified share-based compensation of $0.57, $0.60 and $0.11 for the years ended December 31, 2014, 2013 and 2012.
2 Includes the receipt of a federal income tax refund of approximately $32 million in the year ended December 31, 2012 attributable to 2010 and prior years.
3 As reduced by outstanding borrowings and letters of credit. Also, excludes an additional $50 million attributable to the excess of the borrowing base of $500 million over the current commitment of $450 million for 2014.
29
In 2014, our crude oil and NGL production increased to 73 percent compared to 65 percent of our total production in 2013. Consistent with our growth in liquids-focused production, our cash from operating activities, excluding working capital changes, increased approximately $41 million, or 17 percent, for 2014 compared to 2013, despite declining crude oil and NGL prices during the second half of 2014.
Our growth in crude oil and NGL production has been focused exclusively in the Eagle Ford in South Texas. Since our initial acquisition in this region in 2010 and through February 20, 2015, we have added a total of 280 gross wells, including 246 gross wells that are operated by us and 34 gross wells that are operated by our partners. We are currently operating a total of three drilling rigs, all in the Eagle Ford. Our capital program, which is substantially dedicated to this play, is being financed with a combination of cash from operating activities and borrowings under the Revolver.
To mitigate the volatile effect of commodity price fluctuations, we have a comprehensive hedging program in place. The Financial Condition discussion that follows and Note 5 to the Consolidated Financial Statements provide a detailed summary of our open commodity derivative positions as well as the historical results of our hedging program for the years ended December 31, 2014, 2013 and 2012.
Key Developments
The following general business developments and corporate actions in 2014 had or are expected to have a significant impact on our results of operations, financial position and cash flows: (i) significant decline in commodity prices and the addition of crude oil hedge contracts for calendar year 2015 and 2016, (ii) drilling results and future development plans in the Eagle Ford, (iii) an increase in our borrowing base under the Revolver, (iv) the acquisition of additional Eagle Ford acreage, (v) the sale of our Mississippi assets, South Texas oil gathering rights and South Texas natural gas gathering and gas lift assets, (vi) the resolution of arbitration related to the EF Acquisition and (vii) our recent preferred stock offering.
Significant Decline in Commodity Prices and Addition of Crude Oil Hedge Contracts for Calendar Years 2015 and 2016
In the second half of 2014, commodity prices, particularly crude oil, began to decline from recent high levels. The decline became precipitous late in the fourth quarter of 2014 and into the first quarter of 2015. As discussed below, the significant magnitude of this price decline has led to substantial changes in our operating and drilling programs.
In addition to adjusting our capital program as a result of the decline in commodity pricing, we were also able to enter into additional crude oil derivative contracts for calendar years 2015 and 2016 in order to hedge a portion of our crude oil production for those periods prior to the most significant price declines. Accordingly, in 2014, we provided additional hedge contracts for an average of 9,500 BOPD at a weighted-average price of $89.47 per Bbl for 2015 and 4,000 BOPD at a price of $88.12 per Bbl for 2016. The addition of these contracts has increased our total hedged crude oil production to 13,000 BOPD at a weighted-average price of $90.48 per Bbl for the first half of 2015 and 11,000 BOPD at a weighted-average price of $89.86 per Bbl for the second half of 2015. As a result of these activities, approximately 80 to 90 percent of our total estimated crude oil production for 2015 is subject to favorable hedges.
Drilling Results and Future Development Plans for the Eagle Ford
During 2014, we completed and turned in line 84 gross (51.6 net) operated wells in the Eagle Ford. Our Eagle Ford production was 17,459 net barrels of oil equivalent per day, or BOEPD, during the three months ended December 31, 2014 with oil comprising 12,676 BOPD, or 73 percent, and NGLs and natural gas comprising approximately 14 percent and 13 percent, respectively. In the month of December 2014, our average Eagle Ford production was 18,636 BOEPD, 71 percent of which was crude oil, 15 percent was NGLs and 14 percent was natural gas.
Beginning in March 2014, we have completed and turned in line 17 Upper Eagle Ford wells, including one well that had an operational issue. The average IP rate for the other 16 wells was1,217 BOEPD (61 percent crude oil) and the average 30-day rate for 14 of these 16 wells with sufficient production history was 1,009 BOEPD (61 percent crude oil). The early performance and lower initial rates of decline for the Upper Eagle Ford wells are an improvement over what we have experienced thus far in the Lower Eagle Ford. The internal EUR for these wells averaged approximately 717 MBOE, with a range of 388 to 1,231 MBOE. Due to these favorable results, we plan to devote approximately 42 percent of our 2015 capital expenditures to drilling additional Upper Eagle Ford wells.
Our total capital expenditures for 2015 are anticipated to be up to approximately $345 million, of which 90 percent has been allocated to drilling and completion activities. We intend to operate three to four drilling rigs in the Eagle Ford during 2015. We expect to drill and complete approximately 64 gross wells in the Eagle Ford in 2015 including 24 gross wells in the Upper Eagle Ford. We anticipate our 2015 drilling and completion costs to decrease from 2014 levels as a result of: (i) a decrease in the number of frac stages per well due to an increase in the distance between stages, (ii) a reduction in the amount of proppant per stage, (iii) renegotiated service sector costs and (iv) an ongoing improvement in operational execution of the drilling and completion program.
30
Borrowing Base Increase
In October 2014, the borrowing base under the Revolver was increased to $500 million from $437.5 million in connection with our regular semi-annual redetermination. For more information about our Revolver, please read “Capital Resources—Revolver Borrowings.”
Acquisition of Additional Eagle Ford Acreage
In July 2014, we entered into a definitive agreement to acquire approximately 13,125 gross (11,660 net) acres in Lavaca County, Texas, the vast majority of which are in the “volatile oil window” of the Eagle Ford. The transaction closed in August 2014 for $45.6 million, of which $34.9 million was paid at closing and the balance of $10.6 million will be paid over the next three years as a drilling carry. We anticipate commencing drilling activities on this acreage in 2015. The transaction, combined with recent leasing, brings our total Eagle Ford acreage position to approximately 140,000 gross (101,800 net) acres. The acquired acreage, most of which we expect will be prospective in the Upper Eagle Ford, is adjacent to our Shiner area.
2014 Asset Dispositions
Sale of Mississippi Assets. In July 2014, we sold our Selma Chalk assets in Mississippi for proceeds of $67.9 million, net of transaction costs and customary closing adjustments. An impairment charge of $117.9 million was recognized in the three months ended June 30, 2014 to write down these assets to their estimated fair value.
Sale of Rights to Construct an Oil Gathering System in South Texas. In July 2014, we sold the rights to construct a crude oil gathering and intermediate transportation system in South Texas to Republic Midstream, LLC, or Republic, for proceeds of $147.1 million, net of transaction costs. Concurrent with the sale, we entered into agreements with Republic to provide us gathering and intermediate pipeline transportation services for a substantial portion of our South Texas crude oil and condensate production for a term of 25 years. We realized a gain of $147.1 million, of which $63.0 million was recognized upon the closing of the transaction and the remaining $84.1 million was deferred and will be recognized over a twenty-five year period after the system has been constructed and is operational, currently expected to be in the third quarter of 2015.
Sale of South Texas Natural Gas Gathering and Gas Lift Assets. In January 2014, we sold our natural gas gathering and gas lift assets in South Texas to American Midstream Partners, LP, or AMID, for proceeds of approximately $96 million, net of transaction costs. Concurrent with the sale, we entered into an agreement with AMID to provide us natural gas gathering, compression and gas lift services for a substantial portion of our current and future South Texas natural gas production. We realized a gain of $67.3 million, of which $56.7 million was recognized upon the closing of the transaction and the remaining $10.6 million was deferred and is being recognized over a twenty-five year period.
Settlement of Arbitration
Commencing December 2013, we were involved in arbitration with Magnum Hunter Resources Corporation, or MHR, the seller in the EF Acquisition. The arbitration related to disputes we had with MHR regarding contractual adjustments to the purchase price for the EF Acquisition and suspense funds that we believed MHR was obligated to transfer to us. In July 2014, we received the arbitrator’s determination, which required MHR to pay us a total of $35.1 million, including purchase price adjustments, revenue suspense funds due to partners and royalty owners and interest ($1.3 million) on the funds since the date of acquisition. Payment of the arbitration settlement was made by MHR in August 2014.
Preferred Stock Offering and Induced Conversion of Outstanding Preferred Stock
In June 2014, we completed a private offering of 3,250,000 depositary shares each representing 1/100th interest in a share of our 6% Series B Convertible Perpetual Preferred Stock, or the Series B Preferred Stock, for approximately $313 million of proceeds, net of underwriting fees and issuance costs. Concurrent with the Series B Preferred Stock offering and subsequently in July 2014, we paid a total of $4.3 million to induce the conversion of 3,527 shares, or 352,732 depositary shares, of our 6% Series A Convertible Perpetual Preferred Stock, or the Series A Preferred Stock. A total of 5.9 million shares of our common stock were issued in connection with the induced conversion of the Series A Preferred Stock.
31
Results of Operations
Production
The following tables set forth a summary of our total and daily production volumes by product and geographic region for the periods presented (certain results in the tables below may not calculate due to rounding):
Total Production | Average Daily Production | ||||||||||||||||||||||||||||
Crude oil | Year Ended December 31, | 2014 vs. | 2013 vs. | Year Ended December 31, | 2014 vs. | 2013 vs. | |||||||||||||||||||||||
2014 | 2013 | 2012 | 2013 | 2012 | 2014 | 2013 | 2012 | 2013 | 2012 | ||||||||||||||||||||
(MBbl) | (Bbl per day) | ||||||||||||||||||||||||||||
Texas | |||||||||||||||||||||||||||||
South Texas | 4,459 | 3,199 | 1,960 | 1,259 | 1,240 | 12,216 | 8,766 | 5,354 | 3,451 | 3,412 | |||||||||||||||||||
East Texas | 54 | 63 | 71 | (10 | ) | (8 | ) | 148 | 174 | 194 | (26 | ) | (20 | ) | |||||||||||||||
Mid-Continent | 126 | 160 | 206 | (35 | ) | (46 | ) | 345 | 440 | 563 | (94 | ) | (124 | ) | |||||||||||||||
Other | 5 | 12 | 15 | (7 | ) | (3 | ) | 14 | 33 | 41 | (19 | ) | (8 | ) | |||||||||||||||
4,644 | 3,435 | 2,252 | 1,209 | 1,183 | 12,723 | 9,412 | 6,153 | 3,311 | 3,259 | ||||||||||||||||||||
% Change | 35 | % | 53 | % | |||||||||||||||||||||||||
NGLs | Year Ended December 31, | 2014 vs. | 2013 vs. | Year Ended December 31, | 2014 vs. | 2013 vs. | |||||||||||||||||||||||
2014 | 2013 | 2012 | 2013 | 2012 | 2014 | 2013 | 2012 | 2013 | 2012 | ||||||||||||||||||||
(MBbl) | (Bbl per day) | ||||||||||||||||||||||||||||
Texas | |||||||||||||||||||||||||||||
South Texas | 775 | 485 | 205 | 289 | 280 | 2,122 | 1,330 | 561 | 793 | 769 | |||||||||||||||||||
East Texas | 122 | 191 | 281 | (68 | ) | (90 | ) | 335 | 523 | 767 | (187 | ) | (244 | ) | |||||||||||||||
Mid-Continent | 213 | 306 | 397 | (94 | ) | (91 | ) | 582 | 840 | 1,085 | (257 | ) | (246 | ) | |||||||||||||||
Other | — | — | 1 | — | (1 | ) | — | — | 2 | — | (2 | ) | |||||||||||||||||
1,110 | 982 | 884 | 127 | 98 | 3,040 | 2,692 | 2,415 | 348 | 277 | ||||||||||||||||||||
% Change | 13 | % | 11 | % | |||||||||||||||||||||||||
Natural gas | Year Ended December 31, | 2014 vs. | 2013 vs. | Year Ended December 31, | 2014 vs. | 2013 vs. | |||||||||||||||||||||||
2014 | 2013 | 2012 | 2013 | 2012 | 2014 | 2013 | 2012 | 2013 | 2012 | ||||||||||||||||||||
(MMcf) | (MMcf per day) | ||||||||||||||||||||||||||||
Texas | |||||||||||||||||||||||||||||
South Texas | 4,081 | 2,436 | 1,015 | 1,644 | 1,422 | 11 | 7 | 3 | 5 | 4 | |||||||||||||||||||
East Texas | 4,004 | 4,593 | 5,909 | (588 | ) | (1,316 | ) | 11 | 13 | 16 | (2 | ) | (4 | ) | |||||||||||||||
Mid-Continent | 2,413 | 2,823 | 3,646 | (410 | ) | (823 | ) | 7 | 8 | 10 | (1 | ) | (2 | ) | |||||||||||||||
Other | 2,586 | 4,583 | 9,692 | (1,996 | ) | (5,109 | ) | 7 | 13 | 26 | (5 | ) | (14 | ) | |||||||||||||||
13,085 | 14,435 | 20,261 | (1,350 | ) | (5,826 | ) | 36 | 40 | 55 | (4 | ) | (16 | ) | ||||||||||||||||
% Change | (9 | )% | (29 | )% | |||||||||||||||||||||||||
Combined total | Year Ended December 31, | 2014 vs. | 2013 vs. | Year Ended December 31, | 2014 vs. | 2013 vs. | |||||||||||||||||||||||
2014 | 2013 | 2012 | 2013 | 2012 | 2014 | 2013 | 2012 | 2013 | 2012 | ||||||||||||||||||||
(MBOE) | (BOE per day) | ||||||||||||||||||||||||||||
Texas | |||||||||||||||||||||||||||||
South Texas | 5,913 | 4,091 | 2,334 | 1,823 | 1,757 | 16,201 | 11,208 | 6,378 | 4,994 | 4,830 | |||||||||||||||||||
East Texas | 844 | 1,020 | 1,337 | (176 | ) | (317 | ) | 2,311 | 2,794 | 3,653 | (482 | ) | (859 | ) | |||||||||||||||
Mid-Continent | 741 | 937 | 1,211 | (197 | ) | (273 | ) | 2,029 | 2,568 | 3,308 | (539 | ) | (740 | ) | |||||||||||||||
Other 1 | 437 | 776 | 1,631 | (339 | ) | (855 | ) | 1,196 | 2,126 | 4,457 | (929 | ) | (2,332 | ) | |||||||||||||||
7,934 | 6,824 | 6,513 | 1,111 | 311 | 21,738 | 18,696 | 17,795 | 3,043 | 900 | ||||||||||||||||||||
% Change | 16 | % | 5 | % | |||||||||||||||||||||||||
1 Comprised of: (i) our three active Marcellus Shale wells in Pennsylvania, (ii) for periods through July 2014, our divested Selma Chalk assets in Mississippi, and (iii) for periods through July 2012, our divested Appalachian natural gas properties in West Virginia, Kentucky and Virginia.
2014 vs. 2013. Total production increased during the year ended December 31, 2014 compared to 2013 due primarily to production from the continued expansion of our Eagle Ford development program in South Texas. The increase was partially offset by natural production declines in our East Texas, Mid-Continent and Mississippi regions, as well as the effect of the sale of our Mississippi properties in July 2014. Approximately 73 percent of total production during 2014 was attributable to oil and NGLs, which represents an increase of approximately 30 percent over 2013. During 2014, our Eagle Ford production represented approximately 74 percent of our total production compared to approximately 60 percent from this play during 2013.
32
2013 vs. 2012. Total production increased during 2013 compared to 2012 due primarily to the EF Acquisition and the continued expansion of our development program in the Eagle Ford. The increase was partially offset by the effect of production declines in our East Texas and Mid-Continent regions and the sale of our Appalachian properties in July 2012. Approximately 65% of total production during 2013 was attributable to oil and NGLs, which represents an increase of approximately 41% over 2012. During 2013, our Eagle Ford production represented approximately 60 percent of our total production compared to approximately 36 percent during 2012.
Product Revenues and Prices
The following tables set forth a summary of our revenues and prices per unit of volume by product and geographic region for the periods presented:
Crude oil | Year Ended December 31, | 2014 vs. | 2013 vs. | Year Ended December 31, | 2014 vs. | 2013 vs. | |||||||||||||||||||||||||||||||||
2014 | 2013 | 2012 | 2013 | 2012 | 2014 | 2013 | 2012 | 2013 | 2012 | ||||||||||||||||||||||||||||||
($ per Bbl) | |||||||||||||||||||||||||||||||||||||||
Texas | |||||||||||||||||||||||||||||||||||||||
South Texas | $ | 403,879 | $ | 324,899 | $ | 202,479 | $ | 78,980 | $ | 122,420 | $ | 90.58 | $ | 101.55 | $ | 103.33 | $ | (10.96 | ) | $ | (1.78 | ) | |||||||||||||||||
East Texas | 4,852 | 6,325 | 6,862 | (1,473 | ) | (537 | ) | 90.08 | 99.69 | 96.55 | (9.61 | ) | 3.14 | ||||||||||||||||||||||||||
Mid-Continent | 11,027 | 14,920 | 18,667 | (3,893 | ) | (3,747 | ) | 87.59 | 93.01 | 90.55 | (5.42 | ) | 2.46 | ||||||||||||||||||||||||||
Other | 528 | 1,263 | 1,564 | (735 | ) | (301 | ) | 96.02 | 104.75 | 103.81 | (8.73 | ) | 0.94 | ||||||||||||||||||||||||||
$ | 420,286 | $ | 347,407 | $ | 229,572 | $ | 72,879 | $ | 117,835 | $ | 90.50 | $ | 101.13 | $ | 101.95 | $ | (10.62 | ) | $ | (0.83 | ) | ||||||||||||||||||
% Change | (11 | )% | (1 | )% | |||||||||||||||||||||||||||||||||||
NGLs | Year Ended December 31, | 2014 vs. | 2013 vs. | Year Ended December 31, | 2014 vs. | 2013 vs. | |||||||||||||||||||||||||||||||||
2014 | 2013 | 2012 | 2013 | 2012 | 2014 | 2013 | 2012 | 2013 | 2012 | ||||||||||||||||||||||||||||||
($ per Bbl) | |||||||||||||||||||||||||||||||||||||||
Texas | |||||||||||||||||||||||||||||||||||||||
South Texas | $ | 19,555 | $ | 12,969 | $ | 6,451 | $ | 6,586 | $ | 6,518 | $ | 25.24 | $ | 26.72 | $ | 31.43 | $ | (1.48 | ) | $ | (4.71 | ) | |||||||||||||||||
East Texas | 5,440 | 6,743 | 10,195 | (1,303 | ) | (3,452 | ) | 44.44 | 35.35 | 36.32 | 9.09 | (0.97 | ) | ||||||||||||||||||||||||||
Mid-Continent | 9,557 | 11,036 | 14,365 | (1,479 | ) | (3,329 | ) | 44.95 | 36.01 | 36.16 | 8.94 | (0.15 | ) | ||||||||||||||||||||||||||
Other | — | — | 40 | — | (40 | ) | — | — | 51.61 | — | (51.61 | ) | |||||||||||||||||||||||||||
$ | 34,552 | $ | 30,748 | $ | 31,051 | $ | 3,804 | $ | (303 | ) | $ | 31.14 | $ | 31.30 | $ | 35.13 | $ | (0.17 | ) | $ | (3.82 | ) | |||||||||||||||||
% Change | (1 | )% | (11 | )% | |||||||||||||||||||||||||||||||||||
Natural gas | Year Ended December 31, | 2014 vs. | 2013 vs. | Year Ended December 31, | 2014 vs. | 2013 vs. | |||||||||||||||||||||||||||||||||
2014 | 2013 | 2012 | 2013 | 2012 | 2014 | 2013 | 2012 | 2013 | 2012 | ||||||||||||||||||||||||||||||
($ per Mcf) | |||||||||||||||||||||||||||||||||||||||
Texas | |||||||||||||||||||||||||||||||||||||||
South Texas | $ | 17,132 | $ | 8,586 | $ | 2,593 | $ | 8,546 | $ | 5,993 | $ | 4.20 | $ | 3.52 | $ | 2.56 | $ | 0.67 | $ | 0.97 | |||||||||||||||||||
East Texas | 17,875 | 15,571 | 13,607 | 2,304 | 1,964 | 4.46 | 3.39 | 2.30 | 1.07 | 1.09 | |||||||||||||||||||||||||||||
Mid-Continent | 11,060 | 10,655 | 7,920 | 405 | 2,735 | 4.58 | 3.77 | 2.17 | 0.81 | 1.60 | |||||||||||||||||||||||||||||
Other | 11,977 | 17,726 | 25,741 | (5,749 | ) | (8,015 | ) | 4.63 | 3.87 | 2.66 | 0.76 | 1.21 | |||||||||||||||||||||||||||
$ | 58,044 | $ | 52,538 | $ | 49,861 | $ | 5,506 | $ | 2,677 | $ | 4.44 | $ | 3.64 | $ | 2.46 | $ | 0.80 | $ | 1.18 | ||||||||||||||||||||
% Change | 22 | % | 48 | % | |||||||||||||||||||||||||||||||||||
Combined total | Year Ended December 31, | 2014 vs. | 2013 vs. | Year Ended December 31, | 2014 vs. | 2013 vs. | |||||||||||||||||||||||||||||||||
2014 | 2013 | 2012 | 2013 | 2012 | 2014 | 2013 | 2012 | 2013 | 2012 | ||||||||||||||||||||||||||||||
($ per BOE) | |||||||||||||||||||||||||||||||||||||||
Texas | |||||||||||||||||||||||||||||||||||||||
South Texas | $ | 440,566 | 346,454 | 211,523 | $ | 94,112 | $ | 134,931 | $ | 74.50 | $ | 84.69 | $ | 90.62 | $ | (10.19 | ) | $ | (5.93 | ) | |||||||||||||||||||
East Texas | 28,167 | 28,639 | 30,664 | (472 | ) | (2,025 | ) | 33.39 | 28.09 | 22.94 | 5.29 | 5.15 | |||||||||||||||||||||||||||
Mid-Continent | 31,644 | 36,611 | 40,952 | (4,967 | ) | (4,341 | ) | 42.72 | 39.09 | 33.83 | 3.63 | 5.27 | |||||||||||||||||||||||||||
Other | 12,505 | 18,989 | 27,345 | (6,484 | ) | (8,356 | ) | 28.64 | 24.48 | 16.76 | 4.17 | 7.71 | |||||||||||||||||||||||||||
$ | 512,882 | $ | 430,693 | $ | 310,484 | $ | 82,189 | $ | 120,209 | $ | 64.64 | $ | 63.11 | $ | 47.67 | $ | 1.53 | $ | 15.44 | ||||||||||||||||||||
% Change | 2 | % | 32 | % | |||||||||||||||||||||||||||||||||||
33
The following table provides an analysis of the changes in our revenues for the periods presented:
2014 vs. 2013 Revenue Variance Due to | 2013 vs. 2012 Revenue Variance Due to | ||||||||||||||||||||||
Volume | Price | Total | Volume | Price | Total | ||||||||||||||||||
Crude oil | $ | 122,219 | $ | (49,340 | ) | $ | 72,879 | $ | 120,652 | $ | (2,817 | ) | $ | 117,835 | |||||||||
NGLs | 3,987 | (183 | ) | 3,804 | 3,460 | (3,763 | ) | (303 | ) | ||||||||||||||
Natural gas | (4,962 | ) | 10,468 | 5,506 | (14,356 | ) | 17,033 | 2,677 | |||||||||||||||
$ | 121,244 | $ | (39,055 | ) | $ | 82,189 | $ | 109,756 | $ | 10,453 | $ | 120,209 | |||||||||||
Effects of Derivatives
In 2014 and 2013, respectively, we paid $7.4 million and $1.0 million, and in 2012, we received $28.3 million from cash settlements of oil and gas derivatives. The following table reconciles crude oil and natural gas revenues to realized prices, as adjusted for derivative activities, for the periods presented:
Year Ended December 31, | Increase | Year Ended December 31, | Favorable | ||||||||||||||||||||
2014 | 2013 | (Unfavorable) | 2013 | 2012 | (Unfavorable) | ||||||||||||||||||
Crude oil revenues as reported | $ | 420,286 | $ | 347,407 | $ | 72,879 | $ | 347,407 | $ | 229,572 | $ | 576,979 | |||||||||||
Derivative settlements, net | (6,170 | ) | (2,624 | ) | (3,546 | ) | (2,624 | ) | 8,428 | 5,804 | |||||||||||||
$ | 414,116 | $ | 344,783 | $ | 69,333 | $ | 344,783 | $ | 238,000 | $ | 582,783 | ||||||||||||
Crude oil prices per Bbl, as reported | $ | 90.50 | $ | 101.13 | $ | (10.63 | ) | $ | 101.13 | $ | 101.94 | $ | (0.81 | ) | |||||||||
Derivative settlements per Bbl | (1.33 | ) | (0.76 | ) | (0.57 | ) | (0.76 | ) | 3.74 | (4.50 | ) | ||||||||||||
$ | 89.17 | $ | 100.37 | $ | (11.20 | ) | $ | 100.37 | $ | 105.68 | $ | (5.31 | ) | ||||||||||
Natural gas revenues as reported | $ | 58,044 | $ | 52,538 | $ | 5,506 | $ | 52,538 | $ | 49,861 | $ | 2,677 | |||||||||||
Derivative settlements, net | (1,254 | ) | 1,582 | (2,836 | ) | 1,582 | 19,890 | (18,308 | ) | ||||||||||||||
$ | 56,790 | $ | 54,120 | $ | 2,670 | $ | 54,120 | $ | 69,751 | $ | (15,631 | ) | |||||||||||
Natural gas prices per Mcf, as reported | $ | 4.44 | $ | 3.64 | $ | 0.80 | $ | 3.64 | $ | 2.46 | $ | 1.18 | |||||||||||
Derivative settlements per Mcf | (0.10 | ) | 0.11 | (0.21 | ) | 0.11 | 0.98 | (0.87 | ) | ||||||||||||||
$ | 4.34 | $ | 3.75 | $ | 0.59 | $ | 3.75 | $ | 3.44 | $ | 0.31 | ||||||||||||
Gain (Loss) on Sales of Property and Equipment
In 2014, we recognized a gain of $63.0 million in connection with the sale of rights to construct a crude oil gathering and intermediate transportation system and a gain of $57.1 million on the sale of our natural gas gathering and gas lift assets in South Texas, including $56.7 million recognized upon the closing of the sale and $0.4 million attributable to the deferred portion of the gain. In 2013, we recognized losses of $0.3 million related primarily to certain post-closing adjustments for asset sales that occurred in prior years. In 2012, we recognized gains of $3.9 million attributable to the sale of substantially all of our Appalachian natural gas assets as well as certain undeveloped Marcellus Shale acreage in Pennsylvania. In addition, we recognized several individually insignificant gains and losses on the sale of property, equipment, tubular inventory and well material during all periods presented.
Other Revenues
2014 vs. 2013. Other revenues, which includes gathering, transportation, compression, water supply and disposal fees that we charge to other parties, net of marketing and related expenses and accretion of our unused firm transportation obligation, increased during 2014 from 2013 due primarily to income related to water supply and disposal which began in April 2014. The increase was partially offset by the effect of a $1.6 million gain in 2013 attributable to the sale of certain proprietary seismic data.
2013 vs. 2012. Net revenues from gathering, transportation and compression decreased during 2013 from 2012 due to lower production by other parties in our East Texas AMI. In addition, we recognized a full year of accretion expense, or $1.7 million, in 2013 on our unused firm transportation obligation as compared to one quarter in 2012. These decreases were partially offset by a $1.6 million gain on the sale of certain proprietary seismic data in 2013.
34
Production and Lifting Costs
Year Ended December 31, | 2014 vs. | 2013 vs. | |||||||||||||||||
2014 | 2013 | 2012 | 2013 | 2012 | |||||||||||||||
Favorable (unfavorable) | |||||||||||||||||||
Lease operating | $ | 48,298 | $ | 35,461 | $ | 31,266 | $ | (12,837 | ) | $ | (4,195 | ) | |||||||
Per unit of production ($/BOE) | $ | 6.09 | $ | 5.20 | $ | 4.80 | $ | (0.89 | ) | $ | (0.40 | ) | |||||||
% Change per unit of production | (17 | )% | (8 | )% | |||||||||||||||
2014 vs. 2013. Lease operating expense increased on an absolute and per-unit basis during 2014 compared to 2013 due primarily to higher production volume during 2014. Most volume-based costs, including chemical, water disposal and labor costs increased on an absolute basis, but decreased on a per-unit basis. As discussed in Key Developments, we sold our natural gas gathering and gas lift assets in the South Texas region and entered into an agreement with the buyer to provide us natural gas gathering, compression and gas lift services. We began incurring costs for these services in February 2014. Finally, we also experienced higher workover and subsurface maintenance costs in both South and East Texas in 2014 compared to 2013.
2013 vs. 2012. Lease operating expense increased during 2013 compared to 2012 due primarily to higher subsurface maintenance costs for wells located in East Texas. In addition, we incurred subsurface maintenance costs for certain wells in the EF Acquisition in which we had to remove submersible pumps and replace them with rod pumps. We also incurred higher water disposal and chemical costs associated with our increased oil production. These increases were partially offset by the effect of the sale of our higher-cost Appalachian gas properties in July 2012.
Year Ended December 31, | 2014 vs. | 2013 vs. | |||||||||||||||||
2014 | 2013 | 2012 | 2013 | 2012 | |||||||||||||||
Favorable (unfavorable) | |||||||||||||||||||
Gathering, processing and transportation | $ | 18,294 | $ | 12,839 | $ | 14,196 | $ | (5,455 | ) | $ | 1,357 | ||||||||
Per unit production ($/BOE) | $ | 2.31 | $ | 1.88 | $ | 2.18 | $ | (0.42 | ) | $ | 0.30 | ||||||||
% Change per unit of production | (23 | )% | 14 | % | |||||||||||||||
2014 vs. 2013. Gathering, processing and transportation charges increased during 2014 compared to 2013 due primarily to additional gathering and compression charges for natural gas and NGL production in the South Texas region attributable to the new gathering, compression and gas lift services agreement discussed above, partially offset by the effect of lower natural gas and NGL production volume in our East Texas and Mid-Continent regions as well as the effect of lower natural gas production following the sale of our Mississippi assets in July 2014.
2013 vs. 2012. Gathering, processing and transportation charges decreased during 2013 compared to 2012 due primarily to the effect of the sale of our higher-cost Appalachian properties in July 2012, partially offset by an increase in processing costs related to expanded natural gas production in the Eagle Ford.
Production and Ad Valorem Taxes
Year Ended December 31, | 2014 vs. | 2013 vs. | |||||||||||||||||
2014 | 2013 | 2012 | 2013 | 2012 | |||||||||||||||
Favorable (unfavorable) | |||||||||||||||||||
Production/severance taxes | $ | 22,567 | $ | 17,355 | $ | 7,534 | $ | (5,212 | ) | $ | (9,821 | ) | |||||||
Ad valorem taxes | 5,423 | 5,049 | 3,100 | (374 | ) | (1,949 | ) | ||||||||||||
$ | 27,990 | $ | 22,404 | $ | 10,634 | $ | (5,586 | ) | $ | (11,770 | ) | ||||||||
Per unit production ($/BOE) | $ | 3.53 | $ | 3.28 | $ | 1.63 | $ | (0.24 | ) | $ | (1.65 | ) | |||||||
Production/severance tax rate | 4.4 | % | 4.0 | % | 2.4 | % | |||||||||||||
% Change per unit of production | (7 | )% | NM | ||||||||||||||||
2014 vs. 2013. Production taxes increased during 2014 compared to 2013 due primarily to increased crude oil production in the South Texas region, which carries a higher severance tax rate than our other operating areas, partially offset by severance tax audit refunds for natural gas production in Mississippi attributable to periods prior to the sale of those properties.
2013 vs. 2012. Production and ad valorem taxes increased during 2013 compared to 2012 due primarily to our increased activities in the Eagle Ford. In addition, we recognized approximately $4 million of non-recurring credits in 2012 for severance tax rebates on certain horizontal and ultra-deep natural gas wells in Oklahoma and Texas.
35
General and Administrative
Year Ended December 31, | 2014 vs. | 2013 vs. | |||||||||||||||||
2014 | 2013 | 2012 | 2013 | 2012 | |||||||||||||||
Favorable (unfavorable) | |||||||||||||||||||
General and administrative expenses | $ | 39,106 | $ | 40,410 | $ | 37,555 | $ | 1,304 | $ | (2,855 | ) | ||||||||
Share-based compensation (liability-classified) | 4,519 | 4,116 | 714 | (403 | ) | (3,402 | ) | ||||||||||||
Share-based compensation (equity-classified) | 3,627 | 5,781 | 6,347 | 2,154 | 566 | ||||||||||||||
Significant non-recurring expenses: | |||||||||||||||||||
ERP system development costs | 1,154 | 655 | — | (499 | ) | (655 | ) | ||||||||||||
EF Acquisition-related transaction costs | — | 2,587 | — | 2,587 | (2,587 | ) | |||||||||||||
EF Acquisition-related arbitration and other costs | 589 | 442 | — | (147 | ) | (442 | ) | ||||||||||||
Restructuring expenses | 10 | 7 | 1,284 | (3 | ) | 1,277 | |||||||||||||
$ | 49,005 | $ | 53,998 | $ | 45,900 | $ | 4,993 | $ | (8,098 | ) | |||||||||
Per unit of production ($/BOE) | $ | 6.18 | $ | 7.91 | $ | 7.05 | $ | 1.74 | $ | (0.87 | ) | ||||||||
Per unit of production excluding liability and equity-classified share-based compensation ($/BOE) | $ | 5.15 | $ | 6.46 | $ | 5.96 | $ | 1.31 | $ | (0.50 | ) | ||||||||
Per unit of production excluding share-based compensation and other non-recurring expenses identified above ($/BOE) | $ | 4.93 | $ | 5.92 | $ | 5.77 | $ | 0.99 | $ | (0.15 | ) | ||||||||
2014 vs. 2013. Our total general and administrative expenses decreased on both an absolute and per unit basis during 2014 compared to 2013, reflecting lower incentive compensation costs partially offset by higher employee benefits and occupancy costs. Liability-classified share-based compensation is attributable to our performance-based restricted stock units, or PBRSUs, and represents mark-to-market charges associated with the increase in fair value of the 2012 through 2014 PBRSU grants. The increase in the fair value of the PBRSUs is attributable to our common stock performance relative to a defined peer group. Equity-classified share-based compensation charges attributable to stock options and restricted stock units, which represent non-cash expenses, decreased during 2014 compared to 2013 due primarily to fewer employees receiving grants and the elimination of retirement age-eligible, or grant-date vesting provisions. In 2014, we incurred certain costs not eligible for capitalization, including post-implementation support and training with respect to our recently completed ERP system replacement. Similar charges incurred during 2013 include preliminary project analysis and other non-capitalizable costs. In 2013, we incurred transaction costs associated with the EF Acquisition, including advisory, legal, due diligence and other professional fees. In 2014, we incurred costs including legal and litigation support fees attributable to our arbitration with MHR.
2013 vs. 2012. General and administrative expenses increased in 2013 compared to 2012 due primarily to higher compensation, benefits and cash-based incentive charges resulting from higher employee headcount as our operations and support organization expanded commensurate with our focus in the Eagle Ford. The mark-to-market charges attributable to our PBRSUs were higher in 2013 compared to 2012 due to a combination of our common stock performance as well as the fact that 2013 included grants for two years while 2012 included only one. Equity-classified share-based compensation was lower during 2013 compared to 2012 due to a narrowing of the employee distribution base for such awards. As referenced above, we incurred certain costs in 2013 attributable to the EF Acquisition as well as those related to the implementation of a new ERP system. In 2012 we incurred restructuring charges including employee termination benefits and a provision for lease costs attributable to exit activities in connection with the sale of our Appalachian assets.
Exploration
The following table sets forth the components of exploration expenses for the periods presented:
Year Ended December 31, | 2014 vs. | 2013 vs. | |||||||||||||||||
2014 | 2013 | 2012 | 2013 | 2012 | |||||||||||||||
Favorable (unfavorable) | |||||||||||||||||||
Unproved leasehold amortization | $ | 10,346 | $ | 17,451 | $ | 32,634 | $ | 7,105 | $ | 15,183 | |||||||||
Geological and geophysical costs | 5,106 | 2,882 | 816 | (2,224 | ) | (2,066 | ) | ||||||||||||
Drilling rig termination charges | 751 | — | — | (751 | ) | — | |||||||||||||
Other, primarily delay rentals | 860 | 661 | 642 | (199 | ) | (19 | ) | ||||||||||||
$ | 17,063 | $ | 20,994 | $ | 34,092 | $ | 3,931 | $ | 13,098 | ||||||||||
2014 vs. 2013. Unproved leasehold amortization decreased during 2014 compared to 2013 due primarily to the classification of our unproved property in the Eagle Ford as a “significant leasehold” effective July 1, 2013. Accordingly, our
36
unproved acreage in this region is no longer subject to systematic amortization. Geological and geophysical costs increased due to higher seismic data acquisition costs attributable primarily to our development program in the South Texas region. We incurred a charge during the fourth quarter of 2014 in connection with the early termination of a drilling rig contract that was to expire later in 2015 under the terms of the original agreement. Delay rentals increased due primarily to a larger inventory of undeveloped acreage in the South Texas region.
2013 vs. 2012. Unproved leasehold amortization declined during 2013 compared to 2012 as costs related to successful Eagle Ford wells were transferred to proved properties as well as aforementioned classification of our unproved Eagle Ford property as a “significant leasehold” in 2013. Geological and geophysical costs increased during 2013 due primarily to the purchase of seismic data for the South Texas region.
Depreciation, Depletion and Amortization (DD&A)
The following table sets forth the nature of the DD&A variances for the periods presented:
Year Ended December 31, | 2014 vs. | 2013 vs. | |||||||||||||||||
2014 | 2013 | 2012 | 2013 | 2012 | |||||||||||||||
Favorable (unfavorable) | |||||||||||||||||||
DD&A expense | $ | 300,299 | $ | 245,594 | $ | 206,336 | $ | (54,705 | ) | $ | (39,258 | ) | |||||||
DD&A rate ($/BOE) | $ | 37.85 | $ | 35.99 | $ | 31.68 | $ | (1.86 | ) | $ | (4.31 | ) | |||||||
DD&A Variance due to: | |||||||||||||||||||
Production | Rates | Total | |||||||||||||||||
2014 to 2013 DD&A variance due to: | $ | (39,955 | ) | $ | (14,750 | ) | $ | (54,705 | ) | ||||||||||
2013 to 2012 DD&A variance due to: | $ | (9,789 | ) | $ | (29,469 | ) | $ | (39,258 | ) | ||||||||||
2014 vs. 2013. Higher overall production volumes as well as higher depletion rates associated with oil and NGL production in 2014 compared to 2013 were the primary factors affecting the increase in DD&A expense. Our average DD&A rate increased due to the higher-cost oil drilling program in the Eagle Ford coupled with downward revisions of proved undeveloped reserves in East Texas.
2013 vs. 2012. Higher production volume and depletion rates attributable to the focus on oil and NGL production in the Eagle Ford resulted in higher DD&A expense in 2013 compared to 2012. In addition, the DD&A rate was impacted by lower proved undeveloped reserves due to revisions, primarily in East Texas and the Mid-Continent regions.
Impairments
In 2014, we recognized oil and gas asset impairments of: (i) $667.8 million in the East Texas, Granite Wash and Marcellus regions due to the substantial decline in current and expected future commodity prices in the fourth quarter of 2014, (ii) $6.1 million in connection with an uneconomic field drilled in the Mid-Continent region and (iii) $117.9 million with respect to our Selma Chalk assets in Mississippi triggered by the disposition of those properties. In 2013, we recognized oil and gas asset impairments of: (i) $121.8 million in the Granite Wash, (ii) $9.5 million in the Marcellus Shale and (iii) $0.9 million in the Selma Chalk, in each case due primarily to market declines in current and expected future natural gas prices. In June 2012, we recognized a $28.4 million impairment of our Appalachian assets triggered by the disposition of those properties and a $75.0 million impairment of our Marcellus Shale assets due primarily to market declines in natural gas prices and the resultant reduction in proved natural gas reserves. We also recognized impairments of $1.1 million attributable to tubular inventory and well materials in 2012.
Loss on Firm Transportation Commitment
We have a contractual commitment for certain firm transportation capacity in the Appalachian region that expires in 2022. As a result of the sale of our natural gas assets in that region in 2012, we no longer have production to satisfy this commitment. Accordingly, we recorded a charge of $17.3 million in 2012 representing the liability for estimated discounted future net cash outflows over the remaining term of the contract.
37
Interest Expense
The following table summarizes the components of our interest expense for the periods presented:
Year Ended December 31, | 2014 vs. | 2013 vs. | |||||||||||||||||
2014 | 2013 | 2012 | 2013 | 2012 | |||||||||||||||
Favorable (unfavorable) | |||||||||||||||||||
Interest on borrowings and related fees | $ | 91,866 | $ | 80,263 | $ | 56,080 | $ | (11,603 | ) | $ | (24,183 | ) | |||||||
Amortization of debt issuance costs | 4,197 | 3,413 | 2,695 | (784 | ) | (718 | ) | ||||||||||||
Accretion of original issue discount | — | 431 | 1,367 | 431 | 936 | ||||||||||||||
Capitalized interest | (7,232 | ) | (5,266 | ) | (803 | ) | 1,966 | 4,463 | |||||||||||
$ | 88,831 | $ | 78,841 | $ | 59,339 | $ | (9,990 | ) | $ | (19,502 | ) | ||||||||
Weighted-average debt outstanding | $ | 1,205,077 | $ | 1,022,337 | $ | 697,786 | $ | (182,740 | ) | $ | (324,551 | ) | |||||||
Weighted average interest rate | 7.97 | % | 8.23 | % | 8.62 | % | |||||||||||||
2014 vs. 2013. Interest expense increased during 2014 compared to 2013 due primarily to higher weighted-average debt outstanding following the issuance of the 8.5% Senior Notes due 2020, or the 2020 Senior Notes, in April 2013 and higher average outstanding borrowings under the Revolver. The increase in interest expense was partially offset by higher capitalized interest resulting from the significant increase in the value of our proved undeveloped and unproved properties following the EF Acquisition and the absence of accretion of original issue discount attributable to the 10.375% Senior Notes due 2016, or the 2016 Senior Notes, which were redeemed in May 2013. The weighted-average interest rate declined during 2014 as compared to 2013 due primarily to the replacement of the 2016 Senior Notes with the 2020 Senior Notes as well as lower interest rates on borrowings under the Revolver.
2013 vs. 2012. Interest expense increased during 2013 compared to 2012 due primarily to higher overall weighted-average debt outstanding and a larger proportion of fixed-rate debt with higher interest rates in the 2013 period, compared to a larger proportion of Revolver borrowings at lower variable interest rates in 2012. The increase was partially offset by higher capitalized interest resulting from the significant increase in the value of our proved undeveloped and unproved properties following the EF Acquisition.
Loss on Extinguishment of Debt
In 2013, we redeemed all of the 2016 Senior Notes. We paid a total of $330.9 million, including consent payments and accrued interest, and recognized a loss on the extinguishment of debt of $29.2 million. The loss on extinguishment of debt included non-cash charges of $10.0 million attributable to the write-off of unamortized debt issuance costs and the remaining debt discount associated with the 2016 Senior Notes. In 2012 in connection with our entry into the Revolver, we expensed issuance costs of $3.2 million attributable to our previous credit facility.
Derivatives
The following table summarizes the components of our derivatives income (loss) for the periods presented:
Year Ended December 31, | 2014 vs. | 2013 vs. | |||||||||||||||||
2014 | 2013 | 2012 | 2013 | 2012 | |||||||||||||||
Favorable (unfavorable) | |||||||||||||||||||
Oil and gas derivatives settled | $ | (7,424 | ) | $ | (1,042 | ) | $ | 28,317 | $ | 29,359 | |||||||||
Oil and gas derivative gain (loss) | 169,636 | (19,810 | ) | 6,464 | (189,446 | ) | 26,274 | ||||||||||||
Interest rate swap gain | — | — | 1,406 | — | 1,406 | ||||||||||||||
$ | 162,212 | $ | (20,852 | ) | $ | 36,187 | $ | (189,446 | ) | $ | 57,039 | ||||||||
We paid settlements of $6.2 million for crude oil derivatives and $1.2 million for natural gas derivatives during 2014 and paid settlements of $2.6 million for crude oil derivatives and received settlements of $1.6 million from natural gas derivatives during 2013. We received settlements of $8.4 million from crude oil derivatives and $19.9 million from natural gas derivatives during 2012 as well as $1.4 million attributable to the termination of an interest rate swap agreement. The oil and gas derivative gains and losses loss in the periods presented is due primarily to period-end oil prices differing from hedged prices as well as a substantially lower volume of natural gas production being hedged during 2013 as compared to 2012.
38
Other
The increase in other income during 2014 compared to 2013 is substantially attributable to $1.3 million of interest received in connection with the arbitration settlement with MHR.
Income Taxes
Year Ended December 31, | 2014 vs. | 2013 vs. | |||||||||||||||||
2014 | 2013 | 2012 | 2013 | 2012 | |||||||||||||||
Favorable (unfavorable) | |||||||||||||||||||
Income tax expense (benefit) | $ | 131,678 | $ | 77,696 | $ | 68,702 | $ | (53,982 | ) | $ | (8,994 | ) | |||||||
Effective tax rate | 24.3 | % | 35.2 | % | 39.6 | % | |||||||||||||
Due to the pre-tax operating loss incurred in 2014, we recognized an income tax benefit. Our income tax benefit was reduced by a combined federal and state $62.8 million valuation allowance against our net deferred tax assets. The federal portion of the valuation allowance was $61.1 million which reduced the carrying value of our federal net deferred tax assets to zero.
The significant difference between our blended federal and state statutory income tax rate of 35.7% and our effective income tax rate of 24.3% in 2014 was almost entirely attributable to the incremental valuation allowance placed against our deferred tax assets. Absent this valuation allowance, our effective income tax rate would have been 35.6%.
Due to the pre-tax operating losses incurred in 2012 and 2013, we recognized an income tax benefit during both periods. The effective tax rate for both of these years included a deferred tax asset valuation allowance for state net operating losses.
39
Financial Condition
Liquidity
Our primary sources of liquidity include cash on hand, cash from operating activities, borrowings under the Revolver, proceeds from the sales of assets and, when appropriate, proceeds from capital market transactions including the sale of debt and equity securities. Our cash flows from operating activities are subject to significant volatility due to changes in commodity prices for our crude oil, NGL and natural gas products, as well as variations in our production. The prices for these commodities are driven by a number of factors beyond our control, including global and regional product supply and demand, weather, product distribution, refining and processing capacity and other supply chain dynamics, among other factors.
Our business plan contemplates capital expenditures in excess of our projected cash from operating activities for 2015. Subject to the variability of commodity prices and production that impacts our cash from operating activities, anticipated timing of our capital projects and unanticipated expenditures such as acquisitions, we plan to fund our 2015 capital program with cash from operating activities and borrowings under the Revolver. We have no debt maturities until September 2017 when the Revolver matures. We believe that our cash from operating activities and borrowing capacity under the Revolver will be sufficient to meet our debt service, preferred stock dividends and working capital requirements, as well as our anticipated capital expenditures.
Capital Resources
In 2015, we anticipate making capital expenditures, excluding acquisitions, of up to approximately $345 million. We expect to allocate substantially all of our capital expenditures to the Eagle Ford. This includes approximately 90 percent for drilling and completions, six percent for leasehold acquisition and four percent for facilities and other projects. The 2015 capital expenditures budget assumes a drilling program utilizing three to four operated drilling rigs in the Eagle Ford. We continually review drilling and other capital expenditure plans and may change the amount we spend, or the allocations, based on available opportunities, industry conditions, cash from operating activities and the overall availability of capital. For a detailed analysis of our historical capital expenditures, see the Cash Flows discussion that follows.
Cash From Operating Activities. In addition to commodity price volatility, as discussed in detail below, our cash from operating activities is impacted by the timing of our working capital requirements. The most significant component thereof is attributable to the timing of payments made for drilling and completion capital expenditures and the related billing and collection of amounts from our partners. This can be substantial to the extent that we are the operator of lower working interest wells. In certain circumstances, we have and will continue to utilize capital cash calls to mitigate our related working capital burden.
We actively manage the exposure of our revenues to commodity price fluctuations by hedging the commodity price risk for a portion of our expected production, typically through the use of collar, swap and swaption contracts. The level of our hedging activity and duration of the instruments employed depend on our cash flow at risk, available hedge prices, the magnitude of our capital program and our operating strategy. During 2014, our commodity derivatives portfolio resulted in $6.2 million of net cash payments related to higher than anticipated prices received for our crude oil production and $1.2 million of net cash payments attributable to higher than anticipated prices received for our natural gas production. In the second half of 2014, commodity prices decreased significantly. If commodity prices remain at current levels, we anticipate that our derivative portfolio will result in receipts from settlements for 2015.
We have hedged approximately 13,000 BOPD of our estimated crude oil production at a weighted-average price of $90.48 per Bbl for the first half of 2015 and 11,000 BOPD of our estimated crude oil production at a weighted-average price of $89.86 per Bbl for the second half of 2015. For 2016, we have hedged approximately 4,000 barrels of daily crude oil production at weighted-average floor/swap prices of $88.12 per barrel. We have also hedged 5,000 million MMBtu of daily natural gas production, or approximately 14 percent of our estimated natural gas production for the first quarter of 2015 at a weighted-average floor/swap price of $4.50 per MMBtu.
Revolver Borrowings. The Revolver provides for a $450 million revolving commitment. The Revolver has an accordion feature that allows us to increase the commitment by up to an additional $150 million upon receiving additional commitments from one or more lenders. The Revolver also includes a $20 million sublimit for the issuance of letters of credit. The Revolver is governed by a borrowing base calculation, which is re-determined semi-annually, and the availability under the Revolver may not exceed the lesser of the aggregate commitments and the borrowing base. In October 2014, the borrowing base was increased to $500 million in connection with the regular semi-annual redetermination. The next semi-annual redetermination is scheduled for May 2015. Based on current commodity price levels and our reduced capital expenditure plans, we anticipate the borrowing base to decline with the next re-determination. Furthermore, our current business plans for 2015 are projected to have us approaching the limits of our allowable leverage beginning in the second half of 2015, based on the existing covenants under the Revolver. Accordingly, we plan to assess our financing and liquidity requirements as we progress into 2015. To the extent that we may be challenged with respect to our allowable leverage, we will review our available alternatives and remedies which include, but are not limited to: (i) seeking an amendment to the leverage covenant, (ii) adjusting the pace or magnitude of our capital program or (iii) assessing the potential for a capital markets transaction.
40
The Revolver is available to us for general purposes, including working capital, capital expenditures and acquisitions. The Revolver matures in September 2017. We had letters of credit of $1.8 million outstanding as of December 31, 2014. As of December 31, 2014, our available borrowing capacity under the Revolver was $413.2 million.
For additional information regarding the terms and covenants associated with our Revolver, see the Capitalization discussion that follows. The following table summarizes our borrowing activity under the Revolver during the periods presented:
Borrowings Outstanding | ||||||||||
Weighted- Average | Maximum | Weighted- Average Rate | ||||||||
Three months ended December 31, 2014 | $ | 10,663 | $ | 35,000 | 1.7970 | % | ||||
Year ended December 31, 2014 | $ | 130,438 | $ | 407,000 | 2.2179 | % | ||||
Proceeds from Sales of Assets. We continually evaluate potential sales of non-core assets, including certain oil and gas properties and non-strategic undeveloped acreage, among others. For a discussion of our historical proceeds from asset sales and other dispositions, see the Cash Flows discussion that follows.
Capital Market Transactions. From time-to-time and under market conditions that we believe are favorable to us, we consider capital market transactions, including the offering of debt and equity securities. Historically, we have entered into such transactions to facilitate acquisitions and to pursue opportunities to adjust our total capitalization. For a discussion of our historical proceeds from capital markets transactions, including the Series B Preferred Stock and the 2020 Senior Notes, see the Cash Flows discussion that follows.
Cash Flows
The following table summarizes our cash flows for the periods presented:
Year Ended December 31, | |||||||||||
2014 | 2013 | Variance | |||||||||
Cash flows from operating activities | |||||||||||
Operating cash flows, net | $ | 372,611 | $ | 314,424 | $ | 58,187 | |||||
Working capital changes (excluding interest and income taxes), net | 9,033 | 19,120 | (10,087 | ) | |||||||
Commodity derivative settlements (paid) received, net: | — | ||||||||||
Crude oil | (6,170 | ) | (2,624 | ) | (3,546 | ) | |||||
Natural gas | (1,254 | ) | 1,582 | (2,836 | ) | ||||||
Interest payments, net of amounts capitalized | (84,797 | ) | (65,107 | ) | (19,690 | ) | |||||
Income taxes paid | (3,612 | ) | — | (3,612 | ) | ||||||
EF Acquisition arbitration, transaction, integration and other costs paid | (589 | ) | (3,029 | ) | 2,440 | ||||||
Restructuring and exit costs paid | (2,498 | ) | (2,854 | ) | 356 | ||||||
Net cash provided by operating activities | 282,724 | 261,512 | 21,212 | ||||||||
Cash flows from investing activities | |||||||||||
EF Acquisition and working capital-related settlements, net | 33,712 | (380,694 | ) | 414,406 | |||||||
Capital expenditures – property and equipment | (774,139 | ) | (504,203 | ) | (269,936 | ) | |||||
Proceeds from sales of assets, net | 313,933 | (54 | ) | 313,987 | |||||||
Net cash used in investing activities | (426,494 | ) | (884,951 | ) | 458,457 | ||||||
Cash flows from financing activities | |||||||||||
Proceeds from the issuance of preferred stock, net | 313,330 | — | 313,330 | ||||||||
Payments made to induce conversion of preferred stock | (4,256 | ) | — | (4,256 | ) | ||||||
Proceeds from the issuance of senior notes | — | 775,000 | (775,000 | ) | |||||||
Retirement of senior notes | — | (319,090 | ) | 319,090 | |||||||
Proceeds (repayments) from revolving credit facility borrowings, net | (171,000 | ) | 206,000 | (377,000 | ) | ||||||
Debt issuance costs paid | (151 | ) | (25,634 | ) | 25,483 | ||||||
Dividends paid on preferred stock | (12,803 | ) | (6,862 | ) | (5,941 | ) | |||||
Other, net | 1,428 | (151 | ) | 1,579 | |||||||
Net cash provided by financing activities | 126,548 | 629,263 | (502,715 | ) | |||||||
Net increase in cash and cash equivalents | $ | (17,222 | ) | $ | 5,824 | $ | (23,046 | ) | |||
41
Cash Flows From Operating Activities. Increased crude oil and NGL production resulted in higher operating cash flows during 2014 compared to 2013; however, this increase was offset to some extent by the higher working capital requirements of our expanded drilling program. Specifically, during 2014, we began drilling several wells with lower working interests resulting in significantly larger payments for drilling and completion costs and larger corresponding receivables from our joint interest partners when compared to the prior year period. In addition, our commodity derivatives portfolio generated higher net payments during 2014 as compared to 2013 due primarily to realized crude oil and natural gas prices exceeding hedged prices. Due primarily to the issuance of the 2020 Senior Notes in 2013 and higher average outstanding borrowings under the Revolver, we had significantly higher interest payments during the 2014 period.
Cash Flows From Investing Activities. Capital expenditures were substantially higher during 2014 compared to 2013 due primarily to a higher level of drilling activity and lease acquisitions in the Eagle Ford. Our capital expenditures during 2014 period were partially offset by the receipt of net proceeds from the sale of assets, including approximately $147 million from the sale of rights to construct an oil gathering and intermediate transportation system in South Texas in July 2014, approximately $68 million from the sale of our Selma Chalk assets in Mississippi in July 2014 and approximately $96 million from the sale of our natural gas gathering and gas lift assets in South Texas in January 2014. A portion of those proceeds was used to pay down outstanding borrowings under the Revolver. We also received approximately $35 million in August 2014 with respect to the resolution of arbitration matters in connection with the EF Acquisition. Approximately $34 million, net of interest income on the settlement, was classified as an investing activity. Net proceeds from asset sales during the 2013 period were attributable primarily to the sale of surplus tubular inventory and well materials as well as certain of our Appalachian natural gas assets. Receipt of these proceeds in 2013 were more than offset by the payment of certain post-closing adjustments attributable to asset sales completed in prior years.
The following table sets forth costs related to our capital expenditure program for the periods presented:
Year Ended December 31, | |||||||
2014 | 2013 | ||||||
Oil and gas: | |||||||
Drilling and completion | $ | 667,385 | $ | 418,246 | |||
Lease acquisitions and other land-related costs 1 | 98,443 | 69,155 | |||||
Geological and geophysical (seismic) costs | 5,106 | 2,882 | |||||
Pipeline, gathering facilities and other equipment | 21,538 | 17,583 | |||||
792,472 | 507,866 | ||||||
Other – Corporate 2 | 1,463 | 2,370 | |||||
Total capital program costs | $ | 793,935 | $ | 510,236 | |||
_________________
1 Includes site-preparation and other pre-drilling costs.
2 Includes $0.8 million in 2014 and $2 million in 2013 for an integrated enterprise-wide information technology platform.
The following table reconciles the total costs of our capital expenditure program with the net cash paid for capital expenditures for additions to property and equipment as reported in our Consolidated Statements of Cash Flows for the periods presented:
Year Ended December 31, | |||||||
2014 | 2013 | ||||||
Total capital program costs | $ | 793,935 | $ | 510,236 | |||
Increase in accrued capitalized costs | (24,715 | ) | (6,356 | ) | |||
Less: | |||||||
Exploration expenses charged to operations: | |||||||
Geological and geophysical (seismic) | (5,106 | ) | (2,882 | ) | |||
Other, primarily delay rentals | (860 | ) | (661 | ) | |||
Transfers from tubular inventory and well materials | (403 | ) | (2,471 | ) | |||
Add: | |||||||
Tubular inventory and well materials purchased in advance of drilling | 4,056 | 1,071 | |||||
Capitalized interest | 7,232 | 5,266 | |||||
Total cash paid for capital expenditures | $ | 774,139 | $ | 504,203 | |||
42
We received proceeds, net of related costs, and other settlements from asset sales and the the disposition of certain non-core properties during both 2014 and 2013 as follows:
Year Ended December 31, | |||||||
2014 | 2013 | ||||||
Rights to construct an oil gathering system in South Texas, net | $ | 147,149 | $ | — | |||
South Texas natural gas gathering and gas lift system, net | 95,964 | — | |||||
Oil and gas properties, net | 70,818 | 85 | |||||
Tubular inventory and well materials, net | 2 | 399 | |||||
Proceeds from the sales of assets, net | 313,933 | 484 | |||||
Payments of post-closing adjustments attributable to sales of assets | — | (538 | ) | ||||
$ | 313,933 | $ | (54 | ) | |||
Cash Flows From Financing Activities. In June 2014, we issued the Series B Preferred Stock for net proceeds of approximately $313 million. Cash flows from financing activities for 2014 also included net repayments under the Revolver, funded primarily with proceeds from the issuance of Series B Preferred Stock and asset sales, while 2013 included net borrowings under the Revolver, which were used to finance a portion of our capital program. In June and July of 2014, we paid a total of $4.3 million to induce the conversion of approximately 30 percent of the outstanding shares of the Series A Preferred Stock. Both 2014 and 2013 included dividends paid on the Series A Preferred Stock while 2014 also included the initial payment of dividends on the Series B Preferred Stock. In April 2013, we issued the 2020 Senior Notes, the proceeds of which were used to fund the EF Acquisition and a portion of the tender offer and the redemption of the 2016 Senior Notes. We incurred and paid costs in the 2014 and 2013 periods associated with amendments to the Revolver in advance of the Series B Preferred Stock and the 2020 Senior Notes offering transactions as well as costs paid in the 2013 period associated with the issuance of the 2020 Senior Notes. We also received proceeds of $1.4 million during 2014 from the exercise of stock options.
Capitalization
The following table summarizes our total capitalization as of the dates presented:
As of December 31, | |||||||
2014 | 2013 | ||||||
Revolving credit facility | $ | 35,000 | $ | 206,000 | |||
Senior notes due 2019 | 300,000 | 300,000 | |||||
Senior notes due 2020 | 775,000 | 775,000 | |||||
Total debt | 1,110,000 | 1,281,000 | |||||
Shareholders’ equity 1 | 675,817 | 788,804 | |||||
$ | 1,785,817 | $ | 2,069,804 | ||||
Debt as a % of total capitalization | 62 | % | 62 | % | |||
_________________
1 Includes 7,945 and 11,500 shares of the Series A Preferred Stock as of December 31, 2014 and 2013, respectively, and 32,500 shares of the Series B Preferred Stock as of December 31, 2014. Both series of preferred stock have a liquidation preference of $10,000 per share representing a total of $404 million and $115 million as of December 31, 2014 and 2013, respectively.
Revolving Credit Facility. Borrowings under the Revolver bear interest, at our option, at either (i) a rate derived from LIBOR, as adjusted for statutory reserve requirements for Eurocurrency liabilities, or Adjusted LIBOR, plus an applicable margin (ranging from 1.500% to 2.500%) or (ii) the greater of (a) the prime rate, (b) the federal funds effective rate plus 0.5% or (c) the one-month Adjusted LIBOR plus 1.0%, plus, in each case, an applicable margin (ranging from 0.500% to 1.500%). In each case, the applicable margin is determined based on the ratio of our outstanding borrowings to the available Revolver capacity. As of December 31, 2014, the actual interest rate applicable to the Revolver was 1.6875% which is derived from an Adjusted LIBOR rate of 0.1875% plus an applicable margin of 1.50%. Commitment fees are charged at 0.375% to 0.500% on the undrawn portion of the Revolver depending on our ratio of outstanding borrowings to the available Revolver capacity. As of December 31, 2014, commitment fees were being charged at a rate of 0.375%.
The Revolver is guaranteed by Penn Virginia and all of our material subsidiaries, or the Guarantor Subsidiaries. The obligations under the Revolver are secured by a first priority lien on substantially all of our proved oil and gas reserves and a pledge of the equity interests in the Guarantor Subsidiaries.
2019 Senior Notes. The 7.25% Senior Notes due 2019, or the 2019 Senior Notes, which were issued at par in April 2011, bear interest at an annual rate of 7.25% and are payable on April 15 and October 15 of each year. The 2019 Senior Notes are
43
senior to our existing and future subordinated indebtedness and are subordinated to all of our secured indebtedness, including the Revolver, to the extent of the collateral securing that indebtedness. The 2019 Senior Notes are fully and unconditionally guaranteed by the Guarantor Subsidiaries.
2020 Senior Notes. The 2020 Senior Notes, which were issued at par in April 2013, bear interest at an annual rate of 8.5% and are payable on May 1 and November 1 of each year. The 2020 Senior Notes are senior to our existing and future subordinated indebtedness and are subordinated to all of our secured indebtedness, including the Revolver, to the extent of the collateral securing that indebtedness. The 2020 Senior Notes are fully and unconditionally guaranteed by the Guarantor Subsidiaries.
Series A Preferred Stock. The annual dividend on each share of the Series A Preferred Stock is 6.00% per annum on the liquidation preference of $10,000 per share and is payable quarterly, in arrears, on each of January 15, April 15, July 15 and October 15 of each year. We may, at our option, pay dividends in cash, common stock or a combination thereof.
Each share of the Series A Preferred Stock is convertible, at the option of the holder, into a number of shares of our common stock equal to the liquidation preference of $10,000 divided by the conversion price, which is initially $6.00 per share and is subject to specified anti-dilution adjustments. The initial conversion rate is equal to 1,666.67 shares of our common stock for each share of the Series A Preferred Stock. The initial conversion price represents a premium of 20 percent relative to the October 2012 common stock offering price of $5.00 per share. The Series A Preferred Stock is not redeemable for cash by us or the holders at any time. At any time on or after October 15, 2017, we may, at our option, cause all outstanding shares of the Series A Preferred Stock to be automatically converted into shares of our common stock at the then-applicable conversion price if the closing sale price of our common stock exceeds 130% of the then-applicable conversion price for a specified period prior to conversion. If a holder elects to convert shares of the Series A Preferred Stock upon the occurrence of certain specified fundamental changes, we may be obligated to deliver an additional number of shares above the applicable conversion rate to compensate the holder for lost option value. During 2014, a total of 3,555 shares, or 355,482 depositary shares, of the Series A Preferred Stock were converted into 5.9 million shares of common stock.
Series B Preferred Stock. The annual dividend on each share of the Series B Preferred Stock is 6.00% per annum on the liquidation preference of $10,000 per share and is payable quarterly, in arrears, on each of January 15, April 15, July 15 and October 15 of each year. We may, at our option, pay dividends in cash, common stock or a combination thereof.
Each share of the Series B Preferred Stock is convertible, at the option of the holder, into a number of shares of our common stock equal to the liquidation preference of $10,000 divided by the conversion price, which is initially $18.34 per share and is subject to specified anti-dilution adjustments. The initial conversion rate is equal to 545.17 shares of our common stock for each share of the Series B Preferred Stock. The initial conversion price represents a premium of 30 percent relative to the last reported sales price of $14.11 per common share prior to the offering of the Series B Preferred Stock. The Series B Preferred Stock is not redeemable for cash by us or the holders at any time. At any time on or after July 15, 2019, we may, at our option, cause all outstanding shares of the Series B Preferred Stock to be automatically converted into shares of our common stock at the then-applicable conversion price if the closing sale price of our common stock exceeds 130% of the then-applicable conversion price for a specified period prior to conversion. If a holder elects to convert shares of the Series B Preferred Stock upon the occurrence of certain specified fundamental changes, we may be obligated to deliver an additional number of shares above the applicable conversion rate to compensate the holder for lost option value.
Covenant Compliance. The Revolver and the indentures governing our senior notes require us to maintain certain financial and non-financial covenants. These covenants impose limitations on our ability to pay dividends as well as our ability to incur indebtedness, grant liens, make certain loans, acquisitions and investments, make any material change to the nature of our business, or enter into a merger or sale of our assets, including the sale or transfer of interests in our subsidiaries, among other requirements. As of December 31, 2014 and through the date upon which our Consolidated Financial Statements were issued, we were in compliance with these covenants.
In the event that we would be in default of a covenant under the Revolver, we could request a waiver of the covenant from our bank group. Should the banks deny our request to waive the covenant requirement, any outstanding borrowings under the Revolver would become payable on demand and would be reclassified as a component of current liabilities on our Consolidated Balance Sheets.
The Revolver requires us to maintain certain financial covenants as follows:
• | Total debt to EBITDAX, each as defined in the Revolver, for any four consecutive quarters may not exceed 4.25 to 1.0 for periods through December 31, 2014 and 4.0 to 1.0 for periods through maturity in 2017. EBITDAX, which is a non-GAAP measure, generally means net income plus interest expense, taxes, depreciation, depletion and amortization expenses, exploration expenses, impairments and other non-cash charges or losses. |
• | The current ratio, as of the last day of any quarter, may not be less than 1.0 to 1.0. The current ratio is generally defined as current assets to current liabilities. Current assets and current liabilities attributable to derivative instruments are excluded. In addition, current assets include the amount of any unused commitment under the Revolver. |
44
The indentures governing our senior notes include an incurrence test which is determined by an interest coverage ratio, as defined in the indentures. The interest coverage ratio may not be less than 2.25 times consolidated EBITDAX, a non-GAAP measure.
As of December 31, 2014 and through the date upon which the Consolidated Financial Statements were issued, we were in compliance with these financial covenants.
The following table summarizes the actual results of our financial covenant compliance under the Revolver and senior note indentures as of and for the period ended December 31, 2014:
Required | Actual | |||
Description of Covenant | Covenant | Results | ||
Total debt to EBITDAX | < 4.25 to 1 | 3.0 to 1 | ||
Current ratio | > 1.00 to 1 | 2.0 to 1 | ||
Interest coverage | > 2.25 to 1 | 3.4 to 1 | ||
Off-Balance Sheet Arrangements
We may enter into off-balance sheet arrangements and transactions that can give rise to material off-balance sheet obligations. As of December 31, 2014, the material off-balance sheet arrangements and transactions that we have entered into included operating lease arrangements, well drilling commitments, well completion service commitments, firm transportation agreements and letters of credit, all of which are customary in our business. See Contractual Obligations summarized below for more details related to the value of our off-balance sheet arrangements. We did not have any relationships with unconsolidated entities or financial partnerships, such as structured finance or special purpose entities, which would have been established for the purpose of facilitating off-balance sheet arrangements or other contractually narrow or limited purposes. We are, therefore, not materially exposed to any financing, liquidity, market or credit risk that could arise if we had engaged in such relationships.
Contractual Obligations
The following table summarizes our contractual obligations as of December 31, 2014:
Payments Due by Period | |||||||||||||||||||
Total | Less than 1 Year | 1-3 Years | 3-5 Years | More Than 5 Years | |||||||||||||||
Revolver 1 | $ | 35,000 | $ | — | $ | 35,000 | $ | — | $ | — | |||||||||
Senior Notes due 2019 and 2020 2 | 1,075,000 | — | — | 300,000 | 775,000 | ||||||||||||||
Interest payments on long-term debt 3 | 461,813 | 88,216 | 176,285 | 164,375 | 32,937 | ||||||||||||||
Operating leases 4 | 6,482 | 1,967 | 3,166 | 1,349 | — | ||||||||||||||
Well drilling and completion commitments | 33,660 | 33,660 | — | — | — | ||||||||||||||
Firm transportation commitments 5 | 37,412 | 4,789 | 7,762 | 7,762 | 17,099 | ||||||||||||||
Asset retirement obligations 6 | 76,969 | — | — | — | 76,969 | ||||||||||||||
Other commitments 7 | 139,124 | 10,337 | 32,899 | 27,376 | 68,512 | ||||||||||||||
Total contractual obligations | $ | 1,865,460 | $ | 138,969 | $ | 255,112 | $ | 500,862 | $ | 970,517 | |||||||||
_______________________________________
1 Assumes that the amount outstanding of $35 million as of December 31, 2014 will remain outstanding until its maturity in 2017.
2 Upon their maturities in April 2019 and May 2020, the principal amounts of $300 million and $775 million each will be due.
3 Represents estimated interest payments that will be due under the Revolver, assuming the amount outstanding of $35 million as of December 31, 2014 will remain until its maturity in 2017, as well as contractual interest payments on the 2019 Senior Notes and the 2020 Senior Notes.
4 Relates primarily to office and equipment leases.
5 Includes $21.4 million of undiscounted payments attributable to a firm transportation obligation for which $14.9 million has been recognized on our Consolidated Balance Sheet as of December 31, 2014.
6 Represents the undiscounted balance payable in periods more than five years in the future for which $5.9 million has been recognized on our Consolidated Balance Sheet as of December 31, 2014. While we anticipate making payments to settle asset retirement obligations during each of the next five years, none are currently required by contract to be made during this time frame.
7 Represents all other significant obligations including minimum commitments under a natural gas gathering and compression service agreement, a crude oil gathering and intermediate transportation agreement and information technology licensing and service agreements, among others.
45
Critical Accounting Estimates
The process of preparing financial statements in accordance with GAAP requires our management to make estimates and judgments regarding certain items and transactions. It is possible that materially different amounts could be recorded if these estimates and judgments change or if the actual results differ from these estimates and judgments. We consider the following to be the most critical accounting estimates requiring judgment of our management.
Oil and Gas Reserves
Estimates of our oil and gas reserves are the most critical estimate included in our Consolidated Financial Statements. Reserve estimates become the basis for determining depletive write-off rates, recoverability of historical cost investments and the fair value of properties acquired as well as those subject to potential impairments. There are many uncertainties inherent in estimating crude oil, NGL and natural gas reserve quantities, including projecting the total quantities in place, future production rates and the amount and timing of future development expenditures. In addition, reserve estimates of new discoveries are less precise than those of producing properties due to the lack of a production history. Accordingly, these estimates are subject to change as additional information becomes available.
There are several factors which could change the estimates of our oil and gas reserves. Significant rises or declines in commodity product prices as well as changes in our drilling plans could lead to changes in the amount of reserves as production activities become more or less economical. An additional factor that could result in a change of recorded reserves is the reservoir decline rates differing from those assumed when the reserves were initially recorded. Estimation of future production and development costs is also subject to change partially due to factors beyond our control, such as energy costs and inflation or deflation of oil field service costs.
Oil and Gas Properties
We use the successful efforts method to account for our oil and gas properties. Under this method, costs of acquiring properties, costs of drilling successful exploration wells and development costs are capitalized. Geological and geophysical costs, delay rentals and costs to drill exploratory wells that do not find proved reserves are expensed as oil and gas exploration. We will carry the costs of an exploratory well as an asset if the well has found a sufficient quantity of reserves to justify its completion as a producing well and as long as we are making sufficient progress assessing the reserves and the economic and operating viability of the project. For certain projects, it may take us more than one year to evaluate the future potential of the exploratory well and make a determination of its economic viability. Our ability to move forward on a project may be dependent on gaining access to transportation or processing facilities or obtaining permits and government or partner approval, the timing of which is beyond our control. In such cases, exploratory well costs remain suspended as long as we are actively pursuing access to the necessary facilities or receiving to such permits and approvals and believe that they will be obtained. We assess the status of suspended exploratory well costs on a quarterly basis.
We assess our proved oil and gas properties for impairment on a geographic basis, generally at the field level, based upon a periodic review of commodity prices and, when available, updated oil and gas reserve data. Generally, we compile updated oil and gas reserve data once during the calendar year and again at year-end on a more formal basis. The assessment is performed by comparing the carrying value of proved properties for each field to the undiscounted estimated future cash flows. Undiscounted estimated future cash flows are based on updated oil and gas reserve data, when available, and include the impact of risk-adjusted probable and possible reserves, future commodity prices, anticipated production and forecasted operating and capital expenditures. Commodity prices are estimated based on five-year NYMEX strip prices, adjusted accordingly for basis differentials and other factors consistent with management’s assumptions utilized for internal planning and budgeting purposes. If, based on the assessment, the carrying value of the proved properties exceeds the undiscounted estimated future cash flows, the cost of the proved properties are written down to fair value. In certain circumstances, significant management judgment is applied to consideration of the results of such assessment described above. Accordingly, it is possible that impairment would not be appropriate for certain properties that failed the objective assessment based on consideration of other factors, including the timeliness of reserve assignment, among others. Likewise, impairment may be appropriate for other properties that otherwise passed the objective assessment based on the trending of prices, lease expirations and future development plans.
A portion of the carrying value of our oil and gas properties is attributable to unproved properties. As of December 31, 2014, the costs attributable to unproved properties, net of accumulated amortization, were $125.7 million. Unproved properties whose acquisition costs are insignificant are amortized as a component of exploration expense in the aggregate over the lesser of five years or the average remaining lease term. We assess unproved properties whose acquisition costs are relatively significant, if any, for impairment on a stand-alone basis. As exploration and development work progresses and the reserves on properties are proven, capitalized costs of these properties are subject to depreciation and depletion. If exploration activities are unsuccessful, the capitalized costs of the properties related to the unsuccessful work is charged to exploration expense. The timing of any write-downs of any significant unproved properties depends upon the nature, timing and extent of future exploration and development activities and their results.
Prior to 2013, we have not had any unproved properties that were deemed significant as described above. Subsequent to the EF Acquisition our unproved properties in the Eagle Ford are now considered significant and became subject to impairment
46
on a stand-alone basis effective July 1, 2013. Furthermore, we anticipate transferring material amounts representing the cost of unproved leaseholds to proved properties in future periods as our activities in the Eagle Ford continue to be successful. Accordingly, we anticipate that our future charges for unproved leasehold amortization will decline from historical levels.
Depreciation, Depletion and Amortization
We determine depreciation and depletion of oil and gas producing properties by the units-of-production method and these amounts could change with revisions to estimated proved recoverable reserves. We compute depreciation and amortization of other property and equipment using the straight-line balance method over the estimated useful life of each asset.
Derivative Activities
From time to time, we enter into derivative instruments to mitigate our exposure to crude oil and natural gas price volatility and interest rate fluctuations. The derivative financial instruments, which are placed with financial institutions that we believe are of acceptable credit risk, take the form of collars, swaps and swaptions, among others. All derivative instruments are recognized in our Consolidated Financial Statements at fair value with the changes recorded currently in earnings. The fair values of our derivative instruments are determined based on discounted cash flows derived from quoted forward prices and rates. All derivative transactions are subject to our risk management policy, which has been reviewed and approved by our board of directors.
Deferred Tax Asset Valuation Allowance
We record a valuation allowance to reduce our deferred tax assets to an amount that is more likely than not to be realized after consideration of future taxable income and reasonable tax planning strategies. In the event that we were to determine that we would not be able to realize all or a part of our deferred tax assets for which a valuation allowance had not been established, an adjustment to the deferred tax asset will be reflected in income in the period such determination is made. The most significant matter applicable to the realization of our deferred tax assets is attributable to net operating losses in certain states. Estimates of future taxable income inherently reflect a significant degree of uncertainty. During the years ended December 31, 2014 and 2012, we increased the valuation allowance for our deferred tax assets due primarily to our inability to project sufficient future taxable income in certain states.
Share-Based Compensation
In May 2014, May 2013 and February 2012, we granted PBRSUs to certain executive officers. Vested PBRSUs are payable in cash on the third anniversary of the date of grant based upon the achievement of specified market-based performance metrics with respect to each of a one-year, two-year and three-year performance period, in each case commencing on the date of grant. The number of PBRSUs vested can range from 0% to 200% of the initial grant. The PBRSUs do not have voting rights and do not participate in dividends.
Because the PBRSUs are payable solely in cash, they are considered liability-classified awards and are included in the Other liabilities caption on our Consolidated Balance Sheets. Compensation cost associated with the PBRSUs is measured at the end of each reporting period based on the fair value derived from a Monte Carlo model and recognized based on the period of time that has elapsed during each of the individual performance periods. The Monte Carlo model is a binomial valuation model that requires significant judgment with respect to certain assumptions, including volatility, dividends and other factors. Due primarily to the sensitivity of certain model assumptions, as well as the inherent variability of modeling market-based performance over future periods, our compensation expense with respect to the PBRSUs can be volatile.
Recent Accounting Standards
In May 2014, the FASB issued Accounting Standards Update No. 2014-09, Revenues from Contracts with Customers, or ASU 2014-09, which requires an entity to recognize the amount of revenue to which it expects to be entitled for the transfer of promised goods or services to customers. ASU 2014-09 will replace most existing revenue recognition guidance in U.S. GAAP when it becomes effective on January 1, 2017. The standard permits the use of either the retrospective or cumulative effect transition method upon adoption. We are evaluating the effect that ASU 2014-09 will have on our Consolidated Financial Statements and related disclosures. We have not yet selected a transition method nor have we determined the effect of ASU 2014-09 on our ongoing financial reporting.
47
Item 7A Quantitative and Qualitative Disclosures About Market Risk
Market risk is the risk of loss arising from adverse changes in market rates and prices. The principal market risks to which we are exposed are interest rate risk and commodity price risk.
Interest Rate Risk
All of our long-term debt instruments, with the exception of the Revolver, have fixed interest rates. Accordingly, our interest rate risk is attributable to our borrowings under the Revolver, which is subject to variable interest rates. As of December 31, 2014, we had borrowings of $35 million under the Revolver at an interest rate of 1.6875%. Assuming a constant borrowing level of $35 million under the Revolver, an increase (decrease) in the interest rate of one percent would result in an increase (decrease) in interest expense of approximately $0.4 million on an annual basis.
Commodity Price Risk
We produce and sell crude oil, NGLs and natural gas. As a result, our financial results are affected when prices for these commodities fluctuate. Our price risk management programs permit the utilization of derivative financial instruments (such as collars, swaps and swaptions) to seek to mitigate the price risks associated with fluctuations in commodity prices as they relate to a portion of our anticipated production. The derivative instruments are placed with major financial institutions that we believe are of acceptable credit risk. The fair values of our derivative instruments are significantly affected by fluctuations in the prices of oil and natural gas. We have not typically entered into derivative instruments with respect to NGLs, although we may do so in the future.
As of December 31, 2014, we reported a commodity derivative asset of $164.9 million. The contracts associated with this position are with six counterparties, all of which are investment grade financial institutions, and are substantially concentrated with three of those counterparties. This concentration may impact our overall credit risk, either positively or negatively, in that these counterparties may be similarly affected by changes in economic or other conditions. We neither paid nor received collateral with respect to our derivative positions. No significant uncertainties exist related to the collectability of amounts that may be owed to us by these counterparties. The maximum amount of loss due to credit risk if counterparties to our derivative asset positions fail to perform according to the terms of the contracts would be equal to the fair value of the contracts as of December 31, 2014.
During the year ended December 31, 2014, we reported net commodity derivative income of $162.2 million. We have experienced and could continue to experience significant changes in the estimate of derivative gains or losses recognized due to fluctuations in the value of our derivative instruments. Our results of operations are affected by the volatility of unrealized gains and losses and changes in fair value, which fluctuate with changes in crude oil, NGL and natural gas prices. These fluctuations could be significant in a volatile pricing environment. See Note 5 to our Consolidated Financial Statements for a further description of our price risk management activities.
48
The following table sets forth our commodity derivative positions as of December 31, 2014:
Average | ||||||||||||||||||||
Volume Per | Weighted Average Price | Fair Value | ||||||||||||||||||
Instrument | Day | Floor/Swap | Ceiling | Asset | Liability | |||||||||||||||
Crude Oil: | (barrels) | ($/barrel) | ||||||||||||||||||
First quarter 2015 1 | Collars | 4,000 | $ | 87.50 | $ | 94.66 | $ | 9,152 | $ | — | ||||||||||
Second quarter 2015 1 | Collars | 4,000 | $ | 87.50 | $ | 94.66 | 8,726 | — | ||||||||||||
Third quarter 2015 1 | Collars | 3,000 | $ | 86.67 | $ | 94.73 | 5,283 | — | ||||||||||||
Fourth quarter 2015 1 | Collars | 3,000 | $ | 86.67 | $ | 94.73 | 4,892 | — | ||||||||||||
First quarter 2015 1 | Swaps | 9,000 | $ | 91.81 | 24,800 | — | ||||||||||||||
Second quarter 2015 1 | Swaps | 9,000 | $ | 91.81 | 23,765 | — | ||||||||||||||
Third quarter 2015 1 | Swaps | 8,000 | $ | 91.06 | 20,302 | — | ||||||||||||||
Fourth quarter 2015 1 | Swaps | 8,000 | $ | 91.06 | 18,983 | — | ||||||||||||||
First quarter 2016 | Swaps | 4,000 | $ | 88.12 | 9,719 | — | ||||||||||||||
Second quarter 2016 | Swaps | 4,000 | $ | 88.12 | 9,150 | — | ||||||||||||||
Third quarter 2016 | Swaps | 4,000 | $ | 88.12 | 8,736 | — | ||||||||||||||
Fourth quarter 2016 | Swaps | 4,000 | $ | 88.12 | 8,292 | — | ||||||||||||||
Natural Gas: | (in MMBtu) | ($/MMBtu) | ||||||||||||||||||
First quarter 2015 | Swaps | 5,000 | $ | 4.50 | 677 | — | ||||||||||||||
Settlements to be received in subsequent period | 12,401 | — | ||||||||||||||||||
____________________
1 Certain crude oil derivative transactions include put options we sold. All of the put options carry a $70.00 strike price. If the price of WTI Crude Oil settles below $70.00 per barrel for any given measurement period, the cash received by us on the derivative settlement will be limited to the difference between the Floor/Swap price and the $70.00 put option strike price. The sum of the notional volumes attached to the short puts is 6,000 barrels per day for the first and second quarters of 2015, and 5,000 barrels per day for the third and fourth quarters of 2015.
The following table illustrates the estimated impact on the fair values of our derivative financial instruments and operating income attributable to hypothetical changes in the underlying commodity prices. This illustration assumes that crude oil prices, natural gas prices and production volumes remain constant at anticipated levels. The estimated changes in operating income exclude potential cash receipts or payments in settling these derivative positions.
Change of $10.00 per Barrel of Crude Oil or $1.00 per MMBtu of Natural Gas ($ in millions) | |||||||
Increase | Decrease | ||||||
Effect on the fair value of crude oil derivatives | $ | (44.6 | ) | $ | 40.9 | ||
Effect on the fair value of natural gas derivatives | $ | (0.3 | ) | $ | 0.3 | ||
Effect on 2015 operating income, excluding crude oil derivatives | $ | 46.3 | $ | (46.3 | ) | ||
Effect on 2015 operating income, excluding natural gas derivatives | $ | 10.4 | $ | (10.4 | ) | ||
49
Item 8 | Financial Statements and Supplementary Data |
PENN VIRGINIA CORPORATION AND SUBSIDIARIES
INDEX TO CONSOLIDATED FINANCIAL STATEMENTS
Page | |
Report of Independent Registered Public Accounting Firm | |
Consolidated Statements of Operations for the Years Ended December 31, 2014, 2013 and 2012 | |
Consolidated Statements of Comprehensive Income for the Years Ended December 31, 2014, 2013 and 2012 | |
Consolidated Balance Sheets as of December 31, 2014 and 2013 | |
Consolidated Statements of Cash Flows for the Years Ended December 31, 2014, 2013 and 2012 | |
Consolidated Statements of Shareholders’ Equity for the Years Ended December 31, 2014, 2013 and 2012 | |
Notes to Consolidated Financial Statements: | |
1. Nature of Operations | |
2. Summary of Significant Accounting Policies | |
3. Acquisitions and Divestitures | |
4. Accounts Receivable and Major Customers | |
5. Derivative Instruments | |
6. Property and Equipment | |
7. Asset Retirement Obligations | |
8. Long-Term Debt | |
9. Income Taxes | |
10. Additional Balance Sheet Detail | |
11. Fair Value Measurements | |
12. Commitments and Contingencies | |
13. Shareholders’ Equity | |
14. Share-Based Compensation | |
15. Restructuring Activities | |
16. Impairments | |
17. Interest Expense | |
18. Earnings per Share | |
Supplemental Quarterly Financial Information (unaudited) | |
Supplemental Information on Oil and Gas Producing Activities (unaudited) | |
50
Report of Independent Registered Public Accounting Firm
The Board of Directors and Shareholders
Penn Virginia Corporation:
We have audited the accompanying consolidated balance sheets of Penn Virginia Corporation and subsidiaries as of December 31, 2014 and 2013, and the related consolidated statements of operations, comprehensive income, shareholders' equity, and cash flows for each of the years in the three-year period ended December 31, 2014. We also have audited Penn Virginia Corporation's internal control over financial reporting as of December 31, 2014, based on criteria established in Internal Control - Integrated Framework (1992) issued by the Committee of Sponsoring Organizations of the Treadway Commission (COSO). Penn Virginia Corporation's management is responsible for these consolidated financial statements, for maintaining effective internal control over financial reporting, and for its assessment of the effectiveness of internal control over financial reporting, included in the accompanying Management's Annual Report on Internal Control Over Financial Reporting. Our responsibility is to express an opinion on these consolidated financial statements and an opinion on the Company's internal control over financial reporting based on our audits.
We conducted our audits in accordance with the standards of the Public Company Accounting Oversight Board (United States). Those standards require that we plan and perform the audits to obtain reasonable assurance about whether the financial statements are free of material misstatement and whether effective internal control over financial reporting was maintained in all material respects. Our audits of the consolidated financial statements included examining, on a test basis, evidence supporting the amounts and disclosures in the financial statements, assessing the accounting principles used and significant estimates made by management, and evaluating the overall financial statement presentation. Our audit of internal control over financial reporting included obtaining an understanding of internal control over financial reporting, assessing the risk that a material weakness exists, and testing and evaluating the design and operating effectiveness of internal control based on the assessed risk. Our audits also included performing such other procedures as we considered necessary in the circumstances. We believe that our audits provide a reasonable basis for our opinions.
A company's internal control over financial reporting is a process designed to provide reasonable assurance regarding the reliability of financial reporting and the preparation of financial statements for external purposes in accordance with generally accepted accounting principles. A company's internal control over financial reporting includes those policies and procedures that (1) pertain to the maintenance of records that, in reasonable detail, accurately and fairly reflect the transactions and dispositions of the assets of the company; (2) provide reasonable assurance that transactions are recorded as necessary to permit preparation of financial statements in accordance with generally accepted accounting principles, and that receipts and expenditures of the company are being made only in accordance with authorizations of management and directors of the company; and (3) provide reasonable assurance regarding prevention or timely detection of unauthorized acquisition, use, or disposition of the company's assets that could have a material effect on the financial statements.
Because of its inherent limitations, internal control over financial reporting may not prevent or detect misstatements. Also, projections of any evaluation of effectiveness to future periods are subject to the risk that controls may become inadequate because of changes in conditions, or that the degree of compliance with the policies or procedures may deteriorate.
In our opinion, the consolidated financial statements referred to above present fairly, in all material respects, the financial position of Penn Virginia Corporation and subsidiaries as of December 31, 2014 and 2013, and the results of their operations and their cash flows for each of the years in the three-year period ended December 31, 2014, in conformity with U.S. generally accepted accounting principles. Also in our opinion, Penn Virginia Corporation maintained, in all material respects, effective internal control over financial reporting as of December 31, 2014, based on criteria established in Internal Control - Integrated Framework (1992) issued by the Committee of Sponsoring Organizations of the Treadway Commission (COSO).
/s/ KPMG LLP
Houston, Texas
February 25, 2015
51
PENN VIRGINIA CORPORATION AND SUBSIDIARIES
CONSOLIDATED STATEMENTS OF OPERATIONS
(in thousands, except per share data)
Year Ended December 31, | |||||||||||
2014 | 2013 | 2012 | |||||||||
Revenues | |||||||||||
Crude oil | $ | 420,286 | $ | 347,407 | $ | 229,572 | |||||
Natural gas liquids (NGLs) | 34,552 | 30,748 | 31,051 | ||||||||
Natural gas | 58,044 | 52,538 | 49,861 | ||||||||
Gain (loss) on sales of property and equipment, net | 120,769 | (266 | ) | 4,282 | |||||||
Other | 3,122 | 1,041 | 2,383 | ||||||||
Total revenues | 636,773 | 431,468 | 317,149 | ||||||||
Operating expenses | |||||||||||
Lease operating | 48,298 | 35,461 | 31,266 | ||||||||
Gathering, processing and transportation | 18,294 | 12,839 | 14,196 | ||||||||
Production and ad valorem taxes | 27,990 | 22,404 | 10,634 | ||||||||
General and administrative | 49,005 | 53,998 | 45,900 | ||||||||
Exploration | 17,063 | 20,994 | 34,092 | ||||||||
Depreciation, depletion and amortization | 300,299 | 245,594 | 206,336 | ||||||||
Impairments | 791,809 | 132,224 | 104,484 | ||||||||
Loss on firm transportation commitment | — | — | 17,332 | ||||||||
Total operating expenses | 1,252,758 | 523,514 | 464,240 | ||||||||
Operating loss | (615,985 | ) | (92,046 | ) | (147,091 | ) | |||||
Other income (expense) | |||||||||||
Interest expense | (88,831 | ) | (78,841 | ) | (59,339 | ) | |||||
Loss on extinguishment of debt | — | (29,174 | ) | (3,164 | ) | ||||||
Derivatives | 162,212 | (20,852 | ) | 36,187 | |||||||
Other | 1,334 | 147 | 116 | ||||||||
Loss before income taxes | (541,270 | ) | (220,766 | ) | (173,291 | ) | |||||
Income tax benefit | 131,678 | 77,696 | 68,702 | ||||||||
Net loss | (409,592 | ) | (143,070 | ) | (104,589 | ) | |||||
Preferred stock dividends | (17,148 | ) | (6,900 | ) | (1,687 | ) | |||||
Induced conversion of preferred stock | (4,256 | ) | — | — | |||||||
Net loss attributable to common shareholders | $ | (430,996 | ) | $ | (149,970 | ) | $ | (106,276 | ) | ||
Net loss per share: | |||||||||||
Basic | $ | (6.26 | ) | $ | (2.41 | ) | $ | (2.22 | ) | ||
Diluted | $ | (6.26 | ) | $ | (2.41 | ) | $ | (2.22 | ) | ||
Weighted average shares outstanding – basic | 68,887 | 62,335 | 47,919 | ||||||||
Weighted average shares outstanding – diluted | 68,887 | 62,335 | 47,919 | ||||||||
See accompanying notes to consolidated financial statements.
52
PENN VIRGINIA CORPORATION AND SUBSIDIARIES
CONSOLIDATED STATEMENTS OF COMPREHENSIVE INCOME
(in thousands)
Year Ended December 31, | |||||||||||
2014 | 2013 | 2012 | |||||||||
Net loss | $ | (409,592 | ) | $ | (143,070 | ) | $ | (104,589 | ) | ||
Other comprehensive income (loss): | |||||||||||
Change in pension and postretirement obligations, net of tax of $(10) in 2014, $673 in 2013 and $54 in 2012 | (18 | ) | 1,249 | 102 | |||||||
(18 | ) | 1,249 | 102 | ||||||||
Comprehensive loss | $ | (409,610 | ) | $ | (141,821 | ) | $ | (104,487 | ) | ||
See accompanying notes to consolidated financial statements.
53
PENN VIRGINIA CORPORATION AND SUBSIDIARIES
CONSOLIDATED BALANCE SHEETS
(in thousands, except share data)
As of December 31, | |||||||
2014 | 2013 | ||||||
Assets | |||||||
Current assets | |||||||
Cash and cash equivalents | $ | 6,252 | $ | 23,474 | |||
Accounts receivable, net of allowance for doubtful accounts | 189,627 | 194,403 | |||||
Derivative assets | 128,981 | 3,830 | |||||
Deferred income taxes | 53 | 6,065 | |||||
Other current assets | 10,114 | 5,924 | |||||
Total current assets | 335,027 | 233,696 | |||||
Property and equipment, net (successful efforts method) | 1,825,098 | 2,237,304 | |||||
Derivative assets | 35,897 | 1,552 | |||||
Other assets | 30,412 | 34,535 | |||||
Total assets | $ | 2,226,434 | $ | 2,507,087 | |||
Liabilities and Shareholders’ Equity | |||||||
Current liabilities | |||||||
Accounts payable and accrued liabilities | $ | 312,227 | $ | 248,004 | |||
Derivative liabilities | — | 10,141 | |||||
Total current liabilities | 312,227 | 258,145 | |||||
Other liabilities | 123,886 | 33,386 | |||||
Deferred income taxes | 4,504 | 145,752 | |||||
Long-term debt | 1,110,000 | 1,281,000 | |||||
Commitments and contingencies (Note 12) | |||||||
Shareholders’ equity: | |||||||
Preferred stock of $100 par value – 100,000 shares authorized; Series A – 7,945 and 11,500 shares issued as of December 31, 2014 and December 31, 2013, respectively, and Series B – 32,500 shares issued as of December 31, 2014, each with a redemption value of $10,000 per share | 4,044 | 1,150 | |||||
Common stock of $0.01 par value – 128,000,000 shares authorized; shares issued of 71,568,936 and 65,306,748 as of December 31, 2014 and December 31, 2013, respectively | 529 | 466 | |||||
Paid-in capital | 1,206,305 | 891,351 | |||||
Accumulated deficit | (535,176 | ) | (104,180 | ) | |||
Deferred compensation obligation | 3,211 | 2,792 | |||||
Accumulated other comprehensive income | 249 | 267 | |||||
Treasury stock – 262,070 and 233,063 shares of common stock, at cost, as of December 31, 2014 and December 31, 2013, respectively | (3,345 | ) | (3,042 | ) | |||
Total shareholders’ equity | 675,817 | 788,804 | |||||
Total liabilities and shareholders’ equity | $ | 2,226,434 | $ | 2,507,087 | |||
See accompanying notes to consolidated financial statements.
54
PENN VIRGINIA CORPORATION AND SUBSIDIARIES
CONSOLIDATED STATEMENTS OF CASH FLOWS
(in thousands)
Year Ended December 31, | |||||||||||
2014 | 2013 | 2012 | |||||||||
Cash flows from operating activities | |||||||||||
Net loss | $ | (409,592 | ) | $ | (143,070 | ) | $ | (104,589 | ) | ||
Adjustments to reconcile net loss to net cash provided by operating activities: | |||||||||||
Loss on extinguishment of debt | — | 29,174 | 3,144 | ||||||||
Loss on firm transportation commitment | — | — | 17,332 | ||||||||
Depreciation, depletion and amortization | 300,299 | 245,594 | 206,336 | ||||||||
Impairments | 791,809 | 132,224 | 104,484 | ||||||||
Accretion of firm transportation obligation | 1,301 | 1,674 | 570 | ||||||||
Derivative contracts: | |||||||||||
Net (gains) losses | (162,212 | ) | 20,852 | (36,187 | ) | ||||||
Cash settlements, net | (7,424 | ) | (1,042 | ) | 29,723 | ||||||
Deferred income tax benefit | (135,227 | ) | (77,696 | ) | (68,676 | ) | |||||
(Gain) loss on sales of assets, net | (120,769 | ) | 266 | (4,282 | ) | ||||||
Non-cash exploration expense | 10,346 | 17,451 | 32,634 | ||||||||
Non-cash interest expense | 4,197 | 3,844 | 4,062 | ||||||||
Share-based compensation (equity-classified) | 3,627 | 5,781 | 6,347 | ||||||||
Other, net | 94 | 297 | 434 | ||||||||
Changes in operating assets and liabilities: | |||||||||||
Accounts receivable, net | (20,169 | ) | (105,023 | ) | 9,907 | ||||||
Income taxes receivable and payable, net | (97 | ) | — | 31,439 | |||||||
Accounts payable and accrued expenses | 27,362 | 129,670 | 9,710 | ||||||||
Other assets and liabilities | (821 | ) | 1,516 | (930 | ) | ||||||
Net cash provided by operating activities | 282,724 | 261,512 | 241,458 | ||||||||
Cash flows from investing activities | |||||||||||
Acquisition, net | — | (358,239 | ) | — | |||||||
Receipts (payments) to settle working capital adjustments assumed in acquisition, net | 33,712 | (22,455 | ) | — | |||||||
Capital expenditures – property and equipment | (774,139 | ) | (504,203 | ) | (370,907 | ) | |||||
Proceeds from sales of assets and other, net | 313,933 | (54 | ) | 96,899 | |||||||
Net cash used in investing activities | (426,494 | ) | (884,951 | ) | (274,008 | ) | |||||
Cash flows from financing activities | |||||||||||
Proceeds from the issuance of preferred stock, net | 313,330 | — | 110,337 | ||||||||
Payments to induce conversion of preferred stock | (4,256 | ) | — | — | |||||||
Proceeds from the issuance of common stock, net | — | — | 43,474 | ||||||||
Proceeds from the issuance of senior notes | — | 775,000 | — | ||||||||
Retirement of senior notes | — | (319,090 | ) | (4,915 | ) | ||||||
Proceeds from revolving credit facility borrowings | 412,000 | 297,000 | 211,000 | ||||||||
Repayment of revolving credit facility borrowings | (583,000 | ) | (91,000 | ) | (310,000 | ) | |||||
Debt issuance costs paid | (151 | ) | (25,634 | ) | (2,032 | ) | |||||
Dividends paid on preferred stock | (12,803 | ) | (6,862 | ) | — | ||||||
Dividends paid on common stock | — | — | (5,176 | ) | |||||||
Other, net | 1,428 | (151 | ) | — | |||||||
Net cash provided by financing activities | 126,548 | 629,263 | 42,688 | ||||||||
Net (decrease) increase in cash and cash equivalents | (17,222 | ) | 5,824 | 10,138 | |||||||
Cash and cash equivalents - beginning of period | 23,474 | 17,650 | 7,512 | ||||||||
Cash and cash equivalents - end of period | $ | 6,252 | $ | 23,474 | $ | 17,650 | |||||
Supplemental disclosures: | |||||||||||
Cash paid for interest (net of amounts capitalized) | $ | 84,797 | $ | 65,107 | $ | 54,808 | |||||
Cash paid for income taxes (net of refunds received) | $ | 3,612 | $ | — | $ | (32,603 | ) | ||||
Non-cash investing and financing activities: | |||||||||||
Other assets acquired related to acquisition | $ | — | $ | 99,213 | $ | — | |||||
Other liabilities assumed related to acquisition | $ | — | $ | 96,271 | $ | — | |||||
Common stock transferred as consideration for acquisition | $ | — | $ | 42,300 | $ | — | |||||
See accompanying notes to consolidated financial statements.
55
PENN VIRGINIA CORPORATION AND SUBSIDIARIES
CONSOLIDATED STATEMENTS OF SHAREHOLDERS’ EQUITY
(in thousands)
Common Shares Outstanding | Preferred Stock | Common Stock | Paid-in Capital | Retained Earnings (Accumulated Deficit) | Deferred Compensation Obligation | Accumulated Other Comprehensive Income (Loss) | Treasury Stock | Total Shareholders’ Equity | ||||||||||||||||||||||||||
Balance as of December 31, 2011 | 45,714 | $ | — | $ | 270 | $ | 690,131 | $ | 157,242 | $ | 3,620 | $ | (1,084 | ) | $ | (3,870 | ) | $ | 846,309 | |||||||||||||||
Net loss | — | — | — | — | (104,589 | ) | — | — | — | (104,589 | ) | |||||||||||||||||||||||
Issuance of preferred stock | — | 1,150 | — | 109,312 | — | — | — | — | 110,462 | |||||||||||||||||||||||||
Issuance of common stock | 9,200 | — | 92 | 43,258 | — | — | — | — | 43,350 | |||||||||||||||||||||||||
Dividends declared on preferred stock ($146.67 per preferred share) | — | — | — | — | (1,687 | ) | — | — | — | (1,687 | ) | |||||||||||||||||||||||
Dividends declared on common stock ($0.1125 per share) | — | — | — | — | (5,176 | ) | — | — | — | (5,176 | ) | |||||||||||||||||||||||
Share-based compensation | 80 | — | 1 | 6,346 | — | — | — | — | 6,347 | |||||||||||||||||||||||||
Deferred compensation | 35 | — | — | — | — | (509 | ) | — | 507 | (2 | ) | |||||||||||||||||||||||
Restricted stock unit vesting | 88 | — | 1 | (1 | ) | — | — | — | — | — | ||||||||||||||||||||||||
Change in pension and postretirement benefit obligations | — | — | — | — | — | — | 102 | — | 102 | |||||||||||||||||||||||||
Balance as of December 31, 2012 | 55,117 | 1,150 | 364 | 849,046 | 45,790 | 3,111 | (982 | ) | (3,363 | ) | 895,116 | |||||||||||||||||||||||
Net loss | — | — | — | — | (143,070 | ) | — | — | — | (143,070 | ) | |||||||||||||||||||||||
Issuance of common stock | 10,000 | — | 100 | 42,041 | — | — | — | — | 42,141 | |||||||||||||||||||||||||
Dividends declared on preferred stock ($600.00 per preferred share) | — | — | — | — | (6,900 | ) | — | — | — | (6,900 | ) | |||||||||||||||||||||||
Share-based compensation | 78 | — | 1 | 5,780 | — | — | — | — | 5,781 | |||||||||||||||||||||||||
Deferred compensation | 31 | — | — | (679 | ) | — | (319 | ) | — | 321 | (677 | ) | ||||||||||||||||||||||
Exercise of stock options | 3 | — | — | 16 | — | — | — | — | 16 | |||||||||||||||||||||||||
Restricted stock unit vesting | 78 | — | 1 | (252 | ) | — | — | — | — | (251 | ) | |||||||||||||||||||||||
Change in pension and postretirement benefit obligations | — | — | — | — | — | — | 1,249 | — | 1,249 | |||||||||||||||||||||||||
Other | — | — | — | (4,601 | ) | — | — | — | — | (4,601 | ) | |||||||||||||||||||||||
Balance as of December 31, 2013 | 65,307 | 1,150 | 466 | 891,351 | (104,180 | ) | 2,792 | 267 | (3,042 | ) | 788,804 | |||||||||||||||||||||||
Net loss | — | — | — | — | (409,592 | ) | — | — | — | (409,592 | ) | |||||||||||||||||||||||
Issuance of preferred stock | — | 3,250 | — | 310,080 | — | — | — | — | 313,330 | |||||||||||||||||||||||||
Conversion of preferred stock | 5,926 | (356 | ) | 59 | 297 | — | — | — | — | — | ||||||||||||||||||||||||
Payments to induce conversion of preferred stock | — | — | — | — | (4,256 | ) | — | — | — | (4,256 | ) | |||||||||||||||||||||||
Dividends declared on preferred stock ($600.00 and $348.33 per Series A and Series B preferred share, respectively) | — | — | — | — | (17,148 | ) | — | — | — | (17,148 | ) | |||||||||||||||||||||||
Share-based compensation | 15 | — | 1 | 3,626 | — | — | — | — | 3,627 | |||||||||||||||||||||||||
Deferred compensation | — | — | — | — | — | 419 | — | (303 | ) | 116 | ||||||||||||||||||||||||
Exercise of stock options | 257 | — | 3 | 1,425 | — | — | — | — | 1,428 | |||||||||||||||||||||||||
Restricted stock unit vesting | 64 | — | — | (474 | ) | — | — | — | — | (474 | ) | |||||||||||||||||||||||
Change in pension and postretirement benefit obligations | — | — | — | — | — | — | (18 | ) | — | (18 | ) | |||||||||||||||||||||||
Balance as of December 31, 2014 | 71,569 | $ | 4,044 | $ | 529 | $ | 1,206,305 | $ | (535,176 | ) | $ | 3,211 | $ | 249 | $ | (3,345 | ) | $ | 675,817 | |||||||||||||||
See accompanying notes to consolidated financial statements.
56
PENN VIRGINIA CORPORATION AND SUBSIDIARIES
NOTES TO CONSOLIDATED FINANCIAL STATEMENTS
(in thousands, except per share amounts)
1. | Nature of Operations |
Penn Virginia Corporation (“Penn Virginia,” the “Company,” “we,” “us” or “our”) is an independent oil and gas company engaged in the exploration, development and production of oil, natural gas liquids (“NGLs”) and natural gas in various onshore regions of the United States. Our current operations consist primarily of drilling unconventional horizontal development wells in the Eagle Ford Shale in South Texas. We also have operations in the Granite Wash in Oklahoma and the Haynesville Shale and Cotton Valley in East Texas.
2. | Summary of Significant Accounting Policies |
Principles of Consolidation
Our Consolidated Financial Statements include the accounts of Penn Virginia and all of its subsidiaries. Intercompany balances and transactions have been eliminated.
Use of Estimates
Preparation of our Consolidated Financial Statements in conformity with accounting principles generally accepted in the United States of America requires management to make estimates and assumptions that affect the reported amounts of assets and liabilities in our Consolidated Financial Statements and the reported amounts of revenues and expenses during the reporting period. Such estimates include certain asset and liability valuations as further described in these Notes. Actual results could differ from those estimates.
Cash and Cash Equivalents
We consider all highly liquid investments purchased with an original maturity of three months or less to be cash equivalents.
Derivative Instruments
From time to time, we utilize derivative instruments to mitigate our financial exposure to commodity price and interest rate volatility. The derivative instruments, which are placed with financial institutions that we believe are of acceptable credit risk, take the form of collars, swaps and swaptions. All derivative transactions are subject to our risk management policy, which has been reviewed and approved by our board of directors.
All derivative instruments are recognized in our Consolidated Financial Statements at fair value. The fair values of our derivative instruments are determined based on discounted cash flows derived from quoted forward prices. Our derivative instruments are not formally designated as hedges. We recognize changes in fair value in earnings currently as a component of the Derivatives caption on our Consolidated Statements of Operations. We have experienced and could continue to experience significant changes in the amount of derivative gains or losses recognized due to fluctuations in the value of these commodity derivative contracts, which fluctuate with changes in crude oil and natural gas prices and interest rates.
Oil and Gas Properties
We use the successful efforts method to account for our oil and gas properties. Under this method, costs of acquiring properties, costs of drilling successful exploration wells and development costs are capitalized. Geological and geophysical costs, delay rentals and costs to drill exploratory wells that do not find proved reserves are expensed as oil and gas exploration. We will carry the costs of an exploratory well as an asset if the well has found a sufficient quantity of reserves to justify its completion as a producing well and as long as we are making sufficient progress assessing the reserves and the economic and operating viability of the project. For certain projects, it may take us more than one year to evaluate the future potential of the exploratory well and make a determination of its economic viability. Our ability to move forward on a project may be dependent on gaining access to transportation or processing facilities or obtaining permits and government or partner approval, the timing of which is beyond our control. In such cases, exploratory well costs remain suspended as long as we are actively pursuing access to the necessary facilities or receiving such permits and approvals and believe that they will be obtained. We assess the status of suspended exploratory well costs on a quarterly basis.
Depreciation, depletion and amortization (“DD&A”) of proved producing properties is computed using the units-of-production method. Natural gas is converted to a liquids equivalent on the basis that six thousand cubic feet of natural gas is equivalent to one barrel of liquids. Historically, we have adjusted our depletion rate throughout the year as new data becomes available and in the fourth quarter based on our year-end reserve report.
57
Other Property and Equipment
Other property and equipment consists primarily of gathering systems and related support equipment. Property and equipment are carried at cost and include expenditures for additions and improvements, such as roads and land improvements, which increase the productive lives of existing assets. Maintenance and repair costs are charged to expense as incurred. Renewals and betterments, which extend the useful life of the properties, are capitalized.
We compute depreciation and amortization of property and equipment using the straight-line balance method over the estimated useful life of each asset as follows: Gathering systems - fifteen to twenty years and Other property and equipment - three to twenty years.
Impairment of Long-Lived and Other Assets
We review assets for impairment when events or circumstances indicate a possible decline in the recoverability of the carrying value of such property. If the carrying value of the asset is determined to be impaired, we reduce the asset to its fair value. Fair value may be estimated using comparable market data, a discounted cash flow method, or a combination of the two. In the discounted cash flow method, estimated future cash flows are based on management’s expectations for the future and could include estimates of future production, commodity prices based on published forward commodity price curves as of the date of the estimate, operating and development costs, intent to develop properties and a risk-adjusted discount rate.
We review oil and gas properties for impairment periodically when events and circumstances indicate a decline in the recoverability of the carrying value of such properties, such as a downward revision of the reserve estimates or lower commodity prices. We estimate the future cash flows expected in connection with the properties and compare such future cash flows to the carrying amounts of the properties to determine if the carrying amounts are recoverable. Performing the impairment evaluations requires use of judgments and estimates since the results are dependent on future events. Such events include estimates of proved and unproved reserves, future commodity prices, the timing of future production, capital expenditures and intent to develop properties, among others. We cannot predict whether impairment charges will be required in the future.
The costs of unproved leaseholds, including associated interest costs for the period activities were in progress to bring projects to their intended use, are capitalized pending the results of exploration efforts. Unproved properties whose acquisition costs are insignificant to total oil and gas properties are amortized in the aggregate over the lesser of five years or the average remaining lease term and the amortization is charged to exploration expense. We assess unproved properties whose acquisition costs are relatively significant, if any, for impairment on a stand-alone basis. As exploration work progresses and the reserves on properties are proven, capitalized costs of these properties are subject to depreciation and depletion. If the exploration work is unsuccessful, the capitalized costs of the properties related to the unsuccessful work is charged to exploration expense. The timing of any write-downs of any significant unproved properties depends upon the nature, timing and extent of future exploration and development activities and their results.
Asset Retirement Obligations
We recognize the fair value of a liability for an asset retirement obligation (“ARO”) in the period in which it is incurred. Associated asset retirement costs are capitalized as part of the carrying cost of the asset. Our AROs relate to the plugging and abandonment of oil and gas wells and the associated asset is recorded as a component of oil and gas properties. After recording these amounts, the ARO is accreted to its future estimated value, and the additional capitalized costs are depreciated over the productive life of the assets. Both the accretion of the ARO and the depreciation of the related long-lived assets are included in the DD&A expense caption on our Consolidated Statements of Operations.
Income Taxes
We recognize deferred tax assets and liabilities for the expected future tax consequences of events that have been recognized in the Company’s financial statements or tax returns. Using this method, deferred tax assets and liabilities are determined based on the difference between the financial statement carrying amounts and tax bases of assets and liabilities using enacted tax rates. In assessing our deferred tax assets, we consider whether a valuation allowance should be recorded for some or all of the deferred tax assets which may not be realized. The ultimate realization of deferred tax assets is assessed at each reporting period and is dependent upon the generation of future taxable income and our ability to utilize tax credits and operating loss carryforwards during the periods in which the temporary differences become deductible. We also consider the scheduled reversal of deferred tax liabilities and available tax planning strategies. We recognize interest attributable to income taxes, to the extent they arise, as a component of interest expense and penalties as a component of income tax expense.
We are subject to ongoing tax examinations in numerous domestic jurisdictions. Accordingly, we may record incremental tax expense based upon the more-likely-than-not outcomes of uncertain tax positions. In addition, when applicable, we adjust the previously recorded tax expense to reflect examination results when the position is effectively settled. Our ongoing assessments of the more-likely-than-not outcomes of the examinations and related tax positions require judgment and can increase or decrease our effective tax rate, as well as impact our operating results. The specific timing of when the resolution of each tax position will be reached is uncertain.
58
Revenue Recognition
We record revenues associated with sales of crude oil, NGLs and natural gas when title passes to the customer. We recognize natural gas sales revenues from properties in which we have an interest with other producers on the basis of our net revenue interest (“entitlement” method of accounting). Natural gas imbalances occur when we sell more or less than our entitled ownership percentage of natural gas production. We treat any amount received in excess of our share as a liability. If we take less than we are entitled to take, we record the under-delivery as a receivable. As a result of the numerous requirements necessary to gather information from purchasers or various measurement locations, calculate volumes produced, perform field and wellhead allocations and distribute and disburse funds to various working interest partners and royalty owners, the collection of revenues from oil and gas production may take up to 60 days following the month of production. Therefore, we make accruals for revenues and accounts receivable based on estimates of our share of production, particularly from properties that are operated by our partners. We record any differences, which historically have not been significant, between the actual amounts ultimately received and the original estimates in the period they become finalized.
Share-Based Compensation
Our stock compensation plans permit the grant of incentive and nonqualified stock options, common stock, deferred common stock units, restricted stock and restricted stock units to our employees and directors. We measure the cost of employee services received in exchange for an award of equity-classified instruments based on the grant-date fair value of the award. Compensation cost associated with the liability-classified awards is measured at the end of each reporting period and recognized based on the period of time that has elapsed during the applicable performance period.
Recent Accounting Standards
In May 2014, the FASB issued Accounting Standards Update No. 2014-09, Revenues from Contracts with Customers (“ASU 2014-09”), which requires an entity to recognize the amount of revenue to which it expects to be entitled for the transfer of promised goods or services to customers. ASU 2014-09 will replace most existing revenue recognition guidance in U.S. GAAP when it becomes effective on January 1, 2017. The standard permits the use of either the retrospective or cumulative effect transition method upon adoption. We are evaluating the effect that ASU 2014-09 will have on our Consolidated Financial Statements and related disclosures. We have not yet selected a transition method nor have we determined the effect of ASU 2014-09 on our ongoing financial reporting.
Subsequent Events
Management has evaluated all activities of the Company, through the date upon which our Consolidated Financial Statements were issued, and concluded that no subsequent events have occurred that would require recognition in our Consolidated Financial Statements or disclosure in the Notes to Consolidated Financial Statements.
3. | Acquisitions and Divestitures |
Acquisitions
Undeveloped Eagle Ford Acreage
In August 2014, we acquired undeveloped acreage in the Eagle Ford in Lavaca County, Texas for a purchase price of $45.6 million, of which $34.9 million was paid at closing and the balance of $10.7 million will be paid over the next three years as a drilling carry.
EF Acquisition
On April 24, 2013 (the “Acquisition Date”), we acquired producing properties and undeveloped leasehold interests in the Eagle Ford (the “EF Acquisition”). The EF Acquisition was originally valued at $401 million with an effective date of January 1, 2013 (the “Effective Date”). On the Acquisition Date, we paid approximately $380 million in cash, including approximately $19 million of initial purchase price adjustments related to the period from the Effective Date to the closing, and issued to Magnum Hunter Resources Corporation (“MHR”) 10 million shares of our common stock (the “Shares”) with a fair value of $4.23 per Share. Shortly after the closing, certain of our joint interest partners exercised preferential rights related to the EF Acquisition. We received approximately $21 million from the exercise of these rights, which was recorded as a decrease to the purchase price for the EF Acquisition. Subsequent to the Acquisition Date and through December 31, 2013, we paid a total of $22.5 million, net, to settle working capital adjustments assumed in the EF Acquisition.
Commencing December 2013, we were involved in arbitration with MHR. The arbitration related to disputes we had with MHR regarding contractual adjustments to the purchase price for the EF Acquisition and suspense funds that we believed MHR was obligated to transfer to us. In July 2014, we received the arbitrator’s determination, which required MHR to pay us a total of $35.1 million, including purchase price adjustments, revenue suspense funds due to partners and royalty owners and interest ($1.3 million) on the funds since the Acquisition Date. Payment of the arbitration settlement was made by MHR in August 2014.
59
We incurred $2.6 million of transaction costs associated with the EF Acquisition, including advisory, legal, due diligence and other professional fees. We incurred $0.6 million of professional fees associated with the arbitration proceedings. These costs, as well as fees that we paid to MHR for certain transition services, have been included in the General and administrative caption on our Consolidated Statements of Operations.
We accounted for the EF Acquisition by applying the acquisition method of accounting as of the Acquisition Date. The following table represents the fair values assigned to the net assets acquired as of the Acquisition Date and the consideration paid:
Assets | ||||
Oil and gas properties – proved | $ | 267,688 | ||
Oil and gas properties – unproved | 119,709 | |||
Accounts receivable, net | 107,345 | |||
Other current assets | 2,068 | |||
496,810 | ||||
Liabilities | ||||
Accounts payable and accrued expenses | 94,771 | |||
Other liabilities | 1,500 | |||
96,271 | ||||
Net assets acquired | $ | 400,539 | ||
Cash, net of amounts received for preferential rights | $ | 358,239 | ||
Fair value of the Shares issued to seller | 42,300 | |||
Consideration paid | $ | 400,539 | ||
The fair values of the acquired net assets were measured using valuation techniques that convert future cash flows to a single discounted amount. Significant inputs to valuation of oil and gas properties include estimates of: (i) reserves, (ii) future operating and development costs, (iii) future commodity prices, (iv) future cash flows and (v) a market-based weighted-average cost of capital. Because many of these inputs are not observable, we have classified the initial fair value estimates as Level 3 inputs as that term is defined in U.S. GAAP.
The results of operations attributable to the EF Acquisition have been included in our Consolidated Financial Statements from the Acquisition Date. The following table presents unaudited summary pro forma financial information for the periods presented assuming the EF Acquisition and the related financing occurred as of January 1, 2012. The pro forma financial information does not purport to represent what our results of operations would have been if the EF Acquisition had occurred as of this date or the results of operations for any future periods.
Year Ended December 31, | |||||||||||
2013 | 2012 | ||||||||||
Total revenues | $ | 457,811 | $ | 389,260 | |||||||
Net loss attributable to common shareholders | $ | (148,272 | ) | $ | (106,059 | ) | |||||
Loss per share – basic and diluted | $ | (2.27 | ) | $ | (1.83 | ) | |||||
Divestitures
In July 2014, we sold the rights to construct a crude oil gathering and intermediate transportation system in South Texas to Republic Midstream, LLC (“Republic”) for proceeds of $147.1 million, net of transaction costs. Concurrent with the sale, we entered into long-term agreements with Republic to provide us gathering and intermediate transportation services for a substantial portion of our future South Texas crude oil and condensate production. We realized a gain of $147.1 million, of which $63.0 million was recognized upon the closing of the transaction and the remaining $84.1 million was deferred and will be recognized over a twenty-five year period beginning after the system has been constructed and is operational, currently expected to be in the third quarter of 2015. As of December 31, 2014, $3.4 million of the deferred gain is included as a component of Accounts payable and accrued expenses and $80.7 million, representing the noncurrent portion, is included as a component of Other liabilities on our Consolidated Balance Sheets.
In July 2014, we sold our Selma Chalk assets in Mississippi for proceeds of $67.9 million, net of transaction costs and customary closing adjustments. An impairment charge of $117.9 million was recognized in the second quarter of 2014 with respect to these assets.
60
In January 2014, we sold our natural gas gathering and gas lift assets in South Texas to American Midstream Partners, LP (“AMID”) for proceeds of approximately $96 million, net of transaction costs. Concurrent with the sale, we entered into a long-term agreement with AMID to provide us natural gas gathering, compression and gas lift services for a substantial portion of our current and future South Texas natural gas production. We realized a gain of $67.3 million, of which $56.7 million was recognized upon the closing of the transaction and the remainder was deferred and is being amortized over a twenty-five year period. We amortized $0.4 million of the deferred gain in 2014. As of December 31, 2014, $0.4 million of the remaining deferred gain is included as a component of Accounts payable and accrued expenses and $9.8 million, representing the noncurrent portion, is included as a component of Other liabilities on our Consolidated Balance Sheets.
In July 2012, we sold substantially all of our natural gas assets in West Virginia, Kentucky and Virginia for proceeds of $95.7 million, net of transaction costs and customary closing adjustments, and recognized a gain of $3.3 million in connection with the transaction. An impairment charge of $28.6 million was recognized in the second quarter of 2012 with respect to these assets.
During 2014 and 2012, we also received net proceeds of $2.9 million and $1.0 million and recognized net gains of $0.2 million and $1.0 million from the sale of various non-core oil and gas properties and tubular inventory and well materials. During 2013, payments of post-closing adjustments attributable to sales of properties from prior years were partially offset by net proceeds from sales of individually insignificant oil and gas properties and tubular inventory and well materials, resulting in net payments of $0.1 million and a recognized loss on the sale of assets of $0.3 million.
4. Accounts Receivable and Major Customers
The following table summarizes our accounts receivable by type as of the dates presented:
As of December 31, | |||||||
2014 | 2013 | ||||||
Customers | $ | 62,650 | $ | 93,288 | |||
Joint interest partners | 120,708 | 76,199 | |||||
Other | 6,549 | 25,538 | |||||
189,907 | 195,025 | ||||||
Less: Allowance for doubtful accounts | (280 | ) | (622 | ) | |||
$ | 189,627 | $ | 194,403 | ||||
For the year ended December 31, 2014, three customers accounted for $258.7 million, or approximately 50% of our consolidated product revenues. The revenues generated from these customers during 2014 were $113.6 million, $80.1 million and $65.0 million or 22%, 16%, and 12% of the consolidated total, respectively. As of December 31, 2014, $36.1 million, or approximately 58% of our consolidated accounts receivable from customers was related to these customers. For the year ended December 31, 2013, three customers accounted for $181.7 million, or approximately 42% of our consolidated product revenues. The revenues generated from these customers during 2013 were $70.4 million, $55.9 million and $55.4 million, or approximately 16%, 13% and 13% of the consolidated total, respectively. As of December 31, 2013, $34.8 million, or approximately 37% of our consolidated accounts receivable from customers was related to these customers. No significant uncertainties exist related to the collectability of amounts owed to us by any of these customers.
5. | Derivative Instruments |
We utilize derivative instruments to mitigate our financial exposure to crude oil and natural gas price volatility as well as the volatility in interest rates attributable to our debt instruments. Our derivative instruments are not formally designated as hedges.
Commodity Derivatives
We utilize collars, swaps and swaptions, which are placed with financial institutions that we believe are acceptable credit risks, to hedge against the variability in cash flows associated with anticipated sales of our future oil and gas production. While the use of derivative instruments limits the risk of adverse price movements, such use may also limit future revenues from favorable price movements.
The counterparty to a collar or swap contract is required to make a payment to us if the settlement price for any settlement period is below the floor or swap price for such contract. We are required to make a payment to the counterparty if the settlement price for any settlement period is above the ceiling or swap price for such contract. Neither party is required to make a payment to the other party if the settlement price for any settlement period is equal to or greater than the floor price and equal to or less than the ceiling price for such contract. A swaption contract gives our counterparties the option to enter into a fixed price swap with us at a future date. If the forward commodity price for the term of the swaption is higher than or equal to
61
the swaption strike price on the exercise date, the counterparty will exercise its option to enter into a fixed-price swap at the swaption strike price for the term of the swaption, at which point the contract functions as a fixed-price swap. If the forward commodity price for the term of the swaption is lower than the swaption strike price on the exercise date, the option expires and no fixed-price swap is in effect.
We determine the fair values of our commodity derivative instruments based on discounted cash flows derived from third-party quoted forward prices for NYMEX Henry Hub gas and West Texas Intermediate crude oil closing prices as of the end of the reporting period. The discounted cash flows utilize discount rates adjusted for the credit risk of our counterparties if the derivative is in an asset position, and our own credit risk if the derivative is in a liability position.
The following table sets forth our commodity derivative positions as of December 31, 2014:
Average | ||||||||||||||||||||
Volume Per | Weighted Average Price | Fair Value | ||||||||||||||||||
Instrument | Day | Floor/Swap | Ceiling | Asset | Liability | |||||||||||||||
Crude Oil: | (barrels) | ($/barrel) | ||||||||||||||||||
First quarter 2015 1 | Collars | 4,000 | $ | 87.50 | $ | 94.66 | $ | 9,152 | $ | — | ||||||||||
Second quarter 2015 1 | Collars | 4,000 | $ | 87.50 | 94.66 | 8,726 | — | |||||||||||||
Third quarter 2015 1 | Collars | 3,000 | $ | 86.67 | 94.73 | 5,283 | — | |||||||||||||
Fourth quarter 2015 1 | Collars | 3,000 | $ | 86.67 | 94.73 | 4,892 | — | |||||||||||||
First quarter 2015 1 | Swaps | 9,000 | $ | 91.81 | 24,800 | — | ||||||||||||||
Second quarter 2015 1 | Swaps | 9,000 | $ | 91.81 | 23,765 | — | ||||||||||||||
Third quarter 2015 1 | Swaps | 8,000 | $ | 91.06 | 20,302 | — | ||||||||||||||
Fourth quarter 2015 1 | Swaps | 8,000 | $ | 91.06 | 18,983 | — | ||||||||||||||
First quarter 2016 | Swaps | 4,000 | $ | 88.12 | 9,719 | — | ||||||||||||||
Second quarter 2016 | Swaps | 4,000 | $ | 88.12 | 9,150 | — | ||||||||||||||
Third quarter 2016 | Swaps | 4,000 | $ | 88.12 | 8,736 | — | ||||||||||||||
Fourth quarter 2016 | Swaps | 4,000 | $ | 88.12 | 8,292 | — | ||||||||||||||
Natural Gas: | (in MMBtu) | ($/MMBtu) | ||||||||||||||||||
First quarter 2015 | Swaps | 5,000 | $ | 4.50 | 677 | — | ||||||||||||||
Settlements to be received in subsequent period | 12,401 | — | ||||||||||||||||||
____________________
1 Certain crude oil derivative transactions include put options we sold. All of the put options carry a $70.00 strike price. If the price of WTI Crude Oil settles below $70.00 per barrel for any given measurement period, the cash received by us on the derivative settlement will be limited to the difference between the Floor/Swap price and the $70.00 put option strike price. The sum of the notional volumes attached to the short puts is 6,000 barrels per day for the first and second quarters of 2015, and 5,000 barrels per day for the third and fourth quarters of 2015.
Interest Rate Swaps
As of December 31, 2014 and 2013, we had no interest rate derivative instruments outstanding. In February 2012, we entered into an interest rate swap agreement to establish variable interest rates on approximately one-third of the outstanding obligation under our 7.25% Senior Notes due 2019 (the “2019 Senior Notes”). In May 2012, we terminated this agreement and received $1.2 million in cash proceeds.
62
Financial Statement Impact of Derivatives
The impact of our derivatives activities on income is included in the Derivatives caption on our Consolidated Statements of Operations. The following table summarizes the effects of our derivative activities for the periods presented:
Year Ended December 31, | |||||||||||
2014 | 2013 | 2012 | |||||||||
Impact by contract type: | |||||||||||
Commodity contracts | $ | 162,212 | $ | (20,852 | ) | $ | 34,781 | ||||
Interest rate contracts | — | — | 1,406 | ||||||||
$ | 162,212 | $ | (20,852 | ) | $ | 36,187 | |||||
Cash settlements and gains (losses): | |||||||||||
Cash received (paid) for: | |||||||||||
Commodity contract settlements | $ | (7,424 | ) | $ | (1,042 | ) | $ | 28,317 | |||
Interest rate contract settlements | — | — | 1,406 | ||||||||
(7,424 | ) | (1,042 | ) | 29,723 | |||||||
Gains (losses) attributable to: | |||||||||||
Commodity contracts | 169,636 | (19,810 | ) | 6,464 | |||||||
Interest rate contracts | — | — | — | ||||||||
169,636 | (19,810 | ) | 6,464 | ||||||||
$ | 162,212 | $ | (20,852 | ) | $ | 36,187 | |||||
The effects of derivative gains and (losses) and cash settlements of our commodity and interest rate derivatives are reported as adjustments to reconcile net income (loss) to net cash provided by operating activities. These items are recorded in the Derivative contracts section of our Consolidated Statements of Cash Flows under the Net gains and Cash settlements captions.
The following table summarizes the fair value of our derivative instruments, as well as the locations of these instruments, on our Consolidated Balance Sheets as of the dates presented:
Fair Values as of | ||||||||||||||||||
December 31, 2014 | December 31, 2013 | |||||||||||||||||
Derivative | Derivative | Derivative | Derivative | |||||||||||||||
Type | Balance Sheet Location | Assets | Liabilities | Assets | Liabilities | |||||||||||||
Commodity contracts | Derivative assets/liabilities – current | $ | 128,981 | $ | — | $ | 3,830 | $ | 10,141 | |||||||||
Interest rate contracts | Derivative assets/liabilities – current | — | — | — | — | |||||||||||||
128,981 | — | 3,830 | 10,141 | |||||||||||||||
Commodity contracts | Derivative assets/liabilities – noncurrent | 35,897 | — | 1,552 | — | |||||||||||||
Interest rate contracts | Derivative assets/liabilities – noncurrent | — | — | — | — | |||||||||||||
35,897 | — | 1,552 | — | |||||||||||||||
$ | 164,878 | $ | — | $ | 5,382 | $ | 10,141 | |||||||||||
As of December 31, 2014, we reported a commodity derivative asset of $164.9 million. The contracts associated with this position are with seven counterparties, all of which are investment grade financial institutions, and are substantially concentrated with five of those counterparties. This concentration may impact our overall credit risk, either positively or negatively, in that these counterparties may be similarly affected by changes in economic or other conditions. We have neither paid to nor received from our counterparties any cash collateral in connection with our derivative positions. No significant uncertainties exist related to the collectability of amounts that may be owed to us by these counterparties.
63
6. | Property and Equipment |
The following table summarizes our property and equipment as of the dates presented:
As of December 31, | |||||||
2014 | 2013 | ||||||
Oil and gas properties: | |||||||
Proved | $ | 3,506,603 | $ | 2,970,047 | |||
Unproved | 125,676 | 101,520 | |||||
Total oil and gas properties | 3,632,279 | 3,071,567 | |||||
Other property and equipment | 75,073 | 105,421 | |||||
Total property and equipment | 3,707,352 | 3,176,988 | |||||
Accumulated depreciation, depletion and amortization | (1,882,254 | ) | (939,684 | ) | |||
$ | 1,825,098 | $ | 2,237,304 | ||||
The following table describes the changes in capitalized exploratory drilling costs that are pending the determination of proved reserves for the periods presented:
2014 | 2013 | 2012 | ||||||||||||||||||
Number of Wells | Cost | Number of Wells | Cost | Number of Wells | Cost | |||||||||||||||
Balance at beginning of year | — | $ | — | 1 | $ | 4,435 | — | $ | — | |||||||||||
Additions pending determination of proved reserves | — | — | — | — | 1 | 4,435 | ||||||||||||||
Reclassification to wells, equipment and facilities based on the determination of proved reserves | — | — | (1 | ) | (4,435 | ) | — | — | ||||||||||||
Charged to exploration expense | — | — | — | — | — | — | ||||||||||||||
Balance at end of year | — | $ | — | — | $ | — | 1 | $ | 4,435 | |||||||||||
7. | Asset Retirement Obligations |
The following table reconciles our AROs as of the dates presented, which are included in the Other liabilities caption on our Consolidated Balance Sheets:
As of December 31, | |||||||
2014 | 2013 | ||||||
Balance at beginning of year | $ | 6,437 | $ | 4,513 | |||
Changes in estimates | 112 | — | |||||
Liabilities incurred 1 | 238 | 1,675 | |||||
Liabilities settled | (92 | ) | (220 | ) | |||
Sale of properties | (1,224 | ) | — | ||||
Accretion expense | 419 | 469 | |||||
Balance at end of year | $ | 5,890 | $ | 6,437 | |||
____________________
1 Includes $1.5 million recognized in 2013 in connection with the EF Acquisition.
8. | Long-Term Debt |
The following table summarizes our long-term debt as of the dates presented:
As of December 31, | |||||||
2014 | 2013 | ||||||
Revolving credit facility | $ | 35,000 | $ | 206,000 | |||
Senior notes due 2019 | 300,000 | 300,000 | |||||
Senior notes due 2020 | 775,000 | 775,000 | |||||
$ | 1,110,000 | $ | 1,281,000 | ||||
64
Revolving Credit Facility
The revolving credit facility (the “Revolver”) provides for a $450 million revolving commitment and has a borrowing base of $500 million. The Revolver has an accordion feature that allows us to increase the commitment by up to an additional $150 million upon receiving additional commitments from one or more lenders. The Revolver also includes a $20 million sublimit for the issuance of letters of credit. The Revolver is governed by a borrowing base calculation, which is redetermined semi-annually, and the availability under the Revolver may not exceed the lesser of the aggregate commitments and the borrowing base. The next semi-annual redetermination is scheduled for May 2015. The Revolver allows for the administrative agent to replace any lender who fails to approve a borrowing base increase approved by lenders representing two thirds of the aggregate commitment. The Revolver is available to us for general purposes including working capital, capital expenditures and acquisitions. The Revolver matures in September 2017. We had letters of credit of $1.8 million outstanding as of December 31, 2014. As of December 31, 2014, our available borrowing capacity under the Revolver was $413.2 million.
Borrowings under the Revolver bear interest, at our option, at either (i) a rate derived from the London Interbank Offered Rate, as adjusted for statutory reserve requirements for Eurocurrency liabilities (“Adjusted LIBOR”), plus an applicable margin (ranging from 1.500% to 2.500%) or (ii) the greater of (a) the prime rate, (b) the federal funds effective rate plus 0.5% or (c) the one-month Adjusted LIBOR plus 1.0%, and, in each case, plus an applicable margin (ranging from 0.500% to 1.500%). The applicable margin is determined based on the ratio of our outstanding borrowings to the available Revolver capacity. As of December 31, 2014, the actual interest rate on the outstanding borrowings under the Revolver was 1.6875% which is derived from an Adjusted LIBOR rate of 0.1875% plus an applicable margin of 1.50%. Commitment fees are charged at 0.375% to 0.500% on the undrawn portion of the Revolver depending on our ratio of outstanding borrowings to the available Revolver capacity. As of December 31, 2014, commitment fees were charged at a rate of 0.375%.
The Revolver is guaranteed by Penn Virginia and all of our material subsidiaries (the “Guarantor Subsidiaries”). The obligations under the Revolver are secured by a first priority lien on substantially all of our proved oil and gas reserves and a pledge of the equity interests in the Guarantor Subsidiaries.
The Revolver includes both current ratio and leverage ratio financial covenants. The current ratio is defined in the Revolver to include, among other things, adjustments for undrawn availability and may not be less than 1.0 to 1.0. The ratio of total net debt to EBITDAX, a non-GAAP financial measure defined in the Revolver, may not exceed 4.25 to 1.0 through December 31, 2014 and then 4.0 to 1.0 through maturity.
2016 Senior Notes
In May 2013, we paid a total of $330.9 million including consent payments and accrued interest in connection with a tender offer and redemption of our outstanding 2016 Senior Notes. We recognized a loss on the extinguishment of debt of $29.2 million. The loss on extinguishment of debt included non-cash charges of $10.0 million attributable to the write-off of unamortized debt issuance costs and the remaining debt discount associated with the 2016 Senior Notes.
2019 Senior Notes
The 2019 Senior Notes, which were issued at par in April 2011, bear interest at an annual rate of 7.25% and are payable on April 15 and October 15 of each year. Beginning in April 2015, we may redeem all or part of the 2019 Senior Notes at a redemption price starting at 103.625% of the principal amount and reducing to 100% in June 2017 and thereafter. The 2019 Senior Notes are senior to our existing and future subordinated indebtedness and are effectively subordinated to all of our secured indebtedness, including the Revolver, to the extent of the collateral securing that indebtedness. The obligations under the 2019 Senior Notes are fully and unconditionally guaranteed by the Guarantor Subsidiaries.
2020 Senior Notes
On April 24, 2013, we completed a private placement of the 8.5% Senior Notes due 2020 (the “2020 Senior Notes”) which were later registered in connection with an exchange offer. The 2020 Senior Notes were priced at par and interest is payable on May 1 and November 1 of each year. The 2020 Senior Notes are fully and unconditionally guaranteed by the Guarantor Subsidiaries. Approximately $380 million of the net proceeds from the private placement, together with the Shares, were used to finance the EF Acquisition, including purchase price adjustments. The remaining net proceeds were used to pay down borrowings under the Revolver and to fund a portion of the 2016 Senior Note tender offer and redemption.
The guarantees provided by Penn Virginia, which is the parent company, and the Guarantor Subsidiaries under the Revolver and the senior indebtedness described above are full and unconditional and joint and several. Substantially all of our consolidated assets are held by the Guarantor Subsidiaries. The parent company and its non-guarantor subsidiaries have no material independent assets or operations. There are no significant restrictions on the ability of the parent company or any of the Guarantor Subsidiaries to obtain funds through dividends, advances or loans.
Debt Maturities
We have no debt maturities until September 2017 when the Revolver matures. The 2019 Senior Notes are due in April 2019 and the 2020 Senior Notes are due in May 2020.
65
9. | Income Taxes |
The following table summarizes our provision for income taxes for the periods presented:
Year Ended December 31, | |||||||||||
2014 | 2013 | 2012 | |||||||||
Current income taxes (benefit) | |||||||||||
Federal | $ | 2,045 | $ | — | $ | — | |||||
State | 1,504 | — | (26 | ) | |||||||
3,549 | — | (26 | ) | ||||||||
Deferred income tax benefit | |||||||||||
Federal | (130,693 | ) | (77,046 | ) | (60,676 | ) | |||||
State | (4,534 | ) | (650 | ) | (8,000 | ) | |||||
(135,227 | ) | (77,696 | ) | (68,676 | ) | ||||||
$ | (131,678 | ) | $ | (77,696 | ) | $ | (68,702 | ) | |||
The following table reconciles the difference between the income tax benefit computed by applying the statutory tax rate to our loss before income taxes and our reported income tax benefit for the periods presented:
Year Ended December 31, | ||||||||||||||||||||
2014 | 2013 | 2012 | ||||||||||||||||||
Computed at federal statutory rate | $ | (189,445 | ) | (35.0 | )% | $ | (77,268 | ) | (35.0 | )% | $ | (60,652 | ) | (35.0 | )% | |||||
State income taxes, net of federal income tax benefit | (3,556 | ) | (0.6 | )% | (650 | ) | (0.3 | )% | (8,026 | ) | (4.6 | )% | ||||||||
Change in valuation allowance | 61,104 | 11.3 | % | — | — | % | — | — | % | |||||||||||
Other, net | 219 | — | % | 222 | 0.1 | % | (24 | ) | — | % | ||||||||||
$ | (131,678 | ) | (24.3 | )% | $ | (77,696 | ) | (35.2 | )% | $ | (68,702 | ) | (39.6 | )% | ||||||
The following table summarizes the principal components of our deferred income tax liabilities and assets as of the dates presented:
As of December 31, | |||||||
2014 | 2013 | ||||||
Deferred tax liabilities: | |||||||
Property and equipment | $ | 6,347 | $ | 248,164 | |||
Fair value of derivative instruments | 57,707 | — | |||||
Total deferred tax liabilities | 64,054 | 248,164 | |||||
Deferred tax assets: | |||||||
Fair value of derivative instruments | — | 1,665 | |||||
Pension and postretirement benefits | 2,370 | 2,248 | |||||
Share-based compensation | 7,171 | 6,907 | |||||
Net operating loss (“NOL”) carryforwards | 102,098 | 115,355 | |||||
Deferred gains | 33,704 | — | |||||
Other | 19,875 | 18,029 | |||||
165,218 | 144,204 | ||||||
Less: Valuation allowance | (105,615 | ) | (35,727 | ) | |||
Total deferred tax assets | 59,603 | 108,477 | |||||
$ | 4,451 | $ | 139,687 | ||||
As of December 31, 2014, we had federal NOL carryforwards of approximately $166.4 million, which, if not utilized, expire in 2032 and 2033, and state NOL carryforwards of approximately $67.5 million, which expire between 2024 and 2034.
As of December 31, 2013, we carried a valuation allowance against our state NOL carryforwards of $35.7 million. We incurred a pre-tax loss in 2014, primarily as a result of impairments to our oil and gas properties which, when aggregated with the prior two years, resulted in a pre-tax loss for the three year period ended December 31, 2014. We considered both the
66
positive and negative evidence in determining whether it was more likely than not that some portion or all of our deferred tax assets will be realized. Primarily as a result of recent cumulative losses, we established a federal and state valuation allowance of $62.8 million against the deferred tax assets. The net effect of this and other adjustments resulted in an ending balance of $105.6 million for the deferred tax asset valuation allowance.
We had no liability for unrecognized tax benefits as of December 31, 2014 and 2013. There were no interest and penalty charges recognized during the years ended December 31, 2014, 2013 and 2012. Tax years from 2011 forward remain open for examination by the Internal Revenue Service and various state jurisdictions.
10. | Additional Balance Sheet Detail |
The following table summarizes components of selected balance sheet accounts as of the dates presented:
As of December 31, | |||||||
2014 | 2013 | ||||||
Other current assets: | |||||||
Tubular inventory and well materials | $ | 5,802 | $ | 2,271 | |||
Prepaid expenses | 4,215 | 3,653 | |||||
Other | 97 | — | |||||
$ | 10,114 | $ | 5,924 | ||||
Other assets: | |||||||
Debt issuance costs | $ | 26,194 | $ | 30,239 | |||
Assets of supplemental employee retirement plan 1 | 4,123 | 3,734 | |||||
Other | 95 | 562 | |||||
$ | 30,412 | $ | 34,535 | ||||
Accounts payable and accrued liabilities: | |||||||
Trade accounts payable | $ | 174,496 | $ | 120,278 | |||
Drilling and other lease operating costs | 68,842 | 51,529 | |||||
Royalties | 27,883 | 39,929 | |||||
Compensation-related 2, 3, 4 | 9,197 | 8,584 | |||||
Interest | 15,555 | 15,718 | |||||
Preferred stock dividends | 6,067 | 1,725 | |||||
Other | 10,187 | 10,241 | |||||
$ | 312,227 | $ | 248,004 | ||||
Other liabilities: | |||||||
Deferred gains on sales of assets | $ | 90,569 | $ | — | |||
Firm transportation obligation | 12,042 | 13,245 | |||||
Asset retirement obligations | 5,889 | 6,437 | |||||
Defined benefit pension obligations 2 | 1,753 | 1,579 | |||||
Postretirement health care benefit obligations 2 | 890 | 1,023 | |||||
Compensation-related 4 | 7,631 | 5,839 | |||||
Deferred compensation - supplemental employee retirement plan obligation and other 1 | 4,183 | 3,883 | |||||
Other | 929 | 1,380 | |||||
$ | 123,886 | $ | 33,386 | ||||
1 Includes the assets and liabilities of the Penn Virginia Corporation Supplemental Employee Retirement Plan (“SERP”) which is a nonqualified supplemental employee retirement savings plan. Assets of the SERP are held in a Rabbi Trust. Shares of our common stock held by the Rabbi Trust are presented for financial reporting purposes as treasury stock carried at cost.
2 Includes the combined unfunded benefit obligations under our defined benefit pension and postretirement health care plans of $2.8 million and $3.0 million as of December 31, 2014 and 2013. The expense recognized with respect to these plans was $0.1 million, $0.3 million and $0.3 million for the years ended December 31, 2014, 2013 and 2012, respectively.
3 Includes employer matching obligations under our defined contribution retirement plan of $0.3 million and $0.2 million as of December 31, 2014 and 2013, respectively. The expense recognized with respect to this plan was $1.7 million, $1.0 million and $0.9 million for the years ended December 31, 2014, 2013 and 2012, respectively.
4 Includes liability-classified share-based compensation awards of $2.9 million representing amounts currently payable in cash in 2015 and $6.4 million and $4.8 million representing estimated amounts payable in cash based on valuations prepared as of December 31, 2014 and 2013, respectively.
67
11. | Fair Value Measurements |
We apply the authoritative accounting provisions for measuring fair value of both our financial and nonfinancial assets and liabilities. Fair value is an exit price representing the expected amount we would receive upon the sale of an asset or that we would expect to pay to transfer a liability in an orderly transaction with market participants at the measurement date.
We use a hierarchy that prioritizes the inputs we use to measure fair value into three distinct categories based upon whether such inputs are observable in active markets or unobservable. We classify assets and liabilities in their entirety based on the lowest level of input that is significant to the fair value measurement. Our methodology for categorizing assets and liabilities that are measured at fair value pursuant to this hierarchy gives the highest priority to unadjusted quoted prices in active markets and the lowest level to unobservable inputs as outlined below.
Fair value measurements are classified and disclosed in one of the following three categories:
• | Level 1: Unadjusted quoted prices in active markets that are accessible at the measurement date for identical, unrestricted assets or liabilities. Level 1 inputs generally provide the most reliable evidence of fair value. |
• | Level 2: Quoted prices in markets that are not active or inputs, which are observable, either directly or indirectly, for substantially the full term of the asset or liability. |
• | Level 3: Prices or valuation techniques that require inputs that are both significant to the fair value measurement and unobservable (i.e., supported by little or no market activity). |
Our financial instruments that are subject to fair value disclosure consist of cash and cash equivalents, accounts receivable, accounts payable, derivatives and long-term debt. As of December 31, 2014, the carrying values of all of these financial instruments, except the portion of long-term debt with fixed interest rates, approximated fair value.
The following table summarizes the fair value of our long-term debt with fixed interest rates, which is estimated based on the published market prices for these debt obligations as of the dates presented:
December 31, 2014 | December 31, 2013 | ||||||||||||||
Fair Value | Carrying Value | Fair Value | Carrying Value | ||||||||||||
Senior Notes due 2019 | 234,000 | 300,000 | 307,500 | 300,000 | |||||||||||
Senior Notes due 2020 | 620,000 | 775,000 | 837,969 | 775,000 | |||||||||||
$ | 854,000 | $ | 1,075,000 | $ | 1,145,469 | $ | 1,075,000 | ||||||||
68
Recurring Fair Value Measurements
Certain financial assets and liabilities are measured at fair value on a recurring basis in our Consolidated Balance Sheets. The following tables summarize the valuation of those assets and liabilities as of the dates presented:
As of December 31, 2014 | ||||||||||||||||
Fair Value | Fair Value Measurement Classification | |||||||||||||||
Description | Measurement | Level 1 | Level 2 | Level 3 | ||||||||||||
Assets: | ||||||||||||||||
Commodity derivative assets – current | $ | 128,981 | $ | — | $ | 128,981 | $ | — | ||||||||
Commodity derivative assets – noncurrent | 35,897 | — | 35,897 | — | ||||||||||||
Assets of SERP | 4,123 | 4,123 | — | — | ||||||||||||
Liabilities: | ||||||||||||||||
Deferred compensation – SERP obligation and other | (4,178 | ) | (4,178 | ) | — | — | ||||||||||
As of December 31, 2013 | ||||||||||||||||
Fair Value | Fair Value Measurement Classification | |||||||||||||||
Description | Measurement | Level 1 | Level 2 | Level 3 | ||||||||||||
Assets: | ||||||||||||||||
Commodity derivative assets – current | $ | 3,830 | $ | — | $ | 3,830 | $ | — | ||||||||
Commodity derivative assets – noncurrent | 1,552 | — | 1,552 | — | ||||||||||||
Assets of SERP | 3,734 | 3,734 | — | — | ||||||||||||
Liabilities: | ||||||||||||||||
Commodity derivative liabilities – noncurrent | (10,141 | ) | — | (10,141 | ) | — | ||||||||||
Deferred compensation – SERP obligation and other | (3,879 | ) | (3,879 | ) | — | — | ||||||||||
Changes in economic conditions or model-based valuation techniques may require the transfer of financial instruments from one level of the fair value hierarchy to another level. In such instances, the transfer is deemed to have occurred at the beginning of the quarterly period in which the event or change in circumstances that caused the transfer occurred. There were no transfers during the years ended December 31, 2014, 2013 and 2012.
We used the following methods and assumptions to estimate fair values for the financial assets and liabilities described below:
• | Commodity derivatives: We determine the fair values of our commodity derivative instruments based on discounted cash flows derived from third-party quoted forward prices for West Texas Intermediate crude oil and NYMEX Henry Hub gas closing prices as of the end of the reporting periods. We generally use the income approach, using valuation techniques that convert future cash flows to a single discounted value. Each of these is a level 2 input. |
• | Assets of SERP: We hold various publicly traded equity securities in a Rabbi Trust as assets for funding certain deferred compensation obligations. The fair values are based on quoted market prices, which are level 1 inputs. |
• | Deferred compensation - SERP obligations: Certain of our deferred compensation obligations are ultimately to be settled in cash based on the underlying fair value of certain assets, including those held in the Rabbi Trust. The fair values are based on quoted market prices, which are level 1 inputs. |
Non-Recurring Fair Value Measurements
The most significant non-recurring fair value measurements utilized in the preparation of our Consolidated Financial Statements are those attributable to the recognition and measurement of net assets acquired, the recognition and measurement of asset impairments and the initial determination of AROs. The factors used to determine fair value for purposes of recognizing and measuring net assets acquired and asset impairments include, but are not limited to, estimates of proved and probable reserves, future commodity prices, indicative sales prices for properties, the timing of future production and capital expenditures and a discount rate commensurate with the risk reflective of the lives remaining for the respective oil and gas properties. Because these significant fair value inputs are typically not observable, we have categorized the amounts as level 3 inputs.
The determination of the fair value of AROs is based upon regional market and facility specific information. The amount of an ARO and the costs capitalized represent the estimated future cost to satisfy the abandonment obligation using current prices that are escalated by an assumed inflation factor after discounting the future cost back to the date that the abandonment obligation was incurred using a rate commensurate with the risk, which approximates our cost of funds. Because these significant fair value inputs are typically not observable, we have categorized the initial estimates as level 3 inputs.
69
12. | Commitments and Contingencies |
The following table sets forth our significant commitments as of December 31, 2014, by category, for the next five years and thereafter:
Year | Minimum Rentals | Drilling and Completion | Firm Transportation | Other Commitments | |||||||||||
2015 | $ | 1,967 | $ | 33,660 | $ | 2,002 | $ | 10,337 | |||||||
2016 | 1,873 | — | 1,095 | 19,057 | |||||||||||
2017 | 1,293 | — | 1,095 | 13,842 | |||||||||||
2018 | 675 | — | 1,095 | 13,688 | |||||||||||
2019 | 674 | — | 1,095 | 13,688 | |||||||||||
Thereafter | — | — | 9,672 | 68,512 | |||||||||||
Total | $ | 6,482 | $ | 33,660 | $ | 16,054 | $ | 139,124 | |||||||
Rental Commitments
Operating lease rental expense in the years ended December 31, 2014, 2013 and 2012 was $8.7 million, $9.4 million and $11.0 million, respectively, related primarily to field equipment, office equipment and office leases.
Drilling and Completion Commitments
We have agreements to purchase oil and gas well drilling and well completion services from third parties with original terms of up to two years. As of December 31, 2014, there were no well drilling or well completion agreements with terms that extended beyond December 31, 2015. The well drilling agreements include early termination provisions that require us to pay liquidated damages if we terminate the agreements prior to the end of their original terms. The amount of damages is based on the number of days remaining in the contractual term. As of December 31, 2014, the penalty amount would have been $17.2 million if we had terminated our agreements on that date.
Firm Transportation Commitments
We have entered into contracts that provide firm transportation capacity rights for specified volumes per day on various pipeline systems with terms that range from 1 to 15 years. The contracts require us to pay transportation demand charges regardless of the amount of the pipeline capacity we use. We may sell excess capacity to third parties at our discretion.
Other Commitments
We have entered into certain contractual arrangements for other products and services. We have minimum commitments under a natural gas gathering, compression and gas lift service agreement for a portion of our natural gas and NGL production, minimum commitments under crude oil gathering and intermediate transportation services agreements, information technology licensing and service agreements and certain consulting agreements, among others.
Legal
We are involved, from time to time, in various legal proceedings arising in the ordinary course of business. While the ultimate results of these proceedings cannot be predicted with certainty, our management believes that these claims will not have a material effect on our financial position, results of operations or cash flows. During 2010, we established a $0.9 million reserve for a litigation matter pertaining to certain properties that remains outstanding as of December 31, 2014.
Environmental Compliance
Extensive federal, state and local laws govern oil and gas operations, regulate the discharge of materials into the environment or otherwise relate to the protection of the environment. Numerous governmental departments issue rules and regulations to implement and enforce such laws that are often difficult and costly to comply with and which carry substantial administrative, civil and even criminal penalties for failure to comply. Some laws, rules and regulations relating to protection of the environment may, in certain circumstances, impose “strict liability” for environmental contamination, rendering a person liable for environmental and natural resource damages and cleanup costs without regard to negligence or fault on the part of such person. Other laws, rules and regulations may restrict the rate of oil and gas production below the rate that would otherwise exist or even prohibit exploration or production activities in sensitive areas. In addition, state laws often require some form of remedial action to prevent pollution from former operations, such as plugging of abandoned wells. As of December 31, 2014, we have recorded AROs of $5.9 million attributable to these activities. The regulatory burden on the oil and gas industry increases its cost of doing business and consequently affects its profitability. These laws, rules and regulations affect our operations, as well as the oil and gas exploration and production industry in general. We believe that we are in substantial compliance with current applicable environmental laws, rules and regulations and that continued compliance with existing
70
requirements will not have a material impact on our financial condition or results of operations. Nevertheless, changes in existing environmental laws or the adoption of new environmental laws, including any significant limitation on the use of hydraulic fracturing, have the potential to adversely affect our operations.
13. | Shareholders’ Equity |
Preferred Stock
In June 2014, we completed a registered offering of 32,500 shares of our 6% Series B Convertible Perpetual Preferred Stock (the “Series B Preferred Stock”) that provided $313.3 million of proceeds, net of underwriting fees and issuance costs.
The annual dividend on each share of the Series B Preferred Stock is 6.00% per annum on the liquidation preference of $10,000 per share and is payable quarterly, in arrears, on January 15, April 15, July 15 and October 15 of each year. We may, at our option, pay dividends in cash, common stock or a combination thereof.
Each share of the Series B Preferred Stock is convertible, at the option of the holder, into a number of shares of our common stock equal to the liquidation preference of $10,000 divided by the conversion price, which is initially $18.34 per share and is subject to specified anti-dilution adjustments. The initial conversion rate is equal to 545.17 shares of our common stock for each share of the Series B Preferred Stock. The initial conversion price represents a premium of 30 percent relative to the last reported sales price of $14.11 per share prior to the offering of the Series B Preferred Stock. The Series B Preferred Stock is not redeemable by us or the holders at any time. At any time on or after July 15, 2019, we may, at our option, cause all outstanding shares of the Series B Preferred Stock to be automatically converted into shares of our common stock at the then-applicable conversion price if the closing sale price of our common stock exceeds 130% of the then-applicable conversion price for a specified period prior to conversion. If a holder elects to convert shares of the Series B Preferred Stock upon the occurrence of certain specified fundamental changes, we may be obligated to deliver an additional number of shares above the applicable conversion rate to compensate the holder for lost option value.
In October 2012, we completed a registered offering of 11,500 shares of our 6% Series A Convertible Perpetual Preferred Stock (the “Series A Preferred Stock”) that provided $110.3 million of proceeds, net of underwriting fees and issuance costs.
The annual dividend on each share of the Series A Preferred Stock is 6.00% per annum on the liquidation preference of $10,000 per share and is payable quarterly, in arrears, on January 15, April 15, July 15 and October 15 of each year. We may, at our option, pay dividends in cash, common stock or a combination thereof.
Each share of the Series A Preferred Stock is convertible, at the option of the holder, into a number of shares of our common stock equal to the liquidation preference of $10,000 divided by the conversion price, which is initially $6.00 per share and is subject to specified anti-dilution adjustments. The initial conversion rate is equal to 1,666.67 shares of our common stock for each share of the Series A Preferred Stock. The initial conversion price represents a premium of 20 percent relative to the 2012 common stock offering price of $5.00 per share. The Series A Preferred Stock is not redeemable by us or the holders at any time. At any time on or after October 15, 2017, we may, at our option, cause all outstanding shares of the Series A Preferred Stock to be automatically converted into shares of our common stock at the then-applicable conversion price if the closing sale price of our common stock exceeds 130% of the then-applicable conversion price for a specified period prior to conversion. If a holder elects to convert shares of the Series A Preferred Stock upon the occurrence of certain specified fundamental changes, we may be obligated to deliver an additional number of shares above the applicable conversion rate to compensate the holder for lost option value.
Common Stock
Concurrent with the Series A Preferred Stock offering in October 2012, we completed a registered offering of 9.2 million shares of our common stock that provided $43.5 million of proceeds, net of underwriting fees and issuance costs. The proceeds from the combined offerings were used to repay outstanding borrowings under the Revolver and for general corporate purposes.
In 2014, a total of 3,555 shares of the Series A Preferred Stock were converted into 5.9 million shares of our common stock. We made payments of approximately $4.3 million to induce the conversion of substantially all of these shares.
In July 2012, we discontinued the quarterly dividend on our common stock.
Accumulated Other Comprehensive Income (Loss)
Accumulated other comprehensive income and losses are entirely attributable to our pension and postretirement benefit obligations. The accumulated income (losses), net of tax, were $0.2 million, $0.3 million and $(1.0) million as of December 31, 2014, 2013 and 2012, respectively.
71
Treasury Stock
A portion of the compensation paid to certain non-employee members of our board of directors is paid in deferred common stock units. Each deferred common stock unit represents one share of common stock, vests immediately upon issuance, and is available to the holder upon retirement from our board of directors. In addition, prior to 2012, certain of our employees made elective deferrals of compensation under the SERP, a portion of which was invested, at the employee’s direction, in our common stock.
Shares of our common stock held by the SERP and deferred common stock units that have not been converted into common stock are presented for financial reporting purposes as treasury stock carried at cost. A total of 262,070 and 233,063 shares were recorded as treasury stock as of December 31, 2014 and 2013, respectively.
14. | Share-Based Compensation |
The Penn Virginia Corporation 2013 Amended and Restated Long-Term Incentive Plan (the “LTI Plan”) permits the grant of incentive and nonqualified stock options, common stock, deferred common stock units, restricted stock and restricted stock units to our employees and directors. As of December 31, 2014, there were 2,899,309 shares available for issuance to employees and directors pursuant to the LTI Plan.
With the exception of performance-based restricted stock units (“PBRSUs”), all of the awards issued under our LTI Plan are classified as equity instruments because they result in the issuance of common stock on the date of grant, upon exercise or are otherwise payable in common stock upon vesting, as applicable. The compensation cost attributable to these awards is measured at the grant date and recognized over the applicable vesting period as a non-cash item of expense. Because the PBRSUs are payable in cash, they are considered liability-classified awards and are included in the Other liabilities caption on our Consolidated Balance Sheets. Compensation cost associated with the PBRSUs is measured at the end of each reporting period and recognized based on the period of time that has elapsed during each of the individual performance periods.
The following table summarizes share-based compensation expense recognized for the periods presented:
Year Ended December 31, | |||||||||||
2014 | 2013 | 2012 | |||||||||
Equity-classified awards: | |||||||||||
Stock option awards | $ | 1,598 | $ | 3,123 | $ | 4,424 | |||||
Common, deferred, restricted and restricted unit awards | 2,029 | 2,658 | 1,923 | ||||||||
3,627 | $ | 5,781 | $ | 6,347 | |||||||
Liability-classified awards | 4,520 | 4,116 | 714 | ||||||||
$ | 8,147 | $ | 9,897 | $ | 7,061 | ||||||
Stock Options
The exercise price of all stock options granted under the LTI Plan is equal to the fair market value of our common stock on the date of the grant. Options may be exercised at any time after vesting and prior to ten years following the date of grant. Options vest upon terms established by the compensation and benefits committee of our board of directors (the “Committee”). Generally, options vest over a three-year period, with one-third vesting in each year. In addition, all options will vest upon a change of control of us, as defined in the LTI Plan. In the case of employees, if a grantee’s employment terminates (i) for cause, all of the grantee’s options, whether vested or unvested, will be forfeited, (ii) by reason of death or disability, the grantee’s options will vest and remain exercisable for one year and (iii) for any other reason, the grantee’s unvested options will be forfeited and the grantee’s vested options will remain exercisable for 90 days. For awards granted in 2013, all of the grantee’s options will vest when the grantee becomes retirement eligible (age 62 and providing 10 consecutive years of service). For awards granted in 2012, all of the grantee’s options will vest if or when the grantee retires following becoming retirement eligible. We have historically issued new shares to satisfy stock option exercises.
72
The fair value of each option award is estimated on the date of grant using the Black-Scholes-Merton option-pricing formula that uses the assumptions noted in the following table. Expected volatilities are based on historical changes in the market value of our stock. Separate groups of employees that have similar historical exercise behavior are considered separately to estimate expected lives. Options granted have a maximum term of ten years. We base the risk-free interest rate on the U.S. Treasury rate for the week of the grant having a term equal to the expected life of the option.
2014 | 2013 | 2012 | |||
Expected volatility | 56.2% to 63.7% | 56.9% to 70.1% | 67.3% to 72.9% | ||
Dividend yield | 0.00% to 0.00% | 0.00% to 0.00% | 2.25% to 4.98% | ||
Expected life | 3.5 to 4.6 years | 3.5 to 4.6 years | 3.5 to 4.6 years | ||
Risk-free interest rate | 0.82% to 1.63% | 0.34% to 0.58% | 0.36% to 0.51% | ||
The following table summarizes activity for our most recent fiscal year with respect to stock options:
Shares Under Options | Weighted- Average Exercise Price | Weighted- Average Remaining Contractual Term | Aggregate Intrinsic Value | |||||||||
Outstanding at beginning of year | 3,129,069 | $ | 16.15 | |||||||||
Granted | 367,016 | 16.15 | ||||||||||
Exercised | (257,347 | ) | 5.55 | |||||||||
Forfeited or expired | (144,722 | ) | 19.24 | |||||||||
Outstanding at end of year | 3,094,016 | $ | 16.89 | 6.0 | $ | 2,005 | ||||||
Exercisable at end of year | 2,221,701 | $ | 19.90 | 5.0 | $ | 907 | ||||||
The weighted-average grant-date fair value of options granted during the years ended December 31, 2014, 2013 and 2012, respectively, was $7.46, $2.35 and $2.54 per option. The total intrinsic value of options exercised during the years ended December 31, 2014 and 2013 was $2.3 million and less than $0.1 million. There were no options exercised during 2012.
As of December 31, 2014, we had $2.8 million of unrecognized compensation cost related to unvested stock options. We expect that cost to be recognized over a weighted-average period of 1.0 years. The total grant-date fair values of stock options that vested in 2014, 2013 and 2012 were $1.8 million, $2.7 million and $4.7 million, respectively.
Common Stock
A portion of the compensation paid to certain non-employee members of our board of directors is paid in common stock. Each share of common stock granted as compensation vests immediately upon issuance. In 2014, 2013 and 2012 respectively, we granted 15,501, 77,598 and 79,700 shares of common stock to our non-employee directors at a weighted-average grant date fair value of $11.61, $5.39 and $5.33 per share.
Deferred Common Stock Units
A portion of the compensation paid to certain non-employee members of our board of directors is paid in deferred common stock units. Each deferred common stock unit represents one share of common stock, vests immediately upon issuance, and is available to the holder upon termination or retirement from our board of directors. Deferred common stock units awarded to directors receive all cash or other dividends we pay on shares of our common stock.
The following table summarizes activity for our most recent fiscal year with respect to awarded deferred common stock units:
Deferred Common Stock Units | Weighted-Average Grant Date Fair Value | |||||
Balance at beginning of year | 217,708 | $ | 13.01 | |||
Granted | 36,171 | 11.61 | ||||
Converted | — | — | ||||
Balance at end of year | 253,879 | $ | 12.81 | |||
As of December 31, 2014, 2013 and 2012, shareholders’ equity included deferred compensation obligations of $3.2 million, $2.8 million and $3.1 million, respectively, and corresponding amounts for treasury stock.
73
Restricted Stock
Restricted stock vests upon terms established by the Committee and as specified in the award agreement. Restricted stock vests generally over a three-year period, with one-third vesting in each year. We recognize compensation expense on a straight-line basis over the vesting period.
There were no unvested restricted stock awards outstanding and no restricted stock vested during 2014, 2013 and 2012.
Restricted Stock Units
A restricted stock unit entitles the grantee to receive a share of common stock upon the vesting of the restricted stock unit or, at the discretion of the Committee, the cash equivalent of the fair market value of a share of common stock. The Committee determines the time period over which restricted stock units will vest. In addition, all restricted stock units will vest upon a change of control of us. Unless and to the extent the Committee determines otherwise, (i) if an employee’s employment with us or our affiliates terminates for any reason other than death or disability, the grantee’s restricted stock units will be forfeited and (ii) if a grantee dies or becomes disabled, the grantee’s restricted stock units will vest. Awards granted prior to 2014 also vest if or when the grantee becomes retirement eligible. If restricted stock units vest early on account of retirement eligibility, payment on the restricted stock units will be made when the restricted stock units would have originally vested, even if that is after retirement. Restricted stock units generally vest over a three-year period, with one-third vesting in each year. Prior to 2013, the Committee, in its discretion, could grant tandem dividend equivalent rights with respect to restricted stock units. Beginning in 2013, the Committee may not grant dividend equivalent rights. A dividend equivalent right is a right to receive an amount in cash equal to, and 30 days after, the cash dividends made with respect to a share of common stock during the period such restricted stock unit is outstanding. Payments of dividend equivalent rights associated with restricted stock units that are expected to vest are recorded as dividends; payments associated with restricted stock units that are not expected to vest are recorded as compensation expense.
The following table summarizes activity for our most recent fiscal year with respect to awarded restricted stock units:
Restricted Stock Units | Weighted-Average Grant Date Fair Value | |||||
Balance at beginning of year 1 | 500,850 | $ | 4.42 | |||
Granted | 191,483 | 16.32 | ||||
Vested | (92,986 | ) | 6.29 | |||
Forfeited | — | — | ||||
Balance at end of year 1 | 599,347 | $ | 7.93 | |||
1 Excludes 346,777 units at the beginning of the year and 346,777 units at the end of year that have vested due to retirement eligibility, but have not yet been settled or converted to common shares.
As of December 31, 2014, we had $3.2 million of unrecognized compensation cost attributable to unvested restricted stock units. We expect that cost to be recognized over a weighted-average period of 1.1 years. The total grant-date fair values of restricted stock units that vested in 2014, 2013 and 2012 were $0.6 million, $1.7 million and $1.4 million, respectively.
Performance-Based Restricted Stock Units
In May 2014, May 2013 and February 2012, we granted PBRSUs to certain executive officers. Vested PBRSUs are payable solely in cash on the third anniversary of the date of grant based upon the achievement of specified market-based performance metrics with respect to each of a one-year, two-year and three-year performance period, in each case commencing on the date of grant. The number of PBRSUs vested can range from 0% to 200% of the initial grant. The PBRSUs do not have voting rights and do not participate in dividends.
Except as noted below, if the grantee’s employment terminates for any reason prior to the third anniversary of the grant date, then the grantee’s PBRSUs will be forfeited and no cash will be payable with respect to any PBRSUs. If the grantee’s employment terminates for any reason other than cause prior to the third anniversary of the grant date, then all of the grantee’s PBRSUs will vest and become payable in the amount and at the time the PBRSUs would have otherwise vested and been payable. Awards granted prior to 2014 also vest if or when the grantee becomes retirement eligible. If the grantee dies or becomes disabled prior to the third anniversary of the grant date, a pro-rated share (based on the number of days employed during the three-year vesting period) of the PBRSUs will vest and the grantee will be paid for such PBRSUs at the target percentage at the end of the end of the original three-year vesting period. In the event of a change in control of us, all of the grantee’s PBRSUs will immediately vest and the grantee will be paid for such PBRSUs following the change in control at the target percentage (regardless of our actual market-based performance) and using the value of our common stock on the effective date of the change in control (calculated as the closing price of our common stock on the effective date of the change in control).
74
The compensation cost of the PBRSUs is based on the fair value derived from a Monte Carlo model. The Monte Carlo model is a binomial valuation model that utilizes certain assumptions, including expected volatility, dividend yield, risk-free interest rates and a measure of total shareholder return.
The ranges for the assumptions used in the Monte Carlo model for the PBRSUs granted in 2014, 2013 and 2012 are as follows:
2014 | 2013 | 2012 | |||
Expected volatility | 52.6% to 72.3% | 51.3% to 66.7% | 29.3% to 78.0% | ||
Dividend yield | 0.0% to 0.0% | 0.0% to 0.0% | 0.0% to 5.3% | ||
Risk-free interest rate | 0.02% to 1.07% | 0.01% to 0.78% | 0.02% to 0.43% | ||
The following table summarizes activity for our most recent fiscal year with respect to PBRSUs:
Performance-Based Restricted Stock Units | Weighted-Average Fair Value | |||||
Balance at beginning of year | 561,310 | $ | 16.07 | |||
Granted | 97,606 | 19.21 | ||||
Forfeited | — | — | ||||
Balance at end of year | 658,916 | $ | 16.29 | |||
As of December 31, 2014, $2.9 million, representing amounts currently payable in cash in 2015, is included in the Accounts payable and accrued expenses caption and $6.4 million, which represents the fair value of the noncurrent outstanding PBRSUs, is included in the Other liabilities caption on our Consolidated Balance Sheets.
15. | Restructuring Activities |
In 2012, we completed an organizational restructuring in conjunction with the sale of our natural gas assets in West Virginia, Kentucky and Virginia. We terminated approximately 30 employees and closed our regional office in Canonsburg, Pennsylvania. We recorded a charge in connection with the early termination of the lease of that office. In addition, we have a contractual commitment for certain firm transportation capacity in the Appalachian region that expires in 2022 and, as a result of the sale, we no longer have production to satisfy this commitment. While we sell our unused firm transportation to the extent possible, we recognized an obligation representing the liability for estimated discounted future net cash outflows over the remaining term of the contract. The undiscounted amount payable on an annual basis for the each of the next five years is $2.7 million and a combined amount of $7.6 million is expected to be payable for 2020 through expiration in 2022.
During 2011, we completed an organizational restructuring, including the closing of our regional office in Tulsa, Oklahoma, due primarily to the sale of our Arkoma Basin properties. Accordingly, we recorded a charge and recognized an obligation in connection with the long-term lease of that office. We periodically adjust the lease obligation associated with the Tulsa office as a result of changes in estimated sub-lease rental income.
The following table summarizes our restructuring and exit activity-related obligations and the changes therein for the years ended December 31, 2014, 2013 and 2012:
2014 | 2013 | 2012 | |||||||||
Balance at beginning of period | $ | 16,090 | $ | 17,263 | $ | 576 | |||||
Employee, office and other costs accrued, net | 10 | 7 | 1,284 | ||||||||
Firm transportation charge | — | — | 17,332 | ||||||||
Accretion of obligations | 1,301 | 1,674 | 570 | ||||||||
Cash payments, net | (2,498 | ) | (2,854 | ) | (2,499 | ) | |||||
Balance at end of period | $ | 14,903 | $ | 16,090 | $ | 17,263 | |||||
Restructuring charges are included in the General and administrative caption on our Consolidated Statements of Operations. The initial charge for the firm transportation commitment was presented as a separate caption on our Consolidated Statements of Operations for the year ended December 31, 2012. The accretion of this obligation, net of any recoveries from the periodic sale of our contractual capacity, is charged as an offset to Other revenue.
The current portion of these restructuring and exit cost obligations is included in the Accounts payable and accrued expenses caption and the noncurrent portion is included in the Other liabilities caption on our Consolidated Balance Sheets. As of December 31, 2014, $2.9 million of the total obligations are classified as current while the remaining $12.0 million are classified as noncurrent.
75
16. | Impairments |
The following table summarizes impairment charges recorded during the periods presented:
Year Ended December 31, | |||||||||||
2014 | 2013 | 2012 | |||||||||
Oil and gas properties | $ | 791,809 | $ | 132,224 | $ | 103,417 | |||||
Other – tubular inventory and well materials | — | — | 1,067 | ||||||||
$ | 791,809 | $ | 132,224 | $ | 104,484 | ||||||
The following table summarizes the aggregate fair values of the assets described below, by asset category and the classification of inputs within the fair value measurement hierarchy, at the respective dates of impairment:
Fair Value | |||||||||||||||
Measurement | Level 1 | Level 2 | Level 3 | ||||||||||||
Year ended December 31, 2014: | |||||||||||||||
Long-lived assets held for use | $ | 65,203 | $ | — | $ | — | $ | 65,203 | |||||||
Long-lived assets sold during the year | 70,733 | — | — | 70,733 | |||||||||||
Year ended December 31, 2013: | |||||||||||||||
Long-lived assets held for use | $ | 93,945 | $ | — | $ | — | $ | 93,945 | |||||||
Year ended December 31, 2012: | |||||||||||||||
Long-lived assets held for use | $ | 14,801 | — | — | 14,801 | ||||||||||
Long-lived assets sold during the year | 96,099 | — | — | 96,099 | |||||||||||
In 2014, we recognized oil and gas asset impairments of: (i) $667.8 million in the East Texas, Granite Wash and Marcellus regions due to the substantial decline in current and expected future commodity prices in the fourth quarter of 2014, (ii) $6.1 million in connection with an uneconomic field drilled in the Mid-Continent region and (iii) $117.9 million to write-down our Selma Chalk assets in Mississippi triggered by the disposition of those properties. In 2013, we recognized oil and gas impairments of: (i) $121.8 million in the Granite Wash, (ii) $9.5 million in the Marcellus Shale and (iii) $0.9 million in the Selma Chalk, in each case due primarily to market declines in current and expected future natural gas prices. In 2012, we recognized a $28.4 million impairment of our assets in West Virginia, Kentucky and Virginia triggered by the disposition of these properties, and a $75.0 million impairment of our Marcellus Shale assets due primarily to market declines in natural gas prices and the resultant reduction in proved natural gas reserves. In 2012, we also recognized an impairment of $1.1 million attributable to tubular inventory and well materials.
17. | Interest Expense |
The following table summarizes the components of interest expense for the periods presented:
Year Ended December 31, | |||||||||||
2014 | 2013 | 2012 | |||||||||
Interest on borrowings and related fees | $ | 91,866 | $ | 80,263 | $ | 56,080 | |||||
Accretion of original issue discount 1 | — | 431 | 1,367 | ||||||||
Amortization of debt issuance costs | 4,197 | 3,413 | 2,695 | ||||||||
Capitalized interest 2 | (7,232 | ) | (5,266 | ) | (803 | ) | |||||
$ | 88,831 | $ | 78,841 | $ | 59,339 | ||||||
______________________
1 Includes accretion of original issue discount attributable to the 2016 Senior Notes that were retired in 2013 and the 4.50% Convertible Senior Subordinated Notes due 2012 that were retired in 2012.
2 The increase in capitalized interest in 2014 and 2013 compared to 2012 is attributable to a significant increase in qualifying activities that are in process to bring our Eagle Ford unproved and proved undeveloped properties, including those acquired in the EF Acquisition, into production.
76
18. | Earnings per Share |
The following table provides a reconciliation of the components used in the calculation of basic and diluted earnings per share for the periods presented:
Year Ended December 31, | |||||||||||
2014 | 2013 | 2012 | |||||||||
Net loss | $ | (409,592 | ) | $ | (143,070 | ) | $ | (104,589 | ) | ||
Less: Preferred stock dividends 1 | (17,148 | ) | (6,900 | ) | (1,687 | ) | |||||
Less: Induced conversion of preferred stock | (4,256 | ) | — | — | |||||||
Net loss attributable to common shareholders – basic and diluted | $ | (430,996 | ) | $ | (149,970 | ) | $ | (106,276 | ) | ||
Weighted-average shares – basic | 68,887 | 62,335 | 47,919 | ||||||||
Effect of dilutive securities 2 | — | — | — | ||||||||
Weighted-average shares – diluted | 68,887 | 62,335 | 47,919 | ||||||||
1 Preferred stock dividends were excluded from diluted earnings per share for the years ended December 31, 2014, 2013 and 2012, as the assumed conversion of the outstanding preferred stock would have been anti-dilutive.
2 For 2014, approximately 26.6 million potentially dilutive securities, including the Series A and Series B Preferred Stock, stock options and restricted stock units had the effect of being anti-dilutive and were excluded from the calculation of diluted earnings per common share. For 2013 and 2012, approximately 19.8 million and 19.2 million, respectively, potentially dilutive securities, including the Series A Preferred Stock, stock options and restricted stock units had the effect of being anti-dilutive and were excluded from the calculation of diluted earnings per common share.
77
Supplemental Quarterly Financial Information (Unaudited - see accompanying accountants’ report)
First Quarter | Second Quarter | Third Quarter | Fourth Quarter | ||||||||||||
2014 | |||||||||||||||
Revenues 1 | $ | 189,865 | $ | 139,361 | $ | 205,396 | $ | 102,151 | |||||||
Operating income (loss) 2 | $ | 71,684 | $ | (91,636 | ) | $ | 85,921 | $ | (681,954 | ) | |||||
Loss attributable to common shareholders 3 | $ | 17,503 | $ | (105,870 | ) | $ | 81,132 | $ | (423,761 | ) | |||||
Loss per share – basic 4 | $ | 0.27 | $ | (1.59 | ) | $ | 1.13 | $ | (5.90 | ) | |||||
Loss per share – diluted 4 | $ | 0.22 | $ | (1.59 | ) | $ | 0.87 | $ | (5.90 | ) | |||||
Weighted-average shares outstanding: | |||||||||||||||
Basic | 65,611 | 66,514 | 71,536 | 71,790 | |||||||||||
Diluted | 85,744 | 66,514 | 103,606 | 71,790 | |||||||||||
2013 | |||||||||||||||
Revenues | $ | 83,198 | $ | 109,655 | $ | 121,613 | $ | 117,002 | |||||||
Operating income (loss) 5 | $ | (2,959 | ) | $ | 3,240 | $ | (107,788 | ) | $ | 15,461 | |||||
Loss attributable to common shareholders 6 | $ | (18,108 | ) | $ | (27,163 | ) | $ | (100,625 | ) | $ | (4,074 | ) | |||
Loss per share – basic 4 | $ | (0.33 | ) | $ | (0.43 | ) | $ | (1.54 | ) | $ | (0.06 | ) | |||
Loss per share – diluted 4 | $ | (0.33 | ) | $ | (0.43 | ) | $ | (1.54 | ) | $ | (0.06 | ) | |||
Weighted-average shares outstanding: | |||||||||||||||
Basic | 55,341 | 62,899 | 65,465 | 65,490 | |||||||||||
Diluted | 55,341 | 62,899 | 65,465 | 65,490 | |||||||||||
1 Includes gains on sales of property and equipment of $56.8 million and $63.5 million during the quarters ended March 31, 2014 and September 30, 2014, respectively.
2 Includes impairments of oil and gas properties of $117.9 million, $6.1 million and $667.8 million during the quarters ended June 30, 2014, September 30, 2014 and December 31, 2014, respectively.
3 Includes other income of $154.1 million attributable to our commodity derivatives during the quarter ended December 31, 2014.
4 The sum of the quarters may not equal the total of the respective year’s earnings per common share due to changes in weighted-average shares outstanding throughout the year.
5 Includes impairments of oil and gas properties of $132.2 million during the quarter ended September 30, 2013.
6 Includes a loss on extinguishment of debt of $29.2 million attributable to the tender offer and the redemption of the 2016 Senior Notes during the quarter ended June 30, 2013.
78
Supplemental Information on Oil and Gas Producing Activities (Unaudited - see accompanying accountants’ report)
Oil and Gas Reserves
All of our proved oil and gas reserves are located in the continental United States. The estimates of our proved oil and gas reserves were prepared by our independent third party engineers, Wright & Company, Inc. utilizing data compiled by us. Wright & Company, Inc. is an independent firm of petroleum engineers, geologists, geophysicists and petro physicists. Our Vice President, Operations & Engineering is primarily responsible for overseeing the preparation of the reserve estimate by Wright & Company, Inc.
Reserve engineering is a process of estimating underground accumulations of oil and gas that cannot be measured in an exact manner, and the accuracy of any reserve estimate is a function of the quality of available data and of engineering and geological interpretation and judgment. The quantities of crude oil, NGLs and natural gas that are ultimately recovered, production and operating costs, the amount and timing of future development expenditures and future prices for these commodities may all differ from those assumed. In addition, reserve estimates of new discoveries are more imprecise than those of properties with a production history. Accordingly, these estimates are subject to change as additional information becomes available.
The following table sets forth our estimate of net quantities of proved reserves, including changes therein and proved developed and proved undeveloped reserves for the periods presented:
Oil | NGLs | Natural Gas | Total Equivalents | ||||||||
Proved Developed and Undeveloped Reserves | (MBbl) | (MBbl) | (MMcf) | (MBOE) | |||||||
December 31, 2011 | 14,079 | 21,491 | 669,913 | 147,223 | |||||||
Revisions of previous estimates | (439 | ) | (2,495 | ) | (154,372 | ) | (28,662 | ) | |||
Extensions, discoveries and other additions | 13,444 | 2,578 | 13,405 | 18,255 | |||||||
Production | (2,252 | ) | (884 | ) | (20,261 | ) | (6,513 | ) | |||
Purchase of reserves | 39 | 1 | 6 | 41 | |||||||
Sale of reserves in place | (20 | ) | — | (101,172 | ) | (16,882 | ) | ||||
December 31, 2012 | 24,851 | 20,691 | 407,519 | 113,462 | |||||||
Revisions of previous estimates | (4,400 | ) | (5,298 | ) | (111,939 | ) | (28,355 | ) | |||
Extensions, discoveries and other additions | 34,077 | 6,510 | 36,297 | 46,637 | |||||||
Production | (3,435 | ) | (983 | ) | (14,435 | ) | (6,824 | ) | |||
Purchase of reserves | 9,604 | 1,046 | 4,651 | 11,425 | |||||||
Sale of reserves in place | — | — | — | — | |||||||
December 31, 2013 | 60,697 | 21,966 | 322,093 | 136,345 | |||||||
Revisions of previous estimates | (8,286 | ) | (7,727 | ) | (98,386 | ) | (32,411 | ) | |||
Extensions, discoveries and other additions | 21,427 | 6,090 | 31,842 | 32,824 | |||||||
Production | (4,644 | ) | (1,110 | ) | (13,084 | ) | (7,934 | ) | |||
Purchase of reserves | — | — | — | — | |||||||
Sale of reserves in place | (188 | ) | — | (83,200 | ) | (14,055 | ) | ||||
December 31, 2014 | 69,006 | 19,219 | 159,265 | 114,769 | |||||||
Proved Developed Reserves: | |||||||||||
December 31, 2012 | 10,472 | 8,266 | 169,449 | 46,980 | |||||||
December 31, 2013 | 19,306 | 8,541 | 163,161 | 55,041 | |||||||
December 31, 2014 | 22,054 | 8,065 | 94,565 | 45,880 | |||||||
Proved Undeveloped Reserves: | |||||||||||
December 31, 2012 | 14,379 | 12,425 | 238,070 | 66,482 | |||||||
December 31, 2013 | 41,391 | 13,425 | 158,932 | 81,304 | |||||||
December 31, 2014 | 46,952 | 11,154 | 64,700 | 68,889 | |||||||
79
The following is a discussion and analysis of the significant changes in our proved reserve estimates for the periods presented:
Year Ended December 31, 2014
We had downward revisions of 32.4 MMBOE primarily as a result of the following: (i) downward revisions of 20.7 MMBOE due to the removal of proved undeveloped locations that would not be developed within five years primarily in the Cotton Valley and Haynesville Shale (19.1 MMBOE) and the Granite Wash (1.6 MMBOE), (ii) downward revisions of 8.3 MMBOE (4.5 MMBOE of proved developed and 3.8 MMBOE of proved undeveloped) attributable to certain proved wells in the Eagle Ford and (iii) downward revisions of 3.4 MMBOE due to well performance issues (2.3 MMBOE in the Cotton Valley and Haynesville Shale and 1.1 MMBOE in the Granite Wash). We added 32.8 MMBOE due primarily to the drilling of 84 gross (51.6 net) wells and the addition of proved undeveloped locations in the Eagle Ford. We sold our Selma Chalk assets in Mississippi as well as certain wells in Oklahoma resulting in a decrease of 14.1 MMBOE.
Year Ended December 31, 2013
We had downward revisions of 28.4 MMBOE primarily as a result of the following: (i) downward revisions of 20.1 MMBOE due to the removal of proved undeveloped locations that would not be developed within five years primarily in the Haynesville Shale (8.3 MMBOE), Cotton Valley (7.1 MMBOE), Selma Chalk (3.7 MMBOE) and all other locations combined, including the Granite Wash and Marcellus Shale (1.0 MMBOE), (ii) downward revisions in the Eagle Ford due primarily to the elimination of certain locations (2.2 MMBOE) and revisions to existing locations (2.5 MMBOE) attributable to changes in our development plans including the effects of reduced down-spacing, (iii) downward revisions of 5.8 MMBOE due to well performance issues, primarily in the Haynesville Shale, the Cotton Valley and the Selma Chalk and (iv) the effects of non-participation and lease expirations (0.3 MMBOE) partially offset by (v) favorable price revisions (2.5 MMBOE) for oil and natural gas. We added 46.6 MMBOE due primarily to the drilling of 59 gross (34.6 net) wells and the addition of proved undeveloped locations as well as 11.4 MMBOE from the EF Acquisition in the Eagle Ford.
Year Ended December 31, 2012
We had downward revisions of 28.7 MMBOE primarily as a result of the following: (i) downward revisions of 5.0 MMBOE due to well performance issues, interest changes and economic limits due to operating conditions, including lease operating expense and basis differentials, primarily in the Selma Chalk, the Granite Wash, the Cotton Valley, and the Haynesville and Marcellus Shales, (ii) downward revisions of 15.0 MMBOE due to lower natural gas prices which significantly reduced the number of proved undeveloped locations in the Marcellus Shale and Selma Chalk and (iii) downward revisions of 8.7 MMBOE due to the removal of 38 proved undeveloped locations that would not be developed within five years primarily in the Selma Chalk, the Cotton Valley and the Haynesville Shale. We added 18.3 MMBOE due primarily to the drilling of 18 wells and the addition of 48 proved undeveloped locations in the Eagle Ford.
Capitalized Costs Relating to Oil and Gas Producing Activities
The following table sets forth capitalized costs related to our oil and gas producing activities and accumulated DD&A for the periods presented:
As of December 31, | |||||||||||
2014 | 2013 | 2012 | |||||||||
Oil and gas properties: | |||||||||||
Proved | $ | 3,506,603 | $ | 2,970,047 | $ | 2,277,811 | |||||
Unproved | 125,676 | 101,520 | 60,746 | ||||||||
Total oil and gas properties | 3,632,279 | 3,071,567 | 2,338,557 | ||||||||
Other property and equipment | 55,601 | 87,412 | 76,282 | ||||||||
Total capitalized costs relating to oil and gas producing activities | 3,687,880 | 3,158,979 | 2,414,839 | ||||||||
Accumulated depreciation and depletion | (1,865,873 | ) | (924,667 | ) | (693,123 | ) | |||||
Net capitalized costs relating to oil and gas producing activities 1 | $ | 1,822,007 | $ | 2,234,312 | $ | 1,721,716 | |||||
1 Excludes property and equipment attributable to our corporate operations which is comprised of certain capitalized hardware, software and office furniture and fixtures.
80
Costs Incurred in Certain Oil and Gas Activities
The following table summarizes costs incurred in our oil and gas property acquisition, exploration and development activities for the periods presented:
Year Ended December 31, | |||||||||||
2014 | 2013 | 2012 | |||||||||
Proved property acquisition costs 1 | $ | — | $ | 277,888 | $ | — | |||||
Unproved property acquisition costs 1 | 98,443 | 188,202 | 27,775 | ||||||||
Exploration costs 2 | 5,965 | 16,833 | 50,883 | ||||||||
Development costs and other 3 | 690,277 | 422,540 | 305,693 | ||||||||
Total costs incurred | $ | 794,685 | $ | 905,463 | $ | 384,351 | |||||
1 Acquisition costs in 2013 includes $277.9 million and $119.7 million of proved and unproved property attributable to the EF Acquisition.
2 Includes geological and geophysical costs of $5.1 million, $2.9 million and $0.8 million and delay rentals of $0.9 million, $0.7 million and $0.6 million during the years ended December 31, 2014, 2013 and 2012, respectively.
3 Includes drilling rig termination charges of $0.8 million during the year ended December 31, 2014, that were charged to exploration expense. Does not include non-cash ARO assets of $0.4 million, $1.7 million and $0.1 million that were added to capitalized costs relating to oil and gas producing activities during the years ended December 31, 2014, 2013 and 2012, respectively.
Standardized Measure of Discounted Future Net Cash Flows Relating to Proved Oil and Gas Reserves
Future cash inflows were computed by applying the average prices of oil and gas during the 12-month period prior to the period end, determined as an unweighted arithmetic average of the first-day-of-the-month price for each month within the period and estimated costs as of that fiscal year end, to the estimated future production of proved reserves. Future prices actually received may materially differ from current prices or the prices used in the standardized measure.
Future production and development costs represent the estimated future expenditures (based on current costs) to be incurred in developing and producing the proved reserves, assuming continuation of existing economic conditions. Future income tax expenses were computed by applying statutory income tax rates to the difference between pre-tax net cash flows relating to our proved reserves and the tax basis of proved oil and gas properties. In addition, the effects of statutory depletion in excess of tax basis, available NOL carryforwards and alternative minimum tax credits were used in computing future income tax expense. The resulting annual net cash inflows were then discounted using a 10% annual rate.
The standardized measure of discounted future net cash flows is not intended, and should not be interpreted, to represent the fair value of our oil and gas reserves. An estimate of the fair value would also consider, among other things, the recovery of reserves not presently classified as proved, anticipated future changes in prices and cost, and a discount factor more representative of economic conditions and risks inherent in reserve estimates. Accordingly, the changes in standardized measure reflected above do not necessarily represent the economic reality of such transactions.
Crude oil and natural gas prices were based on average (beginning of month basis) sales prices per Bbl and MMBtu with the representative price of natural gas adjusted for basis premium and energy content to arrive at the appropriate net price. NGL prices were estimated as a percentage of the base crude oil price. The following table summarizes the price measurements utilized, by product, with respect to our estimates of proved reserves as well as in the determination of the standardized measure of the discounted future net cash flows for the periods presented:
Crude Oil | NGLs | Natural Gas | |||||||||
$ per Bbl | $ per Bbl | $ per MMBtu | |||||||||
As of December 31, 2012 | $ | 102.24 | $ | 39.48 | $ | 2.47 | |||||
As of December 31, 2013 | $ | 103.11 | $ | 31.10 | $ | 3.47 | |||||
As of December 31, 2014 | $ | 92.91 | $ | 25.49 | $ | 4.32 | |||||
81
The following table sets forth the standardized measure of the discounted future net cash flows attributable to our proved reserves for the periods presented:
Year Ended December 31, | |||||||||||
2014 | 2013 | 2012 | |||||||||
Future cash inflows | $ | 7,589,354 | $ | 8,059,089 | $ | 4,365,357 | |||||
Future production costs | (2,239,491 | ) | (2,193,925 | ) | (1,206,478 | ) | |||||
Future development costs | (2,175,530 | ) | (2,111,918 | ) | (1,118,859 | ) | |||||
Future net cash flows before income tax | 3,174,333 | 3,753,246 | 2,040,020 | ||||||||
Future income tax expense | (686,562 | ) | (973,680 | ) | (548,132 | ) | |||||
Future net cash flows | 2,487,771 | 2,779,566 | 1,491,888 | ||||||||
10% annual discount for estimated timing of cash flows | (1,305,326 | ) | (1,515,788 | ) | (994,014 | ) | |||||
Standardized measure of discounted future net cash flows | $ | 1,182,445 | $ | 1,263,778 | $ | 497,874 | |||||
Changes in Standardized Measure of Discounted Future Net Cash Flows Relating to Proved Oil and Gas Reserves
The following table summarizes the changes in the standardized measure of the discounted future net cash flows attributable to our proved reserves for the periods presented:
Year Ended December 31, | |||||||||||
2014 | 2013 | 2012 | |||||||||
Sales of oil and gas, net of production costs | $ | (418,300 | ) | $ | (359,989 | ) | $ | (254,388 | ) | ||
Net changes in prices and production costs | (222,349 | ) | 49,214 | (207,045 | ) | ||||||
Extensions, discoveries and other additions | 261,410 | 995,858 | 355,495 | ||||||||
Development costs incurred during the period | 380,650 | 79,964 | 119,706 | ||||||||
Revisions of previous quantity estimates | (614,497 | ) | (260,440 | ) | (196,152 | ) | |||||
Purchases of reserves-in-place | — | 219,414 | 1,156 | ||||||||
Sale of reserves-in-place | (44,805 | ) | — | (116,151 | ) | ||||||
Accretion of discount | 171,663 | 69,247 | 87,441 | ||||||||
Net change in income taxes | 162,842 | (258,254 | ) | 25,312 | |||||||
Other changes | 242,053 | 230,890 | 28,004 | ||||||||
Net increase (decrease) | (81,333 | ) | 765,904 | (156,622 | ) | ||||||
Beginning of year | 1,263,778 | 497,874 | 654,496 | ||||||||
End of year | $ | 1,182,445 | $ | 1,263,778 | $ | 497,874 | |||||
82
Item 9 | Changes in and Disagreements With Accountants on Accounting and Financial Disclosure |
None.
Item 9A | Controls and Procedures |
(a) Disclosure Controls and Procedures
Under the supervision and with the participation of our management, including our Chief Executive Officer and our Chief Financial Officer, we performed an evaluation of the design and operation of our disclosure controls and procedures (as defined in Rule 13a-15(e) of the Exchange Act) as of December 31, 2014. Our disclosure controls and procedures are designed to ensure that information required to be disclosed by us in the reports we file or submit under the Exchange Act is recorded, processed, summarized and reported accurately and on a timely basis. Based on that evaluation, our Chief Executive Officer and our Chief Financial Officer concluded that, as of December 31, 2014, such disclosure controls and procedures were effective.
(b) Management’s Annual Report on Internal Control Over Financial Reporting
Our management, including our Chief Executive Officer and our Chief Financial Officer, is responsible for establishing and maintaining adequate internal control over our financial reporting. Our management assessed the effectiveness of our internal control over financial reporting as of December 31, 2014. This evaluation was completed based on the framework established in Internal Control—Integrated Framework (1992) issued by the Committee of Sponsoring Organizations of the Treadway Commission.
Our management has concluded that, as of December 31, 2014, our internal control over financial reporting was effective.
(c) Attestation Report of the Registered Public Accounting Firm
KPMG LLP, an independent registered public accounting firm, has issued an attestation report on the internal control over financial reporting as of December 31, 2014, which is included in Item 8 of this Annual Report on Form 10-K.
(d) Changes in Internal Control Over Financial Reporting
No changes were made in our internal control over financial reporting that occurred during our last fiscal quarter that have materially affected, or are reasonably likely to materially affect, our internal control over financial reporting.
Item 9B | Other Information |
There was no information that was required to be disclosed by us on a Current Report on Form 8-K during the fourth quarter of 2014 that we did not disclose.
83
Part III
Item 10 | Directors, Executive Officers and Corporate Governance |
In accordance with General Instruction G(3), reference is hereby made to the Company’s definitive proxy statement to be filed within 120 days after the end of the fiscal year covered by this Annual Report on Form 10-K.
Item 11 | Executive Compensation |
In accordance with General Instruction G(3), reference is hereby made to the Company’s definitive proxy statement to be filed within 120 days after the end of the fiscal year covered by this Annual Report on Form 10-K.
Item 12 | Security Ownership of Certain Beneficial Owners and Management and Related Shareholder Matters |
In accordance with General Instruction G(3), reference is hereby made to the Company’s definitive proxy statement to be filed within 120 days after the end of the fiscal year covered by this Annual Report on Form 10-K.
Item 13 | Certain Relationships and Related Transactions, and Director Independence |
In accordance with General Instruction G(3), reference is hereby made to the Company’s definitive proxy statement to be filed within 120 days after the end of the fiscal year covered by this Annual Report on Form 10-K.
Item 14 | Principal Accountant Fees and Services |
In accordance with General Instruction G(3), reference is hereby made to the Company’s definitive proxy statement to be filed within 120 days after the end of the fiscal year covered by this Annual Report on Form 10-K.
84
Part IV
Item 15 | Exhibit and Financial Statement Schedules |
The following documents are included as exhibits to this Annual Report on Form 10-K. Those exhibits incorporated by reference are indicated as such in the parenthetical following the description. All other exhibits are included herewith.
(1) | Financial Statements — The financial statements filed herewith are listed in the Index to Consolidated Financial Statements on page 50 of this Annual Report on Form 10-K. |
(2.1) | Purchase and Sale Agreement, dated May 30, 2014, by and between Penn Virginia Oil & Gas Corporation and KKR Management Holdings L.P. (incorporated by reference to Exhibit 2.1 to Registrant’s Current Report on Form 8-K filed on June 2, 2014). |
(3.1) | Restated Articles of Incorporation of Penn Virginia Corporation (incorporated by reference to Exhibit 3.1 to Registrant’s Current Report on Form 8-K filed on July 30, 2013). |
(3.1.1) | Articles of Amendment of the Restated Articles of Incorporation of Penn Virginia Corporation (incorporated by reference to Exhibit 3.1 to Registrant’s Current Report on Form 8-K filed on June 16, 2014). |
(3.2) | Amended and Restated Bylaws of Penn Virginia Corporation (incorporated by reference to Exhibit 3.2 to Registrant’s Current Report on Form 8-K filed on June 16, 2014). |
(4.1) | Senior Indenture dated June 15, 2009 among Penn Virginia Corporation, as Issuer, the Subsidiary Guarantors named therein, and Wells Fargo Bank, National Association, as Trustee (incorporated by reference to Exhibit 4.1 to Registrant’s Current Report on Form 8-K filed on June 16, 2009). |
(4.1.1) | First Supplemental Indenture relating to the 10.375% Senior Notes due 2016, dated June 15, 2009, among Penn Virginia Corporation, as Issuer, the Subsidiary Guarantors named therein and Wells Fargo Bank, National Association, as Trustee (incorporated by reference to Exhibit 4.1 to Registrant’s Current Report on Form 8-K/A filed on June 18, 2009). |
(4.1.2) | Second Supplemental Indenture relating to the 10.375% Senior Notes due 2016, dated April 4, 2011, among Penn Virginia Corporation, as Issuer, the Subsidiary Guarantors named therein and Wells Fargo Bank, National Association, as Trustee (incorporated by reference to Exhibit 4.1 to Registrant’s Current Report on Form 8-K filed on April 5, 2011). |
(4.1.3) | Third Supplemental Indenture relating to the 7.25% Senior Notes due 2019, dated April 13, 2011, among Penn Virginia Corporation, as Issuer, the Subsidiary Guarantors named therein and Wells Fargo Bank, National Association, as Trustee (incorporated by reference to Exhibit 4.2 to Registrant’s Current Report on Form 8-K filed on April 14, 2011). |
(4.1.4) | Form of Note for 7.25% Senior Notes due 2019 (incorporated by reference to Annex A to Exhibit 4.3 to Registrant’s Current Report on Form 8-K filed on April 14, 2011). |
(4.1.5) | Fourth Supplemental Indenture relating to the 8.500% Senior Notes due 2020, dated April 24, 2013, among Penn Virginia Corporation, as Issuer, the Subsidiary Guarantors named therein and Wells Fargo Bank, National Association, as Trustee (incorporated by reference to Exhibit 4.2 to Registrant’s Current Report on Form 8-K filed on April 29, 2013). |
(4.1.6) | Form of 8.500% Senior Notes due 2020 (incorporated by reference to Exhibit 4.3 contained in Exhibit 1 to Exhibit 4.2 to Registrant’s Current Report on Form 8-K filed on April 29, 2013). |
(4.1.7) | Fifth Supplemental Indenture relating to the 10.375% Senior Notes due 2016, dated April 24, 2013, among Penn Virginia Corporation, as Issuer, the Subsidiary Guarantors named therein and Wells Fargo Bank, National Association, as Trustee (incorporated by reference to Exhibit 4.6 to Registrant’s Current Report on Form 8-K filed on April 29, 2013). |
(4.2) | Deposit Agreement, dated October 17, 2012, among Penn Virginia Corporation, American Stock Transfer & Trust Company, LLC and the holders from time to time of the depositary shares described therein (incorporated by reference to Exhibit 4.1 to Registrant’s Current Report on Form 8-K filed on October 17, 2012). |
(4.2.1) | Form of depositary receipt representing the Depositary Shares (incorporated by reference to Exhibit A to Exhibit 4.1 to Registrant’s Current Report on Form 8-K filed on October 17, 2012). |
(4.3) | Deposit Agreement, dated June 16, 2014, among Penn Virginia Corporation, American Stock Transfer & Trust Company, LLC and the holders from time to time of the depositary receipts described therein (incorporated by reference to Exhibit 4.1 to Registrant’s Current Report on Form 8-K filed on June 16, 2014). |
(4.3.1) | Form of depositary receipt representing the Depositary Shares (incorporated by reference to Exhibit A to Exhibit 4.1 to Registrant’s Current Report on Form 8-K filed on June 16, 2014). |
(10.1) | Credit Agreement dated as of September 28, 2012 among Penn Virginia Holding Corp., as borrower, Penn Virginia Corporation, as parent, the lenders party thereto and Wells Fargo Bank, National Association, as administrative agent (incorporated by reference to Exhibit 10.1 to Registrant’s Current Report on Form 8-K filed on October 2, 2012). |
(10.1.1) | Waiver and First Amendment to Credit Agreement dated as of April 2, 2013 by and among Penn Virginia Holding Corp., as borrower, Penn Virginia Corporation, as parent, the lenders party thereto and Wells Fargo Bank, National Association, as administrative agent (incorporated by reference to Exhibit 10.1 to Registrant’s Current Report on Form 8-K filed on April 3, 2013). |
85
(10.1.2) | Waiver and Second Amendment to Credit Agreement dated as of April 2, 2013 by and among Penn Virginia Holding Corp., as borrower, Penn Virginia Corporation, as parent, the lenders party thereto and Wells Fargo Bank, National Association, as administrative agent (incorporated by reference to Exhibit 10.1 to Registrant’s Current Report on Form 8-K filed on April 11, 2013). |
(10.1.3) | Assignment and Third Amendment to Credit Agreement dated as of May 20, 2013 by and among Penn Virginia Holding Corp., as borrower, Penn Virginia Corporation, as parent, the lenders party thereto and Wells Fargo Bank, National Association, as administrative agent (incorporated by reference to Exhibit 10.1 to Registrant’s Current Report on Form 8-K filed on June 3, 2013). |
(10.1.4) | Assignment and Fourth Amendment to Credit Agreement dated as of October 28, 2013 by and among Penn Virginia Holding Corp., as borrower, Penn Virginia Corporation, as parent, the lenders party thereto and Wells Fargo Bank, National Association, as administrative agent (incorporated by reference to Exhibit 10.1 to Registrant’s Current Report on Form 8-K filed on October 30, 2013). |
(10.1.5) | Fifth Amendment and Borrowing Base Redetermination dated as of May 12, 2014 among Penn Virginia Holding Corp., as borrower, Penn Virginia Corporation, as parent, the lenders party thereto and Wells Fargo Bank, National Association, as administrative agent (incorporated by reference to Exhibit 10.1 to Registrant’s Current Report on Form 8-K filed on May 15, 2014). |
(10.1.6) | Sixth Amendment to Credit Agreement dated as of June 16, 2014 by and among Penn Virginia Holding Corp., as borrower, Penn Virginia Corporation, as parent, the lenders party thereto and Wells Fargo Bank, National Association, as administrative agent (incorporated by reference to Exhibit 10.1 to Registrant’s Current Report on Form 8-K filed on June 16, 2014). |
(10.1.7) | Seventh Amendment and Borrowing Base Redetermination dated as of October 23, 2014 among Penn Virginia Holding Corp., as borrower, Penn Virginia Corporation, as parent, the lenders party thereto and Wells Fargo Bank, National Association, as administrative agent (incorporated by reference to Exhibit 10.1 to Registrant’s Current Report on Form 8-K filed on October 27, 2014). |
(10.1.8) | Eighth Amendment to Credit Agreement dated as of November 7, 2014 by and among Penn Virginia Holding Corp., as borrower, Penn Virginia Corporation, as parent, the lenders party thereto and Wells Fargo Bank, National Association, as administrative agent (incorporated by reference to Exhibit 10.1 to Registrant’s Current Report on Form 8-K filed on November 12, 2014). |
(10.2) | Penn Virginia Corporation Supplemental Employee Retirement Plan (incorporated by reference to Exhibit 10.1 to Registrant’s Current Report on Form 8-K filed on October 29, 2007).* |
(10.2.1) | Amendment 2009-1 to the Penn Virginia Corporation Supplemental Employee Retirement Plan (incorporated by reference to Exhibit 10.4.1 to Registrant’s Annual Report on Form 10-K for the year ended December 31, 2011).* |
(10.3) | Penn Virginia Corporation Amended and Restated Non-Employee Directors Deferred Compensation Plan (incorporated by reference to Exhibit 10.2 to Registrant’s Current Report on Form 8-K filed on October 29, 2007).* |
(10.3.1) | Amendment One to the Penn Virginia Corporation Amended and Restated Non-Employee Directors Deferred Compensation Plan (incorporated by reference to Exhibit 10.1 to Registrant’s Current Report on Form 8-K filed on May 6, 2011).* |
(10.4) | Penn Virginia Corporation Fifth Amended and Restated 1995 Directors’ Compensation Plan (incorporated by reference to Exhibit 10.29 to Registrant’s Annual Report on Form 10-K for the year ended December 31, 2007). * |
(10.4.1) | Form of Agreement for Deferred Common Stock Unit Grants under the Penn Virginia Corporation Fifth Amended and Restated 1995 Directors’ Compensation Plan (incorporated by reference to Exhibit 10.30 to Registrant’s Annual Report on Form 10-K for the year ended December 31, 2007).* |
(10.5) | Penn Virginia Corporation 2013 Amended and Restated Long-Term Incentive Plan (incorporated by reference to Exhibit 10.1 to Registrant’s Current Report on Form 8-K filed on May 3, 2013).* |
(10.5.1) | Form of Agreement for Restricted Stock Unit Awards under the Penn Virginia Corporation 2013 Amended and Restated Long-Term Incentive Plan (incorporated by reference to Exhibit 10.2 to Registrant’s Current Report on Form 8-K filed on May 3, 2013).* |
(10.5.2) | Form of Agreement for Performance Based Restricted Stock Unit Awards under the Penn Virginia Corporation 2013 Amended and Restated Long-Term Incentive Incentive Plan (incorporated by reference to Exhibit 10.3 to Registrant’s Current Report on Form 8-K filed on May 3, 2013).* |
(10.5.3) | Form of Agreement for Stock Option Grants under the Penn Virginia Corporation Amended and Restated 2013 Long-Term Incentive Plan (incorporated by reference to Exhibit 10.4 to Registrant’s Current Report on Form 8-K filed on May 3, 2013).* |
(10.5.4) | Form of Agreement for Deferred Common Stock Unit Awards under the Penn Virginia Corporation 2013 Amended and Restated Long-Term Incentive Plan (incorporated by reference to Exhibit 10.1 to Registrant’s Current Report on Form 8-K filed on July 30, 2013).* |
(10.5.5) | 2014 Form of Agreement for Restricted Stock Unit Awards under the Penn Virginia Corporation 2013 Amended and Restated Long-Term Incentive Plan.* |
(10.5.6) | 2014 Form of Agreement for Performance Based Restricted Stock Unit Awards under the Penn Virginia Corporation 2013 Amended and Restated Long-Term Incentive Incentive Plan.* |
(10.5.7) | 2014 Form of Agreement for Stock Option Grants under the Penn Virginia Corporation Amended and Restated 2013 Long-Term Incentive Plan.* |
86
(10.6) | Amended and Restated Executive Change of Control Severance Agreement dated December 20, 2012 between Penn Virginia Corporation and H. Baird Whitehead (incorporated by reference to Exhibit 10.1 to Registrant’s Current Report on Form 8-K filed on December 21, 2012).* |
(10.7) | Amended and Restated Executive Change of Control Severance Agreement dated December 20, 2012 between Penn Virginia Corporation and Nancy M. Snyder (incorporated by reference to Exhibit 10.2 to Registrant’s Current Report on Form 8-K filed on December 21, 2012).* |
(10.8) | Amended and Restated Executive Change of Control Severance Agreement dated December 20, 2012 between Penn Virginia Corporation and Steven A. Hartman (incorporated by reference to Exhibit 10.3 to Registrant’s Current Report on Form 8-K filed on December 21, 2012).* |
(10.9) | Executive Change of Control Severance Agreement dated January 29, 2013 between Penn Virginia Corporation and John A. Brooks (incorporated by reference to Exhibit 10.1 to Registrant’s Current Report on Form 8-K filed on February 1, 2013). * |
(10.10) | Amended and Restated Change of Location Severance Agreement dated December 20, 2012 between Penn Virginia Corporation and Nancy M. Snyder (incorporated by reference to Exhibit 10.4 to Registrant’s Current Report on Form 8-K filed on December 21, 2012).* |
(10.11) | Penn Virginia Corporation Amended and Restated Annual Incentive Cash Bonus and Long-Term Equity Compensation Guidelines (incorporated by reference to Exhibit 10.1 to Registrant’s Current Report on Form 8-K/A filed on February 19, 2014).* |
(10.12) | Purchase and Sale Agreement dated December 13, 2013, by and among Penn Virginia Oil & Gas, L.P., Ted Collins, Jr., Plein Sud Holdings, LLC as sellers and HPIP LaVaca, LLC as buyer (incorporated by reference to Exhibit 10.14 to Registrant’s Annual Report on Form 10-K for the year ended December 31, 2013). |
(10.13) | Construction and Field Gathering Agreement dated July 30, 2014 by and between Penn Virginia Oil & Gas, L.P. and Republic Midstream, LLC (incorporated by reference to Exhibit 10.1 to Registrant’s Quarterly Report on Form 10-Q for the quarter ended September 30, 2014). |
(12.1) | Statement of Computation of Ratio of Earnings to Fixed Charges and Preferred Dividends Calculation. |
(21.1) | Subsidiaries of Penn Virginia Corporation. |
(23.1) | Consent of KPMG LLP. |
(23.2) | Consent of Wright & Company, Inc. |
(31.1) | Certification Pursuant to 18 U.S.C. Section 1350, as Adopted Pursuant to Section 302 of the Sarbanes-Oxley Act of 2002. |
(31.2) | Certification Pursuant to 18 U.S.C. Section 1350, as Adopted Pursuant to Section 302 of the Sarbanes-Oxley Act of 2002. |
(32.1) | Certification Pursuant to 18 U.S.C. Section 1350, as Adopted Pursuant to Section 906 of the Sarbanes-Oxley Act of 2002. |
(32.2) | Certification Pursuant to 18 U.S.C. Section 1350, as Adopted Pursuant to Section 906 of the Sarbanes-Oxley Act of 2002. |
(99.1) | Report of Wright & Company, Inc. dated January 9, 2015 concerning evaluation of oil and gas reserves. |
(101.INS) | XBRL Instance Document |
(101.SCH) | XBRL Taxonomy Extension Schema Document |
(101.CAL) | XBRL Taxonomy Extension Calculation Linkbase Document |
(101.DEF) | XBRL Taxonomy Extension Definition Linkbase Document |
(101.LAB) | XBRL Taxonomy Extension Label Linkbase Document |
(101.PRE) | XBRL Taxonomy Extension Presentation Linkbase Document |
_________________________
* | Management contract or compensatory plan or arrangement. |
87
SIGNATURES
Pursuant to the requirements of Section 13 or 15(d) of the Securities Exchange Act of 1934, the Registrant has duly caused this report to be signed on its behalf by the undersigned, thereunto duly authorized.
PENN VIRGINIA CORPORATION | ||
By: | /s/ STEVEN A. HARTMAN | |
Steven A. Hartman | ||
Senior Vice President and Chief Financial Officer | ||
February 25, 2015 | By: | /s/ JOAN C. SONNEN |
Joan C. Sonnen | ||
Vice President, Chief Accounting Officer and Controller | ||
(Principal Accounting Officer) | ||
Pursuant to the requirements of the Securities Exchange Act of 1934, this report has been signed below by the following persons on behalf of the Registrant and in the capacities and on the dates indicated.
/s/ EDWARD B. CLOUES, II | Chairman of the Board and Director | February 25, 2015 | ||
Edward B. Cloues, II | ||||
/s/ JOHN U. CLARKE | Director | February 25, 2015 | ||
John U. Clarke | ||||
/s/ STEVEN A. HARTMAN | Senior Vice President and Chief Financial Officer | February 25, 2015 | ||
Steven A. Hartman | (Principal Financial Officer) | |||
/s/ STEVEN W. KRABLIN | Director | February 25, 2015 | ||
Steven W. Krablin | ||||
/s/ MARSHA R. PERELMAN | Director | February 25, 2015 | ||
Marsha R. Perelman | ||||
/s/ JOAN C. SONNEN | Vice President, Chief Accounting Officer and | February 25, 2015 | ||
Joan C. Sonnen | Controller (Principal Accounting Officer) | |||
/s/ H. BAIRD WHITEHEAD | Director and President and Chief Executive Officer | February 25, 2015 | ||
H. Baird Whitehead | (Principal Executive Officer) | |||
/s/ GARY K. WRIGHT | Director | February 25, 2015 | ||
Gary K. Wright | ||||
88