Attached files
| file | filename |
|---|---|
| EX-10.8 - EXHIBIT 10.8 - PENN VIRGINIA CORP | pva-20171231xex108.htm |
| EX-31.1 - EXHIBIT 31.1 - PENN VIRGINIA CORP | pva-20171231xex311.htm |
| EX-99.1 - EXHIBIT 99.1 - PENN VIRGINIA CORP | pva-20171231xex991.htm |
| EX-32.2 - EXHIBIT 32.2 - PENN VIRGINIA CORP | pva-20171231xex322.htm |
| EX-32.1 - EXHIBIT 32.1 - PENN VIRGINIA CORP | pva-20171231xex321.htm |
| EX-31.2 - EXHIBIT 31.2 - PENN VIRGINIA CORP | pva-20171231xex312.htm |
| EX-23.4 - EXHIBIT 23.4 - PENN VIRGINIA CORP | pva-20171231xex234.htm |
| EX-23.3 - EXHIBIT 23.3 - PENN VIRGINIA CORP | pva-20171231xex233.htm |
| EX-23.2 - EXHIBIT 23.2 - PENN VIRGINIA CORP | pva-20171231xex232.htm |
| EX-23.1 - EXHIBIT 23.1 - PENN VIRGINIA CORP | pva-20171231xex231.htm |
| EX-21.1 - EXHIBIT 21.1 - PENN VIRGINIA CORP | pva-20171231xex211.htm |
UNITED STATES
SECURITIES AND EXCHANGE COMMISSION
Washington, D.C. 20549
________________________________________________________
FORM 10-K
________________________________________________________
ý ANNUAL REPORT PURSUANT TO SECTION 13 OR 15(d) OF THE SECURITIES EXCHANGE
ACT OF 1934
For the fiscal year ended December 31, 2017
or
¨ TRANSITION REPORT PUSUANT TO SECTION 13 OR 15(d) OF THE SECURITIES
EXCHANGE ACT OF 1934
For the transition period from ____ to ____
Commission file number: 1-13283
_________________________________________________________

PENN VIRGINIA CORPORATION
(Exact name of registrant as specified in its charter)
Virginia | 23-1184320 | |
(State or other jurisdiction of incorporation or organization) | (I.R.S. Employer Identification Number) | |
14701 St. Mary’s Lane, Suite 275
Houston, TX 77079
(Address of principal executive offices)
Registrant’s telephone number, including area code: (713) 722-6500
Securities registered pursuant to Section 12(b) of the Act:
Title of each class | Name of exchange on which registered | |
Common Stock, $0.01 Par Value | NASDAQ Global Select Market | |
Securities registered pursuant to Section 12(g) of the Act: None
Indicate by check mark if the registrant is a well-known seasoned issuer, as defined in Rule 405 of the Securities Act. Yes ¨ No ý
Indicate by check mark if the registrant is not required to file reports pursuant to Section 13 or Section 15(d) of the Act. Yes ¨ No ý
Indicate by check mark whether the registrant (1) has filed all reports required to be filed by Section 13 or 15(d) of the Securities Exchange Act of 1934 during the preceding 12 months (or for such shorter period that the registrant was required to file such reports), and (2) has been subject to such filing requirements for the past 90 days. Yes ý No ¨
Indicate by check mark whether the registrant has submitted electronically and posted on its corporate Web site, if any, every Interactive Data File required to be submitted and posted pursuant to Rule 405 of Regulation S-T (§ 232.405 of this chapter) during the preceding 12 months (or for such shorter period that the registrant was required to submit and post such files). Yes ý No ¨
Indicate by check mark if disclosure of delinquent filers pursuant to Item 405 of Regulation S-K (§ 229.405 of this chapter) is not contained herein, and will not be contained, to the best of registrant’s knowledge, in definitive proxy or information statements incorporated by reference in Part III of this Form 10-K or any amendment to this Form 10-K. ¨
Indicate by check mark whether the registrant is a large accelerated filer, an accelerated filer, a non-accelerated filer, a smaller reporting company, or emerging growth company. See the definitions of “large accelerated filer,” “accelerated filer,” “smaller reporting company,” and “emerging growth company”in Rule 12b-2 of the Exchange Act. (Check One)
Large accelerated filer | o | Accelerated filer | ý | Non-accelerated filer | o | Smaller reporting company | o | |||
Emerging growth company | o | |||||||||
If an emerging growth company, indicate by check mark if the registrant has elected not to use the extended transition period for complying with any new or revised financial accounting standards provided pursuant to Section 13(a) of the Exchange Act. ¨
Indicate by check mark whether the registrant is a shell company (as defined in Rule 12b-2 of the Act). Yes ¨ No ý
The aggregate market value of voting and non-voting common equity held by non-affiliates of the registrant was $476,690,130 as of June 30, 2017 (the last business day of its most recently completed second fiscal quarter), based on the last sale price of such stock as quoted on the NASDAQ Global Select Market. For purposes of making this calculation only, the registrant has defined affiliates as including all directors and executive officers of the registrant. This determination of affiliate status is not necessarily a conclusive determination for other purposes.
Indicate by check mark whether the registrant has filed all documents and reports required to be filed by Section 12, 13 or 15(d) of the Securities Exchange Act of 1934 subsequent to the distribution of securities under a plan confirmed by a court. Yes ý No ¨
As of February 23, 2018, 15,042,764 shares of common stock of the registrant were outstanding.
DOCUMENTS INCORPORATED BY REFERENCE
Portions of the Proxy Statement relating to the registrant’s Annual Meeting of Shareholders, to be held on May 2, 2018, are incorporated by reference in Part III of this Form 10-K.
PENN VIRGINIA CORPORATION
ANNUAL REPORT ON FORM 10-K
For the Fiscal Year Ended December 31, 2017
Table of Contents
Page | ||
Forward-Looking Statements | ||
Glossary of Certain Industry Terminology | ||
Part I | ||
Item | ||
1. | Business | |
1A. | Risk Factors | |
1B. | Unresolved Staff Comments | |
2. | Properties | |
3. | Legal Proceedings | |
4. | Mine Safety Disclosures | |
Part II | ||
5. | Market for Registrant’s Common Equity, Related Stockholder Matters and Issuer Purchases of Equity Securities | |
6. | Selected Financial Data | |
7. | Management’s Discussion and Analysis of Financial Condition and Results of Operations: | |
Overview and Executive Summary | ||
Key Developments | ||
Financial Condition | ||
Results of Operations | ||
Off-Balance Sheet Arrangements | ||
Contractual Obligations | ||
Critical Accounting Estimates | ||
7A. | Quantitative and Qualitative Disclosures About Market Risk | |
8. | Financial Statements and Supplementary Data | |
9. | Changes in and Disagreements with Accountants on Accounting and Financial Disclosure | |
9A. | Controls and Procedures | |
9B. | Other Information | |
Part III | ||
10. | Directors, Executive Officers and Corporate Governance | |
11. | Executive Compensation | |
12. | Security Ownership of Certain Beneficial Owners and Management and Related Stockholder Matters | |
13. | Certain Relationships and Related Transactions, and Director Independence | |
14. | Principal Accountant Fees and Services | |
Part IV | ||
15. | Exhibits, Financial Statement Schedules | |
16. | Form 10-K Summary | |
Signatures | ||
Forward-Looking Statements
Certain statements contained herein that are not descriptions of historical facts are “forward-looking” statements within the meaning of Section 27A of the Securities Act of 1933, as amended, and Section 21E of the Securities Exchange Act of 1934, as amended, or the Exchange Act. We use words such as “anticipate,” “guidance,” “assumptions,” “projects,” “estimates,” “expects,” “continues,” “intends,” “plans,” “believes,” “forecasts,” “future,” “potential,” “may,” “possible,” “could” and variations of such words or similar expressions to identify forward-looking statements. Because such statements include risks, uncertainties and contingencies, actual results may differ materially from those expressed or implied by such forward-looking statements. These risks, uncertainties and contingencies include, but are not limited to, the following:
• | risks related to recently completed acquisitions, including our ability to realize their expected benefits; |
• | our ability to satisfy our short-term and long-term liquidity needs, including our inability to generate sufficient cash |
flows from operations or to obtain adequate financing to fund our capital expenditures and meet working capital
needs;
• | negative events or publicity adversely affecting our ability to maintain our relationships with our suppliers, service |
providers, customers, employees, and other third parties;
• | plans, objectives, expectations and intentions contained in this report that are not historical; |
• | our ability to execute our business plan in volatile and depressed commodity price environments; |
• | the decline in and volatility of commodity prices for oil, natural gas liquids, or NGLs, and natural gas; |
• | our ability to develop, explore for, acquire and replace oil and natural gas reserves and sustain production; |
• | our ability to generate profits or achieve targeted reserves in our development and exploratory drilling and well |
operations;
• | any impairments, write-downs or write-offs of our reserves or assets; |
• | the projected demand for and supply of oil, NGLs and natural gas; |
• | our ability to contract for drilling rigs, frac crews, supplies and services at reasonable costs; |
• | our ability to obtain adequate pipeline transportation capacity for our oil and gas production at reasonable cost and to |
sell our production at, or at reasonable discounts to, market prices;
• | the uncertainties inherent in projecting future rates of production for our wells and the extent to which actual |
production differs from that estimated in our proved oil and natural gas reserves;
• | drilling and operating risks; |
• | our ability to compete effectively against other oil and gas companies; |
• | leasehold terms expiring before production can be established and our ability to replace expired leases; |
• | environmental obligations, costs and liabilities that are not covered by an effective indemnity or insurance; |
• | the timing of receipt of necessary regulatory permits; |
• | the effect of commodity and financial derivative arrangements; |
• | the occurrence of unusual weather or operating conditions, including force majeure events; |
• | our ability to retain or attract senior management and key employees; |
• | potential adverse effects of the completed Chapter 11, or bankruptcy, proceedings on our liquidity, results of operations, business prospects, ability to retain financing and other risks and uncertainties related to our emergence from bankruptcy; |
• | our post-bankruptcy capital structure and the adoption of Fresh Start Accounting (as defined herein), including the risk that assumptions and factors used in estimating enterprise value vary significantly from the current estimates in connection with the application of Fresh Start Accounting; |
• | counterparty risk related to the ability of these parties to meet their future obligations; |
• | compliance with and changes in governmental regulations or enforcement practices, especially with respect to |
environmental, health and safety matters;
• | physical, electronic and cybersecurity breaches; |
• | uncertainties relating to general domestic and international economic and political conditions; |
• | the impact and costs associated with litigation or other legal matters; and |
• | other factors set forth in our periodic filings with the Securities and Exchange Commission, or SEC, including the risks set forth in Part I, Item 1A of this Annual Report on Form 10-K for the year ended December 31, 2017. |
Additional information concerning these and other factors can be found in our press releases and public filings with the SEC. Many of the factors that will determine our future results are beyond the ability of management to control or predict. Readers should not place undue reliance on forward-looking statements, which reflect management’s views only as of the date hereof. All subsequent written and oral forward-looking statements attributable to us or persons acting on our behalf are expressly qualified in their entirety by these cautionary statements. We undertake no obligation to revise or update any forward-looking statements, or to make any other forward-looking statements, whether as a result of new information, future events or otherwise, except as may be required by applicable law.
1
Glossary of Certain Industry Terminology
The following abbreviations, terms and definitions are commonly used in the oil and gas industry and are used within this Annual Report on Form 10-K.
Bbl. A standard barrel of 42 U.S. gallons liquid volume of oil or other liquid hydrocarbons.
Bcf. One billion cubic feet of natural gas.
BOE. One barrel of oil equivalent with six thousand cubic feet of natural gas converted to one barrel of crude oil based on the estimated relative energy content.
BOEPD. Barrels of oil equivalent per day.
Borrowing base. The value assigned to a collection of borrower’s assets used by lenders to determine an initial and/or continuing amount for loans. In the case of oil and gas exploration and development companies, the borrowing base is generally based on proved developed reserves.
Completion. A process of treating a drilled well, including hydraulic fracturing among other stimulation processes, followed by the installation of permanent equipment for the production of oil or gas.
Condensate. A mixture of hydrocarbons that exists in the gaseous phase at original reservoir temperature and pressure, but that, when produced, is in the liquid phase at surface temperature and pressure.
Development well. A well drilled within the proved area of an oil or gas reservoir to the depth of a stratigraphic horizon known to be productive.
Dry hole. A well found to be incapable of producing either oil or gas in sufficient commercial quantities to justify completion of the well.
Drilling carry. A working interest that will be carried through the drilling and completion of a well.
EBITDAX. A measure of profitability utilized in the oil and gas industry representing earnings before interest, income taxes, depreciation, depletion, amortization and exploration expenses. EBITDAX is not a defined term or measure in generally accepted accounting principles, or GAAP (see below).
Exploratory well. A well drilled to find a new field or to find a new reservoir in a field previously found to be productive of oil or gas in another reservoir. Generally, an exploratory well is any well that is not a development well, a service well or a stratigraphic test well.
EUR. Estimated ultimate reserves, the sum of reserves remaining as of a given date and cumulative production as of that date.
GAAP. Accounting principles generally accepted in the Unites States of America.
Gas lift. A method of artificial lift that uses an external source of high-pressure gas for supplementing formation gas for lifting the well fluids.
Gross acre or well. An acre or well in which a working interest is owned.
HBP. Held by production is a provision in an oil and gas or mineral lease that perpetuates the leaseholder’s right to operate the property as long as the property produces a minimum paying quantity of oil or gas.
Henry Hub. The Erath, Louisiana settlement point price for natural gas.
IP. Initial production, a measurement of a well’s production at the outset.
LIBOR. London Interbank Offered Rate.
LLS. Light Louisiana Sweet, a crude oil pricing index reference.
MBbl. One thousand barrels of oil or other liquid hydrocarbons.
MBOE. One thousand barrels of oil equivalent.
Mcf. One thousand cubic feet of natural gas.
MMBbl. One million barrels of oil or other liquid hydrocarbons.
MMBOE. One million barrels of oil equivalent.
MMBtu. One million British thermal units, a measure of energy content.
MMcf. One million cubic feet of natural gas.
Nasdaq. The NASDAQ Global Select Market.
Net acre or well. The number of gross acres or wells multiplied by the owned working interest in such gross acres or wells.
NGL. Natural gas liquid.
2
NYMEX. New York Mercantile Exchange.
Operator. The entity responsible for the exploration and/or production of a lease or well.
Play. A geological formation with potential oil and gas reserves.
Productive wells. Wells that are not dry holes.
Possible reserves. Those additional reserves that are less certain to be recovered than probable reserves. When probabilistic methods are used, there should be at least a 10 percent probability that the total quantities ultimately recovered will equal or exceed the proved plus probable plus possible reserves estimates.
Probable reserves. Those additional reserves that are less certain to be recovered than proved reserves but which, together with proved reserves, are as likely as not to be recovered. When probabilistic methods are used, there should be at least a 50 percent probability that the actual quantities recovered will equal or exceed the proved plus probable reserves estimates.
Proved reserves. Those quantities of oil and gas which, by analysis of geoscience and engineering data, can be estimated with reasonable certainty to be economically producible from a given date forward, from known reservoirs, and under existing economic conditions, operating methods and government regulations before the time at which contracts providing the right to operate expire, unless evidence indicates that renewal is reasonably certain, regardless of whether deterministic or probabilistic methods are used for the estimation.
Proved developed reserves. Proved reserves that can be expected to be recovered: (a) through existing wells with existing equipment and operating methods or in which the cost of the required equipment is relatively minor compared with the cost of a new well or (b) through installed extraction equipment and infrastructure operational at the time of the reserves estimate if the extraction is by means not involving a well.
Proved undeveloped reserves. Proved reserves that are expected to be recovered from new wells on undrilled acreage, or from existing wells where a relatively major expenditure is required for recompletion. Reserves on undrilled acreage are limited to those directly offsetting development spacing areas that are reasonably certain of production when drilled.
PV10. A non-GAAP measure representing the present value of estimated future oil and gas revenues, net of estimated direct costs, discounted at an annual discount rate of 10%. PV10 is not a measure of financial or operating performance under GAAP, nor should it be considered in isolation or as a substitute for any GAAP measure. PV10 does not purport to represent the fair value of oil and gas properties.
Reservoir. A porous and permeable underground formation containing a natural accumulation of hydrocarbons that is confined by impermeable rock or water barriers and is separate from other reservoirs.
Revenue interest. An economic interest in production of hydrocarbons from a specified property.
Royalty interest. An interest in the production of a well entitling the owner to a share of production generally free of the costs of exploration, development and production.
SEC. United States Securities and Exchange Commission.
Service well. A well drilled or completed for the purpose of supporting production in an existing field.
Standardized measure. The present value, discounted at 10% per year, of estimated future cash inflows from the production of proved reserves, computed by applying prices used in estimating proved oil and gas reserves to the year-end quantities of those reserves (except for consideration of future price changes to the extent provided by contractual arrangements in existence at year-end), reduced by estimated future development and production costs, computed by estimating the expenditures to be incurred in developing and producing the proved oil and gas reserves at the end of the year (including the settlement of asset retirement obligations), based on year-end costs and assuming continuation of existing economic conditions, further reduced by estimated future income tax expenses, computed by applying the appropriate year-end statutory tax rates, with consideration of future tax rates already legislated, to the future pretax net cash flows relating to the proved oil and gas reserves, less the tax basis of the properties involved and giving effect to the tax deductions and tax credits and allowances relating to the proved oil and gas reserves.
Stratigraphic test well. A drilling effort, geologically directed, to obtain information pertaining to a specific geologic condition. Such wells customarily are drilled without the intention of being completed for hydrocarbon production.
Unconventional. Generally refers to hydrocarbon reservoirs that lack discrete boundaries that typically define conventional reservoirs. Examples include shales, tight sands or coal beds.
Undeveloped acreage. Lease acreage on which wells have not been drilled or completed to a point that would permit the production of economic quantities of oil or gas, regardless of whether such acreage contains proved reserves. Under appropriate circumstances, undeveloped acreage may not be subject to expiration if properly held by production, as that term is defined above.
WTI. West Texas Intermediate, a crude oil pricing index reference.
Working interest. A cost-bearing interest under an oil and gas lease that gives the holder the right to develop and produce the minerals under the lease.
3
Part I
Item 1 | Business |
Unless the context requires otherwise, references to the “Company,” “Penn Virginia,” “we,” “us” or “our” in this Annual Report on Form 10-K refer to Penn Virginia Corporation and its subsidiaries.
Description of Business
We are an independent oil and gas company engaged in the onshore exploration, development and production of crude oil, NGLs and natural gas. Our current operations consist primarily of drilling unconventional horizontal development wells and operating our producing wells in the Eagle Ford Shale field, or the Eagle Ford, in South Texas. Our operations are substantially concentrated with over 90 percent of our production, revenues and capital expenditures attributable to this region. We also have less significant operations in Oklahoma, primarily consisting of non-operated properties in the Granite Wash.
We were incorporated in the Commonwealth of Virginia in 1882. Our common stock is publicly traded on the Nasdaq under the symbol “PVAC.” Our headquarters and corporate office is located in Houston, Texas. We also have an operations office near our Eagle Ford assets in South Texas.
We operate in and report our financial results and disclosures as one segment, which is the exploration, development and production of crude oil, NGLs and natural gas. Each of our operating regions has similar economic characteristics and meets the criteria for aggregation as one reporting segment.
Current Operations
We lease a highly contiguous position of approximately 73,400 net acres (as of December 31, 2017) in the core liquids-rich area or “volatile oil window” of the Eagle Ford in Gonzales, Lavaca, Fayette and Dewitt Counties in Texas, which we believe contains a substantial number of drilling locations that will support a multi-year drilling inventory.
In 2017, our total production was comprised of 73 percent crude oil, 14 percent NGLs and 13 percent natural gas. Crude oil accounted for 88 percent of our product revenues. We generally sell our crude oil, NGL and natural gas products using short-term floating price physical and spot market contracts.
As of December 31, 2017, our total proved reserves were approximately 73 MMBOE, of which 44 percent were proved developed reserves and 77 percent were crude oil. Approximately 97 percent of our reserves were located in South Texas and 42 percent were proved developed reserves. As of December 31, 2017, we had 500 gross (332.9 net) productive wells, approximately 80 percent of which we operate, and owned approximately 124,000 gross (90,000 net) acres of leasehold and royalty interests, approximately 18 percent of which were undeveloped. Over 90 percent of our undeveloped acreage in South Texas is HBP and includes a substantial number of undrilled locations. During 2017, we drilled and completed 29 gross (16.9 net) wells, all in the Eagle Ford. For a more detailed discussion of our production, reserves, drilling activities, wells and acreage, see Part I, Item 2, “Properties.”
In September 2017, we completed an acquisition of oil and gas assets, including oil and gas leases covering approximately 19,600 net acres located primarily in Lavaca County, Texas from Devon Energy Corporation, or Devon. On March 1, 2018, we completed the acquisition of certain oil and gas assets from Hunt Oil Company, or Hunt, including oil and gas leases covering approximately 9,700 net acres located primarily in Gonzalez and Lavaca Counties, Texas. With such acquisitions, we have an approximate 83,100 core net acreage position in South Texas with approximately 93 percent HBP, substantially all of which is operated by us. For a more detailed discussion of these acquisitions, see “Key Developments” included in Part II, Item 7, “Management’s Discussion and Analysis of Financial Condition and Results of Operations” and Note 5 to our Consolidated Financial Statements included in Part II, Item 8, “Financial Statements and Supplementary Data.”
Emergence from Bankruptcy Proceedings and Fresh Start Accounting
On May 12, 2016, or the Petition Date, we and eight of our subsidiaries, or the Chapter 11 Subsidiaries, filed voluntary petitions (In re Penn Virginia Corporation, et al., Case No. 16-32395) seeking relief under Chapter 11 of Title 11 of the United States Bankruptcy Code, or the Bankruptcy Code, in the United States Bankruptcy Court for the Eastern District of Virginia, or the Bankruptcy Court.
On August 11, 2016, or the Confirmation Date, the Bankruptcy Court confirmed our Second Amended Joint Chapter 11 Plan of Reorganization of Penn Virginia Corporation and its Debtor Affiliates, or the Plan, and we subsequently emerged from bankruptcy on September 12, 2016, or the Emergence Date.
On the Emergence Date, we adopted and applied the relevant guidance with respect to the accounting and financial reporting for entities that have emerged from bankruptcy proceedings, or Fresh Start Accounting. The adoption of Fresh Start Accounting resulted in a new reporting entity, the Successor, for financial reporting purposes. To facilitate our discussion and analysis of our properties, financial condition and results of operations herein, we refer to the reorganized company as the “Successor” for periods subsequent to September 12, 2016, and the “Predecessor” for periods prior to September 13, 2016. For a more detailed discussion of our bankruptcy proceedings, our emergence from bankruptcy and Fresh Start Accounting, see Note 4 to our Consolidated Financial Statements included in Part II, Item 8, “Financial Statements and Supplementary Data.”
4
Business Strategy
Our goal is to enhance long-term shareholder value. We intend to pursue the following business strategies:
• | Grow reserves, production and cash flow by exploiting our liquids rich resource base. We believe our extensive inventory of drilling locations in the Eagle Ford, combined with our operating expertise, will enable us to continue to deliver accretive production, reserves and cash flow growth and create shareholder value. We intend to selectively develop our acreage base in an effort to maximize its value and resource potential. We believe the location, concentration and scale of our core leasehold positions, coupled with our technical understanding of the reservoirs will allow us to efficiently develop our core area and to allocate capital to maximize the value of our resource base. |
• | Operate our properties as a low-cost producer. We believe our concentrated acreage position in the Eagle Ford and our experience as an operator of virtually all of our properties following completion of our recent oil and gas asset acquisitions enables us to apply optimized drilling and completion techniques, reduce operating costs and achieve economies of scale that will improve returns on capital investments. Operating control allows us to better manage timing and risk as well as the cost of infrastructure, drilling and ongoing operations. We generally drill multiple wells from a single pad, which reduces facilities costs and surface impact while also reducing unit costs and improving cycle time. |
• | Utilize extensive acquisition and technical expertise to strategically grow our core acreage position. We continuously evaluate resource development opportunities. To date, our management and technical teams have completed numerous acquisitions, and we expect to continue to identify and opportunistically lease or acquire additional acreage and producing assets to add to our multi-year drilling inventory. |
• | Maintain financial discipline. We intend to maintain a conservative financial position to allow us to develop our drilling, exploitation and exploration activities. Consistent with our disciplined approach to financial management, we have an active commodity hedging program that seeks to hedge a meaningful portion of our expected oil production, reducing our exposure to downside commodity price fluctuations and enabling us to protect cash flows and maintain liquidity to fund our capital program and investment opportunities. We plan to hedge a substantial portion of our anticipated crude oil production for 2018 and will expand additional hedging for the next several years on an opportunistic basis. |
Key Contractual Arrangements
In the ordinary course of operating our business, we enter into a number of key contracts for services that are critical with respect to our ability to develop, produce and bring our production to market. The following is a summary of our most significant contractual arrangements.
Oil gathering and transportation service contracts. We have long-term agreements that provide us with gathering and intermediate pipeline transportation services for a substantial portion of our crude oil and condensate production in the South Texas region through 2041 as well as volume capacity support for certain downstream interstate pipeline transportation.
Natural gas service contracts. We have an agreement that provides us with gas lift, gathering, compression and transportation services for a substantial portion of our natural gas production in the South Texas region until 2039.
Natural gas processing contracts. We have agreements that provide us with services to process our wet gas production into NGL products and dry, or residue, gas, encompassing our entire operating regions in South Texas and the Mid-Continent. We have two agreements attributable to the South Texas region that are evergreen in term with either party having the right to terminate with 30-days notice to the counterparty. We also have an agreement in place for the Mid-Continent region that extends through November 2019.
Drilling and Completion. From time to time we enter into drilling, completion and materials contracts in the ordinary course of business to ensure availability of rigs, frac crews and materials to satisfy our development program. As of December 31, 2017, there were no drilling, completion or materials agreements with terms that extended beyond one year.
Major Customers
We sell a significant portion of our oil and gas production to a relatively small number of customers. For the year ended December 31, 2017, approximately 86 percent of our consolidated product revenues were attributable to three customers: Phillips 66 Company; BP Products North America Inc. and Shell Trading (US) Company.
Seasonality
Our sales volumes of oil and gas are dependent upon the number of producing wells and, therefore, are not seasonal by nature. We do not believe that the pricing of our crude oil and NGL production is subject to any meaningful seasonal effects. Historically, the pricing of natural gas is seasonal, typically with higher pricing in the winter months.
5
Competition
The oil and gas industry is very competitive, and we compete with a substantial number of other companies, many of which are large, well-established and have greater financial and operational resources than we do. Some of our competitors not only engage in the acquisition, exploration, development and production of oil and gas reserves, but also carry on refining operations, electricity generation and the marketing of refined products. In addition, the oil and gas industry in general competes with other industries supplying energy and fuel to industrial, commercial and individual consumers. Competition is particularly intense in the acquisition of prospective oil and gas properties. We may incur higher costs or be unable to acquire and develop desirable properties at costs we consider reasonable because of this competition. We also compete with other oil and gas companies to secure drilling rigs, frac fleets, sand and other equipment and materials necessary for the drilling and completion of wells and in the recruiting and retaining of qualified personnel. Such materials, equipment and labor may be in short supply from time to time. Shortages of equipment, labor or materials may result in increased costs or the inability to obtain such resources as needed. Many of our larger competitors may have a competitive advantage when responding to commodity price volatility and overall industry cycles.
Government Regulation and Environmental Matters
Our operations are subject to extensive federal, state and local laws and regulations that govern oil and gas operations, regulate the discharge of materials into the environment or otherwise relate to the protection of the environment. These laws, rules and regulations may, among other things:
• | require the acquisition of various permits before drilling commences; |
• | require notice to stakeholders of proposed and ongoing operations; |
• | require the installation of expensive pollution control equipment; |
• | restrict the types, quantities and concentration of various substances that can be released into the environment in connection with oil and natural gas drilling and production and saltwater disposal activities; |
• | limit or prohibit drilling activities on certain lands lying within wilderness, wetlands and other protected areas, or otherwise restrict or prohibit activities that could impact the environment, including water resources; and |
• | require remedial measures to mitigate pollution from former and ongoing operations, such as requirements to close pits and plug abandoned wells. |
Numerous governmental departments issue rules and regulations to implement and enforce such laws that are often difficult and costly to comply with and which carry substantial administrative, civil and even criminal penalties, as well as the issuance of injunctions limiting or prohibiting our activities for failure to comply. Violations and liabilities with respect to these laws and regulations could also result in remedial clean-ups, natural resource damages, permit modifications or revocations, operational interruptions or shutdowns and other liabilities. The costs of remedying such conditions may be significant, and remediation obligations could adversely affect our financial condition, results of operations and cash flows. In certain instances, citizens or citizen groups also have the ability to bring legal proceedings against us if we are not in compliance with environmental laws or to challenge our ability to receive environmental permits that we need to operate. Some laws, rules and regulations relating to protection of the environment may, in certain circumstances, impose “strict liability” for environmental contamination, rendering a person liable for environmental and natural resource damages and cleanup costs without regard to negligence or fault on the part of such person. Other laws, rules and regulations may restrict the rate of oil and gas production below the rate that would otherwise exist or even prohibit exploration or production activities in sensitive areas. In addition, state laws often require some form of remedial action to prevent pollution from former operations, such as plugging of abandoned wells. As of December 31, 2017, we have recorded asset retirement obligations of $3.3 million attributable to these activities. The regulatory burden on the oil and gas industry increases its cost of doing business and consequently affects its profitability. These laws, rules and regulations affect our operations, as well as the oil and gas exploration and production industry in general.
In addition, the United States Environmental Protection Agency, or the EPA, has designated energy extraction as one of six national enforcement initiatives, and has indicated that the agency will direct resources towards addressing incidences of noncompliance from natural gas extraction and production activities. We believe that we are in substantial compliance with current applicable environmental laws, rules and regulations and that continued compliance with existing requirements will not have a material impact on our financial condition, results of operations or cash flows. Nevertheless, changes in existing environmental laws or regulations or the adoption of new environmental laws or regulations, including any significant limitation on the use of hydraulic fracturing, could have the potential to adversely affect our financial condition, results of operations and cash flows. Federal, state or local administrative decisions, developments in the federal or state court systems or other governmental or judicial actions may influence the interpretation or enforcement of environmental laws and regulations and may thereby increase compliance costs. Environmental regulations have historically become more stringent over time, and thus, there can be no assurance as to the amount or timing of future expenditures for environmental compliance or remediation.
6
The following is a summary of the significant environmental laws to which our business operations are subject.
CERCLA. The Comprehensive Environmental Response, Compensation, and Liability Act, or CERCLA, is also known as the “Superfund” law. CERCLA and comparable state laws impose liability, without regard to fault or the legality of the original conduct, on parties that are considered to have contributed to the release of a “hazardous substance” into the environment. These persons include the current or former owner or operator of the site where the release occurred and anyone who disposed or arranged for the disposal of a hazardous substance released at the site. Such “responsible parties” may be subject to joint and several liability under CERCLA for the costs of cleaning up the hazardous substances that have been released into the environment and for damages to natural resources. It is not uncommon for neighboring landowners and other third parties to file claims for personal injury and property damage allegedly caused by the hazardous substances released into the environment. We currently own or lease properties that have been used for the exploration and production of oil and gas for a number of years. Many of these properties have been operated by third parties whose treatment or release of hydrocarbons or other wastes was not under our control. These properties, and any wastes that may have been released on them, may be subject to CERCLA, and we could potentially be required to investigate and remediate such properties, including soil or groundwater contamination by prior owners or operators, or to perform remedial plugging or pit closure operations to prevent future contamination. States also have environmental cleanup laws analogous to CERCLA, including Texas.
RCRA. The Resource Conservation and Recovery Act, or RCRA, and comparable state statutes regulate the generation, transportation, treatment, storage, disposal and cleanup of hazardous and non-hazardous wastes. Under the auspices of the EPA, the individual states administer some or all of the provisions of RCRA. While there is currently an exclusion from RCRA for drilling fluids, produced waters and most of the other wastes associated with the exploration and production of oil or gas, it is possible that some of these wastes could be classified as hazardous waste in the future and therefore be subject to more stringent regulation under RCRA. For example, in December 2016, the EPA and certain environmental organizations entered into a consent decree to address the EPA’s alleged failure to timely assess its RCRA Subtitle D criteria regulations exempting certain exploration and production-related oil and gas wastes from regulation as hazardous wastes under RCRA. The consent decree requires the EPA to propose a rulemaking no later than March 15, 2019 for revision of certain Subtitle D criteria regulations pertaining to oil and gas wastes or to sign a determination that revision of the regulations is not necessary. Any such change could result in an increase in our costs to manage and dispose of wastes, which could have an adverse effect on our results of operations and financial position. Also, in the course of our operations, we generate some amounts of ordinary industrial wastes that may be regulated as hazardous wastes if such wastes have hazardous characteristics.
Oil Pollution Act. The Oil Pollution Act of 1990, or the OPA, contains numerous restrictions relating to the prevention of and response to oil spills into waters of the United States. The term “waters of the United States” has been interpreted broadly to include inland water bodies, including wetlands and intermittent streams. The OPA imposes certain duties and liabilities on certain “responsible parties” related to the prevention of oil spills and damages resulting from such spills in or threatening waters of the United States or adjoining shorelines. For example, operators of certain oil and natural gas facilities must develop, implement and maintain facility response plans, conduct annual spill training for certain employees and provide varying degrees of financial assurance. Owners or operators of a facility, vessel or pipeline that is a source of an oil discharge or that poses the substantial threat of discharge is one type of “responsible party” who is liable. The OPA subjects owners of facilities to strict, joint and several liability for all containment and cleanup costs, and certain other damages arising from a spill. As such, a violation of the OPA has the potential to adversely affect our business, financial condition, results of operations and cash flows.
Clean Water Act. The Federal Water Pollution Control Act, or the Clean Water Act, and comparable state laws impose restrictions and strict controls with respect to the discharge of pollutants, including spills and leaks of oil and other substances, into regulated waters, such as waters of the United States. The discharge of pollutants, including dredge or fill materials in regulated wetlands, into regulated waters or wetlands without a permit issued by the EPA, the U.S. Army Corps of Engineers, or the Corps, or the state is prohibited. The Clean Water Act has been interpreted by these agencies to apply broadly. The EPA and the Corps released a rule to revise the definition of “waters of the United States,” or WOTUS, for all Clean Water Act programs, which went into effect in August 2015. In January 2017, the United States Supreme Court accepted review of the rule to determine whether jurisdiction to hear challenges to the rule rests with the federal district or appellate courts. In January 2018, the Supreme Court ruled that district courts have jurisdiction over challenges to the rule. Litigation surrounding this rule is ongoing, and EPA has instituted rulemakings to both delay the effective date of this rule and repeal the rule.
The Clean Water Act also requires the preparation and implementation of Spill Prevention, Control and Countermeasure Plans in connection with on-site storage of significant quantities of oil. In 2016, the EPA finalized new wastewater pretreatment standards that would prohibit onshore unconventional oil and gas extraction facilities from sending wastewater to publicly-owned treatment works. This restriction of disposal options for hydraulic fracturing waste may result in increased costs. In addition, the Clean Water Act and analogous state laws require individual permits or coverage under general permits for discharges of storm water runoff from certain types of facilities. Federal and state regulatory agencies can impose administrative, civil and criminal penalties for non-compliance with discharge permits or other requirements of the Clean Water Act and analogous state laws and regulations.
7
Safe Drinking Water Act. The Safe Drinking Water Act, or the SDWA, and the Underground Injection Control Program promulgated under the SDWA, establish the requirements for salt water disposal well activities and prohibit the migration of fluid-containing contaminants into underground sources of drinking water. The Underground Injection Well Program requires that we obtain permits from the EPA or delegated state agencies for our disposal wells, establishes minimum standards for injection well operations, restricts the types and quantities of fluids that may be injected and prohibits the migration of fluid containing any contaminants into underground sources of drinking water. Any leakage from the subsurface portions of the injection wells may cause degradation of freshwater, potentially resulting in cancellation of operations of a well, imposition of fines and penalties from governmental agencies, incurrence of expenditures for remediation of affected resources, and imposition of liability by landowners or other parties claiming damages for alternative water supplies, property damages, and personal injuries. We engage third parties to provide hydraulic fracturing or other well stimulation services to us in connection with the wells in which we act as operator. Hydraulic fracturing is an important and commonly used process in the completion of oil and gas wells, particularly in unconventional plays like the Eagle Ford and Granite Wash formations. The EPA released the results of its comprehensive research study to investigate the potential adverse impacts of hydraulic fracturing on drinking water and ground water in December 2016, finding that hydraulic fracturing activities can impact drinking water resources under some circumstances, including large volume spills and inadequate mechanical integrity of wells. These developments could establish an additional level of regulation and permitting of hydraulic fracturing operations at the federal level, which could lead to operational delays, increased operating and compliance costs and additional regulatory burdens that could make it more difficult or commercially impracticable for us to perform hydraulic fracturing. Such costs and burdens could delay the development of unconventional gas resources from shale formations, which are not commercially feasible without the use of hydraulic fracturing.
Chemical Disclosures Related to Hydraulic Fracturing. Certain states in which we operate have adopted regulations requiring the disclosure of chemicals used in the hydraulic fracturing process. For instance, Oklahoma and Texas have implemented chemical disclosure requirements for hydraulic fracturing operations. We currently disclose all hydraulic fracturing additives we use on www.FracFocus.org, a website created by the Ground Water Protection Council and Interstate Oil and Gas Compact Commission.
Prohibitions and Other Regulatory Limitations on Hydraulic Fracturing. There have been a variety of regulatory initiatives at the state level to restrict oil and gas drilling operations in certain locations.
In addition to chemical disclosure rules, some states have implemented permitting, well construction or water withdrawal regulations that may increase the costs of hydraulic fracturing operations. For example, Texas has water withdrawal restrictions allowing suspension of withdrawal rights in times of shortages while other states require reporting on the amount of water used and its source.
Increased regulation of and attention given by environmental interest groups, as well as state and federal regulatory authorities, to the hydraulic fracturing process could lead to greater opposition to oil and gas production activities using hydraulic fracturing techniques. Additional legislation or regulation could also lead to operational delays or increased operating costs in the production of oil and gas, including from the developing shale plays, or could make it more difficult to perform hydraulic fracturing. These developments could also lead to litigation challenging proposed or existing wells. The adoption of federal, state or local laws or the implementation of regulations regarding hydraulic fracturing that are more stringent could cause a decrease in the completion of new oil and gas wells, as well as increased compliance costs and time, which could adversely affect our financial position, results of operations and cash flows. We use hydraulic fracturing extensively and any increased federal, state, or local regulation of hydraulic fracturing could reduce the volumes of oil and gas that we can economically recover.
Clean Air Act. Our operations are subject to the Clean Air Act, or the CAA, and comparable state and local requirements. In 1990, the U.S. Congress adopted amendments to the CAA containing provisions that have resulted in the gradual imposition of certain pollution control requirements with respect to air emissions from our operations. The EPA and states have developed, and continue to develop, regulations to implement these requirements. We may be required to incur certain capital expenditures in the next several years for air pollution control equipment in connection with maintaining or obtaining operating permits and approvals addressing other air emission-related issues. Further, stricter requirements could negatively impact our production and operations. Federal and state regulatory agencies can impose administrative, civil and criminal penalties for non-compliance with air permits or other requirements of the CAA and associated state laws and regulations. In addition, the EPA has developed, and continues to develop, stringent regulations governing emissions of toxic air pollutants at specified sources.
On April 17, 2012, the EPA issued final rules to subject oil and natural gas operations to regulation under the New Source Performance Standards, or NSPS, and National Emission Standards for Hazardous Air Pollutants, or NESHAPS, programs under the CAA, and to impose new and amended requirements under both programs. The EPA rules include NSPS standards for completions of hydraulically fractured natural gas wells, compressors, controllers, dehydrators, storage tanks, natural gas processing plants and certain other equipment. Further, in May 2016, the EPA issued final NSPS governing methane emissions from the oil and natural gas industry as well as source determination standards for determining when oil and
8
gas sources should be aggregated for CAA permitting and compliance purposes. The NSPS for methane extends the 2012 NSPS to completions of hydraulically fractured oil wells, equipment leaks, pneumatic pumps and natural gas compressors. In June 2017, the EPA proposed a two year stay of the fugitive emissions monitoring requirements, pneumatic pump standards and closed vent system certification requirements in the 2016 NSPS rule for the oil and gas industry while it reconsiders these aspects of the rule. The proposal is still under consideration. The U.S. Bureau of Land Management, or BLM, finalized similar rules in November 2016 that limit methane emissions from new and existing oil and gas operations on federal lands through limitations on the venting and flaring of gas, as well as enhanced leak detection and repair requirements. The BLM adopted final rules in January 2017; operators generally had one year from the January 2017 effective date of the rule to come into compliance with the rule’s requirements. However, in December 2017, the BLM temporarily suspended or delayed certain of these requirements set forth in its Venting and Flaring Rule until January 2019, pending administrate review of the rule. These rules have required changes to our operations, including the installation of new equipment to control emissions. The EPA had also announced that it intends to impose methane emission standards for existing sources and has issued information collection requests for oil and natural gas facilities. These rules would result in an increase to our operating costs and change to our operations. As a result of this continued regulatory focus, future federal and state regulations of the oil and natural gas industry remain a possibility and could result in increased compliance costs on our operations.
In November 2015, the EPA also revised the existing National Ambient Air Quality Standards for ground level ozone to make the standard more stringent. Certain areas of the country previously in compliance with the various National Ambient Air Quality Standards, including areas where we operate, may be reclassified as non-attainment areas. The EPA has not yet designated which areas of the country are out of attainment with the new ground level ozone standard, and it will take the states several years to develop compliance plans for their non-attainment areas. If the areas where we operate are reclassified as non-attainment areas, such reclassifications may make it more difficult to construct new or modified sources of emission control in those areas. While we are not able to determine the extent to which this new standard will impact our business at this time, it has the potential to have a material impact on our operations and cost structure.
In addition, on June 3, 2016, the EPA finalized a rule “aggregating” individual wells and other facilities and their collective emissions for purposes of determining whether major source permitting requirements apply under the CAA. These changes may introduce uncertainty into the permitting process and could require more lengthy and costly permitting processes and more expensive emission controls.
Collectively, these rules and proposed rules, as well as any future laws and their implementing regulations, may require a number of modifications to our operations. We may, for example, be required to install new equipment to control emissions from our well sites or compressors at initial startup or by the applicable compliance deadline. We may also be required to obtain pre-approval for the expansion or modification of existing facilities or the construction of new facilities. Compliance with such rules could result in significant costs, including increased capital expenditures and operating costs, and could adversely impact our business.
Greenhouse Gas Emissions. In response to findings that emissions of carbon dioxide, methane and other “greenhouse gases,” or GHGs, present an endangerment to public health and the environment, the EPA has issued regulations to restrict emissions of GHGs under existing provisions of the CAA. These regulations include limits on tailpipe emissions from motor vehicles and preconstruction and operating permit requirements for certain large stationary sources.
Both in the United States and worldwide, there is increasing attention being paid to the issue of climate change and the contributing effect of GHG emissions. Most recently in April 2016, the United States signed the Paris Agreement, which requires countries to review and “represent a progression” in their intended nationally determined contributions, which set GHG emission reduction goals, every five years beginning in 2020. However, in June 2017, President Trump announced that the United States plans to withdraw from the Paris Agreement and to seek negotiations either to reenter the Paris Agreement on different terms or establish a new framework agreement. The Paris Agreement provides for a four-year exit process beginning in November 2016, which would result in an effective exit date of November 2020. The United States’ adherence to the exit process and/or the terms on which the United States may reenter the Paris Agreement or a separately negotiated agreement are unclear at this time.
On August 3, 2015, the EPA also issued new regulations limiting carbon dioxide emissions from existing power generation facilities. Under this rule, nationwide carbon dioxide emissions would be reduced by approximately 30 percent from 2005 levels by 2030 with a flexible interim goal. Several industry groups and states challenged the rule. On February 9, 2016, the U.S. Supreme Court stayed the implementation of this rule pending judicial review. On March 28, 2017, President Trump signed an Executive Order directing the EPA to review the regulations, and on April 4, 2017, the EPA announced that it was reviewing the 2015 carbon dioxide regulations. On April 28, 2017, the U.S. Court of Appeals for the District of Columbia stayed the litigation pending the current administration’s review. That stay was extended for another 60 days on August 8, 2017. On October 10, 2017, the EPA initiated the formal rulemaking process to repeal the regulations. The EPA’s proposal will be subject to public comment and likely legal challenge, and as such we cannot predict at this time what impact the rulemaking will have on the demand for oil and natural gas production and our operations.
9
The EPA also has issued the “Final Mandatory Reporting of Greenhouse Gases” Rule and a series of revisions to it, which requires operators of oil and gas production, natural gas processing, transmission, distribution and storage facilities and other stationary sources emitting more than established annual thresholds of carbon dioxide-equivalent GHGs to inventory and report their GHG emissions occurring in the prior calendar year on a facility-by-facility basis. These rules do not require control of GHGs. However, the EPA has indicated that it will use data collected through the reporting rules to decide whether to promulgate future GHG limits.
In certain circumstances, large sources of GHG emissions are subject to preconstruction permitting under the EPA’s Prevention of Significant Deterioration program. This program historically has had minimal applicability to the oil and gas production industry. However, there can be no assurance that our operations will avoid applicability of these or similar permitting requirements, which impose costs relating to emissions control systems and the efforts needed to obtain the permit.
Additional GHG regulations potentially affecting our industry include those described above under the subheading “Clean Air Act” which relate to methane.
Future federal GHG regulations of the oil and gas industry remain a possibility. Also, many states and regions have adopted GHG initiatives and certain governmental bodies have or are considering the imposition of fees or taxes based on the emission of GHGs by certain facilities. Many states have established GHG cap and trade programs. Most of these cap and trade programs work by requiring major sources of emissions, such as electric power plants, or major producers of fuels, such as refineries and natural gas processing plants, to acquire and surrender emission allowances. While it is not possible to predict how any regulations to restrict GHG emissions may come into force, these and other legislative and regulatory proposals for restricting GHG emissions or otherwise addressing climate change could require us to incur additional operating costs or curtail oil and gas operations in certain areas and could also adversely affect demand for the oil and gas we sell.
Finally, it should be noted that some scientists have concluded that increasing concentrations of GHGs in the Earth’s atmosphere may produce climate changes that have significant physical effects, such as increased frequency and severity of storms, floods and other climatic events; if any such effects were to occur, they could have an adverse effect on our operations.
OSHA. We are subject to the requirements of the Occupational Safety and Health Act, or OSHA, and comparable state laws that regulate the protection of the health and safety of workers. In addition, the OSHA hazard communication standard requires maintenance of information about hazardous materials used or produced in operations, and the provision of such information to employees, state and local government authorities and citizens. Other OSHA standards regulate specific worker safety aspects of our operations.
Endangered Species Act. The Endangered Species Act restricts activities that may affect endangered species or their habitats. While some of our facilities are in areas that may be designated as a habitat for endangered species, we believe that we are in substantial compliance with the Endangered Species Act. The presence of any protected species or the final designation of previously unprotected species as threatened or endangered in areas where we operate could result in increased costs from species protection measures or could result in limitations, delays, or prohibitions on our exploration and production activities that could have an adverse effect on our ability to develop and produce our reserves.
National Environmental Policy Act. Oil and natural gas exploration and production activities on federal lands are subject to the National Environmental Policy Act, or NEPA. NEPA requires federal agencies, including the U.S. Department of Interior, to evaluate major agency actions having the potential to significantly impact the environment. In the course of such evaluations, an agency will prepare an environmental assessment of the potential direct, indirect and cumulative impacts of a proposed project and, if necessary, will prepare a more detailed environmental impact statement that may be made available for public review and comment. This process has the potential to delay or even halt development of some of our oil and natural gas projects.
Employees and Labor Relations
We had a total of 80 employees as of December 31, 2017. We hire independent contractors on an as needed basis. We consider our current employee relations to be favorable. We and our employees are not subject to any collective bargaining agreements.
10
Available Information
Our internet address is http://www.pennvirginia.com. We make available free of charge on or through our website our Corporate Governance Principles, Code of Business Conduct and Ethics, Executive and Financial Officer Code of Ethics, Audit Committee Charter, Compensation and Benefits Committee Charter and Nominating and Governance Committee Charter, and we will provide copies of such documents to any shareholder who so requests. We also make available free of charge on or through our website our Annual Reports on Form 10-K, Quarterly Reports on Form 10-Q, Current Reports on Form 8-K and any amendments to those reports filed or furnished pursuant to Section 13(a) or 15(d) of the Exchange Act, as soon as reasonably practicable after we electronically file such material with, or furnish it to, the SEC. Investors can obtain current and important information about the company from our website on a regular basis. The information contained on, or connected to, our website is not incorporated by reference into this Form 10-K and should not be considered part of this or any other report that we furnish or file with the SEC. We intend for our website to serve as a means of public dissemination of information for purposes of Regulation FD.
Item 1A Risk Factors
Our business and operations are subject to a number of risks and uncertainties as described below; however, the risks and uncertainties described below are not the only ones we face. Additional risks and uncertainties that we are unaware of, or that we may currently deem immaterial, may become important factors that harm our business, financial condition, results of operations and cash flows in the future. If any of the following risks actually occur, our business, financial condition, results of operations and cash flows could suffer and the trading price of our common stock could decline.
Prices for crude oil, NGLs and natural gas are dependent on many factors that are beyond our control.
Prices for crude oil, NGLs and natural gas are dependent on many factors that are beyond our control, including:
• | domestic and foreign supplies of crude oil, NGLs and natural gas; |
• | domestic and foreign consumer demand for crude oil, NGLs and natural gas; |
• | political and economic conditions in oil or gas producing regions; |
• | the ability of the members of the Organization of Petroleum Exporting Countries and other exporting nations to agree upon and maintain production constraints and oil price controls; |
• | overall domestic and foreign economic conditions; |
• | prices and availability of, and demand for, alternative fuels; |
• | technological advances affecting energy consumption; |
• | political and economic events that directly or indirectly impact the relative strength or weakness of the United States dollar, on which crude oil prices are benchmarked globally, against foreign currencies; |
• | risks related to the concentration of our operations in the Eagle Ford Shale field in South Texas; |
• | speculation by investors in oil and gas; |
• | the availability, proximity and capacity of gathering, processing, refining and transportation facilities; |
• | the cost and availability of products and personnel needed for us to produce oil and natural gas; |
• | weather conditions; and |
• | domestic and foreign governmental relations, regulation and taxation. |
It is impossible to predict future commodity price movements with certainty; however, many of our projections and estimates are based on assumptions as to the future prices of crude oil, NGLs and natural gas. These price assumptions are used for planning purposes. We expect our assumptions will change over time and that actual prices in the future will likely differ from our estimates. Any substantial or extended decline in the actual prices of crude oil, NGLs or natural gas would have a material adverse effect on our business, financial position, results of operations and cash flows and borrowing capacity, the quantities of oil and gas reserves that we can economically produce, the quantity of estimated proved reserves that may be attributed to our properties and our ability to fund our capital program.
Exploration and development drilling are high-risk activities with many uncertainties and may not result in commercially productive reserves.
Our future financial condition and results of operations depend on the success of our exploration and production activities. Oil and gas drilling and production activities are subject to numerous risks, including the risk that drilling will not result in commercially viable oil or natural gas production. The costs of drilling, completing and operating wells are often substantial and uncertain, and drilling operations may be curtailed, delayed or canceled as a result of a variety of factors, many of which are beyond our control, including:
• | unexpected drilling conditions; |
• | the use of multi-well pad drilling that requires the drilling of all of the wells on a pad until any one of the pad’s wells can be brought into production; |
• | reductions in oil, natural gas and NGL prices; |
• | elevated pressure or irregularities in geologic formations; |
11
• | loss of title or other title related issues; |
• | equipment failures or accidents; |
• | costs, shortages or delays in the availability of drilling rigs, crews, equipment and materials; |
• | shortages in experienced labor; |
• | crude oil, NGLs or natural gas gathering, transportation and processing availability |
restrictions or limitations;
• | surface access restrictions; |
• | delays imposed by or resulting from compliance with regulatory requirements, including any hydraulic fracturing regulations and other applicable regulations, and the failure to secure or delays in securing necessary regulatory approvals and permits; |
• | political events, public protests, civil disturbances, terrorist acts or cyber attacks; |
• | environmental hazards, such as natural gas leaks, oil spills, pipeline and tank ruptures, encountering naturally occurring radioactive materials, and unauthorized discharges of brine, well stimulation and completion fluids, toxic gases or other pollutants into the surface and subsurface environment; |
• | limited availability of financing at acceptable terms; |
• | limitations in the market for crude oil, natural gas and NGLs; |
• | fires, explosions, blow-outs and surface cratering; and |
• | adverse weather conditions. |
The prevailing prices of crude oil, NGLs and natural gas also affect the cost of and the demand for drilling rigs, frac crews, materials (including sand) and other equipment and related services. The availability of drilling rigs, frac crews, materials (including sand) and equipment can vary significantly from region to region at any particular time. Although land drilling rigs and frac crews can be moved from one region to another in response to changes in levels of demand, an undersupply in any region may result in drilling and/or completions delays and higher well costs in that region.
The wells we drill may not be productive and we may not recover all or any portion of our investment in such wells. Our decisions to purchase, explore, develop or otherwise exploit prospects or properties depend in part on the evaluation of data obtained through geophysical and geological analyses, production data and engineering studies, the results of which are often inconclusive or subject to varying interpretations. The seismic data and other technologies we use do not allow us to know conclusively prior to drilling a well that oil or gas is present or may be produced economically. Furthermore, the cost of drilling, completing, equipping and operating a well is often uncertain, and cost factors can adversely affect the economics of a project. Overruns in budgeted expenditures are common risks that can make a particular project uneconomical or less economical than forecasted. In addition, limitations on the use of hydraulic fracturing could have an adverse effect on our ability to develop and produce oil and gas from new wells, which would reduce our rate of return on these wells and our cash flows. Drilling activities can result in dry holes or wells that are productive but do not produce sufficient net revenues after operating and other costs to cover initial drilling costs.
Our future drilling activities may not be successful, nor can we be sure that our overall drilling success rate or our drilling success rate within a particular area will not decline. Unsuccessful drilling activities could have a material adverse effect on our business, financial condition, results of operations and cash flows. Also, we may not be able to obtain any options or lease rights in potential drilling locations that we identify. Although we have identified numerous potential drilling locations, we may not be able to economically produce oil or gas from all of them.
We may not adhere to our proposed drilling schedule.
Our final determination of whether to drill any wells will be dependent on a number of factors, including:
• | the results of our exploration efforts and the acquisition, review and analysis of the seismic data; |
• | the availability of sufficient capital resources to us and the other participants for the drilling of the prospects; |
• | the approval of the prospects by the other participants after additional data has been compiled; |
• | economic and industry conditions at the time of drilling, including prevailing and anticipated prices for oil and gas and the availability and prices of drilling rigs and crews, frac crews, and related equipment and material; and |
• | the availability of leases and permits on reasonable terms for the prospects. |
Although we have identified numerous drilling prospects, we may not be able to lease or drill those prospects within our expected time frame or at all. There can be no assurance that these projects can be successfully developed or that any identified drill sites will, if drilled, encounter reservoirs of commercially productive oil or gas or that we will be able to complete such wells on a timely basis, or at all. We may seek to sell or reduce all or a portion of our interest in a project area or with respect to prospects wells within such project area.
12
The unavailability, high cost or shortage of drilling rigs, frac crews, equipment, raw materials, supplies, oilfield services or personnel may restrict our operations.
The oil and natural gas industry is cyclical, which can result in shortages of drilling rigs, frac crews, equipment, raw materials (particularly sand and other proppants), supplies and personnel. When shortages occur, the costs and delivery times of drilling rigs, equipment and supplies increase and demand for, and wage rates of, qualified drilling rig and frac crews also rise with increases in demand. We cannot predict whether these conditions will exist in the future and, if so, what their timing and duration will be. In accordance with customary industry practice, we rely on independent third party service providers to provide most of the services necessary to drill new wells. If we are unable to secure a sufficient number of drilling rigs and frac crews at reasonable costs, our financial condition and results of operations could suffer, and we may not be able to drill all of our acreage before our leases expire. Shortages of drilling rigs, frac crews, equipment, raw materials (particularly sand and other proppants), supplies, personnel, trucking services, tubulars, fracking and completion services and production equipment could delay or restrict our exploration and development operations, which in turn could impair our financial condition and results of operations.
Our future performance depends on our ability to find or acquire additional oil and gas reserves that are economically recoverable.
Unless we successfully replace the reserves that we produce, our reserves will decline, eventually resulting in a decrease in oil and gas production and lower revenues and cash flows from operating activities. We must make substantial capital expenditures to find, acquire, develop and produce new oil and gas reserves. We may not be able to make the necessary capital investments to maintain or expand our oil and gas reserves with our cash flows from operating activities. Furthermore, external sources of capital may be limited.
If we cannot obtain sufficient capital when needed, we will not be able to continue with our business strategy.
Our business strategy has historically included maintaining a portfolio of properties that provide long-term, profitable growth through development in areas that support sustainable, lower-risk, repeatable, high-return drilling projects. In the future, we may not be able to obtain financing in sufficient amounts or on acceptable terms when needed, which could adversely affect our operating results and prospects. If we cannot raise the capital required to implement our business strategy, we may be required to curtail operations, which could adversely affect our financial condition, results of operations and cash flows.
The ability to attract and retain key personnel is critical to the success of our business and may be challenging.
The success of our business depends on key personnel. The ability to attract and retain these key personnel may be difficult in light of the volatility of our business. We may need to enter into retention or other arrangements that could be costly to maintain. If executives, managers or other key personnel resign, retire or are terminated, or their service is otherwise interrupted, we may not be able to replace them in a timely manner and we could experience significant declines in productivity.
Certain of our undeveloped leasehold assets are subject to leases that will expire over the next several years unless production is established on the acreage.
Leases on oil and natural gas properties typically have a term after which they expire unless, prior to expiration, a well is drilled and production of hydrocarbons in paying quantities is established. If our leases expire and we are unable to renew the leases, we will lose our right to develop the related properties. While we seek to actively manage our leasehold inventory through drilling wells to hold the leasehold acreage that we believe is material to our operations, our drilling plans for these areas are subject to change and subject to the availability of capital.
We are exposed to the credit risk of our customers, and nonpayment or nonperformance by these parties would reduce our cash flows.
We are subject to risk from loss resulting from our customers’ nonperformance or nonpayment. We depend on a limited number of customers for a significant portion of our revenues. The concentration of credit risk may be affected by changes in economic or other conditions within our industry and may accordingly affect our overall credit risk. Recently, many of our customers’ equity values have substantially declined. The combination of reduction of cash flow resulting from declines in commodity prices and the lack of availability of debt or equity financing may result in a significant reduction in our customers’ liquidity and ability to make payments or perform on their obligations to us. In 2017, approximately 86 percent of our total consolidated product revenues resulted from three of our customers. Any nonpayment or nonperformance by our customers would reduce our cash flows.
13
We participate in oil and gas leases with third parties and these third parties may not be able to fulfill their commitments to our projects.
We frequently own less than 100 percent of the working interest in the oil and gas leases on which we conduct operations, and other parties own the remaining portion of the working interest under joint venture arrangements. Financial risks are inherent in any operation where the cost of drilling, equipping, completing and operating wells is shared by more than one party. We could be held liable for joint venture obligations of other working interest owners, such as nonpayment of costs and liabilities arising from the actions of the other working interest owners. In addition, the volatility in commodity prices and currently depressed commodity environment increases the likelihood that some of these working interest owners may not be able to fulfill their joint venture obligations. Some of our project partners have experienced liquidity and cash flow problems. These problems have led and may lead our partners to continue to attempt to delay the pace of project development in order to preserve cash. A partner may be unable or unwilling to pay its share of project costs. In some cases, a partner may declare bankruptcy. In the event any of our project partners do not pay their share of such costs, we would likely have to pay those costs, and we may be unsuccessful in any efforts to recover these costs from our partners, which could materially adversely affect our financial condition, results of operations and cash flows.
Estimates of oil and gas reserves and future net cash flows are not precise, and undeveloped reserves may not ultimately be converted into proved producing reserves.
This Annual Report on Form 10-K contains estimates of our proved oil and gas reserves and the estimated future net cash flows from such reserves. These estimates are based upon various assumptions, including assumptions relating to crude oil, NGL and natural gas prices, drilling and operating expenses, capital expenditures, taxes and availability of funds. The process of estimating oil and gas reserves is complex. This process requires significant decisions and assumptions in the evaluation of available geological, geophysical, engineering and economic data for each reservoir. These estimates are dependent on many variables and, therefore, changes often occur as these variables evolve and commodity prices fluctuate. Any material inaccuracies in these reserve estimates or underlying assumptions could materially affect the estimated quantities and present value of our reserves.
Actual future production, crude oil, NGL and natural gas prices, revenues, taxes, development expenditures, operating expenses and quantities of recoverable oil and gas reserves will most likely vary from those estimated. Any significant variance could materially affect the estimated quantities and present value of reserves disclosed by us. In addition, we may adjust estimates of proved reserves to reflect production history, results of exploration and development, prevailing crude oil, NGL and natural gas prices and other factors, many of which are beyond our control.
At December 31, 2017, approximately 56 percent of our estimated proved reserves were proved undeveloped, compared to 47 percent at December 31, 2016. Estimation of proved undeveloped reserves and proved developed non-producing reserves is based on volumetric calculations and adjacent reserve performance data. Recovery of proved undeveloped reserves requires significant capital expenditures and successful drilling operations. Our reserve data assumes that we can and will make these significant expenditures to develop our reserves and conduct these drilling operations successfully. These assumptions, however, may not prove correct, and our estimated costs may not be accurate, development may not occur as scheduled and actual results may not occur as estimated.
The reserve estimation standards under SEC rules provide that, subject to limited exceptions, proved undeveloped reserves may only be booked if they relate to wells scheduled to be drilled within five years of the date of booking. These standards may limit our potential to book additional proved undeveloped reserves as we pursue our drilling program. Moreover, we may be required to write down our proved undeveloped reserves if we do not develop those reserves within the required five-year time frame or cannot demonstrate that we could do so. Accordingly, our reserve report at December 31, 2017 includes estimates of total future development costs over the next five years associated with our proved undeveloped reserves of approximately $663 million. If we choose not to spend the capital to develop these reserves, or if we are not otherwise able to successfully develop these reserves, we will be required to write-off these reserves. During the year ended December 31, 2017, we wrote-off 4.7 MMBOE of proved undeveloped reserves because they are no longer expected to be developed within five years of their initial recording. Any such write-offs of our reserves could reduce our ability to borrow money and could reduce the value of our securities.
You should not assume that the present value of estimated future net cash flows (standardized measure) referred to herein is the current fair value of our estimated oil and gas reserves. In accordance with SEC requirements, we base the estimated discounted future net cash flows from our proved reserves on prices and costs on the date of the estimate. Actual current and future prices and costs may be materially higher or lower than the prices and costs as of the date of the estimate. As a result, net present value estimates using actual prices and costs may be significantly less than the SEC estimate that is provided herein. Actual future net cash flows may also be affected by the amount and timing of actual production, availability of financing for capital expenditures necessary to develop our undeveloped reserves, supply and demand for oil and gas, increases or decreases in consumption of oil and gas and changes in governmental regulations or taxation. In addition, the 10% discount factor, which is required by the SEC to be used in calculating discounted future net cash flows for reporting purposes, is not necessarily the most accurate discount factor for us. With all other factors held constant, if commodity prices used in the reserve report were to
14
decrease by 10%, our standardized measure and PV-10 would have decreased to approximately $443 million and $457 million, respectively. Any adjustments to the estimates of proved reserves or decreases in the price of our commodities may decrease the value of our securities.
We may record impairments on our oil and gas properties.
Quantities of proved reserves are estimated based on economic conditions in existence in the period of assessment. Lower crude oil, NGL and natural gas prices may have the impact of shortening the economic lives of certain fields because it becomes uneconomic to produce all reserves within such fields, thus reducing proved property reserve estimates. If such revisions in the estimated quantities of proved reserves occur, it will have the effect of increasing the rates of depreciation, depletion and amortization, or DD&A, on the affected properties, which would decrease earnings or result in losses through higher DD&A expense. The revisions may also be significant enough to result in a write-down that would further decrease reported earnings.
The full cost method of accounting for oil and gas properties under GAAP requires that at the end of each quarterly reporting period, the unamortized cost of our oil and gas properties, net of deferred income taxes, is limited to the sum of the estimated discounted future net revenues from proved properties adjusted for costs excluded from amortization and related income taxes, or a Ceiling Test. The estimated discounted future net revenues are determined using the prior 12-month’s average price based on closing prices on the first day of each month, adjusted for differentials, discounted at 10%. The calculation of the Ceiling Test and provision for DD&A are based on estimates of proved reserves. There are significant uncertainties inherent in estimating quantities of proved reserves and projecting future rates of production, timing and plan of development. In addition to revisions to reserves and the impact of lower commodity prices, Ceiling Test write-downs may occur due to increases in estimated operating and development costs and other factors.
During the past several years, we have been required to write-down the value of certain of our oil and gas properties and related assets, including $1.4 billion in 2015, while we applied the successful efforts method of accounting for oil and gas properties. We could experience additional write-downs in the future while applying the full cost method of accounting for oil and gas properties. While such a charge reflects our inability to recover the carrying value of our investments, it does not impact our cash flows from operating activities.
Our business depends on gathering, processing, refining and transportation facilities owned by others.
We deliver substantially all of our oil and gas production through pipelines and trucks that we do not own. The marketability of our production depends upon the availability, proximity and capacity of these pipelines and trucks, as well as gathering systems, gas processing facilities and downstream refineries. The unavailability of or lack of available capacity on these systems and facilities could result in the shut-in of producing wells, the reduction in wellhead pricing or the delay or discontinuance of development plans for properties. Federal, state and local regulation of oil and gas production and transportation, tax and energy policies, changes in supply and demand, pipeline pressures, damage to or destruction of pipelines and general economic conditions could adversely affect our ability to produce, gather, process, refine and market our oil and gas.
We rely on third-party service providers to conduct the drilling and completion operations on properties we operate.
Where we are the operator of a property, we rely on third-party service providers to perform necessary drilling and completion operations. The ability and availability of third-party service providers to perform such drilling and completion operations will depend on those service providers’ ability to compete for and retain qualified personnel, financial condition, economic performance, and access to capital, which in turn will depend upon the supply and demand for oil, NGLs and natural gas, prevailing economic conditions and financial, business and other factors. The failure of a third-party service provider to adequately perform operations on a timely basis could delay drilling or completion operations, reduce production from the property or cause other damage to operations, each of which could adversely affect our business, financial condition, results of operations and cash flows.
Our property acquisitions carry significant risks.
Acquisition of oil and gas properties is a key element of maintaining and growing reserves and production. Competition for these assets has been and will continue to be intense. We may not be able to identify attractive acquisition opportunities. Even if we do identify attractive candidates, we may not be able to complete the acquisition or do so on commercially acceptable terms. In the event we do complete an acquisition, its success will depend on a number of factors, many of which are beyond our control. These factors include the purchase price, future crude oil, NGL and natural gas prices, the ability to reasonably estimate or assess the recoverable volumes of reserves, rates of future production and future net revenues attainable from reserves, future operating and capital costs, results of future exploration, exploitation and development activities on the acquired properties and future abandonment and possible future environmental or other liabilities. There are numerous uncertainties inherent in estimating quantities of proved oil and gas reserves, actual future production rates and associated costs and potential liabilities with respect to prospective acquisition targets. Actual results may vary substantially from those assumed in the estimates. A customary review of subject properties will not necessarily reveal all existing or potential problems.
15
Additionally, significant acquisitions can change the nature of our operations and business depending upon the character of the acquired properties if they have substantially different operating and geological characteristics or are in different geographic locations than our existing properties. To the extent that acquired properties are substantially different than our existing properties, our ability to efficiently realize the expected economic benefits of such transactions may be limited.
Integrating acquired businesses and properties involves a number of special risks. These risks include the possibility that management may be distracted from regular business concerns by the need to integrate operations and systems and that unforeseen difficulties can arise in integrating operations and systems and in retaining and assimilating employees. Any of these or other similar risks could lead to potential adverse short-term or long-term effects on our operating results, and may cause us to not be able to realize any or all of the anticipated benefits of the acquisitions.
Properties we acquire may not produce as projected, and we may be unable to determine reserve potential, identify liabilities associated with the properties or obtain protection from sellers against them.
Our initial technical reviews of properties we acquire are necessarily limited because an in-depth review of every individual property involved in each acquisition generally is not feasible. Even a detailed review of records and properties may not necessarily reveal existing or potential problems, nor will it permit a buyer to become sufficiently familiar with the properties to assess fully their deficiencies and potential. Inspections may not always be performed on every well and environmental problems, such as soil or ground water contamination, are not necessarily observable even when an inspection is undertaken. Even when problems are identified, we may assume certain environmental and other risks and liabilities in connection with acquired properties, and such risks and liabilities could have a material adverse effect on its results of operations and financial condition.
We may incur losses as a result of title deficiencies.
We purchase working and revenue interests in the oil and gas leasehold interests upon which we will perform our exploration activities from third parties or directly from the mineral fee owners. The existence of a material title deficiency can render a lease worthless and can adversely affect our results of operations and financial condition. Title insurance covering mineral leaseholds is not generally available and, in all instances, we forego the expense of retaining lawyers to examine the title to the mineral interest to be placed under lease or already placed under lease until the drilling block is assembled and ready to be drilled. Even then, the cost of performing detailed title work can be expensive. We may choose to forgo detailed title examination by title lawyers on a portion of the mineral leases that we place in a drilling unit or conduct less title work than we have traditionally performed. As is customary in our industry, we generally rely upon the judgment of oil and gas lease brokers or independent landmen who perform the field work in examining records in the appropriate governmental offices and abstract facilities before attempting to acquire or place under lease a specific mineral interest and before drilling a well on a leased tract. We, in some cases, perform curative work to correct deficiencies in the marketability or adequacy of the title to us. The work might include obtaining affidavits of heirship or causing an estate to be administered. In cases involving more serious title problems, the amount paid for affected oil and gas leases can be generally lost and the target area can become undrillable. The failure of title may not be discovered until after a well is drilled, in which case we may lose the lease and the right to produce all or a portion of the minerals under the property. Our industry is highly competitive and we may not be able to compete effectively.
We face difficulties in competing with larger companies. The costs of doing business in the exploration and production industry, including such costs as those required to explore new oil and natural gas plays, to acquire new acreage, and to develop attractive oil and natural gas projects, are significant. We face intense competition in all areas of our business from companies with greater and more productive assets, greater access to capital, substantially larger staffs and greater financial and operating resources than we have. Our limited size has placed us at a disadvantage with respect to funding our capital and operating costs, and means that we are more vulnerable to commodity price volatility and overall industry cycles, are less able to absorb the burden of changes in laws and regulations, and that poor results in any single exploration, development or production play can have a disproportionately negative impact on us.
We also compete for people, including experienced geologists, geophysicists, engineers and other professionals. Our limited size has placed us at a disadvantage with respect to attracting and retaining management and other professionals with the technical abilities necessary to successfully operate our business.
Our lack of diversification increases the risk of an investment in us and we are vulnerable to risks associated with operating primarily in one major contiguous area.
Over 90 percent of our production, revenues and capital expenditures for 2017 were attributable to the Eagle Ford Shale in South Texas, making us vulnerable to risks associated with operating in one geographic area. Due to the concentrated nature of our business activities, a number of our properties could experience any of the same conditions at the same time, resulting in a relatively greater impact on our results of operations than they might have on other companies that are more diversified. In particular, we may be disproportionately exposed to the impact of regional supply and demand factors, delays or interruptions of production from wells in which we have an interest that are caused by transportation capacity constraints, curtailment of production, availability of equipment, facilities, personnel or services, significant governmental regulation, natural disasters,
16
adverse weather conditions, plant closures for scheduled maintenance or interruption of transportation of crude oil or natural gas produced from wells in the Eagle Ford. Such delays or interruptions could have a material adverse effect on our financial condition, results of operations and cash flows.
We emerged from bankruptcy in September 2016, which could adversely affect our business and relationships.
It is possible that our having filed for bankruptcy and our emergence could adversely affect our business and relationships with customers, employees and suppliers. Due to uncertainties, many risks exist, including the following:
• | key suppliers could terminate their relationship or require financial assurances or enhanced performance; |
• | our ability to renew existing contracts and compete for new business may be adversely affected; |
• | our ability to attract, motivate and/or retain key executives and employees may be adversely affected; |
• | employees may be distracted from performance of their duties or more easily attracted to other employment opportunities; |
• | our ability to obtain credit and raise capital on terms acceptable to us or at all; |
• | our ability to attract and retain customers may be negatively impacted; |
• | risks related to challenges to the Plan; and |
• | we may incur legal costs associated with addressing claims under the Plan. |
The occurrence of one or more of these events could have a material and adverse effect on our operations, financial condition and reputation. We cannot assure you that having been subject to bankruptcy protection will not adversely affect our operations in the future.
Our actual financial results after emergence from bankruptcy may not be comparable to our historical financial information as a result of the implementation of the plan of reorganization and the transactions contemplated thereby and our adoption of fresh start accounting and the full cost method of accounting for oil and gas properties.
Upon our emergence from bankruptcy, we adopted Fresh Start Accounting and the full cost method of accounting for oil and gas properties. Accordingly, our financial condition and results of operations after September 2016 may not be comparable to the financial condition or results of operations reflected in the Predecessor’s historical financial statements. The lack of comparable historical financial information may discourage investors from purchasing our common stock. The adoption of Fresh Start Accounting established a new basis for our assets and liabilities on the Emergence Date. The adoption of the full cost method of accounting for oil and gas properties, as compared to the successful efforts method utilized by the Predecessor, results in the capitalization of additional costs as well as different methodologies to determine depletive write-offs and impairments. For a more detailed discussion of Fresh Start Accounting and the full cost method of accounting for oil and gas properties, see the discussion of “Critical Accounting Estimates” included in Part II, Item 7, “Management’s Discussion and Analysis of Financial Condition and Results of Operations” as well as Notes 3, 4 and 8 to the Consolidated Financial Statements included in Part II, Item 8, “Financial Statements and Supplementary Data.”
We have substantial indebtedness and may incur substantially more debt. Higher levels of indebtedness make us more vulnerable to economic downturns and adverse developments in our business.
We had $277 million of outstanding debt at December 31, 2017, including $77 million under the Credit Agreement as amended, or the Credit Facility, and $200 million, excluding unamortized discount and issuance costs, under the $200 million Second Lien Credit Agreement, or the Second Lien Facility.
As a result of our indebtedness, we will need to use a portion of our cash flow to pay interest, which will reduce the amount we will have available to fund our operations and other business activities and could limit our flexibility in planning for or reacting to changes in our business and the industry in which we operate. The amount of our debt may also cause us to be more vulnerable to economic downturns and adverse developments in our business. We may incur substantially more debt in the future.
Any increase in our level of indebtedness could have adverse effects on our financial condition and results of operations, including imposing additional cash requirements on us in order to support interest payments, increasing our vulnerability to adverse changes in general economic and industry conditions and limiting our ability to obtain additional financing for working capital, capital expenditures, general corporate and other purposes.
The borrowing base under our credit facility may be reduced in the future if commodity prices decline.
The borrowing base under the Credit Facility, was $237.5 million as of December 31, 2017 and $340 million as of March 1, 2018. Our borrowing base is redetermined at least twice each year and is scheduled to next be redetermined in October 2018. If crude oil, NGL or natural gas prices decline, the borrowing base under the Credit Facility may be reduced. As a result, we may be unable to obtain funding under the Credit Facility. If funding is not available when or in the amounts needed, or is available only on unfavorable terms, it might adversely affect our development plan and our ability to make new acquisitions, each of which could have a material adverse effect on our production, financial condition, results of operations and cash flows.
17
The Credit Facility and the Second Lien Facility have restrictive covenants that could limit our financial flexibility.
The Credit Facility and Second Lien Facility contain financial and other restrictive covenants that limit our ability to engage in activities that may be in our long-term best interests. Our ability to borrow under the Credit Facility is subject to compliance with certain financial covenants, including leverage, interest coverage and current ratios.
The Credit Facility and the Second Lien Facility include other restrictions that, among other things, limit our ability to incur indebtedness; grant liens; engage in mergers, consolidations and liquidations; make asset dispositions, restricted payments and investments; enter into transactions with affiliates; and amend, modify or prepay certain indebtedness.
Our business plan and our compliance with these covenants are based on a number of assumptions, the most important of which is relatively stable oil and gas prices at economically sustainable levels. If the price that we receive for our oil and gas production deteriorates significantly from current levels it could lead to lower revenues, cash flows and earnings, which in turn could lead to a default under certain financial covenants contained in our Credit Facility. Because the calculations of the financial ratios are made as of certain dates, the financial ratios can fluctuate significantly from period to period as the amounts outstanding under our Credit Facility are dependent on the timing of cash flows related to operations, capital expenditures, sales of oil and gas properties and securities offerings. Our failure to comply with these covenants could result in an event of default that, if not cured or waived, could result in the acceleration of all of our debts. We may not have sufficient working capital to satisfy our debt obligations in the event of an acceleration of all or a significant portion of our outstanding indebtedness.
We are subject to complex laws and regulations that can adversely affect the cost, manner or feasibility of doing business.
Exploration, development, production and sale of oil and gas are subject to extensive federal, state and local laws and regulations, including complex environmental laws. Future laws or regulations, any adverse changes in the interpretation of existing laws and regulations, inability to obtain necessary regulatory approvals or a failure to comply with existing legal requirements may harm our business, results of operations, financial condition or cash flows. We may be required to make large expenditures to comply with environmental and other governmental regulations. Failure to comply with these laws and regulations may result in the suspension or termination of operations and subject us to administrative, civil and criminal penalties. Matters subject to regulation include discharge permits for drilling operations, drilling bonds, spacing of wells, unitization and pooling of properties, environmental protection and taxation. Our operations create the risk of environmental liabilities to the government or third parties for any unlawful discharge of oil, gas or other pollutants into the air, soil or water. In the event of environmental violations or other environmental, health or safety impacts, we may be charged with remedial costs and land owners may file claims for alternative water supplies, property damage or bodily injury. Laws and regulations protecting the environment have become more stringent in recent years, and may, in some circumstances, result in liability for environmental damage regardless of negligence or fault. No assurance can be given that continued compliance with existing or future environmental laws and regulations will not result in a curtailment of production or processing activities or result in a material increase in the costs of production, development, exploration or processing operations. In addition, pollution and similar environmental risks generally are not fully insurable. These liabilities and costs could have a material adverse effect on our business, financial condition, results of operations and cash flows. See Part I, Item 1, “Business - Government Regulation and Environmental Matters.”
Our business involves many operating risks, including hydraulic fracturing, that may result in substantial losses for which insurance may be unavailable or inadequate.
Our operations are subject to all of the risks and hazards typically associated with the exploitation, development and exploration for and the production and transportation of oil and gas, including well stimulation and completion activities such as hydraulic fracturing. These operating risks include:
• | fires, explosions, blowouts, cratering and casing collapses; |
• | formations with abnormal pressures; |
• | pipeline ruptures or spills; |
• | uncontrollable flows of oil, natural gas or well fluids; |
• | migration of fracturing fluids into surrounding groundwater; |
• | spills or releases of fracturing fluids including from trucks sometimes used to deliver these materials; |
• | spills or releases of brine or other produced water that may go off-site; |
• | subsurface conditions that prevent us from (i) stimulating the planned number of stages, (ii) accessing the entirety of the wellbore with our tools during completion or (iii) removing all fracturing-related materials from the wellbore to allow production to begin; |
• | environmental hazards such as natural gas leaks, oil or produced water spills and discharges of toxic gases; and |
• | natural disasters and other adverse weather conditions, terrorism, vandalism and physical, electronic and cyber security breaches. |
18
Any of these risks could result in substantial losses resulting from injury or loss of life, damage to or destruction of property, natural resources and equipment, pollution and other environmental damages, clean-up responsibilities, regulatory investigations and penalties and suspension of operations. In addition, under certain circumstances, we may be liable for environmental damage caused by previous owners or operators of properties that we own, lease or operate. As a result, we may incur substantial liabilities to third parties or governmental entities, which could reduce or eliminate funds available for exploration, development or acquisitions or cause us to incur losses.
If we experience any problems with well stimulation and completion activities, such as hydraulic fracturing, our ability to explore for and produce oil or natural gas may be adversely affected. We could incur substantial losses or otherwise fail to realize reserves in particular formations as a result of:
• | delays imposed by or resulting from compliance with environmental and other governmental or regulatory requirements, which may include limitations on hydraulic fracturing or the discharge of GHGs; |
• | the need to shut down, abandon and relocate drilling operations; |
• | the need to sample, test and monitor drinking water in particular areas and to provide filtration or other drinking water supplies to users of water supplies that may have been impacted or threatened by potential contamination from fracturing fluids; |
• | the need to modify drill sites to ensure there are no spills or releases off-site and to investigate and/or remediate any spills or releases that might have occurred; or |
• | suspension of our operations. |
In accordance with industry practice, we maintain insurance at a level that balances the cost of insurance with our assessment of the risk and our ability to achieve a reasonable rate of return on our investments. We cannot assure you that our insurance will be adequate to cover losses or liabilities or that we will purchase insurance against all possible losses or liabilities. Also, we cannot predict the continued availability of insurance at premium levels that justify its purchase. The occurrence of a significant event, not fully insured or indemnified against, could have a material adverse effect on our business, financial condition, results of operations and cash flows.
Access to water to drill and conduct hydraulic fracturing may not be available if water sources become scarce.
The availability of water is crucial to conduct hydraulic fracturing. A significant amount of water is necessary for drilling and completing each well with hydraulic fracturing. In the past, Texas has experienced severe droughts that have limited the water supplies that are necessary to conduct hydraulic fracturing. Although we have taken measures to secure our water supply, we can make no assurances that sufficient water resources will be available in the short or long term to carry out our current activities.
Laws and regulations restricting emissions of greenhouse gases could force us to incur increased capital and operating costs and could have a material adverse effect on our financial condition, results of operations and cash flows.
In December 2009, the EPA determined that emissions of carbon dioxide, methane and other GHGs endanger public health and the environment because emissions of such gases are, according to the EPA, contributing to warming of the Earth’s atmosphere and other climatic changes. Based on these findings, the EPA has begun adopting and implementing regulations to restrict emissions of GHGs under existing provisions of the CAA. For example, the EPA issued rules restricting methane emissions from hydraulically fractured and refractured gas wells, compressors, pneumatic controls, storage vessels, and natural gas processing plants. For more information on GHG regulation, see Part I, Item 1, “Business - Government Regulation and Environmental Matters.”
In addition, some scientists have concluded that increasing concentrations of GHGs in the Earth’s atmosphere may produce climate changes that have significant physical effects, such as increased frequency and severity of storms, droughts, floods and other climatic events. If any such events were to occur, they could have an adverse effect on our financial condition, results of operations and cash flows. For a more complete discussion of environmental laws and regulations intended to address climate change and their impact on our business and operations, see Part I, Item 1, “Business - Environmental Regulation - Climate Change.”
Finally, increasing attention to the risks of climate change has resulted in an increased possibility of lawsuits brought by public and private entities against oil and gas companies in connection with their greenhouse gas emissions. Should we be targeted by any such litigation, we may incur liability, which, to the extent that societal pressures or political or other factors are involved, could be imposed without regard to the company’s causation of or contribution to the asserted damage, or to other mitigating factors.
19
Federal and state legislation and regulatory initiatives relating to hydraulic fracturing could result in increased costs and additional operating restrictions or delays.
Hydraulic fracturing involves the injection of water, sand or other propping agents and chemicals under pressure into rock formations to stimulate oil and natural gas production. We routinely use hydraulic fracturing to complete wells. The EPA released the final results of its comprehensive research study on the potential adverse impacts that hydraulic fracturing may have on drinking water resources in December 2016. The EPA concluded that hydraulic fracturing activities can impact drinking water resources under some circumstances, including large volume spills and inadequate mechanical integrity of wells. The results of the EPA’s study could spur action towards federal legislation and regulation of hydraulic fracturing or similar production operations. In past sessions, Congress has considered, but did not pass, legislation to amend the SDWA to remove the SDWA’s exemption granted to most hydraulic fracturing operations (other than operations using fluids containing diesel) and to require reporting and disclosure of chemicals used by oil and gas companies in the hydraulic fracturing process. The EPA has issued SDWA permitting guidance for hydraulic fracturing operations involving the use of diesel fuel in fracturing fluids in those states where the EPA is the permitting authority.
In addition, a number of states and local regulatory authorities are considering or have implemented more stringent regulatory requirements applicable to hydraulic fracturing, including bans/moratoria on drilling that effectively prohibit further production of oil and gas through the use of hydraulic fracturing or similar operations. Texas has adopted regulations that require the disclosure of information regarding the substances used in the hydraulic fracturing process. Moreover, in light of concerns about seismic activity being triggered by the injection of produced waters into underground wells, Texas regulators have asserted regulatory authority to limit injection activities in certain wells in an effort to reduce seismic activity. A 2015 U.S. Geological Survey report identified areas of increased rates of induced seismicity that could be attributed to fluid injection or oil and natural gas extraction.
The adoption of new laws or regulations imposing reporting or operational obligations on, or otherwise limiting or prohibiting, the hydraulic fracturing process could make it more difficult to complete oil and gas wells in unconventional plays. In addition, if hydraulic fracturing becomes regulated at the federal level as a result of federal legislation or regulatory initiatives by the EPA, hydraulic fracturing activities could become subject to additional permitting requirements, and also to attendant permitting delays and potential increases in cost, which could adversely affect our business and results of operations.
Restrictions on drilling activities intended to protect certain species of wildlife or their habitat may adversely affect our ability to conduct drilling activities in some of the areas where we operate.
Various federal and state statutes prohibit certain actions that harm endangered or threatened species and their habitats, migratory birds, wetlands and natural resources. These statutes include the Endangered Species Act, the Migratory Bird Treaty Act, the Clean Water Act, CERCLA and the OPA. The U.S. Fish and Wildlife Service may designate critical habitat and suitable habitat areas that it believes are necessary for survival of threatened or endangered species. A critical habitat or suitable habitat designation could result in further material restrictions to federal land use and private land use and could delay or prohibit land access or oil and gas development. If harm to species or damages to wetlands, habitat or natural resources occur or may occur, government entities or, at times, private parties may act to prevent oil and gas exploration or development activities or seek damages for harm to species, habitat or natural resources resulting from drilling, construction or releases of oil, wastes, hazardous substances or other regulated materials, and in some cases, may seek criminal penalties.
Derivative transactions may limit our potential gains and involve other risks.
In order to achieve more predictable cash flows and manage our exposure to price risks in the sale of our crude oil, NGLs and natural gas, we periodically enter into commodity price hedging arrangements with respect to a portion of our expected production. Our hedges are limited in duration, usually for periods of three years or less. While intended to reduce the effects of volatile crude oil, NGL and natural gas prices, such transactions may limit our potential gains if crude oil, NGL or natural gas prices were to rise over the price established by the hedging arrangements. In trying to maintain an appropriate balance, we may end up hedging too much or too little, depending upon how commodity prices fluctuate in the future.
In addition, derivative transactions may expose us to the risk of financial loss in certain circumstances, including instances in which:
• | our production is less than expected; |
• | there is a widening of price basis differentials between delivery points for our production and the delivery point assumed in the hedge arrangement; |
• | the counterparty to a derivatives instrument fails to perform under the contract; or |
• | a sudden, unexpected event materially impacts commodity prices. |
In addition, we may enter into derivative instruments that involve basis risk. Basis risk in a derivative contract occurs when the index upon which the contract is based is more or less variable than the index upon which the hedged asset is based, thereby making the hedge less effective. For example, a NYMEX index used for hedging certain volumes of production may have more or less variability than the regional price index used for the sale of that production.
20
The adoption of derivatives legislation and implementing rules could have an adverse effect on our ability to use derivative instruments to reduce the effect of commodity price risks associated with our business.
The Dodd-Frank Wall Street Reform and Consumer Protection Act, or the Dodd Frank Act, enacted on July 21, 2010, established federal oversight and regulation of the over-the-counter derivatives market and entities, such as us, that participate in that market. The Dodd-Frank Act requires the Commodity Futures Trading Commission, or CFTC, and the SEC, to promulgate rules and regulations implementing the Dodd-Frank Act. While some of these rules have been finalized, some have not been finalized. In October 2011, the CFTC issued regulations to set position limits for certain futures and option contracts in the major energy markets and for swaps that are their economic equivalents; however, this initial position limits rule was vacated by the United States District Court for the District of Columbia in September 2012. The CFTC has subsequently issued proposals for new rules that would place position limits on certain core futures contracts and equivalent swap contracts for or linked to certain physical commodities, subject to certain exceptions, though these rules have not been finalized.
While the CFTC has designated certain interest rate swaps and credit default swaps subject to mandatory clearing, the CFTC has not yet proposed rules subjecting any other classes of swaps, including physical commodity swaps, to mandatory clearing. The full impact of the Dodd-Frank Act and related regulatory requirements upon our business will not be known until the regulations are implemented and the market for derivatives contracts has adjusted.
When fully implemented, the Dodd-Frank Act and any new regulations could increase the operational and transactional cost of derivatives contracts, reduce the availability of derivatives to protect against risks that we encounter, reduce our ability to monetize and restructure our existing derivatives contracts and affect the number and/or creditworthiness of available counterparties. If we reduces our use of derivatives as a result of the Dodd-Frank Act and regulations, our results of operations may become more volatile and our cash flows may be less predictable, which could adversely affect our ability to plan for and fund capital expenditures.
In addition, we may transact with counterparties based in the European Union, Canada or other jurisdictions which, like the U.S., are in the process of implementing regulations to regulate derivatives transactions, some of which are currently in effect and impose operational and transactional costs on our derivatives activities.
Our ability to use net operating loss carryforwards to offset future taxable income may be subject to certain limitations.
Our ability to utilize U.S. net operating loss, or NOL, carryforwards to reduce future taxable income is subject to various limitations under the Internal Revenue Code of 1986, as amended, or the Code. As disclosed in Note 11 to our Consolidated Financial Statements included in Part II, Item 8, “Financial Statements and Supplementary Data,” we have substantial NOL carryforwards. The utilization of such carryforwards may be limited upon the occurrence of certain ownership changes, including the purchase or sale of our stock by 5 percent shareholders and our offering of stock during any three-year period resulting in an aggregate change of more than 50 percent in our beneficial ownership. In the event of an ownership change, Section 382 of the Code imposes an annual limitation on the amount of our taxable income that can be offset by these carryforwards. As of December 31, 2017, we do not believe that an ownership change has occurred; however, to the extent an ownership change has occurred or were to occur in the future, it is possible that the limitations imposed on our ability to use pre-ownership change losses could cause a significant net increase in our U.S. federal income tax liability and could cause U.S. federal income taxes to be paid earlier than they otherwise would be paid if such limitations were not in effect. In addition, due to the recently enacted budget reconciliation act commonly referred to as the Tax Cut and Jobs Act, or TCJA, U.S. NOLs generated on or after January 1, 2018 could be limited to 80 percent of taxable income.
Recently enacted legislation will affect our tax position, and one day, certain federal income tax deductions currently available with respect to oil and natural gas exploration and development may be eliminated. Additional state taxes on oil and natural gas extraction may be imposed, as a result of future legislation.
In December 2017, Congress enacted the TCJA. The law made significant changes to U.S. federal income tax laws, including reducing the corporate income tax rate to 21%, repeal of the corporate alternative minimum tax, or AMT, partially limiting the deductibility of interest expense and NOLs, eliminating the deduction for certain U.S. production activities, and allowing the immediate deduction of certain new investments in lieu of depreciation expense over time. Most of these new laws go into effect for tax years beginning after December 31, 2017. We are still evaluating the impact generated after December 31, 2017 of the TCJA to us. Notwithstanding the reduction in the corporate income tax rate and repeal of the corporate AMT, we cannot yet conclude that the overall impact of the TCJA to us is positive. The TCJA could adversely affect our business, operating results, financial condition and cash flows, as well as the value of an investment in our common stock.
In recent years, lawmakers and Treasury have proposed certain significant changes to U.S. tax laws applicable to oil and gas companies. These changes include, but are not limited to: (i) the repeal of the percentage depletion allowance for oil and natural gas properties; (ii) the elimination of current deductions for intangible drilling and development costs; and (iii) an extension of the amortization period for certain geological and geophysical expenditures. Although these changes were not included in the TCJA, it is unclear whether any such changes will be enacted or if enacted, when such changes could be effective. If such proposed changes are ever made, as well as any similar changes in state law, it could eliminate or postpone
21
certain tax deductions that are currently available to us with respect to oil and natural gas exploration and development, and any such change could negatively affect our financial condition, results of operations and cash flows.
Additionally, future legislation could be enacted that increases the taxes or fees imposed on oil and natural gas extraction. Any such legislation could result in increased operating costs and/or reduced consumer demand for petroleum products, which in turn could affect the prices we receive for our crude oil, NGLs and natural gas.
We may not be able to keep pace with technological developments in our industry.
The oil and gas industry is characterized by rapid and significant technological advancements and introductions of new products and services using new technologies. As others use or develop new technologies, we may be placed at a competitive disadvantage, and competitive pressures may force us to implement those new technologies at substantial cost. In addition, other oil and gas companies may have greater financial, technical and personnel resources that allow them to enjoy technological advantages and may allow them to implement new technologies before we can. We may not be able to respond to these competitive pressures and implement new technologies on a timely basis or at an acceptable cost. If one or more of the technologies we use now or in the future were to become obsolete or if we are unable to use the most advanced commercially available technology, our business, financial condition, results of operations and cash flows could be adversely affected.
A cyber incident could result in theft of confidential information, data corruption or operational disruption.
The oil and gas industry is increasingly dependent on digital technologies to conduct certain exploration, development and production activities. Software programs are used for, among other things, reserve estimates, seismic interpretation, modeling and compliance reporting. In addition, the use of mobile communication is widespread. Increasingly, we must protect our business against potential cyber incidents including attacks.
If our systems for protecting against cyber incidents prove insufficient, we could be adversely affected by unauthorized access to our digital systems which could result in theft of confidential information, data corruption or operational disruption. As cyber threats continue to evolve, we may be required to expend additional resources to continue to modify and enhance our protective systems or to investigate and remediate any vulnerabilities.
Information technology solution failures, network disruptions and breaches of data security could disrupt our operations by causing delays or cancellation of customer orders, impeding processing of transactions and reporting financial results, resulting in the unintentional disclosure of customer, employee or our information, or damage to our reputation. There can be no assurance that a system failure or data security breach will not have a material adverse effect on our financial condition, results of operations or cash flows.
Certain provisions of our certificate of incorporation and our bylaws may make it difficult for stockholders to change the composition of our Board and may discourage, delay or prevent a merger or acquisition that some stockholders may consider beneficial.
Certain provisions of our Certificate of Incorporation and our Bylaws may have the effect of delaying or preventing changes in control if our Board determines that such changes in control are not in the best interests of the Company and our stockholders. The provisions in our Certificate of Incorporation and Bylaws include, among other things, those that:
• | authorize our Board to issue preferred stock and to determine the price and other terms, including preferences and voting rights, of those shares without stockholder approval; |
• | establish advance notice procedures for nominating directors or presenting matters at stockholder meetings; and |
• | limit the persons who may call special meetings of stockholders. |
While these provisions have the effect of encouraging persons seeking to acquire control of the Company to negotiate with our Board, they could enable the Board to hinder or frustrate a transaction that some, or a majority, of the stockholders may believe to be in their best interests and, in that case, may prevent or discourage attempts to remove and replace incumbent directors. These provisions may frustrate or prevent any attempts by our stockholders to replace or remove our current management by making it more difficult for stockholders to replace members of our Board, which is responsible for appointing the members of our management.
The market price of our common stock is subject to volatility.
The market price of our common stock could be subject to wide fluctuations in response to, and the level of trading of our common stock may be affected by, numerous factors, many of which are beyond our control. These factors include, among other things, our relatively limited trading history subsequent to our emergence from bankruptcy, our limited trading volume, the concentration of holdings of our common stock, the lack of comparable historical financial information due to our adoption of Fresh Start Accounting, actual or anticipated variations in our operating results and cash flow, the nature and content of our earnings releases, announcements or events that impact our products, customers, competitors or markets, business conditions in our markets and the general state of the securities markets and the market for energy-related stocks, as well as general economic and market conditions and other factors that may affect our future results, including those described in this report. Significant sales of our common stock, or the expectation of these sales, by significant shareholders, officers or directors could materially and adversely affect the market price of our common stock.
22
There may be future sales or other dilution of our equity, which may adversely affect the market price of our common stock.
We are not restricted from issuing additional common stock, including securities that are convertible into or exchangeable for, or that represent a right to receive, common stock. Any issuance of additional shares of our common stock or convertible securities will dilute the ownership interest of our common stockholders. Sales of a substantial number of shares of our common stock or other equity-related securities in the public market could depress the market price of our common stock and impair our ability to raise capital through the sale of additional equity securities. We cannot predict the effect that future sales of our common stock or other equity-related securities would have on the market price of our common stock.
Because we have no plans to pay dividends on or repurchase our common stock, investors must look solely to stock appreciation for a return on their investment in us.
We do not anticipate paying any cash dividends on or repurchasing our common stock in the foreseeable future. We currently intend to retain all future earnings to fund the development and growth of our business. Any payment of future dividends or repurchase of our common stock will be at the discretion of our board of directors and will depend on, among other things, our earnings, financial condition, capital requirements, level of indebtedness, statutory and contractual restrictions and other considerations that our board of directors deems relevant. Covenants contained in the Credit Facility and the Second Lien Facility restrict the payment of dividends and share repurchases. Investors must rely on sales of their common stock after price appreciation, which may never occur, as the only way to realize a return on their investment. Investors seeking cash dividends should not purchase our common stock.
Item 1B | Unresolved Staff Comments |
None.
Item 2 | Properties |
As of December 31, 2017, our primary oil and gas assets were located in Gonzales, Lavaca, Fayette and Dewitt Counties in South Texas and Washita and Custer Counties in Western Oklahoma.
Facilities
All of our office facilities are leased and we believe that our facilities are adequate for our current needs.
Title to Oil and Gas Properties
Prior to completing an acquisition of producing oil and gas assets, we review title opinions on all material leases. As is customary in the oil and gas industry, however, we make a cursory review of title when we acquire farmout acreage or undeveloped oil and gas leases. Prior to the commencement of drilling operations, a thorough title examination is conducted. To the extent the title examination reflects defects, we cure such title defects. If we are unable to cure any title defect of a nature such that it would not be prudent to commence drilling operations on a property, we could suffer a loss of our investment in the property. Our oil and gas properties are subject to customary royalty interests, liens for debt obligations, current taxes and other burdens that we believe do not materially interfere with the use or materially affect the value of such properties. We believe that we have satisfactory title to all of our properties and the associated oil and gas in accordance with standards generally accepted in the oil and gas industry.
23
Summary of Oil and Gas Reserves
Proved Reserves
The following tables summarize certain information regarding our estimated proved reserves as of December 31 for each of the years presented:
Crude Oil | NGLs | Natural Gas | Oil Equivalents | Standardized Measure | PV10 1 | ||||||||||||||
(MMBbl) | (MMBbl) | (Bcf) | (MMBOE) | $ in millions | $ in millions | ||||||||||||||
2017 (Successor) | |||||||||||||||||||
Developed | |||||||||||||||||||
Producing | 22.4 | 4.9 | 27.2 | 31.8 | |||||||||||||||
Non-producing | — | — | — | — | |||||||||||||||
22.4 | 4.9 | 27.2 | 31.8 | ||||||||||||||||
Undeveloped | 33.4 | 4.0 | 20.1 | 40.8 | |||||||||||||||
55.8 | 8.9 | 47.3 | 72.6 | $ | 590.5 | $ | 609.0 | ||||||||||||
Price measurement used 2 | $51.34/Bbl | $18.48/Bbl | $2.98/MMBtu | ||||||||||||||||
2016 (Successor) | |||||||||||||||||||
Developed | |||||||||||||||||||
Producing | 17.5 | 4.3 | 24.8 | 25.9 | |||||||||||||||
Non-producing | 0.2 | 0.1 | 0.1 | 0.3 | |||||||||||||||
17.7 | 4.4 | 24.9 | 26.2 | ||||||||||||||||
Undeveloped | 18.9 | 2.4 | 11.8 | 23.3 | |||||||||||||||
36.6 | 6.8 | 36.7 | 49.5 | $ | 317.5 | $ | 317.5 | ||||||||||||
Price measurement used 2 | $42.75/Bbl | $12.33/Bbl | $2.48/MMBtu | ||||||||||||||||
2015 (Predecessor) | |||||||||||||||||||
Developed | |||||||||||||||||||
Producing | 19.6 | 6.1 | 36.8 | 31.8 | |||||||||||||||
Non-producing | 0.6 | 0.1 | 0.4 | 0.8 | |||||||||||||||
20.2 | 6.2 | 37.2 | 32.6 | ||||||||||||||||
Undeveloped | 9.3 | 1.0 | 5.0 | 11.1 | |||||||||||||||
29.5 | 7.2 | 42.2 | 43.7 | $ | 323.3 | $ | 323.3 | ||||||||||||
Price measurement used 2 | $50.28/Bbl | $14.44/Bbl | $2.70/MMBtu | ||||||||||||||||
_____________________________________________
1 PV10 represents a non-GAAP measure that is most directly comparable to the Standardized Measure as defined in GAAP. The Standardized Measure represents the discounted future net cash flows from our proved reserves after future income taxes discounted at 10% in accordance with SEC criteria. PV10 represents the Standardized Measure without regard to income taxes. Our Standardized Measures for 2016 and 2015 did not include any income tax effect. Accordingly, our PV10 and Standardized Measure values are equivalent as of those dates. We believe that PV10 is a meaningful supplemental disclosure to the Standardized Measure as the PV10 concept is widely used within the industry and by the financial and investment community to evaluate the proved reserves on a comparable basis across companies without regard to the individual owner’s unique income tax position. We utilize PV10 to evaluate the potential return on investment in our oil and gas properties as well as evaluating properties for potential purchases and sales.
2 Crude oil and natural gas prices were based on average (beginning of month basis) sales prices per Bbl and MMBtu. The representative prices of crude oil and natural gas, as adjusted for basis differentials and product quality, were as follows: crude oil - $50.06, $40.97 and $45.78 each per Bbl, NGLs - $18.02, $11.82 and $13.15 each per Bbl and natural gas - $2.89, $2.40 and $2.59 each per MMBtu, for December 31, 2017, 2016 and 2015, respectively. NGL prices were estimated as a percentage of the base crude oil price.
The following table sets forth by region the estimated quantities of proved reserves and the percentages thereof that are represented by proved developed reserves as of December 31, 2017:
Proved | % of Total Proved | % Proved | |||||||
Region | Reserves | Reserves | Developed | ||||||
(MMBOE) | |||||||||
South Texas | 70.2 | 97 | % | 42 | % | ||||
Mid-Continent | 2.4 | 3 | % | 100 | % | ||||
72.6 | 100 | % | 44 | % | |||||
A discussion and analysis of the changes in our total proved reserves is provided in “Supplemental Information on Oil and Gas Producing Activities (Unaudited)” included in Part II, Item 8, “Financial Statements and Supplementary Data.”
24
Proved Undeveloped Reserves
The proved undeveloped reserves included in our reserve estimates relate to wells that are forecasted to be drilled within the next five years. The following table sets forth the changes in our proved undeveloped reserves, all of which are located in the Eagle Ford in South Texas, during the year ended December 31, 2017:
Crude Oil | NGLs | Natural Gas | Oil Equivalents | ||||||||
(MMBbl) | (MMBbl) | (Bcf) | (MMBOE) | ||||||||
Proved undeveloped reserves at beginning of year | 18.9 | 2.4 | 11.8 | 23.3 | |||||||
Revisions of previous estimates | (4.2 | ) | (1.0 | ) | (4.4 | ) | (5.9 | ) | |||
Extensions and discoveries | 22.3 | 3.0 | 15.0 | 27.7 | |||||||
Purchase of reserves | 0.3 | 0.1 | 0.1 | 0.5 | |||||||
Conversion to proved developed reserves | (3.9 | ) | (0.5 | ) | (2.4 | ) | (4.8 | ) | |||
Proved undeveloped reserves at end of year | 33.4 | 4.0 | 20.1 | 40.8 | |||||||
In 2017, our proved undeveloped reserves increased by 17.5 MMBOE. We experienced negative revisions of 5.9 MMBOE including: (i) 4.7 MMBOE due to the loss of certain locations resulting from changes in the timing and drilling locations attributable to our development plans and (ii) 1.3 MMBOE due to reduced treatable lateral lengths in certain locations due primarily to reconfiguration of the planned drilling units partially offset by 0.1 MMBOE of other changes. Extensions and discoveries of 27.7 MMBOE are entirely attributable to our expanded development plan for the Eagle Ford including adding a third rig to our drilling program and the corresponding increase in the number of new drilling locations that we are planning to drill in the next five years. We acquired 0.5 MMBOE, as measured on the closing date of the transaction, in connection with the Devon Acquisition. In addition, we converted 4.8 MMBOE from proved undeveloped to proved developed reserves in the Eagle Ford. During 2017, we incurred capital expenditures of $74.9 million attributable to 25 gross (14.2 net) wells in connection with the conversion of proved undeveloped reserves to proved developed reserves. While we resumed our drilling program in November 2016, we did not turn any new wells to sales until February 2017 and we operated with only two rigs and limited completion service through the first half of 2017. Accordingly, our conversion rate for proved undeveloped reserves is anticipated to accelerate modestly from the actual rate achieved for 2017.
Preparation of Reserves Estimates and Internal Controls
The proved reserve estimates were prepared by DeGolyer and MacNaughton, Inc., our independent third party petroleum engineers. For additional information regarding estimates of proved reserves and other information about our oil and gas reserves, see “Supplemental Information on Oil and Gas Producing Activities (Unaudited)” in our Notes to the Consolidated Financial Statements included in Part II, Item 8, “Financial Statements and Supplementary Data” and the report of DeGolyer and MacNaughton, Inc., dated February 9, 2018, which is included as an Exhibit to this Annual Report on Form 10-K. We did not file any reports during the year ended December 31, 2017 with any federal authority or agency with respect to our estimate of oil and gas reserves.
Our policies and practices regarding the recording of reserves are structured to objectively and accurately estimate our oil and gas reserve quantities and present values in compliance with the SEC’s regulations and GAAP. Our Vice President, Engineering is primarily responsible for overseeing the preparation of the reserve estimate by DeGolyer and MacNaughton, Inc. Our Vice President, Engineering has over 30 years of industry experience in the estimation and evaluation of reserve information, holds a B.S. degree in Petroleum Engineering from Texas A&M University and is licensed by the State of Texas as a Professional Engineer. Our internal controls over reserve estimates include reconciliation and review controls, including an independent internal review of assumptions used in the estimation.
There are numerous uncertainties inherent in estimating quantities of reserves and in projecting future rates of production and timing of development expenditures, including many factors beyond our control. For additional information about the risks inherent in our estimates of proved reserves, see Part I, Item 1A, “Risk Factors.”
Qualifications of Third Party Petroleum Engineers
The technical person primarily responsible for review of our reserve estimates at DeGolyer and MacNaughton, Inc. meets the requirements regarding qualifications, independence, objectivity and confidentiality set forth in the Standards Pertaining to the Estimating and Auditing of Oil and Gas Reserves Information promulgated by the Society of Petroleum Engineers. DeGolyer and MacNaughton, Inc. is an independent firm of petroleum engineers, geologists, geophysicists and petrophysicists; they do not own an interest in our properties and are not employed on a contingent fee basis.
25
Oil and Gas Production, Production Prices and Production Costs
In the tables that follow, we have presented our former operations in the Haynesville Shale and Cotton Valley in East Texas, which were sold in 2015 as “Divested properties.” The sale of those operations represented a complete divestiture and we have retained no interests therein. In addition, we sold certain non-core properties in the Eagle Ford and Granite Wash in October 2015. The production associated with these former properties is also included within “Divested properties.” Our remaining operations are represented in the Eagle Ford in South Texas and the Granite Wash in Oklahoma.
Oil and Gas Production by Region
The following tables set forth by region our total production and average daily production for the periods presented:
Total Production | |||||||||||||
Successor | Predecessor | ||||||||||||
Year Ended | September 13 Through | January 1 Through | Year Ended | ||||||||||
December 31, | December 31, | September 12 | December 31, | ||||||||||
Region | 2017 | 2016 | 2016 | 2015 | |||||||||
(MBOE) | (MBOE) | ||||||||||||
South Texas | 3,487 | 937 | 3,071 | 6,903 | |||||||||
Mid-Continent and other 1 | 292 | 103 | 276 | 460 | |||||||||
Divested properties 2 | — | — | — | 560 | |||||||||
3,779 | 1,040 | 3,346 | 7,923 | ||||||||||
Average Daily Production | |||||||||||||
Successor | Predecessor | ||||||||||||
Year Ended | September 13 Through | January 1 Through | Year Ended | ||||||||||
December 31, | December 31, | September 12 | December 31, | ||||||||||
Region | 2017 | 2016 | 2016 | 2015 | |||||||||
(BOEPD) | (BOEPD) | ||||||||||||
South Texas | 9,553 | 8,518 | 11,996 | 18,913 | |||||||||
Mid-Continent and other 1 | 800 | 936 | 1,085 | 1,260 | |||||||||
Divested properties 2 | — | — | — | 2,150 | |||||||||
10,353 | 9,454 | 13,081 | 22,323 | ||||||||||
_____________________________________________
1 Includes total production and average daily production of approximately 10 MBOE (48 BOEPD) and 22 MBOE (60 BOEPD) for 2016 and 2015, respectively, attributable to our then active Marcellus Shale wells.
2 We sold all of our properties in the Haynesville Shale and Cotton Valley in East Texas in August 2015, which represented total production and average daily production of approximately 449 MBOE (1,806 BOEPD) in 2015. We sold certain non-core properties in the Eagle Ford and Granite Wash in October 2015, which represented total production and average daily production of approximately 111 MBOE (344 BOEPD) in 2015.
Production Prices and Production Costs
The following table sets forth the average sales prices per unit of volume and our average production costs, not including ad valorem and production/severance taxes, per unit of production for the periods presented:
Successor | Predecessor | ||||||||||||||||
Year Ended | September 13 Through | January 1 Through | Year Ended | ||||||||||||||
December 31, | December 31, | September 12 | December 31, | ||||||||||||||
2017 | 2016 | 2016 | 2015 | ||||||||||||||
Average prices: | |||||||||||||||||
Crude oil ($ per Bbl) | $ | 50.96 | $ | 46.63 | $ | 35.21 | $ | 44.81 | |||||||||
NGLs ($ per Bbl) | $ | 19.25 | $ | 16.51 | $ | 11.38 | $ | 12.24 | |||||||||
Natural gas ($ per Mcf) | $ | 2.89 | $ | 2.81 | $ | 2.06 | $ | 2.62 | |||||||||
Aggregate ($ per BOE) | $ | 42.20 | $ | 37.17 | $ | 27.99 | $ | 33.19 | |||||||||
Average production and lifting cost ($ per BOE): | |||||||||||||||||
Lease operating | $ | 5.76 | $ | 5.13 | $ | 4.67 | $ | 5.36 | |||||||||
Gathering processing and transportation | 2.84 | 2.93 | 3.96 | 3.01 | |||||||||||||
$ | 8.60 | $ | 8.06 | $ | 8.63 | $ | 8.37 | ||||||||||
26
Significant Fields
Our properties in the Eagle Ford in South Texas, which contain primarily crude oil reserves, represented approximately 97 percent of our total equivalent proved reserves as of December 31, 2017.
The following table sets forth certain information with respect to this field for the periods presented:
Successor | Predecessor | |||||||||||||||
Year Ended | September 13 Through | January 1 Through | Year Ended | |||||||||||||
December 31, | December 31, | September 12 | December 31, | |||||||||||||
2017 | 2016 | 2016 | 2015 | |||||||||||||
Production: 1 | ||||||||||||||||
Crude oil (MBbl) | 2,716 | 695 | 2,265 | 4,733 | ||||||||||||
NGLs (MBbl) | 418 | 130 | 449 | 1,169 | ||||||||||||
Natural gas (MMcf) | 2,120 | 674 | 2,141 | 6,011 | ||||||||||||
Total (MBOE) | 3,487 | 937 | 3,071 | 6,903 | ||||||||||||
Percent of total company production | 92 | % | 90 | % | 92 | % | 87 | % | ||||||||
Average prices: | ||||||||||||||||
Crude oil ($ per Bbl) | $ | 51.08 | $ | 46.73 | $ | 35.24 | $ | 44.73 | ||||||||
NGLs ($ per Bbl) | $ | 18.13 | $ | 14.82 | $ | 10.34 | $ | 11.03 | ||||||||
Natural gas ($ per Mcf) | $ | 2.95 | $ | 2.79 | $ | 2.05 | $ | 2.64 | ||||||||
Aggregate ($ per BOE) | $ | 43.74 | $ | 38.71 | $ | 28.94 | $ | 34.84 | ||||||||
Average production and lifting cost ($ per BOE): 2 | ||||||||||||||||
Lease operating | $ | 5.79 | $ | 5.39 | $ | 4.58 | $ | 5.04 | ||||||||
Gathering processing and transportation | 2.49 | 2.58 | 3.50 | 2.66 | ||||||||||||
$ | 8.28 | $ | 7.97 | $ | 8.08 | $ | 7.70 | |||||||||
_____________________________________________
1 Excludes production from certain non-core Eagle Ford properties that we sold in October 2015.
2 Excludes production/severance and ad valorem taxes.
Drilling and Other Exploratory and Development Activities
The following table sets forth the gross and net development wells that we drilled, all of which were in the Eagle Ford in South Texas, during the years ended December 31, 2017, 2016 and 2015, respectively, and wells that were in progress at the end of each year. There were no exploratory wells drilled in any of the years presented. The number of wells drilled refers to the number of wells completed at any time during the year, regardless of when drilling was initiated.
2017 | 2016 | 2015 | |||||||||||||||
Gross | Net | Gross | Net | Gross | Net | ||||||||||||
Development | |||||||||||||||||
Productive | 29 | 16.9 | 5 | 2.9 | 61 | 38.6 | |||||||||||
Dry well 1 | 1 | 0.7 | — | — | — | — | |||||||||||
Total | 30 | 17.6 | 5 | 2.9 | 61 | 38.6 | |||||||||||
Wells in progress at end of year 2 | 11 | 8.2 | 5 | 2.6 | 4 | 2.3 | |||||||||||
_____________________________________________
1 Represents the Zebra Hunter 05H well in the northern portion of our Eagle Ford acreage.
2 Includes ten gross (7.4 net) wells completing or waiting on completion and one gross (0.8 net) well being drilled as of December 31, 2017.
Present Activities
As of December 31, 2017, we had 11 gross (8.2 net) wells in progress, all of which were located in the Eagle Ford in South Texas. As of February 23, 2018, seven gross (5.4 net) wells were completed, three gross (2.0 net) wells were completing or waiting on completion and one gross (0.8 net) well was the first well drilled on a three-well pad and will be prepared for completion with the other two wells upon drilling to total depth for this pad.
Delivery Commitments
We generally sell our oil, NGL and natural gas products using short-term floating price physical and spot market contracts. We have commitments to provide minimum deliveries of crude oil of 8,000 BOPD (gross) in our South Texas region
27
through 2031 under a gathering agreement with Republic Midstream, LLC, or Republic Midstream. Our production and reserves are currently sufficient to fulfill the current 8,000 BOPD delivery commitment under that agreement. In 2016, following the suspension of our drilling program, we incurred charges for deficiencies of $0.4 million as a result of our inability to satisfy the 15,000 BOPD delivery commitment under such agreements prior to their August 2016 amendments.
Productive Wells
The following table sets forth by region the productive wells in which we had a working interest as of December 31, 2017:
Primarily Oil | Primarily Natural Gas | Total | ||||||||||||||||
Region | Gross | Net | Gross | Net | Gross | Net | ||||||||||||
South Texas | 402 | 289.2 | 1 | 1.0 | 403 | 290.2 | ||||||||||||
Mid-Continent | 2 | 1.6 | 95 | 41.1 | 97 | 42.7 | ||||||||||||
404 | 290.8 | 96 | 42.1 | 500 | 332.9 | |||||||||||||
Of the total wells presented in the table above, we are the operator of 399 gross (367 oil and 32 gas) and 297.4 net (277.1 oil and 20.3 gas) wells. In addition to the above working interest wells, we own royalty interests in 19 gross wells.
Acreage
The following table sets forth by region our developed and undeveloped acreage as of December 31, 2017 (in thousands):
Developed | Undeveloped | Total | ||||||||||||||||
Region | Gross | Net | Gross | Net | Gross | Net | ||||||||||||
South Texas | 90.6 | 66.7 | 7.8 | 6.7 | 98.4 | 73.4 | ||||||||||||
Mid-Continent and other | 15.6 | 7.4 | 9.7 | 9.5 | 25.3 | 16.9 | ||||||||||||
106.2 | 74.1 | 17.5 | 16.2 | 123.7 | 90.3 | |||||||||||||
The primary terms of our leases generally range from three to five years and we do not have any concessions. All of our acreage in the Granite Wash in Oklahoma is HBP. As of December 31, 2017, our net undeveloped acreage is scheduled to expire as shown in the table below, unless the primary lease terms are, where appropriate, extended, HBP or otherwise changed:
Region | 2018 | 2019 | 2020 | Thereafter | ||||
South Texas | 2.7 | 0.8 | 3.1 | 0.1 | ||||
Mid-Continent and other | 0.0 | 9.5 | 0.0 | 0.0 | ||||
We anticipate paying options to extend a substantial portion of the acreage scheduled to expire in South Texas in 2018. We do not believe that the remaining scheduled expirations of our undeveloped acreage in South Texas will substantially affect our ability or plans to conduct our exploration and development activities. In February 2018, we sold the our undeveloped acreage holdings in the Tuscaloosa Marine Shale in Louisiana that was scheduled to expire in 2019.
Item 3 | Legal Proceedings |
On May 12, 2016, or the Petition Date, we and the Chapter 11 Subsidiaries filed voluntary petitions (In re Penn Virginia Corporation, et al., Case No. 16-32395) seeking relief under the Bankruptcy Code in the United States Bankruptcy Court for the Eastern District of Virginia.
On August 11, 2016, the Bankruptcy Court confirmed the Plan, and we subsequently emerged from bankruptcy on September 12, 2016. See Note 4 to our Consolidated Financial Statements included in Part II, Item 8, “Financial Statements and Supplementary Data,” for a more detailed discussion of our bankruptcy proceedings and emergence.
On February 7, 2017, a former shareholder of the Company filed a Complaint against us in the Bankruptcy Court requesting that the Bankruptcy Court set aside its prior order confirming the Plan, previously confirmed on August 11, 2016, or provide other equitable relief or damages. We filed a motion to dismiss the proceeding which was granted by the Bankruptcy Court on July 21, 2017. The former shareholder filed a notice of appeal to the U.S. District Court for the Eastern District of Virginia on July 27, 2017. As reflected by the Bankruptcy Court’s ruling, we believe this matter is without merit and will defend confirmation of the Plan. Absent a reversal or modification of the Bankruptcy Court’s decision, this matter has no impact on the order confirming the Plan.
See Note 15 to our Consolidated Financial Statements included in Part II, Item 8, “Financial Statements and Supplementary Data.” We are not aware of any material legal or governmental proceedings against us, or threatened to be brought against us, under the various environmental protection statutes to which we are subject.
Item 4 | Mine Safety Disclosures |
Not applicable.
28
Part II
Item 5 | Market for Registrant’s Common Equity, Related Stockholder Matters and Issuer Purchases of Equity Securities |
Market Information
In connection with our reorganization and emergence from bankruptcy, our common stock was initially listed on the OTCQX U.S. Premier Market under the symbol “PVAC” on November 15, 2016. Prior to such time, there was no established trading market for our common stock. On December 28, 2016, our common stock was listed and began trading on the Nasdaq under the symbol “PVAC.”
The market data below represents the high and low sales prices (composite transactions) of our common stock since November 15, 2016:
Sales Price | ||||||||||
Quarter Ended | High | Low | ||||||||
December 31, 2017 | $ | 43.29 | $ | 32.99 | ||||||
September 30, 2017 | $ | 40.50 | $ | 33.44 | ||||||
June 30, 2017 | $ | 50.00 | $ | 31.00 | ||||||
March 31, 2017 | $ | 61.97 | $ | 41.40 | ||||||
December 31, 2016 | $ | 50.00 | $ | 34.75 | ||||||
Equity Holders
As of February 23, 2018, there were 109 record holders of our common stock.
Dividends
We have not paid nor do we intend in the foreseeable future to pay any cash dividends on our common stock. Furthermore, we are restricted from paying dividends under the Credit Facility and the Second Lien Facility.
Securities Authorized for Issuance Under Equity Compensation Plans
See Part III, Item 12, “Security Ownership of Certain Beneficial Owners and Management and Related Stockholder Matters” and Note 17 to our Consolidated Financial Statements included in Part II, Item 8, “Financial Statements and Supplementary Data” for information regarding shares of common stock authorized for issuance under our stock compensation plans.
Issuer Purchases of Equity Securities
We did not repurchase any shares of our common stock in the fourth quarter of 2017.
29
Performance Graph
The following graph compares our cumulative total shareholder return with the cumulative total return of the Standard & Poor’s 600 Oil & Gas Exploration and Production Index and the Standard & Poor’s SmallCap 600 Index for the period from November 15, 2016 (the date that our common shares became publicly tradable) through December 31, 2017. As of December 31, 2017, there were five exploration and production companies in the Standard & Poor’s 600 Oil & Gas Exploration and Production Index: Bill Barrett Corporation, Carrizo Oil & Gas, Inc., Denbury Resources Inc., PDC Energy, Inc. and SRC Energy Inc. The graph assumes $100 is invested on November 15, 2016 in us and each index at November 15, 2016 closing prices.
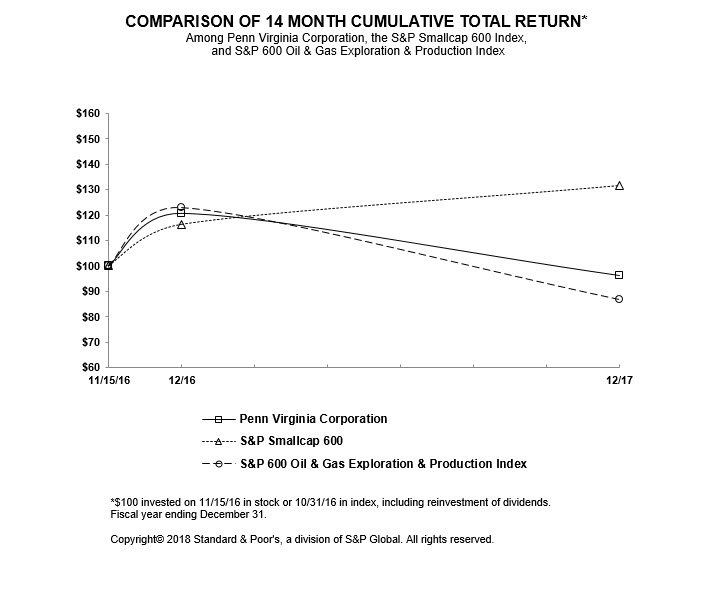
The following table represents the actual data points for the dates indicated on the graph above:
November 15, | December 31, | |||||||||||
2016 | 2016 | 2017 | ||||||||||
Penn Virginia Corporation | $ | 100.00 | $ | 120.62 | $ | 96.27 | ||||||
S&P SmallCap 600 Index | $ | 100.00 | $ | 116.34 | $ | 131.74 | ||||||
S&P 600 Oil & Gas Exploration & Production Index | $ | 100.00 | $ | 122.91 | $ | 86.71 | ||||||
30
Item 6 | Selected Financial Data |
The following selected historical financial and operating information was derived from our Consolidated Financial Statements. The selected financial data should be read in conjunction with Part II, Item 7, “Management’s Discussion and Analysis of Financial Condition and Results of Operations,” and our Consolidated Financial Statements and the accompanying Notes and Supplementary Data in Part II, Item 8, “Financial Statements and Supplementary Data.”
(in thousands, except per share amounts, production and reserves) | ||||||||||||||||||||||||
Successor | Predecessor | |||||||||||||||||||||||
Year | September 13 | January 1 | ||||||||||||||||||||||
Ended | Through | Through | ||||||||||||||||||||||
December 31, | December 31, | September 12, | Year Ended December 31, | |||||||||||||||||||||
2017 | 2016 | 2016 | 2015 | 2014 | 2013 | |||||||||||||||||||
Statements of Operations and Other Data: | ||||||||||||||||||||||||
Revenues | $ | 160,054 | $ | 39,003 | $ | 94,310 | $ | 305,298 | $ | 636,773 | $ | 431,468 | ||||||||||||
Operating income (loss )1 | $ | 51,811 | $ | 11,391 | $ | (20,856 | ) | $ | (1,565,041 | ) | $ | (615,985 | ) | $ | (92,046 | ) | ||||||||
Net income (loss) 2 | $ | 32,662 | $ | (5,296 | ) | $ | 1,054,602 | $ | (1,582,961 | ) | $ | (409,592 | ) | $ | (143,070 | ) | ||||||||
Preferred stock dividends 3 | $ | — | $ | — | $ | 5,972 | $ | 22,789 | $ | 17,148 | $ | 6,900 | ||||||||||||
Income (loss) attributable to common shareholders 2 | $ | 32,662 | $ | (5,296 | ) | $ | 1,048,630 | $ | (1,605,750 | ) | $ | (430,996 | ) | $ | (149,970 | ) | ||||||||
Income (loss) per common share, basic | $ | 2.18 | $ | (0.35 | ) | $ | 11.91 | $ | (21.81 | ) | $ | (6.26 | ) | $ | (2.41 | ) | ||||||||
Income (loss) per common share, diluted | $ | 2.17 | $ | (0.35 | ) | $ | 8.50 | $ | (21.81 | ) | $ | (6.26 | ) | $ | (2.41 | ) | ||||||||
Weighted-average shares outstanding: | ||||||||||||||||||||||||
Basic | 14,996 | 14,992 | 88,013 | 73,639 | 68,887 | 62,335 | ||||||||||||||||||
Diluted | 15,063 | 14,992 | 124,087 | 73,639 | 68,887 | 62,335 | ||||||||||||||||||
Dividends declared per share | $ | — | $ | — | $ | — | $ | — | $ | — | $ | — | ||||||||||||
Cash provided by operating activities | $ | 81,710 | $ | 30,774 | $ | 30,247 | $ | 169,303 | $ | 282,724 | $ | 261,512 | ||||||||||||
Cash paid for capital expenditures | $ | 115,687 | $ | 4,812 | $ | 15,359 | $ | 364,844 | $ | 774,139 | $ | 504,203 | ||||||||||||
Total production (MBOE) | 3,779 | 1,039 | 3,346 | 7,923 | 7,934 | 6,824 | ||||||||||||||||||
December 31, | September 12, | December 31, | ||||||||||||||||||||||
Balance Sheet and Other Data: | 2017 | 2016 | 2016 | 2015 | 2014 | 2013 | ||||||||||||||||||
Property and equipment, net | $ | 529,059 | $ | 247,473 | $ | 253,510 | $ | 344,395 | $ | 1,825,098 | $ | 2,237,304 | ||||||||||||
Total assets | $ | 629,597 | $ | 291,686 | $ | 333,974 | $ | 517,725 | $ | 2,201,810 | $ | 2,472,830 | ||||||||||||
Total debt | $ | 265,267 | $ | 25,000 | $ | 75,350 | $ | 1,224,383 | $ | 1,085,429 | $ | 1,252,808 | ||||||||||||
Shareholders’ equity (deficit) | $ | 221,639 | $ | 185,548 | $ | 190,895 | $ | (915,121 | ) | $ | 675,817 | $ | 788,804 | |||||||||||
Actual shares outstanding at period-end | 15,019 | 14,992 | 14,992 | 81,253 | 71,569 | 65,307 | ||||||||||||||||||
Proved reserves as of December 31,(MMBOE) | 73 | 49 | N/A | 44 | 115 | 136 | ||||||||||||||||||
_____________________________________________
1 Operating loss for 2015, 2014 and 2013 included impairment charges of $1.4 billion, $791.8 million and $132.2 million, respectively.
2 | Net income (loss) and Income (loss) attributable to common shareholders for the period of January 1 through September 12, 2016 includes reorganization items attributable to our bankruptcy proceedings of $1.1 billion. |
3 | Excludes inducements paid for the conversion of preferred stock of $4.3 million in 2014. |
31
Item 7 | Management’s Discussion and Analysis of Financial Condition and Results of Operations |
The following discussion and analysis of our financial condition and results of operations should be read in conjunction with our Consolidated Financial Statements and Notes thereto included in Part II, Item 8, “Financial Statements and Supplementary Data.” All dollar amounts presented in the tables that follow are in thousands unless otherwise indicated. Also, due to the combination of different units of volumetric measure and the number of decimal places presented and rounding, certain results may not calculate explicitly from the values presented in the tables.
Overview and Executive Summary
We are an independent oil and gas company engaged in the onshore exploration, development and production of crude oil, NGLs and natural gas. Our current operations consist primarily of drilling unconventional horizontal development wells and operating our producing wells in the Eagle Ford, in South Texas. Our operations are substantially concentrated with over 90 percent of our production, revenues and capital expenditures attributable to this region. We also have less significant operations in Oklahoma, primarily consisting of non-operated properties in the Granite Wash.
While crude oil prices began 2017 in the $53 per Bbl range, they declined through the late winter and throughout the summer before climbing back and ending the year at approximately $60 per Bbl. With the improved pricing environment domestic production has increased including that in the broader Eagle Ford region in which we operate. This environment has expanded opportunities in our principal operating region. Furthermore, many exploration and production companies that experienced financial difficulties similar to us during 2015 to 2016 time frame have restructured and refocused their financial resources and operating plans to capitalize on current opportunities. As a result, pricing for certain oilfield products and services, including drilling and completion services, have increased in the past several months.
As discussed in further detail in Note 4 to our Consolidated Financial Statements, we have adopted and applied Fresh Start Accounting as a result of our emergence from bankruptcy in 2016. Accordingly, our Consolidated Financial Statements and Notes after September 12, 2016 are not comparable to the Consolidated Financial Statements and Notes prior to that date. To facilitate the discussion and analysis of our financial condition and results of operations herein, we refer to the reorganized company as the “Successor” for periods subsequent to September 12, 2016, and the “Predecessor” for periods prior to September 13, 2016. Furthermore, our presentations herein include a “black line” division to delineate the lack of comparability between the Predecessor and Successor. In order to enhance our discussion herein, we have addressed the Successor and Predecessor periods discretely and have provided comparative analysis, to the extent practical, where appropriate. In addition, and as referenced in Note 2 to the Consolidated Financial Statements, we have adopted the full cost method of accounting for our oil and gas properties effective with our adoption of Fresh Start Accounting. Accordingly, our results of operations and financial position for the Successor periods will be substantially different from our historic trends.
The following summarizes certain key operating and financial highlights for the three months ended December 31, 2017 with comparison to the three months ended September 30, 2017. The year-over-year highlights for 2017 and 2016 are addressed in further detail in the discussions for Financial Condition and Results of Operations that follow.
• | Production increased approximately 31 percent to 1,135 MBOE, from 864 MBOE . |
• | Product revenues increased approximately 58 percent to $54.1 million from $34.3 million due primarily to the aforementioned increase in production as well as higher pricing for crude oil and NGLs partially offset by lower natural gas prices. |
• | Production and lifting costs increased on an absolute basis to $9.5 million from $7.6 million, but decreased on a per unit basis to $8.35 per BOE, from $8.85 per BOE due primarily to lower maintenance costs as well as the effect of the increase in production volume. |
• | Production and ad valorem taxes increased on an absolute and per unit basis to $3.0 million and $2.68 per BOE from $1.7 million and $1.93 per BOE, respectively, due primarily to higher production volume and product pricing. |
• | General and administrative expenses decreased on an absolute and per unit basis to $3.5 million and $3.05 per BOE from $7.0 million and $8.04 per BOE, respectively, due primarily to transaction costs associated with the Devon Acquisition and costs incurred to complete an upgrade of our ERP system, both of which were incurred in the third quarter of 2017, as well as the effect of higher production volume. |
• | Our DD&A increased to $17.1 million, or $15.07 per BOE from $10.7 million, or $12.33 per BOE due primarily to the increase in capitalized costs for oil and gas properties resulting from the Devon Acquisition and our expanded capital program as well as the effect of higher production volume. |
• | Our operating income increased to $21.2 million for the three months ended December 31, 2017 compared to $7.5 million for the three months ended September 30, 2017 due the combined impact of the matters noted above. |
32
The following table sets forth certain historical summary operating and financial statistics for the periods presented:
(in thousands except per unit measurements, production, wells and reserves) | ||||||||||||||||
Successor | Predecessor | |||||||||||||||
Year Ended | September 13 Through | January 1 Through | Year Ended | |||||||||||||
December 31, | December 31, | September 12, | December 31, | |||||||||||||
2017 | 2016 | 2016 | 2015 | |||||||||||||
Total production (MBOE) | 3,779 | 1,039 | 3,346 | 7,923 | ||||||||||||
Average daily production (BOEPD) | 10,353 | 9,449 | 13,071 | 22,476 | ||||||||||||
Crude oil production (MBbl) | 2,764 | 710 | 2,311 | 4,923 | ||||||||||||
Crude oil production as a percent of total | 73 | % | 68 | % | 69 | % | 62 | % | ||||||||
Product revenues | $ | 159,469 | $ | 38,654 | $ | 93,649 | $ | 262,980 | ||||||||
Crude oil revenues | $ | 140,886 | $ | 33,157 | $ | 81,377 | $ | 220,596 | ||||||||
Crude oil revenues as a percent of total | 88 | % | 86 | % | 87 | % | 84 | % | ||||||||
Realized prices: | ||||||||||||||||
Crude oil ($ per Bbl) | $ | 50.96 | $ | 46.68 | $ | 35.21 | $ | 44.81 | ||||||||
NGL ($ per Bbl) | $ | 19.25 | $ | 16.56 | $ | 11.37 | $ | 12.24 | ||||||||
Natural gas ($ per Mcf) | $ | 2.89 | $ | 2.81 | $ | 2.06 | $ | 2.62 | ||||||||
Aggregate ($ per BOE) | $ | 42.20 | $ | 37.19 | $ | 27.99 | $ | 33.18 | ||||||||
Prices, adjusted for derivatives:: | ||||||||||||||||
Crude oil ($ per Bbl) | $ | 49.69 | $ | 47.17 | $ | 55.98 | $ | 72.74 | ||||||||
Natural gas ($ per Mcf) | $ | 2.89 | $ | 2.81 | $ | 2.06 | $ | 2.69 | ||||||||
Aggregate ($ per BOE) | $ | 41.27 | $ | 37.56 | $ | 42.33 | $ | 50.63 | ||||||||
Production and lifting costs ($ per BOE): | ||||||||||||||||
Lease operating | $ | 5.76 | $ | 5.13 | $ | 4.67 | $ | 5.36 | ||||||||
Gathering, processing and transportation | $ | 2.84 | $ | 2.93 | $ | 3.96 | $ | 3.01 | ||||||||
Production and ad valorem taxes ($ per BOE) | $ | 2.33 | $ | 2.40 | $ | 1.04 | $ | 2.06 | ||||||||
General and administrative ($ per BOE) 1 | $ | 4.83 | $ | 4.90 | $ | 11.64 | $ | 5.47 | ||||||||
Depreciation, depletion and amortization ($ per BOE) 2 | $ | 12.87 | $ | 11.21 | $ | 10.04 | $ | 42.22 | ||||||||
Cash provided by operating activities 3 | $ | 81,710 | $ | 30,774 | $ | 30,247 | $ | 169,303 | ||||||||
Cash paid for capital expenditures | $ | 115,687 | $ | 4,812 | $ | 15,359 | $ | 364,844 | ||||||||
Cash and cash equivalents at end of period | $ | 11,017 | $ | 6,761 | $ | 31,414 | $ | 11,955 | ||||||||
Debt outstanding, net of discount and issue costs, at end of period | $ | 265,267 | $ | 25,000 | $ | 75,350 | $ | 1,224,383 | ||||||||
Credit available under credit facility at end of period 4 | $ | 159,745 | $ | 102,233 | $ | 51,883 | $ | — | ||||||||
Net development wells drilled and completed | 16.9 | — | 2.9 | 38.6 | ||||||||||||
Proved reserves at the end of the period (MMBOE) | 73 | 49 | N/A | 44 | ||||||||||||
_____________________________________________
1 Includes equity-classified share-based compensation, liability-classified share-based compensation and significant special charges, including acquisition transaction costs, strategic and financial advisory costs prior to our bankruptcy filing, among others as described in the discussion of “Results of Operations - General and Administrative Expenses,” of $1.35, $6.98 and $1.39 for the year ended December 31, 2017, the Predecessor period in 2016 and the year ended December 31, 2015, respectively.
2 | Determined using the full cost method for the Successor periods and the successful efforts method for the Predecessor periods. |
3 | Includes cash paid for derivative settlements of $3.5 million for 2017 and cash received for derivative settlements of $0.4 million, $48.0 million and $138.2 million for the Successor period in 2016, the Predecessor period in 2016 and 2015, respectively. |
4 | As of December 31, 2015, we were unable to draw on our pre-petition credit facility, or RBL. |
33
Key Developments
The following general business developments and corporate actions had or may have a significant impact on our results of operations, financial position and cash flows:
Acquisition of Producing Properties
Hunt Acquisition
In December 2017, we entered into a purchase and sale agreement with Hunt to acquire certain oil and gas assets in the Eagle Ford Shale, primarily in Gonzales and Lavaca Counties, Texas for $86.0 million in cash, subject to adjustments, or the Hunt Acquisition. The Hunt Acquisition has an effective date of October 1, 2017 and closed on March 1, 2018. We funded the Hunt Acquisition with borrowings under the Credit Facility. The Hunt Acquisition expands our core net leasehold position by approximately 9,700 net acres, substantially all of which is held by production, in the northwestern portion of our Eagle Ford acreage. As a result of the Hunt Acquisition we are the operator of substantially all of our Eagle Ford acreage.
Devon Acquisition
In July 2017, we entered into a purchase and sale agreement, or the Purchase Agreement, with Devon, to acquire all of Devon’s right, title and interest in and to certain oil and gas assets, or the Devon Properties, including oil and gas leases covering approximately 19,600 net acres located primarily in Lavaca County, Texas for consideration of $205 million in cash, subject to adjustment, or the Devon Acquisition. Upon execution of the Purchase Agreement, we deposited $10.3 million as earnest money into an escrow account, or the Escrow Account. The Devon Acquisition has an effective date of March 1, 2017 and closed on September 29, 2017, at which time we paid cash consideration of $189.9 million and $7.1 million was released from the Escrow Account to Devon. In November 2017, we acquired additional working interests in the Devon Properties for $0.7 million from parties that had tag-along rights to sell their interests under the Purchase Agreement.
The final settlement of the Devon Acquisition together with the tag-along rights acquisition, occurred in February 2018 at which time $2.5 million in cash was transferred from the Escrow Account to Devon representing final adjustments for the period from the effective date of the acquisition through the closing date and the curing of title defects for certain properties. As of December 31, 2017, there was $3.2 million remaining in the Escrow Account, which is included as a component of noncurrent “Other assets” on our Consolidated Balance Sheet. Of this total, $2.5 million was transferred as described above and the remaining $0.7 million was distributed to us in February 2018.
Amendments to Credit Facility and Borrowing Base Redetermination
On March 1, 2018, we entered into an amendment to our Credit Facility that increased our borrowing base by $102.5 million to $340 million from $237.5 million pursuant to the Spring redetermination and the Hunt Acquisition.
Previously, in September 2017 and in connection with the closing of the Second Lien Facility (discussed below), the Credit Facility was amended to, among other things, increase the borrowing base to its year-end 2017 level of $237.5 million, provide for the entry into the Second Lien Facility, the borrowings thereunder, the granting of liens to secure the obligations thereunder and other related modifications.
Second Lien Facility
In September 2017, we entered into the Second Lien Facility. We received net proceeds of $187.8 million from the Second Lien Facility net of an original issue discount, or OID, of $4.0 million and issue costs of $8.2 million. The proceeds from the Second Lien Facility were used to fund the Devon Acquisition and related fees and expenses. The Second Lien Facility was issued at a price of 98% with an initial interest rate of 8.34% resulting in an effective interest rate of 9.89%. The initial interest rate on the Second Lien Facility as described above was based on the three-month LIBOR rate in effect on the date the Second Lien Facility was entered into. As of March 1, 2018, the interest rate was 8.65%. The maturity date under the Second Lien Facility is September 29, 2022.
34
Production, Capital and Development Plans
Total production for the quarter and year ended December 31, 2017 was 1,135 MBOE and 3,779 MBOE, or 12,340 BOEPD and 10,353 BOEPD, with approximately 74 percent and 73 percent, or 845 MBbls and 2,764 MBbls, of production from crude oil, 13 percent and 14 percent from NGLs and 13 percent and 13 percent from natural gas, respectively. Production from our Eagle Ford operations during these periods was 1,067 MBOE and 3,487 MBOE, or 11,594 BOEPD and 9,553 BOEPD, respectively. Approximately 78 percent of our Eagle Ford production for each of the periods was from crude oil, 12 percent was from NGLs and 10 percent was from natural gas, respectively. Production from our Eagle Ford operations was approximately 94 percent and 92 percent of total Company production during the quarter and year ended December 31, 2017, respectively.
We drilled and turned nine and 29 gross (5.3 and 16.9 net) Eagle Ford wells to sales during the quarter and year ended December 31, 2017, respectively.
Based on our business plan, we anticipate total capital expenditures for 2018 to total between $320 and $360 million with approximately 95 percent of capital being directed to drilling and completions in the Eagle Ford.
Commodity Hedging Program
As of February 23, 2018, we have hedged a substantial portion of our estimated future crude oil production through the end of 2020. For 2018, we have 6,227 BOPD with a weighted-average WTI-based swap price of $50.70 per barrel and 2,500 BOPD with a weighted-average LLS-based swap price of $55.18 per barrel. For 2019, we have 4,915 BOPD with a weighted-average WTI-based swap price of $52.12 per barrel and 2,500 BOPD with a weighted-average LLS-based swap price of $51.30 per barrel. For 2020, we have 4,000 BOPD with a weighted-average WTI-based swap price of $52.67 per barrel. We are currently unhedged with respect to NGL and natural gas production.
Changes to Executive Management and Board of Directors
Effective August 15, 2017, our board of directors appointed John Brooks as our President and Chief Executive Officer and as a member of our board of directors. Furthermore, effective January 19, 2018, the Board increased the size of the Board to seven members and elected Mr. David Geenberg and Mr. Michael Hanna as members of the Board to fill the newly created vacancies. Additionally, effective February 28, 2018, Mr. Harry Quarls resigned from his position as a director and Executive Chairman of the Company, and the Board was reduced to six members. The Company is actively engaged in finding a new independent board member to serve as chairman of the board of directors of the Company. Until the Company can find such replacement, Darin G. Holderness and David Geenberg will serve as co-chairmen of the board.
35
Financial Condition
Liquidity
Our primary sources of liquidity include our cash on hand, cash provided by operating activities and borrowings under the Credit Facility. The Credit Facility, as recently amended, provides us with up to $340 million in borrowing commitments. The current borrowing base under the Credit Facility is also $340 million. As of March 1, 2018, we had $164.2 million of availability under the Credit Facility, which reflects borrowings of $78.0 million drawn on March 1, 2018 to substantially fund the Hunt Acquisition.
Our cash flows from operating activities are subject to significant volatility due to changes in commodity prices for crude oil, NGL and natural gas products, as well as variations in our production. The prices for these commodities are driven by a number of factors beyond our control, including global and regional product supply and demand, weather, product distribution, refining and processing capacity and other supply chain dynamics, among other factors. The level of our hedging activity and duration of the financial instruments employed depend on our desired cash flow protection, available hedge prices, the magnitude of our capital program and our operating strategy. In order to mitigate this volatility, we entered into derivative contracts hedging a substantial portion of our estimated future crude oil production through the end of 2020.
Our business plan contemplates capital expenditures in excess of our projected cash from operating activities for 2018. Subject to the variability of commodity prices and production that impacts our cash from operating activities, anticipated timing of our capital projects and unanticipated expenditures such as acquisitions, we plan to fund our 2018 capital program with cash from operating activities and borrowings under the Credit Facility.
Capital Resources
Under our business plan for 2018, we currently anticipate capital expenditures, excluding acquisitions, to total between $320 million and $360 million with approximately 95 percent of capital being directed to drilling and completions on our Eagle Ford acreage. We plan to fund our 2018 capital spending with cash from operating activities and borrowings under the Credit Facility. Based upon current price and production expectations for 2018, we believe that our cash from operating activities and borrowings under our Credit Facility will be sufficient to fund our operations through year-end 2018; however, future cash flows are subject to a number of variables and significant additional capital expenditures may be required to more fully develop our properties. For a detailed analysis of our historical capital expenditures, see the “Cash Flows” discussion that follows.
Cash on Hand and Cash From Operating Activities. As of December 31, 2017, we had approximately $11 million of cash on hand. For additional information and an analysis of our historical cash from operating activities, see the “Cash Flows” discussion that follows.
Credit Facility Borrowings. During 2017, we borrowed $52 million, net of repayments, under the Credit Facility. For additional information regarding the terms and covenants under the Credit Facility, see the “Capitalization” discussion that follows.
The following table summarizes our borrowing activity under the Credit Facility for the periods presented:
Borrowings Outstanding | |||||||||||
Weighted- Average | Maximum | Weighted- Average Rate | |||||||||
Three months ended December 31, 2017 | $ | 61,457 | $ | 77,000 | 4.53 | % | |||||
Year ended December 31, 2017 | $ | 41,840 | $ | 77,000 | 4.29 | % | |||||
Proceeds from Sales of Assets. We continually evaluate potential sales of non-core assets, including certain oil and gas properties and non-strategic undeveloped acreage, among others. For additional information and an analysis of our historical proceeds from sales of assets, see the “Cash Flows” discussion that follows.
Capital Market Transactions. From time-to-time and under market conditions that we believe are favorable to us, we may consider capital market transactions, including the offering of debt and equity securities.
36
Cash Flows
The following table summarizes our cash flows for the periods presented:
Successor | Predecessor | |||||||||||
Year | September 13 | January 1 | ||||||||||
Ended | Through | Through | ||||||||||
December 31, | December 31, | September 12, | ||||||||||
2017 | 2016 | 2016 | ||||||||||
Cash flows from operating activities | ||||||||||||
Operating cash flows, net of working capital changes | $ | 91,365 | $ | 31,068 | $ | 34,914 | ||||||
Crude oil derivative settlements (paid) received, net | (3,511 | ) | 384 | 48,008 | ||||||||
Interest payments, net of amounts capitalized | (4,102 | ) | (598 | ) | (4,331 | ) | ||||||
Income tax refunds | — | 7 | 35 | |||||||||
Acquisition transaction costs paid | (1,088 | ) | — | — | ||||||||
Strategic and financial advisory fees paid | — | — | (18,036 | ) | ||||||||
Reorganization items paid | (1,269 | ) | (648 | ) | (28,570 | ) | ||||||
Return of professional fee escrow | 315 | 756 | — | |||||||||
Restructuring and exit costs paid | — | (195 | ) | (1,773 | ) | |||||||
Net cash provided by operating activities | 81,710 | 30,774 | 30,247 | |||||||||
Cash flows from investing activities | ||||||||||||
Acquisitions, net | (200,849 | ) | — | — | ||||||||
Capital expenditures | (115,687 | ) | (4,812 | ) | (15,359 | ) | ||||||
Proceeds from sales of assets, net | 869 | — | 224 | |||||||||
Other, net | — | (104 | ) | 1,186 | ||||||||
Net cash used in investing activities | (315,667 | ) | (4,916 | ) | (13,949 | ) | ||||||
Cash flows from financing activities | ||||||||||||
Proceeds (repayments) from credit facility borrowings, net | 52,000 | (50,350 | ) | (43,771 | ) | |||||||
Proceeds from second lien facility, net | 196,000 | — | — | |||||||||
Debt issuance costs paid | (9,787 | ) | — | (3,011 | ) | |||||||
Proceeds from rights offering, net | 55 | — | 49,943 | |||||||||
Other, net | (55 | ) | (161 | ) | — | |||||||
Net cash provided by (used in) financing activities | 238,213 | (50,511 | ) | 3,161 | ||||||||
Net increase (decrease) in cash and cash equivalents | $ | 4,256 | $ | (24,653 | ) | $ | 19,459 | |||||
Cash Flows from Operating Activities. The overall increase in net cash from operating activities for 2017 compared to the combined Successor and Predecessor periods in 2016 was primarily attributable to (i) higher prices resulting in higher overall product revenue receipts in 2017, (ii) substantially higher payments in the combined Successor and Predecessor periods in 2016 for professional fees and other costs associated with our reorganization, bankruptcy proceedings and consideration of strategic financing alternatives in advance thereof, (iii) payments for termination benefits and other exit activities in the combined Successor and Predecessor periods in 2016 and (iv) lower interest payments due to lower average outstanding borrowings under the Credit Facility and Second Lien Facility in 2017 as compared to outstanding borrowings under the Credit Facility and RBL in the combined Successor and Predecessor periods in 2016. The increase was partially offset by the effect of the payment of net cash settlements from derivatives in 2017 compared to the receipt of net settlements during the combined Successor and Predecessor periods in 2016. Specifically, our hedge prices under our derivative contracts were lower than actual WTI crude oil prices resulting in net payments in 2017 while the opposite situation occurred in the combined Successor and Predecessor periods in 2016 resulting in the receipt of cash settlements. Additionally, the early termination of certain pre-petition derivative contracts in the Predecessor period in 2016 accelerated the receipt of cash settlements in 2016. In addition, we (i) paid certain transaction costs associated with the Devon and Hunt Acquisitions in 2017 and (ii) experienced higher working capital utilization in 2017 as a result of the restart of our drilling program, which had been suspended from February 2016 through November 2016.
37
Cash Flows from Investing Activities. In 2017, we paid a total of $200.8 million for the Devon Acquisition which included $0.7 million paid to other parties that had tag-along rights to sell their interests. As illustrated in the tables below, our cash payments for capital expenditures were higher during 2017 as compared to the combined Successor and Predecessor periods in 2016 due primarily to the restart of our Eagle Ford drilling program. Furthermore, the cash paid for capital expenditures in the Predecessor period in 2016 includes a higher portion attributable to settlements of accrued capital charges from the prior year-end period.
The following table sets forth costs related to our capital expenditure program for the periods presented:
Successor | Predecessor | |||||||||||
Year | September 13 | January 1 | ||||||||||
Ended | Through | Through | ||||||||||
December 31, | December 31, | September 12, | ||||||||||
2017 | 2016 | 2016 | ||||||||||
Drilling and completion | $ | 125,235 | $ | 4,839 | $ | 3,696 | ||||||
Lease acquisitions and other land-related costs | 4,493 | 93 | 58 | |||||||||
Geological, geophysical (seismic) and delay rental costs | 696 | 567 | (16 | ) | ||||||||
Pipeline, gathering facilities and other equipment, net | (597 | ) | (45 | ) | 375 | |||||||
$ | 129,827 | $ | 5,454 | $ | 4,113 | |||||||
The following table reconciles the total costs of our capital expenditure program with the net cash paid for capital expenditures as reported in our Consolidated Statements of Cash Flows for the periods presented:
Successor | Predecessor | |||||||||||
Year | September 13 | January 1 | ||||||||||
Ended | Through | Through | ||||||||||
December 31, | December 31, | September 12, | ||||||||||
2017 | 2016 | 2016 | ||||||||||
Total capital program costs (from above) | $ | 129,827 | $ | 5,454 | $ | 4,113 | ||||||
(Increase) decrease in accrued capitalized costs | (19,910 | ) | (997 | ) | 11,301 | |||||||
Less: | ||||||||||||
Exploration expenses charged to operations: | ||||||||||||
Geological and geophysical (seismic) and delay rental costs | — | — | 16 | |||||||||
Transfers from tubular inventory and well materials | (3,326 | ) | (272 | ) | (465 | ) | ||||||
Sales & use tax refunds received and applied to property accounts | (2,265 | ) | — | — | ||||||||
Add: | ||||||||||||
Tubular inventory and well materials purchased in advance of drilling | 6,252 | 61 | 211 | |||||||||
Capitalized internal labor | 2,384 | 541 | — | |||||||||
Capitalized interest | 2,725 | 25 | 183 | |||||||||
Total cash paid for capital expenditures | $ | 115,687 | $ | 4,812 | $ | 15,359 | ||||||
The increased capital expenditures for 2017 and the Predecessor period in 2016 were partially offset by cash inflows during such periods. We sold certain lease rights for inactive acreage in Oklahoma for $0.9 million in 2017 and the Predecessor period in 2016 includes insurance recoveries from a casualty loss incurred in 2015. The 2016 Successor period includes payments for certain items related to assets sold in prior periods net of proceeds received from the sale of surplus tubular inventory and well equipment.
Cash Flows from Financing Activities. The Successor periods in 2017 and 2016 include borrowings, net of repayments, of $52 million and $50.4 million, respectively, under the Credit Facility while the Predecessor period in 2016 includes repayments of $119.1 million under the RBL offset by the initial draw of $75.4 million under the Credit Facility upon emergence. We received proceeds of $196.0 million from the Second Lien Facility, net of OID, in 2017. We also paid $1.7 million of debt issue costs in 2017 in connection with amendments to the Credit Facility and $8.1 million in connection with the Second Lien Facility as compared to $3.0 million in the Predecessor period in 2016 attributable to the initial placement of the Credit Facility. Delayed receipts attributable to the rights offering in September 2016 were offset by costs paid in connection with the registration of our common stock in 2017 as compared to the original proceeds received from the rights offering in the 2016 Predecessor period upon our emergence from bankruptcy.
38
Capitalization
The following table summarizes our total capitalization as of the dates presented:
December 31, | |||||||
2017 | 2016 | ||||||
Credit Facility borrowings | $ | 77,000 | $ | 25,000 | |||
Second Lien Facility term loans, net of original issue discount and issuance costs | 188,267 | — | |||||
Total debt | 265,267 | 25,000 | |||||
Shareholders’ equity | 221,639 | 185,548 | |||||
Total capitalization | $ | 486,906 | $ | 210,548 | |||
Debt as a % of total capitalization | 54 | % | 12 | % | |||
Credit Facility. The Credit Facility provides for a $340 million revolving commitment and borrowing base. The Credit Facility includes a $5.0 million sublimit for the issuance of letters of credit. The availability under the Credit Facility may not exceed the lesser of the aggregate commitments and the borrowing base. The borrowing base under the Credit Facility is redetermined semi-annually, generally in April and October of each year. Additionally, the Credit Facility lenders may, at their discretion, initiate a redetermination at any time during the six-month period between scheduled redeterminations. The Credit Facility is available to us to pay expenses associated with our bankruptcy proceedings and for general corporate purposes including working capital. The Credit Facility matures in September 2020.
The outstanding borrowings under the Credit Facility bear interest at a rate equal to, at our option, either (a) a customary reference rate plus an applicable margin ranging from 2.00% to 3.00%, determined based on the average availability under the Credit Facility or (b) a customary London interbank offered rate, or LIBOR, plus an applicable margin ranging from 3.00% to 4.00%, determined based on the average availability under the Credit Facility. Interest on reference rate borrowings is payable quarterly in arrears and is computed on the basis of a year of 365/366 days, and interest on LIBOR borrowings is payable every one, three or six months, at our election, and is computed on the basis of a year of 360 days. As of December 31, 2017, the actual weighted-average interest rate on the outstanding borrowings under the Credit Facility was 4.78%. Unused commitment fees are charged at a rate of 0.50%.
The Credit Facility is guaranteed by our parent company and all of our subsidiaries, or the Guarantor Subsidiaries. The guarantees under the Credit Facility are full and unconditional and joint and several. Substantially all of our consolidated assets are held by the Guarantor Subsidiaries. The parent company has no material independent assets or operations. The obligations under the Credit Facility are secured by a first priority lien on substantially all of our assets.
Second Lien Facility. On September 29, 2017, we entered into the $200 million Second Lien Facility. We received $187.9 million from the Second Lien Facility, net of OID of $4.0 million and issue costs of $8.1 million. The proceeds from the Second Lien Facility were used to fund the Devon Acquisition and related fees and expenses. The maturity date under the Second Lien Facility is September 29, 2022.
The outstanding borrowings under the Second Lien Facility bear interest at a rate equal to, at our option, either (a) a customary reference rate based on the prime rate plus an applicable margin of 6.00% or (b) a customary LIBOR rate plus an applicable margin of 7.00%. Amounts under the Second Lien Facility were borrowed at a price of 98% with an initial interest rate of 8.34% resulting in an effective interest rate of 9.89%. As of December 31, 2017, the actual interest rate on the Second Lien Facility was 8.57%. Interest on reference rate borrowings is payable quarterly in arrears and is computed on the basis of a year of 365/366 days, and interest on eurocurrency borrowings is payable every one or three months (including in three month intervals if we select a six month interest period), at our election and is computed on the basis of a year of 360 days. We have the right, to the extent permitted under the Credit Facility and an intercreditor agreement between the lenders under the Credit Facility and the lenders under the Second Lien Facility, to prepay loans under the Second Lien Facility at any time, subject to the following prepayment premiums (in addition to customary “breakage” costs with respect to eurocurrency loans): during year one, a customary “make-whole” premium; during year two, 102% of the amount being prepaid; during year three, 101% of the amount being prepaid; and thereafter, no premium. The Second Lien Facility also provides for the following prepayment premiums in the event of a change in control that results in an offer of prepayment that is accepted by the lenders under the Second Lien Facility. During years one and two, 102% of the amount being prepaid; during year three, 101% of the amount being prepaid; and thereafter, no premium.
The Second Lien Facility is collateralized by substantially all of the Company’s and its subsidiaries’ assets with lien priority subordinated to the liens securing the Credit Facility. The obligations under the Second Lien Facility are guaranteed by us and the Guarantor Subsidiaries.
39
Covenant Compliance. The Credit Facility requires us to maintain (1) a minimum interest coverage ratio (adjusted EBITDAX to adjusted interest expense), measured as of the last day of each fiscal quarter, of 3.00 to 1.00, (2) a minimum current ratio (as defined in the Credit Facility, which considers the unused portion of the total commitment as a current asset), measured as of the last day of each fiscal quarter of 1.00 to 1.00, and (3) a maximum leverage ratio (consolidated indebtedness to EBITDAX), measured as of the last day of each fiscal quarter, of 3.75 to 1.00, decreasing on March 31, 2018 and thereafter to 3.50 to 1.00. The Second Lien Facility has no financial covenants.
The Credit Facility and Second Lien Facility also contain customary affirmative and negative covenants, including as to compliance with laws (including environmental laws, ERISA and anti-corruption laws), maintenance of required insurance, delivery of quarterly and annual financial statements, oil and gas engineering reports and budgets, maintenance and operation of property (including oil and gas properties), restrictions on the incurrence of liens and indebtedness, merger, consolidation or sale of assets, payment of dividends, and transactions with affiliates and other customary covenants.
The Credit Facility and Second Lien Facility contain customary events of default and remedies. If we do not comply with the financial and other covenants in the Credit Facility and Second Lien Facility, the lenders thereto may, subject to customary cure rights, require immediate payment of all amounts outstanding under the Credit Facility and Second Lien Facility.
As of December 31, 2017, we were in compliance with all of the covenants under the Credit Facility and the Second Lien Facility.
Results of Operations
The tabular presentations included below reflect the results of operations associated with the Successor periods of 2017 and 2016 (the period from September 13 through December 31, 2016), the Predecessor period of 2016 (the period from January 1 through September 12, 2016) and the full calendar year of 2015. As discussed previously in “Overview and Executive Summary,” the adoption of Fresh Start Accounting and the full cost method of accounting for oil and gas properties on the Emergence Date results in the Successor not being comparable to the Predecessor for purposes of financial reporting. While the Successor effectively represents a new reporting entity for financial reporting purposes, the impact is generally limited to those areas associated with the basis in and accounting for our oil and gas properties (specifically DD&A, impairments as well as exploration expenses), capital structure (specifically interest expense) and income taxes (due to the change in control). Accordingly, we believe that describing certain year-over-year variances and trends in our production, revenues and expenses for the calendar years 2017, 2016 and 2015 without regard to the concept of a Successor and Predecessor facilitates a meaningful analysis of our results of operations.
Substantial components of our year-over-year variances for 2016 to 2015 are due to the effects of property divestitures. In 2015, we sold all of our interests in the Haynesville Shale and Cotton Valley in East Texas as well as certain non-core properties in the Eagle Ford and Mid-Continent. In the discussion and analysis that follows, the term “Divested properties” refers to the production, revenues and expenses associated with our former assets in those regions. In addition, we operated three wells in the Marcellus Shale in Pennsylvania. We terminated operations in that region in August 2016 and completed well-plugging and remediation activities in 2017.
40
Production
The following tables set forth a summary of our total and average daily production volumes by product and geographic region for the periods presented:
Total Production | ||||||||||||
Successor | Predecessor | |||||||||||
Year Ended | September 13 Through | January 1 Through | Year Ended | |||||||||
December 31, | December 31, | September 12, | December 31, | |||||||||
2017 | 2016 | 2016 | 2015 | |||||||||
Crude oil (MBbl) | 2,764 | 711 | 2,311 | 4,923 | ||||||||
NGLs (MBbl) | 523 | 164 | 533 | 1,381 | ||||||||
Natural gas (MMcf) | 2,949 | 994 | 3,013 | 9,713 | ||||||||
Total (MBOE) | 3,779 | 1,040 | 3,346 | 7,923 | ||||||||
2017 vs. Combined 2016 Variance (MBOE) | (607 | ) | ||||||||||
% Change | (13.8 | )% | ||||||||||
Combined 2016 vs. 2015 Variance (MBOE) | (3,537 | ) | ||||||||||
% Change | (44.6 | )% | ||||||||||
Average Daily Production | ||||||||||||
Year Ended | September 13 Through | January 1 Through | Year Ended | |||||||||
December 31, | December 31, | September 12, | December 31, | |||||||||
2017 | 2016 | 2016 | 2015 | |||||||||
Crude oil (Bbl per day) | 7,573 | 6,463 | 9,028 | 13,523 | ||||||||
NGLs (Bbl per day) | 1,432 | 1,491 | 2,082 | 3,893 | ||||||||
Natural gas (MMcf per day) | 8 | 9 | 11 | — | ||||||||
Total (BOEPD) | 10,353 | 9,454 | 13,081 | 22,323 | ||||||||
2017 vs. Combined 2016 Variance (MBOE) | (1,631 | ) | ||||||||||
% Change | (13.6 | )% | ||||||||||
Combined 2016 vs. 2015 Variance (MBOE) | (10,339 | ) | ||||||||||
% Change | (46.3 | )% | ||||||||||
Total Production | ||||||||||||
Year Ended | September 13 Through | January 1 Through | Year Ended | |||||||||
December 31, | December 31, | September 12, | December 31, | |||||||||
2017 | 2016 | 2016 | 2015 | |||||||||
South Texas | 3,487 | 937 | 3,071 | 6,903 | ||||||||
Mid-Continent and other 1 | 292 | 103 | 276 | 460 | ||||||||
Divested properties 2 | — | — | — | 560 | ||||||||
Total (MBOE) | 3,779 | 1,040 | 3,346 | 7,923 | ||||||||
2017 vs. Combined 2016 Variance (MBOE) | (607 | ) | ||||||||||
% Change | (13.8 | )% | ||||||||||
Combined 2016 vs. 2015 Variance (MBOE) | (3,537 | ) | ||||||||||
% Change | (44.6 | )% | ||||||||||
Average Daily Production | ||||||||||||
Year Ended | September 13 Through | January 1 Through | Year Ended | |||||||||
December 31, | December 31, | September 12, | December 31, | |||||||||
2017 | 2016 | 2016 | 2015 | |||||||||
South Texas | 9,553 | 8,518 | 11,996 | 18,913 | ||||||||
Mid-Continent and other 1 | 800 | 936 | 1,085 | 1,260 | ||||||||
Divested properties 2 | — | — | — | 2,150 | ||||||||
Total (BOEPD) | 10,353 | 9,454 | 13,081 | 22,323 | ||||||||
2017 vs. Combined 2016 Variance (MBOE) | (1,631 | ) | ||||||||||
% Change | (13.6 | )% | ||||||||||
Combined 2016 vs. 2015 Variance (MBOE) | (10,339 | ) | ||||||||||
% Change | (46.3 | )% | ||||||||||
_____________________________________________
1 Includes total production and average daily production of approximately 10 MBOE (48 BOEPD) and 22 MBOE (60 BOEPD) for 2016 and 2015, respectively, attributable to our three then-active Marcellus Shale wells.
2 We sold all of our properties in the Haynesville Shale and Cotton Valley in East Texas in August 2015, which represented total production and average daily production of approximately 449 MBOE (1,806 BOEPD) in 2015. We sold certain non-core properties in the Eagle Ford and Granite Wash in October 2015, which represented total production and average daily production of approximately 111 MBOE (344 BOEPD) in 2015.
41
2017 vs. 2016. Total production decreased for the year ended December 31, 2017 compared to the combined Successor and Predecessor periods in 2016 due primarily to natural production declines and the carryover effect from the suspension of our drilling program that began in February 2016 and extended through November 2016. While we resumed the drilling program at the end of 2016, we did not turn any new wells to sales until mid-February 2017. The decline was further exacerbated by mechanical issues with our previously-contracted drilling rigs and the effects of Hurricane Harvey in August 2017 which resulted in a partial curtailment of production for several days as well as delays in our scheduled drilling and completion activities in South Texas. Approximately 73 percent of total production during 2017 was attributable to crude oil when compared to approximately 69 percent during the combined Successor and Predecessor periods in 2016. Our Eagle Ford production represented 92 percent of our total production during 2017 compared to approximately 91 percent from this region during the combined Successor and Predecessor periods in 2016. During 2017, we turned 29 gross (16.9 net) Eagle Ford wells to sales compared to five gross (2.9 net) wells during the combined Successor and Predecessor periods in 2016
2016 vs. 2015. Total production decreased substantially during the combined Successor and Predecessor periods in 2016 compared to 2015 due primarily to the suspension of our drilling program in February 2016, natural production declines in all of our operating regions and the sale of our East Texas assets in August 2015 and other non-core Eagle Ford and certain Mid-Continent properties in October 2015. Approximately 69 percent of total production during the combined Successor and Predecessor periods in 2016 was attributable to crude oil when compared to approximately 62 percent during 2015. Our Eagle Ford production represented approximately 91 percent of our total production during the combined Successor and Predecessor periods in 2016 compared to approximately 87 percent from this region during 2015. During the combined Successor and Predecessor period in 2016, we turned to sales five gross (2.9 net) Eagle Ford wells compared to 61 gross (38.6 net) Eagle Ford wells during 2015.
42
Product Revenues and Prices
The following tables set forth a summary of our revenues and prices per unit of volume by product and geographic region for the periods presented:
Total Product Revenues | ||||||||||||||||
Successor | Predecessor | |||||||||||||||
Year Ended | September 13 Through | January 1 Through | Year Ended | |||||||||||||
December 31, | December 31, | September 12, | December 31, | |||||||||||||
2017 | 2016 | 2016 | 2015 | |||||||||||||
Crude oil | $ | 140,886 | $ | 33,157 | $ | 81,377 | $ | 220,596 | ||||||||
NGLs | 10,066 | 2,707 | 6,064 | 16,905 | ||||||||||||
Natural gas | 8,517 | 2,790 | 6,208 | 25,479 | ||||||||||||
Total | $ | 159,469 | $ | 38,654 | $ | 93,649 | $ | 262,980 | ||||||||
2017 vs. Combined 2016 Variance | $ | 27,166 | ||||||||||||||
% Change | 20.5 | % | ||||||||||||||
Combined 2016 vs. 2015 Variance | $ | (130,677 | ) | |||||||||||||
% Change | (49.7 | )% | ||||||||||||||
Product Revenues per Unit of Volume | ||||||||||||||||
Year Ended | September 13 Through | January 1 Through | Year Ended | |||||||||||||
December 31, | December 31, | September 12, | December 31, | |||||||||||||
2017 | 2016 | 2016 | 2015 | |||||||||||||
Crude oil ($ per barrel) | $ | 50.96 | $ | 46.63 | $ | 35.21 | $ | 44.81 | ||||||||
NGLs ($ per barrel) | $ | 19.25 | $ | 16.51 | $ | 11.38 | $ | 12.24 | ||||||||
Natural gas ($ per Mcf) | $ | 2.89 | $ | 2.81 | $ | 2.06 | $ | 2.62 | ||||||||
Total ($ per BOE) | $ | 42.20 | $ | 37.17 | $ | 27.99 | $ | 33.19 | ||||||||
2017 vs. Combined 2016 Variance ($ per BOE) | $ | 12.03 | ||||||||||||||
% Change | 39.9 | % | ||||||||||||||
Combined 2016 vs. 2015 Variance ($ per BOE) | $ | (3.02 | ) | |||||||||||||
% Change | (9.1 | )% | ||||||||||||||
Total Product Revenues | ||||||||||||||||
Year Ended | September 13 Through | January 1 Through | Year Ended | |||||||||||||
December 31, | December 31, | September 12, | December 31, | |||||||||||||
2017 | 2016 | 2016 | 2015 | |||||||||||||
South Texas | $ | 152,521 | $ | 36,261 | $ | 88,849 | $ | 240,486 | ||||||||
Mid-Continent and other 1 | 6,948 | 2,393 | 4,800 | 9,666 | ||||||||||||
Divested properties 2 | — | — | — | 12,828 | ||||||||||||
Total | $ | 159,469 | $ | 38,654 | $ | 93,649 | $ | 262,980 | ||||||||
2017 vs. Combined 2016 Variance | $ | 27,166 | ||||||||||||||
% Change | 20.5 | % | ||||||||||||||
Combined 2016 vs. 2015 Variance | $ | (130,677 | ) | |||||||||||||
% Change | (49.7 | )% | ||||||||||||||
Product Revenues per Unit of Volume | ||||||||||||||||
Year Ended | September 13 Through | January 1 Through | Year Ended | |||||||||||||
December 31, | December 31, | September 12, | December 31, | |||||||||||||
2017 | 2016 | 2016 | 2015 | |||||||||||||
South Texas | $ | 43.74 | $ | 38.71 | $ | 28.94 | $ | 34.84 | ||||||||
Mid-Continent and other | $ | 23.79 | $ | 23.23 | $ | 17.41 | $ | 21.01 | ||||||||
Divested properties | $ | — | $ | — | $ | — | $ | 22.91 | ||||||||
Total ($ per BOE) | $ | 42.20 | $ | 37.17 | $ | 27.99 | $ | 33.19 | ||||||||
2017 vs. Combined 2016 Variance ($ per BOE) | $ | 12.03 | ||||||||||||||
% Change | 39.9 | % | ||||||||||||||
Combined 2016 vs. 2015 Variance ($ per BOE) | $ | (3.02 | ) | |||||||||||||
% Change | (9.1 | )% | ||||||||||||||
_____________________________________________
1 Includes revenues of $0.1 million and $0.2 million attributable to the Marcellus Shale for the Predecessor period in 2016 and the year ended December 31, 2015, respectively.
2 | Includes revenues of $8.2 million attributable to East Texas for 2015 that we sold in August 2015. Includes revenues of $4.3 million for 2015 attributable to non-core Eagle Ford properties that we sold in October 2015. Includes revenues of $0.4 million for 2015 attributable to certain Mid-Continent properties that we sold in October 2015. |
43
The following table provides an analysis of the changes in our revenues for the periods presented:
Year Ended December 31, 2017 vs. | Combined Successor and Predecessor | ||||||||||||||||||||||
Combined Successor and Predecessor | Periods Ended December 31, 2016 vs. | ||||||||||||||||||||||
Periods Ended December 31, 2016 | Year Ended December 31, 2015 | ||||||||||||||||||||||
Revenue Variance Due to | Revenue Variance Due to | ||||||||||||||||||||||
Volume | Price | Total | Volume | Price | Total | ||||||||||||||||||
Crude oil | $ | (9,742 | ) | $ | 36,094 | $ | 26,352 | $ | (85,180 | ) | $ | (20,882 | ) | $ | (106,062 | ) | |||||||
NGLs | (2,188 | ) | 3,483 | 1,295 | (8,371 | ) | 237 | (8,134 | ) | ||||||||||||||
Natural gas | (2,378 | ) | 1,897 | (481 | ) | (14,998 | ) | (1,483 | ) | (16,481 | ) | ||||||||||||
$ | (14,308 | ) | $ | 41,474 | $ | 27,166 | $ | (108,549 | ) | $ | (22,128 | ) | $ | (130,677 | ) | ||||||||
2017 vs. 2016. Our product revenues in 2017 increased over the combined Successor and Predecessor periods in 2016 due primarily to the significant increases in all product pricing which was partially offset by the decline in production described previously. Total crude oil revenues were approximately 88 percent during 2017 compared to 87 percent during the combined Successor and Predecessor periods in 2016. Total Eagle Ford revenues were approximately 96 percent of total revenues in 2017 compared to 94 percent in the combined Successor and Predecessor periods in 2016.
2016 vs. 2015. Our product revenues during the combined Successor and Predecessor periods in 2016 decreased substantially compared to 2015 due primarily to the decline in production described previously, which was further exacerbated by the collapse of commodity prices that continued from 2015 into 2016. Total crude oil revenues were approximately 87 percent during the combined Successor and Predecessor periods in 2016 compared to 84 percent during 2015. Total Eagle Ford revenues were approximately 94 percent of total revenues in the combined Successor and Predecessor periods in 2016 compared to 91 percent in 2015.
Effects of Derivatives
The following table reconciles crude oil and natural gas revenues to realized prices, as adjusted for derivative activities, for the periods presented:
Successor | Predecessor | |||||||||||||||
Year Ended | September 13 Through | January 1 Through | Year Ended | |||||||||||||
December 31, | December 31, | September 12, | December 31, | |||||||||||||
2017 | 2016 | 2016 | 2015 | |||||||||||||
Crude oil revenues as reported | $ | 140,886 | $ | 33,157 | $ | 81,377 | $ | 220,596 | ||||||||
Derivative settlements, net | (3,511 | ) | 384 | 48,008 | 137,488 | |||||||||||
$ | 137,375 | $ | 33,541 | $ | 129,385 | $ | 358,084 | |||||||||
Crude oil prices per Bbl, as reported | $ | 50.96 | $ | 46.63 | $ | 35.21 | $ | 44.81 | ||||||||
Derivative settlements per Bbl | (1.27 | ) | 0.54 | 20.77 | 27.93 | |||||||||||
$ | 49.69 | $ | 47.17 | $ | 55.98 | $ | 72.74 | |||||||||
Natural gas revenues as reported | $ | 8,517 | $ | 2,790 | $ | 6,208 | $ | 25,479 | ||||||||
Derivative settlements, net | — | — | — | 681 | ||||||||||||
$ | 8,517 | $ | 2,790 | $ | 6,208 | $ | 26,160 | |||||||||
Natural gas prices per Mcf, as reported | $ | 2.89 | $ | 2.81 | $ | 2.06 | $ | 2.62 | ||||||||
Derivative settlements per Mcf | — | — | — | 0.07 | ||||||||||||
$ | 2.89 | $ | 2.81 | $ | 2.06 | $ | 2.69 | |||||||||
44
Gain (Loss) on Sales of Assets
During the Successor periods, we recognize gains and losses on the sale or disposition of assets other than our oil and gas properties upon the completion of the underlying transactions. The Predecessor periods, during which time we applied the successful efforts method, we also recognized gains and losses on the sale or disposition of oil and gas properties.
The following table sets forth the total gains and losses recognized for the periods presented:
Successor | Predecessor | |||||||||||||||
Year Ended | September 13 Through | January 1 Through | Year Ended | |||||||||||||
December 31, | December 31, | September 12, | December 31, | |||||||||||||
2017 | 2016 | 2016 | 2015 | |||||||||||||
Gain (loss) on sales of assets, net | $ | (36 | ) | $ | (49 | ) | $ | 1,261 | $ | 41,335 | ||||||
2017 and Successor Period in 2016. In 2017 and the Successor period in 2016, we recognized insignificant net losses attributable to support equipment and tubular inventory and well materials.
Predecessor Period in 2016. The Predecessor period in 2016 includes $1.7 million from the amortization of deferred gains attributable to our 2014 sale of rights to construct a crude oil gathering and intermediate transportation system. The amortization of $0.3 million of deferred gains from the 2014 sale of our South Texas natural gas gathering and gas lift assets is also included for the Predecessor period in 2016. As of the Emergence Date, the unamortized portions of those deferred gains were reversed from our Consolidated Balance Sheet in connection with our application of Fresh Start Accounting and included as a component of Reorganization items, net.
2015. In 2015, we recognized a gain of approximately $43 million on the sale of our East Texas assets. Additionally, in connection with an amendment to our crude oil gathering agreement with Republic Midstream which included a pricing concession, we recognized $8.4 million of the gain that was previously deferred and being recognized over the term of the underlying agreement. In 2015, we also recognized $0.4 million of deferred gain from the 2014 sale of our natural gas gathering and gas lift assets in South Texas. These gains were partially offset by a loss of $9.5 million from the sale of certain non-core Eagle Ford properties and a combined loss of $1.2 million from other sale transactions and post-closing adjustments attributable to prior year asset sales.
Other Revenues, net
Other revenues, net, includes fees for marketing, water disposal, gathering, transportation and compression that we charge to third parties, net of related expenses as well as other miscellaneous revenues and credits attributable to our operations. During the Predecessor periods, these revenues also included fees for water supply services as well as charges for accretion attributable to our unused firm transportation obligation.
The following table sets forth the total other revenues, net for the periods presented:
Successor | Predecessor | |||||||||||||||
Year Ended | September 13 Through | January 1 Through | Year Ended | |||||||||||||
December 31, | December 31, | September 12, | December 31, | |||||||||||||
2017 | 2016 | 2016 | 2015 | |||||||||||||
Other revenues, net | $ | 621 | $ | 398 | $ | (600 | ) | $ | 983 | |||||||
2017 vs. 2016. Other revenues, net increased during 2017 from the combined Successor and Predecessor periods in 2016 due primarily to higher marketing fees partially offset by lower water disposal fees resulting from lower overall production. The combined Successor and Predecessor periods in 2016 included charges for reserves of certain of our receivables from joint venture partners and charges attributable to the accretion of unused firm transportation, both of which are presented as contra-revenue items in this caption. There were no firm transportation charges in 2017 because the underlying obligation was rejected in our bankruptcy proceedings.
2016 vs. 2015. Other revenues, net decreased during the Successor and Predecessor periods in 2016 from 2015 due primarily to substantially lower drilling activity in our operating areas. Certain of these revenue sources also declined due to the sale of our East Texas assets in August 2015. In addition, we realized lower water supply and disposal fees in the South Texas region during the combined Successor and Predecessor periods in 2016 due to decreased demand in the region. We also reserved certain of our receivables from joint venture partners in the Predecessor period in 2016.
45
Lease Operating Expenses
Lease operating expenses, or LOE, includes costs that we incur to operate our producing wells and field operations. The most significant costs include compression and gas-lift, chemicals, water disposal, repairs and maintenance, including down-hole repairs, field labor, pumping and well-tending, equipment rentals, utilities and supplies among others.
The following table sets forth our LOE for the periods presented:
Successor | Predecessor | |||||||||||||||
Year Ended | September 13 Through | January 1 Through | Year Ended | |||||||||||||
December 31, | December 31, | September 12, | December 31, | |||||||||||||
2017 | 2016 | 2016 | 2015 | |||||||||||||
Lease operating | $ | 21,784 | $ | 5,331 | $ | 15,626 | $ | 42,428 | ||||||||
Per unit of production ($/BOE) | $ | 5.76 | $ | 5.13 | $ | 4.67 | $ | 5.36 | ||||||||
2017 vs. 2016. LOE increased on an absolute and per unit basis during 2017 when compared to the combined Successor and Predecessor periods in 2016 due primarily to certain costs associated with maintaining our portfolio of operating wells, which are less variable in nature and are therefore adversely affected by lower production volume, as well as higher surface and other repair and maintenance costs. We proceeded with certain of these repair and maintenance efforts during the third quarter of 2017 in order to recover a portion of the production shortfall brought about by Hurricane Harvey and the operational delays discussed above. While we incurred approximately $1 million of higher surface repair costs in 2017, they were partially offset by continuing cost containment efforts that we implemented throughout 2016 and into 2017 as well as the effects of lower industry-wide pricing for certain oilfield products and services.
2016 vs. 2015. LOE decreased during the combined Successor and Predecessor periods in 2016 on an absolute and per unit basis when compared to 2015 due primarily to lower overall production and cost containment efforts that we implemented throughout 2016 and lower industry-wide pricing for certain oilfield products and services. The Predecessor period in 2015 included $4.2 million of LOE attributable to our East Texas assets that were sold in August 2015.
Gathering Processing and Transportation
Gathering, processing and transportation, or GPT, includes costs that we incur to gather and aggregate our oil, NGL and natural gas production from our wells and deliver them to a central delivery point, downstream pipelines or processing plants, depending upon the type of production and the specific arrangements that we have with midstream operators.
The following table sets forth our GPT for the periods presented:
Successor | Predecessor | |||||||||||||||
Year Ended | September 13 Through | January 1 Through | Year Ended | |||||||||||||
December 31, | December 31, | September 12, | December 31, | |||||||||||||
2017 | 2016 | 2016 | 2015 | |||||||||||||
Gathering, processing and transportation | $ | 10,734 | $ | 3,043 | $ | 13,235 | $ | 23,815 | ||||||||
Per unit of production ($/BOE) | $ | 2.84 | $ | 2.93 | $ | 3.96 | $ | 3.01 | ||||||||
2017 vs. 2016. GPT decreased on an absolute and per unit basis during 2017 when compared to the combined Successor and Predecessor periods in 2016 due primarily to lower production volumes as discussed above and decreased gathering rates pursuant to an amendment to our gathering agreement with Republic Midstream, which became effective in August of 2016. Prior to that time we had incurred $0.4 million of charges for production falling below our minimum commitments which were previously higher. We also incurred costs of approximately $0.5 million in the combined Successor and Predecessor periods in 2016 for unused firm transportation services in the Marcellus Shale prior to our termination of operations in that region. There were no such costs incurred in 2017 as the underlying contracts were rejected in our bankruptcy proceedings.
2016 vs. 2015. GPT decreased on an absolute basis during the combined Successor and Predecessor periods in 2016 when compared to 2015 due primarily to substantially lower production volumes in the South Texas region as discussed above. We also experienced a decline in the Successor and Predecessor periods in 2016 resulting from the sale of our East Texas assets in August 2015 as well as lower natural gas and NGL production in the Mid-Continent during the 2016 Successor and Predecessor periods when compared to 2015. The decrease in 2016 was partially offset by charges associated with volume deficiencies in 2016 attributable to our throughput commitments to Republic Midstream and Republic Midstream Marketing, LLC, or together, Republic, as well as higher costs for unused firm transportation services in the Marcellus Shale in the 2016 period prior to our termination of operations in that region. Per unit rates increased during the 2016 Successor and Predecessor periods primarily due to higher rates under the oil gathering services commenced by Republic Midstream in April 2016.
46
Production and Ad Valorem Taxes
Production or severance taxes represent taxes imposed by the states in which we operate for the removal of resources including crude oil, NGLs and natural gas. Ad valorem taxes represent taxes imposed by certain jurisdictions, primarily counties, in which we operate, based on the value of our operating properties. The assessments for ad valorem taxes are generally based on contemporary commodity prices.
The following table sets forth our production and ad valorem taxes for the periods presented:
Successor | Predecessor | |||||||||||||||
Year Ended | September 13 Through | January 1 Through | Year Ended | |||||||||||||
December 31, | December 31, | September 12, | December 31, | |||||||||||||
2017 | 2016 | 2016 | 2015 | |||||||||||||
Production and ad valorem taxes | ||||||||||||||||
Production/severance taxes | $ | 7,533 | $ | 1,801 | $ | 2,695 | $ | 11,796 | ||||||||
Ad valorem taxes | 1,281 | 697 | 795 | 4,486 | ||||||||||||
$ | 8,814 | $ | 2,498 | $ | 3,490 | $ | 16,282 | |||||||||
Per unit of production ($/BOE) | $ | 2.33 | $ | 2.40 | $ | 1.04 | $ | 2.06 | ||||||||
Production/severance tax rate as a percent of product revenues | 4.7 | % | 4.7 | % | 2.9 | % | 4.4 | % | ||||||||
2017 vs. 2016. Production taxes increased on both an absolute and per unit basis during 2017 when compared to the combined Successor and Predecessor periods in 2016 due primarily to the recognition of certain severance tax refunds from Oklahoma in the 2016 periods that were attributable to prior years, as well as higher commodity sales prices despite a decline in production volume in 2017. In the latter half of 2016 and into 2017, we adjusted our accruals for ad valorem taxes downward, primarily in South Texas, reflecting lower oil and gas property valuations.
2016 vs. 2015. Production taxes in the South Texas region declined substantially during the combined Successor and Predecessor periods in 2016 when compared to 2015 due primarily to the overall decline in production volume and commodity prices. In the 2016 Predecessor period, we adjusted our accruals for ad valorem taxes downward, primarily in South Texas, reflecting lower oil and gas property valuations attributable to the significant decline in commodity prices. These adjustments resulted in a significant downward impact on the per unit cost for the Predecessor period in 2016. We also recognized certain severance tax refunds attributable to prior periods in the Mid-Continent and other region during the Predecessor period in 2016.
General and Administrative
Our general and administrative expenses, or G&A, include employee compensation, benefits and other related costs for our corporate management and governance functions, rent and occupancy costs for our corporate facilities, insurance, and consulting costs supporting various corporate-level functions, among others. In order to facilitate a meaningful discussion and analysis of our results of operations with respect to G&A, we have disaggregated certain costs into three components as presented in the table below. Primary G&A encompasses all G&A costs except share-based compensation and certain significant special charges that are generally attributable to material stand-alone transactions or corporate actions that are not otherwise in the normal course.
47
The following table sets forth the components of G&A expenses for the periods presented:
Successor | Predecessor | |||||||||||||||
Year Ended | September 13 Through | January 1 Through | Year Ended | |||||||||||||
December 31, | December 31, | September 12, | December 31, | |||||||||||||
2017 | 2016 | 2016 | 2015 | |||||||||||||
Primary G&A | $ | 13,133 | $ | 5,087 | $ | 15,596 | $ | 32,353 | ||||||||
Shares-based compensation | ||||||||||||||||
Liability-classified | — | — | (19 | ) | (711 | ) | ||||||||||
Equity-classified | 3,809 | 81 | 1,511 | 4,540 | ||||||||||||
Significant special charges | ||||||||||||||||
Acquisition transaction costs | 1,340 | — | — | — | ||||||||||||
Strategic and financial advisory costs | — | — | 18,036 | 6,189 | ||||||||||||
Restructuring expenses | (20 | ) | (80 | ) | 3,821 | 957 | ||||||||||
Total general and administrative expenses | $ | 18,262 | $ | 5,088 | $ | 38,945 | $ | 43,328 | ||||||||
Per unit of production ($/BOE) | $ | 4.83 | $ | 4.90 | $ | 11.64 | $ | 5.47 | ||||||||
Per unit of production excluding all share-based compensation and other significant special charges identified above ($/BOE) | $ | 3.48 | $ | 4.90 | $ | 4.66 | $ | 4.08 | ||||||||
2017 vs. 2016. Our primary G&A expenses decreased on an absolute and per unit basis during 2017 compared to the combined Successor and Predecessor periods in 2016. The decrease is due primarily to the effects of: (i) lower payroll and benefits attributable to a lower overall employee headcount, (ii) the capitalization of certain labor and benefits costs to oil and gas properties in accordance with the full cost method in 2017, (iii) the relocation of our headquarters from Radnor, Pennsylvania to Houston, Texas and related move to a smaller office location, (iv) reduced travel and entertainment and (v) lower corporate support costs consistent with our efforts throughout 2016 and 2017 to decrease our support cost base.
Liability-classified share-based compensation in the 2016 Predecessor period was attributable to our former performance-based restricted stock units, or PBRSUs, and represents mark-to-market adjustments associated with the change in fair value of the then-outstanding PBRSU grants. Our common stock performance relative to a defined peer group was less favorable during the 2016 period resulting in a mark-to-market reversal. All of the unvested PBRSUs were canceled upon our emergence from bankruptcy.
Equity-classified share-based compensation is attributable to the grants of time-vested restricted stock units, or RSUs, in the Successor periods in 2016 and 2017 as well as performance restricted stock units, or PRSUs, in 2017. The 2017 grants of RSUs and PRSUs are described in greater detail in Note 17 to the Consolidated Financial Statements included in Part II, Item 8, “Financial Statements and Supplementary Data.” The Predecessor period in 2016 includes a charge for the cancellation of all of the RSUs outstanding prior to our bankruptcy filing in May 2016, partially offset by forfeitures of the Predecessor’s stock options. All of our equity-classified share-based compensation represents non-cash expenses.
During 2017, we incurred transaction costs associated with the Devon and Hunt Acquisitions, including advisory, legal, due diligence and other professional fees. During the Predecessor period in 2016, we incurred substantial professional fees and other consulting costs associated with our consideration of strategic financing alternatives and related activities in advance of our bankruptcy filing. In connection with our efforts to simplify and reduce our administrative cost structure, we terminated a total of 45 employees during the combined Successor and Predecessor periods in 2016 and incurred related termination and severance benefit costs during the Predecessor periods.
2016 vs. 2015. Our primary G&A expenses decreased during the combined Successor and Predecessor periods in 2016 on an absolute basis and increased on a per unit basis compared to 2015. Our primary G&A expenses during the combined Successor and Predecessor periods in 2016 as compared to 2015 reflect the effects of: (i) lower payroll and benefits attributable to lower employee headcount, (ii) the relocation of our headquarters from Radnor, Pennsylvania to Houston, Texas and related move to a smaller office location, (iii) reduced travel and entertainment and (iv) lower corporate support costs.
Liability-classified share-based compensation represents unfavorable mark-to-market charges in the 2016 Predecessor period and 2015 associated with the change in fair value of the then outstanding PBRSU grants.
Equity-classified share-based compensation charges during the Successor period of 2016 were attributable to restricted stock unit grants to one executive and the board of directors in 2016, while the Predecessor periods in 2016 and 2015 were attributable to the Predecessor’s stock options and RSUs.
During the 2016 Predecessor period, we incurred substantial professional fees and other consulting costs associated with our consideration of strategic financing alternatives and related activities in advance of our bankruptcy filing. In 2015, we incurred $6.2 million in professional fees and consulting costs associated with certain strategic initiatives, including our refinancing efforts and a search for a chief executive officer.
48
In connection with our efforts to simplify and reduce our administrative cost structure, we terminated a total of 53 employees and incurred termination and severance benefits during the Predecessor period in 2016 as compared to a total of 26 employee terminations in 2015 for which we also incurred severance and termination benefits.
Exploration
While applying the successful efforts method of accounting to our oil and gas properties during the Predecessor period in 2016 and 2015, we incurred costs which were charged to operations in accordance with the successful efforts method. In the Successor periods, we applied the full cost method whereby these costs are capitalized. See the discussion of our capital expenditures program included in “Financial Condition - Cash Flows” above and Note 8 to the Consolidated Financial Statements included in Part II, Item 8, “Financial Statements and Supplementary Data” for a discussion of certain capitalized costs.
The following table sets forth the components of exploration expenses for the periods presented:
Successor | Predecessor | |||||||||||||||
Year Ended | September 13 Through | January 1 Through | Year Ended | |||||||||||||
December 31, | December 31, | September 12, | December 31, | |||||||||||||
2017 | 2016 | 2016 | 2015 | |||||||||||||
Unproved leasehold amortization | $ | — | $ | — | $ | 1,940 | $ | 5,759 | ||||||||
Drilling rig termination charges | — | — | 1,705 | 5,885 | ||||||||||||
Drilling carry commitment | — | — | 1,964 | — | ||||||||||||
Geological and geophysical costs (seismic) | — | — | 33 | 828 | ||||||||||||
Other, primarily write-off of uncompleted wells | — | — | 4,646 | 111 | ||||||||||||
$ | — | $ | — | $ | 10,288 | $ | 12,583 | |||||||||
2016 vs. 2015. On the Emergence Date we adopted the full cost method. Accordingly, there are no exploration expenses recorded for the Successor period. With respect to the Predecessor period in 2016, we experienced lower unproved leasehold amortization attributable to a declining leasehold asset base subject to amortization. We also incurred early termination charges in connection with the release of drilling rigs in the Eagle Ford in each of the 2016 and 2015 Predecessor periods; however, the 2015 period includes the release of multiple rigs while the 2016 periods reflect the release of only one rig. Seismic and delay rental costs declined in the Predecessor period in 2016 compared to 2015 due to the suspension of our drilling program. These reductions were partially offset by a charge of $4.0 million for the write-off of certain uncompleted well costs prior to the aforementioned change in accounting method, a $2.0 million charge attributable to our failure to complete a drilling carry requirement attributable to certain acreage acquired in the Eagle Ford in 2014, and a charge of $0.6 million for coiled tubing services that were not utilized by the contract expiration date.
Depreciation, Depletion and Amortization (DD&A)
As discussed with respect to exploration expenses above, our adoption of the full cost method in place of the successful efforts method of accounting for oil and gas properties also impacted the determination of our DD&A during the Successor period in 2016 as compared to the Predecessor periods in 2016 and 2015. For a more detailed discussion of the determination of our DD&A, see the discussion of “Critical Accounting Estimates” that follows as well as Note 3 to our Consolidated Financial Statements included in Part II, Item 8, “Financial Statements and Supplementary Data.”
The following table sets forth total and per unit costs for DD&A for the periods presented:
Successor | Predecessor | |||||||||||||||
Year Ended | September 13 Through | January 1 Through | Year Ended | |||||||||||||
December 31, | December 31, | September 12, | December 31, | |||||||||||||
2017 | 2016 | 2016 | 2015 | |||||||||||||
DD&A expense | $ | 48,649 | $ | 11,652 | $ | 33,582 | $ | 334,479 | ||||||||
DD&A rate ($/BOE) | $ | 12.87 | $ | 11.21 | $ | 10.04 | $ | 42.22 | ||||||||
2017 vs. 2016. Lower production volumes net of the effects of higher depletion rates were the primary factors attributable to the increase in DD&A during 2017 when compared to the combined Successor and Predecessor period in 2016. The Successor periods include a higher proportion of capitalized costs relative to the underlying proved reserves, consistent with the full cost method, when compared to the Predecessor periods which utilized the successful efforts method.
2016 vs. 2015. The effects of lower production volumes and lower depletion rates resulting from Fresh Start Accounting, impairments recorded in the fourth quarter of 2015 and an overall reduction in reserves in 2015 were the primary factors attributable to the decline in DD&A during the Successor and Predecessor periods in 2016 when compared to 2015.
49
Impairments
As more fully described in the discussion of “Critical Accounting Estimates” that follows as well as Note 3 to our Consolidated Financial Statements included in Part II, Item 8, “Financial Statements and Supplementary Data,” our capitalized costs for oil and gas properties are subject to limitations during the Successor and Predecessor periods under the full cost and successful efforts methods, respectively.
The following table sets forth impairments charged for the periods presented:
Successor | Predecessor | |||||||||||||||
Year Ended | September 13 Through | January 1 Through | Year Ended | |||||||||||||
December 31, | December 31, | September 12, | December 31, | |||||||||||||
2017 | 2016 | 2016 | 2015 | |||||||||||||
Impairments | $ | — | $ | — | $ | — | $ | 1,397,424 | ||||||||
2016 vs. 2015. We had no impairments during the 2016 Successor period while we applied the full cost method and no impairments during the 2016 Predecessor period while we applied the successful efforts method. The significant deterioration of commodity prices throughout 2015, as reflected in the future strip pricing as of December 31, 2015, triggered an impairment of approximately $1.4 billion to our proved and unproved Eagle Ford properties and required us to reduce their carrying value to a fair value of approximately $312 million.
Interest Expense
The following table summarizes the components of our interest expense for the periods presented:
Successor | Predecessor | |||||||||||||||
Year Ended | September 13 Through | January 1 Through | Year Ended | |||||||||||||
December 31, | December 31, | September 12, | December 31, | |||||||||||||
2017 | 2016 | 2016 | 2015 | |||||||||||||
Interest on borrowings and related fees | $ | 6,995 | 678 | $ | 36,012 | $ | 92,490 | |||||||||
Accretion of original issue discount | 161 | — | — | — | ||||||||||||
Amortization of debt issuance costs | 1,961 | 226 | 22,189 | 4,749 | ||||||||||||
Capitalized interest | (2,725 | ) | (25 | ) | (183 | ) | (6,288 | ) | ||||||||
$ | 6,392 | $ | 879 | $ | 58,018 | $ | 90,951 | |||||||||
2017 vs. 2016. Interest expense for 2017 is attributable to the Credit and Second Lien Facilities whereas interest expense during the Successor period in 2016 is exclusively attributable to the Credit Facility. Interest expense during the Predecessor period in 2016 is attributable to the RBL and our 7.25% Senior Notes due 2019, or the 2019 Senior Notes, and our 8.50% Senior Notes due 2020, or the 2020 Senior Notes, together with the 2019 Senior Notes, the Senior Notes. Weighted-average amounts outstanding under the Credit Facility during 2017 were lower than the combined weighted-average amounts outstanding under the Credit Facility and RBL during the combined 2016 periods resulting in lower expense. This was partially offset by interest expense on borrowings as well as amortization and accretion of debt issue costs and OID, respectively, attributable to the Second Lien Facility that was put in place at the end of the third quarter in 2017. The 2016 Predecessor period also includes a $20.5 million accelerated write-off of issuance costs associated with the RBL and Senior Notes in advance of our bankruptcy filings
2016 vs. 2015. As described above, interest expense for the Successor period in 2016 is exclusively attributable to the Credit Facility. Interest expense during the Predecessor periods of 2016 and 2015 is attributable to the RBL and the Senior Notes. The 2016 Predecessor period also includes a $20.5 million accelerated write-off of our issuance costs associated with the RBL and Senior Notes in advance of our bankruptcy filings.
50
Derivatives
The gains and losses for our derivatives portfolio reflect changes in the fair value attributable to changes in market values relative to our hedged commodity prices.
The following table summarizes the gains and (losses) attributable to our commodity derivatives portfolio, by commodity type, for the periods presented:
Successor | Predecessor | |||||||||||||||
Year Ended | September 13 Through | January 1 Through | Year Ended | |||||||||||||
December 31, | December 31, | September 12, | December 31, | |||||||||||||
2017 | 2016 | 2016 | 2015 | |||||||||||||
Crude oil derivative (losses) gains | $ | (17,819 | ) | $ | (16,622 | ) | $ | (8,333 | ) | $ | 71,244 | |||||
Natural gas derivative gains | — | — | — | 3 | ||||||||||||
$ | (17,819 | ) | $ | (16,622 | ) | $ | (8,333 | ) | $ | 71,247 | ||||||
2017 vs. 2016. We paid cash settlements of $3.5 million in 2017 as compared to the receipt of $48.4 million of cash settlements from crude oil derivatives during the combined Successor and Predecessor periods in 2016. During 2017, prices under our derivative contracts were lower than the actual WTI crude oil prices resulting in net payments while the opposite situation occurred in the combined Successor and Predecessor periods in 2016 resulting in net receipts of cash settlements as well as the early termination of certain pre-petition derivative contracts in the Predecessor periods in 2016 which accelerated the receipt of cash settlements.
2016 vs. 2015. We received net cash settlements for crude oil derivatives during each of the Successor and Predecessor periods in 2016 and 2015 of $0.4 million, $48.0 million and $137.5 million, respectively, and received cash settlements of $0.7 million for natural gas derivatives during 2015. The decline in total cash settlements is attributable to: (i) lower spreads between hedged and realized prices on our post-petition derivatives, (ii) lower overall crude oil volumes hedged, (iii) the early termination of our entire pre-petition portfolio of 2016 derivative contracts, most of the proceeds from which were provided directly to the RBL lenders to pay down borrowings under the RBL prior to the Petition Date and (iv) the expiration of our natural gas hedges in the 2015 period.
Other, net
Other, net includes interest income and miscellaneous items of income and expense that are not directly associated with our current operations including recoveries and write-offs attributable to prior years and properties that have been divested.
The following table sets forth the other income (expense), net recognized for the periods presented:
Successor | Predecessor | |||||||||||||||
Year Ended | September 13 Through | January 1 Through | Year Ended | |||||||||||||
December 31, | December 31, | September 12, | December 31, | |||||||||||||
2017 | 2016 | 2016 | 2015 | |||||||||||||
Other, net | $ | 119 | $ | 814 | $ | (3,184 | ) | $ | (3,587 | ) | ||||||
2017. In 2017, we recorded interest income attributable to the Escrow Account and we recovered certain costs attributable to assets that were sold in prior years.
2016. In the Successor period of 2016, we reversed $0.9 million representing a portion of a reserve recognized in the Predecessor period of 2016 attributable to a prior-year acquisition-related receivable. This item was partially offset by the write-off of certain acquisition-related joint interest billing receivables and a decline in the market value of certain supplemental retirement plan assets prior to their reversion to us in connection with our emergence from bankruptcy. In the Predecessor period of 2016, we initially reserved the aforementioned acquisition-related receivable for $2.9 million and wrote-off unrecoverable amounts from prior years, including severance tax receivables, certain joint interest billing receivables, GPT and other revenue deductions due from other parties of $0.6 million, all of which were attributable primarily to properties that were sold in prior years. These items were partially offset by a vendor settlement of $0.3 million also attributable to prior periods.
2015. In 2015, we wrote-off a combined $1.6 million of receivables from various joint interest partners and other parties that we determined were not collectible as well as approximately $2.0 million of unrecoverable amounts from prior years, including GPT and other revenue deductions, attributable primarily to properties that have been sold.
51
Reorganization Items, net
The following table summarizes the components included in “Reorganization items, net” for the periods presented:
Successor | Predecessor | |||||||||||||||
Year Ended | September 13 Through | January 1 Through | Year Ended | |||||||||||||
December 31, | December 31, | September 12, | December 31, | |||||||||||||
2017 | 2016 | 2016 | 2015 | |||||||||||||
Gains on the settlement of liabilities subject to compromise | $ | — | $ | — | $ | 1,150,248 | $ | — | ||||||||
Fresh Start Accounting adjustments | — | — | 28,319 | — | ||||||||||||
Legal and professional fees and expenses | — | — | (29,976 | ) | — | |||||||||||
Settlements attributable to contract amendments | — | — | (2,550 | ) | — | |||||||||||
Debtor-in-Possession Facility costs and commitment fees | — | — | (170 | ) | — | |||||||||||
Write-off of prepaid directors and officers insurance | — | — | (832 | ) | — | |||||||||||
Other reorganization items | — | — | (46 | ) | — | |||||||||||
$ | — | $ | — | $ | 1,144,993 | $ | — | |||||||||
The gains on the settlement of liabilities subject to compromise are primarily attributable to the Senior Notes and interest thereon. The Fresh Start Accounting adjustments include those fair value adjustments attributable to our property and equipment, asset retirement obligations, or AROs, retiree benefit obligations and the accelerated recognition of previously deferred gains of the Predecessor. The legal and professional fees that we incurred were attributable to our advisers as well as those of the various creditor committees, the RBL lenders and the indenture trustee under the Senior Notes. We paid settlements in cash with respect to certain critical contract amendments. While we did not borrow any amounts under the Debtor-in-Possession, or DIP, credit facility from the Petition Date through the Emergence Date, we paid certain costs and fees to arrange and maintain the DIP credit facility during this term. Upon emergence from bankruptcy, we wrote off certain prepaid directors and officers insurance attributable to the Predecessor. The items described herein are also described in further detail in Note 4 to the Consolidated Financial Statements included in Part II, Item 8, “Financial Statements and Supplementary Data.”
Income Taxes
The following table summarizes our income tax benefits for the periods presented:
Successor | Predecessor | |||||||||||||||
Year Ended | September 13 Through | January 1 Through | Year Ended | |||||||||||||
December 31, | December 31, | September 12, | December 31, | |||||||||||||
2017 | 2016 | 2016 | 2015 | |||||||||||||
Income tax benefit | $ | 4,943 | $ | — | $ | — | $ | 5,371 | ||||||||
Effective tax benefit rate | 17.8 | % | — | % | — | % | 0.3 | % | ||||||||
2017. In connection with our initial analysis of the impact of the TCJA, we recorded income tax charge of $86.6 million for the year ended December 31, 2017, which consists of a reduction of deferred tax assets previously valued at 35%. We recorded a corresponding decrease in our deferred tax asset valuation allowance representing an income tax benefit for the same amount. The reduction in the statutory U.S. federal rate is expected to positively impact the Company’s future US after tax earnings. As a result of the repeal of the corporate alternative minimum tax, or AMT, we anticipate that our existing AMT credit carryovers will become refundable beginning with the 2018 tax year. The AMT credit carryforwards will be used to offset current year regular tax liabilities with 50 percent of any excess remaining credit per year being refundable as part of the annual income tax filing. We anticipate full utilization of the AMT credit carryforwards by 2021.
In addition to the aforementioned offsetting items with respect to the reduction in income tax rates, our income tax provision includes federal income taxes of $9.7 million applied at the statutory rate of 35% for 2017 and an adjustment of $10.8 million attributable to reductions in certain tax attributes of property and other adjustments of $0.3 million applied in connection with the filing of our 2016 income tax returns. These expenses were effectively offset by benefits attributable to the reduction in our deferred tax asset valuation allowance of $24.3 million and state income tax benefits of $1.4 million resulting in a net tax deferred benefit of $4.9 million, all of which is attributable to the AMT matter.
2016. We recognized a federal income tax benefit for each of the Successor and Predecessor periods in 2016 at the statutory rate of 35%; however, the federal tax benefit was fully offset by a valuation allowance against our net deferred tax assets. We considered both the positive and negative evidence in determining that it was more likely than not that some portion or all of our deferred tax assets will not be realized, primarily as a result of our cumulative losses.
52
We evaluated the impact of our reorganization, including the change in control, resulting from our emergence from bankruptcy. From an income tax perspective, the most significant impact is attributable to our carryover tax attributes associated with our NOLs. We believe that the Successor will be able to fully absorb the cancellation of debt income realized by the Predecessor in connection with the reorganization with its adjusted NOL carryovers. The amount of the remaining NOL carryovers and the tax basis of our properties will be limited under Section 382 of the Internal Revenue Code due to the change in control as described in Note 4 to the Consolidated Financial Statements included in Part II, Item 8, “Financial Statements and Supplementary Data.” As the tax basis of our assets, primarily our oil and gas properties, is in excess of the carrying value, as adjusted in the Fresh Start Accounting process, the Successor is in a net deferred tax asset position.
2015. We recognized a federal income tax benefit for 2015 at the statutory rate of 35%; however, the federal tax benefit was substantially offset by a valuation allowance against our net deferred tax assets. We recognized state deferred tax benefits of $4.4 million as well as certain federal deferred tax benefits of $1.0 million resulting in a combined effective tax rate of 0.3% for 2015. The significant difference between our combined federal and state statutory rate of 35.7% and our effective tax of 0.3% is due almost entirely to the incremental valuation allowance placed against our deferred tax assets.
Off-Balance Sheet Arrangements
We may enter into off-balance sheet arrangements and transactions that can give rise to material off-balance sheet obligations. As of December 31, 2017, the material off-balance sheet arrangements and transactions that we have entered into included operating lease arrangements, information technology licensing, service agreements, employment agreements and letters of credit, all of which are customary in our business. See “Contractual Obligations” summarized below and Note 15 to the Consolidated Financial Statements included in Part II, Item 8, “Financial Statements and Supplementary Data” for more details related to the value of our off-balance sheet arrangements. We did not have any relationships with unconsolidated entities or financial partnerships, such as structured finance or special purpose entities, which would have been established for the purpose of facilitating off-balance sheet arrangements or other contractually narrow or limited purposes. We are, therefore, not materially exposed to any financing, liquidity, market or credit risk that could arise had we engaged in such relationships.
Contractual Obligations
The following table summarizes our contractual obligations as of December 31, 2017:
Payments Due by Period | |||||||||||||||||||
Total | Less than 1 Year | 1-3 Years | 3-5 Years | More Than 5 Years | |||||||||||||||
Credit Facility 1 | $ | 77,000 | $ | — | $ | 77,000 | $ | — | $ | — | |||||||||
Second Lien Facility 2 | 200,000 | — | — | 200,000 | — | ||||||||||||||
Interest payments on long-term debt 3 | 91,228 | 20,824 | 40,538 | 29,866 | — | ||||||||||||||
Operating leases 4 | 366 | 241 | 125 | — | — | ||||||||||||||
Crude oil gathering and transportation commitments 5 | 124,676 | 10,376 | 24,664 | 25,924 | 63,712 | ||||||||||||||
Drilling and completion commitments 6 | 37,907 | 37,907 | — | — | — | ||||||||||||||
Asset retirement obligations 7 | 89,575 | — | — | — | 89,575 | ||||||||||||||
Derivatives | 41,677 | 27,777 | 13,900 | — | — | ||||||||||||||
Other commitments 8 | 262 | 157 | 100 | 5 | — | ||||||||||||||
Total contractual obligations | $ | 662,691 | $ | 97,282 | $ | 156,327 | $ | 255,795 | $ | 153,287 | |||||||||
_____________________________________________
1 Assumes that the amount outstanding of $77 million as of December 31, 2017 will remain outstanding until its maturity in 2020. The Credit Facility has been classified as a long term liability on our Consolidated Balance Sheet as described in “Financial Condition – Liquidity” and in Note 10 to the Consolidated Financial Statements included in Part II, Item 8, “Financial Statements and Supplementary Data.”
2 | Assumes that the amount outstanding of $200 million as of December 31, 2017 will remain outstanding until its maturity in 2022. The Second Lien has been classified as a long term liability on our Consolidated Balance Sheet as described in “Financial Condition – Liquidity” and in Note 10 to the Consolidated Financial Statements included in Part II, Item 8, “Financial Statements and Supplementary Data.” |
3 Represents estimated interest payments that will be due under the Credit Facility and Second Lien Facility, assuming the amounts outstanding of $77 million and $200 million as of December 31, 2017, respectively, will remain outstanding until their maturities in 2020 and 2022, respectively.
4 | Relates primarily to office and equipment leases. |
5 | Represents minimum payments for gathering and intermediate pipeline transportation services for our crude oil and condensate production in South Texas. The gathering portion of these commitments is recognized as GPT while the intermediate transportation and pipeline support components are recognized as a reduction to the index-based price that we receive from crude oil sold to Republic Midstream. |
6 | Includes commitments for two drilling rigs, one frac service crew and certain proppant materials. |
7 | Represents the undiscounted balance payable, primarily for the plugging of inactive wells, in periods more than five years in the future for which $3.3 million, on a discounted basis, has been recognized on our Consolidated Balance Sheet as of December 31, 2017. While we may make payments to settle certain AROs, including those subject to regulatory requirements during each of the next five years, no material amounts are currently required by contract or regulatory authority to be made during this time frame. |
8 | Represents all other significant obligations including information technology licensing and service agreements, among others. |
53
Critical Accounting Estimates
The process of preparing financial statements in accordance with GAAP requires our management to make estimates and judgments regarding certain items and transactions. It is possible that materially different amounts could be recorded if these estimates and judgments change or if the actual results differ from these estimates and judgments. We consider the following to be the most critical accounting estimates requiring judgment of our management.
Fresh Start Accounting
On the Emergence Date, we adopted Fresh Start Accounting. Fresh Start Accounting involved a comprehensive valuation process in which we determined the fair value of all of our assets and liabilities on the Emergence Date. This process, which is more fully described in Note 4 to our Consolidated Financial Statements included in Item II, Part 8, “Financial Statements and Supplementary Data,” utilized several critical estimates associated with, among other items, our development plans, financial projections, regional and broader market conditions as well as an estimated discount rate.
Oil and Gas Reserves
Estimates of our oil and gas reserves are the most critical estimate included in our Consolidated Financial Statements. Reserve estimates become the basis for determining depletive write-off rates and the recoverability of historical cost investments. There are many uncertainties inherent in estimating crude oil, NGL and natural gas reserve quantities, including projecting the total quantities in place, future production rates and the amount and timing of future development expenditures. In addition, reserve estimates of new discoveries are less precise than those of producing properties due to the lack of a production history. Accordingly, these estimates are subject to change as additional information becomes available.
There are several factors which could change the estimates of our oil and gas reserves. Significant rises or declines in commodity product prices as well as changes in our drilling plans could lead to changes in the amount of reserves as production activities become more or less economical. An additional factor that could result in a change of recorded reserves is the reservoir decline rates differing from those assumed when the reserves were initially recorded. Estimation of future production and development costs is also subject to change partially due to factors beyond our control, such as energy costs and inflation or deflation of oil field service costs.
Oil and Gas Properties
Beginning on the Emergence Date, we have applied the full cost method to account for our oil and gas properties. Under this method, all productive and nonproductive costs incurred in the exploration, development and acquisition of oil and gas reserves are capitalized. Such costs may be incurred both prior to and after the acquisition of a property and include lease acquisitions, geological and geophysical, or seismic, drilling, completion and equipment costs. Internal costs incurred that are directly attributable to exploration, development and acquisition activities undertaken by us for our own account, and which are not attributable to production, general corporate overhead or similar activities are also capitalized. Future development costs are estimated on a property-by-property basis based on current economic conditions and are amortized as a component of DD&A.
Unproved properties not being amortized include unevaluated leasehold costs and associated capitalized interest. These costs are reviewed quarterly to determine whether or not and to what extent proved reserves have been assigned to a property or if an impairment has occurred due to lease expirations, general economic conditions and other factors, in which case, the related costs along with associated capitalized interest are reclassified to the proved oil and gas properties subject to DD&A. Factors we consider in our assessment include drilling results, the terms of oil and gas leases not held by production and drilling and completion capital expenditures consistent with our plans.
At the end of each quarterly reporting period, the unamortized cost of our oil and gas properties, net of deferred income taxes, is limited to the sum of the estimated discounted future net revenues from proved properties adjusted for costs excluded from amortization and related income taxes, or a Ceiling Test. The estimated discounted future net revenues are determined using the prior 12-month’s average price based on closing prices on the first day of each month, adjusted for differentials, discounted at 10%. The calculation of the Ceiling Test and provision for DD&A are based on estimates of proved reserves. There are significant uncertainties inherent in estimating quantities of proved reserves and projecting future rates of production, timing and plan of development. As of December 31, 2017, the carrying value of our proved oil and gas properties was below the limit determined by the Ceiling Test by approximately $213 million.
Depreciation, Depletion and Amortization
DD&A of our oil and gas properties is computed using the units-of-production method. We apply this method by multiplying the unamortized cost of our proved oil and gas properties, net of estimated salvage plus future development costs, by a rate determined by dividing the physical units of oil and gas produced during the period by the total estimated units of proved oil and gas reserves at the beginning of the period.
54
Derivative Activities
From time to time, we enter into derivative instruments to mitigate our exposure to commodity price volatility and interest rate fluctuations. The derivative financial instruments, which are placed with financial institutions that we believe are of acceptable credit risk, take the form of collars, swaps and swaptions, among others. All derivative instruments are recognized in our Consolidated Financial Statements at fair value with the changes recorded currently in earnings. The fair values of our derivative instruments are determined based on discounted cash flows derived from quoted forward prices and rates. All derivative transactions are subject to our risk management policy, which has been reviewed and approved by our board of directors.
Deferred Tax Asset Valuation Allowance
We record a valuation allowance to reduce our deferred tax assets to an amount that is more likely than not to be realized after consideration of future taxable income and reasonable tax planning strategies. In the event that we were to determine that we would not be able to realize all or a part of our deferred tax assets for which a valuation allowance had not been established, an adjustment to the deferred tax asset will be reflected in income in the period such determination is made. The most significant matter applicable to the realization of our deferred tax assets is attributable to net operating losses at the federal level as well as certain states in which we operate. Estimates of future taxable income inherently reflect a significant degree of uncertainty. As of December 31, 2017, we had a full valuation allowance for all of our net deferred tax assets, with the exception of our refundable AMT credit carryforwards, due primarily to our inability to project sufficient future taxable income in both the federal and various state jurisdictions.
Disclosure of the Impact of Recently Issued Accounting Standards to be Adopted in the Future
In March 2017, the Financial Accounting Standards Board, or the FASB, issued Accounting Standards Update, or ASU, 2017–07, Improving the Presentation of Net Periodic Pension Cost and Net Periodic Postretirement Benefit Cost, or ASU 2017–07, which provides guidance to improve the reporting of net benefit cost in financial statements. The guidance requires employers to disaggregate the service cost component from the other components of net benefit cost. The service cost component of net periodic benefit cost shall be reported in the same line item as other compensation costs arising from services rendered by the pertinent employees during the period, except for amounts capitalized. All other components of net benefit cost shall be presented outside of a subtotal for income from operations. The line item used to present the components other than the service cost shall be disclosed if the other components are not presented in a separate line item or items. ASU 2017–07 is effective January 1, 2018 and is required to be applied retrospectively. ASU 2017–07 will be applicable to our legacy retiree benefit plans which cover a limited population of former employees. There is no service cost associated with these plans as they are not applicable to current employees, but rather interest and other costs associated with the legacy obligations. Upon the adoption of ASU 2017–07, the entirety of the expense associated with these plans will be presented as a component of the “Other income (expense)” caption in our Consolidated Statement of Operations. These costs are currently recognized as a component of “General and administrative” expenses. The total cost associated with these plans is generally less than $0.1 million on an annual basis and is therefore not material. We have adopted ASU 2017–07 effective as of January 2018.
In June 2016, the FASB issued ASU 2016–13, Measurement of Credit Losses on Financial Instruments, or ASU 2016–13, which changes the recognition model for the impairment of financial instruments, including accounts receivable, loans and held-to-maturity debt securities, among others. ASU 2016–13 is required to be adopted using the modified retrospective method by January 1, 2020, with early adoption permitted for fiscal periods beginning after December 15, 2018. In contrast to current guidance, which considers current information and events and utilizes a probable threshold, (an “incurred loss” model), ASU 2016–13 mandates an “expected loss” model. The expected loss model: (i) estimates the risk of loss even when risk is remote, (ii) estimates losses over the contractual life, (iii) considers past events, current conditions and reasonably supported forecasts and (iv) has no recognition threshold. ASU 2016–13 will have applicability to our accounts receivable portfolio, particularly those receivables attributable to our joint interest partners which have a higher credit risk than those associated with our traditional customer receivables. At this time, we do not anticipate that the adoption of ASU 2016–13 will have a significant impact on our Consolidated Financial Statements and related disclosures; however, we are continuing to evaluate the requirements and the period for which we will adopt the standard as well as monitoring developments regarding ASU 2016–13 that are unique to our industry.
In February 2016, the FASB issued ASU 2016–02, Leases, or ASU 2016–02, which will require organizations that lease assets to recognize on the balance sheet the assets and liabilities for the rights and obligations created by those leases with terms of more than twelve months. Consistent with current GAAP, the recognition, measurement, and presentation of expenses and cash flows arising from a lease by a lessee primarily will depend on its classification as a finance or operating lease. ASU 2016–02 also will require disclosures regarding the amount, timing, and uncertainty of cash flows arising from leases. The effective date of ASU 2016–02 is January 1, 2019, with early adoption permitted. We believe that ASU 2016–02 will likely be applicable to our oil and natural gas gathering commitment arrangements as described in Note 15 to our Consolidated Financial Statements included in Part II, Item 8, included in Part II, Item 8, “Financial Statements and Supplementary Data,” our existing leases for office facilities and certain office equipment, land easements and similar arrangements for rights-of-way and
55
potentially to certain drilling rig and completion contracts with terms in excess of twelve months to the extent we may have such contracts in the future. Our oil and natural gas gathering arrangements are fairly complex and involve multiple elements that could be construed as leases. Accordingly, we are continuing to evaluate the effect that ASU 2016–02 will have on our Consolidated Financial Statements and related disclosures as well as the period for which we will adopt the standard; however, at this time, we believe that we will likely adopt ASU 2016–02 in 2019. We are also continuing to monitor developments regarding ASU 2016–02 that are unique to our industry.
In May 2014, the FASB issued ASU 2014–09, Revenues from Contracts with Customers, or ASU 2014–09, which requires an entity to recognize the amount of revenue to which it expects to be entitled for the transfer of promised goods or services to customers. ASU 2014–09 will replace most existing revenue recognition guidance in GAAP when it becomes effective on January 1, 2018. The standard permits the use of either the retrospective or cumulative effect transition method upon adoption. While traditional commodity sales transactions, property conveyances and joint interest arrangements in the oil and gas industry are not expected to be significantly impacted by ASU 2014–09, the terms of the individual commodity purchase, joint operating agreements and other contracts underlying these types of transactions will determine the appropriate recognition, measurement and disclosure once ASU 2014–09 has been adopted. Also, to the extent applicable, participation in certain of these transactions as either a principal or agent can impact the ultimate accounting and presentation.
We have adopted ASU 2014–09 using the cumulative effect transition method, effective as of January 2018. We will record a cumulative-effect charge to our beginning balance of retained earnings for $2.6 million representing the net receivables for producer imbalances as December 31, 2017, the accounting for which has been modified under ASU 2014–09. Effective January 2018, we will discontinue utilization of the “entitlements” method for producer imbalances and will begin accounting for such transactions utilizing the “sales” method. We do not anticipate this change to have a material impact going forward. In addition, we will change the presentation of our NGL product revenues from a “gross” to a “net” basis, that is revenues, net of processing costs, as we have determined that we are the agent with respect to the sale of these products to the ultimate customers. Accordingly, the applicable processing costs associated with these revenues will no longer be presented as a component of “Gathering, processing and transportation” expense on our Consolidated Statement of Operations. In summary, with the exception of the presentation of NGL revenues and more expansive disclosures, we do not anticipate a material impact attributable to the adoption of ASU 2014–09.
Item 7A | Quantitative and Qualitative Disclosures About Market Risk |
Market risk is the risk of loss arising from adverse changes in market rates and prices. The principal market risks to which we are exposed are interest rate risk and commodity price risk.
Interest Rate Risk
Our interest rate risk is attributable to our borrowings under the Credit Facility and the Second Lien Facility, which are subject to variable interest rates. As of December 31, 2017, we had borrowings of $77 million under the Credit Facility at an interest rate of 4.78%. As of December 31, 2017, we had borrowings of $188.3 million under the Second Lien Facility , net of OID and issuance costs, at an interest rate of 8.57%. Assuming a constant borrowing level under the Credit and Second Lien Facilities, an increase (decrease) in the interest rate of one percent would result in an increase (decrease) in interest expense of approximately $2.8 million on an annual basis.
Commodity Price Risk
We produce and sell crude oil, NGLs and natural gas. As a result, our financial results are affected when prices for these commodities fluctuate. Our price risk management programs permit the utilization of derivative financial instruments (such as collars, swaps and swaptions) to seek to mitigate the price risks associated with fluctuations in commodity prices as they relate to a portion of our anticipated production. The derivative instruments are placed with major financial institutions that we believe are of acceptable credit risk. The fair values of our derivative instruments are significantly affected by fluctuations in the prices of oil and natural gas. We have not typically entered into derivative instruments with respect to NGLs, although we may do so in the future.
As of December 31, 2017, we reported a commodity derivative liability of $41.7 million. The net and gross amounts for our derivative assets and liabilities are the same for both periods presented above. The contracts associated with this position are with five counterparties, all of which are investment grade financial institutions. This concentration may impact our overall credit risk, either positively or negatively, in that these counterparties may be similarly affected by changes in economic or other conditions. We have neither paid to, nor received from, our counterparties any cash collateral in connection with our derivative positions. Furthermore, our derivative contracts are not subject to margin calls or similar accelerations. No significant uncertainties exist related to the collectability of amounts that may be owed to us by these counterparties.
56
During the year ended December 31, 2017, we reported net commodity derivative losses of $17.8 million. We have experienced and could continue to experience significant changes in the estimate of derivative gains or losses recognized due to fluctuations in the value of our derivative instruments. Our results of operations are affected by the volatility of unrealized gains and losses and changes in fair value, which fluctuate with changes in crude oil, NGL and natural gas prices. These fluctuations could be significant in a volatile pricing environment. See Note 7 to our Consolidated Financial Statements included in Part II, Item 8, included in Part II, Item 8, “Financial Statements and Supplementary Data” for a further description of our price risk management activities.
The following table sets forth our commodity derivative positions as of December 31, 2017:
Average | Weighted | |||||||||||||||
Volume Per | Average | Fair Value | ||||||||||||||
Instrument 1 | Day | Price | Asset | Liability | ||||||||||||
Crude Oil: | (barrels) | ($/barrel) | ||||||||||||||
First quarter 2018 | Swaps | 8,013 | $ | 51.14 | $ | — | $ | 7,622 | ||||||||
Second quarter 2018 | Swaps | 7,984 | $ | 51.15 | — | 7,075 | ||||||||||
Third quarter 2018 | Swaps | 7,955 | $ | 51.15 | — | 6,241 | ||||||||||
Fourth quarter 2018 | Swaps | 7,955 | $ | 51.15 | — | 5,357 | ||||||||||
First quarter 2019 | Swaps | 6,446 | $ | 50.97 | — | 3,845 | ||||||||||
Second quarter 2019 | Swaps | 6,421 | $ | 50.97 | — | 3,336 | ||||||||||
Third quarter 2019 | Swaps | 6,397 | $ | 50.97 | — | 2,886 | ||||||||||
Fourth quarter 2019 | Swaps | 6,398 | $ | 50.97 | — | 2,528 | ||||||||||
First quarter 2020 | Swaps | 2,000 | $ | 51.29 | — | 441 | ||||||||||
Second quarter 2020 | Swaps | 2,000 | $ | 51.29 | — | 353 | ||||||||||
Third quarter 2020 | Swaps | 2,000 | $ | 51.29 | — | 283 | ||||||||||
Fourth quarter 2020 | Swaps | 2,000 | $ | 51.29 | — | 228 | ||||||||||
_______________________
1 | Including the effect of additional hedge contracts entered into in January 2018, we have hedged our crude oil production as follows: 2018 - 6,227 BOPD at a weighted-average WTI-based price of $50.70 per barrel and 2,500 BOPD at a weighted-average LLS-based price of $55.18 per barrel, 2019 - 4,915 BOPD at a weighted-average WTI-based price of $52.12 per barrel and 2,500 BOPD at a weighted-average LLS-based price of $51.30 per barrel and 2020 - 4,000 BOPD at a weighted-average WTI-based price of $52.67 per barrel. |
The following table illustrates the estimated impact on the fair values of our derivative financial instruments and operating income attributable to hypothetical changes in the underlying commodity prices. This illustration assumes that crude oil prices, natural gas prices and production volumes remain constant at anticipated levels. The estimated changes in operating income exclude potential cash receipts or payments in settling these derivative positions.
Change of $10.00 per Barrel of Crude Oil or $1.00 per MMBtu of Natural Gas ($ in millions) | |||||||
Increase | Decrease | ||||||
Effect on the fair value of crude oil derivatives | $ | (61.3 | ) | $ | 55.7 | ||
Effect on 2018 operating income, excluding crude oil derivatives 1 | $ | 65.8 | $ | (65.8 | ) | ||
Effect on 2018 operating income, excluding natural gas derivatives 1 | $ | 4.8 | $ | (4.8 | ) | ||
_____________________________________________
1 Based on our 2018 Business Plan consistent with the assumptions used to determine our proved reserves as disclosed in Item 2, “Properties – Summary of Oil and Gas Reserves.”
57
Item 8 | Financial Statements and Supplementary Data |
PENN VIRGINIA CORPORATION
INDEX TO CONSOLIDATED FINANCIAL STATEMENTS
Page | |
Reports of Independent Registered Public Accounting Firms | |
Consolidated Statements of Operations | |
Consolidated Statements of Comprehensive Income (Loss) | |
Consolidated Balance Sheets | |
Consolidated Statements of Cash Flows | |
Consolidated Statements of Shareholders’ Equity | |
Notes to Consolidated Financial Statements: | |
1. Nature of Operations | |
2. Basis of Presentation | |
3. Summary of Significant Accounting Policies | |
4. Bankruptcy Proceedings, Emergence and Fresh Start Accounting | |
5. Acquisitions and Divestitures | |
6. Accounts Receivable and Major Customers | |
7. Derivative Instruments | |
8. Property and Equipment | |
9. Asset Retirement Obligations | |
10. Long-Term Debt | |
11. Income Taxes | |
12. Exit Activities | |
13. Additional Balance Sheet Detail | |
14. Fair Value Measurements | |
15. Commitments and Contingencies | |
16. Shareholders’ Equity | |
17. Share-Based Compensation and Other Benefit Plans | |
18. Impairments | |
19. Interest Expense | |
20. Earnings per Share | |
Supplemental Quarterly Financial Information (unaudited) | |
Supplemental Information on Oil and Gas Producing Activities (unaudited) | |
58
Report of Independent Registered Public Accounting Firm
Board of Directors and Shareholders
Penn Virginia Corporation
Opinion on the financial statements
We have audited the accompanying consolidated balance sheets of Penn Virginia Corporation (a Virginia corporation) and subsidiaries (the “Company”) as of December 31, 2017 and 2016, the related consolidated statements of operations, comprehensive income (loss), shareholders’ equity, and cash flows for the year ended December 31, 2017 (Successor) and for the period from September 13, 2016 through December 31, 2016 (Successor) and the period from January 1, 2016 through September 12, 2016 (Predecessor), and the related notes (collectively referred to as the “financial statements”). In our opinion, the financial statements present fairly, in all material respects, the financial position of the Company as of December 31, 2017 and 2016, and the results of their operations and their cash flows for the year ended December 31, 2017 (Successor) and the period from September 13, 2016 through December 31, 2016 (Successor) and the period from January 1, 2016 through September 12, 2016 (Predecessor), in conformity with accounting principles generally accepted in the United States of America.
We also have audited, in accordance with the standards of the Public Company Accounting Oversight Board (United States) (“PCAOB”), the Company’s internal control over financial reporting as of December 31, 2017, based on criteria established in the 2013 Internal Control-Integrated Framework issued by the Committee of Sponsoring Organizations of the Treadway Commission (“COSO”), and our report dated March 2, 2018 expressed an unqualified opinion.
Basis for opinion
These financial statements are the responsibility of the Company’s management. Our responsibility is to express an opinion on the Company’s financial statements based on our audits. We are a public accounting firm registered with the PCAOB and are required to be independent with respect to the Company in accordance with the U.S. federal securities laws and the applicable rules and regulations of the Securities and Exchange Commission and the PCAOB.
We conducted our audits in accordance with the standards of the PCAOB. Those standards require that we plan and perform the audit to obtain reasonable assurance about whether the financial statements are free of material misstatement, whether due to error or fraud. Our audits included performing procedures to assess the risks of material misstatement of the financial statements, whether due to error or fraud, and performing procedures that respond to those risks. Such procedures included examining, on a test basis, evidence supporting the amounts and disclosures in the financial statements. Our audits also included evaluating the accounting principles used and significant estimates made by management, as well as evaluating the overall presentation of the financial statements. We believe that our audits provide a reasonable basis for our opinion.
/s/ GRANT THORNTON LLP
We have served as the Company’s auditor since 2016.
Houston, Texas
March 2, 2018
59
Report of Independent Registered Public Accounting Firm
Board of Directors and Shareholders
Penn Virginia Corporation
Opinion on internal control over financial reporting
We have audited the internal control over financial reporting of Penn Virginia Corporation (a Virginia corporation) and subsidiaries (the “Company”) as of December 31, 2017, based on criteria established in the 2013 Internal Control-Integrated Framework issued by the Committee of Sponsoring Organizations of the Treadway Commission (“COSO”). In our opinion, the Company maintained, in all material respects, effective internal control over financial reporting as of December 31, 2017, based on criteria established in the 2013 Internal Control-Integrated Framework issued by COSO.
We also have audited, in accordance with the standards of the Public Company Accounting Oversight Board (United States) (“PCAOB”), the consolidated financial statements of the Company as of and for the year ended December 31, 2017, and our report dated March 2, 2018 expressed an unqualified opinion on those financial statements.
Basis for opinion
The Company’s management is responsible for maintaining effective internal control over financial reporting and for its assessment of the effectiveness of internal control over financial reporting, included in the accompanying Management’s Annual Report on Internal Control Over Financial Reporting. Our responsibility is to express an opinion on the Company’s internal control over financial reporting based on our audit. We are a public accounting firm registered with the PCAOB and are required to be independent with respect to the Company in accordance with the U.S. federal securities laws and the applicable rules and regulations of the Securities and Exchange Commission and the PCAOB.
We conducted our audit in accordance with the standards of the PCAOB. Those standards require that we plan and perform the audit to obtain reasonable assurance about whether effective internal control over financial reporting was maintained in all material respects. Our audit included obtaining an understanding of internal control over financial reporting, assessing the risk that a material weakness exists, testing and evaluating the design and operating effectiveness of internal control based on the assessed risk, and performing such other procedures as we considered necessary in the circumstances. We believe that our audit provides a reasonable basis for our opinion.
Definition and limitations of internal control over financial reporting
A company’s internal control over financial reporting is a process designed to provide reasonable assurance regarding the reliability of financial reporting and the preparation of financial statements for external purposes in accordance with generally accepted accounting principles. A company’s internal control over financial reporting includes those policies and procedures that (1) pertain to the maintenance of records that, in reasonable detail, accurately and fairly reflect the transactions and dispositions of the assets of the company; (2) provide reasonable assurance that transactions are recorded as necessary to permit preparation of financial statements in accordance with generally accepted accounting principles, and that receipts and expenditures of the company are being made only in accordance with authorizations of management and directors of the company; and (3) provide reasonable assurance regarding prevention or timely detection of unauthorized acquisition, use, or disposition of the company’s assets that could have a material effect on the financial statements.
Because of its inherent limitations, internal control over financial reporting may not prevent or detect misstatements. Also, projections of any evaluation of effectiveness to future periods are subject to the risk that controls may become inadequate because of changes in conditions, or that the degree of compliance with the policies or procedures may deteriorate.
/s/ GRANT THORNTON LLP
Houston, Texas
March 2, 2018
60
Report of Independent Registered Public Accounting Firm
The Board of Directors and Shareholders
Penn Virginia Corporation:
We have audited the accompanying consolidated statements of operations, comprehensive income (loss), stockholders’ equity, and cash flows of Penn Virginia and subsidiaries for the year ended December 31, 2015. These consolidated financial statements are the responsibility of the Company’s management. Our responsibility is to express an opinion on these consolidated financial statements based on our audit.
We conducted our audit in accordance with the standards of the Public Company Accounting Oversight Board (United States). Those standards require that we plan and perform the audit to obtain reasonable assurance about whether the financial statements are free of material misstatement. An audit includes examining, on a test basis, evidence supporting the amounts and disclosures in the financial statements. An audit also includes assessing the accounting principles used and significant estimates made by management, as well as evaluating the overall financial statement presentation. We believe that our audit provides a reasonable basis for our opinion.
In our opinion, the consolidated financial statements referred to above present fairly, in all material respects, the results of operations and the cash flows of Penn Virginia Corporation and subsidiaries for the year ended December 31, 2015, in conformity with U.S. generally accepted accounting principles.
The accompanying consolidated financial statements have been prepared assuming that the Company will continue as a going concern. As discussed in note 2 to the consolidated financial statements in the 2015 Form 10-K, the Company has suffered recurring losses from operations and is dependent on obtaining additional financing to continue its planned principal business operations. These factors raise substantial doubt about its ability to continue as a going concern. Management’s plans in regard to these matters are also described in note 2 to the consolidated financial statements in the 2015 Form 10-K. The consolidated financial statements do not include any adjustments that might result from the outcome of this uncertainty.
/s/ KPMG LLP
Houston, Texas
March 15, 2016
61
PENN VIRGINIA CORPORATION
CONSOLIDATED STATEMENTS OF OPERATIONS
(in thousands, except per share data)
Successor | Predecessor | |||||||||||||||
Year Ended | September 13, Through | January 1, Through | Year Ended | |||||||||||||
December 31, | December 31, | September 12, | December 31, | |||||||||||||
2017 | 2016 | 2016 | 2015 | |||||||||||||
Revenues | ||||||||||||||||
Crude oil | $ | 140,886 | $ | 33,157 | $ | 81,377 | $ | 220,596 | ||||||||
Natural gas liquids | 10,066 | 2,707 | 6,064 | 16,905 | ||||||||||||
Natural gas | 8,517 | 2,790 | 6,208 | 25,479 | ||||||||||||
Gain (loss) on sales of assets, net | (36 | ) | (49 | ) | 1,261 | 41,335 | ||||||||||
Other, net | 621 | 398 | (600 | ) | 983 | |||||||||||
Total revenues | 160,054 | 39,003 | 94,310 | 305,298 | ||||||||||||
Operating expenses | ||||||||||||||||
Lease operating | 21,784 | 5,331 | 15,626 | 42,428 | ||||||||||||
Gathering, processing and transportation | 10,734 | 3,043 | 13,235 | 23,815 | ||||||||||||
Production and ad valorem taxes | 8,814 | 2,498 | 3,490 | 16,282 | ||||||||||||
General and administrative | 18,262 | 5,088 | 38,945 | 43,328 | ||||||||||||
Exploration | — | — | 10,288 | 12,583 | ||||||||||||
Depreciation, depletion and amortization | 48,649 | 11,652 | 33,582 | 334,479 | ||||||||||||
Impairments | — | — | — | 1,397,424 | ||||||||||||
Total operating expenses | 108,243 | 27,612 | 115,166 | 1,870,339 | ||||||||||||
Operating income (loss) | 51,811 | 11,391 | (20,856 | ) | (1,565,041 | ) | ||||||||||
Other income (expense) | ||||||||||||||||
Interest expense, net of amounts capitalized | (6,392 | ) | (879 | ) | (58,018 | ) | (90,951 | ) | ||||||||
Derivatives | (17,819 | ) | (16,622 | ) | (8,333 | ) | 71,247 | |||||||||
Other, net | 119 | 814 | (3,184 | ) | (3,587 | ) | ||||||||||
Reorganization items, net | — | — | 1,144,993 | — | ||||||||||||
Income (loss) before income taxes | 27,719 | (5,296 | ) | 1,054,602 | (1,588,332 | ) | ||||||||||
Income tax benefit | 4,943 | — | — | 5,371 | ||||||||||||
Net income (loss) | 32,662 | (5,296 | ) | 1,054,602 | (1,582,961 | ) | ||||||||||
Preferred stock dividends | — | — | (5,972 | ) | (22,789 | ) | ||||||||||
Net income (loss) attributable to common shareholders | $ | 32,662 | $ | (5,296 | ) | $ | 1,048,630 | $ | (1,605,750 | ) | ||||||
Net income (loss) per share: | ||||||||||||||||
Basic | $ | 2.18 | $ | (0.35 | ) | $ | 11.91 | $ | (21.81 | ) | ||||||
Diluted | $ | 2.17 | $ | (0.35 | ) | $ | 8.50 | $ | (21.81 | ) | ||||||
Weighted average shares outstanding – basic | 14,996 | 14,992 | 88,013 | 73,639 | ||||||||||||
Weighted average shares outstanding – diluted | 15,063 | 14,992 | 124,087 | 73,639 | ||||||||||||
See accompanying notes to consolidated financial statements.
62
PENN VIRGINIA CORPORATION
CONSOLIDATED STATEMENTS OF COMPREHENSIVE INCOME (LOSS)
(in thousands)
Successor | Predecessor | |||||||||||||||
Year Ended | September 13 Through | January 1 Through | Year Ended | |||||||||||||
December 31, | December 31, | September 12, | December 31, | |||||||||||||
2017 | 2016 | 2016 | 2015 | |||||||||||||
Net income (loss) | $ | 32,662 | $ | (5,296 | ) | $ | 1,054,602 | $ | (1,582,961 | ) | ||||||
Other comprehensive income (loss): | ||||||||||||||||
Change in pension and postretirement obligations, net of tax of $0 for 2017, $39 for the Successor period from September 13, 2016 through December 31, 2016, $(226) for the Predecessor period from January 1, 2016 through September 12, 2016, and $93 for 2015. | (73 | ) | 73 | (421 | ) | 173 | ||||||||||
(73 | ) | 73 | (421 | ) | 173 | |||||||||||
Comprehensive income (loss) | $ | 32,589 | $ | (5,223 | ) | $ | 1,054,181 | $ | (1,582,788 | ) | ||||||
See accompanying notes to consolidated financial statements.
63
PENN VIRGINIA CORPORATION
CONSOLIDATED BALANCE SHEETS
(in thousands, except share data)
December 31, | |||||||
2017 | 2016 | ||||||
Assets | |||||||
Current assets | |||||||
Cash and cash equivalents | $ | 11,017 | $ | 6,761 | |||
Accounts receivable, net of allowance for doubtful accounts | 69,821 | 29,095 | |||||
Other current assets | 6,250 | 3,028 | |||||
Total current assets | 87,088 | 38,884 | |||||
Property and equipment, net | 529,059 | 247,473 | |||||
Deferred income taxes | 4,943 | — | |||||
Other assets | 8,507 | 5,329 | |||||
Total assets | $ | 629,597 | $ | 291,686 | |||
Liabilities and Shareholders’ Equity | |||||||
Current liabilities | |||||||
Accounts payable and accrued liabilities | $ | 96,181 | $ | 49,697 | |||
Derivative liabilities | 27,777 | 12,932 | |||||
Total current liabilities | 123,958 | 62,629 | |||||
Other liabilities | 4,833 | 4,072 | |||||
Derivative liabilities | 13,900 | 14,437 | |||||
Long-term debt | 265,267 | 25,000 | |||||
Commitments and contingencies (Note 15) | |||||||
Shareholders’ equity: | |||||||
Preferred stock of $0.01 par value – 5,000,000 shares authorized; none issued | — | — | |||||
Common stock of $0.01 par value – 45,000,000 shares authorized; 15,018,870 and 14,992,018 shares issued as of December 31, 2017 and December 31, 2016, respectively | 150 | 150 | |||||
Paid-in capital | 194,123 | 190,621 | |||||
Retained earnings (accumulated deficit) | 27,366 | (5,296 | ) | ||||
Accumulated other comprehensive income | — | 73 | |||||
Total shareholders’ equity | 221,639 | 185,548 | |||||
Total liabilities and shareholders’ equity | $ | 629,597 | $ | 291,686 | |||
See accompanying notes to consolidated financial statements.
64
PENN VIRGINIA CORPORATION
CONSOLIDATED STATEMENTS OF CASH FLOWS
(in thousands)
Successor | Predecessor | |||||||||||||||
Year Ended | September 13 Through | January 1 Through | Year Ended | |||||||||||||
December 31, | December 31, | September 12, | December 31, | |||||||||||||
2017 | 2016 | 2016 | 2015 | |||||||||||||
Cash flows from operating activities | ||||||||||||||||
Net income (loss) | $ | 32,662 | $ | (5,296 | ) | $ | 1,054,602 | $ | (1,582,961 | ) | ||||||
Adjustments to reconcile net income (loss) to net cash provided by operating activities: | ||||||||||||||||
Non-cash reorganization items | — | — | (1,178,302 | ) | — | |||||||||||
Depreciation, depletion and amortization | 48,649 | 11,652 | 33,582 | 334,479 | ||||||||||||
Impairments | — | — | — | 1,397,424 | ||||||||||||
Accretion of firm transportation obligation | — | — | 317 | 942 | ||||||||||||
Derivative contracts: | ||||||||||||||||
Net losses (gains) | 17,819 | 16,622 | 8,333 | (71,247 | ) | |||||||||||
Cash settlements, net | (3,511 | ) | 384 | 48,008 | 138,169 | |||||||||||
Deferred income tax benefit | (4,943 | ) | — | — | (4,712 | ) | ||||||||||
Loss (gain) on sales of assets, net | 36 | 49 | (1,261 | ) | (41,335 | ) | ||||||||||
Non-cash exploration expense | — | — | 6,038 | 5,759 | ||||||||||||
Non-cash interest expense | 2,122 | 226 | 22,189 | 4,749 | ||||||||||||
Share-based compensation (equity-classified) | 3,809 | 81 | 1,511 | 4,540 | ||||||||||||
Other, net | 61 | 21 | (13 | ) | 13 | |||||||||||
Changes in operating assets and liabilities: | ||||||||||||||||
Accounts receivable, net | (43,318 | ) | 10,791 | 12,273 | 137,854 | |||||||||||
Accounts payable and accrued expenses | 28,542 | (3,887 | ) | 22,469 | (152,553 | ) | ||||||||||
Other assets and liabilities | (218 | ) | 131 | 501 | (1,818 | ) | ||||||||||
Net cash provided by operating activities | 81,710 | 30,774 | 30,247 | 169,303 | ||||||||||||
Cash flows from investing activities | ||||||||||||||||
Acquisitions, net | (200,849 | ) | — | — | — | |||||||||||
Capital expenditures | (115,687 | ) | (4,812 | ) | (15,359 | ) | (364,844 | ) | ||||||||
Proceeds from sales of assets, net | 869 | — | 224 | 85,189 | ||||||||||||
Other, net | — | (104 | ) | 1,186 | — | |||||||||||
Net cash used in investing activities | (315,667 | ) | (4,916 | ) | (13,949 | ) | (279,655 | ) | ||||||||
Cash flows from financing activities | ||||||||||||||||
Proceeds from credit facility borrowings | 59,000 | — | 75,350 | 233,000 | ||||||||||||
Repayment of credit facility borrowings | (7,000 | ) | (50,350 | ) | (119,121 | ) | (98,000 | ) | ||||||||
Proceeds from second line note | 196,000 | — | — | — | ||||||||||||
Debt issuance costs paid | (9,787 | ) | — | (3,011 | ) | (744 | ) | |||||||||
Proceeds received from rights offering, net | 55 | — | 49,943 | — | ||||||||||||
Dividends paid on preferred stock | — | — | — | (18,201 | ) | |||||||||||
Other, net | (55 | ) | (161 | ) | — | — | ||||||||||
Net cash provided by (used in) financing activities | 238,213 | (50,511 | ) | 3,161 | 116,055 | |||||||||||
Net increase (decrease) in cash and cash equivalents | 4,256 | (24,653 | ) | 19,459 | 5,703 | |||||||||||
Cash and cash equivalents - beginning of period | 6,761 | 31,414 | 11,955 | 6,252 | ||||||||||||
Cash and cash equivalents - end of period | $ | 11,017 | $ | 6,761 | $ | 31,414 | $ | 11,955 | ||||||||
Supplemental disclosures: | ||||||||||||||||
Cash paid for interest (net of amounts capitalized) | $ | 4,102 | $ | 598 | $ | 4,331 | $ | 86,226 | ||||||||
Cash paid for income taxes (net of refunds) | $ | — | $ | (7 | ) | $ | (35 | ) | $ | (714 | ) | |||||
Cash paid for reorganization items, net | $ | 954 | $ | 525 | $ | 30,990 | $ | — | ||||||||
Non-cash investing and financing activities: | ||||||||||||||||
Common stock issued in exchange for liabilities | $ | — | $ | — | $ | 140,952 | $ | — | ||||||||
Changes in accrued liabilities related to capital expenditures | $ | 19,910 | $ | 997 | $ | (11,301 | ) | $ | (55,660 | ) | ||||||
Derivatives settled to reduce outstanding debt | $ | — | $ | — | $ | 51,979 | $ | — | ||||||||
See accompanying notes to consolidated financial statements.
65
PENN VIRGINIA CORPORATION
CONSOLIDATED STATEMENTS OF SHAREHOLDERS’ EQUITY
(in thousands)
Common Shares Outstanding | Preferred Stock | Common Stock | Paid-in Capital | Retained Earnings (Accumulated Deficit) | Deferred Compensation Obligation | Accumulated Other Comprehensive Income (Loss) | Treasury Stock | Total Shareholders’ Equity (Deficit) | ||||||||||||||||||||||||||
Balance as of December 31, 2014 (Predecessor) | 71,569 | $ | 4,044 | $ | 529 | $ | 1,206,305 | $ | (535,176 | ) | $ | 3,211 | $ | 249 | $ | (3,345 | ) | $ | 675,817 | |||||||||||||||
Net loss | — | — | — | — | (1,582,961 | ) | — | — | — | (1,582,961 | ) | |||||||||||||||||||||||
Conversion of preferred stock | 9,414 | (898 | ) | 94 | 804 | — | — | — | — | — | ||||||||||||||||||||||||
Dividends declared on preferred stock ($300.00 and $300.00 per Series A and Series B preferred share, respectively) | — | — | — | — | (12,134 | ) | — | — | — | (12,134 | ) | |||||||||||||||||||||||
Share-based compensation | 195 | — | 4 | 4,536 | — | — | — | — | 4,540 | |||||||||||||||||||||||||
Deferred compensation | 2 | — | — | — | — | 229 | — | (229 | ) | — | ||||||||||||||||||||||||
Restricted stock unit vesting | 73 | — | 1 | (557 | ) | — | — | — | — | (556 | ) | |||||||||||||||||||||||
Change in pension and postretirement benefit obligations | — | — | — | — | — | — | 173 | — | 173 | |||||||||||||||||||||||||
Balance as of December 31, 2015 (Predecessor) | 81,253 | 3,146 | 628 | 1,211,088 | (2,130,271 | ) | 3,440 | 422 | (3,574 | ) | (915,121 | ) | ||||||||||||||||||||||
Net income | — | — | — | — | 1,054,602 | — | — | — | 1,054,602 | |||||||||||||||||||||||||
Share-based compensation | — | — | — | 1,511 | — | — | — | — | 1,511 | |||||||||||||||||||||||||
All other changes | 6,965 | (1,266 | ) | 69 | 1,198 | — | — | (39 | ) | — | (38 | ) | ||||||||||||||||||||||
Balance, September 12, 2016 (Predecessor) | 88,218 | 1,880 | 697 | 1,213,797 | (1,075,669 | ) | 3,440 | 383 | (3,574 | ) | 140,954 | |||||||||||||||||||||||
Cancellation of Predecessor equity | (88,218 | ) | (1,880 | ) | (697 | ) | (1,213,797 | ) | 1,075,669 | (3,440 | ) | (383 | ) | 3,574 | (140,954 | ) | ||||||||||||||||||
Balance, September 12, 2016 (Predecessor) | — | $ | — | $ | — | $ | — | $ | — | $ | — | $ | — | $ | — | $ | — | |||||||||||||||||
Issuance of Successor common stock - Rights Offering | 7,634 | $ | — | $ | 76 | $ | 49,867 | $ | — | $ | — | $ | — | $ | — | $ | 49,943 | |||||||||||||||||
Issuance of Successor common stock - Backstop Fee | 473 | — | 5 | 9,054 | — | — | — | — | 9,059 | |||||||||||||||||||||||||
Issuance of Successor common stock - exchange of claims | 6,885 | — | 69 | 131,824 | — | — | — | — | 131,893 | |||||||||||||||||||||||||
Balance, September 12, 2016 (Successor) | 14,992 | — | 150 | 190,745 | — | — | — | — | 190,895 | |||||||||||||||||||||||||
Net loss | — | — | — | — | (5,296 | ) | — | — | — | (5,296 | ) | |||||||||||||||||||||||
Share-based compensation | — | — | — | 81 | — | — | — | — | 81 | |||||||||||||||||||||||||
All other changes | — | — | — | (205 | ) | — | — | 73 | — | (132 | ) | |||||||||||||||||||||||
Balance as of December 31, 2016 | 14,992 | — | 150 | 190,621 | (5,296 | ) | — | 73 | — | 185,548 | ||||||||||||||||||||||||
Net income | — | — | — | — | 32,662 | — | — | — | 32,662 | |||||||||||||||||||||||||
Share-based compensation | — | — | — | 3,809 | — | — | — | — | 3,809 | |||||||||||||||||||||||||
Restricted stock unit vesting | 27 | — | — | (351 | ) | — | — | — | — | (351 | ) | |||||||||||||||||||||||
All other changes | — | — | — | 44 | — | — | (73 | ) | — | (29 | ) | |||||||||||||||||||||||
Balance as of December 31, 2017 | 15,019 | $ | — | $ | 150 | $ | 194,123 | $ | 27,366 | $ | — | $ | — | $ | — | $ | 221,639 | |||||||||||||||||
See accompanying notes to consolidated financial statements.
66
PENN VIRGINIA CORPORATION
NOTES TO CONSOLIDATED FINANCIAL STATEMENTS
(in thousands, except per share amounts or where otherwise indicated)
1. | Nature of Operations |
Penn Virginia Corporation (together with its consolidated subsidiaries unless the context otherwise requires, “Penn Virginia,” the “Company,” “we,” “us” or “our”) is an independent oil and gas company engaged in the onshore exploration, development and production of oil, natural gas liquids (“NGLs”) and natural gas. Our current operations consist primarily of drilling unconventional horizontal development wells and operating our producing wells in the Eagle Ford Shale (the “Eagle Ford”) in South Texas. Our operations are substantially concentrated with over 90 percent of our production, revenues and capital expenditures attributable to this region. We also have less significant operations in Oklahoma, primarily consisting of non-operated properties in the Granite Wash.
2. | Basis of Presentation |
Comparability of Financial Statements to Prior Periods
As described in further detail in Note 4 below, we have adopted and applied the relevant guidance provided in accounting principles generally accepted in the United States of America (“GAAP”) with respect to the accounting and financial statement disclosures for entities that have emerged from bankruptcy proceedings (“Fresh Start Accounting”). Accordingly, our Consolidated Financial Statements and Notes after September 12, 2016, are not comparable to the Consolidated Financial Statements and Notes through that date. To facilitate our financial statement presentations, we refer to the reorganized company in these Consolidated Financial Statements and Notes as the “Successor” for periods subsequent to September 12, 2016, and the “Predecessor” for periods prior to September 13, 2016. Furthermore, our Consolidated Financial Statements and Notes have been presented with a “black line” division to delineate the lack of comparability between the Predecessor and Successor. In addition, we have adopted the full cost method of accounting for our oil and gas properties effective with our adoption of Fresh Start Accounting. Accordingly, our results of operations and financial position for the Successor periods will be substantially different from our historic trends.
We have applied the relevant guidance provided in GAAP with respect to the accounting and financial statement disclosures for entities that have filed petitions with the bankruptcy court and expect to reorganize as going concerns in preparing our Consolidated Financial Statements and Notes through the period ended September 12, 2016, or Predecessor periods. That guidance requires that, for periods subsequent to our bankruptcy filing on May 12, 2016, or post-petition periods, certain transactions and events that were directly related to our reorganization be distinguished from our normal business operations. Accordingly, certain revenues, expenses, realized gains and losses and provisions that were realized or incurred in connection with the bankruptcy proceedings have been included in “Reorganization items, net” in our Consolidated Statement of Operations for the period ended September 12, 2016. In addition, certain liabilities and other obligations incurred prior to May 12, 2016, or pre-petition periods, have been classified in “Liabilities subject to compromise” on our Predecessor Consolidated Balance Sheet through September 12, 2016. Further detail for our “Reorganization items, net” and “Liabilities subject to compromise” are provided in Note 4 below.
Going Concern Presumption
Our Consolidated Financial Statements for the Successor periods have been prepared on a going concern basis, which contemplates the realization of assets and the satisfaction of liabilities and other commitments in the normal course of business.
Subsequent Events
Management has evaluated all of our activities through the issuance date of our Consolidated Financial Statements and has concluded that, with the exception of an oil and gas asset acquisition described in Note 5, no subsequent events have occurred that would require recognition in our Consolidated Financial Statements or disclosure in the Notes thereto.
Recently Issued Accounting Pronouncements Pending Adoption
In March 2017, the Financial Accounting Standards Board (“FASB”) issued Accounting Standards Update (“ASU”) 2017–07, Improving the Presentation of Net Periodic Pension Cost and Net Periodic Postretirement Benefit Cost (“ASU 2017–07”) which provides guidance to improve the reporting of net benefit cost in financial statements. The guidance requires employers to disaggregate the service cost component from the other components of net benefit cost. The service cost component of net periodic benefit cost shall be reported in the same line item as other compensation costs arising from services rendered by the pertinent employees during the period, except for amounts capitalized. All other components of net benefit cost shall be presented outside of a subtotal for income from operations. The line item used to present the components other than the service cost shall be disclosed if the other components are not presented in a separate line item or items. ASU 2017–07 is effective January 1, 2018 and is required to be applied retrospectively. ASU 2017–07 will be applicable to our legacy retiree benefit plans which cover a limited population of former employees. There is no service cost associated with these plans as
67
they are not applicable to current employees, but rather interest and other costs associated with the legacy obligations. Upon the adoption of ASU 2017–07, the entirety of the expense associated with these plans will be presented as a component of the “Other income (expense)” caption in our Consolidated Statement of Operations. These costs are currently recognized as a component of “General and administrative” expenses. The total cost associated with these plans is generally less than $0.1 million on an annual basis and is therefore not material. We have adopted ASU 2017–07 effective January 2018.
In June 2016, the FASB issued ASU 2016–13, Measurement of Credit Losses on Financial Instruments (“ASU 2016–13”), which changes the recognition model for the impairment of financial instruments, including accounts receivable, loans and held-to-maturity debt securities, among others. ASU 2016–13 is required to be adopted using the modified retrospective method by January 1, 2020, with early adoption permitted for fiscal periods beginning after December 15, 2018. In contrast to current guidance, which considers current information and events and utilizes a probable threshold, (an “incurred loss” model), ASU 2016–13 mandates an “expected loss” model. The expected loss model: (i) estimates the risk of loss even when risk is remote, (ii) estimates losses over the contractual life, (iii) considers past events, current conditions and reasonably supported forecasts and (iv) has no recognition threshold. ASU 2016–13 will have applicability to our accounts receivable portfolio, particularly those receivables attributable to our joint interest partners which have a higher credit risk than those associated with our traditional customer receivables. At this time, we do not anticipate that the adoption of ASU 2016–13 will have a significant impact on our Consolidated Financial Statements and related disclosures; however, we are continuing to evaluate the requirements and the period for which we will adopt the standard as well as monitoring developments regarding ASU 2016–13 that are unique to our industry.
In February 2016, the FASB issued ASU 2016–02, Leases (“ASU 2016–02”), which will require organizations that lease assets to recognize on the balance sheet the assets and liabilities for the rights and obligations created by those leases with terms of more than twelve months. Consistent with current GAAP, the recognition, measurement, and presentation of expenses and cash flows arising from a lease by a lessee primarily will depend on its classification as a finance or operating lease. ASU 2016–02 also will require disclosures regarding the amount, timing, and uncertainty of cash flows arising from leases. The effective date of ASU 2016–02 is January 1, 2019, with early adoption permitted. We believe that ASU 2016–02 will likely be applicable to our oil and natural gas gathering commitment arrangements as described in Note 15, our existing leases for office facilities and certain office equipment, land easements and similar arrangements for rights-of-way and potentially to certain drilling rig and completion contracts with terms in excess of twelve months to the extent we may have such contracts in the future. Our oil and natural gas gathering arrangements are fairly complex and involve multiple elements that could be construed as leases. Accordingly, we are continuing to evaluate the effect that ASU 2016–02 will have on our Consolidated Financial Statements and related disclosures as well as the period for which we will adopt the standard; however, at this time, we believe that we will likely adopt ASU 2016–02 in 2019. We are also continuing to monitor developments regarding ASU 2016–02 that are unique to our industry.
In May 2014, the FASB issued ASU 2014–09, Revenues from Contracts with Customers (“ASU 2014–09”), which requires an entity to recognize the amount of revenue to which it expects to be entitled for the transfer of promised goods or services to customers. ASU 2014–09 will replace most existing revenue recognition guidance in GAAP when it becomes effective on January 1, 2018. The standard permits the use of either the retrospective or cumulative effect transition method upon adoption. While traditional commodity sales transactions, property conveyances and joint interest arrangements in the oil and gas industry are not expected to be significantly impacted by ASU 2014–09, the terms of the individual commodity purchase, joint operating agreements and other contracts underlying these types of transactions will determine the appropriate recognition, measurement and disclosure once ASU 2014–09 has been adopted. Also, to the extent applicable, participation in certain of these transactions as either a principal or agent can impact the ultimate accounting and presentation.
We have adopted ASU 2014–09 effective January 2018 using the cumulative effect transition method. We will record a cumulative-effect charge to our beginning balance of retained earnings for $2.6 million representing the net receivables for producer imbalances as December 31, 2017, the accounting for which has been modified under ASU 2014–09. Effective January 2018, we will discontinue utilization of the “entitlements” method for producer imbalances and will begin accounting for such transactions utilizing the “sales” method. We do not anticipate this change to have a material impact going forward. In addition, we will change the presentation of our NGL product revenues from a “gross” to a “net” basis, that is revenues, net of processing costs, as we have determined that we are the agent with respect to the sale of these products to the ultimate customers. Accordingly, the applicable processing costs associated with these revenues will no longer be presented as a component of “Gathering, processing and transportation” expense on our Consolidated Statement of Operations. In summary, with the exception of the presentation of NGL revenues and more expansive disclosures, we do not anticipate a material impact attributable to the adoption of ASU 2014–09.
68
3. | Summary of Significant Accounting Policies |
Principles of Consolidation
Our Consolidated Financial Statements include the accounts of Penn Virginia and all of its subsidiaries. Intercompany balances and transactions have been eliminated.
Use of Estimates
Preparation of our Consolidated Financial Statements in conformity with GAAP requires management to make estimates and assumptions that affect the reported amounts of assets and liabilities in our Consolidated Financial Statements and the reported amounts of revenues and expenses during the reporting period. Such estimates include certain asset and liability valuations as further described in these Notes. Actual results could differ from those estimates.
Cash and Cash Equivalents
We consider all highly liquid investments purchased with an original maturity of three months or less to be cash equivalents.
Derivative Instruments
From time to time, we utilize derivative instruments to mitigate our financial exposure to commodity price and interest rate volatility. The derivative instruments, which are placed with financial institutions that we believe are of acceptable credit risk, take the form of collars, swaps and swaptions. All derivative transactions are subject to our risk management policy, which has been reviewed and approved by our board of directors.
All derivative instruments are recognized in our Consolidated Financial Statements at fair value. The fair values of our derivative instruments are determined based on discounted cash flows derived from quoted forward prices. Our derivative instruments are not formally designated as hedges. We recognize changes in fair value in earnings currently as a component of the Derivatives caption in our Consolidated Statements of Operations. We have experienced and could continue to experience significant changes in the amount of derivative gains or losses recognized due to fluctuations in the value of these commodity derivative contracts, which fluctuate with changes in commodity prices and interest rates.
Oil and Gas Properties
We apply the full cost method of accounting for our oil and gas properties which we adopted effective with our adoption of Fresh Start Accounting. Under this method, all productive and nonproductive costs incurred in the exploration, development and acquisition of oil and gas reserves are capitalized. Such costs may be incurred both prior to and after the acquisition of a property and include lease acquisitions, geological and geophysical, or seismic, drilling, completion and equipment costs. Internal costs incurred that are directly attributable to exploration, development and acquisition activities undertaken by us for our own account, and which are not attributable to production, general corporate overhead or similar activities are also capitalized. Future development costs are estimated on a property-by-property basis based on current economic conditions and are amortized as a component of depreciation, depletion and amortization (“DD&A”).
Unproved properties not being amortized include unevaluated leasehold costs and associated capitalized interest. These costs are reviewed quarterly to determine whether or not and to what extent proved reserves have been assigned to a property or if an impairment has occurred due to lease expirations, general economic conditions and other factors, in which case the related costs along with associated capitalized interest are reclassified to the proved oil and gas properties subject to DD&A.
At the end of each quarterly reporting period, the unamortized cost of our oil and gas properties, net of deferred income taxes, is limited to the sum of the estimated discounted future net revenues from proved properties adjusted for costs excluded from amortization and related income taxes (a “Ceiling Test”). The estimated discounted future net revenues are determined using the prior 12-month’s average price based on closing prices on the first day of each month, adjusted for differentials, discounted at 10%. The calculation of the Ceiling Test and provision for DD&A are based on estimates of proved reserves. There are significant uncertainties inherent in estimating quantities of proved reserves and projecting future rates of production, timing and plan of development.
For the periods prior to the Emergence Date, we applied the successful efforts method of accounting for our oil and gas properties. Under this method, costs of acquiring properties, costs of drilling successful exploration wells and development costs were capitalized. Seismic costs, delay rentals and costs to drill exploratory wells that did not find proved reserves were expensed as oil and gas exploration. We carried the costs of exploratory wells as assets if the wells had found a sufficient quantity of reserves to justify its completion as a producing well and as long as we were making sufficient progress assessing the reserves and the economic and operating viability of the project. For certain projects, it may have taken us more than one year to evaluate the future potential of the exploratory well and make determinations of their economic viability. Our ability to move forward on projects was dependent on gaining access to transportation or processing facilities or obtaining permits and government or partner approval, the timing of which was beyond our control. In such cases, exploratory well costs remained suspended as long as we were actively pursuing access to the necessary facilities or receiving such permits and approvals and believed that they would be obtained. We assessed the status of suspended exploratory well costs on a quarterly basis.
69
Depreciation, Depletion and Amortization
DD&A of our oil and gas properties is computed using the units-of-production method. We apply this method by multiplying the unamortized cost of our proved oil and gas properties, net of estimated salvage plus future development costs, by a rate determined by dividing the physical units of oil and gas produced during the period by the total estimated units of proved oil and gas reserves at the beginning of the period.
DD&A of our proved properties while we applied the successful efforts method during the Predecessor periods was computed using the units-of-production method. Historically, we adjusted our depletion rate throughout the year as new data became available and in the fourth quarter based on our year-end reserve report through December 31, 2015.
Other Property and Equipment
Other property and equipment consists primarily of gathering systems and related support equipment. Property and equipment are carried at cost and include expenditures for additions and improvements, such as roads and land improvements, which increase the productive lives of existing assets. Maintenance and repair costs are charged to expense as incurred. Renewals and betterments, which extend the useful life of the properties, are capitalized.
We compute depreciation and amortization of property and equipment using the straight-line balance method over the estimated useful life of each asset as follows: Gathering systems – fifteen to twenty years and Other property and equipment – three to twenty years.
Impairment of Long-Lived Assets
While we applied the successful efforts method of accounting for our oil and gas properties during the Predecessor periods, we reviewed our assets for impairment when events or circumstances indicated a possible decline in the recoverability of the carrying value of the properties. If the carrying value of the asset was determined to be impaired, we reduced the asset to its fair value. Fair value may have been estimated using comparable market data, a discounted cash flow method, or a combination of the two. In the discounted cash flow method, estimated future cash flows were based on management’s expectations for the future and included estimates of future production, commodity prices based on published forward commodity price curves as of the date of the estimate, operating and development costs, intent to develop properties and a risk-adjusted discount rate.
We reviewed oil and gas properties for impairment periodically when events and circumstances indicated a decline in the recoverability of the carrying value of such properties, such as a downward revision of the reserve estimates or lower commodity prices. We estimated the future cash flows expected in connection with the properties and compared such future cash flows to the carrying amounts of the properties to determine if the carrying amounts were recoverable. Performing the impairment evaluations required use of judgments and estimates since the results were dependent on future events. Such events included estimates of proved and unproved reserves, future commodity prices, the timing of future production, capital expenditures and intent to develop properties, among others.
The costs of unproved leaseholds, including associated interest costs for the period activities were in progress to bring projects to their intended use, were capitalized pending the results of exploration efforts. Unproved properties whose acquisition costs were insignificant to total oil and gas properties were amortized in the aggregate over the lesser of five years or the average remaining lease term and the amortization was charged to exploration expense. We assessed unproved properties whose acquisition costs were relatively significant, if any, for impairment on a stand-alone basis. As exploration work progressed and the reserves on properties were proved, capitalized costs of these properties became subject to depreciation and depletion. If the exploration work was unsuccessful, the capitalized costs of the properties related to the unsuccessful work was charged to exploration expense. The timing of any write-downs of any significant unproved properties depended upon the nature, timing and extent of future exploration and development activities and their results.
Asset Retirement Obligations
We recognize the fair value of a liability for an asset retirement obligation (“ARO”) in the period in which it is incurred. Associated asset retirement costs are capitalized as part of the carrying cost of the asset. Our AROs relate to the plugging and abandonment of oil and gas wells and the associated asset is recorded as a component of oil and gas properties. After recording these amounts, the ARO is accreted to its future estimated value, and the additional capitalized costs are depreciated over the productive life of the assets. Both the accretion of the ARO and the depreciation of the related long-lived assets are included in the DD&A expense caption in our Consolidated Statements of Operations.
70
Income Taxes
We recognize deferred tax assets and liabilities for the expected future tax consequences of events that have been recognized in the Company’s financial statements or tax returns. Using this method, deferred tax assets and liabilities are determined based on the difference between the financial statement carrying amounts and tax bases of assets and liabilities using enacted tax rates. In assessing our deferred tax assets, we consider whether a valuation allowance should be recorded for some or all of the deferred tax assets which may not be realized. The ultimate realization of deferred tax assets is assessed at each reporting period and is dependent upon the generation of future taxable income and our ability to utilize tax credits and operating loss carryforwards during the periods in which the temporary differences become deductible. We also consider the scheduled reversal of deferred tax liabilities and available tax planning strategies. We recognize interest attributable to income taxes, to the extent they arise, as a component of interest expense and penalties as a component of income tax expense.
We are subject to ongoing tax examinations in numerous domestic jurisdictions. Accordingly, we may record incremental tax expense based upon the more-likely-than-not outcomes of uncertain tax positions. In addition, when applicable, we adjust the previously recorded tax expense to reflect examination results when the position is effectively settled. Our ongoing assessments of the more-likely-than-not outcomes of the examinations and related tax positions require judgment and can increase or decrease our effective tax rate, as well as impact our operating results. The specific timing of when the resolution of each tax position will be reached is uncertain.
Revenue Recognition
We record revenues associated with sales of crude oil, NGLs and natural gas when title passes to the customer. Through December 31, 2017, we recognized natural gas sales revenues from properties in which we have an interest with other producers on the basis of our net revenue interest (“entitlement” method of accounting - see Note 2 regarding the adoption of ASU 2014–09 effective January 2018). Natural gas imbalances occur when we sell more or less than our entitled ownership percentage of natural gas production. We treat any amount received in excess of our share as a liability. If we take less than we are entitled to take, we record the under-delivery as a receivable. As a result of the numerous requirements necessary to gather information from purchasers or various measurement locations, calculate volumes produced, perform field and wellhead allocations and distribute and disburse funds to various working interest partners and royalty owners, the collection of revenues from oil and gas production may take up to 60 days following the month of production. Therefore, we make accruals for revenues and accounts receivable based on estimates of our share of production, particularly from properties that are operated by our partners. We record any differences, which historically have not been significant, between the actual amounts ultimately received and the original estimates in the period they become finalized.
Share-Based Compensation
Our stock compensation plans permit the grant of incentive and nonqualified stock options, common stock, deferred common stock units, restricted stock and restricted stock units to our employees and directors. We measure the cost of employee services received in exchange for an award of equity-classified instruments based on the grant-date fair value of the award. Compensation cost associated with the liability-classified awards is measured at the end of each reporting period and recognized based on the period of time that has elapsed during the applicable performance period.
4. | Bankruptcy Proceedings, Emergence and Fresh Start Accounting |
Bankruptcy Proceedings and Emergence
On May 12, 2016 (the “Petition Date”), we and eight of our subsidiaries (the “Chapter 11 Subsidiaries”) filed voluntary petitions (In re Penn Virginia Corporation, et al., Case No. 16-32395) seeking relief under Chapter 11 of Title 11 of the United States Bankruptcy Code (the “Bankruptcy Code”) in the United States Bankruptcy Court for the Eastern District of Virginia (the “Bankruptcy Court”).
On August 11, 2016 (the “Confirmation Date”), the Bankruptcy Court confirmed our Second Amended Joint Chapter 11 Plan of Reorganization of Penn Virginia Corporation and its Debtor Affiliates (the “Plan”), and we subsequently emerged from bankruptcy on September 12, 2016 (the “Emergence Date”).
On January 31, 2018, the Bankruptcy Court closed the eight cases attributable to the Chapter 11 Subsidiaries, leaving the aforementioned lead case open pending the entry of a final decree or order by the Bankruptcy Court.
71
Debtors-In-Possession. From the Petition Date through the Emergence Date, we and the Chapter 11 Subsidiaries operated our business as debtors-in-possession in accordance with the applicable provisions of the Bankruptcy Code. The Bankruptcy Court granted all “first day” motions filed by us and the Chapter 11 Subsidiaries, which were designed primarily to minimize the impact of the bankruptcy proceedings on our normal day-to-day operations, our customers, regulatory agencies, including taxing authorities, and employees. As a result, we were able to conduct normal business activities and pay all associated obligations for the post-petition period and we were also authorized to pay and have paid (subject to limitations applicable to payments of certain pre-petition obligations) pre-petition employee wages and benefits, pre-petition amounts owed to certain lienholders, amounts due to taxing authorities for production and other related taxes and funds belonging to third parties, including royalty and working interest holders.
Pre-Petition Agreements. Immediately prior to the Petition Date, the holders (the “Ad Hoc Committee”) of approximately 86 percent of the $1,075 million principal amount of our 7.25% Senior Notes due 2019 (the “2019 Senior Notes”) and 8.50% Senior Notes due 2020 (the “2020 Senior Notes” and, together with the 2019 Senior Notes, the “Senior Notes”) agreed to a restructuring support agreement (the “RSA”) that set forth the general framework of the Plan and the timeline for the bankruptcy proceedings. In addition, we entered into a backstop commitment agreement (the “Backstop Commitment Agreement”) with the parties thereto (collectively, the “Backstop Parties”), pursuant to which the Backstop Parties committed to provide a $50 million commitment to backstop a rights offering (the “Rights Offering”) that was conducted in connection with the Plan.
Plan of Reorganization. Pursuant to the terms of the Plan, which was supported by us, the holders (the “RBL Lenders”) of 100 percent of the claims attributable to our pre-petition credit agreement (as amended, the “RBL”), the Ad Hoc Committee and the Official Committee of Unsecured Claimholders (the “UCC”), the following transactions were completed subsequent to the Confirmation Date and prior to or at the Emergence Date:
• | the approximately $1,122 million of indebtedness, including accrued interest, attributable to our Senior Notes and certain other unsecured claims were exchanged for 6,069,074 shares representing 41 percent of the Successor’s common stock (“Successor Common Stock”); |
• | a total of $50 million of proceeds were received on the Emergence Date from the Rights Offering resulting in the issuance of 7,633,588 shares representing 51 percent of Successor Common Stock to holders of claims arising under the Senior Notes, certain holders of general unsecured claims and to the Backstop Parties; |
• | the Backstop Parties received a backstop fee comprised of 472,902 shares representing three percent of Successor Common Stock; |
• | an additional 816,454 shares representing five percent of Successor Common Stock were authorized for disputed general unsecured claims and non-accredited investor holders of the Senior Notes and subsequently, 749,600 shares of Successor Common Stock were reserved for issuance under a new management incentive plan; |
• | on the Emergence Date, we entered into a shareholders agreement and a registration rights agreement and amended our articles of incorporation and bylaws for the authorization of the Successor Common Stock and to provide customary registration rights thereunder, among other corporate governance actions; |
• | holders of claims arising under the RBL were paid in full from cash on hand, $75.4 million from borrowings under a new credit agreement (the “Credit Facility”) (see Note 10 below) and proceeds from the Rights Offering; |
• | the debtor-in-possession credit facility (the “DIP Facility”), under which there were no outstanding borrowings at any time from the Petition Date through the Emergence Date, was canceled and less than $0.1 million in fees were paid in full in cash; |
• | certain other priority claims were paid in full in cash, reinstated or otherwise treated in a manner acceptable to the creditor claim-holders; |
• | a cash reserve of $2.7 million was established for certain other secured, priority or convenience claims pending resolution as of the Emergence Date; |
• | an escrow account for professional service fees attributable to our advisers and those of the UCC was funded by us with cash of $14.6 million, and we paid $7.2 million for professional fees and expenses on behalf of the RBL Lenders, the Ad Hoc Committee and the indenture trustee for the Senior Notes; |
• | on the Emergence Date, our previous interim Chief Executive Officer, Edward B. Cloues, resigned and each member of our board of directors resigned and was replaced by new board members: Darin G. Holderness, CPA, Marc McCarthy and Harry Quarls and, in October 2016, Jerry R. Schuyler; |
• | our Predecessor preferred stock and common stock was canceled, extinguished and discharged; and |
• | all of our Predecessor share-based compensation plans and supplemental employee retirement plan (the “SERP”) entitlements were canceled. |
72
While our emergence from bankruptcy is effectively complete, certain administrative and claims resolution activities will continue under the authority of the Bankruptcy Court until they have been appropriately discharged. As of February 23, 2018, certain claims were still in the process of resolution. While most of these matters are unsecured claims for which shares of Successor Common Stock have been allocated, certain of these matters must be settled with cash payments. As of December 31, 2017, we had $3.9 million reserved for outstanding claims to be potentially settled in cash. This reserve is included as a component of “Accounts payable and accrued liabilities” on our Consolidated Balance Sheet.
Fresh Start Accounting
We adopted Fresh Start Accounting on the Emergence Date in connection with our emergence from bankruptcy. As referenced below, our reorganization value of $334.0 million, immediately prior to emergence was substantially less than our post-petition liabilities and allowed claims. Furthermore and in connection with our reorganization, we experienced a change in control as the outstanding common and preferred shares of the Predecessor were canceled and substantially all of the Successor Common Stock was issued to the Predecessor’s creditors, primarily former holders of our Senior Notes. Accordingly, the holders of the Predecessor’s common and preferred shares effectively received no shares of the Successor. The adoption of Fresh Start Accounting results in a new reporting entity, the Successor, for financial reporting purposes. The presentation is analogous to that of a new business entity such that the Successor is presented with no beginning retained earnings or deficit on the Emergence Date.
Reorganization Value
Reorganization value represents the fair value of the Successor’s total assets prior to the consideration of liabilities and is intended to approximate the amount a willing buyer would pay for the assets immediately after a restructuring. The reorganization value, which was derived from the Successor’s enterprise value, was allocated to our individual assets based on their estimated fair values.
Enterprise value represents the estimated fair value of an entity’s long term debt and shareholders’ equity. The Successor’s enterprise value, as approved by the Bankruptcy Court in support of the Plan, was estimated to be within a range of $218 million to $382 million with a mid-point value of $300 million. Based on the estimates and assumptions utilized in our Fresh Start Accounting process, we estimated the Successor’s enterprise value to be approximately $266.2 million after the consideration of cash and cash equivalents on hand at the Emergence Date.
The following table reconciles the enterprise value, net of cash and cash equivalents, to the estimated fair value of our Successor Common Stock as of the Emergence Date:
Enterprise value | $ | 234,831 | ||
Plus: Cash and cash equivalents | 31,414 | |||
Less: Fair value of debt | (75,350 | ) | ||
Fair value of Successor Common Stock | $ | 190,895 | ||
Shares outstanding as of September 12, 2016 | 14,992,018 | |||
Per share value | $ | 12.73 | ||
The following table reconciles the enterprise value to the reorganization value of our Successor assets as of the Emergence Date:
Enterprise value | $ | 234,831 | ||
Plus: Cash and cash equivalents | 31,414 | |||
Plus: Current liabilities | 54,171 | |||
Plus: Noncurrent liabilities excluding long-term debt | 13,558 | |||
Reorganization value | $ | 333,974 | ||
73
Valuation Process
Our valuation analysis was prepared with the assistance of an independent third-party consultant utilizing reserve information prepared by our independent reserve engineers, internal development plans and schedules, other internal financial information and projections and the application of standard valuation techniques including risked net asset value analysis and comparable public company metrics. Because many of the inputs utilized in the valuation process are not observable, we have classified the Fresh Start fair value measurements as Level 3 inputs as that term is defined in GAAP.
Our principal assets include the Successor’s oil and gas properties. We determined the fair value of our oil and gas properties based on the discounted cash flows expected to be generated from these assets. Our analyses were based on market conditions and reserves in place as confirmed by our independent petroleum engineers. The proved reserves were segregated into various geographic regions, including sub-regions within the Eagle Ford where a substantial portion of our assets are located, for which separate risk factors were determined based on geological characteristics. Due to the limited drilling plans that we had in place, proved undeveloped locations were risked accordingly. Future cash flows were estimated by using New York Mercantile Exchange (“NYMEX”) forward prices for West Texas Intermediate (“WTI”) crude oil and Henry Hub natural gas with inflation adjustments applied to periods beyond a five-year horizon. These prices were adjusted for differentials realized by us for location and product quality. Gathering and transportation costs were estimated based on agreements that we had in place and development and operating costs were based on our most recent experience and adjusted for inflation in future years. The risk-adjusted after-tax cash flows were discounted at a rate of 13.5%. This rate was determined from a weighted-average cost of capital computation which utilized a blended expected cost of debt and expected returns on equity for similar industry participants. Plugging and abandonment costs were also identified and measured in this process in order to determine the fair value of the Successor’s AROs attributable to our proved developed reserves on the Emergence Date. Based on this valuation process, we determined fair values of $121.9 million for our proved reserves and $2.7 million for the related AROs.
With respect to the valuation of our undeveloped acreage, we segregated our current lease holdings in the Eagle Ford into prospect regions in which we had significant developed acreage and those in which we had not yet initiated any significant drilling activity. For those prospects within previously developed regions, we applied a multiple based on recent transactions involving acreage deemed comparable to our acreage for each targeted formation. Based on this valuation process, we determined a fair value of $92.5 million for our undeveloped acreage within previously developed regions of the Eagle Ford. For those lease holdings in other areas of the Eagle Ford, we disregarded those prospects for which lease expirations were to occur during 2016 as well as those for which future drilling was considered uneconomical at then current commodity prices. A reduced multiple was then applied to this adjusted undeveloped acreage consistent with recent transactions for acreage deemed comparable to our acreage resulting in a fair value of $8.3 million. We attributed no value to our limited undeveloped lease holdings in all areas other than the Eagle Ford.
Our remaining equipment and other fixed assets were valued at $26.7 million primarily using a cost approach that incorporated depreciation and obsolescence to the extent applicable on an asset-by-asset basis. The most significant of these assets is our water facility in South Texas which is integral to our regional operations. Accordingly, this asset, for which we determined a fair value of $23.4 million, is included in our full cost pool for purposes of determining our DD&A attributable to our oil and gas production. Certain assets, particularly personal property including office equipment and vehicles, among others, were valued based on market data for comparable assets to the extent such information was available.
The remaining reorganization value is attributable to certain natural gas imbalance receivables, cash and cash equivalents, working capital assets including accounts receivable, prepaid items, current derivative assets and debt issuance costs. Our natural gas imbalance receivables, which are fully attributable to our Mid-Continent operations in the Granite Wash, were valued using NYMEX spot prices for Henry Hub natural gas adjusted for basis differentials for transportation. Our accounts receivable, including amounts receivable from our joint venture partners, were subjected to analysis on an individual basis and reserved to the extent we believe was appropriate. Collectively, these remaining assets, including our current derivative assets which are marked-to-market on a monthly basis, were stated at their fair values on the Emergence Date. The reorganization value also included $3.0 million of issuance costs attributable to the Credit Facility under which we initially borrowed $75.4 million. This amount was capitalized in accordance with GAAP as it represents costs attributable to the access to credit over the term of the Credit Facility.
Our liabilities on the Emergence Date included the aforementioned borrowings under the Credit Facility, working capital liabilities including accounts payable and accrued liabilities, a reserve for certain litigation matters, pension and health care obligations attributable to certain retirees, AROs, and derivative liabilities. As the Credit Facility is current and is a variable-rate financial instrument, it was stated at its fair value. Our working capital liabilities and litigation reserve are ordinary course obligations and their carrying amounts approximated their fair values. We revalued our retiree obligations based on data from our independent actuaries and they have been stated at their fair values. The AROs were valued in connection with the valuation process attributable to our oil and gas reserves as discussed above. Finally, our derivative liabilities were also stated at their fair value as they are marked-to-market on a monthly basis.
74
Successor Balance Sheet
The following table reflects the reorganization and application of Fresh Start Accounting adjustments on our Consolidated Balance Sheet as of September 12, 2016:
Reorganization | Fresh Start | ||||||||||||||||||
Predecessor | Adjustments | Adjustments | Successor | ||||||||||||||||
Assets | |||||||||||||||||||
Current assets | |||||||||||||||||||
Cash and cash equivalents | $ | 48,718 | $ | (17,304 | ) | (1 | ) | $ | — | $ | 31,414 | ||||||||
Accounts receivable, net of allowance for doubtful accounts | 35,606 | 4,292 | (2 | ) | — | 39,898 | |||||||||||||
Derivative assets | 397 | — | — | 397 | |||||||||||||||
Other current assets | 3,966 | (832 | ) | (3 | ) | — | 3,134 | ||||||||||||
Total current assets | 88,687 | (13,844 | ) | — | 74,843 | ||||||||||||||
Property and equipment, net | 309,261 | — | (55,751 | ) | (12 | ) | 253,510 | ||||||||||||
Other assets | 6,902 | (1,281 | ) | (4 | ) | — | 5,621 | ||||||||||||
Total assets | $ | 404,850 | $ | (15,125 | ) | $ | (55,751 | ) | $ | 333,974 | |||||||||
Liabilities and Shareholders’ Equity (Deficit) | |||||||||||||||||||
Current liabilities | |||||||||||||||||||
Accounts payable and accrued liabilities | $ | 77,151 | $ | (21,166 | ) | (5 | ) | $ | (3,455 | ) | (13 | ) | $ | 52,530 | |||||
Derivative liabilities | 1,641 | — | — | 1,641 | |||||||||||||||
Current maturities of long-term debt | 113,653 | (113,653 | ) | (6 | ) | — | — | ||||||||||||
Total current liabilities | 192,445 | (134,819 | ) | (3,455 | ) | 54,171 | |||||||||||||
Other liabilities | 84,953 | 100 | (5 | ) | (80,615 | ) | (14 | ) | 4,438 | ||||||||||
Derivative liabilities | 9,120 | — | — | 9,120 | |||||||||||||||
Long-term debt | — | 75,350 | (7 | ) | — | 75,350 | |||||||||||||
Liabilities subject to compromise | 1,154,163 | (1,154,163 | ) | (8 | ) | — | — | ||||||||||||
Shareholders’ equity (deficit) | |||||||||||||||||||
Preferred stock (Predecessor) | 1,880 | (1,880 | ) | (9 | ) | — | — | ||||||||||||
Common stock (Predecessor) | 697 | (697 | ) | (9 | ) | — | — | ||||||||||||
Paid-in capital (Predecessor) | 1,213,797 | (1,213,797 | ) | (9 | ) | — | — | ||||||||||||
Deferred compensation obligation (Predecessor) | 3,440 | (3,440 | ) | (9 | ) | — | — | ||||||||||||
Accumulated other comprehensive income (Predecessor) | 383 | (383 | ) | (9 | ) | — | — | ||||||||||||
Treasury stock (Predecessor) | (3,574 | ) | 3,574 | (9 | ) | — | — | ||||||||||||
Common stock (Successor) | — | 150 | (10 | ) | — | 150 | |||||||||||||
Paid-in capital (Successor) | — | 190,745 | (10 | ) | — | 190,745 | |||||||||||||
Accumulated deficit | (2,252,454 | ) | 2,224,135 | (11 | ) | 28,319 | (15 | ) | — | ||||||||||
Total shareholders’ equity (deficit) | (1,035,831 | ) | 1,198,407 | 28,319 | 190,895 | ||||||||||||||
Total liabilities and shareholders’ equity (deficit) | $ | 404,850 | $ | (15,125 | ) | $ | (55,751 | ) | $ | 333,974 | |||||||||
75
Reorganization Adjustments
1. | Represents the net cash payments that occurred on the Emergence Date: |
Sources: | |||||||
Proceeds from the Credit Facility | $ | 75,350 | |||||
Proceeds from the Rights Offering, net of issuance costs | 49,943 | ||||||
Total sources | $ | 125,293 | |||||
Uses: | |||||||
Repayment of RBL | $ | 113,653 | |||||
Accrued interest payable on RBL | 1,374 | ||||||
DIP Facility fees | 12 | ||||||
Debt issue costs of the Credit Facility | 3,011 | ||||||
Funding of professional fee escrow account | 14,575 | ||||||
RBL lender professional fees and expenses | 455 | ||||||
Ad Hoc Committee and indenture trustee professional fees and expenses | 6,782 | ||||||
Payment of certain allowed claims and settlements | 2,735 | ||||||
Total uses | 142,597 | ||||||
$ | (17,304 | ) | |||||
2. | Represents the reclassification of SERP assets to a current receivable from other noncurrent assets upon the cancellation of the underlying plan and the reversion of the assets to the Successor. |
3. | Represents the write-off of certain prepaid directors and officers tail insurance. |
4. | Represents the capitalization of debt issuance costs attributable to the Credit Facility, net of the reclassification of SERP assets as discussed in item (2) above. |
5. | Represents the payment of professional fees on behalf of the RBL Lenders, the Ad Hoc Committee and the UCC, indenture trustee fees and expenses, interest payable on the RBL as well as certain allowed claims and settlements net of the establishment of reserves and the reinstatement of certain other obligations. |
6. | Represents the repayment of the RBL in cash in full. |
7. | Represents the initial borrowings under the Credit Facility. |
8. | Liabilities subject to compromise were settled as follows in accordance with the Plan: |
Liabilities subject to compromise prior to the Emergence Date: | |||||||
Senior Notes | $ | 1,075,000 | |||||
Interest on Senior Notes | 47,213 | ||||||
Firm transportation obligation | 11,077 | ||||||
Compensation – related | 9,733 | ||||||
Deferred compensation | 4,676 | ||||||
Trade accounts payable | 1,487 | ||||||
Litigation claims | 1,092 | ||||||
Other accrued liabilities | 3,885 | ||||||
$ | 1,154,163 | ||||||
Amounts settled in cash, reinstated or otherwise reserved at emergence | (3,915 | ) | |||||
Gain on settlement of liabilities subject to compromise | $ | 1,150,248 | |||||
9. | Represents the cancellation of our Predecessor preferred and common stock and related components of our Predecessor shareholders’ deficit. |
10. | Represents the issuance of 14,992,018 shares of Successor Common Stock with a fair value of $12.73 per share. |
76
11. | Represents the cumulative impact of the reorganization adjustments described above: |
Gain on settlement of liabilities subject to compromise | $ | 1,150,248 | ||||
Fair value of equity allocated to: | ||||||
Unsecured creditors on the Emergence Date | 174,477 | |||||
Unsecured creditors pending resolution on the Emergence Date | 10,396 | |||||
Backstop Parties in the form of a Commitment Premium | 6,022 | |||||
190,895 | ||||||
Cancellation of Predecessor shareholders’ deficit | 882,992 | |||||
Net impact to Predecessor accumulated deficit | $ | 2,224,135 | ||||
Fresh Start Adjustments
12. | Represents the Fresh Start Accounting valuation adjustments applied to our oil and gas properties and other equipment. |
13. | Represents the accelerated recognition of the current portion of previously deferred gains on sales of assets attributable to the accounting presentation required by GAAP under the Predecessor. |
14. | Represents the recognition of Fresh Start Accounting adjustments to: (i) our AROs attributable to the revalued oil and gas properties and (ii) our retiree obligations based on actuarial measurements, as well as the accelerated recognition of the noncurrent portion of previously deferred gains on sales of assets attributable to the accounting presentation required by GAAP under the Predecessor. |
15. | Represents the cumulative impact of the Fresh Start Accounting adjustments discussed above. |
Reorganization Items. As described above in Note 2, our Consolidated Statements of Operations for the period ended September 12, 2016 include “Reorganization items, net,” which reflects gains recognized on the settlement of liabilities subject to compromise and costs and other expenses associated with the bankruptcy proceedings, principally professional fees, and the costs associated with the DIP Facility. These post-petition costs for professional fees, as well as administrative fees charged by the U.S. Trustee, have been reported in “Reorganization items, net” in our Consolidated Statement of Operations as described above. Similar costs that were incurred during the pre-petition periods have been reported in “General and administrative” expenses.
The following table summarizes the components included in “Reorganization items, net” in our Consolidated Statements of Operations for the period presented:
January 1 Through | |||
September 12, | |||
2016 | |||
Gains on the settlement of liabilities subject to compromise | $ | 1,150,248 | |
Fresh start accounting adjustments | 28,319 | ||
Legal and professional fees and expenses | (29,976 | ) | |
Settlements attributable to contract amendments | (2,550 | ) | |
DIP Facility costs and commitment fees | (170 | ) | |
Write-off of prepaid directors and officers insurance | (832 | ) | |
Other reorganization items | (46 | ) | |
$ | 1,144,993 | ||
77
5. Acquisitions and Divestitures
Acquisitions
Hunt Acquisition
In December 2017, we entered into a purchase and sale agreement with Hunt Oil Company (“Hunt”) to acquire certain oil and gas assets in the Eagle Ford Shale, primarily in Gonzales and Lavaca Counties, Texas for $86.0 million in cash, subject to adjustments (the “Hunt Acquisition”). The Hunt Acquisition has an effective date of October 1, 2017 and closed on March 1, 2018. We funded the Hunt Acquisition with borrowings under the Credit Facility. The Hunt Acquisition expands our core net leasehold position by approximately 9,700 net acres, substantially all of which is held by production, in the northwestern portion of our Eagle Ford acreage. As a result of the Hunt Acquisition we are the operator of substantially all of our Eagle Ford acreage.
Devon Acquisition
In July 2017, we entered into a purchase and sale agreement (the “Purchase Agreement”), with Devon Energy Corporation (“Devon”) to acquire all of Devon’s right, title and interest in and to certain oil and gas assets (the “Devon Properties”), including oil and gas leases covering approximately 19,600 net acres located primarily in Lavaca County, Texas for aggregate consideration of $205 million in cash (the “Devon Acquisition”). Upon execution of the Purchase Agreement, we deposited $10.3 million as earnest money into an escrow account (the “Escrow Account”). The Devon Acquisition has an effective date of March 1, 2017 and closed on September 29, 2017, at which time we paid cash consideration of $189.9 million and $7.1 million was released from the Escrow Account to Devon. In November 2017, we acquired additional working interests in the Devon Properties for $0.7 million from parties that had tag-along rights to sell their interests under the Purchase Agreement.
The final settlements of the Devon Acquisition together with the tag-along rights acquisition, occurred in February 2018 at which time $2.5 million in cash was transferred from the Escrow Account to Devon representing final adjustments for the period from the effective date through the closing date and the curing of title defects for certain properties. As of December 31, 2017, there was $3.2 million remaining in the Escrow Account, which is included as a component of noncurrent “Other assets” on our Consolidated Balance Sheet. Of this total, $2.5 million was transferred as described above and the remaining $0.7 million was distributed to us in February 2018 as well.
The Devon Acquisition was financed with the net proceeds received from borrowing under the $200 million Second Lien Credit Agreement dated as of September 29, 2017 (the “Second Lien Facility”) (see Note 10 for terms of the Second Lien Facility) and incremental borrowings under the Credit Facility. The Devon Properties include increases in working interests of many properties for which we are the operator as well as other properties that are contiguous to our existing asset base in South Texas.
We incurred a total of $1.3 million of transaction costs associated with the Hunt and Devon Acquisitions during 2017, including advisory, legal, due diligence and other professional fees. These costs have been recognized as a component of our “General and administrative” expenses.
We accounted for the Devon Acquisition by applying the acquisition method of accounting as of the Date of Acquisition. The following table represents the preliminary fair values assigned to the net assets acquired as of the Date of Acquisition and the consideration transferred:
Assets | ||||
Oil and gas properties - proved | $ | 42,891 | ||
Oil and gas properties - unproved | 146,686 | |||
Other property and equipment | 8,642 | |||
Liabilities | ||||
Asset retirement obligations | 494 | |||
Net assets acquired | $ | 197,725 | ||
Cash consideration paid | $ | 190,599 | ||
Amount transferred to Devon from the Escrow Account on the Date of Acquisition | 7,049 | |||
Amount due to Devon from the Escrow Account in February 2018 | 2,506 | |||
Application of working capital adjustments, net | (2,429 | ) | ||
Total consideration | $ | 197,725 | ||
78
The fair values of the oil and gas properties acquired were measured using valuation techniques that convert future cash flows to a single discounted amount. Significant inputs to the valuation include estimates of: (i) reserves, (ii) future operating and development costs, (iii) future commodity prices, (iv) future cash flows (v) the timing of or development plans and (vi) a market-based weighted-average cost of capital. The fair value of the other property and equipment acquired was measured primarily with reference to replacement costs for similar assets adjusted for the age and normal use of the underlying assets. Because many of these inputs are not observable, we have classified the initial fair value estimates as Level 3 inputs as that term is defined in GAAP.
The results of operations attributable to the Devon Acquisition have been included in our Consolidated Financial Statements for the periods after September 30, 2017. The Devon Acquisition provided revenues and earnings of approximately $9 million and $4 million, respectively, for the period from October 1, 2017 through December 31, 2017. The following table presents unaudited summary pro forma financial information for the year ended December, 31, 2017 assuming the Devon Acquisition and the related entry into the Second Lien Facility occurred as of January 1, 2017. The pro forma financial information does not purport to represent what our actual results of operations would have been if the Devon Acquisition and the entry into the Second Lien Facility had occurred as of this date, or the results of operations for any future periods. We have excluded any pro forma presentations for the Successor and Predecessor periods in 2016 as the determination of such pro forma adjustments are not practical due primarily to our reorganization and adoption of Fresh Start Accounting and the full cost method on the Emergence Date. In light of these circumstances, we also believe that such a pro forma presentation for 2016 would not be comparable and could potentially be misleading.
Total revenues | $ | 184,831 | |||
Net income attributable to common shareholders | $ | 23,360 | |||
Net income per share - basic | $ | 1.56 | |||
Net income per share - diluted | $ | 1.55 | |||
Divestitures
South Texas Properties
In October 2015, we sold certain non-core Eagle Ford properties for $12.5 million net of transaction costs and customary closing adjustments. We recognized a loss of $9.5 million on this transaction.
Mid-Continent Properties
In October 2015, we sold certain properties in Oklahoma that were outside of our core Granite Wash operating region for approximately $0.1 million which represented their approximate carrying values.
East Texas Properties
In August 2015, we sold our Cotton Valley and Haynesville Shale assets in East Texas and received cash proceeds of approximately $73 million, net of transaction costs and customary closing adjustments. The effective date of the sale was May 1, 2015 and we recognized a gain of approximately $43 million. The carrying value of the net assets disposed in this transaction was $29.5 million, including oil and gas properties and other assets of $33.3 million, net of related AROs of $3.8 million. The net pre-tax operating income (loss), excluding the gain on sale and impairment charges, attributable to the East Texas assets was $1.3 million for the year ended December 31, 2015. The net proceeds from this transaction were used to pay down a portion of our outstanding borrowings under the RBL.
6. | Accounts Receivable and Major Customers |
The following table summarizes our accounts receivable by type as of the dates presented:
December 31, | ||||||||
2017 | 2016 | |||||||
Customers | $ | 39,106 | $ | 20,489 | ||||
Joint interest partners | 32,493 | 7,238 | ||||||
Other | 584 | 3,789 | ||||||
72,183 | 31,516 | |||||||
Less: Allowance for doubtful accounts | (2,362 | ) | (2,421 | ) | ||||
$ | 69,821 | $ | 29,095 | |||||
79
For the year ended December 31, 2017, three customers accounted for $137.5 million, or approximately 86% of our consolidated product revenues. The revenues generated from these customers during 2017 were $94.1 million, $22.1 million and $21.3 million or 59%, 14%, and 13% of the consolidated total, respectively. As of December 31, 2017, $32.1 million, or approximately 82% of our consolidated accounts receivable from customers was related to these customers. For the year ended December 31, 2016, three customers accounted for $122.7 million, or approximately 93% of our consolidated product revenues. The revenues generated from these customers during 2016 were $93.5 million, $15.7 million and $13.5 million, or approximately 71%, 12% and 10% of the consolidated total, respectively. As of December 31, 2016, $16.7 million, or approximately 81% of our consolidated accounts receivable from customers was related to these customers. No significant uncertainties exist related to the collectability of amounts owed to us by any of these customers.
7. | Derivative Instruments |
We utilize derivative instruments to mitigate our financial exposure to commodity price volatility. Our derivative instruments are not formally designated as hedges in the context of U.S. GAAP.
Commodity Derivatives
We typically utilize collars, swaps and swaptions, which are placed with financial institutions that we believe are acceptable credit risks, to hedge against the variability in cash flows associated with anticipated sales of our future production. While the use of derivative instruments limits the risk of adverse price movements, such use may also limit future revenues from favorable price movements.
The counterparty to a collar or swap contract is required to make a payment to us if the settlement price for any settlement period is below the floor or swap price for such contract. We are required to make a payment to the counterparty if the settlement price for any settlement period is above the ceiling or swap price for such contract. Neither party is required to make a payment to the other party if the settlement price for any settlement period is equal to or greater than the floor price and equal to or less than the ceiling price for such collar contract.
We determine the fair values of our commodity derivative instruments based on discounted cash flows derived from third-party quoted forward prices for WTI crude oil, Light Louisiana Sweet (“LLS”) crude oil and NYMEX Henry Hub gas closing prices as of the end of the reporting period. The discounted cash flows utilize discount rates adjusted for the credit risk of our counterparties if the derivative is in an asset position, and our own credit risk if the derivative is in a liability position.
We terminated all of our pre-petition derivative contracts from March 2016 through May 2016 for $63.0 million and reduced our amounts outstanding under the RBL by $52.0 million. In connection with these transactions, the counterparties to the derivative contracts, which were also affiliates of lenders under the RBL, transferred the cash proceeds that were used for RBL repayments directly to the administrative agent under the RBL. Accordingly, all of these RBL repayments have been presented as non-cash financing activities in our Consolidated Statement of Cash Flows for the period January 1, 2016 through September 12, 2016.
On May 13, 2016, the Bankruptcy Court approved our motion to enter into new commodity derivative contracts. Accordingly, we hedged a substantial portion of our future crude oil production through the end of 2019, as required in the RSA, at a weighted-average price of approximately $49.12 per barrel. We also entered into additional hedge contracts in 2017 as reflected in the table that follows. We are currently unhedged with respect to natural gas as well as NGL production.
80
The following table sets forth our commodity derivative positions as of December 31, 2017:
Average | Weighted | |||||||||||||||
Volume Per | Average | Fair Value | ||||||||||||||
Instrument 1 | Day | Price | Asset | Liability | ||||||||||||
Crude Oil: | (barrels) | ($/barrel) | ||||||||||||||
First quarter 2018 | Swaps | 8,013 | $ | 51.14 | $ | — | $ | 7,622 | ||||||||
Second quarter 2018 | Swaps | 7,984 | $ | 51.15 | — | 7,075 | ||||||||||
Third quarter 2018 | Swaps | 7,955 | $ | 51.15 | — | 6,241 | ||||||||||
Fourth quarter 2018 | Swaps | 7,955 | $ | 51.15 | — | 5,357 | ||||||||||
First quarter 2019 | Swaps | 6,446 | $ | 50.97 | — | 3,845 | ||||||||||
Second quarter 2019 | Swaps | 6,421 | $ | 50.97 | — | 3,336 | ||||||||||
Third quarter 2019 | Swaps | 6,397 | $ | 50.97 | — | 2,886 | ||||||||||
Fourth quarter 2019 | Swaps | 6,398 | $ | 50.97 | — | 2,528 | ||||||||||
First quarter 2020 | Swaps | 2,000 | $ | 51.29 | — | 441 | ||||||||||
Second quarter 2020 | Swaps | 2,000 | $ | 51.29 | — | 353 | ||||||||||
Third quarter 2020 | Swaps | 2,000 | $ | 51.29 | — | 283 | ||||||||||
Fourth quarter 2020 | Swaps | 2,000 | $ | 51.29 | — | 228 | ||||||||||
Settlements to be paid in subsequent period | 1,482 | |||||||||||||||
_____________________________________________
1 | Including the effect of additional hedge contracts entered into in January 2018, we have hedged our crude oil production as follows: 2018 - 6,227 BOPD at a weighted-average WTI-based price of $50.70 per barrel and 2,500 BOPD at a weighted-average LLS-based price of $55.18 per barrel, 2019 - 4,915 BOPD at a weighted-average WTI-based price of $52.12 per barrel and 2,500 BOPD at a weighted-average LLS-based price of $51.30 per barrel and 2020 - 4,000 BOPD at a weighted-average WTI-based price of $52.67 per barrel. |
Financial Statement Impact of Derivatives
The impact of our derivatives activities on income is included in the “Derivatives” caption on our Consolidated Statements of Operations. The following table summarizes the effects of our derivative activities for the periods presented:
Successor | Predecessor | |||||||||||||||
Year Ended | September 13 Through | January 1 Through | Year Ended | |||||||||||||
December 31, | December 31, | September 12, | December 31, | |||||||||||||
2017 | 2016 | 2016 | 2015 | |||||||||||||
Derivative gains (losses) | $ | (17,819 | ) | $ | (16,622 | ) | $ | (8,333 | ) | $ | 71,247 | |||||
The effects of derivative gains and (losses) and cash settlements (except for those cash settlements attributable to the aforementioned termination transactions) are reported as adjustments to reconcile net income (loss) to net cash provided by operating activities. These items are recorded in the “Derivative contracts” section of our Consolidated Statements of Cash Flows under the “Net losses (gains)” and “Cash settlements, net.”
The following table summarizes the fair value of our derivative instruments, as well as the locations of these instruments, on our Consolidated Balance Sheets as of the dates presented:
Fair Values | |||||||||||||||||||
December 31, 2017 | December 31, 2016 | ||||||||||||||||||
Derivative | Derivative | Derivative | Derivative | ||||||||||||||||
Type | Balance Sheet Location | Assets | Liabilities | Assets | Liabilities | ||||||||||||||
Commodity contracts | Derivative assets/liabilities – current | $ | — | $ | 27,777 | $ | — | $ | 12,932 | ||||||||||
Commodity contracts | Derivative assets/liabilities – noncurrent | — | 13,900 | — | 14,437 | ||||||||||||||
$ | — | $ | 41,677 | $ | — | $ | 27,369 | ||||||||||||
As of December 31, 2017, we reported a commodity derivative liability of $41.7 million. The net and gross amounts for our derivative assets and liabilities are the same for both periods presented above. The contracts associated with this position are with five counterparties, all of which are investment grade financial institutions. This concentration may impact our overall credit risk, either positively or negatively, in that these counterparties may be similarly affected by changes in economic or other conditions. We have neither paid to, nor received from, our counterparties any cash collateral in connection with our derivative positions. Furthermore, our derivative contracts are not subject to margin calls or similar accelerations. No significant uncertainties exist related to the collectability of amounts that may be owed to us by these counterparties.
81
8. | Property and Equipment |
The following table summarizes our property and equipment as of the dates presented:
December 31, | |||||||
2017 | 2016 | ||||||
Oil and gas properties: | |||||||
Proved | $ | 460,029 | $ | 251,083 | |||
Unproved | 117,634 | 4,719 | |||||
Total oil and gas properties | 577,663 | 255,802 | |||||
Other property and equipment | 12,712 | 3,575 | |||||
Total property and equipment | 590,375 | 259,377 | |||||
Accumulated depreciation, depletion and amortization | (61,316 | ) | (11,904 | ) | |||
$ | 529,059 | $ | 247,473 | ||||
Unproved property costs of $117.6 million and $4.7 million have been excluded from amortization as of December 31, 2017 and December 31, 2016, respectively. We transferred $40.4 million and $3.8 million of undeveloped leasehold costs, including capitalized interest, associated with proved undeveloped reserves, acreage unlikely to be drilled or expiring acreage, from unproved properties to the full cost pool during the year ended December 31, 2017 and Successor period ended December 31, 2016. We capitalized internal costs of $2.4 million and $0.5 million and interest of $2.7 million and less than $0.1 million during the year ended December 31, 2017 and the Successor period ended December 31, 2016, respectively, in accordance with our accounting policies. Average DD&A per barrel of oil equivalent of proved oil and gas properties was $12.87 for the year ended December 31, 2017, $11.21 for the Successor period from September 13, 2016 through December 31, 2016, $10.04 for the Predecessor period from January 1, 2016 through September 12, 2016 and $42.22 for the year ended December 31, 2015. The DD&A rate for the Predecessor periods was determined under the successful efforts method while the Successor periods subsequent to September 12, 2016 were determined under the full cost method (see Note 2).
9. | Asset Retirement Obligations |
The following table reconciles our AROs as of the dates presented, which are included in the “Other liabilities” caption on our Consolidated Balance Sheets:
Successor | Predecessor | |||||||||||
Year Ended | September 13 Through | January 1 Through | ||||||||||
December 31, | December 31, | September 12, | ||||||||||
2017 | 2016 | 2016 | ||||||||||
Balance at beginning of period | $ | 2,459 | $ | 2,687 | $ | 2,621 | ||||||
Fresh Start Accounting adjustment | — | — | (754 | ) | ||||||||
Changes in estimates | 118 | 27 | 176 | |||||||||
Liabilities incurred | 149 | — | 469 | |||||||||
Liabilities settled | (139 | ) | (311 | ) | — | |||||||
Purchase of properties | 494 | — | — | |||||||||
Accretion expense | 205 | 56 | 175 | |||||||||
Balance at end of period | $ | 3,286 | $ | 2,459 | $ | 2,687 | ||||||
82
10. | Long-Term Debt |
The following table summarizes our long-term debt as of the dates presented:
December 31, 2017 | December 31, 2016 | |||||||||||||||
Principal | Unamortized Discount and Issuance Costs 1 | Principal | Unamortized Discount and Issuance Costs 1 | |||||||||||||
Credit facility 2 | $ | 77,000 | $ | 25,000 | ||||||||||||
Second lien term loans | 200,000 | $ | 11,733 | — | $ | — | ||||||||||
Totals | 277,000 | 11,733 | 25,000 | — | ||||||||||||
Less: Unamortized discount | (3,839 | ) | — | |||||||||||||
Less: Unamortized deferred issuance costs | (7,894 | ) | — | |||||||||||||
Long-term debt, net | $ | 265,267 | $ | 25,000 | ||||||||||||
_____________________________________________
1 Discount and issuance costs of the Second Lien Facility are being amortized over the term of the underlying loan using the effective-interest method.
2 | Issuance costs of the Credit Facility, which represent costs attributable to the access to credit over its contractual term, have been presented as a component of Other assets (see Note 13) and are being amortized over the term of the Credit Facility using the straight-line method. |
Credit Facility
On the Emergence Date, we entered into the Credit Facility. As of March 1, 2018, the Credit Facility provides for a $340.0 million revolving commitment and borrowing base and a $5 million sublimit for the issuance of letters of credit. On March 1, 2018, we entered into the Master Assignment, Agreement and Amendment No. 4 to the Credit Facility (the “Fourth Amendment”) whereby the borrowing base was redetermined from $237.5 million to $340.0 million. In the year ended December 31, 2017, we paid and capitalized issue costs of $1.7 million in connection with three separate amendments to the Credit Facility and wrote-off $0.8 million of previously capitalized issue costs due to changes in the composition of financial institutions comprising the Credit Facility bank group associated with those amendments. The availability under the Credit Facility may not exceed the lesser of the aggregate commitments or the borrowing base. The borrowing base under the Credit Facility is generally redetermined semi-annually in April and October of each year. Additionally, the Credit Facility lenders may, at their discretion, initiate a redetermination at any time during the six-month period between scheduled redeterminations. The Spring 2018 redetermination was accelerated to March in connection with the Hunt Acquisition and became effective with the Fourth Amendment. The Credit Facility is available to us to pay expenses associated with our bankruptcy proceedings and for general corporate purposes including working capital. The Credit Facility matures in September 2020. We had $0.8 million in letters of credit outstanding as of December 31, 2017 and December 31, 2016.
The outstanding borrowings under the Credit Facility bear interest at a rate equal to, at our option, either (a) a customary reference rate plus an applicable margin ranging from 2.00% to 3.00%, determined based on the average availability under the Credit Facility or (b) a customary London interbank offered rate (“LIBOR”) plus an applicable margin ranging from 3.00% to 4.00%, determined based on the average availability under the Credit Facility. Interest on reference rate borrowings is payable quarterly in arrears and is computed on the basis of a year of 365/366 days, and interest on LIBOR borrowings is payable every one, three or six months, at the election of the borrower, and is computed on the basis of a year of 360 days. As of December 31, 2017, the actual interest rate on the outstanding borrowings under the Credit Facility was 4.78%. Unused commitment fees are charged at a rate of 0.50%.
The Credit Facility is guaranteed by us and all of our subsidiaries (the “Guarantor Subsidiaries”). The guarantees under the Credit Facility are full and unconditional and joint and several. Substantially all of our consolidated assets are held by the Guarantor Subsidiaries. The parent company has no material independent assets or operations. There are no significant restrictions on the ability of the parent company or any of the Guarantor Subsidiaries to obtain funds through dividends, advances or loans. The obligations under the Credit Facility are secured by a first priority lien on substantially all of our assets.
The Credit Facility requires us to maintain (1) a minimum interest coverage ratio (adjusted earnings before interest, taxes, depreciation, depletion, amortization and exploration expenses as defined in the Credit Facility (“EBITDAX”) to adjusted interest expense), measured as of the last day of each fiscal quarter, of 3.00 to 1.00, (2) a minimum current ratio (as defined in the Credit Facility, which considers the unused portion of the total commitment as a current asset), measured as of the last day of each fiscal quarter of 1.00 to 1.00, and (3) a maximum leverage ratio (consolidated indebtedness to EBITDAX), measured as of the last day of each fiscal quarter, on December 31, 2017 of 3.75 to 1.00 and decreasing on March 31, 2018 and thereafter to 3.50 to 1.00.
83
The Credit Facility also contains customary affirmative and negative covenants, including as to compliance with laws (including environmental laws, ERISA and anti-corruption laws), maintenance of required insurance, delivery of quarterly and annual financial statements, oil and gas engineering reports and budgets, maintenance and operation of property (including oil and gas properties), restrictions on the incurrence of liens and indebtedness, merger, consolidation or sale of assets, payment of dividends, and transactions with affiliates and other customary covenants.
As of December 31, 2017, and through the date upon which the Consolidated Financial Statements were issued, we were in compliance with all of the covenants under the Credit Facility.
Second Lien Facility
On September 29, 2017, we entered into the $200 million Second Lien Facility. We received net proceeds of $187.8 million from the Second Lien Facility net of an original issue discount (“OID”) of $4.0 million and issue costs of $8.2 million. The proceeds from the Second Lien Facility were used to fund the Devon Acquisition and related fees and expenses. The maturity date under the Second Lien Facility is September 29, 2022.
The outstanding borrowings under the Second Lien Facility bear interest at a rate equal to, at our option, either (a) a customary reference rate based on the prime rate plus an applicable margin of 6.00% or (b) a customary LIBOR rate plus an applicable margin of 7.00%. As of December 31, 2017, the actual interest rate of outstanding borrowings under the Second Lien Facility was 8.57%. Amounts under the Second Lien Facility were borrowed at a price of 98% with an initial interest rate of 8.34% resulting in an effective interest rate of 9.89%. Interest on reference rate borrowings is payable quarterly in arrears and is computed on the basis of a year of 365/366 days, and interest on eurocurrency borrowings is payable every one or three months (including in three month intervals if we select a six month interest period), at our election and is computed on the basis of a 360-day year. We have the right, to the extent permitted under the Credit Facility and an intercreditor agreement between the lenders under the Credit Facility and the lenders under the Second Lien Facility, to prepay loans under the Second Lien Facility at any time, subject to the following prepayment premiums (in addition to customary “breakage” costs with respect to eurocurrency loans): during year one, a customary “make-whole” premium; during year two, 102% of the amount being prepaid; during year three, 101% of the amount being prepaid; and thereafter, no premium. The Second Lien Facility also provides for the following prepayment premiums in the event of a change in control that results in an offer of prepayment that is accepted by the lenders under the Second Lien Facility: during years one and two, 102% of the amount being prepaid; during year three, 101% of the amount being prepaid; and thereafter, no premium.
The Second Lien Facility is collateralized by substantially all of the Company’s and its subsidiaries’ assets with lien priority subordinated to the liens securing the Credit Facility. The obligations under the Second Lien Facility are guaranteed by us and the Subsidiary Guarantors.
The Second Lien Facility has no financial covenants, but contains customary affirmative and negative covenants, including as to compliance with laws (including environmental laws, ERISA and anti-corruption laws), maintenance of required insurance, delivery of quarterly and annual financial statements, oil and gas engineering reports and budgets, maintenance and operation of property (including oil and gas properties), restrictions on the incurrence of liens and indebtedness, merger, consolidation or sale of assets and transactions with affiliates and other customary covenants.
As illustrated in the table above, the OID and issue costs of the Second Lien Facility are presented as reductions to the outstanding term loans. These costs are subject to amortization using the interest method over the five-year term of the Second Lien Facility.
As of December 31, 2017, and through the date upon which the Consolidated Financial Statements were issued, we were in compliance with all of the covenants under the Second Lien Facility.
Pre-Petition Credit Facility
As described in Note 4, our principal and interest obligations outstanding under the RBL as well as certain associated fees and expenses were satisfied in cash in full on the Emergence Date. These obligations were funded from a combination of cash on hand, proceeds from the Rights Offering and proceeds from initial borrowings under the Credit Facility.
2019 Senior Notes and 2020 Senior Notes
The Senior Notes were included in “Liabilities subject to compromise” on the Consolidated Balance Sheet of the Predecessor as of September 12, 2016 (see Note 4) and were included in “Current liabilities” as of December 31, 2015. As described in Note 4, the Senior Notes were canceled upon our emergence from bankruptcy.
84
11. | Income Taxes |
The following table summarizes our provision for income taxes for the periods presented:
Successor | Predecessor | |||||||||||||||
Year Ended | September 13 Through | January 1 Through | Year Ended | |||||||||||||
December 31, | December 31, | September 12, | December 31, | |||||||||||||
2017 | 2016 | 2016 | 2015 | |||||||||||||
Current income taxes (benefit) | ||||||||||||||||
Federal | $ | — | $ | — | $ | — | $ | (660 | ) | |||||||
State | — | — | — | 1 | ||||||||||||
— | — | — | (659 | ) | ||||||||||||
Deferred income taxes (benefit) | ||||||||||||||||
Federal | (4,943 | ) | — | — | (261 | ) | ||||||||||
State | — | — | — | (4,451 | ) | |||||||||||
(4,943 | ) | — | — | (4,712 | ) | |||||||||||
$ | (4,943 | ) | $ | — | $ | — | $ | (5,371 | ) | |||||||
The following table reconciles the difference between the income tax benefit computed by applying the statutory tax rate to our income (loss) before income taxes and our reported income tax benefit for the periods presented:
Successor | Predecessor | |||||||||||||||||||||||||||||
Year Ended | September 13 Through | January 1 Through | Year Ended | |||||||||||||||||||||||||||
December 31, | December 31, | September 12, | December 31, | |||||||||||||||||||||||||||
2017 | 2016 | 2016 | 2015 | |||||||||||||||||||||||||||
Computed at federal statutory rate | $ | 9,701 | 35.0 | % | $ | (1,854 | ) | 35.0 | % | $ | 369,111 | 35.0 | % | $ | (555,916 | ) | 35.0 | % | ||||||||||||
State income taxes, net of federal income tax benefit | (1,383 | ) | (5.0 | )% | 197 | (3.7 | )% | 1,989 | 0.2 | % | (4,438 | ) | 0.3 | % | ||||||||||||||||
Change in valuation allowance | (24,353 | ) | (87.8 | )% | 1,657 | (31.3 | )% | (384,692 | ) | (36.5 | )% | 554,879 | (35.0 | )% | ||||||||||||||||
Effect of rate change on the valuation allowance | (86,612 | ) | (312.5 | )% | — | — | — | — | % | — | — | % | — | — | % | |||||||||||||||
Effect of rate change | 86,612 | 312.5 | % | — | — | % | — | — | % | — | — | % | ||||||||||||||||||
Reorganization adjustments | 10,760 | 38.8 | % | — | — | % | 13,572 | 1.3 | % | — | — | % | ||||||||||||||||||
Other, net | 332 | 1.2 | % | — | — | % | 20 | — | % | 104 | — | % | ||||||||||||||||||
$ | (4,943 | ) | (17.8 | )% | $ | — | — | % | $ | — | — | % | $ | (5,371 | ) | 0.3 | % | |||||||||||||
The following table summarizes the principal components of our deferred income tax assets and liabilities as of the dates presented:
December 31, | ||||||||
2017 | 2016 | |||||||
Deferred tax assets: | ||||||||
Property and equipment | $ | 37,345 | $ | 183,303 | ||||
Pension and postretirement benefits | 452 | 710 | ||||||
Share-based compensation | 435 | 28 | ||||||
Net operating loss (“NOL”) carryforwards | 127,821 | 87,622 | ||||||
Fair value of derivative instruments | 8,752 | 9,579 | ||||||
Other | 7,608 | 7,166 | ||||||
182,413 | 288,408 | |||||||
Less: Valuation allowance | (177,470 | ) | (288,408 | ) | ||||
Net deferred tax assets | $ | 4,943 | $ | — | ||||
85
On December 22, 2017, the U.S. Congress enacted the budget reconciliation act commonly referred to as the Tax Cuts and Jobs Act (the “TCJA”). The TCJA makes broad and complex changes to the U.S. tax code, including but not limited to, (i) the requirement to pay a one-time transition tax on all undistributed earnings of foreign subsidiaries; (ii) reducing the U.S. federal corporate income tax rate from 35% to 21%; (iii) generally eliminating U.S. federal income taxes on dividends from foreign subsidiaries; (iv) creating a new limitation on deductible interest expense; (v) changing rules related to use and limitations of NOL carryforwards created in tax years beginning after December 31, 2017 and (vi) repeal of the corporate alternative minimum tax (“AMT”).
On that same date, the SEC staff also issued Staff Accounting Bulletin No. 118 (“SAB 118”), which provides guidance on accounting for the tax effects of the TCJA. SAB 118 provides a measurement period that should not extend beyond one year from the TCJA enactment date for companies to complete the accounting under the FASB’s Accounting Standards Codification (“ASC”) 740, Income Taxes (“ASC 740”). In accordance with SAB 118, a company must reflect the income tax effects of those aspects of the TCJA for which accounting under ASC 740 is complete. To the extent that a company’s accounting for certain income tax effects of the TCJA is incomplete but it is able to determine a reasonable estimate, it must record a provisional estimated in the financial statements. If the Company cannot determine a provisional estimate to be included in the financial statements, it should continue to apply ASC 740 on the basis of the provisions of the tax laws that were in effect immediately before the enactment of the TCJA.
In connection with our initial analysis of the impact of the TCJA, we recorded income tax charge of $86.6 million for the year ended December 31, 2017, which consists of a reduction of deferred tax assets previously valued at 35%. We recorded a corresponding decrease in our deferred tax asset valuation allowance representing an income tax benefit for the same amount. The reduction in the statutory U.S. federal rate is expected to positively impact the Company’s future US after tax earnings. As a result of the repeal of the AMT, we anticipate that our existing AMT credit carryovers will become refundable beginning with the 2018 tax year. The AMT credit carryforwards will be used to offset current year regular tax liabilities with 50 percent of any excess remaining credit per year being refundable as part of the annual income tax filing. We anticipate full utilization of the AMT credit carryforwards by 2021.
In addition to the aforementioned offsetting items with respect to the reduction in income tax rates, our income tax provision includes federal income taxes of $9.7 million applied at the statutory rate of 35% for 2017 and an adjustment of $10.8 million attributable to reductions in certain tax attributes of property and other adjustments of $0.3 million applied in connection with the filing of our 2016 income tax returns. These expenses were effectively offset by benefits attributable to the reduction in our deferred tax asset valuation allowance of $24.3 million and state income tax benefits of $1.4 million resulting in a net tax deferred benefit of $4.9 million. The tax benefit and the corresponding net deferred tax asset presented on our Consolidated Balance Sheet as of December 31, 2017 are exclusively attributable to the AMT credit carryforwards and the deferred tax asset effectively represent a noncurrent receivable of AMT credits to be applied in the future.
As of December 31, 2017, we had federal NOL carryforwards of approximately $385.7 million, which, if not utilized, expire between 2032 and 2037, and state NOL carryforwards of approximately $446.7 million, which expire between 2024 and 2037. Because of the change in ownership provisions of the Tax Reform Act of 1986, use of a portion of our federal and state NOL may be limited in future periods. As of December 31, 2017, we carried a valuation allowance against our federal and state deferred tax assets of $177.5 million. We incurred pre-tax income in 2017 which, when aggregated with the prior two years, resulted in a pre-tax loss for the three year period ended December 31, 2017. We considered both the positive and negative evidence in determining whether it was more likely than not that some portion or all of our deferred tax assets will be realized. Due to the TCJA, we are eligible for a full refund of our AMT credit carryforwards beginning with the tax year ended December 31, 2018. As noted above, the provision for the year ended December 31, 2017 includes a benefit of $4.9 million for deferred tax assets attributable to the AMT carryforwards while the valuation allowance related to other net deferred tax assets remains in full. The amount of deferred tax asset considered realizable could, however, be adjusted if estimates of future taxable income during the carryforward period are reduced or increased or if objective negative evidence in the form of cumulative losses is no longer present and additional weight is given to subjective evidence such as our projections for growth.
We had no liability for unrecognized tax benefits as of December 31, 2017 and 2016. There were no interest and penalty charges recognized during the years ended December 31, 2017, 2016 and 2015. Tax years from 2013 forward remain open for examination by the Internal Revenue Service and various state jurisdictions.
86
12. | Exit Activities |
During the Predecessor periods, we committed to a number of actions, or exit activities. The most significant of those activities were attributable to an overall reduction in the scope and scale of our organization during those periods and required payments to satisfy obligations associated with the underlying commitments. The following summarizes the most significant exit activities.
Reductions in Force
In connection with efforts to reduce our administrative costs, we took certain actions to reduce our total employee headcount. In 2016, we reduced our total employee headcount by 53 employees. We paid a total of $2.1 million, including $1.4 million in severance and termination benefits and $0.7 million in retention bonuses during the year ended December 31, 2016.
The costs associated with these reduction-in-force and retention actions are included as a component of our “General and administrative” expenses in our Consolidated Statements of Operations.
Drilling Rig Termination
In connection with the suspension of our 2016 drilling program in the Eagle Ford, we terminated a drilling rig contract and incurred $1.7 million in early termination charges. As this obligation represented a pre-petition liability of the Predecessor, it was discharged in connection with our emergence from bankruptcy and included in “Reorganization items, net” in our Consolidated Statements of Operations. The vendor recovered a portion of the amount in the form of Successor Common Stock.
Firm Transportation Obligation
We had a contractual obligation with a carrying value of $10.8 million for certain firm transportation capacity in the Appalachian region that was scheduled to expire in 2022 and, as a result of the sale of our natural gas assets in this region in 2012, we no longer had production available to satisfy this commitment. We originally recognized a liability in 2012 representing this obligation for the estimated discounted future net cash outflows over the remaining term of the contract. The accretion of the obligation through the Petition Date, net of any recoveries from periodic sales of our contractual capacity, was charged as an offset to “Other revenue” in our Consolidated Statement of Operations. In connection with our emergence from bankruptcy, we rejected the underlying contract and the obligation was included in “Reorganization items, net” in our Consolidated Statements of Operations. The vendor recovered a portion of the amount in the form of Successor Common Stock.
87
13. | Additional Balance Sheet Detail |
The following table summarizes components of selected balance sheet accounts as of the dates presented:
December 31, | ||||||||
2017 | 2016 | |||||||
Other current assets: | ||||||||
Tubular inventory and well materials | $ | 5,146 | $ | 2,125 | ||||
Prepaid expenses | 1,104 | 903 | ||||||
Other | — | — | ||||||
$ | 6,250 | $ | 3,028 | |||||
Other assets: | ||||||||
Deferred issuance costs of the Credit Facility | $ | 2,857 | $ | 2,785 | ||||
Deposit in escrow 1 | 3,210 | — | ||||||
Other | 2,440 | 2,544 | ||||||
$ | 8,507 | $ | 5,329 | |||||
Accounts payable and accrued liabilities: | ||||||||
Trade accounts payable | $ | 22,579 | $ | 9,825 | ||||
Drilling costs | 22,389 | 2,479 | ||||||
Royalties and revenue - related | 39,287 | 26,116 | ||||||
Compensation - related | 2,975 | 2,557 | ||||||
Interest | 223 | 55 | ||||||
Reserve for bankruptcy claims | 3,933 | 3,922 | ||||||
Other | 4,795 | 4,743 | ||||||
$ | 96,181 | $ | 49,697 | |||||
Other liabilities: | ||||||||
Asset retirement obligations | $ | 3,286 | $ | 2,459 | ||||
Defined benefit pension obligations | 971 | 1,025 | ||||||
Postretirement health care benefit obligations | 476 | 488 | ||||||
Other | 100 | 100 | ||||||
$ | 4,833 | $ | 4,072 | |||||
_____________________________________________
1 Represents amount remaining in the Escrow Account for the Devon Acquisition which will fully fund the remaining liability due to Devon for the final settlement (see Note 5).
14. | Fair Value Measurements |
We apply the authoritative accounting provisions for measuring fair value of both our financial and nonfinancial assets and liabilities. Fair value is an exit price representing the expected amount we would receive upon the sale of an asset or that we would expect to pay to transfer a liability in an orderly transaction with market participants at the measurement date.
We use a hierarchy that prioritizes the inputs we use to measure fair value into three distinct categories based upon whether such inputs are observable in active markets or unobservable. We classify assets and liabilities in their entirety based on the lowest level of input that is significant to the fair value measurement. Our methodology for categorizing assets and liabilities that are measured at fair value pursuant to this hierarchy gives the highest priority to unadjusted quoted prices in active markets and the lowest level to unobservable inputs as outlined below.
Fair value measurements are classified and disclosed in one of the following three categories:
• | Level 1: Unadjusted quoted prices in active markets that are accessible at the measurement date for identical, unrestricted assets or liabilities. Level 1 inputs generally provide the most reliable evidence of fair value. |
• | Level 2: Quoted prices in markets that are not active or inputs, which are observable, either directly or indirectly, for substantially the full term of the asset or liability. |
• | Level 3: Prices or valuation techniques that require inputs that are both significant to the fair value measurement and unobservable (i.e., supported by little or no market activity). |
88
Our financial instruments that are subject to fair value disclosure consist of cash and cash equivalents, accounts receivable, accounts payable, derivatives and long-term debt. Due to the short-term nature of their maturities, the carrying value of our cash and cash equivalents, accounts receivable and accounts payable approximate their fair value. Our derivatives are marked-to-market and presented at their values. The carrying value of our long-term debt, which includes the Credit Facility and the Second Lien Facility, approximated their fair values as they represent variable-rate debt and their interest rates are reflective of market rates.
Recurring Fair Value Measurements
Certain financial assets and liabilities are measured at fair value on a recurring basis on our Consolidated Balance Sheets. The following tables summarize the valuation of those assets and (liabilities) as of the dates presented:
December 31, 2017 | ||||||||||||||||
Fair Value | Fair Value Measurement Classification | |||||||||||||||
Description | Measurement | Level 1 | Level 2 | Level 3 | ||||||||||||
Liabilities: | ||||||||||||||||
Commodity derivative liabilities – current | $ | (27,777 | ) | $ | — | $ | (27,777 | ) | $ | — | ||||||
Commodity derivative liabilities – noncurrent | (13,900 | ) | — | (13,900 | ) | — | ||||||||||
December 31, 2016 | ||||||||||||||||
Fair Value | Fair Value Measurement Classification | |||||||||||||||
Description | Measurement | Level 1 | Level 2 | Level 3 | ||||||||||||
Liabilities: | ||||||||||||||||
Commodity derivative liabilities – current | $ | (12,932 | ) | $ | — | $ | (12,932 | ) | $ | — | ||||||
Commodity derivative liabilities – noncurrent | (14,437 | ) | — | (14,437 | ) | — | ||||||||||
Changes in economic conditions or model-based valuation techniques may require the transfer of financial instruments from one level of the fair value hierarchy to another level. In such instances, the transfer is deemed to have occurred at the beginning of the quarterly period in which the event or change in circumstances that caused the transfer occurred. There were no transfers during any period in the years ended December 31, 2017, 2016 and 2015.
We used the following methods and assumptions to estimate fair values for the financial assets and liabilities described below:
• | Commodity derivatives: We determine the fair values of our commodity derivative instruments based on discounted cash flows derived from third-party quoted forward prices for WTI and LLS crude oil and NYMEX Henry Hub gas closing prices as of the end of the reporting periods. We generally use the income approach, using valuation techniques that convert future cash flows to a single discounted value. Each of these is a level 2 input. |
Non-Recurring Fair Value Measurements
The most significant non-recurring fair value measurements utilized in the preparation of our Consolidated Financial Statements are those attributable to the recognition and measurement of the Successor’s net assets with respect to the application of Fresh Start Accounting. Those measurements are more fully described in Note 4. In addition, we utilize non-recurring fair value measurements with respect to the recognition and measurement of asset impairments, particularly during our Predecessor periods during which time we applied the successful efforts method to our oil and gas properties, as well as the initial determination of AROs associated with the ongoing development of new oil and gas properties.
The factors used to determine fair value for purposes of recognizing and measuring asset impairments while we applied the successful efforts method to our oil and gas properties during our Predecessor periods included, but were not limited to, estimates of proved and risk-adjusted probable reserves, future commodity prices, indicative sales prices for properties, the timing of future production and capital expenditures and a discount rate commensurate with the risk reflective of the lives remaining for the respective oil and gas properties. Because these significant fair value inputs were typically not observable, we have categorized the amounts as level 3 inputs. Under the full cost method, which we have applied since the Emergence Date, we apply a ceiling test determination utilizing prescribed procedures as described in Note 3. The full cost method is substantially different from the successful efforts method which relies upon fair value measurements.
The determination of the fair value of AROs is based upon regional market and facility specific information. The amount
of an ARO and the costs capitalized represent the estimated future cost to satisfy the abandonment obligation using current
prices that are escalated by an assumed inflation factor after discounting the future cost back to the date that the abandonment
obligation was incurred using a rate commensurate with the risk, which approximates our cost of funds. Because these
significant fair value inputs are typically not observable, we have categorized the initial estimates as level 3 inputs.
89
15. | Commitments and Contingencies |
The following table sets forth our significant commitments as of December 31, 2017, by category, for the next five years and thereafter:
Year | Minimum Rentals | Drilling and Completion | Gathering and Intermediate Transportation | Derivatives | Other Commitments | |||||||||||||||
2018 | $ | 241 | $ | 37,907 | $ | 10,376 | $ | 27,777 | $ | 157 | ||||||||||
2019 | 78 | — | 11,702 | 12,595 | 50 | |||||||||||||||
2020 | 47 | — | 12,962 | 1,305 | 50 | |||||||||||||||
2021 | — | — | 12,962 | — | 5 | |||||||||||||||
2022 | — | — | 12,962 | — | — | |||||||||||||||
Thereafter | — | — | 63,712 | — | — | |||||||||||||||
Total | $ | 366 | $ | 37,907 | $ | 124,676 | $ | 41,677 | $ | 262 | ||||||||||
Rental Commitments
Operating lease rental expense was $1.0 million, $0.2 million, $2.4 million and $7.2 million, for the year ended December 31, 2017, the Successor period from September 13, 2016 through December 31, 2016, the Predecessor period from January 1, 2016 through September 12, 2016, and the year ended December 31, 2015, related primarily to field equipment, office equipment and office leases.
Drilling and Completion Commitments
We had contractual commitments for two drilling rigs as of December 31, 2017. One rig began operations in September 2017 and is subject to a six-month commitment through March 2018. The second rig began operations in November 2017 and is also subject to a six-month commitment through May 2018. In December 2017, we entered into a one-year commitment to utilize certain frac services. We also have a one-year purchase commitment for certain proppant materials. Both the frac services and materials commitments are effective January 1, 2018.
Gathering and Intermediate Transportation Commitments
We have long-term agreements with Republic Midstream and Republic Midstream Marketing, LLC (“Republic Marketing” and, together with Republic Midstream, collectively, “Republic”) to provide gathering and intermediate pipeline transportation services for a substantial portion of our crude oil and condensate production in the South Texas region as well as volume capacity support for certain downstream interstate pipeline transportation.
In August 2016, the Bankruptcy Court approved a settlement with Republic and authorized the assumption of certain amended agreements with Republic (the “Amended Agreements”). We paid Republic $0.3 million in connection with the settlement which is included in “Reorganization items, net” in our Consolidated Statements of Operations.
Under the terms of the Amended Agreements, Republic is obligated to gather and transport our crude oil and condensate from within a dedicated area in the Eagle Ford (the “Dedication Area”) via a gathering system and intermediate takeaway pipeline connecting to a downstream interstate pipeline operated by a third party. The amended gathering agreement reduced our minimum volume commitment from 15,000 to 8,000 gross barrels of oil per day. The term of the amended gathering agreement runs through 2041, with the term of the minimum volume commitment extended from 10 to 15 years through 2031. The gathering portion of these minimum commitments are being recognized as a component of our gathering, processing and transportation expense while the intermediate transportation and pipeline support commitments are recognized as a reduction to the index-based price that we receive for crude oil sold to Republic in accordance with Amended Agreements.
Under the amended marketing agreement, we have a 10-year commitment to sell 8,000 barrels per day of crude oil (gross) to Republic, or any third party, utilizing Republic Marketing’s capacity on a certain downstream interstate pipeline.
Other Commitments
We have entered into certain contractual arrangements for other products and services. We have purchase commitments for certain materials as well as minimum commitments under information technology licensing and service agreements, among others.
90
Legal
We are involved, from time to time, in various legal proceedings arising in the ordinary course of business. While the ultimate results of these proceedings cannot be predicted with certainty, our management believes that these claims will not have a material effect on our financial position, results of operations or cash flows. During 2016, we reduced our reserve for a litigation matter to $0.1 million from $0.9 million due to our dismissal from the subject litigation.
Environmental Compliance
Extensive federal, state and local laws govern oil and gas operations, regulate the discharge of materials into the environment or otherwise relate to the protection of the environment. Numerous governmental departments issue rules and regulations to implement and enforce such laws that are often difficult and costly to comply with and which carry substantial administrative, civil and even criminal penalties for failure to comply. Some laws, rules and regulations relating to protection of the environment may, in certain circumstances, impose “strict liability” for environmental contamination, rendering a person liable for environmental and natural resource damages and cleanup costs without regard to negligence or fault on the part of such person. Other laws, rules and regulations may restrict the rate of oil and gas production below the rate that would otherwise exist or even prohibit exploration or production activities in sensitive areas. In addition, state laws often require some form of remedial action to prevent pollution from former operations, such as plugging of abandoned wells. As of December 31, 2017, we have recorded AROs of $3.3 million attributable to these activities. The regulatory burden on the oil and gas industry increases its cost of doing business and consequently affects its profitability. These laws, rules and regulations affect our operations, as well as the oil and gas exploration and production industry in general. We believe that we are in substantial compliance with current applicable environmental laws, rules and regulations and that continued compliance with existing requirements will not have a material impact on our financial condition or results of operations. Nevertheless, changes in existing environmental laws or the adoption of new environmental laws, including any significant limitation on the use of hydraulic fracturing, have the potential to adversely affect our operations.
16. | Shareholders’ Equity |
Preferred Stock
As discussed in Note 4, all of our Predecessor preferred stock was canceled upon our emergence from bankruptcy on the Emergence Date. As of December 31, 2017 and December 31, 2016, there were 5,000,000 Successor shares of preferred stock authorized with none issued or outstanding.
Common Stock
As discussed in Note 4, all our Predecessor common stock was canceled upon our emergence from bankruptcy on the Emergence Date and 14,992,018 shares of Successor Common Stock were issued with a par value of $0.01 per share. We have a total of 45,000,000 shares authorized. We do not anticipate that cash dividends or other distributions will be paid with respect to our common stock in the foreseeable future. In addition, our Credit Facility has restrictive covenants that limit our ability to pay dividends.
Accumulated Other Comprehensive Income
Accumulated other comprehensive income and losses are entirely attributable to our pension and postretirement health care benefit obligations. The accumulated other comprehensive income, net of tax, was less than $0.0 million, $0.1 million, less than $0.1 million and $0.4 million as of December 31, 2017, December 31, 2016, September 12, 2016 and December 31, 2015, respectively.
Treasury Stock
Shares of our Predecessor common stock held by the SERP and Predecessor deferred common stock units that had not been converted into Predecessor common stock were previously presented for financial reporting purposes as treasury stock carried at cost. As discussed above, all of the Predecessor common stock held by the SERP and Predecessor deferred common stock units were canceled upon our emergence from bankruptcy on the Emergence Date.
91
17. | Share-Based Compensation and Other Benefit Plans |
We recognize share-based compensation expense related to our share-based compensation plans as a component of “General and administrative” expense in our Consolidated Statements of Operations.
We reserved 749,600 shares of Successor Common Stock for issuance under the Penn Virginia Corporation Management Incentive Plan for future share-based compensation awards. A total of 304,981 time-vested restricted stock units (“RSUs”) and 98,526 performance restricted stock units (“PRSUs”) have been granted as of December 31, 2017.
In the Predecessor periods in 2016 and 2015, we had outstanding equity-classified awards in the form of stock options, restricted stock units and deferred stock units. As discussed in Note 4, all Predecessor equity-classified share-based compensation awards were canceled in connection with our emergence from bankruptcy.
With the exception of our Predecessor performance-based restricted stock units (“Predecessor PBRSUs”), all of our Successor and Predecessor share-based compensation awards are classified as equity instruments because they result in the issuance of common stock on the date of grant, upon exercise or are otherwise payable in common stock upon vesting, as applicable. The compensation cost attributable to these awards has been measured at the grant date and recognized over the applicable vesting periods as a non-cash item of expense. Because the Predecessor PBRSUs were payable in cash, they were considered liability-classified awards and were included in “Accounts payable and accrued liabilities” (current portion) and “Other liabilities” (noncurrent portion) on the Consolidated Balance Sheets of the Predecessor. Compensation cost associated with the Predecessor PBRSUs was measured at the end of each reporting period and recognized based on the period of time that had elapsed during each of the individual performance periods.
The following table summarizes our share-based compensation expense (benefit) recognized for the periods presented:
Successor | Predecessor | |||||||||||||||
Year Ended | September 13 Through | January 1 Through | Year Ended | |||||||||||||
December 31, | December 31, | September 12, | December 31, | |||||||||||||
2017 | 2016 | 2016 | 2015 | |||||||||||||
Equity-classified awards | $ | 3,809 | $ | 81 | $ | 1,511 | $ | 4,540 | ||||||||
Liability-classified awards | — | — | (19 | ) | (711 | ) | ||||||||||
$ | 3,809 | $ | 81 | $ | 1,492 | $ | 3,829 | |||||||||
Stock Options
The exercise price of all stock options granted under our Predecessor incentive compensation plans was equal to the fair value of our common stock on the date of the grant. Options could be exercised at any time after vesting and prior to ten years following the date of grant. Options vested upon terms established by the compensation and benefits committee of our Predecessor board of directors. Generally, options vested over a three-year period, with one-third vesting in each year.
The fair value of each option award was estimated on the date of grant using the Black-Scholes-Merton option-pricing formula. Expected volatilities were based on historical changes in the market value of our Predecessor common stock. Separate groups of employees that had similar historical exercise behavior were considered separately to estimate expected lives. Options granted had a maximum term of ten years. We based the risk-free interest rate on the U.S. Treasury rate for the week of the grant having a term equal to the expected life of the option.
The ranges for the assumptions used in the Black-Scholes-Merton pricing formula for the Predecessor stock options granted in the year ended December 31, 2015 were as follows:
Expected volatility | 64.6% to 69.4% |
Dividend yield | 0.00% to 0.00% |
Expected life | 3.5 to 4.6 years |
Risk-free interest rate | 0.87% to 1.54% |
The weighted-average grant-date fair value of options granted during the Predecessor year ended December 31, 2015 was $3.15 per option. There were no options exercised during 2015 and 2016. The total grant-date fair values of stock options that vested in the Predecessor year 2015 was $1.3 million.
In connection with our emergence from bankruptcy, all stock options outstanding as of September 12, 2016 were canceled.
92
Common Stock
A portion of the compensation paid to certain non-employee members of our Predecessor board of directors was paid in common stock. Each share of common stock granted as compensation vested immediately upon issuance. In 2015 we granted 195,395 shares of common stock to our non-employee directors at a weighted-average grant date fair value of $1.33 per share. No shares were granted to employees or directors during 2017 or the Successor or Predecessor periods in 2016.
In connection with our emergence from bankruptcy, all shares granted to the non-employee members of our Predecessor board of directors as of September 12, 2016 were canceled.
Deferred Common Stock Units
A portion of the compensation paid to certain non-employee members of our Predecessor board of directors was paid in deferred common stock units. Each deferred common stock unit represented one share of common stock, vested immediately upon issuance, and was available to the holder upon termination or retirement from our board of directors. Deferred common stock units awarded to directors received all cash or other dividends we paid on shares of our common stock.
As of December 31, 2015, our Predecessor shareholders’ deficit included deferred compensation obligations of $3.4 million and corresponding amounts for treasury stock.
In connection with our emergence from bankruptcy, all deferred common stock units outstanding as of September 12, 2016 were canceled.
Time-Vested Restricted Stock Units
A restricted stock unit entitles the grantee to receive a share of common stock upon the vesting of the restricted stock unit. The grant date fair value of our time-vested restricted stock unit awards are recognized on a straight-line basis over the applicable vesting period.
The following table summarizes activity for our most recent fiscal year with respect to awarded RSUs:
Restricted Stock Units | Weighted-Average Grant Date Fair Value | |||||
Balance as of January 1, 2017 | 107,563 | $ | 23.15 | |||
Granted | 197,418 | 48.41 | ||||
Vested | (35,854 | ) | 23.15 | |||
Forfeited | (9,137 | ) | 51.71 | |||
Balance as of December 31, 2017 | 259,990 | $ | 41.32 | |||
As of December 31, 2017, we had $8.9 million of unrecognized compensation cost attributable to RSUs. We expect that cost to be recognized over a weighted-average period of 1.9 years. The Predecessor total grant-date fair values of RSUs that vested in 2015 was $2.2 million. No RSUs vested during 2016.
In connection with our emergence from bankruptcy, all Predecessor RSUs outstanding as of September 12, 2016 were canceled.
Predecessor Performance-Based Restricted Stock Units
In each of the years ended December 31, 2015, 2014 and 2013, we granted Predecessor PBRSUs to certain executive officers. Vested Predecessor PBRSUs were payable solely in cash on the third anniversary of the date of grant based upon the achievement of specified market-based performance metrics with respect to each of a one-year, two-year and three-year performance period, in each case commencing on the date of grant. The number of Predecessor PBRSUs vested ranged from 0% to 200% of the initial grant. The Predecessor PBRSUs did not have voting rights and did not participate in dividends.
The compensation cost of the Predecessor PBRSUs was based on the fair value derived from a Monte Carlo model. The Monte Carlo model is a binomial valuation model that utilizes certain assumptions, including expected volatility, dividend yield, risk-free interest rates and a measure of total shareholder return.
The ranges for the assumptions used in the Monte Carlo model for the Predecessor PBRSUs granted in 2015 are presented as follows:
Expected volatility | 66.5% to 97.7% |
Dividend yield | 0.0% to 0.0% |
Risk-free interest rate | 0.01% to 1.31% |
In connection with our emergence of bankruptcy, all Predecessor PBRSUs outstanding as of September 12, 2016 were canceled.
93
Successor Performance Restricted Stock Units
In the year ended December 31, 2017, we granted 98,526 PRSUs to members of our management. The PRSUs were issued collectively in two to three separate tranches with individual three-year performance periods beginning in January 2017, 2018 and 2019, respectively. Vesting of the PRSUs can range from zero to 200% of the original grant based on the performance of our common stock relative to an industry index. Due to their market condition, the PRSUs are being charged to expense using graded vesting over a maximum of five years. The fair value of each PRSU award was estimated on their grant dates using a Monte Carlo simulation with a range of $47.70 to $65.28 per PRSU.
The ranges for the assumptions used in the Monte Carlo model for the PRSUs granted during 2017 are presented as follows:
Expected volatility | 59.63% to 62.18% |
Dividend yield | 0.0% to 0.0% |
Risk-free interest rate | 1.44% to 1.51% |
The following table summarizes activity for our most recent fiscal year with respect to PRSUs:
Performance Restricted Stock Units | Weighted-Average Fair Value | |||||
Balance as of January 1, 2017 | — | $ | — | |||
Granted | 98,526 | 57.81 | ||||
Forfeited | — | — | ||||
Canceled | — | $ | — | |||
Balance as of December 31, 2017 | 98,526 | $ | 57.81 | |||
Defined Contribution Plan
We maintain the Penn Virginia Corporation and Affiliated Companies Employees 401(k) Plan (the “401(k) Plan”), a defined contribution plan, which covers substantially all of our employees. We provide matching contributions on our employees’ elective deferral contributions up to six percent of compensation up to the maximum statutory limits. The 401(k) Plan also provides for discretionary employer contributions. The expense recognized with respect to the 401(k) Plan was $0.5 million, $0.1 million, $0.5 million and $0.9 million for the year ended December 31, 2017, the Successor period from September 13, 2016 through December 31, 2016, the Predecessor period from January 1, 2016 through September 12, 2016, and the year ended December 31, 2015, respectively, and is included as a component of “General and administrative expenses” in our Statements of Operations. Amounts representing accrued obligations to the 401(k) Plan of $0.2 million and $0.1 million are included in the “Accounts payable and accrued expenses” caption on our Consolidated Balance Sheets as of December 31, 2017 and 2016, respectively.
Defined Benefit Pension and Postretirement Health Care Plans
We maintain unqualified legacy defined benefit pension and defined benefit postretirement health care plans which cover a limited population of former employees that retired prior to January 1, 2000. The combined expense recognized with respect to these plans was $0.1 million, less than $0.1 million, less than $0.1 million and $0.1 million for the year ended December 31, 2017, the Successor period from September 13, 2016 through December 31, 2016, the Predecessor period from January 1, 2016 through September 12, 2016, and the year ended December 31, 2015, respectively, and is included as a component of “General and administrative expenses” in our Statements of Operations. The combined unfunded benefit obligations under these plans were $1.7 million and are included within the “Accounts payable and accrued expenses” (current portion) and “Other liabilities” (noncurrent) captions on our Consolidated Balance Sheets as of December 31, 2017 and 2016.
94
18. | Impairments |
The following table summarizes impairment charges recorded during the periods presented:
Successor | Predecessor | |||||||||||||||
Year Ended | September 13 Through | January 1 Through | Year Ended | |||||||||||||
December 31, | December 31, | September 12, | December 31, | |||||||||||||
2017 | 2016 | 2016 | 2015 | |||||||||||||
Oil and gas properties | $ | — | $ | — | $ | — | $ | 1,396,340 | ||||||||
Other – tubular inventory and well materials | — | — | — | 1,084 | ||||||||||||
$ | — | $ | — | $ | — | $ | 1,397,424 | |||||||||
The following table summarizes the aggregate fair values of the assets described below, by asset category and the classification of inputs within the fair value measurement hierarchy, at the respective dates of impairment:
Fair Value Measurement | Level 1 | Level 2 | Level 3 | ||||||||||||
Year Ended December 31, 2015 (Predecessor) | |||||||||||||||
Long-lived assets held for use | $ | 311,886 | $ | — | $ | — | $ | 311,886 | |||||||
We recorded no impairment charges during 2017 and 2016. The significant deterioration of commodity prices in 2015, as reflected in the future strip pricing as of December 31, 2015, triggered an impairment of approximately $1.4 billion to our proved and unproved Eagle Ford properties, which required us to reduce their carrying value to a fair value of approximately $312 million. In 2015, we also recorded an impairment charge of $1.1 million attributable to surplus tubular inventory and well materials.
19. | Interest Expense |
The following table summarizes the components of interest expense for the periods presented:
Successor | Predecessor | |||||||||||||||
Year Ended | September 13 Through | January 1 Through | Year Ended | |||||||||||||
December 31, | December 31, | September 12, | December 31, | |||||||||||||
2017 | 2016 | 2016 | 2016 | |||||||||||||
Interest on borrowings and related fees 1 | $ | 6,995 | $ | 678 | $ | 36,012 | $ | 92,490 | ||||||||
Accretion of original issue discount 2 | 161 | — | — | — | ||||||||||||
Amortization of debt issuance costs 3 | 1,961 | 226 | 22,189 | 4,749 | ||||||||||||
Capitalized interest | (2,725 | ) | (25 | ) | (183 | ) | (6,288 | ) | ||||||||
$ | 6,392 | $ | 879 | $ | 58,018 | $ | 90,951 | |||||||||
_____________________________________________
1 Absent the bankruptcy proceedings and the corresponding suspension of the accrual of interest on unsecured debt, we would have recorded total contractual interest expense of $66.1 million for the Predecessor period from January 1, 2016 through September 12, 2016, including $15.3 million attributable to the 2019 Senior Notes and $46.3 million attributable to the 2020 Senior Notes.
2 | Includes accretion of original issue discount attributable to the Second Lien Facility (see Note 10). |
3 | The year ended December 31, 2017 includes a total of $0.8 million of write-offs attributable to changes in the composition of financial institutions comprising the Credit Facility’s bank group in connection with amendments to the Credit Facility (see Note 10). The Predecessor period from January 1, 2016 through September 12, 2016 includes $20.5 million related to the accelerated write-off of unamortized debt issuance costs associated with the RBL and Senior Notes (see Note 10). |
95
20. | Earnings per Share |
The following table provides a reconciliation of the components used in the calculation of basic and diluted earnings per share utilizing the two-class method for the periods presented:
Successor | Predecessor | |||||||||||||||
Year Ended | September 13 Through | January 1 Through | Year Ended | |||||||||||||
December 31, | December 31, | September 12, | December 31, | |||||||||||||
2017 | 2016 | 2016 | 2015 | |||||||||||||
Net income (loss) | $ | 32,662 | $ | (5,296 | ) | $ | 1,054,602 | $ | (1,582,961 | ) | ||||||
Less: Preferred stock dividends 1 | — | — | (5,972 | ) | (22,789 | ) | ||||||||||
Net income (loss) attributable to common shareholders – basic and diluted | $ | 32,662 | $ | (5,296 | ) | $ | 1,048,630 | $ | (1,605,750 | ) | ||||||
Weighted-average shares – basic | 14,996 | 14,992 | 88,013 | 73,639 | ||||||||||||
Effect of dilutive securities 2 | 67 | — | 36,074 | — | ||||||||||||
Weighted-average shares – diluted | 15,063 | 14,992 | 124,087 | 73,639 | ||||||||||||
_____________________________________________
1 Preferred stock dividends were excluded from diluted earnings per share for the year ended December 31, 2015, as the assumed conversion of the outstanding preferred stock would have been anti-dilutive.
2 For the period from September 13, 2016 through December 31, 2016, less than 0.1 million potentially dilutive securities, represented by RSUs, had the effect of being anti-dilutive and were excluded from the calculation of diluted earnings per common share. For 2015, approximately 30.2 million potentially dilutive securities, including Predecessor Preferred Stock, stock options and RSUs had the effect of being anti-dilutive and were excluded from the calculation of diluted earnings per common share.
96
Supplemental Quarterly Financial Information (Unaudited)
Successor | |||||||||||||||
First Quarter | Second Quarter | Third Quarter | Fourth Quarter | ||||||||||||
2017 | |||||||||||||||
Revenues 1 | $ | 34,986 | $ | 36,282 | $ | 34,459 | $ | 54,327 | |||||||
Operating income | $ | 11,603 | $ | 11,441 | $ | 7,527 | $ | 21,240 | |||||||
Income (loss) attributable to common shareholders | $ | 28,081 | $ | 21,329 | $ | (5,947 | ) | $ | (10,801 | ) | |||||
Income (loss) per share – basic 2 | $ | 1.87 | $ | 1.42 | $ | (0.40 | ) | $ | (0.72 | ) | |||||
Income (loss) per share – diluted 2 | $ | 1.86 | $ | 1.42 | $ | (0.40 | ) | $ | (0.72 | ) | |||||
Weighted-average shares outstanding: | |||||||||||||||
Basic | 14,992 | 14,992 | 14,994 | 15,006 | |||||||||||
Diluted | 15,126 | 15,050 | 14,994 | 15,006 | |||||||||||
Predecessor | Successor | |||||||||||||||||||
First Quarter | Second Quarter | July 1, 2016 Through September 12, 2016 | September 13, 2016 Through September 30, 2016 | Fourth Quarter | ||||||||||||||||
2016 | ||||||||||||||||||||
Revenues 3 | $ | 30,497 | $ | 37,152 | $ | 26,661 | $ | 6,349 | $ | 32,654 | ||||||||||
Operating income (loss) 4 | $ | (12,507 | ) | $ | (614 | ) | $ | (7,735 | ) | $ | 1,137 | $ | 10,254 | |||||||
Income (loss) attributable to common shareholders 5 | $ | (36,625 | ) | $ | (64,800 | ) | $ | 1,150,055 | $ | (3,441 | ) | $ | (1,855 | ) | ||||||
Income (loss) per share – basic 2 | $ | (0.43 | ) | $ | (0.73 | ) | $ | 12.88 | $ | (0.23 | ) | $ | (0.12 | ) | ||||||
Income (loss) per share – diluted 2 | $ | (0.43 | ) | $ | (0.73 | ) | $ | 10.32 | $ | (0.23 | ) | $ | (0.12 | ) | ||||||
Weighted-average shares outstanding: | ||||||||||||||||||||
Basic | 85,941 | 89,051 | 89,292 | 14,992 | 14,992 | |||||||||||||||
Diluted | 85,941 | 89,051 | 111,458 | 14,992 | 14,992 | |||||||||||||||
_____________________________________________
1 | Includes gains (losses) on sales of assets of less than $0.1 million, $(0.1) million, less than $0.1 million and less than $0.1 million during the quarters ended March 31, 2017, June 30, 217, September 30, 2017 and December 31, 2017, respectively. |
2 The sum of the quarters may not equal the total of the respective year’s earnings per common share due to changes in weighted-average shares outstanding throughout the year.
3 Includes gains (losses) on sales of assets of $(0.2) million, $0.9 million, $0.5 million and less than $(0.1) million during the quarters ended March 31, 2016 and June 30, 2016, the period from July 1, 2016 through September 12, 2016 and the quarter ended December 31, 2016, respectively.
4 | The equity-classified share-based compensation expense included in the operating loss for the Predecessor periods from July 1, 2016 through September 12, 2016, includes an adjustment of $5.3 million to correct for an error that occurred in the reporting of equity-classified share-based compensation expense for the three months ended June 30, 2016. We have assessed the quantitative and qualitative factors with respect to this error as well as the effect of the correcting adjustment being recorded in the Predecessor period from July 1, 2016 through September 12, 2016 and determined that the amount and timing of the adjustment is not material to the Consolidated Financial Statements taken as a whole for any of the subject periods. |
5 | Includes reorganization items attributable to our bankruptcy proceedings of $7.4 million (expense) during the quarter ended June 30, 2016 and $1.152 billion (income) during the period from July 1, 2016 through September 12, 2016 (see Note 4). |
97
Supplemental Information on Oil and Gas Producing Activities (Unaudited)
Oil and Gas Reserves
All of our proved oil and gas reserves are located in the continental United States. The estimates of our proved oil and gas reserves as of December 31, 2017, 2016 and 2015 were prepared by our independent third party engineers, DeGolyer and MacNaughton, Inc. utilizing data compiled by us. Estimates of our proved oil and gas reserves as of December 31, 2014 were prepared by Wright & Company, Inc. DeGolyer and MacNaughton, Inc. and Wright & Company, Inc. are both independent firms of petroleum engineers, geologists, geophysicists and petrophysicists. Our Vice President, Engineering is primarily responsible for overseeing the preparation of the reserve estimate by DeGolyer and MacNaughton, Inc. and Wright & Company, Inc.
Reserve engineering is a process of estimating underground accumulations of oil and gas that cannot be measured in an exact manner, and the accuracy of any reserve estimate is a function of the quality of available data and of engineering and geological interpretation and judgment. The quantities of crude oil, NGLs and natural gas that are ultimately recovered, production and operating costs, the amount and timing of future development expenditures and future prices for these commodities may all differ from those assumed. In addition, reserve estimates of new discoveries are more imprecise than those of properties with a production history. Accordingly, these estimates are subject to change as additional information becomes available.
The following table sets forth our estimate of net quantities of proved reserves, including changes therein and proved developed and proved undeveloped reserves for the periods presented:
Oil | NGLs | Natural Gas | Total Equivalents | ||||||||
Proved Developed and Undeveloped Reserves | (MBbl) | (MBbl) | (MMcf) | (MBOE) | |||||||
December 31, 2014 (Predecessor) | 69,006 | 19,219 | 159,265 | 114,769 | |||||||
Revisions of previous estimates | (34,525 | ) | (8,667 | ) | (46,859 | ) | (51,002 | ) | |||
Extensions and discoveries | 2,519 | 321 | 1,584 | 3,105 | |||||||
Production | (4,923 | ) | (1,381 | ) | (9,713 | ) | (7,923 | ) | |||
Sale of reserves in place | (2,615 | ) | (2,288 | ) | (62,124 | ) | (15,258 | ) | |||
December 31, 2015 (Predecessor) | 29,462 | 7,204 | 42,153 | 43,691 | |||||||
Revisions of previous estimates | (1,359 | ) | (1,225 | ) | (8,661 | ) | (4,028 | ) | |||
Extensions and discoveries | 11,529 | 1,483 | 7,196 | 14,213 | |||||||
Production | (3,021 | ) | (697 | ) | (4,006 | ) | (4,386 | ) | |||
December 31, 2016 (Successor) | 36,611 | 6,765 | 36,682 | 49,490 | |||||||
Revisions of previous estimates | (5,735 | ) | (2,071 | ) | (10,468 | ) | (9,550 | ) | |||
Extensions and discoveries | 23,850 | 3,571 | 16,840 | 30,228 | |||||||
Production | (2,764 | ) | (523 | ) | (2,949 | ) | (3,779 | ) | |||
Purchase of reserves | 3,867 | 1,122 | 7,162 | 6,183 | |||||||
December 31, 2017 (Successor) | 55,829 | 8,864 | 47,267 | 72,572 | |||||||
Proved Developed Reserves: | |||||||||||
December 31, 2015 (Predecessor) | 20,188 | 6,201 | 37,172 | 32,585 | |||||||
December 31, 2016 (Successor) | 17,734 | 4,335 | 24,899 | 26,219 | |||||||
December 31, 2017 (Successor) | 22,412 | 4,882 | 27,229 | 31,832 | |||||||
Proved Undeveloped Reserves: | |||||||||||
December 31, 2015 (Predecessor) | 9,274 | 1,003 | 4,981 | 11,106 | |||||||
December 31, 2016 (Successor) | 18,877 | 2,430 | 11,783 | 23,271 | |||||||
December 31, 2017 (Successor) | 33,417 | 3,982 | 20,038 | 40,740 | |||||||
98
The following is a discussion and analysis of the significant changes in our proved reserve estimates for the periods presented:
Year Ended December 31, 2017
We had downward revisions of 9.6 MMBOE, substantially all of which are attributable to the Eagle Ford, as a result of the following: (i) downward revisions of 6.5 MMBOE due primarily to reduced treatable lateral lengths in certain locations due primarily to reconfiguration of the planned drilling units partially offset by improved performance, (ii) downward revisions of 4.7 MMBOE to our proved undeveloped reserves due to the loss of certain locations resulting from changes in the timing and drilling locations attributable to our development plans partially offset by (iii) 1.6 MMBOE due to improved well performance. Extensions and discoveries of 30.2 MMBOE are entirely attributable to our expanded development plan for the Eagle Ford including adding a third rig to our drilling program and the corresponding increase in the number of drilling locations that we are planning to drill in the next five years. We acquired 6.2 MMBOE, as measured on the closing date of the transaction, in connection with the Devon Acquisition. An additional 1.0 MMBOE attributable to the Devon Acquisition was determined in our year-end assessment consistent with our development plans and is included in the aforementioned extensions and discoveries.
Year Ended December 31, 2016
We had downward revisions of 4.0 MMBOE primarily as a result of the following: (i) downward revisions of 1.7 MMBOE due to lower EURs for natural gas and NGLs net of higher expected crude oil recoveries attributable to our existing and new Eagle Ford wells, (ii) downward revisions of 1.3 MMBOE to our proved undeveloped reserves, all of which are located in the Eagle Ford, due to the loss of certain locations resulting from changes in the timing of our development plans and lower EURs, (iii) downward revisions of 0.7 MMBOE (Granite Wash - 0.4 MMBOE and Eagle Ford 0.3 MMBOE) due to lower commodity prices compared to year-end 2015 and (iv) downward revisions of 0.3 MMBOE to our Granite Wash wells due to well performance. Extensions and discoveries of 14.2 MMBOE for our proved undeveloped reserves were attributable primarily to the resumption of our development plans in the Eagle Ford.
Year Ended December 31, 2015
We had downward revisions of 51.0 MMBOE primarily as a result of the following: (i) downward revisions of 45.2 MMBOE due to the removal of proved undeveloped locations that would not be developed within five years primarily in the Eagle Ford, (ii) downward revisions of 2.9 MMBOE attributable to certain proved wells in the Eagle Ford and (iii) downward revisions of 2.5 MMBOE due to well performance issues, primarily in the Granite Wash in Oklahoma. We added 3.1 MMBOE due primarily to the drilling of 61 gross (38.6 net) wells and the addition of proved undeveloped locations in the Eagle Ford. We sold our Cotton Valley and Haynesville Shale assets in East Texas as well as certain non-core Eagle Ford wells resulting in a decrease of 15.3 MMBOE.
Capitalized Costs Relating to Oil and Gas Producing Activities
The following table sets forth capitalized costs related to our oil and gas producing activities and accumulated DD&A for the periods presented:
Successor | Predecessor | |||||||||||||||
December 31, | September 12, | December 31, | ||||||||||||||
2017 | 2016 | 2016 | 2015 | |||||||||||||
Oil and gas properties: | ||||||||||||||||
Proved | $ | 460,029 | $ | 251,083 | $ | 241,597 | $ | 2,678,415 | ||||||||
Unproved | 117,634 | 4,719 | 8,338 | 6,881 | ||||||||||||
Total oil and gas properties | 577,663 | 255,802 | 249,935 | 2,685,296 | ||||||||||||
Other property and equipment | 10,057 | 1,230 | 1,229 | 11,330 | ||||||||||||
Total capitalized costs relating to oil and gas producing activities | 587,720 | 257,032 | 251,164 | 2,696,626 | ||||||||||||
Accumulated depreciation and depletion | (60,247 | ) | (11,669 | ) | — | (2,354,405 | ) | |||||||||
Net capitalized costs relating to oil and gas producing activities 1 | $ | 527,473 | $ | 245,363 | $ | 251,164 | $ | 342,221 | ||||||||
_____________________________________________
1 Excludes property and equipment attributable to our corporate operations which is comprised of certain capitalized hardware, software and office furniture and fixtures.
99
Costs Incurred in Certain Oil and Gas Activities
The following table summarizes costs incurred in our oil and gas property acquisition, exploration and development activities for the periods presented:
Successor | Predecessor | |||||||||||||||
September 13 | January 1 | |||||||||||||||
Year Ended | Through | Through | Year Ended | |||||||||||||
December 31, | December 31, | September 12, | December 31, | |||||||||||||
2017 | 2016 | 2016 | 2015 | |||||||||||||
Development and other costs 1 | $ | 132,969 | $ | 4,887 | $ | 4,129 | $ | 294,445 | ||||||||
Proved property acquisition costs 2 | 42,397 | — | — | — | ||||||||||||
Unproved property acquisition costs 3 | 151,180 | — | — | 16,052 | ||||||||||||
Exploration costs 4 | 696 | 567 | 8,311 | 939 | ||||||||||||
Total costs incurred 5 | $ | 327,242 | $ | 5,454 | $ | 12,440 | $ | 311,436 | ||||||||
_____________________________________________
1 Does not include non-cash ARO assets of $0.3 million, $.0.1 million, $0.6 million and $0.3 million that were added to capitalized costs relating to oil and gas producing activities during the year ended December 31, 2017, the Successor period ended December 31, 2016, the Predecessor period ended September 12, 2016 and the year ended December 31, 2015, respectively.
2 Represents costs for proved properties acquired in the Devon Acquisition excluding acquired non-cash ARO assets of $0.5 million.
3 Includes costs for unproved properties acquired in the Devon Acquisition of $146.7 million.
4 Includes geological and geophysical costs and delay rentals of $0.7 million for the year ended December 31, 2017, $0.6 million for the Successor period ended December 31, 2016, less than $0.1 million for the Predecessor period ended September 12, 2016 and $0.9 million during the year ended December 31, 2015, respectively. Also includes drilling rig termination charges of $1.7 million and $5.9 million during the Predecessor period ended September 12, 2016 and the year ended December 31, 2015, respectively, a $2.0 million charge for failure to complete a drilling carry commitment, a $0.6 million charge for unutilized coiled tubing services and a $4.0 million write-off of certain uncompleted well costs during the Predecessor period ended September 12, 2016, all of which were charged to exploration expense.
5 Excludes capitalized interest of $2.7 million, less than $0.1 million, $0.2 million and $6.3 million during the year ended December 31, 2017, the Successor period ended December 31, 2016, the Predecessor period ended September 12, 2016 and the year ended December 31, 2015, respectively. Also excludes $2.4 million and $0.5 million of capitalized internal costs for the year ended December 31, 2017 and the Successor period ended December 31, 2016, respectively, during which periods we applied the full cost method. We did not capitalize such internal costs while we applied the successful efforts method during the Predecessor periods.
Standardized Measure of Discounted Future Net Cash Flows Relating to Proved Oil and Gas Reserves
Future cash inflows were computed by applying the average prices of oil and gas during the 12-month period prior to the period end, determined as an unweighted arithmetic average of the first-day-of-the-month price for each month within the period and estimated costs as of that fiscal year end, to the estimated future production of proved reserves. Future prices actually received may materially differ from current prices or the prices used in the standardized measure.
Future production and development costs represent the estimated future expenditures (based on current costs) to be incurred in developing and producing the proved reserves, assuming continuation of existing economic conditions. Future income tax expenses were computed by applying statutory income tax rates to the difference between pre-tax net cash flows relating to our proved reserves and the tax basis of proved oil and gas properties. In addition, the effects of statutory depletion in excess of tax basis, available NOL carryforwards and alternative minimum tax credits were used in computing future income tax expense. The resulting annual net cash inflows were then discounted using a 10% annual rate.
The standardized measure of discounted future net cash flows is not intended, and should not be interpreted, to represent the fair value of our oil and gas reserves. An estimate of the fair value would also consider, among other things, the recovery of reserves not presently classified as proved, anticipated future changes in prices and cost, and a discount factor more representative of economic conditions and risks inherent in reserve estimates. Accordingly, the changes in standardized measure reflected above do not necessarily represent the economic reality of such transactions.
100
Crude oil and natural gas prices were based on average (beginning of month basis) sales prices per Bbl and MMBtu with the representative price of natural gas adjusted for basis premium and energy content to arrive at the appropriate net price. NGL prices were estimated as a percentage of the base crude oil price.
The following table summarizes the price measurements utilized, by product, with respect to our estimates of proved reserves as well as in the determination of the standardized measure of the discounted future net cash flows for the periods presented:
Crude Oil | NGLs | Natural Gas | |||||||||
$ per Bbl | $ per Bbl | $ per MMBtu | |||||||||
As of December 31, 2015 1 | $ | 50.28 | $ | 14.44 | $ | 2.70 | |||||
As of December 31, 2016 1 | $ | 42.75 | $ | 12.33 | $ | 2.48 | |||||
As of December 31, 2017 1 | $ | 51.34 | $ | 18.48 | $ | 2.98 | |||||
_____________________________________________
1 Crude oil and natural gas prices were based on average (beginning of month basis) sales prices per Bbl and MMBtu. The representative prices of crude oil and natural gas as adjusted for basis differentials and product quality were as follows: Crude oil - $50.06, $40.97 and $45.78 each per barrel. NGLs - $18.02, $11.82 and $13.15 each per barrel and Natural gas - $2.89, $2.40 and $2.59 each per MMBtu, as of December 31, 2017, 2016 and 2015, respectively. NGL prices were estimated as a percentage of the base crude oil price.
The following table sets forth the standardized measure of the discounted future net cash flows attributable to our proved reserves for the periods presented:
December 31, | |||||||||||
2017 | 2016 | 2015 | |||||||||
Future cash inflows | $ | 3,091,366 | $ | 1,667,971 | $ | 1,557,246 | |||||
Future production costs | (1,069,910 | ) | (673,538 | ) | (731,951 | ) | |||||
Future development costs | (689,998 | ) | (327,213 | ) | (206,616 | ) | |||||
Future net cash flows before income tax | 1,331,458 | 667,220 | 618,679 | ||||||||
Future income tax expense | (84,350 | ) | — | — | |||||||
Future net cash flows | 1,247,108 | 667,220 | 618,679 | ||||||||
10% annual discount for estimated timing of cash flows | (656,624 | ) | (349,670 | ) | (295,368 | ) | |||||
Standardized measure of discounted future net cash flows | $ | 590,484 | $ | 317,550 | $ | 323,311 | |||||
Changes in Standardized Measure of Discounted Future Net Cash Flows Relating to Proved Oil and Gas Reserves
The following table summarizes the changes in the standardized measure of the discounted future net cash flows attributable to our proved reserves for the periods presented:
Year Ended December 31, | |||||||||||
2017 | 2016 | 2015 | |||||||||
Sales of oil and gas, net of production costs | $ | (118,137 | ) | $ | (89,080 | ) | $ | (180,455 | ) | ||
Net changes in prices and production costs | 170,488 | (11,971 | ) | (1,442,919 | ) | ||||||
Changes in future development costs | 30,692 | 59,266 | 1,376,226 | ||||||||
Extensions and discoveries | 131,060 | 35,321 | 19,396 | ||||||||
Development costs incurred during the period | 74,880 | 6,775 | 222,612 | ||||||||
Revisions of previous quantity estimates | (122,357 | ) | (38,151 | ) | (436,898 | ) | |||||
Purchases of reserves-in-place | 80,878 | — | — | ||||||||
Sale of reserves-in-place | — | — | (86,662 | ) | |||||||
Changes in production rates | 12,161 | (252 | ) | (767,689 | ) | ||||||
Accretion of discount | 31,755 | 32,331 | 147,245 | ||||||||
Net change in income taxes | (18,486 | ) | — | 290,010 | |||||||
Net increase (decrease) | 272,934 | (5,761 | ) | (859,134 | ) | ||||||
Beginning of year | 317,550 | 323,311 | 1,182,445 | ||||||||
End of year | $ | 590,484 | $ | 317,550 | $ | 323,311 | |||||
101
Item 9 | Changes in and Disagreements With Accountants on Accounting and Financial Disclosure |
Not applicable.
Item 9A | Controls and Procedures |
(a) Disclosure Controls and Procedures
Our management, with the participation of our Chief Executive Officer and our Chief Financial Officer, evaluated the effectiveness of our disclosure controls and procedures (as defined in Rule 13a-15(e) of the Exchange Act) as of December 31, 2017. Our disclosure controls and procedures are designed to ensure that information required to be disclosed by us in the reports we file or submit under the Exchange Act is recorded, processed, summarized and reported within the time periods specified in the Securities and Exchange Commission’s rules and forms, and that such information is accumulated and communicated to the issuer’s management, including our Chief Executive Officer and our Chief Financial Officer, as appropriate to allow timely decisions regarding required disclosure. Based on that evaluation, our Chief Executive Officer and our Chief Financial Officer concluded that, as of December 31, 2017, such disclosure controls and procedures were effective.
(b) Management’s Annual Report on Internal Control Over Financial Reporting
Our management is responsible for establishing and maintaining adequate internal control over our financial reporting. Our management assessed the effectiveness of our internal control over financial reporting as of December 31, 2017. This evaluation was completed based on the framework established in Internal Control—Integrated Framework (2013) issued by the Committee of Sponsoring Organizations of the Treadway Commission.
Based on that assessment, our management has concluded that, as of December 31, 2017, our internal control over financial reporting was effective.
(c) Attestation Report of the Registered Public Accounting Firm
Grant Thornton LLP, the independent registered public accounting firm that audited and reported on the consolidated financial statements contained in this Form 10-K, has issued an attestation report on the internal control over financial reporting as of December 31, 2017, which is included in Item 8 of this Annual Report on Form 10-K.
(d) Changes in Internal Control Over Financial Reporting
No changes were made in our internal control over financial reporting that occurred during our last fiscal quarter that have materially affected, or are reasonably likely to materially affect, our internal control over financial reporting.
Item 9B | Other Information |
None.
102
Part III
Item 10 | Directors, Executive Officers and Corporate Governance |
In accordance with General Instruction G(3), reference is hereby made to the Company’s definitive proxy statement to be filed within 120 days after the end of the fiscal year covered by this Annual Report on Form 10-K.
We have adopted a Code of Business Conduct and Ethics that applies to all of our directors, officer and employees,
including our principal executive, principal financial and principal accounting officers, or persons performing similar
functions. Our Code of Business Conduct and Ethics is posted on our website located at
https://ir.pennvirginia.com/governance-docs. We intend to disclose future amendments to certain provisions of the Code of
Business Conduct and Ethics, and waivers of the Code of Business Conduct and Ethics granted to executive officers and
directors, on the website within four business days following the date of the amendment or waiver.
Item 11 | Executive Compensation |
In accordance with General Instruction G(3), reference is hereby made to the Company’s definitive proxy statement to be filed within 120 days after the end of the fiscal year covered by this Annual Report on Form 10-K.
Item 12 Security Ownership of Certain Beneficial Owners and Management and Related Stockholder Matters
In accordance with General Instruction G(3), reference is hereby made to the Company’s definitive proxy statement to be filed within 120 days after the end of the fiscal year covered by this Annual Report on Form 10-K.
Item 13 | Certain Relationships and Related Transactions, and Director Independence |
In accordance with General Instruction G(3), reference is hereby made to the Company’s definitive proxy statement to be filed within 120 days after the end of the fiscal year covered by this Annual Report on Form 10-K.
Item 14 | Principal Accountant Fees and Services |
In accordance with General Instruction G(3), reference is hereby made to the Company’s definitive proxy statement to be filed within 120 days after the end of the fiscal year covered by this Annual Report on Form 10-K.
103
Part IV
Item 15 | Exhibits and Financial Statement Schedules |
The following documents are included as exhibits to this Annual Report on Form 10-K. Those exhibits incorporated by reference are indicated as such in the parenthetical following the description. All other exhibits are included herewith.
(1) | Financial Statements — The financial statements filed herewith are listed in the Index to Consolidated Financial Statements on page 58 of this Annual Report on Form 10-K. |
(2.1) | Second Amended Joint Chapter 11 Plan of Reorganization of Penn Virginia Corporation and Its Debtor Affiliates (Technical Modifications) filed pursuant to Chapter 11 of the United States Bankruptcy Code filed on August 10, 2016 with the United States Bankruptcy Court for the Eastern Division of Virginia, Richmond Division (incorporated by reference to Exhibit 2.1 to Registrant’s Current Report on Form 8-K filed on August 17, 2016). |
(2.2) | Disclosure Statement for the First Amended Joint Chapter 11 Plan of Reorganization of Penn Virginia Corporation and Its Debtor Affiliates and Amended Exhibits Thereto filed pursuant to Chapter 11 of the United States Bankruptcy Code filed on June 24, 2016 with the United States Bankruptcy Court for the Eastern Division of Virginia, Richmond Division (incorporated by reference to Exhibit 2.2 to Registrant’s Current Report on Form 8-K filed on August 17, 2016). |
(3.1) | Second Amended and Restated Articles of Incorporation of Penn Virginia Corporation (incorporated by reference to Exhibit 3.1 to Registrant’s Current Report on Form 8-K filed on September 15, 2016). |
(3.2) | Third Amended and Restated Bylaws of Penn Virginia Corporation (incorporated by reference to Exhibit 3.1 to Registrant’s Current Report on Form 8-K filed on January 19, 2018). |
(10.1) | Credit Agreement, dated as of September 12, 2016, by and among Penn Virginia Holding Corp., Penn Virginia Corporation, the lenders party thereto and Wells Fargo Bank, National Association, as administrative agent and issuing lender (incorporated by reference to Exhibit 10.1 to Registrant’s Current Report on Form 8-K filed on September 15, 2016). |
(10.1.1) | Amendment No. 1 to Credit Agreement dated as of March 10, 2017 among Penn Virginia Holding Corp., Penn Virginia Corporation, the guarantors and lenders party thereto and Wells Fargo Bank, National Association, as administrative agent and issuing lender (incorporated by reference to Exhibit 10.1.1 to Registrant’s Registration Statement on Form S-3/A (Amendment No. 2) filed on May 2, 2017). |
(10.1.2) | Master Assignment, Agreement and Amendment No. 2 to Credit Agreement dated as of June 27, 2017 among Penn Virginia Holding Corp., as borrower, Penn Virginia Corporation, as parent, the subsidiaries of the borrower party thereto, the lenders and New Lenders party thereto and Wells Fargo Bank, National Association, as administrative agent and issuing lender (incorporated by reference to Exhibit 10.1 to Registrant’s Current Report on Form 8-K filed on June 30, 2017). |
(10.1.3) | Master Assignment, Agreement and Amendment No. 3 to Credit Agreement dated as of September 29, 2017 among Penn Virginia Holding Corp., as borrower, Penn Virginia Corporation, as parent, the subsidiaries of the borrower party thereto, the lenders party thereto and Wells Fargo Bank, National Association, as administrative agent and issuing lender (incorporated by reference to Exhibit 10.1 to Registrant’s Current Report on Form 8-K filed on October 5, 2017). |
(10.2) | Pledge and Security Agreement, dated as of September 12, 2016, by Penn Virginia Holding Corp., Penn Virginia Corporation and the other grantors party thereto in favor of Wells Fargo Bank, National Association, as administrative agent for the benefit of the secured parties thereunder (incorporated by reference to Exhibit 10.2 to Registrant’s Current Report on Form 8-K filed on September 15, 2016). |
(10.3) | Registration Rights Agreement, dated as of September 12, 2016 between Penn Virginia Corporation and the holders party thereto (incorporated by reference to Exhibit 10.3 to Registrant’s Current Report on Form 8-K filed on September 15, 2016). |
(10.4) | Credit Agreement, dated as of September 29, 2017, by and among Penn Virginia Holding Corp., as borrower, Penn Virginia Corporation, the lenders party thereto and Jefferies Finance LLC, as administrative agent, collateral agent and sole lead arranger (incorporated by reference to Exhibit 10.2 to Registrant’s Current Report on Form 8-K filed on October 5, 2017). |
(10.5) | Pledge and Security Agreement, dated as of September 29, 2017, by Penn Virginia Holding Corp., Penn Virginia Corporation and the other grantors party thereto in favor of Jefferies Finance LLC, as administrative agent and collateral agent for the ratable benefit of the secured parties thereunder (incorporated by reference to Exhibit 10.3 to Registrant’s Current Report on Form 8-K filed on October 5, 2017). |
(10.6) | Intercreditor Agreement, dated as of September 29, 2017, by and among Penn Virginia Holding Corp., Penn Virginia Corporation, the subsidiaries of Penn Virginia Holding Corp. party thereto, Wells Fargo Bank, National Association and Jefferies Finance LLC (incorporated by reference to Exhibit 10.4 to Registrant’s Current Report on Form 8-K filed on October 5, 2017). |
(10.7) | Purchase and Sale Agreement by and between Devon Energy Production Company, L.P. as seller, and Penn Virginia Oil & Gas, L.P. as buyer dated as of July 29, 2017 (incorporated by reference to Exhibit 10.5 to Registrant’s Quarterly Report on Form 10-Q filed on November 9, 2017). |
(10.8) # | Purchase and Sale Agreement by and between Hunt Oil Company and Penn Virginia Oil and Gas, L.P. dated December 30, 2017. |
(10.9) | Second Amended and Restated Construction and Field Gathering Agreement by and between Republic Midstream, LLC and Penn Virginia Oil & Gas, L.P. dated August 1, 2016 (incorporated by reference to Exhibit 10.5 to Registrant’s Quarterly Report on Form 10-Q/A filed on November 28, 2016). |
104
(10.9.1) | Amendment No. 1 to the Second Amended and Restated Construction and Field Gathering Agreement dated as of April 13, 2017 but effective August 1, 2016 by and between Republic Midstream, LLC and Penn Virginia Oil & Gas, L.P. (incorporated by reference to Exhibit 10.4.1 to Registrant’s Registration Statement on Form S-3/A (Amendment No. 2) filed on May 2, 2017). |
(10.10) | First Amended and Restated Crude Oil Marketing Agreement dated as of August 1, 2016, by and between Penn Virginia Oil & Gas, L.P., Republic Midstream Marketing, LLC and solely for purposes of Article V therein, Penn Virginia Corporation (incorporated by reference to Exhibit 10.6 to Registrant’s Quarterly Report on Form 10-Q/A filed on November 28, 2016). |
(10.11)* | Hartman Employment Agreement dated May 9, 2016 (incorporated by reference to Exhibit 10.4 to Registrant’s Current Report on Form 8-K filed on May 13, 2016). |
(10.12)* | Penn Virginia Corporation 2016 Management Incentive Plan (incorporated by reference to Exhibit 10.1 to Registrant’s Current Report on Form 8-K filed on October 11, 2016). |
(10.12.1)* | Form of Nonqualified Stock Option Award Agreement (incorporated by reference to Exhibit 10.2 to Registrant’s Current Report on Form 8-K filed on October 11, 2016). |
(10.12.2)* | Form of Officer Restricted Stock Unit Award Agreement (incorporated by reference to Exhibit 10.1 to Registrant’s Current Report on Form 8-K filed on January 30, 2017). |
(10.12.3)* | Form of Performance Restricted Stock Unit Award Agreement (incorporated by reference to Exhibit 10.2 to Registrant’s Current Report on Form 8-K filed on January 30, 2017). |
(10.12.4)* | Form of Director Restricted Stock Award Agreement (incorporated by reference to Exhibit 10.1 to Registrant’s Current Report on Form 8-K filed on December 21, 2016). |
(10.13) | Form of Director Indemnification Agreement (incorporated by reference to Exhibit 10.6 to Registrant’s Current Report on Form 8-K filed on October 11, 2016). |
(21.1) # | Subsidiaries of Penn Virginia Corporation. |
(23.1) # | Consent of Grant Thornton LLP. |
(23.2) # | Consent of KPMG LLP. |
(23.3) # | Consent of DeGolyer and MacNaughton. |
(23.4) # | Consent of Wright & Company, Inc. |
(31.1) # | Certification Pursuant to 18 U.S.C. Section 1350, as Adopted Pursuant to Section 302 of the Sarbanes-Oxley Act of 2002. |
(31.2) # | Certification Pursuant to 18 U.S.C. Section 1350, as Adopted Pursuant to Section 302 of the Sarbanes-Oxley Act of 2002. |
(32.1) † | Certification Pursuant to 18 U.S.C. Section 1350, as Adopted Pursuant to Section 906 of the Sarbanes-Oxley Act of 2002. |
(32.2) † | Certification Pursuant to 18 U.S.C. Section 1350, as Adopted Pursuant to Section 906 of the Sarbanes-Oxley Act of 2002. |
(99.1) # | Report of DeGolyer and MacNaughton dated February 9, 2018 concerning evaluation of oil and gas reserves. |
(101.INS)# | XBRL Instance Document |
(101.SCH)# | XBRL Taxonomy Extension Schema Document |
(101.CAL)# | XBRL Taxonomy Extension Calculation Linkbase Document |
(101.DEF)# | XBRL Taxonomy Extension Definition Linkbase Document |
(101.LAB)# | XBRL Taxonomy Extension Label Linkbase Document |
(101.PRE)# | XBRL Taxonomy Extension Presentation Linkbase Document |
____________________
* | Management contract or compensatory plan or arrangement. |
# | Filed herewith. |
† | Furnished herewith. |
Item 16 | Form 10-K Summary |
None.
105
SIGNATURES
Pursuant to the requirements of Section 13 or 15(d) of the Securities Exchange Act of 1934, the Registrant has duly caused this report to be signed on its behalf by the undersigned, thereunto duly authorized.
PENN VIRGINIA CORPORATION | ||
By: | /s/ STEVEN A. HARTMAN | |
Steven A. Hartman | ||
Senior Vice President and Chief Financial Officer | ||
(Principal Financial Officer) | ||
March 2, 2018 | By: | /s/ TAMMY L. HINKLE |
Tammy L. Hinkle | ||
Vice President and Controller | ||
(Principal Accounting Officer) | ||
Pursuant to the requirements of the Securities Exchange Act of 1934, this report has been signed below by the following persons on behalf of the Registrant and in the capacities and on the dates indicated.
/s/ JOHN A. BROOKS | Chief Executive Officer and Director | March 2, 2018 | ||
John A. Brooks | (Principal Executive Officer) | |||
/s/ STEVEN A. HARTMAN | Senior Vice President and Chief Financial Officer | March 2, 2018 | ||
Steven A. Hartman | (Principal Financial Officer) | |||
/s/ TAMMY L. HINKLE | Vice President and Controller | March 2, 2018 | ||
Tammy L. Hinkle | (Principal Accounting Officer) | |||
/s/ DAVID GEENBERG | Co-Chairman of the Board | March 2, 2018 | ||
David Geenberg | ||||
/s/ MICHAEL HANNA | Director | March 2, 2018 | ||
Michael Hanna | ||||
/s/ DARIN G. HOLDERNESS | Co-Chairman of the Board | March 2, 2018 | ||
Darin G. Holderness | ||||
/s/ MARC MCCARTHY | Director | March 2, 2018 | ||
Marc McCarthy | ||||
/s/ JERRY R. SCHUYLER | Director | March 2, 2018 | ||
Jerry R. Schuyler | ||||
106