Attached files
| file | filename |
|---|---|
| 8-K - FORM 8-K - PENN VIRGINIA CORP | d515707d8k.htm |
| EX-99.2 - EX-99.2 - PENN VIRGINIA CORP | d515707dex992.htm |
| EX-99.3 - EX-99.3 - PENN VIRGINIA CORP | d515707dex993.htm |
Exhibit 99.1
INFORMATION REGARDING PENN VIRGINIA CORPORATION
AND THE ACQUISITION PROPERTIES
This Exhibit 99.1 sets forth certain information regarding PVA and the properties to be acquired in connection with the Acquisition.
Our current focus is on drilling unconventional horizontal development wells in shale formations principally in the Eagle Ford Shale play in South Texas, where we are the operator on 42,430 gross (35,020 net) acres located primarily in Lavaca and Gonzalez Counties. Since 2010, we have drilled and completed 70 gross (58.9 net) wells in the Eagle Ford Shale play. We also have 8,045 net acres in the horizontal Granite Wash play in the Mid-Continent region and pursue select drilling opportunities in the play through participation in wells drilled by our joint venture partner.
During the quarter ended December 31, 2012, our average daily production rate was 15,444 BOEPD, which was 39% oil, 17% NGLs and 44% natural gas. As we continue to develop our Eagle Ford Shale assets, we expect oil, and to a lesser extent NGLs, to comprise a greater percentage of our daily production.
The following table sets forth by region our proved reserves and reserves to production ratio as of December 31, 2012, as well as our average daily production for the quarter ended December 31, 2012:
| As of December 31, 2012 | Quarter ended December 31, 2012 |
|||||||||||||||||||
| Region |
Proved reserves (MMBOE)(1) |
% Total proved reserves |
% Proved developed |
Reserves to production ratio (in years)(2) |
Average daily production (BOEPD) |
|||||||||||||||
| Texas |
82.9 | 73.0 | % | 33.2 | % | 22.1 | 10,265 | |||||||||||||
| Mid-Continent |
12.5 | 11.0 | % | 79.2 | % | 11.8 | 2,892 | |||||||||||||
| Mississippi |
17.6 | 15.5 | % | 53.8 | % | 21.8 | 2,209 | |||||||||||||
| Appalachia |
0.5 | 0.5 | % | 22.6 | % | 17.6 | 78 | |||||||||||||
|
|
|
|
|
|
|
|||||||||||||||
| Total |
113.5 | 100.0 | % | 41.4 | % | 20.1 | 15,444 | |||||||||||||
|
|
|
|
|
|
|
|||||||||||||||
| (1) | Based on an equivalent ratio of one barrel of oil and NGLs to six Mcf of natural gas. |
| (2) | Reserves to production ratio is determined by dividing our proved reserves by the average daily production attributable to such reserves for the quarter ended December 31, 2012, on an annualized basis. |
We believe our pending acquisition, or the Acquisition, of Eagle Ford Hunter, Inc., or Eagle Hunter, represents both a strategic and transformative acquisition for us. Eagle Hunter owns 40,565 gross (19,037 net) acres of producing oil, NGL and natural gas properties, which are located in Gonzales and Lavaca Counties, Texas and are largely contiguous to our current leaseholds. Eagle Hunter’s average daily production for the month of February 2013 was 3,173 BOEPD, of which 90% was oil. As of March 31, 2013, there were 46 gross (22.1 net) producing wells and seven gross wells awaiting completion.
For the year ended December 31, 2012, the Eagle Hunter assets had revenues of $72.1 million and direct operating expenses of $10.3 million. As of December 31, 2012, proved reserves associated with the Eagle Hunter assets were approximately 12.0 MMBOE, of which 37% were proved developed reserves and 96% were oil and NGLs. Included in the proved reserve estimates were 44 gross proved developed wells and 51 gross proved undeveloped locations. During the quarter ended December 31, 2012, the average daily production rate was 2,710 BOEPD, which was 89% oil, 6% NGLs and 5% natural gas.
The following table sets forth information relating to Eagle Hunter’s proved reserves as of December 31, 2012:
| As of December 31, 2012(1) | ||||||||||||||||||||
| Category |
Oil (MMBbl) |
NGLs (MMBbl) |
Natural
Gas (Bcf) |
Oil
Equivalents (MMBOE) |
PV-10 ($ million)(2) |
|||||||||||||||
| Proved Developed |
3.9 | 0.3 | 1.1 | 4.4 | $ | 156.0 | ||||||||||||||
| Proved Undeveloped |
6.9 | 0.4 | 1.8 | 7.6 | 84.7 | |||||||||||||||
|
|
|
|
|
|
|
|
|
|
|
|||||||||||
| Total Proved Reserves |
10.8 | 0.7 | 2.9 | 12.0 | $ | 240.7 | ||||||||||||||
|
|
|
|
|
|
|
|
|
|
|
|||||||||||
1
| (1) | Estimated proved reserve data for the Eagle Hunter assets was prepared by Cawley, Gillespie & Associates, Inc., or Cawley Gillespie, using unweighted average first-day-of-the month prices for the year ended December 31, 2012. The average prices for oil, NGLs and natural gas were $98.77 per barrel of oil, $43.57 per barrel of NGLs and $2.88 per Mcf of natural gas, respectively. |
| (2) | A reconciliation of Eagle Hunter’s PV-10 to standardized measure, assuming that Eagle Hunter’s tax rates would be the same as ours, is as follows: |
| ($ in millions) | ||||
| PV-10 value |
$ | 240.7 | ||
| Income tax effect |
(67.7 | ) | ||
|
|
|
|||
| Standardized measure |
$ | 173.0 | ||
PV-10 is the present value of estimated future revenues to be generated from the production of proved reserves, before income taxes, net of estimated production and future development costs, using prices and costs as of the date of estimation without future escalation, without giving effect to financial hedging activities, non-property related expenses such as general and administrative expenses, debt service and depreciation, depletion and amortization, and discounted using an annual discount rate of 10%. Standardized measure is the present value of estimated future cash inflows from proved natural gas and oil reserves, less future development and production costs and future income tax expenses, discounted at 10% per annum to reflect timing of future cash flows and using the same pricing assumptions as are used to calculate PV-10. Standardized measure differs from PV-10 because standardized measure includes the effect of future income taxes.
PV-10 is considered a non-GAAP measure. We believe the presentation of the PV-10 value is relevant and useful to our investors because it presents the discounted future net cash flows attributable to our proved reserves before taking into account corporate income taxes. We believe investors and creditors utilize our PV-10 value as a basis for comparison of the relative size and value of our reserves to other companies. Neither PV-10 value nor standardized measure reflects the impact of financial hedging transactions.
Following the consummation of the Acquisition, we will have a larger consolidated position of approximately 83,000 gross (54,000 net) acres in the Eagle Ford Shale play. We plan to operate four rigs on the operated portion of our leaseholds, and we believe that Eagle Hunter’s operating partner plans to continue a two-rig program. As of March 31, 2013, we would have had an interest in 117 gross (82.0 net) producing wells and up to an estimated 640 additional gross (420 net) drilling locations. This new combined acreage position will afford us a multi-year inventory of identified locations in an area familiar to us and where we have experience and institutional knowledge of the geology, reservoir characteristics and current industry best practices in drilling and completion techniques. Further, we believe that the Acquisition will enable us to leverage our increased scale and reduce our operating costs and development capital expenditures per well. We anticipate spending approximately $385 million on drilling and completions in 2013 and anticipate bringing a total of 62 gross (39.3 net) wells online by year-end.
After giving effect to the Acquisition, on a pro forma basis, our proved reserves as of December 31, 2012 would have been approximately 125.5 MMBOE, of which 41% would have been proved developed reserves and 46% would have been oil and NGLs. Our Eagle Ford Shale proved reserves would have been approximately 38.2 MMBOE, which would have comprised 30% of our total proved reserves. The pro forma PV-10 value of our proved reserves as of December 31, 2012 would have been $933.2 million. Our pro forma average daily production rate for the quarter ended December 31, 2012 would have been 18,154 BOEPD, consisting of 47% oil, 15% NGLs and 38% natural gas. PV-10 is considered a non-GAAP measure. A reconciliation of our pro forma PV-10 to standardized measure, assuming that Eagle Hunter’s tax rates would be the same as ours, is as follows:
| ($ in thousands) | ||||
| PV-10 value |
$ | 933,209 | ||
| Income tax effect |
(262,250 | ) | ||
|
|
|
|||
| Standardized measure |
$ | 670,959 | ||
Description of Properties
Pro Forma Overview of Properties
The following map shows our asset base, on a pro forma basis, after giving effect to the Acquisition. For a further description of our historical activity in each of these regions, please see the information that follows this map.
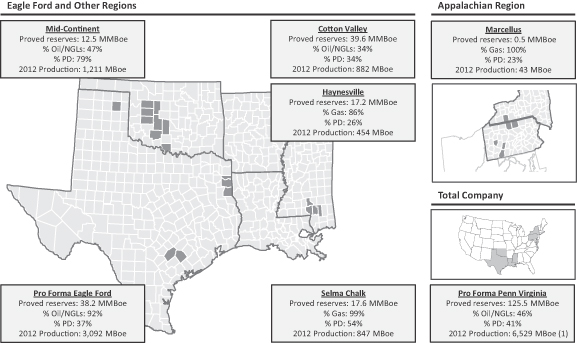
| (1) | Excludes 742 MBoe related to assets divested in 2012. |
2
Eagle Ford Shale
We are active in the Eagle Ford Shale play in South Texas and our current leaseholds are located primarily in Gonzales and Lavaca Counties. We own and operate a total of 42,430 gross (35,020 net) acres in the Eagle Ford Shale. Our Eagle Ford Shale oil and NGL reserves comprise approximately 21% of our total equivalent proved reserves as of December 31, 2012. In addition, according to Wright & Company Inc., our independent third-party reserve engineers, the average gross estimated ultimate recovery for our Eagle Ford Shale proved undeveloped locations with full-length laterals in Gonzales County and Lavaca County is approximately 400 MBOE and 500 MBOE, respectively.
During 2012, we invested approximately $350 million, or more than 90% of our 2012 capital program, to projects in the Eagle Ford Shale and drilled a total of 35 gross (29.5 net) wells, all but one of which was successful. We believe our project inventory in the Eagle Ford Shale provides us opportunities for continued oil and NGL-focused development over the next several years. Since December 2012, we have completed seven gross (6.5 net) Eagle Ford Shale wells, bringing our total to date to 71 gross (59.9 net) producing wells, with four gross wells being drilled and three gross wells awaiting completion. The initial 30-day average gross wellhead production rate for 68 of these wells with a 30-day production history was approximately 620 BOEPD. Our Eagle Ford Shale production was 6,872 BOEPD during the quarter ended December 31, 2012, comprised of approximately 80% oil, 11% NGLs and 9% natural gas. Our daily production from the Eagle Ford Shale for February 2013 was 7,776 BOEPD.
Mid-Continent
Our Mid-Continent efforts are focused on drilling the horizontal Granite Wash play where we have approximately 55,000 net leasehold acres across Washita, Custer, Blaine, Dewey, Caddo, Comanche, Grady and Jefferson Counties, Oklahoma and Roberts County, Texas. The Mid-Continent region contains primarily liquids-rich natural gas reserves, and represents approximately 11% of our total equivalent proved reserves as of December 31, 2012. Our Mid-Continent production was 2,892 BOEPD during the quarter ended December 31, 2012.
Activity in this region is primarily conducted through participation in wells drilled by our joint venture partner. During 2012, we invested approximately $25 million, or 6% of our 2012 capital program, to projects in this region. In 2013, we plan to invest approximately $13 million to participate in five gross (2.2 net) wells.
East Texas
In East Texas, we have approximately 33,000 net leasehold acres located in Harrison, Panola and Marion Counties. Our Carthage field in East Texas, consisting of our Cotton Valley and Haynesville Shale properties, represents approximately 50% of our total equivalent proved reserves as of December 31, 2012. Our East Texas production was 3,393 BOEPD during the quarter ended December 31, 2012 and was 70% natural gas.
Mississippi
Our Mississippi assets are located primarily in the Selma Chalk play in Marion, Lamar, Forrest and Jefferson Davis Counties where we have approximately 30,000 net leasehold acres and represent approximately 16% of our total equivalent proved reserves as of December 31, 2012. Our Mississippi production was 2,209 BOEPD during the quarter ended December 31, 2012 and was substantially all natural gas.
Appalachia
In Appalachia, we have approximately 38,000 net leasehold acres located primarily in Potter and Tioga Counties, Pennsylvania. Our Appalachian assets consist of our Marcellus Shale properties and represent less than 1% of our total equivalent proved reserves as of December 31, 2012. Our Appalachian production was 78 BOEPD during the quarter ended December 31, 2012 and was substantially all natural gas.
3
Other Recent Developments
Hedging Activity
Since December 31, 2012, we have entered into several derivative financial instruments. The following table sets forth our commodity derivative positions as of March 31, 2013.
| Instrument | Average Volume Per Day |
Weighted Average Price | ||||||||||||||
| Floor/Swap | Ceiling | |||||||||||||||
| (barrels) | ($/barrel) | |||||||||||||||
| Crude Oil: |
||||||||||||||||
| First quarter 2013 |
Collars | 1,590 | $ | 90.00 | $ | 99.35 | ||||||||||
| Second quarter 2013 |
Collars | 1,900 | 90.00 | 99.17 | ||||||||||||
| Third quarter 2013 |
Collars | 1,900 | 90.00 | 99.17 | ||||||||||||
| Fourth quarter 2013 |
Collars | 1,900 | 90.00 | 99.17 | ||||||||||||
| First quarter 2013 |
Swaps | 2,906 | 102.72 | |||||||||||||
| Second quarter 2013 |
Swaps | 3,750 | 101.26 | |||||||||||||
| Third quarter 2013 |
Swaps | 4,000 | 98.43 | |||||||||||||
| Fourth quarter 2013 |
Swaps | 4,000 | 98.43 | |||||||||||||
| First quarter 2014 |
Swaps | 4,000 | 95.27 | |||||||||||||
| Second quarter 2014 |
Swaps | 4,000 | 95.27 | |||||||||||||
| Third quarter 2014 |
Swaps | 3,500 | 94.43 | |||||||||||||
| Fourth quarter 2014 |
Swaps | 3,500 | 94.43 | |||||||||||||
| First quarter 2014 |
Swaption | 1,812 | 100.00 | |||||||||||||
| Second quarter 2014 |
Swaption | 1,812 | 100.00 | |||||||||||||
| Third quarter 2014 |
Swaption | 1,812 | 100.00 | |||||||||||||
| Fourth quarter 2014 |
Swaption | 1,812 | 100.00 | |||||||||||||
| Natural Gas: |
(in MMBtu | ) | ($ | /MMBtu | ) | |||||||||||
| First quarter 2013 |
Collars | 10,000 | $ | 3.50 | $ | 4.30 | ||||||||||
| Second quarter 2013 |
Collars | 10,000 | 3.50 | 4.30 | ||||||||||||
| Third quarter 2013 |
Collars | 10,000 | 3.50 | 4.30 | ||||||||||||
| Fourth quarter 2013 |
Collars | 15,000 | 3.67 | 4.37 | ||||||||||||
| First quarter 2014 |
Collars | 5,000 | 4.00 | 4.50 | ||||||||||||
| First quarter 2013 |
Swaps | 10,000 | 4.01 | |||||||||||||
| Second quarter 2013 |
Swaps | 15,000 | 3.92 | |||||||||||||
| Third quarter 2013 |
Swaps | 15,000 | 3.92 | |||||||||||||
| Fourth quarter 2013 |
Swaps | 10,000 | 4.04 | |||||||||||||
| First quarter 2014 |
Swaps | 5,000 | 4.05 | |||||||||||||
| Second quarter 2014 |
Swaps | 10,000 | 4.03 | |||||||||||||
| Third quarter 2014 |
Swaps | 10,000 | 4.03 | |||||||||||||
Business Strengths
We believe that we are well positioned to successfully execute the key elements of our business strategies based on the following business strengths:
| • | Substantial block of leasehold acreage in the Eagle Ford Shale play. Upon the consummation of the Acquisition, we will own approximately 54,000 net leasehold acres in Gonzalez and Lavaca Counties, Texas, which are generally contiguous. Eagle Hunter currently has 46 gross producing wells, and we believe that the blocky nature of our post-Acquisition combined acreage will provide us up to approximately 80 additional drilling locations. We expect that the scale and concentration of our acreage, combined with our experience as operator, will also enable us to achieve operational efficiencies and improve our drilling and completion costs. |
| • | Continued growth in oil-weighted production and reserves. For the quarter ended December 31, 2012, approximately 47% of our pro forma average daily production would have been oil, which would have represented approximately 79% of revenue from sales of oil, NGLs and natural gas on a pro forma basis for that period. We currently operate a three-rig program on our existing Eagle Ford Shale assets and expect to increase to a six-rig program following the Acquisition. Of these six, four will be operated by us. We plan to drill or participate in approximately 62 gross (39.3 net) wells in the Eagle Ford Shale play in 2013. |
| • | High quality asset base that is geographically and geologically diverse. Our proved reserves, production and resource potential are located within multiple onshore U.S. basins that are well understood. These various basins provide exposure to a variety of reservoir formations with various compositions of oil, NGLs and natural gas. We believe this diversity in geography and commodity exposure mitigates our exposure to temporary price dislocations in any one market. |
4
| • | Active portfolio management. As production from the Eagle Ford Shale grows and comprises a greater portion of our total production, we will have the ability to monetize non-core assets, which we expect will provide us with cash to reinvest in our business and repay debt. This allows us to focus on a portfolio of core properties with significant potential to increase our proved reserves and production. |
| • | Experienced management and technical teams. Our senior management team has an average of over 23 years of industry experience and is supported by technical and operating personnel who also have substantial industry experience and expertise. Since late 2010, we have drilled and completed 70 gross (58.9 net) wells in the Eagle Ford Shale play. As an active industry participant in the Eagle Ford Shale, we have acquired extensive experience and familiarity with our assets that we will be able to use to develop the Eagle Hunter assets. |
Business Strategies
We intend to pursue the following business strategies:
| • | Continue to expand oil and NGL reserves and drilling inventory. Upon consummation of the Acquisition, we anticipate spending up to approximately $430 million to $485 million for capital expenditures in 2013, of which over 90% will be allocated to our Eagle Ford Shale acreage. Pro forma for the Acquisition, approximately 35% of our leasehold position will be held by production. We anticipate the remaining acreage can be held within three years with a five-rig development program. |
| • | Grow our cash flows and margins. We expect our operating cash flows and margins will continue to grow, on a pro forma basis taking into consideration recent asset sales, as we increase our oil and NGL production through investment in higher rate-of-return development oil projects. |
| • | Maintain our liquidity and financial position. We expect to continue to use our operating cash flows and borrowings under our Revolver to fund our capital requirements in 2013. Based on our capital expenditure plan for 2013 and the contribution to our cash flow and reserve value expected from the Eagle Hunter assets, we expect to fund our development plan through operating cash flow and undrawn capacity on our Revolver. |
| • | Maximize long-term optionality across our portfolio. Our substantial Haynesville Shale and Cotton Valley Sands properties are largely held by production. Retaining these assets provides us the option to deploy capital on these leaseholds in a higher natural gas price environment. Given that these properties are past their initial production declines, we feel they will exhibit a more gradual decline in the future and, based on estimated reserves, have a long reserve to production life. We also continue to evaluate divestment opportunities with respect to our non-core assets with limited near-term development. We expect that any divestitures of these non-core assets will provide us with cash to reinvest in higher growth oil- and NGL-focused projects. Further, as production from our Eagle Ford acreage grows, we have the ability to monetize these assets to improve our overall operating cost profile and liquidity. |
| • | Manage risk exposure through an active hedging program. We actively manage our exposure to commodity price fluctuations by hedging the commodity price risk for our expected production. The level of our hedging activity and duration of the instruments employed depend upon our cash flows at risk, available hedge prices and our operating strategy. As of March 31, 2013, we have hedged approximately 69% of our estimated crude oil production at average floor/swap and ceiling prices of $96.67 and $99.73 per barrel, respectively, for 2013. In addition, as of March 31, 2013, we have hedged approximately 68% of our estimated natural gas production at a weighted-average floor/swap and ceiling prices of $3.77 per MMBtu and $4.13 per MMBtu, respectively, for 2013. Following the closing of the Acquisition, we expect to enter into additional hedges and target an overall hedged percentage resembling our current percent of expected production. |
5
The summary other financial data and key credit statistics presented as of and for the year ended December 31, 2012 are derived from our unaudited pro forma condensed consolidated financial statements. The pro forma financial data gives effect to the proposed acquisition and to the financing thereof with a combination of debt and the issuance to Magnum Hunter Resources Corporation of $40 million of our common stock. The unaudited pro forma financial data are based on certain assumptions and do not purport to be indicative of the results which actually would have been achieved if the proposed acquisition and other transactions listed above had been consummated on the dates indicated or of results that may be achieved in the future.
| Pro Forma | Historical | |||||||||||||||
| Year Ended December 31, |
Year Ended December 31, | |||||||||||||||
| 2012 | 2012 | 2011 | 2010 | |||||||||||||
| (in thousands) | ||||||||||||||||
| Other financial data and key credit statistics: |
||||||||||||||||
| Ratio of earnings to fixed charges and preferred stock dividends(1) |
— | — | — | — | ||||||||||||
| EBITDAX(2) |
$ | 194,652 | $ | 132,823 | $ | 84,053 | $ | 137,653 | ||||||||
| Adjusted EBITDAX(2) |
309,447 | 247,618 | 222,509 | 173,347 | ||||||||||||
| Total interest expense(3) |
94,917 | 59,339 | 56,216 | 53,679 | ||||||||||||
| Ratio of total long-term debt to Adjusted EBITDAX(2) |
3.3 | 2.4 | 3.1 | 2.9 | ||||||||||||
| Ratio of Adjusted EBITDAX to total interest expense(2)(3) |
3.3 | 4.2 | 4.0 | 3.1 | ||||||||||||
| (1) | For purposes of computing our ratio of earnings to fixed charges and preferred stock dividends on a consolidated basis, (x) earnings consist of the aggregate of income (before adjustment for income taxes, extraordinary items and income or loss from equity investees), plus fixed charges, amortization of capitalized interest and distributed income of equity investees, and minus capitalized interest, and (y) fixed charges consist of interest expense (including amounts capitalized), amortization of debt issuance costs, the portion of rental expense representing the interest factor and preferred stock dividends on a pre-tax basis. For the years ended December 31, 2012, 2011 and 2010, we had a deficiency of earnings to fixed charges of $176.9 million, $223.1 million and $109.6 million, respectively. The deficiency of earnings to fixed charges for the pro forma period is $239.2 million. |
| (2) | Adjusted EBITDAX represents net loss before income tax benefit, interest expense, depreciation, depletion and amortization expenses, exploration expenses and share-based compensation expense (“EBITDAX”), further adjusted to exclude the effects of non-cash changes in the fair value of derivatives, loss on firm transportation commitment, impairments, net gains and losses on the sale of assets, loss on the extinguishment of debt and other non-cash items. We believe this presentation is commonly used by investors and professional research analysts in the valuation, comparison, rating and investment recommendations of companies within the oil and gas exploration and production industry. We use this information for comparative purposes within our industry. Adjusted EBITDAX is not a measure of financial performance under GAAP and should not be considered as a measure of liquidity or as an alternative to net loss. Adjusted EBITDAX represents EBITDAX as defined in our Revolver. The following table provides a reconciliation of net income to EBITDAX and to Adjusted EBITDAX: |
| Pro Forma | Historical | |||||||||||||||
| Year Ended December 31, |
Year Ended December 31, | |||||||||||||||
| 2012 | 2012 | 2011 | 2010 | |||||||||||||
| (in thousands) | ||||||||||||||||
| Net loss from continuing operations |
$ | (141,244 | ) | $ | (104,589 | ) | $ | (132,915 | ) | $ | (65,327 | ) | ||||
| Add: |
||||||||||||||||
| Income tax benefit |
(92,734 | ) | (68,702 | ) | (88,155 | ) | (42,851 | ) | ||||||||
| Interest expense |
94,917 | 59,339 | 56,216 | 53,679 | ||||||||||||
| Depreciation, depletion and amortization expenses |
232,263 | 206,336 | 162,534 | 134,700 | ||||||||||||
| Exploration expenses |
95,103 | 34,092 | 78,943 | 49,641 | ||||||||||||
| Share-based compensation expense |
6,347 | 6,347 | 7,430 | 7,811 | ||||||||||||
|
|
|
|
|
|
|
|
|
|||||||||
| EBITDAX |
$ | 194,652 | $ | 132,823 | $ | 84,053 | $ | 137,653 | ||||||||
| Effect of derivatives: |
||||||||||||||||
| Net (gains) losses included in net income |
(36,187 | ) | (36,187 | ) | (15,651 | ) | (41,906 | ) | ||||||||
| Cash settlements |
29,723 | 29,723 | 27,380 | 32,818 | ||||||||||||
| Loss on firm transportation commitment |
17,332 | 17,332 | — | — | ||||||||||||
| Impairments |
104,484 | 104,484 | 104,688 | 45,959 | ||||||||||||
| Loss (gain) on sale of assets |
(4,282 | ) | (4,282 | ) | (2,474 | ) | 61 | |||||||||
| Loss on extinguishment of debt |
3,164 | 3,164 | 25,421 | — | ||||||||||||
| Other non-cash items |
561 | 561 | (908 | ) | (1,238 | ) | ||||||||||
|
|
|
|
|
|
|
|
|
|||||||||
| Adjusted EBITDAX |
$ | 309,447 | $ | 247,618 | $ | 222,509 | $ | 173,347 | ||||||||
| (3) | Pro forma total interest expense and pro forma ratio of Adjusted EBITDAX to total interest expense assume an interest rate of 8.75% for the debt financing. Total interest includes interest expense less interest capitalized during the period. |
6
FORWARD-LOOKING STATEMENTS
Some of the information included herein contains “forward-looking statements” within the meaning of Section 27A of the Securities Act, and Section 21E of the Securities Exchange Act of 1934, as amended. These statements use forward-looking words such as “may,” “will,” “should,” “could,” “achievable,” “anticipate,” “believe,” “expect,” “estimate,” “project” or other words and phrases of similar meaning. These statements discuss goals, intentions and expectations as to future trends, plans, events, results of operations or financial condition or state other “forward-looking” information. A forward-looking statement may include a statement of the assumptions or bases underlying the forward-looking statements. We believe we have chosen these assumptions or bases in good faith and that they are reasonable. However, we caution you that assumed facts or bases almost always vary from actual results, and the differences between assumed facts or bases and actual results can be material, depending on the circumstances. When considering forward-looking statements, you should keep in mind the cautionary statements in this offering memorandum and the documents we have incorporated by reference herein, including in our Annual Report on Form 10-K for the year ended December 31, 2012, or our 2012 Annual Report. These statements reflect our current views with respect to future events and are subject to various risks, uncertainties and contingencies, including, but not limited, to:
| • | our ability to successfully complete the acquisition of Eagle Ford Hunter, Inc., or Eagle Hunter, integrate the business of Eagle Hunter with ours and realize the anticipated benefits from the acquisition; |
| • | any unexpected costs or delays in connection with the acquisition of Eagle Hunter; |
| • | the volatility of commodity prices for oil, NGLs and natural gas; |
| • | our ability to develop, explore for, acquire and replace oil and natural gas reserves and sustain production; |
| • | our ability to generate profits or achieve targeted reserves in our development and exploratory drilling and well operations; |
| • | any impairments, write-downs or write-offs of our reserves or assets; |
| • | the projected demand for and supply of oil, NGLs and natural gas; |
| • | reductions in the borrowing base under our revolving credit facility, or our Revolver; |
| • | our ability to contract for drilling rigs, supplies and services at reasonable costs; |
| • | our ability to obtain adequate pipeline transportation capacity for our oil and gas production at reasonable cost and to sell the production at, or at reasonable discounts to, market prices; |
| • | the uncertainties inherent in projecting future rates of production for our wells and the extent to which actual production differs from estimated proved oil and natural gas reserves; |
| • | drilling and operating risks; |
| • | our ability to compete effectively against other independent and major oil and natural gas companies; |
| • | our ability to successfully monetize select assets and repay our debt; |
| • | leasehold terms expiring before production can be established; |
| • | environmental liabilities that are not covered by an effective indemnity or insurance; |
| • | the timing of receipt of necessary regulatory permits; |
| • | the effect of commodity and financial derivative arrangements; |
| • | our ability to maintain adequate financial liquidity and to access adequate levels of capital on reasonable terms; |
| • | the occurrence of unusual weather or operating conditions, including force majeure events; |
7
| • | our ability to retain or attract senior management and key technical employees; |
| • | counterparty risk related to their ability to meet their future obligations; |
| • | changes in governmental regulation or enforcement practices, especially with respect to environmental, health and safety matters; |
| • | uncertainties relating to general domestic and international economic and political conditions; and |
| • | other risks set forth in Item 1A of our 2012 Annual Report. |
Additional information concerning these and other factors can be found in our press releases and public periodic filings with the SEC. Many of the factors that will determine our future results are beyond the ability of management to control or predict. Readers should not place undue reliance on forward-looking statements, which reflect management’s views only as of the date hereof. Other than as required under the securities laws, we undertake no obligation to revise or update any forward-looking statements, or to make any other forward-looking statements, whether as a result of new information, future events or otherwise.
8