Attached files
| file | filename |
|---|---|
| EXCEL - IDEA: XBRL DOCUMENT - GOLDEN QUEEN MINING CO LTD | Financial_Report.xls |
| EX-31.1 - EXHIBIT 31.1 - GOLDEN QUEEN MINING CO LTD | exhibit31-1.htm |
| EX-32.2 - EXHIBIT 32.2 - GOLDEN QUEEN MINING CO LTD | exhibit32-2.htm |
| EX-23.1 - EXHIBIT 23.1 - GOLDEN QUEEN MINING CO LTD | exhibit23-1.htm |
| EX-31.2 - EXHIBIT 31.2 - GOLDEN QUEEN MINING CO LTD | exhibit31-2.htm |
| EX-32.1 - EXHIBIT 32.1 - GOLDEN QUEEN MINING CO LTD | exhibit32-1.htm |
UNITED STATES
SECURITIES AND
EXCHANGE COMMISSION
Washington, D.C. 20549
FORM 10-K/A
Amendment No. 1
[X] ANNUAL REPORT PURSUANT TO SECTION 13 OR 15(d) OF THE
SECURITIES EXCHANGE ACT OF 1934
For the fiscal year ended December 31, 2011
[ ] TRANSITION REPORT PURSUANT TO SECTION 13 OR 15(d) OF THE
SECURITIES EXCHANGE ACT OF 1934
For the transition period from _______________to
_______________
0-21777
(Commission File Number)
GOLDEN QUEEN MINING CO.
LTD.
(Name of registrant in its charter)
| British Columbia, Canada | Not Applicable |
| (State or other jurisdiction | (IRS Employer |
| of incorporation or organization) | Identification No.) |
| 6411 Imperial Avenue, West Vancouver, British Columbia, Canada | V7W 2J5 |
| (Address of principal executive offices) | (Zip Code) |
Issuer’s telephone number: (604) 921-7570
Securities registered under Section 12(b) of the Exchange Act: None
Securities registered under section 12(g) of the Exchange Act: Common shares without par value
Indicate by check mark if the registrant is a well-known seasoned issuer, as defined in Rule 405 of the Securities Act. Yes [ ] No [X]
Indicate by check mark if the registrant is not required to file reports pursuant to Section 13 or Section 15(d) of the Act. Yes [ ] No [X]
Indicate by check mark whether the registrant (1) has filed all reports required to be filed by Section 13 or 15(d) of the Securities Exchange Act of 1934 during the preceding 12 months (or for such shorter period that the registrant was required to file such reports), and (2) has been subject to such filing requirements for the past 90 days. Yes [X] No [ ]
Indicate by check mark whether the registrant has submitted electronically and posted on its corporate Website, if any, every Interactive Data File required to be submitted and posted pursuant to Rule 405 of Regulation S-T during the preceding 12 months (or for such shorter period that the registrant was required to submit and post such files). Yes [X] No [ ]
Indicate by check mark if disclosure of delinquent filers in response to Item 405 of Regulation S-K is not contained herein, and will not be contained, to the best of registrant’s knowledge, in definitive proxy or information statements incorporated by reference in Part III of this Form 10-K/A or any amendment to this Form 10-K/A. [X]
Indicate by check mark whether the registrant is a large
accelerated filer, an accelerated filer, a non-accelerated filer, or a smaller
reporting company.
Large accelerated filer [ ] Accelerated filer [X]
Non-accelerated filer [ ] Smaller reporting company [ ]
Indicate by check mark whether the registrant is a shell company (as defined in Rule 12b-2 of the Exchange Act). Yes [ ] No [X]
State the aggregate market value of the voting and non-voting
common equity held by non-affiliates computed by reference to the price at which
the common equity was sold, or the average bid and asked price of such common
equity, as of the last business day of the registrant’s most recently completed
second fiscal quarter:
$156,775,909 as at June 30, 2011.
Indicate the number of shares outstanding of each of the
registrant’s classes of common equity, as of the latest practicable date:
97,978,383 common shares as at March 29, 2012.
DOCUMENTS INCORPORATED BY REFERENCE
Portions of the registrant's Proxy Statement for the Annual Meeting of Stockholders are incorporated by reference into Part III of this Form 10-K/A, which Proxy Statement is to be filed within 120 days after the end of the registrant's fiscal year ended December 31, 2011. If the definitive Proxy Statement cannot be filed on or before the 120 day period, the issuer may instead file an amendment to this Form 10-K/A disclosing the information with respect to Items 10 through 14.
EXPLANATORY NOTE
We are filing this Amendment No. 1 to our Form 10-K for the financial year ended December 31, 2011 in response to comments received from the U.S. Securities and Exchange Commission as part of their mandate to periodically review filings of each reporting company. This Amendment includes amendments to our audited consolidated financial statements to reflect reclassifications on our consolidated statement of loss and comprehensive loss, revisions to mineral properties in the notes to consolidated financial statements and presentation changes in Note 3. Also, the audit opinion has been modified to remove the reference to the predecessor auditors related to the period in inception (November 21, 1985) through May 31, 1996. In addition, we have amended Item 7 under the headings Results of Operations and Application of Critical Accounting Estimates, and Item 9a. These amendments do not have any impact on the consolidated financial position, net loss or cash flows of the Company from those previously reported.
Except as described above, no other changes have been made to the original Annual Report filed March 30, 2012 and this Amendment continues to reflect information as of the date of the original Annual Report, and the Company has not updated the disclosures contained therein to reflect any events which occurred at a date subsequent to the filing of the original Annual Report.
2
Form 10-K/A
Table of Contents
| Part | Item No. | |
| I | 1 | Business |
| 1A | Risk Factors | |
| 1B | Unresolved Staff Comments | |
| 2 | Properties | |
| 3 | Legal Proceedings | |
| 4 | Mine Safety Disclosures | |
| II | 5 | Market for Common Equity, Related Stockholder Matters and Issuer Purchases of Equity Securities |
| 6 | Selected Financial Data | |
| 7 | Management’s Discussion and Analysis of Financial Condition and Results of Operation | |
| 7A | Quantitative and Qualitative Disclosures About Market Risk | |
| 8 | Financial Statements and Supplementary Data | |
| 9 | Changes in and Disagreements With Accountants on Accounting and Financial Disclosure | |
| 9A | Controls and Procedures | |
| 9B | Other Information | |
| III | 10 | Directors, Executive Officers and Corporate Governance |
| 11 | Executive Compensation | |
| 12 | Security Ownership of Certain Beneficial Owners and Management and Related Stockholder Matters | |
| 13 | Certain Relationships and Related Transactions and Director Independence | |
| 14 | Principal Accountant Fees and Services | |
| IV | 15 | Exhibits, Financial Statement Schedules |
| Signatures | ||
3
PART I
FORWARD-LOOKING STATEMENTS
ALL STATEMENTS IN THIS DISCUSSION THAT ARE NOT HISTORICAL ARE FORWARD-LOOKING STATEMENTS WITHIN THE MEANING OF SECTION 21E OF THE SECURITIES EXCHANGE ACT OF 1934, AS AMENDED. STATEMENTS PRECEDED BY, FOLLOWED BY OR THAT OTHERWISE INCLUDE THE WORDS "BELIEVES", "EXPECTS", "ANTICIPATES", "INTENDS", "PROJECTS", "ESTIMATES", "PLANS", "MAY INCREASE", "MAY FLUCTUATE" AND SIMILAR EXPRESSIONS OR FUTURE OR CONDITIONAL VERBS SUCH AS "SHOULD", "WOULD", "MAY" AND "COULD" ARE GENERALLY FORWARD-LOOKING IN NATURE AND NOT HISTORICAL FACTS. THESE FORWARD-LOOKING STATEMENTS WERE BASED ON VARIOUS FACTORS AND WERE DERIVED UTILIZING NUMEROUS IMPORTANT ASSUMPTIONS AND OTHER IMPORTANT FACTORS THAT COULD CAUSE ACTUAL RESULTS TO DIFFER MATERIALLY FROM THOSE IN THE FORWARD-LOOKING STATEMENTS. FORWARD-LOOKING STATEMENTS INCLUDE THE INFORMATION CONCERNING OUR FUTURE FINANCIAL PERFORMANCE, BUSINESS STRATEGY, PROJECTED PLANS AND OBJECTIVES. THESE FACTORS INCLUDE, AMONG OTHERS, THE FACTORS SET FORTH BELOW UNDER THE HEADING "RISK FACTORS." ALTHOUGH WE BELIEVE THAT THE EXPECTATIONS REFLECTED IN THE FORWARD-LOOKING STATEMENTS ARE REASONABLE, WE CANNOT GUARANTEE FUTURE RESULTS, LEVELS OF ACTIVITY, PERFORMANCE OR ACHIEVEMENTS. MOST OF THESE FACTORS ARE DIFFICULT TO PREDICT ACCURATELY AND ARE GENERALLY BEYOND OUR CONTROL.
EXCEPT AS REQUIRED BY LAW, WE ARE UNDER NO OBLIGATION TO PUBLICLY UPDATE ANY OF THE FORWARD-LOOKING STATEMENTS TO REFLECT EVENTS OR CIRCUMSTANCES AFTER THE DATE HEREOF OR TO REFLECT THE OCCURRENCE OF UNANTICIPATED EVENTS. READERS ARE CAUTIONED NOT TO PLACE UNDUE RELIANCE ON THESE FORWARD-LOOKING STATEMENTS. REFERENCES IN THIS FORM 10-K/A, UNLESS ANOTHER DATE IS STATED, ARE TO DECEMBER 31, 2012.
AS USED HEREIN, THE "COMPANY," "GOLDEN QUEEN MINING" "WE," "US," "OUR" AND WORDS OF SIMILAR MEANING REFER TO GOLDEN QUEEN MINING CO. LTD.
Item 1. Business.
Glossary
Certain terms used in this Form 10-K/A are described below. Note that Golden Queen Mining Co. Ltd. (the “Company”) uses Canadian Institute of Mining, Metallurgy and Petroleum definitions for the terms “reserves”, “measured resources”, “indicated resources” and “inferred resources”, and U.S. investors are cautioned that while these terms are recognized and required by Canadian regulations, the U.S. Securities and Exchange Commission does not recognize them.
Advance minimum royalty - Payment made before the start of commercial production under a mining lease agreement with landholders.
Ag – The chemical symbol for silver.
Au – The chemical symbol for gold.
Exploration Stage Company – A company engaged in the search for or exploration of mineral deposits, which is not in either the development or production stage.
Development Stage Company – A company engaged in the preparation of a mineral deposit with reserves for production and which is not in the production stage.
Production Stage Company – A company engaged in the exploitation of a mineral deposit with reserves.
4
Fault or faulting - A fracture in the earth’s crust caused by tectonic forces with displacement along the fracture.
Grade - A term used to assign value to resources and reserves, such as gram per tonne (g/t) or troy ounces per ton (oz/ton). Grades are reported both in Imperial and Metric units in this Form 10-K/A.
Heap leaching – A process which allows dilute cyanide solutions to percolate through run-of-mine or crushed ore heaped on an impervious pad to dissolve gold and/or silver.
Kriging - A geostatistical method used to assign grades to mineral resource and mineral reserve model blocks.
Mineral deposit - A mineral deposit is a mineralized body, which has been intersected by a sufficient number of drill holes or by underground workings to give an estimate of grade(s) of metal(s) and thus to warrant further exploration or development. A mineral deposit does not qualify as a commercially viable mineral deposit with reserves under standards set by the U.S. Securities and Exchange Commission until a final, comprehensive, economic, technical and legal feasibility study has been completed.
Ore - A natural aggregate of one or more minerals which, at a specified time and place, may be mined and processed and the product(s) sold at a profit or from which some part may be profitably separated.
Mineral Resource - A mineral resource is a concentration or occurrence of natural, solid, inorganic or fossilized organic material in or on the earth’s crust in such form and quantity and of such a grade or quality that it has reasonable prospects for economic exploitation. The location, quantity, grade, geological characteristics and continuity of a Mineral Resource are known, estimated or interpreted from specific geological evidence and knowledge. Mineral resources are sub-divided, in order of increasing geological confidence, into inferred, indicated and measured categories.
Mineral Reserve - A mineral reserve is the economically mineable part of an indicated or measured mineral resource as demonstrated by at least a preliminary feasibility study. This study must include adequate information on mining, metallurgy and processing, economic and other relevant factors that demonstrate, at the time of reporting, that economic exploitation can be justified. A mineral reserve includes diluting materials and allowance for losses that may occur when the material is mined. Mineral reserves are sub-divided in order of increasing confidence into probable and proven categories.
Stripping ratio - The quantity of waste rock in tonnes or tons removed to allow the mining of one tonne or ton of ore in an open pit.
Volcanics - Rock composed of clasts or pieces that are of volcanic composition.
General Development of Business
The Company was incorporated under the laws of the Province of British Columbia, Canada in November 1985 and has been exploring its mineral properties (the “Property”) located just south of Mojave in Kern County in southern California since that time.
The Company acquired its initial interest in the Property in 1985 and has since added to its holdings in the area. Work on the Property and on the Soledad Mountain project (the “Project”) is done by Golden Queen Mining Co., Inc., a California corporation and the wholly-owned subsidiary (the “Subsidiary”) of the Company.
The Company explored for gold and silver on the Property and did extensive engineering work on the Project between 1988 and 1999. M3 Engineering and Technology Corporation (“M3”), Tucson, Arizona completed a preliminary feasibility study for the Project in 1998 with gold and silver prices of $350/oz and $5.50/oz respectively. The Company did additional drilling and underground sampling in 1998 and 1999.
The Company had previously reported that it expected to begin producing gold and silver from the Project during the second half of 1998, based on the M3 preliminary feasibility study and once approvals and permits had been secured. Because of relatively low gold and silver prices in the late 1990s and in early 2000 however, the Company was not able to obtain financing for the Project and the Project was therefore put on hold in late 2000. Employees were laid off and costs were reduced to the minimum required to maintain rights to the Property. The major landholders agreed to a 3-year moratorium on advance minimum royalty and other property payments or until the prices of gold and silver improved. The Company recorded an asset impairment loss of $28,547,592 for the year ended December 31, 2000 and this asset impairment loss reduced the carrying value its Property and other assets to their estimated, net realizable value.
5
The Project remained on hold in 2011 pending the receipt of outstanding approvals and permits for the Project.
In order to update the prospects for the economic exploitation of the Soledad Mountain mineral deposit, the Company initiated a detailed review of the Project in mid-2002 to identify new approaches that would reduce both the capital cost to the start of production and future operating costs. The review was supported and complimented by a substantial amount of work done by independent engineers and contractors. The review was documented and compiled into an in-house report to assist management in determining the prospects for development of the Project at gold and silver prices prevailing in late-2006. The review indicated reasonable prospects for the development of the Project and this was the basis for work on the Project that has continued to date.
The Company retracted the historical mineral reserve estimates, which were based on the report prepared by M3 in 1998, in 2005 on the basis that they were out of date and not supported by National Instrument NI 43-101 (“NI 43-101”), being the Canadian regulation that governs the disclosure of technical information by natural resource companies.
The Company engaged SRK Consulting (U.S.), Inc. (“SRK”), Lakewood, Colorado in 2005 to prepare a NI 43-101 compliant technical report (the “Technical Report (SRK)”) to validate and confirm the mineral resource estimates in compliance with NI 43-101. SRK released the Technical Report (SRK) on March 6, 2006 and this confirmed the mineral resource estimates (see “Exploration & Mineral Resources” heading below).
The Company engaged Norwest Corporation (“Norwest”), Vancouver in 2007 to prepare a further NI 43-101 compliant technical report (the “Technical Report (Norwest)”) to assess mineral reserves for the Project as part of an independent feasibility study based upon the technical work that had been completed to the end of 2006. The results of the Norwest study were disclosed in a press release on December 14, 2007 (see “Mineral Reserves” heading below), which is available on SEDAR and on the Company’s website at www.goldenqueen.com.
An updated feasibility study and economic analysis was prepared by Norwest with input from independent consulting engineers and management and the results were disclosed in a news release on April 6, 2011.
The Project will produce two different types of materials with overlapping time frames. Open pit mining and heap leaching as presently planned is approximately one year of construction, twelve years of mining, thirteen years of leaching for the production of gold and silver (which overlaps with the twelve years of mining), and a further two years of rinsing and drain-down. The production and sale of aggregate is expected to commence fairly early in the mine life and continue for up to thirty years or until the stockpile of quality waste rock has been exhausted. The Company also plans to process and sell leached and rinsed residues from the heap leach operation for a range of uses to local and regional markets. Reclamation will proceed concurrently where feasible, but is nonetheless expected to require two years following cessation of all mining, and a further three years of post-closure monitoring. Monitoring will continue until the reclamation success criteria are met.
There are a number of risks associated with the Project and readers are urged to consider these risks and possible other risks, in order to obtain an understanding of the Project (see “Item 1A. Risk Factors” heading below).
The registered office of the Company is located at 1200 - 750 West Pender Street, Vancouver, BC, Canada V6C 2T8 and its executive offices are located at 6411 Imperial Ave., West Vancouver, BC, Canada, V7W 2J5.
The U.S. dollar (“U.S.$) is used in this Form 10-K/A and quantities are reported in Metric units with Imperial units in brackets.
6
Project Background
The Project is located approximately 8km (5miles) south of Mojave in Kern County in southern California. See Figure 1, property location map under below.
Gold mining on Soledad Mountain dates back to the late 19th century. The largest producer in the area was Gold Fields America Development Co. (“Gold Fields”), a subsidiary of Consolidated Gold Fields of South Africa. This syndicate operated an underground mine and mill on the property from 1935 to 1942, when the mine was forced to close by War Production Board Order L-208. Production after the war was minimal, as costs had increased while the price of gold remained fixed at $35/oz until 1973.
Exploration & Mineral Resources
The Soledad Mountain mineral deposit is hosted in a volcanic sequence of rhyolite porphyries, quartz latites and bedded pyroclastics that occur on a large dome-shaped feature, called Soledad Mountain, along the margins of a collapsed caldera. Higher-grade precious metals mineralization is associated with steeply dipping, epithermal veins, which occupy faults and fracture zones that cross cut the rock units and generally trend northwest. The veins are contained within siliceous envelopes of lower-grade mineralization that forms the bulk of the mineral resource.
The primary rock types that occur on the Property are rhyolite porphyry and flow-banded rhyolite, quartz latite porphyry, pyroclastics and siliceous vein material. Little or no clay occurs in any of the rocks and the rocks contain upwards of 60% Si as SiO2. Rhyolite porphyry and flow-banded rhyolite were grouped as a single rock type for the metallurgical test work.
Extensive programs of mapping, diamond drilling, reverse-circulation drilling and underground diamond drilling and channel sampling were carried out on the Property between 1985 and 1999. Company geologists and engineers managed these programs. The geological database today includes the crosscut assay data recorded on linens by Gold Fields between 1933 and 1942 and the results of exploration done on the Property by Rosario Exploration and Shell/Billiton. The database contains 71,325 samples, generated from over 113,593m (372,649ft) of drilling and sampling of underground crosscuts.
Ore zones were shaped manually by Company geologists to define continuity with a low-grade cutoff grade of 0.274g/t AuEq (0.008oz/ton AuEq). Prices for gold and silver of $325.00/oz and $6.00/oz and recoveries for gold and silver of 78.0% and 60.0% respectively were used to calculate the gold-equivalent cutoff grade for this purpose.
Note:
| AuEq is the gold-equivalent grade, which is calculated as follows: | |
| AuEq g/t = Au g/t + {(Ag/R1 )xR2 } g/t where | |
| R1 = Au price in $/oz/Ag price in $/oz; R2 = Ag recovery in %/Au recovery in %. |
Mineral Resources Development, Inc. (“MRDI”), San Mateo, California completed a detailed due diligence review of the procedures used by the Company between 1998 and 2000. This work involved statistical analyses, the evaluation of grade capping, the design of appropriate kriging techniques and setting criteria for the classification of resources. The Company received a final report with recommendations in May 2000.
The Company engaged SRK Consulting (U.S.), Inc. (“SRK”), Lakewood, Colorado in 2005 to prepare a NI 43-101 compliant technical report (the “Technical Report (SRK)”) to validate and confirm the mineral resource estimates in compliance with NI 43-101. SRK and AMEC E&C Services, Inc. (AMEC acquired MRDI in 2000) did an exhaustive review of the database information and this included the MRDI recommendations from 2000 and audited the geological model over a period of five months in late 2005 and early 2006. Linear kriging was used to estimate gold and silver grades for all blocks in the model. SRK released the Technical Report (SRK) on March 6, 2006.
Mineral resources were classified as follows:
- Measured – first drill hole or crosscut within 21m (70ft) and a second drill hole or crosscut within 30m (100ft).
7
- Indicated – first drill hole or crosscut within 43m (140ft) and a second drill hole or crosscut within 61m (200ft).
- Inferred – everything beyond measured and indicated, but with two drill holes or cross-cuts within 91m (300ft) and this is more restrictive than the MRDI recommendation from 2000.
Note that mineral resources are not mineral reserves and do not have demonstrated economic viability.
Cautionary note to U.S. investors concerning estimates of measured or indicated resources: This section uses the terms “measured resources” and “indicated resources”. We advise U.S. investors that while these terms are recognized and required by Canadian regulations, the U.S. Securities and Exchange Commission does not recognize them.
Soledad Mountain Project - Measured & Indicated Mineral Resource Estimates
| Grade | ||||||||
| AuEq | Gold | Silver | ||||||
| Category | t | ton | g/t | oz/ton | g/t | oz/ton | g/t | oz/ton |
| Measured | 39,720,000 | 43,692,000 | 1.118 | 0.033 | 0.926 | 0.027 | 14.86 | 0.43 |
| Indicated | 50,774,000 | 55,851,000 | 0.789 | 0.023 | 0.603 | 0.018 | 11.47 | 0.33 |
| Total & Average | 90,494,000 | 99,543,000 | 0.912 | 0.027 | 0.744 | 0.022 | 12.96 | 0.38 |
Cautionary note to U.S. investors concerning inferred resources: This section uses the term “inferred resources.” We advise U.S. investors that while this term is recognized and required by Canadian regulations, the U.S. Securities and Exchange Commission does not recognize it. Inferred resources have great uncertainty as to their existence, and great uncertainty as to the economic feasibility of exploiting these in a mining operation. Under Canadian rules, estimates of an inferred resource may not form the basis of pre-feasibility or feasibility studies except in rare cases. Investors are cautioned not to assume that all of or part of an inferred resource exists or will be economically exploitable.
Soledad Mountain Project - Inferred Mineral Resource Estimates
| Grade | ||||||||
| AuEq | Gold | Silver | ||||||
| Category | t | ton | g/t | oz/ton | g/t | oz/ton | g/t | oz/ton |
| Inferred | 32,073,000 | 35,280,000 | 0.634 | 0.019 | 0.497 | 0.015 | 10.84 | 0.32 |
| Note: | |
|
1. |
AuEq is the gold-equivalent grade, which is calculated as follows: AuEq g/t = Au g/t + {(Ag/R1 )xR2 } g/t where R1 = Au price in $/oz/Ag price in $/oz; R2 = Ag recovery in %/Au recovery in %. Prices used in the calculations are $450.00/oz and $7.50/oz for gold and silver respectively. Recoveries used in the calculations are 78.0% and 60.0% for gold and silver respectively. |
| 2. | Ore zones were shaped manually with a cutoff grade of 0.274g/t (0.008oz/ton) AuEq. |
| 3. | The mineral resources were calculated with a cutoff grade of 0.274g/t (0.008oz/ton) AuEq. |
8
Peter Clarke, P.Eng., SRK Consulting (U.S.), Inc., a Qualified Person as described in NI 43-101, signed the Technical Report (SRK). The Technical Report (SRK) is available on the Company’s web site at www.goldenqueen.com.
Infill Drill Program
The Company announced that it had initiated an infill drill program in a news release on October 21, 2010. The drill was mobilized in April 2011 and drilling was completed in May 2011. A total of 20 drill holes (6,288 feet/1,917 m) was completed in the program.
The drill program was designed to test targets within the areas of the planned North-West and East open pits. Nine holes were drilled in the area of the North-West open pit with a total length of 2,020 feet/616 m. The North-West open pit is the planned location of the first phase of mining. A total of 11 holes were drilled in the area of the East open pit with a total length of 4,268 feet/1,301 m. Key program objectives were to support potential reclassification of inferred material to higher confidence mineral resource categories, and eventually to mineral reserves, to continue to test continuity of mineralization, and provide data for road alignment and road construction purposes.
AMEC E&C Services, Inc., Sparks, Nevada, is currently integrating the results from the infill drill program into updated mineral resource estimates.
The Company has prepared a further drill program with 40 drill holes and approximately 7,200m (23,500ft) of drilling, designed to test a portion of the material classified as inferred within pit shells constructed in 2011. SRK concurred in the Technical Report (SRK) that strategically targeted drilling could upgrade a significant portion of the inferred to the measured or indicated categories. The Company intends to do extensive infill drilling and further exploration only once the mine is in production.
Mineral Reserves
The Company engaged Norwest in January 2007 to prepare a NI 43-101 compliant technical report (the “Technical Report (Norwest)”) to assess mineral reserves for the Project as part of an independent feasibility study based upon the technical work that had been completed to the end of 2006. The results of the Norwest study were disclosed in a press release on December 14, 2007 and the Technical Report (Norwest) is dated March 2008.
Sean Ennis, P.Eng., Norwest Corporation, a Qualified Person as described in NI 43-101, signed the Technical Report (Norwest). The Technical Report (Norwest) is available on the Company’s web site at www.goldenqueen.com.
Norwest completed substantial additional mine design between 2008 and 2010. An updated feasibility study and economic analysis was prepared by Norwest with input from independent consulting engineers and management and the results were disclosed in a news release on April 6, 2011. The mineral reserve estimates determined by Norwest are set out in the table below.
| Soledad Mountain Project - Mineral Reserve Estimates | ||||||||
| Diluted Grades | Contained Metal | |||||||
| Gold | Silver | Gold | Silver | |||||
| Classification | tonnes | ton | g/t | oz/ton | g/t | oz/ton | oz | oz |
| Proven* | 28,301,000 | 31,196,000 | 0.823 | 0.024 | 13.72 | 0.40 | 748,700 | 12,478,400 |
| Probable* | 20,091,000 | 22,146,000 | 0.545 | 0.016 | 11.45 | 0.33 | 352,900 | 7,381,900 |
| Total & Average | 48,392,000 | 53,342,000 | 0.708 | 0.021 | 12.77 | 0.37 | 1,101,600 | 19,860,300 |
9
*Indicated recoveries for gold and silver based upon extensive test work are 85.0% and 52.5% as discussed in detail in section Mineralogy, Process Development & Flow Sheet below.
Norwest allowed for 15% dilution at zero grade in calculating the mineral reserves estimates.
Cautionary note to U.S. investors concerning proven or probable reserve estimates: This section uses the terms “proven reserves” and “probable reserves”. We advise U.S. investors that these terms are defined strictly in accordance with applicable Canadian regulations. We further advise U.S. investors that the mineral reserve estimates are not compliant with the Securities and Exchange Commission Industry Guide 7 as a final bankable feasibility study has not been completed.
These mineral reserve estimates are included in the Measured & Indicated Mineral Resource Estimates set out in the table in the section Exploration & Mineral Resources above.
Exploration Potential
Additional geological targets have been identified on the Property. These targets are generally peripheral (east, south and west) to the currently defined mineral resources. In the east, two additional zones of quartz stringer veins have been mapped in the hanging wall of the Karma/Ajax vein system. Toward the south, an extension of the Silver Queen vein system is open and additional vein splits have been mapped on surface. Also, an extension of the Golden Queen vein system appears to be offset by an east-west trending fault. Initial drill results indicate widths of 8m (26ft) with good gold and silver grades.
The exploration work to date has focused on known fault/vein structures central to the deposit. The host volcanics associated with the mineralization on the Property extend further to the south and have not been fully evaluated. Further, anomalous gold values have also been found in the low volcanic hills that protrude from the valley floor to the northwest of the Property.
The continuity of mineralization at depth remains untested.
Independent Feasibility Study
An updated feasibility study and economic analysis was prepared by Norwest with input from independent consulting engineers and management and the results were disclosed in a news release on April 6, 2011.
Gold and silver prices used to model the cash flows were $1,457.00 and $39.63 respectively, the London a.m. fix for precious metals on April 6, 2011. The Project has an indicated internal rate of return (“IRR”) on capital employed of 83.7% . The net present value (“NPV”) is $722million with a discount rate of 8.0% and the undiscounted, cumulative net cash flow is approximately $1.16billion. The indicated contribution of gold and silver to gross revenues is 77% and 23% respectively at current gold and silver prices with an all-inclusive, average cash cost per ounce of gold produced, net of silver credits, of $133/oz.
If gold and silver prices are reduced by 10% from these levels, the indicated IRR is 74.1%, the NPV is $579million with a discount rate of 8% and the undiscounted, cumulative net cash flow is $996million. The all-inclusive, average cash cost per ounce of gold produced, net of silver credits, increases from $133/oz to $157/oz at these lower gold and silver prices.
When trailing 36-month average gold and silver prices of $1061.25/oz and $17.78/oz respectively to the end of March 2011 are used to model the cash flows, the indicated IRR is 51.6% before taxes, the NPV is $343million with a discount rate of 8% and the undiscounted, cumulative net cash flow is $617million. The all-inclusive, average cash cost per ounce of gold produced, net of silver credits, increases further to $313/oz. The trailing 36-month average precious metals prices are accepted by the U.S. Securities And Exchange Commission when reporting mineral reserves estimates.
Technical information is provided in the following sections.
10
Mine Design
Norwest did detailed mine designs between 2008 and 2010. These detailed mine designs were adapted from the original 2007 designs to reduce waste to ore mining ratios, enhance opportunities for backfill placement and develop pit phasing and access which would lower the costs associated with backfilling. One of the key considerations was also to develop sufficient ore to fill the heap leach pads.
Mineral reserves estimates are discussed in section Mineral Reserves above.
The average waste to ore mining ratio has been reduced from 2.12:1.0 in 2008 to 1.85:1.0.
An independent consulting engineer did open pit slope stability analyses in 1995 and these included analyses with the ultimate slopes subjected to a maximum, credible earthquake acceleration of 0.297g. The consulting engineer recommended an ultimate slope angle of 55o with an indication that this angle could be safely increased to 63.4 o. The Company drilled five diamond drill holes in 1997 specifically to obtain rock strength parameters for further slope stability analyses. An independent consulting engineer did further slope stability analyses and confirmed the ultimate slope angle of 55o. Norwest use an inter-ramp slope angle of 55o for the mine design done in 2011.
Disposal of waste rock will be largely in mined-out phases of the open pit and a single, external waste rock pad will be constructed to provide a pad for the aggregate operation. Independent consulting engineers did waste rock stability analyses in 1996 and again in 1998 and these were confirmed by Norwest in 2007. A further stability analysis was done in 2010. These analyses concluded that backfilled waste rock and the waste rock pad would be stable under both static and seismic loading conditions, both during operations and after closure and reclamation. Some sloughing of the faces of backfilled waste rock or the waste rock pad could occur during significant seismic events in the area.
Waste rock will be disposed of at an angle of repose of 37o (1.3:1.0) and a specific volume of 18.1ft 3/ton that represents a 30% net swell after allowing for partial compaction. Waste rock will be re-sloped to 27o (2.0:1.0) as part of closure and reclamation. The toes of the re-sloped fills will also typically remain within the open pit perimeter or within the Approved Project Boundary. There is no groundwater in the areas where waste rock will be disposed of and this will therefore not have an impact on the stability of the waste rock pad.
Open Pit Operation
Standard, open pit mining methods will be used to mine ore and waste rock. Mining operations will include drilling, blasting, loading and hauling and it is expected that the Company will do the mining. All open pit mining will occur in dry conditions above the water table.
Planned mining rates are 13,000 tons of ore and 27,000 tons of waste rock per day or 4.55million tons of ore and 9.45million tons of waste rock per year for a combined total of 14.0million tons per year and these have been reduced from the earlier planned mining rates. Mine life has increased from 7 years to 12 years. The total quantity of ore to be mined, crushed and screened and stacked on the heap leach pads is estimated to be 48.5 million tonnes (53.3 million tons). Total waste rock to be mined is estimated as 89.7 million tonnes (98.7 million tons) of which 17.3 million tonnes (19.0 million tons) is expected to be processed and 13.6 million tonnes (15.0 million tons) sold as aggregate.
The quantities of both ore and waste rock mined per year will vary from year to ensure the most efficient disposal of waste rock in mined-out phases of the open pit.
Ore-from-waste separation will require special attention to ensure that overall grade projections are met.
Underground mine openings will be encountered from time-to-time during open pit mining and this will be allowed for in the detailed mine planning.
The open pit design done by Norwest assumed a loaded downhill ore haul to the primary crusher for the life of the mine. The intent is to replace trucks with a downhill pipe conveyor to convey ore for a number of the mining phases with a reduction in the number of trucks required. Ore will be crushed by an in-pit, portable, primary crusher and fed to the pipe conveyor and conveyed to the coarse ore stockpile. The length of the pipe conveyor will be approximately 1,500ft. Various alternative mine designs are being explored in an effort to make the best possible use of the pipe conveyor and detailed engineering for this application remains to be completed.
11
Pipe conveyor technology is well-proven in practice with upwards of 200 installations in Europe and a number of installations in North America. Regenerative braking is typically used in all loaded downhill applications and the power generated would provide a small portion of the power required elsewhere in the Project.
Norwest prepared capital and operating cost estimates for the open pit operation for the updated feasibility study in 2011.
Mineralogy, Process Development & Flow Sheet
Studies show that gold is present as native gold and electrum with particles ranging in size from less than 10 micron to greater than 150 micron with the silver content of the electrum as high as 25%. Silver is also present as the mineral acanthite (Ag2S) with some native silver, pyrargyrite (3Ag2S.Sb2S3) and polybasite (9Ag2S.Sb2S3). Pyrite (FeS2), galena (PbS) and chalcopyrite (CuFeS2) are present in minor amounts with no indicated acid-generating potential. Multi-element x-ray fluorescence analyses show only trace quantities of mercury.
Test work done on Soledad Mountain ores from 1989 to 2007 shows that these ores are readily amenable to heap leaching provided the ore is crushed and/or ground to relatively small sizes. A range of parameters required to design a heap leach operation, such as agglomerate strength, percolation rates under load and the consumption of cyanide and other reagents, were determined.
It was proposed to crush and screen ore to 100% - 8mesh or 100% - 2.37mm and a four-stage crushing and screening plant using vertical shaft impact crushers in the third and fourth crushing stages was designed for the Project in the 1990s. This approach is referred to as conventional crushing in the following analysis. The Company did a review that provided new insights into the historical test results in 2002. An alternative flow sheet was developed for the Project in late 2002. This was now a three-stage crushing and screening plant with a high-pressure grinding roll (“HPGR”) in the third crushing stage.
Confirmation HPGR tests were required to provide the following:
- The design parameters to both size the equipment and determine the motor sizes for the HPGR;
- The target particle size distributions for the commercial operation; and
- Information to finalize the flow sheet, e.g. the need to recycle edge material.
Samples of rhyolite ore and quartz latite ore were collected for the HPGR tests in July 2003 and in March 2004 respectively. The samples were crushed to 100% passing 32mm and 35mm respectively by McClelland Laboratories, Inc. (“MLI”), an independent metallurgical laboratory located in Sparks, Nevada. The samples were shipped by airfreight to the laboratories of two HPGR manufacturers in Germany where the actual HPGR tests were done. The crushed samples were returned to the MLI laboratory in Nevada for confirmation leach test work. The following conclusions were drawn based upon the results of bottle roll and column leach tests:
- Recoveries are higher with longer leach times and this confirms the historical findings;
- Recoveries increase with a finer crushed product and this effect is especially pronounced for silver; and
- Recoveries for the HPGR products are consistently higher and extraction rates faster than those obtained from conventional crusher products – the evidence is that this is due to penetration of leach solution into micro-cracks that are created by the high specific press force applied to the ore particles in the HPGR.
The detailed analysis of the leached residues or tails indicated that tests should be done on a high-grade and a low-grade sample to obtain data for the complete range of expected head grades. Two rhyolite samples were taken for this test work in April 2006. The total weight of the two samples was approximately 2,100kg (4,600lb). The samples were shipped by truck to MLI for first-stage crushing and then by airfreight to a HPGR manufacturers’ laboratory in Germany where the HPGR tests were done. The samples were returned to MLI and bottle roll tests and column leach tests were started in July and completed in December 2006. Final test results were received and combined with the results from earlier tests for a detailed recovery analysis.
12
The Company now estimates the following recoveries based upon the tails analysis:
| Primary Rock Types | Proportion | Gold | Silver |
| % | % | % | |
| Pyroclastics | 10.5 | 85.4 | 52.5 |
| Quartz Latite | 21.3 | 89.9 | 52.5 |
| Rhyolite | 68.1 | 83.4 | 52.5 |
| Undefined | 0.1 | Average | Average |
| Total & Average | 100.0 | 85.0 | 52.5 |
Tests were done on leached residues from two of the column leach tests to determine the percolation rates under load and the results of the tests were used to design the heap and confirm heap height for the heap leach operation.
The test work shows that the HPGR is expected to have distinct advantages over conventional crushing and screening to size and prepare particles for heap leaching in this particular application. The indicated benefits of using the HPGR will be:
- Higher recoveries in the heap leach operation due to micro-cracks in the ore particles;
- Faster gold and silver extraction rates;
- Stronger agglomerates due to a more favorable overall particle size distribution and this will also impact the flow rates of solution through the heap;
- Substantially lower capital costs than a conventional crushing - screening plant;
- Manageable dust control with fewer transfer points;
- Lower energy consumption and thus lower operating costs; and
- Exceptional circuit flexibility that will readily permit future upgrades such as a finer HPGR feed size or the recycle of edge product.
A technical paper entitled “Flow Sheet Development And Benefits Of The HPGR” was presented at the RANDOL conference held in Perth, Australia in late August 2005.
The HPGR consists basically of two counter-rotating rolls – one a fixed roll and the other a ‘floating’ roll. The ‘floating’ roll is mounted on and can move freely on two slides and the grinding forces are applied to the ‘floating’ roll by four hydraulic rams. Ore is choke-fed to the gap between the rolls and comminution takes place by inter-particle crushing in the bed of particles. The gap between the rolls is determined by the nip-in characteristics of the feed and the total grinding force applied, which in turn depends upon pressures in the hydraulic system. Each roll is driven by an electric motor via a planetary gear reducer. The total grinding force can range from 750kN to 20,000kN and pressures in the gap can range from 50MPa (approximately 7,000lb/in2) to 250MPa (approximately 36,000lb/in2). The unconfined compressive strengths of Soledad Mountain ores range from 2.2MPa (320lb/in2) to 118.9MPa (17,200lb/in2) by comparison.
Comminution in the HPGR is achieved without impact and essentially without attrition of the wear protection on the surface of the rolls.
An independent consulting engineering firm did the design of the crushing-screening plant including the HPGR in 2006. This design was revised in 2008 and further updated in 2011. The crushing-screening plant has been designed to process 650t/h (715ton/h to a possible throughput of 4,650,000 tonnes (5,119,000 tons) of ore per year. The engineering firm also prepared capital and operating cost estimates for the crushing-screening plant for the updated feasibility study in 2011.
13
Merrill-Crowe Plant
Gold and silver are typically recovered in a heap leach operation by dissolution in a dilute sodium-cyanide solution and then by precipitation with zinc or adsorption on activated carbon. The zinc precipitation process, referred to as the Merrill-Crowe process after its developers, is used to recover gold and silver when the silver to gold ratio in solution is greater than 10:1. The silver to gold ratio is expected to average 15:1 for the Project and a Merrill-Crowe precipitation plant will therefore be required. In the Merrill-Crowe process, zinc dust is metered into the deaerated, pregnant solution and gold and silver are precipitated as micron-sized, metallic particles. The precipitate is dried, mixed with selected fluxes and melted in an induction furnace. The molten mix of gold and silver, i.e. the dorè, is poured into molds. The dorè is cooled, cleaned and shipped to a commercial refinery where gold and silver bullion are produced for final sale.
The Merrill-Crowe process is highly efficient and recoveries in a commercial plant typically range upwards of 98%.
An independent consulting engineering firm did detailed designs and prepared capital and operating costs estimates for the Merrill-Crowe plant and this includes the refinery for the updated feasibility study in 2010.
The Heap Leach Pad And The Heap
A dilute, sodium-cyanide solution will be used to extract gold and silver in the heap leach operation. Extensive procedures will be put in place to protect workers and the environment. The cyanide will be received in a dissolved form by truck directly from the manufacturer and will be pumped to a storage tank on site and from there to the process.
An independent consulting engineering firm is responsible for the design of the heap leach facility, which has been designed for zero discharge. The design contemplates that the first heap leach pad to be constructed, the Phase 1 pad, will be located on the northern side of Soledad Mountain. A second pad, the Phase 2 pad, will be located on the western side of Soledad Mountain, if required. The Phase 1 pad will be a single-use, dedicated pad.
The following are the design criteria for the Phase 1 pad:
- The pad has been designed as a permanent, single-use pad;
- Dry specific weight of agglomerated ore ranges from 1.36t/m3 (85lb/ft3 ) to 1.86t/m3 (116lb/ft3 );
- Maximum heap height is 60m (200ft);
- Lift height is 10m (33ft);
- The angle of repose of the agglomerated ore is 2.0H:1.0V;
- Slopes are 2.5H:1.0V on the north and west sides and 2.0H:1.0V on the south and east side of the heap;
- Nominal capacity of the pad is 55 million tonnes (60 million tons) and
- The heap is to be constructed in 3 stages.
The Phase 1 heap leach pad will be lined with a composite liner consisting of a compacted soil liner and a geomembrane. The geomembrane will in turn be covered and protected by 45cm (18inch) of a crushed liner protection fill that will act as a drainage layer. A network of perforated pipes will be installed in the liner protection fill. Solution will drain by gravity to a pump box and will be pumped to the Merrill-Crowe plant where gold and silver will be extracted from the pregnant solution. The barren solution will be returned to the heap and drip emitters will be used on the heap to limit evaporation losses. Drip emitters will be covered. An overflow pond is located east and downstream of the pump box.
Detailed site investigations were done in the area where the Phase 1 heap leach pad will be constructed in 2004 and again in 2006. The design of the Phase 1 pad has been completed for construction. An experienced contractor based in Bakersfield prepared a construction cost estimate for the Phase 1, Stage 1 portion of the pad for the updated feasibility study in 2011.
14
The design of the heap leach pad meets all applicable regulatory requirements. Note that the heap must be reclaimed to approximately 25ft above original contours to meet State reclamation requirements.
An equipment manufacturer did the heap leach stacking study for the conveying and stacking system and prepared capital and operating cost estimates for the updated feasibility study in 2011.
Services
The Project is located approximately 8km (5 miles) south of Mojave in southern California. The metropolitan areas of Rosamond and Lancaster lie from 14km (9 miles) to 32km (20 miles) to the south. Access to site is from State Route 14 and Silver Queen Road, an existing paved County road. Mojave is a railroad hub for the Burlington Northern/Santa Fe and Union Pacific/Southern Pacific railroad lines. Services such as a hospital, ambulance, fire-protection, garbage and hazardous waste disposal, schools, motels and housing, shopping, airport and recreation are available in Mojave and its surroundings.
Water Supply
A water supply will be required for the operation and it is expected that groundwater will be used.
A detailed study of the site hydrogeology was completed in 2006 to confirm that groundwater would be a dependable source of water for the Project. As many as 35 wells have been drilled in the greater Project area in the past. Records for some of these wells plus step rate test data from production well PW-1 drilled by the Company indicate that, initially, two production wells can provide the maximum estimated water requirement of 147.6m 3/h (650gal/min). Production well PW-1 is located approximately 1km (3,000ft) north of the Project. A second production well was drilled approximately 300m (1,000ft) north of well PW-1 and cased and tested and a third production well, PW-3, was drilled in an area west of the Project in November 2008 and development of the well has been completed.
Water samples taken from five characterization wells on site indicate that groundwater can be used in the heap leach process without pre-treatment.
An independent consulting engineering firm did the design for the water supply and the process water and firewater distribution systems and prepared capital and operating cost estimates for the updated feasibility study in 2011.
The Company filed an application for a water service connection with Antelope Valley – East Kern Water Agency in February 2008 to provide a backup water supply. This was mandated as one of the conditions of approval in the Conditional Use Permits that were issued in 1997. A legal agreement is being completed to secure the backup water supply if required.
The Company is in discussion with the Rosamond Community Services District to determine the availability and feasibility of using recycled water for the Project and initial engineering studies have been initiated.
Power Supply
The regional utility, Southern California Edison (“SCE”), will supply power.
A main power line with three sets of conductors runs along the eastern property boundary. The top two sets of conductors carry 66kV while the bottom set of conductors carries 12,460V and these are the common primary voltages in SCE territory.
SCE provided a rate for power for the updated feasibility study in 2011. The rate structure is complex and a mix of consumption and demand charges applies to peak, mid-peak and off-peak periods.
SCE indicates that the power factor is an absolutely critical item in SCE territory. SCE requires a minimum operating power factor of 0.95 and a load-sensitive capacitor bank will be installed to achieve this. SCE may also limit the number of starts permitted for the major motors per day.
15
It is expected that the Company will install and own the utility tie sub-station, which will transform the incoming voltage of 66kV to 4160V and this will be the mine distribution voltage. Overhead transmission lines will distribute power from the utility tie sub-station to the areas where power will be required.
A diesel-powered generator will provide standby power and this will be set beside the Merrill-Crowe plant. Power will be available to operate the pregnant and barren solution pumps in case of a SCE power failure.
An independent consulting engineering firm prepared a detailed motor list and estimated the power consumption for the Project. The firm also prepared a detailed capital cost estimate for the supply of power to the Project for the updated feasibility study in 2011. The engineering firm is currently doing the detailed electrical design and cost estimates for construction in 2012. This effort is being supported by a Method of Service study being done by SCE.
Assay Laboratory, Offices & Workshop/Warehouse
Detailed designs for all services required for a mining operation such as an office, workshop and warehouse, diesel fuel and gasoline storage and an assay laboratory have been completed. Detailed capital and operating cost estimates were prepared for these facilities for the updated feasibility study in 2011.
Project Management & Operating Manpower
A management team will be assembled in Mojave to manage the Project. Manpower is expected to average 34 salaried and 129 hourly-paid workers once the mine is in full production with a further 15 hourly-paid workers required for the aggregate operation. Indications are that skilled workers will be available locally as there are a number of mines and quarries in production in the greater Mojave area.
Construction manpower is expected to peak at 200 with an estimated 141.7 man-years required for construction.
Aggregate
It is expected that a by-product aggregate and construction materials business can be developed once the heap leach operation is in full production, based on the location of the Project in southern California with close proximity to major highways and railway lines. The source of raw materials will be quality waste rock specifically stockpiled for this purpose. The waste rock can be classified into a range of products such as riprap, crushed stone and sand with little further processing. Test work done in the 1990s confirmed the suitability of waste rock as aggregate and construction material. The production and sale of aggregate is expected to commence fairly early in the mine life and continue for up to thirty years or until the stockpile of quality waste rock has been exhausted. The Company also plans to process and sell leached and rinsed residues from the heap leach operation as aggregate or for other uses to local and regional markets.
Environmental Issues, Approvals & Permits
Introduction
The Company’s Soledad Mountain Project requires three main permits that will give the Company the right to begin mining and processing operations. These are:
| a. |
Amended Conditional Use Permits to be issued by Kern County (see “CEQA/NEPA” heading below); | |
| b. |
Authorities to Construct to be issued by the Eastern Kern Air Pollution Control District (see “Authority to Construct & Permit to Operate” heading below; and | |
| c. |
Waste Discharge Requirements to be issued by the Lahontan Regional Water Quality Control Board (see “Water Quality” heading below. |
The environmental issues and the efforts made to secure the three main permits are described in detail under the subheadings “CEQA/NEPA”, “Authority to Construct & Permit to Operate”, and “Water Quality”.
16
General
The area surrounding Mojave is typical of the western Mojave Desert. The immediate vicinity of the Project is sparsely populated with considerable historical and more recent mining activity. The Standard Hill, Tropico and Cactus mines are located within a radius of 12km (7.5 miles) of the Property.
The Project and the immediate area surrounding the Project or a total of approximately 9,600 (3,887 hectares) acres are included in the Specific Plan (the “Plan”) for Soledad Mountain - Elephant Butte & Vicinity - south of Mojave. This Plan was prepared in March 1973 and adopted by the Kern County Board of Supervisors as Resolution 73-485 on June 18, 1973. Gold and silver mining operations are recognized in the Plan as important land uses and the protection of mineral deposits, potentially of commercial value, is included in the Plan through restriction of incompatible land uses. The Project as presently defined is consistent with the Plan.
An independent consulting engineering firm reviewed the major approvals and permits that were issued for the Project in the late 1990s and the current regulatory environment in California in 2005. Additional work was indicated due to the time that had passed since the permits were first issued and changes that had been made in the Project. There have also been changes in regulations imposed by two levels of government in California. No significant environmental issues were however identified in the review and furthermore, the footprint of the Project as presently defined has been reduced in both a physical and an environmental sense.
Environmental issues and the status of approvals and permits are summarized in the following sections.
CEQA/NEPA
The Project is subject to the California Environmental Quality Act (“CEQA”) and the National Environmental Policy Act (“NEPA”), each of which requires written analysis of proposed mining activities and their effect on the physical, biological, social and economic resources of the area. This analysis is known under CEQA as an environmental impact report (“EIR”), and under NEPA as an environmental impact statement (“EIS”).
The environmental setting of the Project was documented in a number of baseline studies prepared between 1990 and 1997. The Kern County Board of Supervisors unanimously approved two Conditional Use Permits (“CUP”) for the Project in September 1997 (i.e. CUP Case No. 41, Map No. 213 and CUP Case No. 22, Map No. 214). The Bureau of Land Management subsequently issued its Record of Decision approving the Plan of Operations under NEPA in November 1997.
The State of California introduced backfilling requirements for certain types of open pit, metal mines in December 2002. The Company contended that these regulations did not apply to the Project under a grandfathering provision included in the regulation. The Company, therefore, pursued both a favorable interpretation under the regulation and subsequently an amendment of the regulation with the State Mining and Geology Board (the “Board”) in 2006. These efforts were supported by Kern County officials. Both approaches were rejected by the Board and the decision was duly recorded by the Board in January 2007.
The Company completed an Application for a revised Surface Mining and Reclamation Plan, which was submitted to the Kern County Planning Department (the “Planning Department”) in April 2007. The Planning Department completed its review of the Application and deemed the Application complete in July 2007. The Planning Department noted that changes proposed for the Project constituted new information that required evaluation of potential impacts and mitigation in a supplemental EIR (“SEIR”). The Planning Department issued a Request for Proposal to prepare the SEIR to a total of 17 qualified consultants in October 2007. The Chambers Group was awarded the contract to prepare the SEIR. The Company signed an agreement with the Planning Department in February 2008 and made a payment of $55,000 which was 50% of the cost of preparing the SEIR. This agreement was approved by the Kern County Board of Supervisors at its regular meeting on March 11, 2008.
The kickoff meeting with the Chambers Group was held on the afternoon of March 12, 2008. The Chambers Group completed the initial review of information provided by the Planning Department and issued a draft Notice of Preparation by mid-June. The Planning Department then terminated the agreement with the Chambers Group due to a conflict of interest related to another project. The Planning Department mailed the Notice of Preparation and the supporting reports to agencies on the mailing list on August 18 with a deadline for responses by September 17. A total of 66 sets of information were mailed by the Planning Department directly plus a further 15 sets were mailed by the State Clearinghouse.
17
The State Office of Mine Reclamation (“OMR”), accompanied by the Planning Department and Company management, met on site for a due diligence review on September 16, 2008. The OMR indicated that it would require additional time beyond the September 17, 2008 deadline to prepare comments on the Project.
The Planning Department received nine comment letters by September 17, 2008 and two additional comment letters at the end of September plus a twelfth comment letter thereafter. The OMR submitted comments to the Planning Department on September 30, 2008.
The County selected RGP Planning and Development Services (“RGP”) to continue with the preparation of the SEIR. The agreement with RGP was approved by the Kern County Board of Supervisors at its regular meeting on October 14, 2008. The estimated cost of the work to be done by RGP was $123,800 and the Company paid this amount on September 25, 2008.
A scoping meeting was held on site attended by RGP, the Planning Department, and Company management.
The Company submitted responses to ten of the comment letters referred to above to the Planning Department on November 27, 2008 and responses to the OMR’s comment letter on December 16, 2008.
RGP prepared a Progress Report, which the Planning Department released to the public, on December 30, 2008.
The Company’s consulting engineers did extensive studies to confirm the possibility of backfilling mined-out phases of the open pit in January and February 2009. The studies were presented to the Planning Department in a meeting in Bakersfield on March 11, 2009. The Planning Department requested that the Project Description be revised to include the backfilling studies and this was done and submitted to the Planning Department on March 24. The Application for the revised Surface Mining and Reclamation Plan was also revised and submitted to the Planning Department on April 5. A further revision of the Application was requested by the Planning Department on May 5 and this was completed and submitted on May 25. The Company recognizes that the reviews by the Planning Department have added to the overall quality of the Application.
The Planning Department’s target for the release of the SEIR to the public was then late July or early August 2009.
The following two items are of note:
- The Company completed a number of studies and did significant work on site between 2005 and 2010 to document that the environmental setting for the Project had not changed since 1997. The studies have been submitted to the Planning Department.
- The Bureau of Land Management has confirmed that its Record of Decision approving the Plan of Operations under NEPA in November 1997 remains valid and that no additional reviews or approvals are required before the Company can proceed with the Project.
The SEIR was distributed by the Planning Department, as lead agency under the provisions of CEQA to approximately 430 recipients and notification of release to 985 recipients on January 11, 2010. At the conclusion of the review period, the Planning Department had received 26 responses, including letters supporting the Project, letters that had concerns with the Project, and letters from regulatory agencies designated as responsible agencies under CEQA. Comments were also received from the State of California on the reclamation plan provisions. The lead agency responded in writing to the comments received by February 25, 2010. The Company supported the lead agency’s effort by supplying additional information that was requested. As required by CEQA, the lead agency provided written responses to those who commented no later than 14 days prior to the project’s consideration by the Kern County Planning Commission “Commission”. The Commission was scheduled to consider this case at its regularly scheduled April 8, 2010, hearing.
18
The Commission formally considered the Project on April 8, 2010. At the meeting, the Commission, consisting of a panel of three commissioners, unanimously approved the Project. Two appeals to the certification were filed but subsequently withdrawn. Accordingly, the Commission’s actions became final on May 24, 2010. The thirty-day period for filing a lawsuit challenging the SEIR expired on June 23, 2010. The Commission certified the SEIR and adopted a Mitigation Measures Monitoring Program and a set of Conditions of Approval for the Project. The Mitigation Measures Monitoring Program and Conditions of Approval for the Project were amended by Commission Resolution No. 171-10 adopted on October 28, 2010 and are now final.
The Company is currently addressing conditions in the CUPs that apply to closure and closing reclamation.
Air Quality
Background Information
The Project lies within the Southeast Desert Air Basin, which falls under the jurisdiction of the Eastern Kern Air Pollution Control District (“EKAPCD”). The district is charged to regulate sources of air pollution within the basin, pursuant to authority granted under the federal Clean Air Act.
The area is designated as unclassified for PM10 emissions (that portion of the total suspended particulates less than 10 microns in size) and as a non-attainment area for ozone. The typically windy conditions and very dry nature of the area are responsible for high background PM10 levels recorded at several nearby meteorological monitoring stations.
Fugitive dust from a mining operation on the Property, combined with background dust, may result in unacceptable levels of PM10 emissions in the surrounding areas, especially downwind, and this may present the greatest potential environmental issue for the Project. A PM10 level of 44 micrograms per cubic meter was projected by computer modeling for an annual mining rate of 27 million tonnes (30 million tons) in 1996. This level is below the California attainment standard of 50 micrograms per cubic meter and the Federal standard of 150 micrograms per cubic meter. However, the Company believes that it will achieve compliance with applicable standards by a greater margin, as the modeling methodology assumes worst-case conditions, which are considered unlikely to be encountered in the actual operation based on the planned use of commonly accepted dust control techniques in all phases of the operation.
The Planning Department requested that the Air Quality Assessment and Health Risk Assessment for the Project be redone in February 2009 to provide current information for the SEIR. This study was completed and in the hands of the Planning Department and EKAPCD on July 21, 2009.
EKAPCD transferred an Emission Reduction Credit Certificate from Cactus Gold Mines Company to the Project in February 1999 and this remains valid.
Authority To Construct & Permit To Operate
The Company had obtained seven Authorities to Construct dated March 16, 2002. These permits expired on March 16, 2004 and were not renewed due to changes anticipated in the Project.
Ten applications for Authority to Construct permits were submitted to the EKAPCD in February 2011. The EKAPCD confirmed that the information required to support the applications was complete. The draft Authority to Construct permits were received in September 2011. The Company’s consulting engineers and legal counsel completed their review of the draft Authority to Construct permits in January 2012. The Authority to Construct permits were issued by EKAPCD on February 8, 2012. The Authority to Construct permits will be converted to a Permit to Operate after construction has been completed and subject to inspection by EKAPCD.
Meteorological Monitoring Station
The Company was required to install both upwind and downwind meteorological monitoring stations before the start of production and decided to proceed with the upwind monitoring station in May 2006 to add to the background database. The station was designed by Air Sciences Inc., Golden, Colorado and commissioned in September 2006.
19
The EKAPCD approved the design of the station in October 2006. Data is being recorded on a continuous basis and quarterly reports are being issued to the EKAPCD.
The equipment for the downwind meteorological monitoring station has been purchased and is in storage in Mojave.
Water Quality
The Project is located in the northern portion of the Antelope Valley Groundwater Basin. The mean recorded annual rainfall in the surrounding area is approximately 156mm (6.14in) . Typical patterns of precipitation are winter rains and summer thunderstorms and these tend to be short-lived and of high intensity. The site is dominated by Soledad Mountain and surface drainage patterns in the area are largely influenced by local topography. This varies from steep, rugged hillsides at the upper elevations to a gently sloping desert floor around the toe of Soledad Mountain. Runoff on the northern side of Soledad Mountain is via a series of gullies or channels, which direct surface flows to the north, northeast and northwest and eventually to the east to the Gloster and Chaffee Hydrologic Areas of the Antelope Hydrologic Unit.
There are no springs or intermittent streams in the immediate area. The closest intermittent stream is approximately 5km (3 miles) to the west. Evaporation rates are high. Groundwater is typically found at depths of 55m to 60m (180ft to 200ft) in the area north of the Project.
The Lahontan Regional Water Quality Control Board (“Regional Board”) is responsible for ensuring compliance with the federal Clean Water Act and California’s Porter-Cologne Water Quality Act. The Company submitted a Report of Waste Discharge (“ROWD”), prepared by a company based in Bakersfield to the Regional Board in June 1997. The Regional Board adopted Board Order No. 6-98-9 in March 1998 at a meeting held in Lancaster and this set the Waste Discharge Requirements for the Project.
Revised Report Of Waste Discharge
The ROWD submitted in 1997 included a design for the heap leach facility done before and in 1997. The Company and its consulting engineers prepared an engineering review that set out significant differences between the layout and designs prepared for the heap leach facility in 1997 and in 2005 and made a presentation to the Regional Board in Victorville in May 2006. The Regional Board requested that the Company submit a revised ROWD to reflect these changes. The Company and its consulting engineers prepared and submitted a revised ROWD to the Regional Board in March 2007.
The Regional Board completed its assessment of the revised ROWD and prepared draft Waste Discharge Requirements (“WDRs”) for the Project. The Regional Board waited for confirmation from the Planning Department that the SEIR had been certified before adopting a revised Board Order and setting revised WDRs for the Project.
The Regional Board unanimously approved WDRs and a Monitoring and Reporting Program for the Project at the joint, regular meeting held on July 14, 2010 in South Lake Tahoe, NV and Victorville, CA. The Board recommended adopting an order approving the WDRs subject only to locating an additional ground water monitoring well. This well was drilled and tested in November 2010. The Board Order was signed by the Executive Officer of the Regional Board on July 23, 2010.
The order approving the WDRs is a critical authorization for the construction and operation of, and establishes the discharge and monitoring standards for, the heap leach pads, rock stockpiles and other activities that have the potential to affect surface and ground waters.
Closure, Reclamation and Financial Assurance
Closure and reclamation will be done in accordance with the requirements set out in the CUPs and an approved Surface Mining and Reclamation Plan and as set out in the Board Order issued by the Regional Board.
20
The following general principles apply:
- Considerable experience gained in reclamation of other heap leach operations in the California deserts since the mid-1990s shows that reclamation can be completed successfully.
- The Surface Mining and Reclamation Plan will be an active plan with concurrent reclamation on one hand and alternative reclamation concepts to be sought and evaluated during the mine life on the other hand.
- Reclamation will proceed concurrently where feasible, but is nonetheless expected to require two years following ending of all mining and the processing and sale of aggregate and construction materials.
- The site drainage plan will be re-assessed to direct and thus control runoff to minimize erosion.
- Public safety will be a concern to be addressed both while mining is underway and as part of closure, and
- Post-closure monitoring will continue until revegetation targets are met with the ultimate goal of establishing a productive and self-staining eco-system.
The following points will have an impact on closure and reclamation costs:
- The footprint required for Project facilities has been significantly reduced from the earlier concepts;
- A road to the top of Soledad Mountain will remain for access to public facilities and will not be reclaimed;
- Waste rock will be disposed of in mined-out phases of the open pit as part of a comprehensive waste rock management plan;
- A planned major waste rock dump to the south of Soledad Mountain has been eliminated and this will significantly reduce the total disturbed area that must be reclaimed;
- The Company is committed to neutralizing, rinsing and then selling the leached residues; and
- The size and complexity of the crushing & screening plant has been significantly reduced with fewer structures that have to be dismantled and fewer concrete footings that have to be broken up or buried.
The following two items will require future consideration:
- The workshop and warehouse building and wash slab, security and human resources units, bulk fuel storage tanks, septic tank and leach field and the parking lot will find an approved, alternative industrial use and may not be dismantled and the site where these facilities are constructed may not have to be reclaimed.
- Two (or three) water supply wells may remain for future industrial or municipal use. The water supply infrastructure may be turned over to the Mojave Public Utility District to become part of the permanent facilities in the area.
Revegetation
Sites have been revegetated successfully elsewhere in the California deserts, for example at the Castle Mountain Mine in San Bernardino County, and it is expected that revegetation can be completed successfully for the Project as per the detailed revegetation plan that has been prepared by the Company’s consulting engineers.
A summary of the proposed revegetation procedures is given below:
- Two revegetation test plots were prepared and seeded north and south of Soledad Mountain in 2006 and 2007 respectively to demonstrate that seed collected locally can be an effective source of seed;
- Seed is being collected locally and a seed library has been established;
- Seed collected locally will be supplemented by seed contained in growth media that has been stockpiled;
- Surfaces will be prepared to provide textures suitable for desert plants and micro-basins will be created to trap seed and moisture;
- Hand seeding has been found to be effective and aerial (crop duster or helicopter) seeding can be used in areas that are inaccessible by vehicle or foot;
- Seeded areas will not require fertilizer and watering;
- Reclamation of disturbed areas will occur as soon as possible throughout the mine life;
- Control of runoff to minimize erosion will be a key to successful revegetation and
- Quantifiable goals for density and diversity of perennial species have been proposed.
21
Financial Assurances
The Company will be required to provide the following financial assurances for the Project:
- To the Bureau of Land Management, State of California and Kern County for general reclamation on site;
- To the State Water Resources Control Board for rinsing and closing reclamation of the leached residues on the heap and
- “Unforeseen events financial assurance” required by the State Water Resources Control Board to provide for an unforeseen event that could contaminate surface or groundwater.
The Company provided reclamation financial assurance in the form of a Payment Bond Certificate backed by a Certificate Of Deposit with Union Bank of California in the amount of $296,180 effective October 2011. The estimate for reclamation financial assurance is $314,712 for 2012 and this estimate has been submitted to the Engineering, Surveying & Permit Services Department for review and approval.
Cleanup On Site
The Company has done extensive cleanup on site over the past several years as summarized in the table below.
| Amount | |||
| Payable To | Years | US$ | No. of Loads |
| Contractor 1 | 2006 | 13,077.93 | 6.0 |
| 2007 | 41,946.50 | 48.5 | |
| 2008 | 138,336.00 | 160.0 | |
| 2009 | 15,425.00 | 17.5 | |
| 2010 | 20,310.00 | 19.5 | |
| 2011 | 93,285.00 | 74.0 | |
| Total | 2006-2011 | 322,380.43 | 325.5 |
| Contractor 2 | 2008 | 128,000.00 | 141.0 |
| Contractor 3 | 2010 | 18,644.60 | 5.0 |
| Grand Total | 450,380.43 | 466.5 |
Some work remains to be done and cleanup is continuing in 2012.
The work was done at a significant cost to the Company and demonstrates that the Company is committed to environmental stewardship and good housekeeping in its operations.
Environmental, Safety and Health Policy
The Company has an Environmental, Safety and Health Policy and a management system to implement the Policy.
The Company expects to sign the International Cyanide Management Code. The Code was developed under the auspices of the United Nations Environment Program and the International Council on Metals and the Environment. The International Cyanide Management Institute, a non-profit organization, administers the Code. Signatories to the Code commit to follow the Principles set out in Code and to follow the Standards of Practice. Companies are expected to design, construct, operate and decommission their facilities consistent with the requirements of the Code and must have their operations audited by an independent third party. Audit results are made public.
22
Offices and Employees
The Company’s principal executive offices are located in Vancouver at 6411 Imperial Ave., West Vancouver, BC V7W 2J5, Canada.
The Company currently has no employees. The Company utilizes an accounting firm, which is independent from our auditors, on a contract basis for the preparation of its financial statements, and engages various part-time consultants and contractors as needed for administrative services. Technical services related to Project permitting, development and land matters are performed by consultants and contractors on an as-needed basis.
Item 1A. Risk Factors.
The following is a brief discussion of distinctive or special characteristics of the Company’s operations and the industry in which it operates, which may have a material impact on, or constitutes risk factors in respect of, the Company’s future financial performance and in respect of an investment in the Company. These risk factors should be read in conjunction with disclosure on business and risks appearing in this Form 10-K/A and elsewhere.
The Likelihood of Continued Losses from Operations and Ability To Continue As A Going Concern
The Company has had no revenue from operations and has incurred cumulative losses from inception through December 31, 2011 of $66,682,638. Losses are expected to continue until such time as the Company can economically produce and sell gold and silver, aggregate and construction materials from the Project. Continued losses will require that the Company raise additional funds by equity or debt financing, failing which the Company will not be able to continue operations. Management cannot provide assurances that this will occur and this raises doubts about the Company’s ability to continue as a going concern.
The Need for Significant Additional Financing
If a production decision is made, the Company will need significant additional financing to develop the Project into an operating mine and estimates that this could range as high as $90 million plus working capital. The Company expects to finance the construction and to secure the necessary working capital from either additional sales of common shares, from bank or other borrowings or, alternatively, through a merger with an established mining company. However, the Company has no commitment for the underwriting of additional shares or for bank financing and it is not a party to any agreement or arrangement providing for a merger with an established mining company. Whether or not and to what extent project financing can be secured will depend on a number of factors, including gold and silver prices. Gold and silver prices fluctuate widely and are affected by numerous factors beyond the Company's control, such as the strength of the U.S. dollar and foreign currencies, global and regional demand, and global or regional political or economic events. If financing is not obtained, the Company will not be able to develop the Project and would be forced to seek alternatives to its current business plan, including disposing of its interests in the Property.
Passive Foreign Investment Company
The Company may be classified as a passive foreign investment company. U.S. investors should seek independent advice from tax advisors to discuss any tax consequences.
We must secure approvals and permits
The Company must secure approvals and permits for the Project as set out the section Environmental Issues, Approvals & Permits above. The Company has been persistent in its efforts to secure approvals and permits, however, there is no assurance that the final approvals can ultimately be secured and this remains a significant risk.
23
Our ability to obtain mine financing is likely dependant on the price of gold and silver remaining at current levels, which, given historical fluctuations, can vary significantly
Financing to develop the Project will depend upon current price levels for gold and silver being sustained for the foreseeable future. The current price levels of gold and silver have not been attained since the early 1980s and there is no guarantee that prices will remain at the current high levels. Gold and silver prices historically have fluctuated widely and are affected by numerous factors outside of our control including industrial and retail demand, central bank lending, forward sales of gold by producers and speculators, levels of gold production, short-term changes in supply and demand because of speculative hedging activities, confidence in the global monetary system, expectations of the future rate of inflation, the strength of the U.S. dollar (the currency in which the price of gold is generally quoted), interest rates and global or regional political or economic events.
The agreements with landholders need ongoing monitoring.
The Company monitors the status of agreements with landholders on a regular basis in order to protect the Company’s interests in the Property that it does not own. There can be no assurance that the Company will continue to be able to retain all of its interests in the Property through negotiations with landowners, or that the cost of retaining its interests will not increase significantly as a result of future negotiations. The value of the Project may be significantly reduced if the Company cannot access or mine areas of the Property that are material to the Project, due to its inability to retain its interests in the Property. While each and every property has its own value and unique purpose in the overall mine plan, the feasibility of the Project will depend on the Company’s ability to maintain control of the portions of the Property that are material to the Project. Failure to keep property agreements in good standing may result in a loss of control of the corresponding interest in the Property, which, if material to the Project, would prevent the Company from developing the Project.
We rely extensively on the services of our President, Mr. H. Lutz Klingmann, P.Eng., who has considerable current knowledge of our operations, including the Soledad Mountain Project, and the loss of his services would likely result in delay and cost associated with acquiring and training additional management.
Since 2002, Mr. Lutz Klingmann has been largely responsible for most of the operations of the Company, including work on the Project. The successful development of the Project as currently envisioned by management is dependent to a significant extent on the efforts and abilities of Mr. Klingmann. Investors must be willing to rely to a significant extent on management’s discretion and judgment. We do not maintain key employee insurance on Mr. Klingmann and the loss of his services would likely have an adverse affect on Company operations and plans, until such time as a replacement can be located and brought current on Company plans and operations.
Risks and Contingencies Associated with the Mining Industry Generally
In addition to the risks noted above, the Company is subject to all of the risks inherent in the mining industry, including environmental risks, fluctuating metals prices, industrial accidents, labor disputes, unusual or unexpected geologic formations, cave-ins, flooding, earth quakes and periodic interruptions due to inclement weather. These risks could result in damage to, or destruction of, production facilities, personal injury, environmental damage, delays, monetary losses and legal liability. Although the Company maintains or can be expected to maintain insurance within ranges of coverage consistent with industry practice, no assurance can be given that such insurance will be available at economically feasible premiums. Insurance against environmental risks (including pollution or other hazards resulting from the disposal of waste products generated from production activities) is not generally available to the Company or other companies in the mining industry. If subjected to environmental liabilities, the costs incurred would reduce funds available for other purposes.
While we believe we have taken the steps necessary to improve the effectiveness of our internal control over financial reporting, if we are unable to successfully address or prevent material weaknesses in our internal control over financial reporting, our ability to report our financial results on a timely and accurate basis and to comply with disclosure and other requirements may be adversely affected.
Our management identified material weaknesses in internal control over financial reporting as of December 31, 2011 related to the (i) financial statements closing process due to lack of timely review and preparation of financial statements and other reporting documents, inconsistency of foreign exchange rate used in translation and (ii) lack of segregation of duties in daily cash management and no proper approval on general and administrative and capital expenditures (see “Item 9A. Controls and Procedures”). As a result of these material weaknesses, our management concluded that, as of December 31, 2011, we did not maintain effective disclosure controls and procedures or internal control over financial reporting. A material weakness is a deficiency, or a combination of deficiencies, in internal control over financial reporting such that there is a reasonable possibility that a material misstatement of our annual or interim financial statements will not be prevented or detected on a timely basis.
24
We can give no assurances that the measures we take to remediate material weaknesses that we identified will be successful, or that any additional material weaknesses will not arise in the future.
Any material weakness or other deficiencies in our disclosure controls and procedures and internal control over financial reporting may affect our ability to report our financial results on a timely and accurate basis and to comply with disclosure obligations or cause our financial statements to contain material misstatements, which could negatively affect the market price and trading liquidity of our common stock or cause investors to lose confidence in our reported financial information.
Most of our directors are ordinarily resident outside of the United States and accordingly it may be difficult to effect service of process on them, or to enforce any legal judgment against them.
With the exception of Thomas Clay, our directors namely Edward G. Thompson, Chester Shynkaryk, Gordon C. Gutrath, and H. Lutz Klingmann are residents of Canada. Consequently, it may be difficult for U.S. investors to effect service of process within the U.S. upon these directors, or to realize in the U.S. upon judgments of U.S. courts predicated upon civil liabilities under the U.S. securities laws. A judgment of a U.S. court predicated solely upon such civil liabilities would probably be enforceable in Canada by a Canadian court if the U.S. court in which the judgment was obtained had jurisdiction, as determined by the Canadian court, in the matter. There is substantial doubt whether an original action could be brought successfully in Canada against any of such directors predicated solely upon such civil liabilities.
Because our common shares will likely trade at prices below $5.00 per share, and because we will not be listed on a national U.S. exchange, there are additional regulations imposed on U.S. broker-dealers trading in our shares that may make it more difficult for you to resell our shares through a U.S. broker-dealer.
Because of U.S. rules that apply to shares with a market price of less than U.S.$5.00 per share, known as the “penny stock rules”, investors will find it more difficult to sell their securities in the U.S. through a U.S. broker dealer. The penny stock rules will probably apply to trades in our shares. These rules in most cases require a broker-dealer to deliver a standardized risk disclosure document to a potential purchaser of the securities, along with additional information including current bid and offer quotations, the compensation of the broker-dealer and its salesperson in the transaction, monthly account statements showing the market value of each penny stock held in the customer’s account, and to make a special written determination that the penny stock is a suitable investment for the purchaser and receive the purchaser’s written agreement to the transaction.
Item 1B. Unresolved Staff Comments.
Not applicable.
Item 2. Properties.
Land Ownership and Mining Rights
The Company acquired its initial property interests in 1985 and has since acquired additional properties in the area. The Company holds directly or controls via agreement a total of 33 patented lode mining claims, 134 unpatented lode mining claims, 1 patented millsite, 12 unpatented millsites, 1 unpatented placer claim and upward of 946 acres of fee land, which together make up the Property. The Property is located west of California State Highway 14 and lies largely south of Silver Queen Road covering all of Section 6 and portions of Sections 5, 7 and 8 in Township 10 North, Range 12 West; portions of Sections 1 and 12 in Township 10 North, Range 13 West; portions of Section 18 in Township 9 North, Range 12 West, and portions of Section 32 in Township 11 North, Range 12 West, all from the San Bernardino Baseline and Meridian.
25
A Property location map is shown in Figure 1 below.
Figure 1
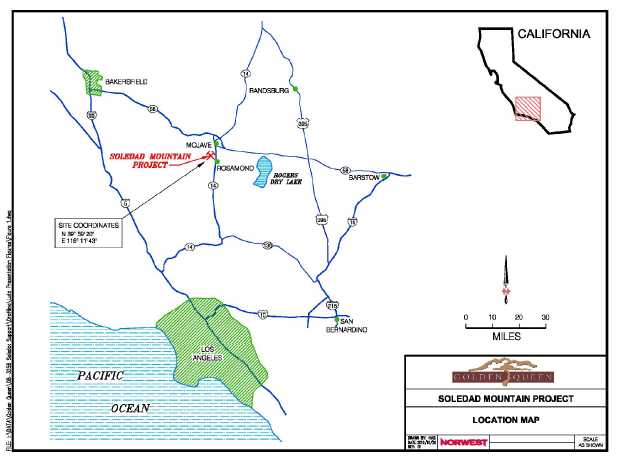
The Company holds the properties either directly through a subsidiary, or under mining lease agreements with a number of individual landholders, two groups of landholders and three incorporated entities. The land required for the Project has therefore either been secured under one of these agreements or is controlled by the Company through ownership of the land in fee or where the Company holds patented and unpatented mining claims or millsites. The mining lease agreements were entered into from 1986 onwards. Refer to the section Property Interest Are In Good Standing below for key information.
26
Figure 2 below provides a map of the various claim groups that make up the Property.
Figure 2
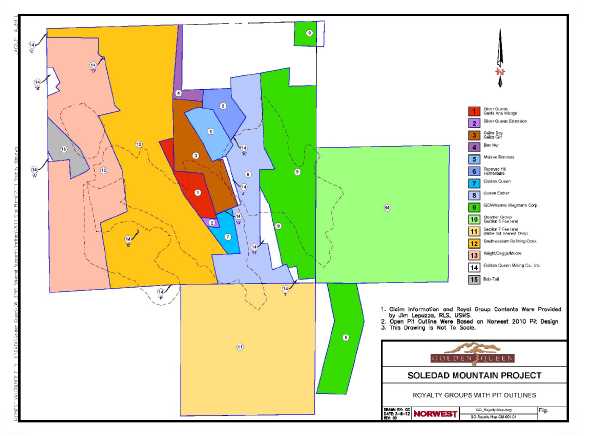
The fee land surrounding Section 6 is required for the construction of the ancillary facilities required for a mining operation, for the construction of the heap leach pads and for construction of a pad for the aggregate production facilities. The area that will be disturbed by the Project is a 369 hectare-block (912 acres) within the total area of approximately 1,417 hectares (3,500 acres) owned, held or controlled by the Company. The Company also owns six residential properties with buildings north of Silver Queen Road and one residential property west of Mojave Tropico Road.
The Company is continuing with its efforts to purchase additional land that will secure its land position in the area.
Title Review
The Company commissioned a formal title review of the Property by a firm familiar with title matters in California in 1996. This title review was updated in February 1998 and again in March 1999. A further title review was completed by an independent landman in 2004 and no particular title problems were identified.
Quiet Title Judgment
The ownership history is typically complex in historic mining districts and title problems will exist. The Company obtained a Quiet Title Judgment on May 15, 1999 and this resolved a majority of title questions. The effect of the Judgment was to clear the title to the interests in the patented claims listed in the action and to cure the title defects of record, providing security of title and thus greatly enhancing the value of the Property.
27
The Company has determined that any remaining title questions would not present a threat to the Project.
Record Of Survey
The California Business & Professions Code includes the Professional Land Surveyors Act, “Article 5. Surveying Practices” and specifically “8762. Records of survey.” Land surveyors must be aware of the requirements set out in Article 5 as these are essential to their surveying practice and govern their responsibilities to their clients and the State. The Company therefore decided to proceed with a Record of Survey and engaged James A. LaPuzza, PLS, MS in November 2009.
A set of fourteen maps based upon survey work done by James A. LaPuzza, PLS, MS on Soledad Mountain between 2007 and 2010, along with supporting information on the history of staking and recording and ownership of mining claims and millsites researched by Sylvia Good, RPL, Landman and legal counsel and staff of Gresham Savage Nolan & Tilden, A Professional Corporation, San Bernardino, California from the early 1990s onwards, was submitted to the Kern County Department of Engineering, Surveying and Permit Services in August 2010. The maps were checked in meticulous detail by County staff over a period of 10 months. There were also numerous exchanges of information between James A. LaPuzza, PLS, MS and staff during this period. County staff gave the maps a “Final Check” in May 2011. The recordable mylars were submitted to County staff in July 2011, formally signed by the County Surveyor and forwarded to the Kern County Assessor – Recorder as a Record of Survey. The Record of Survey was recorded as follows:
- Recorded July 20, 2011;
- Document No. 211092035 and
- Book 0027, Page 66
The basis for the Company’s royalty map is now the Record of Survey and this has superseded all earlier versions of the royalty map.
A copy of this report was sent to all landholders of record on August 1, 2011.
Royalties
The Company is required to make advance, minimum royalty payments under the mining lease agreements. In some instances, the Company will receive a credit for the advance minimum royalty payments on commencement of commercial production. Most of the royalties are of the net smelter return type and are based on a sliding scale, with the percentage amount of the royalty depending upon the ore grades on the particular property to which the royalty relates. Weighted average royalty rates will range from a low of 1.0 % to a high of 5.0% depending upon the area being mined and gold and silver prices. The agreements also typically provide for an additional royalty if non-mineral commodities, such as aggregates, are produced and sold.
Property Interests Are In Good Standing
The Company had disclosed in its Form 10-K/A for the fiscal year ended December 31, 2007 that not all property interests were in good standing. The total advance minimum royalty owing to landholders was $714,137. The Company contacted all landholders and paid $666,103 in the second, third and fourth quarters of 2008 with a further $48,034 paid to the remaining rightful landholders in 2009. The Company continues to pay advance minimum royalties to landholders and incurred a total of $245,970 in 2011, of which $13,723 has yet to be paid. The Company believes it is in compliance with the requirements.
A mining lease agreement with a group of landowners expired in 2004. Negotiations with the group were completed in July 2011 and the agreements were extended to 2041. Under the amended agreements, the Company paid advance minimum royalties of $7,500 per year for eight years for a total amount of $60,000 in August 2011 to bring the advance minimum royalties owing current to March 14, 2012.
28
A number of lease agreements expired in 2010 and in January 2011. Of these expired lease agreements, one set of lease agreements that together comprises a 50% interest in a claim group, is considered material by the Company. The Company is in the process of negotiating renewed leases with the landholders, maintains a good relationship with the landholders involved and anticipates that it will be able to reach agreements for new leases in 2012.
While the Company is not in default of any current lease, the Company is negotiating renewal terms for leases that are approaching expiry. The Company does not consider any of those leases to be individually material. However leases that are individually not material may become part of a material group of leases if more than one of the leases in the group cannot be renewed.
Leases have expiry dates ranging from 2012 to 2045. Of these, no single lease is considered material with the exception of four leases which expire in September 2014, April 2015, April 2021 and April 2026 respectively. All leases become non-expiring once the mine commences commercial production.
While each and every part of the Property has its own value and unique purpose in the overall mine plan, the feasibility of the Project will depend on the ability of the Company to maintain the rights to access and use of the material portions of the Property. A failure to keep property agreements in good standing may result in a loss of control, which, if material to the Project, would prevent the Company from developing the Project.
Item 3. Legal Proceedings.
To the best of our knowledge, there are no legal actions pending, threatened or contemplated against the Company.
Item 4. Mine Safety Disclosures.
The Company is the operator of the Soledad Mountain project, which includes one mine located in Mojave in Kern County, California. The Company is currently evaluating the development of the mine for production. The Company has no mine safety violations or other regulatory matters to report.
PART II
Item 5. Market for Common Equity, Related Stockholder Matters and Small Business Issuer Purchases of Equity Securities.
Market and Trading Price
The common shares of the Company are listed and traded on the Toronto Stock Exchange under the trading symbol “GQM”. The high and low sales prices of the common shares as traded on the Toronto Stock Exchange for the calendar periods indicated are set out in the table below. All prices are reported in Canadian dollars.
| Year ended December 31 | High | Low | |
| 2011 | Fourth Quarter | $3.37 | $2.44 |
| Third Quarter | $3.95 | $2.58 | |
| Second Quarter | $3.84 | $2.61 | |
| First Quarter | $2.94 | $2.26 | |
| 2010 | Fourth Quarter | $2.80 | $2.02 |
| Third Quarter | $2.06 | $1.29 | |
| Second Quarter | $1.54 | $0.95 | |
| First Quarter | $1.06 | $0.78 | |
29
Exchange Rates
The following table sets forth, for the periods indicated, certain exchange rates based on the noon buying rate in Canadian dollars. Such rates are the number of Canadian dollars per one (1) U.S. dollar quoted by the Bank of Canada. The high and low exchange rates for each month during the previous six months were as follows:
| High | Low | |
| February 2012 | $1.0016 | $0.9866 |
| January 2012 | $1.0272 | $0.9986 |
| December 2011 | $1.0406 | $1.0105 |
| November 2011 | $1.0487 | $1.0126 |
| October 2011 | $1.0604 | $0.9935 |
| September 2011 | $1.0389 | $0.9752 |
Exchange rate information (from USD$ to CAD$) as at each of the years ended December 31, 2010 and 2011 is set out in the table below:
| Year Ended December 31 | ||
| 2010 | 2011 | |
| Rate at end of Period | $0.9946 | $1.0170 |
| Low | $0.9946 | $0.9449 |
| High | $1.0778 | $1.0604 |
As of March 29, 2012, there were 222 registered holders of record of the Company’s common shares and an undetermined number of beneficial holders.
The common shares of the Company are also traded on the Pink Sheets under the trading symbol “GQMNF”. The high and low sales prices of the common stock as traded on the Pink Sheets for the calendar periods indicated are set out in the table below. All prices are reported in U.S. dollars. Such over-the-counter market quotations reflect inter-dealer prices, without retail mark-up, markdown or commission and may not necessarily represent actual transactions. The Pink Sheets has a limited and sporadic trading market and does not constitute an established trading market.
| Year ended December 31 | High | Low | |
| 2011 | Fourth Quarter | $3.31 | $2.36 |
| Third Quarter | $4.01 | $2.62 | |
| Second Quarter | $4.05 | $2.65 | |
| First Quarter | $3.00 | $2.30 | |
| 2010 | Fourth Quarter | $2.82 | $1.95 |
| Third Quarter | $2.00 | $1.25 | |
| Second Quarter | $1.46 | $0.95 | |
| First Quarter | $1.07 | $0.70 | |
Dividends
The Company has not declared dividends on its common shares since inception.
Securities Authorized for Issuance Under Compensation Plans
The following table sets forth information as at December 31, 2011 respecting the compensation plans under which shares of the Company’s common stock are authorized to be issued.
30
Plan Category |
Number of securities to be issued upon exercise of outstanding options, warrants and rights (a) |
Weighted-average exercise price of outstanding options, warrants and rights (b) |
Number of securities remaining available for future issuance under equity compensation plans (excluding securities reflected in column (a)) (c) |
| Equity compensation plans approved by security holders |
1,800,000 |
CAD$0.29 |
5,400,000 |
| Equity compensation plans not approved by security holders |
Nil |
Nil |
Nil |
| Total | 1,800,000 | -- | 5,400,000 |
Performance Graph
The performance graph below shows the Company’s cumulative total return based on an initial investment of $100 in GQM common stock, as compared with the S&P/TSX Global Gold Index. The chart shows performance marks as of the last trading day during each of the last five years.
![]()
| December | December | December | December | December | |
| 31, 2007 | 31, 2008 | 31, 2009 | 31, 2010 | 31, 2011 | |
| Company | 100 | 46 | 114 | 333 | 337 |
| S&P/TSX Global Gold Index (TITTGD) | 100 | 101 | 107 | 136 | 116 |
Purchases of Equity Securities by the Company and Affiliated Purchasers
Neither the Company nor an affiliated purchaser of the Company purchased common shares of the Company in the year ended December 31, 2011.
31
Item 6. Selected Financial Data.
The following table summarizes certain selected consolidated financial data of the Company and should be read in conjunction with the Consolidated Financial Statements and Notes thereto appearing elsewhere in this report.
Results for the five most recent years are set out in the table below.
| Dec. 31, | Dec. 31, | Dec. 31, | Dec. 31, | Dec. 31, | |
| Results for the year ended on: | 2011 | 2010 | 2009 | 2008 | 2007 |
| Item | $ | $ | $ | $ | $ |
| Revenues | 0 | 0 | 0 | 0 | 0 |
| Net loss and comprehensive loss | -3,230,641 | -9,983,926 | -4,514,742 | -3,996,777 | -2,006,482 |
| Basic loss and diluted loss per share | -0.03 | -0.11 | -0.05 | -0.05 | -0.03 |
| Cash and cash equivalents | 7,922,255 | 6,967,465 | 2,433,202 | 3,033,771 | 2,796,190 |
| Total assets | 8,692,866 | 7,655,343 | 2,969,865 | 3,557,416 | 3,345,937 |
| Stockholders' equity | 3,631,916 | -3,327,592 | -131,888 | 3,097,436 | 2,909,788 |
Item 7. Management’s Discussion and Analysis of Financial Condition and Results of Operation.
The following discussion of the operating results and financial condition of the Company is as at March 29, 2012 and should be read in conjunction with the audited, consolidated financial statements of the Company for the year ended December 31, 2011 and the notes thereto.
The information in this Management Discussion and Analysis of Financial Condition and Results of Operation is prepared in accordance with U.S. generally accepted accounting principles and all amounts herein are in U.S. dollars unless otherwise noted.
Results of Operation
The following are the results of operation for the year ended December 31, 2011.
The Company had no revenue from operations.
The Company incurred general and administrative expenses of $880,830 for the year ended December 31, 2011 (2010 - $639,203, 2009 - $504,754). Costs were higher by $241,624 for the year ended December 31, 2011 when compared with 2010.
Significant general and administrative expenses incurred related to $270,114 accounting and audit fees (2010 - $174,678; 2009 – $108,019) due to increased work relating to internal control testing and the identification of material weaknesses in the Company’s internal control and procedures,and $37,678 foreign exchange loss (2010 - $353,516 foreign exchange gain; 2009 - $66,147 foreign exchange gain)
The Company incurred exploration expenditures of $2,639,946 for the year-ended December 31, 2011 (2010 - $2,651,533; 2009 - $1,742,199). Costs were marginally lower by $11,587 for the year-ended December 31, 2011 when compared with 2010. The significant components of this difference during the year compared to 2010 and 2009 were:
-
$251,393 (2010 - $84,948, 2009 - $0) for the infill drill program.
-
$294,946 (2010 - $0, 2009 - $0) for the detailed analysis of data required to construct the geological model and block model for the Project by an independent consulting engineering firm.
-
$1,046,765 (2010 - $1,365,069, 2009 - $574,979) for ongoing detailed engineering, mine design and drafting support. The detailed engineering allows contractors to provide solid cost estimates for the construction of the facilities and this information was required for the updated feasibility study that was released in April 2011. Ongoing engineering was also required to support the effort to secure outstanding approvals and permits. Costs increased from 2009 to 2010 as more detailed engineering was done. Costs then decreased from 2010 to 2011 as most of the detailed engineering was completed. It is expected that costs will increase again if a production decision is made.
-
$138,344 (2010 - $68,881, 2009 – $35,354) for ongoing sampling and analysis of groundwater from monitoring and production wells to meet the requirements set in the Waste Discharge Requirements by the Lahontan Regional Water Quality Control Board. Alternative methods of sampling groundwater were also evaluated in the third quarter of 2011. Costs increased from 2009 to 2010 and again in 2011 as the sampling and analysis effort increased to meet the requirement set in the Waste Discharge Requirements.
32
-
$64,882 (2010 - $0, 2009 - $0) for the development of production water well PW-3. This also included a pump test. Production water well PW-3 was drilled and equipped in 2008.
-
$100,000 (2010 - $0, 2009 - $0) to Southern California Edison for a Method of Service study.
-
$126,047 (2010 - $190,826, 2009 – $362,050) for analysis of the draft Authority to Construct permits and ongoing monitoring, maintenance and data recovery from the meteorological station on site. Significantly higher costs were incurred in 2009 when the Air Quality and Health Risk Assessment was prepared for the Project and additional engineering support was required for the preparation of the Supplemental EIR.
-
$332,760 (2010 - $646,043, 2009 - $190,201) for legal fees incurred in support of ongoing efforts to conclude the approvals process for the Project, in negotiations with landholders to extend mining lease agreements and for general corporate legal fees. The Company engaged legal counsel to work with the Kern County Planning Department on preparation of the Supplemental EIR in 2009. Costs increased significantly in 2010 in connection with a number of public hearings held in 2010.
-
$77,914 (2010 - $180,621, 2009 – $20,051) for fees charged by the regulatory authorities such as the State Water Resources Control Board, Kern County Planning & Community Development Department, Kern County Egineering, Surveying & Permit Services Department and Eastern Kern Air Pollution Control District. Costs increased from 2009 to 2010 as preparations were made for public hearings held in 2010. No further public hearings were held in 2011 and costs incurred in 2011 is an indication of the recurring costs.
-
$108,988 (2010 - $38,955, 2009 - $15,425) for costs incurred by a contractor for ongoing cleanup on site and maintenance of houses owned by the Company.
The Company recorded a change in fair value of derivative liability of -$1,213,913 for the year compared to $6,575,406 in 2010. This item is a non-cash item and was recorded in accordance with accounting pronouncement ASC 850-40-15. Refer to Note 10 Derivative Liability of the audited, consolidated financial statements for a detailed analysis of the changes in fair value of the derivative liability.
Interest income of $48,659 (2010 - $31,633) was higher by $17,026 as there was more cash on deposit during the year. There was no interest expense during the year. Interest rates remained low during the year and are projected to remain low for the coming year at least.
The Company incurred a net loss of $ 3,230,641 ($0.03 loss per share) for the year as compared to a net loss of $9,983,926 ($0.11 per share) for 2010 for a difference in net loss of $6,753,285.
The Company has not disclosed any contractual obligations as of December 31, 20112, there were no contractual obligations that are required to be disclosed.
33
Summary of Quarterly Results
Results for the eight most recent quarters are set out in the table below.
| Results for the quarter ended on: | Dec. 31, 2011 | Sept. 30, 2011 | June 30, 2011 | March 31, 2011 |
| Item | $ | $ | $ | $ |
| Revenue | Nil | Nil | Nil | Nil |
| Net loss for the quarter | 230,281 | -981,654 | -1,758,400 | -720,868 |
| Net loss per share | 0.00 | -0.01 | -0.02 | -0.01 |
| Results for the quarter ended on: | Dec. 31, 2010 | Sept. 30, 2010 | June 30, 2010 | March 31, 2010 |
| Item | $ | $ | $ | $ |
| Revenue | Nil | Nil | Nil | Nil |
| Net loss for the quarter | -4,126,127 | -3,125,127 | -2,406,367 | -326,305 |
| Net loss per share | -0.04 | -0.03 | -0.03 | 0 |
The results of operations can vary from quarter to quarter depending upon the nature, timing and cost of activities undertaken during the quarter and whether or not the Company incurs gains or losses on foreign exchange or grants stock options.
Selected Annual Information
| Results for the year ended on: | Dec. 31, 2011 | Dec. 31, 2010 | Dec. 31, 2009 | From Inception |
| Item | $ | $ | $ | |
| General and administrative expenses | -880,830 | -639,203 | -504,754 | -5,951,675 |
| Exploration expenditures | -2,639,946 | -2,651,533 | -1,742,199 | -20,587,637 |
| Asset impairment loss | -938,770 | -133,436 | -167,898 | -33,207,798 |
| Adjustment of asset retirement obligation on changes in cash flow estimates | - | - | -6882 | 223,583 |
| Accretion expense | -33,667 | -15,981 | -7,779 | -105,029 |
| Change in fair value of derivative liability | 1,213,913 | -6,575,406 | -2,095,300 | -7,456,793 |
| Gain on settlement of debt | - | - | - | 136,627 |
| Mineral property interests written off | - | - | - | -277,251 |
| Sub-total | -3,279,300 | -10,015,559 | -4,524,812 | -67,225,973 |
| Interest expense | - | - | - | -913,098 |
| Interest income | 48,659 | 31,633 | 10,070 | 1,680,279 |
| Net loss and comprehensive loss | -3,230,641 | -9,983,926 | -4,514,742 | -66,458,792 |
| Net loss per share | -0.03 | -0.11 | -0.05 |
Reclamation Financial Assurance and Asset Retirement Obligation
The Company provided reclamation financial assurance in the form of a Payment Bond Certificate backed by a Certificate Of Deposit with Union Bank of California in the amount of $296,180 effective October 2011. The estimate for reclamation financial assurance is $314,712 for 2012 and this estimate has been submitted to the Engineering, Surveying & Permit Services Department for review and approval.
The asset retirement obligation is estimated at $227,212 and this is shown as a liability on the Consolidated Balance Sheet. The actual obligation could differ materially from these estimates.
Advance Minimum Royalties
The Company continues to pay advance minimum royalties to landholders and incurred $245,970 in 2011.
34
Off-balance Sheet Arrangements
The Company has no off-balance sheet arrangements.
Stock Option Plan
The Company’s current stock option plan (the “Plan”) was adopted by management of the Company in 2008 and approved by shareholders of the Company in 2009. The Plan provides a fixed number of 7,200,000 common shares of the Company that may be issued pursuant to the grant of stock options. The exercise price of stock options granted under the Plan shall be determined by the Company’s Board of Directors, but shall not be less than the volume weighted average trading price of the Company’s shares on the Toronto Stock Exchange for the five trading days immediately prior to the date of the grant. The expiry date of a stock option shall be the date so fixed by the Board subject to a maximum term of five years. The Plan provides that stock options will terminate on the earlier of the expiry of the term and (i) 12 months from the date an option holder dies, (ii) 90 days from the date from the date the option holder ceases to act as a director or officer of the Company, or (iii) 60 days from the date the option holder ceases to be employed, or engaged as a consultant, by the Company.
The Company granted 1,950,000 stock options to directors, officers and consultants of the Company pursuant to the Plan on January 28, 2009. The options are exercisable at a price of C$0.26 per share for a period of 5 years from the date of grant. The Company also granted 50,000 stock options to a consultant of the Company pursuant to the Plan on April 19, 2010. The options are exercisable at a price of C$1.24 per share for a period of 5 years from the date of grant.
Transactions with Related Parties
Mr. H. Lutz Klingmann was paid $137,748 (2010 - $141,293, 2009 - $116,776) for services as President of the Company and Mr. Chester Shynkaryk was paid $27,295 (2010 - $17,769; 2009 - $18,620) for consulting services to the Company for the year ended December 31, 2011. Mr. G. Ross McDonald was paid $20,218 (2010 - $Nil; 2009 -$Nil), of which $2,831 is payable, for services as CFO to the Company for the year ended December 31, 2011. No other compensation was paid or given during the year for services rendered by the directors in such capacity and no amounts were payable at year-end under any standard arrangements for committee participation or special assignments.
Four directors of the Company were paid $2,022 (2010 - $1,974; 2009 - $1,752) and one director was paid $2,000 (2010 - $2,000; 2009 - $2,000) in director’s fees for the year ended December 31, 2011.
The Company amended a consulting services agreement originally entered into in 2004 with Mr. H.L. Klingmann, the President of the Company, in May of 2010. Under the original agreement, upon receipt by the Company of a feasibility study and a production decision made by the Company, a bonus of 150,000 common shares would be issued and upon commencement of commercial production on the Property, a bonus of 150,000 common shares would be issued. Pursuant to the amended agreement, an alternative 300,000 bonus shares would be issuable upon a change of control transaction or upon a sale of all or substantially all of the Company’s assets, having a value at or above C$1.00 per share of the Company, with a further 300,000 bonus shares being issuable in the event the change of control transaction or asset sale occurred at a value at or above C$1.50 per share. As at December 31, 2011, the milestones had not been reached and no accrual was made in connection with these arrangements.
There were no other related party transactions during the year ended December 31, 2011.
Fair Value of Financial Instruments
The carrying amount reported in the balance sheets for cash and cash equivalents, receivables, accounts payable and accrued liabilities approximates fair value because of the immediate or short-term maturity of these financial instruments. The Company does not hold any bank or non-bank asset-backed commercial paper. The fair value of the reclamation financial assurance approximates carrying value because the stated interest rate reflects recent market
35
conditions. It is the opinion of management that the Company is not exposed to significant interest, currency or credit risk arising from the use of these financial instruments.
Private Placement
The Company completed a non-brokered private placement with AuRico Gold Inc. (“AuRico”) (formerly Gammon Gold Inc.) on June 1, 2010, whereby AuRico purchased 5,000,000 units of the Company at a price of C$1.60 per unit for total proceeds of $7,634,316 (C$8,000,000). Each unit consisted of one common share, one quarter of one Class A Warrant, and one quarter of one Class B Warrant. Each Class A Warrant entitled AuRico to purchase a common share at a price of C$1.75 for a period of 18 months from the closing date. Each Class B Warrant entitled AuRico to purchase one common share at a price of C$2.00 for a period of 18 months from the closing date. The aggregate fair value of the Class A and B purchase warrants was $1,726,518 and the amount was recorded as a derivative liability and the Company allocated the remaining proceeds of $5,907,798 to the common shares. AuRico was also granted the right to participate in future financings to maintain its equity position in the Company and this right was subject to certain conditions.
AuRico exercised the warrants before the expiry date of December 1, 2011. The Company filed a registration statement relating to these securities with the U.S. Securities And Exchange Commission and this became effective on December 16, 2011.
Liquidity and Capital Resources
The Company held $7,922,253 in cash and cash equivalents on December 31, 2011.
Cash used in Operating Activities:
Cash was used mainly for the ongoing development of the Project in 2011 with major expenditures in four areas:
-
Consulting engineering fees remained high due to the significant amount of detailed engineering completed for Project facilities;
-
Costs were incurred for ongoing sampling and analysis of groundwater from monitoring and production wells to meet the requirements set in the Waste Discharge Requirements by the Lahontan Regional Water Quality Control Board and alternative methods of sampling groundwater were also evaluated in the third quarter;
-
Legal fees were incurred in support of ongoing efforts to conclude the approvals process for the Project, in negotiations with landholders to extend mining lease agreements and for corporate legal fees and
-
Consulting fees were incurred to do a very detailed analysis of the geological and block models and to prepare a NI 43-101 compliant Technical Report. It is expected that this report will be completed in the second quarter of 2012.
Cash was used mainly for the ongoing development of the Project in 2010 and 2009 with major expenditures in two key areas:
-
Consulting engineering fees remained high due to the significant amount of detailed engineering completed for Project facilities and
-
Legal fees were incurred in support of ongoing efforts to secure approvals and permits process for the Project.
36
Cash from Financing Activities:
Cash was received from financing activities during the year ended December 31, 2011 as follows:
- Proceeds from the exercise of stock options of $972,559 during the year.
- AuRico Gold Inc. exercised 2,500,000 warrants for total proceeds of $4,594,237.
The Company received a total of $7,860,707 from financing activities in 2010. An amount of $7,588,551 was received from a private placement of shares, net of share issuance costs, and the remainder was received from the exercise of 850,000 stock options.
The Company received $1,527,731 from the exercise of stock options in 2009.
Cash used in Investing Activities:
The Company purchased fee land for approximately $938,770 (2010 - $310,768, 2009 - $167,800) during the year. Cash used in investing activities will vary from year to year as willing sellers are found and acceptable prices can be negotiated during the year. Further purchases of fee land are being considered to provide room for a possible future expansion of heap leach pads and future expansion of the area required for the construction of facilities for the aggregate production component of the Project.
Working Capital:
As at December 31, 2011, the Company had current assets of $8,088,236 and current liabilities of $281,236 (Working capital of $7,807,000).
Management does not expect that additional cash will be required beyond cash currently on hand for ongoing work on approvals and permits for the Project, for paying advance minimum royalties, for detailed engineering of facilities for the Project, for ongoing work on site, for additional land purchases and for general corporate purposes to the end of 2012. Refer also to Outlook below.
Outstanding Share Data
The number of shares issued and outstanding and the fully diluted share position are set out in the table below.
Golden Queen Mining Co. Ltd.
| No. of | |||
| Item | Shares | ||
| Shares issued and outstanding on December 31, 2010 | 94,228,383 | ||
| Shares issued pursuant to the exercise of stock options | 1,250,000 | ||
| AuRico Gold Inc. warrants | 2,500,000 | ||
| Shares issued and outstanding on December 31, 2011 | 97,978,383 | Exercise Price | Expiry Date |
| C$0.26 & | 28/01/14 & | ||
| Director and consultants stock options | 1,800,000 | C$1.24 | 19/04/15 |
| Shares to be issued as a finders fee | 100,000 | Not Applicable | Not Applicable |
| Bonus shares to H.L. Klingmann | 600,000 | Not Applicable | Not Applicable |
| Fully diluted on December 31, 2011 | 100,478,383 |
The company's authorized share capital is 150,000,000 common shares with no par value.
37
Outlook
If the remaining approvals and permits are secured for the Project and a production decision is made, the Company will need significant additional financing to develop the Project into an operating mine. This is currently estimated at $105million and this includes working capital. The Company believes that financing for the Project can be secured if gold and silver prices remain at or near $1,457.00/oz and $39.63/oz respectively, the London a.m. fix for precious metals on April 6, 2011 and the prices used for the updated cash flow analyses referred to under Independent Feasibility Study Completed By Norwest Corporation above. Gold and silver prices averaged $1,224.53/oz and $20.19/oz in 2010, $1,563.93 and $36.61 in 2011 and the London pm fix for gold and silver was $1,657.50/oz and $31.79 respectively on March 29, 2012.
The Company is evaluating various financing options for the Project and these may be combined:
| a. |
An equity financing; | |
| b. |
A combination of equity and debt and | |
| c. |
A merger with an established mining company. |
It is not expected that the Company will hedge any of its gold or silver production.
The ability of the Company to develop a mine on the Property is subject to numerous risks, certain of which are disclosed under Item 1A. Risk Factors above. Readers should evaluate the Company’s prospects in light of these and other risk factors.
Subsequent Event
There are no subsequent events.
Application of Critical Accounting Estimates
The financial statements of the Company have been prepared in accordance with generally accepted accounting principles in the United States. Because a precise determination of many assets and liabilities is dependent upon future events, the preparation of financial statements for a period necessarily involves the use of estimates which have been made using careful judgment.
The financial statements have, in management’s opinion, been properly prepared within reasonable limits of materiality and within the framework of the significant accounting policies summarized below:
Mineral Property and Exploration Costs
Costs related to the development of our mineral reserves are capitalized when it has been determined an ore body can be economically developed. The development stage begins when an ore body is determined to be economically recoverable based on proven and probable reserves and appropriate permits are in place, and ends when the production stage or exploitation of reserves begins. Major mine development expenditures are capitalized, including primary development costs such as costs of building access ways, heap leach pads, ramps and infrastructure developments.
Costs for exploration, pre-development, if and when applicable, and maintenance and repairs on capitalized property, plant and equipment are charged to operations as incurred. Exploration costs include those relating to activities carried out (a) in search of previously unidentified mineral deposits, or (b) at undeveloped concessions. Pre-development activities involve costs incurred in the exploration stage that may ultimately benefit production that are expensed due to the lack of evidence of economic development, which is necessary to demonstrate future recoverability of these expenses. Secondary development costs are incurred for preparation of an ore body for production in a specific ore block, stope or work area, providing a relatively short-lived benefit only to the mine area they relate to, and not to the ore body as a whole.
Drilling and related costs are either classified as exploration or secondary development, as defined above, and charged to operations as incurred, or capitalized, based on the following criteria:
- Whether the costs are incurred to further define mineralization at and adjacent to existing reserve areas or intended to assist with mine planning within a reserve area;
- Whether the drilling costs relate to an ore body that has been determined to be commercially mineable, and a decision has been made to put the ore body into commercial production; and
- Whether, at the time that the cost is incurred, the expenditure: (a) embodies a probable future benefit that involves a capacity, singly or in combination, with other assets to contribute directly or indirectly to future net cash inflows, (b) we can obtain the benefit and control others’ access to it, and (c) the transaction or event giving rise to our right to or control of the benefit has already occurred.
If all of these criteria are met, drilling and related costs are capitalized. Drilling costs not meeting all of these criteria are expensed as incurred. The following factors are considered in determining whether or not the criteria listed above have been met, and capitalization of drilling costs is appropriate:
- Completion of a favourable economic study and mine plan for the ore body targeted;
- Authorization of development of the ore body by management and/or the Board of Directors; and
- All permitting and/or contractual requirements necessary for us to have the right to or control of the future benefit from the targeted ore body have been met.
Once production has commenced, capitalized costs will be depleted using the units-of-production method over the estimated life of the proven and probable reserves. If mineral properties are subsequently abandoned or impaired, any capitalized costs will be charged to the Consolidated Statements of Loss and Comprehensive Loss in that period.
38
We assess the carrying cost of our mineral properties for impairment whenever information or circumstances indicate the potential for impairment. Such evaluations compare estimated future net cash flows with our carrying costs and future obligations on an undiscounted basis. If it is determined that the future undiscounted cash flows are less than the carrying value of the property, a write down to the estimated fair value is charged to the Consolidated Statements of Loss and Comprehensive Loss for the period. Where estimates of future net cash flows are not available and where other conditions suggest impairment, management assesses if the carrying value can be recovered.
Proceeds received under option agreements and/or earn-in agreements are recorded as a cost recovery against the carrying value of the underlying project until the carrying value is reduced to zero. Any proceeds received in excess of the carrying value of the project are recorded as a realized gain in the Consolidated Statements of Loss and Comprehensive Loss.
During the year ended December 31, 2011, the Company acquired mineral property interests totaling $938,770 (2010 - $133,436). However, due to uncertainties around the Company’s ability to obtain the necessary permits to advance the Project to commercial production, the full asset impairment loss was recorded for the year-ended December 31, 2011.
Asset Retirement Obligations
The Company’s liability for reclamation of the property is estimated each year by an independent civil engineer. This estimate, once approved by federal, state and county authorities, forms the basis for a cash deposit of reclamation financial assurance. In the absence of a long-term mining permit this estimate is the current obligation of the Company to clean up or reclaim its lands.
As at December 31, 2011, the Company had provided reclamation financial assurance to the Bureau of Land Management, the State and Kern County totaling $296,180 (2010 - $286,653). This deposit earns interest at 0.1% per annum and is not available for working capital purposes.
The asset retirement obligation recorded as a liability on the Consolidated Balance Sheet is $227,212 (2010 -$193,545.
Derivative Liabilities
Our stock options and warrants are denominated in a currency other than our reporting currency and the instruments were required to be accounted for as separate derivative liabilities. These liabilities were required to be measured at fair value. These instruments were adjusted to reflect fair value at each period end. Any increase or decrease in the fair value was recorded in results of operations as change in fair value of derivative liabilities. In determining the appropriate fair value, we used the Black-Scholes pricing model.
Recently Issued Accounting Standards
A summary of Recently Issued Accounting Standards is provided under the Recent Accounting Pronouncements header of the Notes to the Audited Consolidated Financial Statements for the year ended December 31, 2011.
Item 7A. Quantitative and Qualitative Disclosures About Market Risk.
Interest Rate Risk
We hold all of our cash in bank deposit accounts with a single major financial institution. Based on the average cash balances during the year ended December 31, 2011, a 1% decrease in interest rates would have reduced the interest income for 2011 to $Nil.
Foreign Currency Exchange Risk
Currency exchange fluctuations may impact the costs of our operations. Specifically, the appreciation of the C$ against the U.S.$ may result in an increase in our Canadian operating costs in U.S. dollar terms. As of December 31, 2011, we maintained the majority of our cash balances in C$.
We currently do not engage in any currency hedging activities.
39
Commodity Price Risk
Our primary business activity is the development of the open pit, gold and silver, heap leach project on the Property. Decreases in the price of either of these metals from current levels has the potential to negatively impact our ability to secure the significant additional financing required to develop the Project into an operating mine. Refer also to
Item 1A. Risk Factors above.
The Project is not as yet in production and we do not currently hold any commodity derivative positions.
Item 8. Financial Statements and Supplementary Data.
The Consolidated Financial Statements of the Company and the notes thereto are attached to this report following the signature page and Certifications.
Item 9. Changes in and Disagreements with Accountants on Accounting and Financial Disclosure.
None.
Item 9A. Controls and Procedures.
Disclosure controls and procedures. Pursuant to Rule 13a-15(b) under the Exchange Act, GQM’s management has evaluated, under the supervision and with the participation of our principal executive officer and principal financial officer, the effectiveness of the design and operation of our disclosure controls and procedures (as defined in Rules 13a-15(e) and 15d-15(e) of the Exchange Act), as of the end of the period covered by this report. This evaluation included consideration of various processes and procedures to ensure that information that is required to be disclosed by the Company in the reports it files or submits under the Exchange Act is (i) recorded, processed, summarized and reported, within the time periods specified in the SEC’s rules and forms and (ii) accumulated and communicated to the Company’s management, including our principal executive officer and principal financial officer, as appropriate to allow timely decisions regarding required disclosure.
Based upon this evaluation, our principal executive officer and principal financial officer concluded that, as of December 31, 2011, as a result of the material weaknesses described below, our disclosure controls and procedures were not effective. Due to these material weaknesses in preparing our consolidated financial statements for the year ended December 31, 2011, we performed additional procedures to ensure that our consolidated financial statements were fairly presented in all material respects in accordance with U.S. generally accepted accounting principles.
Management’s report on internal control over financial reporting. The Company’s management is responsible for establishing and maintaining adequate internal control over financial reporting (as defined in Rule 13a-15(f) or 15d-15(f) of the Exchange Act). Management assessed the effectiveness of our internal control over financial reporting as of December 31, 2011, using criteria established in Internal Control-Integrated Framework issued by the Committee of Sponsoring Organizations of the Treadway Commission (COSO). Even an effective internal control system, no matter how well designed, has inherent limitations, including the possibility of human error and circumvention or overriding of controls and therefore can provide only reasonable assurance with respect to reliable financial reporting. Furthermore, the effectiveness of an internal control system in future periods can change with conditions.
A material weakness is a deficiency, or combination of deficiencies, in internal control over financial reporting such that there is a reasonable possibility that a material misstatement of the Company’s annual or interim financial statements will not be prevented or detected on a timely basis.
During the preparation and audit of our consolidated financial statements for the year ended December 31, 2011, we identified the following material weaknesses existed as of December 31, 2011:
| 1. | We did not maintain effective controls over the financial statements closing process or the timeliness of review and preparation of financial statements and other reporting documents and inconsistency of foreign exchange rate used in translation. |
| 2. | We did not maintain effective controls over the daily cash management and proper approval over the general and administrative and capital expenditures. |
40
These control weaknesses resulted in re-filing the unaudited consolidated interim financial statements for each of the quarters ended June 30 and September 30, 2011. The annual report for the year ended December 31, 2010 because the Company did not file with the SEC the Definitive Proxy Statement on Schedule 14A deemed incorporated into the Annual Report of the Company on Form 10-K, on or before the deadline for incorporation of such documents into the Company’s Form 10-K. In addition, the material weaknesses also resulted in audit adjustments to the following accounts: mark-to-market expenses (gain) for derivative liabilities and derivative liabilities, accretion expenses and asset retirement obligations.
Accordingly, the Company’s management has determined these control deficiencies constitute material weaknesses and as a result management has concluded that the internal controls over financial reporting are not effective as of December 31, 2011.
Our independent registered public accounting firm, BDO Canada LLP, has issued reports on its assessment of our internal control over financial reporting and our consolidated financial statements that are included in Item 8 of this Annual Report on Form 10-K. The reports contain an explanatory paragraph regarding the Company’s ability to continue as a going concern and an adverse opinion on the effectiveness of the Company’s internal control over financial reporting as of December 31, 2011.
Remediation of Material Weaknesses. The Company is evaluating remediation plans to address material weaknesses as may be appropriate for the size of operations and staffing of the Company, and that can be implemented in a cost effective manner. In doing so, the Company is currently completing the following steps:
| 1. | Reviewing the financial statement preparation and review process to ensure roles and responsibilities are clearly defined and understood; |
| 2. | Review the closing process for the accounting and financial statements to identify specific areas of weakness and address as necessary; and |
| 3. | Develop a chain of command and a process for approving general and administrative and capital expenditures. |
Changes in Internal Control. There were no changes in our internal control over financial reporting (as defined in Rule 13a-15(e) and Rule 15d-15(e) under the Exchange Act) during the fiscal year ended December 31, 2011 that have materially affected, or are reasonably likely to materially affect, our internal control over financial reporting, with the exception that a new chief financial officer was appointed in May of 2011.
Item 9B. Other Information
None.
PART III
Information with respect to Items 10 through 14 is set forth in the definitive Proxy Statement to be filed with the Securities and Exchange Commission on or before April 29, 2012 and is incorporated herein by reference. If the definitive Proxy Statement cannot be filed on or before April 29, 2012, the issuer will instead file an amendment to this Form 10-K/A disclosing the information with respect to Items 10 through 14.
41
PART IV
Item 15. Exhibits
| Exhibit | Description of Exhibit | Manner of Filing | |
| No. | |||
| 3.1 |
Notice of Articles |
Incorporated by reference to Exhibit 3.1 to the Form 8-K of the Company, filed with the SEC on September 2, 2010 | |
| 3.2 |
Articles |
Incorporated by reference to Exhibit 3.2 to the Form 8-K of the Company, filed with the SEC on September 2, 2010 | |
| 10.1 |
Management Agreement dated March 11, 2004 between the Registrant and H. Lutz Klingmann, and amendment dated May 31, 2010. |
Incorporated by reference to Exhibit 10.1 to the Form 10-K of the Company, filed with the SEC on January 14, 2011 | |
| 10.2 |
Mining Lease dated April 22, 1986 between the Registrant, Southwestern Refining Corporation, and Claude and Mary J.Birtle, and amendment dated March 23, 2007. |
Incorporated by reference to Exhibit 10.2 to the Form 10-K of the Company, filed with the SEC on January 14, 2011 | |
| 10.3 |
Mining Lease dated April 26, 2001 between the Subsidiary and Virginia Knight. |
Incorporated by reference to Exhibit 10.3 to the Form 10-K of the Company, filed with the SEC on January 14, 2011 | |
| 10.4 |
Lease dated October 20, 1994 between the Subsidiary and William J. Warner with respect to certain property within the project area. |
Incorporated by reference to Exhibit 10.5 to the Form 10-SB | |
| 10.5 |
Mining Lease dated September 19, 1994 between the Subsidiary and Western Centennials, Inc., with respect to certain property within the project area. |
Incorporated by reference to Exhibit 10.6 to the Form 10-SB | |
| 10.6 |
1996 Stock option plan of the registrant, as amended. |
Incorporated by reference to Exhibit 10.13 to the Form 10-SB | |
| 10.7 |
2008 Stock option plan of the registrant. |
Incorporated by reference to Exhibit 10.1 to the Form S-8 of the Company filed with the SEC on February 17, 2010 | |
| 21.1 |
Subsidiaries of the Registrant. |
Incorporated by reference to Exhibit 24.0 to the Form 10-SB | |
| 23.1 | |||
| 31.1 | |||
| 31.2 | |||
| 32.1 | |||
| 32.2 |
42
SIGNATURES
Pursuant to the requirements of Section 13 or 15(d) of the Securities Exchange Act of 1934, the registrant has duly caused this report to be signed on its behalf by the undersigned, thereunto duly authorized.
GOLDEN QUEEN MINING CO. LTD.
| /s/ H. Lutz Klingmann | ||||
| By: | ||||
| H. Lutz Klingmann | ||||
| President and Principal Executive Officer |
Date: March 13, 2013
Pursuant to the requirements of the Securities Exchange Act of 1934, this report has been signed below by the following persons on behalf of the registrant and in the capacities and on the dates indicated.
| Signature | Title | Date | |
| /s/ H. Lutz Klingmann | President, Principal Executive Officer, and Director | March 13, 2013 | |
| H. Lutz Klingmann | |||
| /s/ Edward Thompson | Director | March 13, 2013 | |
| Edward Thompson | |||
| /s/ Chester Shynkaryk | Director | March 13, 2013 | |
| Chester Shynkaryk | |||
| /s/ G. Ross McDonald | Principal Financial Officer and Principal Accounting Officer | March 13, 2013 | |
| G. Ross McDonald |
43
Golden Queen Mining Co. Ltd.
(An Exploration Stage
Company)
Consolidated Financial Statements
December 31, 2011
(US Dollars)
 |
Tel: 604 688 5421 Fax: 604 688 5132 www.bdo.ca |
BDO Canada LLP 600 Cathedral Place 925 West Georgia Street Vancouver BC V6C 3L2 Canada |
Report of Independent Registered Public Accounting Firm
To the Shareholders and Board of Directors
Golden Queen Mining Co. Ltd.
(An exploration stage company)
We have audited Golden Queen Mining Co. Ltd.’s internal control over financial reporting as of December 31, 2011, based on criteria established in Internal Control – Integrated Framework issued by the Committee of Sponsoring Organizations of the Treadway Commission (the COSO criteria). Golden Queen Mining Co. Ltd’s management is responsible for maintaining effective internal control over financial reporting and for its assessment of the effectiveness of internal control over financial reporting, appearing in its Annual Report under Item 9A, “Controls and Procedures”. Our responsibility is to express an opinion on the company’s internal control over financial reporting based on our audit.
We conducted our audit in accordance with the standards of the Public Company Accounting Oversight Board (United States). Those standards require that we plan and perform the audit to obtain reasonable assurance about whether effective internal control over financial reporting was maintained in all material respects. Our audit included obtaining an understanding of internal control over financial reporting, assessing the risk that a material weakness exists, and testing and evaluating the design and operating effectiveness of internal control based on the assessed risk. Our audit also included performing such other procedures as we considered necessary in the circumstances. We believe that our audit provides a reasonable basis for our opinion.
A company’s internal control over financial reporting is a process designed to provide reasonable assurance regarding the reliability of financial reporting and the preparation of financial statements for external purposes in accordance with generally accepted accounting principles. A company’s internal control over financial reporting includes those policies and procedures that (1) pertain to the maintenance of records that, in reasonable detail, accurately and fairly reflect the transactions and dispositions of the assets of the company; (2) provide reasonable assurance that transactions are recorded as necessary to permit preparation of financial statements in accordance with generally accepted accounting principles, and that receipts and expenditures of the company are being made only in accordance with authorizations of management and directors of the company; and (3) provide reasonable assurance regarding prevention or timely detection of unauthorized acquisition, use, or disposition of the company’s assets that could have a material effect on the financial statements.
Because of its inherent limitations, internal control over financial reporting may not prevent or detect misstatements. Also, projections of any evaluation of effectiveness to future periods are subject to the risk that controls may become inadequate because of changes in conditions, or that the degree of compliance with the policies or procedures may deteriorate.
A material weakness is a deficiency, or a combination of deficiencies, in internal control over financial reporting, such that there is a reasonable possibility that a material misstatement of the company’s annual or interim financial statements will not be prevented or detected on a timely basis. Material weaknesses in internal control over financial reporting related to (i) Financial Statement Close Process due to lack of timely review and preparation of the financial statements and other reporting documents and inconsistency of foreign exchange rate used in translation and (ii) lack of segregation of duties in daily cash management and no proper approval of capital expenditures and general and administrative spending have been identified and described in management’s assessment. These material weaknesses were considered in determining the nature, timing, and extent of audit tests applied in our audit of the 2011 consolidated financial statements, and this report does not affect our report dated March 28, 2012 on those financial statements.
In our opinion, Golden Queen Mining Co. Ltd. did not maintain, in all material respects, effective internal control over financial reporting as of December 31, 2011, based on the COSO criteria. We do not express an opinion or any other form of assurance on management’s statements referring to any corrective actions taken by the Company after the date of management’s assessment.
BDO Canada LLP, a Canadian limited liability partnership, is a member of BDO International Limited, a UK company limited by guarantee, and forms part of the international BDO network ofindependent firms.
1
We have also audited, in accordance with the standards of the Public Company Accounting Oversight Board (United States), the accompanying consolidated balance sheets of Golden Queen Mining Co. Ltd. as of December 31, 2011 and 2010 and the related consolidated statements of loss and comprehensive loss, stockholders’ equity (capital deficit), and cash flows for each of the three years in the period ended December 31, 2011. We have also audited the consolidated statements of loss and comprehensive loss, changes in shareholders’ equity (capital deficit), and cash flows for the period from inception (November 21, 1985) through December 31, 2012. Our report dated March 28, 2012, expressed an unqualified opinion with an explanatory paragraph disclosing substantial doubt about the Company's ability to continue as a going concern.
(signed) “BDO Canada LLP”
Chartered Accountants
Vancouver, Canada
March 28, 2012
|
Tel: 604 688 5421 Fax: 604 688 5132 www.bdo.ca |
BDO Canada LLP 600 Cathedral Place 925 West Georgia Street Vancouver BC V6C 3L2 Canada |
Report of Independent Registered Public Accounting Firm
To the Shareholders and Board of Directors
Golden Queen Mining Co. Ltd.
(An exploration stage company)
We have audited the accompanying consolidated balance sheets of Golden Queen Mining Co. Ltd. as of December 31, 2011 and 2010 and the related consolidated statements of loss and comprehensive loss, stockholders’ equity (capital deficit), and cash flows for each of the three years in the period ended December 31, 2011. We have also audited the statements of loss and comprehensive loss, changes in shareholders’ equity (capital deficit), and cash flows for the period from inception (November 21, 1985) through December 31, 2011. These consolidated financial statements are the responsibility of the Company’s management. Our responsibility is to express an opinion on these consolidated financial statements based on our audits.
We conducted our audits in accordance with the standards of the Public Company Accounting Oversight Board (United States). Those standards require that we plan and perform the audit to obtain reasonable assurance about whether the financial statements are free of material misstatement. An audit also includes examining, on a test basis, evidence supporting the amounts and disclosures in the financial statements, assessing the accounting principles used and significant estimates made by management, as well as evaluating the overall financial statement presentation. We believe that our audits provide a reasonable basis for our opinion.
In our opinion, the consolidated financial statements referred to above present fairly, in all material respects, the financial position of Golden Queen Mining Co. Ltd. at December 31, 2011 and 2010, and the results of its operations and its cash flows for each of the three years in the period ended December 31, 2011 and for the period from inception (November 1, 1985) through December 31, 2011, in conformity with accounting principles generally accepted in the United States of America.
The accompanying consolidated financial statements have been prepared assuming that the Company will continue as a going concern. As discussed in Note 1 to the consolidated financial statements, the Company has incurred recurring operating losses and had a deficit accumulated during the exploration stage as of December 31, 2011. These conditions raise substantial doubt about the Company’s ability to continue as a going concern. Management’s plans in regard to these matters are also described in Note 1. The consolidated financial statements do not include any adjustments that might result from the outcome of this uncertainty.
We also have audited, in accordance with the standards of the Public Company Accounting Oversight Board (United States), Golden Queen Mining Co. Ltd. and the Subsidiary’s internal control over financial reporting as of December 31, 2011, based on criteria established in Internal Control – Integrated Framework issued by the Committee of Sponsoring Organizations of the Treadway Commission (COSO) and our report dated March 28, 2012 expressed an adverse opinion on the Company’s internal control over financial reporting.
(signed) “BDO Canada LLP”
Chartered Accountants
Vancouver, Canada
March 28, 2012
BDO Canada LLP, a Canadian limited liability partnership, is a member of BDO International Limited, a UK company limited by guarantee, and forms part of the international BDO network ofindependent firms.
GOLDEN QUEEN MINING CO. LTD.
(an exploration stage
company)
Consolidated Balance Sheets
(US dollars)
| December 31, | December 31, | |||||
| 2011 | 2010 | |||||
| Assets | ||||||
| Current assets: | ||||||
| Cash and cash equivalents | $ | 7,922,255 | $ | 6,967,465 | ||
| Receivables | 21,516 | 42,796 | ||||
| Prepaid expenses and other current assets | 144,465 | 40,103 | ||||
| Total current assets | 8,088,236 | 7,050,364 | ||||
| Property and equipment, net (Note 2) | 308,450 | 318,326 | ||||
| Reclamation financial assurance (Note 6) | 296,180 | 286,653 | ||||
| Total Assets | $ | 8,692,866 | $ | 7,655,343 | ||
| Liabilities and Shareholders’ Equity (Capital deficit) | ||||||
| Current liabilities: | ||||||
| Accounts payable (Note 8) | $ | 183,934 | $ | 319,675 | ||
| Accrued liabilities | 83,579 | 62,839 | ||||
| Advance minimum royalties (Note 7) | 13,723 | 17,108 | ||||
| Total current liabilities | 281,236 | 399,622 | ||||
| Asset retirement obligations (Note 6) | 227,212 | 193,545 | ||||
| Derivative liability (Note 10) | 4,552,502 | 10,389,768 | ||||
| Total liabilities | 5,060,950 | 10,982,935 | ||||
| Shareholders’ Equity (Capital deficit) | ||||||
| Preferred
shares, no par value, 3,000,000
shares authorized; no shares outstanding Common shares, no par value, 150,000,000 shares authorized; 97,978,383 (2010 – 94,228,383) shares issued and outstanding (Note 5) |
61,906,619 | 56,339,823 | ||||
| Additional paid-in capital | 8,407,935 | 3,784,582 | ||||
| Deficit accumulated during the exploration stage | (66,682,638 | ) | (63,451,997 | ) | ||
| Total shareholders’ equity (capital deficit) | 3,631,916 | (3,327,592 | ) | |||
| Total Liabilities and Shareholders’ Equity (Capital deficit) | $ | 8,692,866 | $ | 7,655,343 |
Basis of Presentation and Ability to Continue as a Going Concern (Note 1) Commitments and Contingencies (Notes 3, 5 and 7)
Approved by the Directors:
| “H. Lutz Klingmann” | “Chester Shynkaryk” | |
| H. Lutz Klingmann, Director | Chester Shynkaryk, Director |
See Accompanying Summary of Accounting Policies and Notes to Consolidated Financial Statements
GOLDEN QUEEN MINING CO. LTD.
(an exploration stage
company)
Consolidated Statements of Loss and Comprehensive Loss
(US dollars)
| Cumulative | ||||||||||||
| from Date of | ||||||||||||
| Inception | ||||||||||||
| (November 21, | ||||||||||||
| Year Ended | Year Ended | Year Ended | 1985) through | |||||||||
| December 31, | December 31, | December 31, | December 31, | |||||||||
| 2011 | 2010 | 2009 | 2011 | |||||||||
| General and administrative expenses | $ | (880,830 | ) | $ | (639,203 | ) | $ | (504,754 | ) | $ | (5,951,675 | ) |
| Exploration expenditures | (2,639,946 | ) | (2,651,533 | ) | (1,742,199 | ) | (20,587,637 | ) | ||||
| Asset impairment loss (Note 3) | (938,770 | ) | (133,436 | ) | (167,898 | ) | (33,207,798 | ) | ||||
| Adjustment to asset retirement obligation
on changes in cash flow estimates |
- | - | (6,882 | ) | 223,583 | |||||||
| Accretion expense (Note 6) | (33,667 | ) | (15,981 | ) | (7,779 | ) | (105,029 | ) | ||||
| Change in fair value of derivative
liability including change in foreign exchange (Note 10) |
1,213,913 | (6,575,406 | ) | (2,095,300 | ) | (7,456,793 | ) | |||||
| Gain on settlement of debt | - | - | - | 136,627 | ||||||||
| Mineral property interests written-off | - | - | - | (277,251 | ) | |||||||
| (3,279,300 | ) | (10,015,559 | ) | (4,524,812 | ) | (67,225,973 | ) | |||||
| Interest expense | - | - | - | (913,098 | ) | |||||||
| Interest income | 48,659 | 31,633 | 10,070 | 1,680,279 | ||||||||
| Net loss and comprehensive loss | $ | (3,230,641 | ) | $ | (9,983,926 | ) | $ | (4,514,742 | ) | $ | (66,458,792 | ) |
| Loss per share - basic and diluted | $ | (0.03 | ) | $ | (0.11 | ) | $ | (0.05 | ) | |||
| Weighted average number of common shares outstanding | 95,343,041 | 91,990,821 | 86,738,897 |
See Accompanying Summary of Accounting Policies and Notes to Consolidated Financial Statements
GOLDEN QUEEN MINING CO. LTD.
(an exploration stage
company)
Consolidated Statements of Shareholders’ Equity (Capital
Deficit)
(US dollars)
| Deficit | |||||||||||||||
| Accumulated | Total | ||||||||||||||
| From the Date of Inception | During the | Shareholders’ | |||||||||||||
| (November 21, 1985) | Common | Additional | Exploration | Equity | |||||||||||
| through December 31, 2011 | Shares | Amount | Paid-in Capital | Stage | (Capital Deficit) | ||||||||||
| Balance, November 21, 1985 | |||||||||||||||
| Issuance of common shares for cash | 1,425,001 | $ | 141,313 | $ | - | $ | - | $ | 141,313 | ||||||
| Net loss for the period | - | - | - | (15,032 | ) | (15,032 | ) | ||||||||
| Balance, May 31, 1986 | 1,425,001 | 141,313 | - | (15,032 | ) | 126,281 | |||||||||
| Issuance of common shares for cash | 550,000 | 256,971 | - | - | 256,971 | ||||||||||
| Issuance of common shares for mineral property |
25,000 | 13,742 | - | - | 13,742 | ||||||||||
| Net loss for the year | - | - | - | (58,907 | ) | (58,907 | ) | ||||||||
| Balance, May 31, 1987 | 2,000,001 | 412,026 | - | (73,939 | ) | 338,087 | |||||||||
| Issuance of common shares for cash | 1,858,748 | 1,753,413 | - | - | 1,753,413 | ||||||||||
| Net income for the year | - | - | - | 38,739 | 38,739 | ||||||||||
| Balance, May 31, 1988 | 3,858,749 | 2,165,439 | (35,200 | ) | 2,130,239 | ||||||||||
| Issuance of common shares for cash | 1,328,750 | 1,814,133 | - | - | 1,814,133 | ||||||||||
| Issuance of common shares for mineral property |
100,000 | 227,819 | - | - | 227,819 | ||||||||||
| Net loss for the year | - | - | - | (202,160 | ) | (202,160 | ) | ||||||||
| Balance, May 31, 1989 | 5,287,499 | 4,207,391 | - | (237,360 | ) | 3,970,031 | |||||||||
| Issuance of common shares for cash | 1,769,767 | 2,771,815 | - | - | 2,771,815 | ||||||||||
| Issuance of common shares for mineral property |
8,875 | 14,855 | - | - | 14,855 | ||||||||||
| Net loss for the year | - | - | - | (115,966 | ) | (115,966 | ) | ||||||||
| Balance, May 31, 1990 | 7,066,141 | 6,994,061 | - | (353,326 | ) | 6,640,735 | |||||||||
| Net income for the year | - | - | - | 28,706 | 28,706 | ||||||||||
| Balance, May 31, 1991 | 7,066,141 | 6,994,061 | - | (324,620 | ) | 6,669,441 | |||||||||
| Net loss for the year | - | - | - | (157,931 | ) | (157,931 | ) | ||||||||
| Balance, May 31, 1992 | 7,066,141 | 6,994,061 | - | (482,551 | ) | 6,511,510 | |||||||||
| Net loss for the year | - | - | - | (285,391 | ) | (285,391 | ) | ||||||||
| Balance, May 31, 1993 | 7,066,141 | 6,994,061 | - | (767,942 | ) | 6,226,119 | |||||||||
| Issuance of common shares for cash | 5,834,491 | 1,536,260 | - | - | 1,536,260 | ||||||||||
| Share issuance costs | - | - | - | (18,160 | ) | (18,160 | ) | ||||||||
| Issuance of common shares for mineral property |
128,493 | 23,795 | - | - | 23,795 | ||||||||||
| Net loss for the year | - | - | - | (158,193 | ) | (158,193 | ) | ||||||||
| Balance, May 31, 1994 | 13,029,125 | 8,554,116 | - | (944,295 | ) | 7,609,821 | |||||||||
| Issuance of common shares for cash | 648,900 | 182,866 | - | - | 182,866 | ||||||||||
| Net loss for the year | - | - | - | (219,576 | ) | (219,576 | ) | ||||||||
| Balance, May 31, 1995 | 13,678,025 | 8,736,982 | - | (1,163,871 | ) | 7,573,111 | |||||||||
| Issuance of common shares for cash | 2,349,160 | 2,023,268 | - | - | 2,023,268 | ||||||||||
| Issuance of common shares for debt | 506,215 | 662,282 | - | - | 662,282 | ||||||||||
| Issuance of 5,500,000 special warrants | - | 9,453,437 | - | - | 9,453,437 | ||||||||||
| Special warrants issuance costs | - | - | - | (100,726 | ) | (100,726 | ) | ||||||||
| Net loss for the year | - | - | - | (426,380 | ) | (426,380 | ) | ||||||||
| Balance, May 31, 1996 | 16,533,400 | 20,875,969 | - | (1,690,977 | ) | 19,184,992 | |||||||||
| Issuance of common shares for cash | 18,000 | 10,060 | - | - | 10,060 | ||||||||||
| Issuance of common shares for special warrants |
5,500,000 | - | - | - | - | ||||||||||
| Special warrants issuance costs | - | - | - | (123,806 | ) | (123,806 | ) | ||||||||
| Net loss for the period | - | - | - | (348,948 | ) | (348,948 | ) | ||||||||
| Balance, December 31, 1996 | 22,051,400 | $ | 20,886,029 | $ | - | $ | (2,163,731 | ) | $ | 18,722,298 |
See Accompanying Summary of Accounting Policies and Notes to Consolidated Financial Statements
GOLDEN QUEEN MINING CO. LTD.
(an exploration stage
company)
Consolidated Statements of Shareholders’ Equity (Capital
Deficit)
(US dollars)
| Deficit | ||||||||||||||||||
| Accumulated | Total | |||||||||||||||||
| From the Date of Inception | Additional | During the | Shareholders’ | |||||||||||||||
| (November 21, 1985) | Common | Stock | Paid-in | Exploration | Equity (Capital | |||||||||||||
| through December 31, 2011 | Shares | Amount | Subscription | Capital | Stage | Deficit) | ||||||||||||
| Balance, carried forward from previous page | 22,051,400 | $ | 20,886,029 | $ | - | $ | - | $ | (2,163,731 | ) | $ | 18,722,298 | ||||||
| Issuance of common shares for cash | 157,000 | 157,050 | - | - | - | 157,050 | ||||||||||||
| Issuance of 3,500,000 special warrants | - | 5,287,315 | - | - | - | 5,287,315 | ||||||||||||
| Issuance of common shares for special warrants |
3,500,000 | - | - | - | - | - | ||||||||||||
| Options to non-employee directors | - | - | - | 70,200 | - | 70,200 | ||||||||||||
| Special warrants issuance costs | - | - | - | - | (163,313 | ) | (163,313 | ) | ||||||||||
| Net loss for the year | - | - | - | - | (1,047,869 | ) | (1,047,869 | ) | ||||||||||
| Balance, December 31, 1997 | 25,708,400 | 26,330,394 | - | 70,200 | (3,374,913 | ) | 23,025,681 | |||||||||||
| Issuance of common shares upon exercise of warrants |
1,834,300 | 857,283 | - | - | - | 857,283 | ||||||||||||
| Issuance of common shares through
conversion of debt |
2,017,941 | 1,000,000 | - | - | - | 1,000,000 | ||||||||||||
| Share issuance costs | - | - | - | - | (6,060 | ) | (6,060 | ) | ||||||||||
| Issuance of common shares for cash | 5,236,000 | 2,439,753 | - | - | - | 2,439,753 | ||||||||||||
| Options and re-priced options to
non-employee directors |
- | - | - | 107,444 | - | 107,444 | ||||||||||||
| Net loss for the year | - | - | - | - | (971,595 | ) | (971,595 | ) | ||||||||||
| Balance, December 31, 1998 | 34,796,641 | 30,627,430 | - | 177,644 | (4,352,568 | ) | 26,452,506 | |||||||||||
| Issuance of 13,250,000 special warrants | - | 3,350,915 | - | - | - | 3,350,915 | ||||||||||||
| Special warrants issuance costs | - | - | - | - | (166,620 | ) | (166,620 | ) | ||||||||||
| Issuance of common shares for special warrants |
13,250,000 | - | - | - | - | - | ||||||||||||
| Net loss for the year | - | - | - | - | (564,657 | ) | (564,657 | ) | ||||||||||
| Balance, December 31, 1999 | 48,046,641 | 33,978,345 | - | 177,644 | (5,083,845 | ) | 29,072,144 | |||||||||||
| Cumulative effect of change in accounting for stock options |
- | - | - | (177,644 | ) | - | (177,644 | ) | ||||||||||
| Stock subscription | - | - | 200,000 | - | - | 200,000 | ||||||||||||
| Net loss for the year | - | - | - | - | (28,708,276 | ) | (28,708,276 | ) | ||||||||||
| Balance, December 31, 2000 | 48,046,641 | 33,978,345 | 200,000 | - | (33,792,121 | ) | 386,224 | |||||||||||
| Issuance of common shares through conversion of debt |
406,250 | 65,000 | - | - | - | 65,000 | ||||||||||||
| Issuance of common shares for conversion of stock subscription |
1,538,462 | 200,000 | (200,000 | ) | - | - | - | |||||||||||
| Share issuance costs | - | - | - | - | (3,337 | ) | (3,337 | ) | ||||||||||
| Net loss for the year | - | - | - | - | (262,059 | ) | (262,059 | ) | ||||||||||
| Balance, December 31, 2001 | 49,991,353 | 34,243,345 | - | - | (34,057,517 | ) | 185,828 | |||||||||||
| Issuance of common shares through exercise of options |
290,000 | 37,234 | - | - | - | 37,234 | ||||||||||||
| Issuance of common shares through exercise of warrants |
1,520,836 | 243,334 | - | - | - | 243,334 | ||||||||||||
| Stock option compensation | - | - | - | 21,456 | - | 21,456 | ||||||||||||
| Share issuance costs | - | - | - | - | (4,216 | ) | (4,216 | ) | ||||||||||
| Net loss for the year | - | - | - | - | (347,603 | ) | (347,603 | ) | ||||||||||
| Balance, December 31, 2002 | 51,802,189 | 34,523,913 | - | 21,456 | (34,409,336 | ) | 136,033 | |||||||||||
| Issuance of common shares through exercise of options |
100,000 | 24,379 | - | - | - | 24,379 | ||||||||||||
| Equity component of convertible notes | - | - | - | 375,000 | - | 375,000 | ||||||||||||
| Stock option compensation | - | - | - | 127,326 | - | 127,326 | ||||||||||||
| Net loss for the year | - | - | - | - | (744,516 | ) | (744,516 | ) | ||||||||||
| Balance, December 31, 2003 | 51,902,189 | $ | 34,548,292 | $ | - | $ | 523,782 | $ | (35,153,852 | ) | $ | (81,778 | ) |
See Accompanying Summary of Accounting Policies and Notes to Consolidated Financial Statements
GOLDEN QUEEN MINING CO. LTD.
(an exploration stage
company)
Consolidated Statements of Shareholders’ Equity (Capital
Deficit)
(US dollars)
| Deficit | |||||||||||||||
| Accumulated | Total | ||||||||||||||
| From the Date of Inception | Additional | During the | Shareholders’ | ||||||||||||
| (November 21, 1985) | Common | Paid-in | Exploration | Equity | |||||||||||
| through December 31, 2011 | Shares | Amount | Capital | Stage | (Capital Deficit) | ||||||||||
| Balance, carried forward from previous page | 51,902,189 | $ | 34,548,292 | $ | 523,782 | $ | (35,153,852 | ) | $ | (81,778 | ) | ||||
| Issuance of common shares for cash | 8,000,000 | 3,036,282 | - | - | 3,036,282 | ||||||||||
| Issuance of common shares for convertible notes |
978,260 | 225,000 | - | - | 225,000 | ||||||||||
| Issuance of common shares through exercise of options |
200,000 | 55,861 | - | - | 55,861 | ||||||||||
| Share issuance costs | - | - | - | (38,975 | ) | (38,975 | ) | ||||||||
| Net loss for the year | - | - | - | (1,772,250 | ) | (1,772,250 | ) | ||||||||
| Balance, December 31, 2004 | 61,080,449 | 37,865,435 | 523,782 | (36,965,077 | ) | 1,424,140 | |||||||||
| Issuance of common shares through exercise of options |
110,000 | 21,049 | - | - | 21,049 | ||||||||||
| Stock option compensation | - | - | 48,592 | - | 48,592 | ||||||||||
| Net loss for the year | - | - | - | (1,476,324 | ) | (1,476,324 | ) | ||||||||
| Balance, December 31, 2005 | 61,190,449 | 37,886,484 | 572,374 | (38,441,401 | ) | 17,457 | |||||||||
| Issuance of common shares through private placement |
7,200,000 | 1,614,716 | 1,520,899 | - | 3,135,615 | ||||||||||
| Issuance of common shares through exercise of options |
100,000 | 30,853 | - | - | 30,853 | ||||||||||
| Issuance of common shares through exercise of warrants |
8,978,260 | 4,659,173 | - | - | 4,659,173 | ||||||||||
| Issuance of common shares for convertible notes |
652,174 | 150,000 | 39,917 | - | 189,917 | ||||||||||
| Stock option compensation | - | - | 814,810 | - | 814,810 | ||||||||||
| Modification of warrants | - | - | 889,117 | - | 889,117 | ||||||||||
| Share issuance costs | - | - | - | (62,888 | ) | (62,888 | ) | ||||||||
| Net loss for the year | - | - | - | (4,910,036 | ) | (4,910,036 | ) | ||||||||
| Balance, December 31, 2006 | 78,120,883 | 44,341,226 | 3,837,117 | (43,414,325 | ) | 4,764,018 | |||||||||
| Issuance of common shares for exercise of options |
290,000 | 127,652 | - | - | 127,652 | ||||||||||
| Issuance of common shares for property | 30,000 | 24,600 | - | - | 24,600 | ||||||||||
| Net loss for the year | - | - | - | (2,006,482 | ) | (2,006,482 | ) | ||||||||
| Balance, December 31, 2007 | 78,440,883 | 44,493,478 | 3,837,117 | (45,420,807 | ) | 2,909,788 | |||||||||
| Issuance of common shares through exercise of warrants |
7,200,000 | 4,184,425 | - | - | 4,184,425 | ||||||||||
| Net loss for the year | - | - | - | (3,996,777 | ) | (3,996,777 | ) | ||||||||
| Balance, December 31, 2008 | 85,640,883 | 48,677,903 | 3,837,117 | (49,417,584 | ) | 3,097,436 | |||||||||
| Cumulative effect of change in accounting principle |
- | - | (863,402 | ) | 464,255 | (399,147 | ) | ||||||||
| Issuance of common shares through private placement |
2,337,500 | 1,396,646 | - | - | 1,396,646 | ||||||||||
| Issuance of common shares through exercise of options |
400,000 | 131,085 | - | - | 131,085 | ||||||||||
| Reclassification of derivative liability on the exercise of stock options |
- | - | 156,834 | - | 156,834 | ||||||||||
| Net loss for the year | - | - | - | (4,514,742 | ) | (4,514,742 | ) | ||||||||
| Balance, December 31, 2009 | 88,378,383 | 50,205,634 | 3,130,549 | (53,468,071 | ) | (131,888 | ) | ||||||||
| Issuance of common shares through
exercise of options (Note 5) |
850,000 | 272,156 | - | - | 272,156 | ||||||||||
| Reclassification of derivative liability on the exercise of stock options (Note 10) |
- | - | 654,033 | - | 654,033 | ||||||||||
| Issuance of common shares through private placement (Note 5) |
5,000,000 | 5,907,798 | - | - | 5,907,798 | ||||||||||
| Share issuance costs (Note 5) | - | (45,765 | ) | - | - | (45,765 | ) | ||||||||
| Net loss for the year | - | - | - | (9,983,926 | ) | (9,983,926 | ) | ||||||||
| Balance, December 31, 2010 | 94,228,383 | $ | 56,339,823 | $ | 3,784,582 | $ | (63,451,997 | ) | $ | (3,327,592 | ) |
See Accompanying Summary of Accounting Policies and Notes to Consolidated Financial Statements
GOLDEN QUEEN MINING CO. LTD.
(an exploration stage
company)
Consolidated Statements of Shareholders’ Equity Capital
Deficit)
(US dollars)
| Deficit | |||||||||||||||
| Accumulated | Total | ||||||||||||||
| From the Date of Inception | During the | Shareholders’ | |||||||||||||
| (November 21, 1985) | Common | Additional Paid- | Exploration | Equity | |||||||||||
| through December 31, 2011 | Shares | Amount | in Capital | Stage | (Capital Deficit) | ||||||||||
| Balance carried forward from previous page | 94,228,383 | $ | 56,339,823 | $ | 3,784,582 | $ | (63,451,997 | ) | $ | (3,327,592 | ) | ||||
| Issuance of common shares through exercise of options (Note 5) |
1,250,000 | 972,559 | - | - | 972,559 | ||||||||||
| Issuance of common shares through exercise of warrants (Note 5) |
2,500,000 | 4,594,237 | - | - | 4,594,237 | ||||||||||
| Reclassification of derivative liability on exercise of warrants (Note 10) |
- | - | 1,629,668 | - | 1,629,668 | ||||||||||
| Reclassification of derivative liability on the exercise of stock options (Note 10) |
- | - | 2,993,685 | - | 2,993,685 | ||||||||||
| Net loss for the year | - | - | - | (3,230,641 | ) | (3,230,641 | ) | ||||||||
| Balance, December 31, 2011 | 97,978,383 | $ | 61,906,619 | $ | 8,407,935 | $ | (66,682,638 | ) | $ | 3,631,916 |
See Accompanying Summary of Accounting Policies and Notes to Consolidated Financial Statements
GOLDEN QUEEN MINING CO. LTD.
(an exploration stage
company)
Consolidated Statements of Cash Flows
(US dollars)
| Cumulative | ||||||||||||
| from Date of | ||||||||||||
| Inception | ||||||||||||
| (November 21, | ||||||||||||
| Year Ended | Year Ended | Year Ended | 1985) through | |||||||||
| December 31, | December 31, | December 31, | December 31, | |||||||||
| 2011 | 2010 | 2009 | 2011 | |||||||||
| Operating activities: | ||||||||||||
| Net loss for period | $ | (3,230,641 | ) | $ | (9,983,926 | ) | $ | (4,514,742 | ) | $ | (66,458,792 | ) |
| Adjustments to reconcile net loss to cash used in operating activities: | ||||||||||||
| Asset impairment loss | 938,770 | 133,436 | 167,898 | 33,207,798 | ||||||||
| Abandoned mineral property interests | - | - | - | 277,251 | ||||||||
| Amortization and depreciation | 9,876 | 8,119 | 6,024 | 479,796 | ||||||||
| Amortization of debt discount | - | - | - | 375,000 | ||||||||
| Adjustment to asset retirement
obligation based on changes in cash flow estimates |
- | - | 6,882 | (223,583 | ) | |||||||
| Accretion expense | 33,667 | 15,981 | 7,779 | 105,029 | ||||||||
| Change in fair value of
derivative liability including change in foreign exchange |
(1,213,913 | ) | 6,575,406 | 2,095,300 | 7,456,793 | |||||||
| Gain on disposition of property and equipment | - | - | - | (10,032 | ) | |||||||
| Stock option compensation | - | 46,275 | 357,989 | 1,416,448 | ||||||||
| Financing charges related to modification of warrants | - | - | - | 889,117 | ||||||||
| Mineral property expenditures | - | - | - | (22,395,449 | ) | |||||||
| Changes in assets and liabilities: | ||||||||||||
| Receivables | 21,280 | (18,192 | ) | (4,553 | ) | (21,516 | ) | |||||
| Prepaid expenses and other current assets | (104,362 | ) | (20,613 | ) | 356 | (231,375 | ) | |||||
| Accounts payable and accrued liabilities | (115,001 | ) | 153,927 | (20,456 | ) | 307,430 | ||||||
| Royalty and mining rights payable | (3,385 | ) | 17,108 | (48,034 | ) | 13,723 | ||||||
| Cash used in operating activities | (3,663,709 | ) | (3,072,479 | ) | (1,945,557 | ) | (44,812,362 | ) | ||||
| Investment activities: | ||||||||||||
| Purchase of mineral properties | (938,770 | ) | (133,436 | ) | (167,898 | ) | (8,875,562 | ) | ||||
| Deposits on mineral properties | - | - | - | (1,017,551 | ) | |||||||
| Purchase of financial assurance | (9,527 | ) | - | (14,845 | ) | (296,180 | ) | |||||
| Purchase of property and equipment | - | (120,529 | ) | - | (1,434,367 | ) | ||||||
| Proceeds from sale of property and equipment | - | - | - | 47,153 | ||||||||
| Cash used in investing activities | (948,297 | ) | (253,965 | ) | (182,743 | ) | (11,576,507 | ) |
See Accompanying Summary of Accounting Policies and Notes to Consolidated Financial Statements
GOLDEN QUEEN MINING CO. LTD.
(an exploration stage
company)
Consolidated Statements of Cash Flows (Continued)
(US dollars)
| Cumulative | ||||||||||||
| from Date of | ||||||||||||
| Inception | ||||||||||||
| (November 21, | ||||||||||||
| Year Ended | Year Ended | Year Ended | 1985) through | |||||||||
| December 31, | December 31, | December 31, | December 31, | |||||||||
| 2011 | 2010 | 2009 | 2011 | |||||||||
| Financing activities: | ||||||||||||
| Borrowing under long-term debt | $ | - | $ | - | $ | - | $ | 3,918,187 | ||||
| Payment of long-term debt | - | - | - | (2,105,905 | ) | |||||||
| Proceeds from convertible debt | - | - | - | 440,000 | ||||||||
| Issuance of common shares for cash | - | 7,634,316 | 1,396,646 | 28,871,618 | ||||||||
| Share issuance costs | - | (45,765 | ) | - | (733,866 | ) | ||||||
| Issuance of special warrants | - | - | - | 18,091,667 | ||||||||
| Issuance of common shares upon exercise
of stock options |
972,559 | 272,156 | 131,085 | 1,534,305 | ||||||||
| Issuance of common shares upon exercise of warrants | 4,594,237 | - | - | 14,295,118 | ||||||||
| Cash provided by financing activities | 5,566,796 | 7,860,707 | 1,527,731 | 64,311,124 | ||||||||
| Net change in cash and cash Equivalents | 954,790 | 4,534,263 | (600,569 | ) | 7,922,255 | |||||||
| Cash and cash equivalents, beginning balance | 6,967,465 | 2,433,202 | 3,033,771 | - | ||||||||
| Cash and cash equivalents, ending balance | $ | 7,922,255 | $ | 6,967,465 | $ | 2,433,202 | $ | 7,922,255 |
Supplementary Disclosures of Cash Flow Information (Note 9)
See Accompanying Summary of Accounting Policies and Notes to Consolidated Financial Statements
GOLDEN QUEEN MINING CO. LTD.
(an exploration stage
company)
Notes to Consolidated Financial Statements
Years
Ended December 31, 2011, 2010 and 2009
(US dollars)
Nature of Business Golden Queen Mining Co. Ltd. (“Golden Queen” or the “Company”) is engaged in acquiring and maintaining gold and silver mining properties for exploration, future development and production. The Company was formed on November 21, 1985. Since its inception, the Company has been in the exploration stage. Planned activities involve bringing to production the Soledad Mountain Project (the “Project”), a precious metals mine located in the Mojave Mining District, Kern County, California.
Principles of Consolidation These consolidated financial statements include the accounts of Golden Queen, a British Columbia corporation, and its wholly-owned subsidiary, Golden Queen Mining Co., Inc. (the “Subsidiary”), a US (State of California) corporation and, until its dissolution on August 27, 2007, the Karma Wegmann Corporation (see Note 3).
Generally Accepted Accounting Principles (“GAAP”) The consolidated financial statements have been prepared in accordance with accounting principles generally accepted in the United States.
Cash and Cash Equivalents For purposes of balance sheet classification and the statements of cash flows, the Company considers all highly liquid investments purchased with an original maturity of three months or less to be cash equivalents.
The Company places its cash and cash equivalents with high quality financial. At times, such investments may be in excess of FDIC insurance limits. To date, the Company has not experienced a loss or lack of access to its invested cash and cash equivalents. However, no assurance can be provided that access to the Company’s invested cash and cash equivalents will not be impacted by adverse economic conditions in the financial markets.
Property and Equipment Property and equipment are stated at the lower of cost or net realizable value less accumulated depreciation. Depreciation is provided by the straight-line method over the estimated service lives of the respective assets, which range from 3 to 30 years, as follows:
| Buildings | 20 years |
| Furniture and Fixtures | 5 years |
| Automobiles | 3 to 5 years |
| Rental Properties | 30 years |
Mineral Properties Costs related to the development of our mineral reserves are capitalized when it has been determined an ore body can be economically developed. The development stage begins when an ore body is determined to be economically recoverable based on proven and probable reserves and appropriate permits are in place, and ends when the production stage or exploitation of reserves begins. Major mine development expenditures are capitalized, including primary development costs such as costs of building access ways, heap leach pads, ramps and infrastructure developments.
Costs for exploration, pre-development, if and when applicable, and maintenance and repairs on capitalized property, plant and equipment are charged to operations as incurred. Exploration costs include those relating to activities carried out (a) in search of previously unidentified mineral deposits, or (b) at undeveloped concessions. Pre-development activities involve costs incurred in the exploration stage that may ultimately benefit production that are expensed due to the lack of evidence of economic development, which is necessary to demonstrate future recoverability of these expenses. Secondary development costs are incurred for preparation of an ore body for production in a specific ore block, stope or work area, providing a relatively short-lived benefit only to the mine area they relate to, and not to the ore body as a whole.
Drilling and related costs are either classified as exploration or secondary development, as defined above, and charged to operations as incurred, or capitalized, based on the following criteria:
- Whether the costs are incurred to further define mineralization at and adjacent to existing reserve areas or intended to assist with mine planning within a reserve area;
- Whether the drilling costs relate to an ore body that has been determined to be commercially mineable, and a decision has been made to put the ore body into commercial production; and
- Whether, at the time that the cost is incurred, the expenditure: (a) embodies a probable future benefit that involves a capacity, singly or in combination, with other assets to contribute directly or indirectly to future net cash inflows, (b) we can obtain the benefit and control others’ access to it, and (c) the transaction or event giving rise to our right to or control of the benefit has already occurred.
If all of these criteria are met, drilling and related costs are capitalized. Drilling costs not meeting all of these criteria are expensed as incurred. The following factors are considered in determining whether or not the criteria listed above have been met, and capitalization of drilling costs is appropriate:
- Completion of a favourable economic study and mine plan for the ore body targeted;
- Authorization of development of the ore body by management and/or the Board of Directors; and
- All permitting and/or contractual requirements necessary for us to have the right to or control of the future benefit from the targeted ore body have been met.
Once production has commenced, capitalized costs will be depleted using the units-of-production method over the estimated life of the proven and probable reserves. If mineral properties are subsequently abandoned or impaired, any capitalized costs will be charged to the Consolidated Statements of Loss and Comprehensive Loss in that period.
GOLDEN QUEEN MINING CO. LTD.
(an exploration stage
company)
Notes to Consolidated Financial Statements
Years
Ended December 31, 2011, 2010 and 2009
(US dollars)
We assess the carrying cost of our mineral properties for impairment whenever information or circumstances indicate the potential for impairment. Such evaluations compare estimated future net cash flows with our carrying costs and future obligations on an undiscounted basis. If it is determined that the future undiscounted cash flows are less than the carrying value of the property, a write down to the estimated fair value is charged to the Consolidated Statements of Loss and Comprehensive Loss for the period. Where estimates of future net cash flows are not available and where other conditions suggest impairment, management assesses if the carrying value can be recovered.
Proceeds received under option agreements and/or earn-in agreements are recorded as a cost recovery against the carrying value of the underlying project until the carrying value is reduced to zero. Any proceeds received in excess of the carrying value of the project are recorded as a realized gain in the Consolidated Statements of Loss and Comprehensive Loss.
Valuation of Long-lived Assets Accounting standards require recognition of impairment of long-lived assets in the event the carrying value of such assets may not be recoverable. It requires that those long-lived assets to be disposed of by sale are to be measured at the lower of carrying amount or fair value less cost of sale whether reported in continuing operations or in discontinued operations. In accordance with the provisions of the accounting standard, the Company reviews the carrying value of its mineral properties on a regular basis. Estimated undiscounted future cash flow from the mineral properties is compared with the current carrying value in order to determine if an impairment exists. Reductions to the carrying value, if necessary, are recorded to the extent the net book value of the property exceeds the estimate of future discounted cash flow or liquidation value.
Foreign Currency Translation The Company’s functional and reporting currency, the US dollar is the primary economic currency. Assets and liabilities in foreign currencies are generally translated into US dollars at the exchange rates on the balance sheet date. Revenues and expenses are translated at exchange rates on the date of the transaction. Where amounts denominated in a foreign currency are converted into US dollars by remittance or repayment, the realized exchange differences are included in other income. The exchange rates prevailing at December 31, 2011, 2010 and 2009 were $1.02, $0.99 and $1.05 stated in Canadian dollars per one US dollar, respectively. The average rates of exchange during the years ended December 31, 2011, 2010 and 2009 were $0.99, $1.02 and $1.14, stated in Canadian dollars per one US dollar, respectively.
Loss Per Share The Company computes and discloses loss per share in accordance with ASC 260, “Earnings per Share”, which requires dual presentation of basic loss per share and diluted loss per share on the face of all income statements presented for all entities with complex capital structures. Basic loss per share is computed as net loss divided by the weighted average number of common shares outstanding for the period. Diluted loss per share reflects the potential dilution that could occur from common shares issuable through stock options and warrants. Since the Company’s stock options and warrants are anti-dilutive for all periods presented, there is no difference between basic and diluted loss per share as presented. A total of 1,800,000 (2010 – 5,550,000, 2009 – 3,850,000) common shares were issuable pursuant to such stock options at December 31, 2011.
Asset Retirement Obligations The Company records the fair value of an asset retirement obligation as a liability in the period in which it incurs a legal obligation associated with the retirement of tangible long-lived assets that result from the acquisition, construction, development and/or normal use of the assets. The obligation is measured initially at fair value using present value methodology, and the resulting costs capitalized into the carrying amount of the related asset. In subsequent periods, the liability will be adjusted for any changes in the amount or timing of the underlying future cash flows. Capitalized asset retirement costs are amortized on the same basis as the related asset and the discount accretion of the liability is included in determining the results of operations.
Estimates The preparation of financial statements in conformity with GAAP requires management to make estimates and assumptions that affect the reported amounts of assets and liabilities and disclosure of contingent assets and liabilities at the date of the financial statements, and the reported amounts of revenues and expenses during the reporting period. Significant estimates have been made by management in several areas including the recoverability of mineral properties, reclamation reserves and valuation of stock options. Actual results could differ from those estimates.
Fair Value of Financial Instruments The carrying amounts reported in the balance sheets for cash and cash equivalents, receivables, accounts payable and accrued liabilities approximate fair values because of the immediate or short-term maturity of these financial instruments. The fair value of the reclamation financial assurance approximates the carrying value because the stated interest rates reflect recent market conditions or because the rates are variable in nature.
GOLDEN QUEEN MINING CO. LTD.
(an exploration stage
company)
Notes to Consolidated Financial Statements
Years
Ended December 31, 2011, 2010 and 2009
(US dollars)
Income Taxes The Company follows the asset and liability method of accounting for income taxes whereby the deferred tax assets and liabilities are recognized for the future tax consequences of differences between the financial statement carrying amounts of existing assets and liabilities and their respective tax basis. If it is determined that the realization of the future tax benefit is not more likely than not, the Company establishes a valuation allowance.
Stock Option Plan In 2009, the Company’s Board of Directors adopted a second stock option plan referred to as the 2008 stock option plan (the “2008 Plan”). Pursuant to the 2008 Plan, a further 7,200,000 shares were reserved for the issuance on exercise of options granted under the new plan. The exercise price of stock options granted under the 2008 Plan is determined by the Board, but shall not be less than the volume weighted average price for the five trading days immediately prior to the award date. All options granted under the 2008 Plan will be subject to such vesting requirements as may be prescribed by the Exchange, if applicable, or as may be imposed by the Board. All stock options granted under the 2008 Plan and outstanding as at December 31, 2011 expire at a date determined by the Company’s Board of Directors, not exceeding five years from the date of grant.
Derivative Financial Instruments The Company reviews the terms of its equity instruments and other financing arrangements to determine whether or not there are embedded derivative instruments that are required to be accounted for separately as a derivative financial instrument. Also, in connection with the issuance of financing instruments, the Company may issue freestanding options or warrants that may, depending on their terms, be accounted for as derivative instrument liabilities, rather than as equity. The Company may also issue options or warrants to non-employees in connection with consulting or other services.
Derivative financial instruments are measured at their fair value. For derivative financial instruments that are accounted for as liabilities, the derivative instrument is initially recorded at its fair value and is then re-valued at each reporting date, with changes in the fair value reported as charges or credits to income. For warrant-based derivative financial instruments, the Company uses the Black-Scholes option pricing model to estimate fair value of the derivative instruments. To the extent that the initial fair values of the freestanding and/or bifurcated derivative instrument liabilities exceed the total proceeds received, an immediate charge to income is recognized, in order to initially record the derivative instrument liabilities at their fair value.
The classification of derivative instruments, including whether or not such instruments should be recorded as liabilities or as equity, is reassessed at the end of each reporting period. If reclassification is required, the fair value of the derivative instrument, as of the determination date, is reclassified. Any previous charges or credits to income for changes in the fair value of the derivative instrument are not reversed. Derivative instrument liabilities are classified in the balance sheet as current or non-current based on whether net-cash settlement of the derivative instrument could be required within 12 months of the balance sheet date.
Recent Accounting Pronouncements
| (i) | In December 2011, the Financial Accounting Standards Board (FASB) issued Accounting Standards Update (ASU) No. 2011-12, Comprehensive Income (Topic 220): Deferral of the Effective Date for Amendments to the Presentation of Reclassifications of Items Out of Accumulated Other Comprehensive Income in ASU No. 2011-05. Entities will not be required to comply with the presentation requirements in ASU No. 2011-05 that this ASU is deferring. For this reason, the transition guidance in paragraph 220-10- 65-2 is consistent with that for Update 2011-05. The amendment is effective for interim and annual periods commencing December 15, 2011. Early adoption is permitted. The adoption of the standard did not have any impact on the Company’s consolidated financial statements. |
GOLDEN QUEEN MINING CO. LTD.
(an exploration stage
company)
Notes to Consolidated Financial Statements
Years
Ended December 31, 2011, 2010 and 2009
(US dollars)
Recent Accounting Pronouncements - Continued
| (ii) | The FASB has issued ASU No. 2011-05, Comprehensive Income (Topic 220): Presentation of Comprehensive Income. This ASU amends the FASB Accounting Standards CodificationTM (Codification) to allow an entity the option to present the total of comprehensive income, the components of net income and the components of other comprehensive income either in a single continuous statement of comprehensive income or in two separate but consecutive statements. In both choices, an entity is required to present each component of net income along with total net income, each component of other comprehensive income along with a total for other comprehensive income and a total amount for comprehensive income. ASU 2011-05 eliminates the option to present the components of other comprehensive income as part of the statement of changes in shareholders’ equity. The amendments to the Codification in the ASU do not change the items that must be reported in other comprehensive income or when an item of other comprehensive income must be reclassified to net income. ASU 2011-05 should be applied retrospectively. The amendment is effective for interim and annual periods commencing December 15, 2011. Early adoption is permitted. The adoption of the standard did not have any impact on the Company’s consolidated financial statements. |
| (iii) | The FASB has issued ASU No. 2011-04, Fair Value Measurement (Topic 820): Amendments to Achieve Common Fair Value Measurement and Disclosure Requirements in U.S. GAAP and International Financial Reporting Standards (IFRS). This ASU represents the converged guidance of the FASB and the International Accounting Standards Board (IASB) (the Boards) on fair value measurement. The collective efforts of the Boards and their staffs, reflected in ASU 2011-04, have resulted in common requirements for measuring fair value and for disclosing information about fair value measurements, including a consistent meaning of the term “fair value”. The Boards have concluded the common requirements will result in greater comparability of fair value measurements presented and disclosed in financial statements prepared in accordance with US GAAP and IFRS. The amendments to the Codification in this ASU are to be applied prospectively. The amendments are effective for interim and annual periods commencing December 15, 2011. Early application is not permitted. The adoption of the standard did not have any impact on the Company’s consolidated financial statements. |
| (iv) | In April 2010, the FASB issued ASU 2010-13, Compensation – Stock Compensation (Topic 718). The objective of this update is to address the classification of an employee share-based payment award with an exercise price denominated in the currency of a market in which the underlying equity security trades. It provides guidance on the classification of a share-based payment award as either equity or a liability. A share-based payment award that contains a condition that is not a market, performance or service condition is required to be classified as a liability. The amendment in this update is effective for the Company’s interim period and annual periods beginning on January 1, 2011. The amendments in this update should be applied by recording a cumulative-effect adjustment to the opening balance of retained earnings. The cumulative-effect adjustment should be calculated for all awards outstanding as of the beginning of the fiscal year in which the amendments are initially applied, as if the amendments had been applied consistently since the inception of the award. The adoption of the standard did not have any impact on the Company’s consolidated financial statements. |
GOLDEN QUEEN MINING CO. LTD.
(an exploration stage
company)
Notes to Consolidated Financial Statements
Years
Ended December 31, 2011, 2010 and 2009
(US dollars)
1. Basis of Presentation and Ability to Continue as a Going Concern
The Company has had no revenues from operations since inception and as at December 31, 2011 has a deficit of $66,682,638 (2010 - $63,451,997) accumulated during the exploration stage. Management plans to control current costs and does not anticipate requiring additional financing to fund Company activities over the next twelve months.
The Company released the results of a feasibility study in a news release on April 6, 2011. The Company has not as yet made a production decision. The Company is evaluating various financing options for the construction of the Project and these may include:
| a. | An equity financing; |
| b. | A combination of equity and debt; and |
| c. | A merger with an established mining company. |
The ability of the Company to obtain financing for its ongoing activities and thus maintain solvency, or to fund construction of the operating facility at Soledad, is dependent on equity market conditions, the market for precious metals, the willingness of other parties to lend the Company money or the ability to find a merger partner. While the Company has been successful at certain of these efforts in the past, there can be no assurance that future efforts will be successful. This raises substantial doubt about the Company’s ability to continue as a going concern.
These financial statements do not include any adjustments to the recoverability and classification of recorded asset amounts and classification of liabilities that might be necessary should the Company be unable to continue as a going concern.
Certain prior-year amounts have been reclassified to conform with the current year's presentation.
GOLDEN QUEEN MINING CO. LTD.
(an exploration stage
company)
Notes to Consolidated Financial Statements
Years
Ended December 31, 2011, 2010 and 2009
(US dollars)
2. Property and Equipment
Property and equipment consists of:
| 2011 | 2010 | |||||
| Buildings | $ | 110,730 | $ | 110,730 | ||
| Furniture and fixtures | 56,090 | 56,090 | ||||
| Automobiles | 21,401 | 21,401 | ||||
| Rental properties | 349,794 | 349,794 | ||||
| Property and equipment, cost | 538,015 | 538,015 | ||||
| Less accumulated depreciation | (229,565 | ) | (219,689 | ) | ||
| Property and equipment, net | $ | 308,450 | $ | 318,326 |
3. Mineral Properties
The Company capitalizes amounts paid to acquire mineral property interests. As of December 31, 2011, all acquisition and mineral property costs were impaired due to uncertainties in obtaining the necessary permits and advancing the Project. Acquisition costs for the year ended December 31, 2010 and 2011 are as follows:
| 2011 | 2010 | |||||
| Beginning balance | $ | - | $ | - | ||
| Addition of mineral property interests | 938,770 | 133,436 | ||||
| Asset impairment loss | (938,770 | ) | (133,436 | ) | ||
| Ending balance | $ | - | $ | - |
In July 2006, the Company acquired through the purchase of the Karma Wegmann Corporation a tract of land contiguous to the Project, in considerati
on of $875,000 paid to the vendors. The mineral properties owned by Karma Wegmann Corporation were transferred to the Company and management determined that a write-down of $875,000 was necessary in 2006. The Karma Wegmann Corporation was wound-up on August 27, 2007.
The Company is required to pay a royalty of 1% of gross smelter returns to the original owners of the Karma Wegmann Corporation for a period of up to 60 years, not to exceed $60,000,000, upon commencement of commercial production from the Property formerly owned by Karma Wegmann Corporation. As of December 31, 2011, the Company has not incurred any royalty as the Project has not been in production.
GOLDEN QUEEN MINING CO. LTD.
(an exploration stage
company)
Notes to Consolidated Financial Statements
Years
Ended December 31, 2011, 2010 and 2009
(US dollars)
4. Income Taxes
The tax effects of the temporary differences that give rise to the Company's deferred tax assets and liabilities are as follows:
| 2011 | 2010 | ||||||
| Net operating and capital losses | $ | 8,382,000 | $ | 9,174,000 | |||
| Property and equipment | 125,000 | 327,000 | |||||
| Mineral properties and deferred exploration costs | 3,085,000 | 2,141,000 | |||||
| Asset retirement obligations | 77,000 | 63,000 | |||||
| Foreign exchange (gain) loss | (49,000 | ) | (43,000 | ) | |||
| Undeducted financing costs | 8,000 | 10,000 | |||||
| Valuation allowance | (11,628,000 | ) | (11,672,000 | ) | |||
| Deferred tax assets (liabilities) | $ | - | $ | - |
The provision for income taxes differ from the amount established using the statutory income tax rate as follows:
| 2011 | 2010 | 2009 | |||||||
| Income tax benefit at Canadian statutory rate | $ | (856,000 | ) | $ | (2,845,000 | ) | $ | (1,354,000 | ) |
| Foreign income taxes at other than Canadian statutory rate | (278,000 | ) | (176,000 | ) | (64,000 | ) | |||
| Change in fair value of derivative liability | (329,000 | ) | 1,797,000 | 681,000 | |||||
| Non-deductible penalty | (16,000 | ) | - | - | |||||
| Non-deductible stock-based compensation | - | 14,000 | - | ||||||
| Share issuance costs | - | (7,000 | ) | - | |||||
| Non-taxable portion of foreign exchange gain | 61,000 | (43,000 | ) | - | |||||
| Expiry of losses carried forward | 1,372,000 | 253,000 | 699,000 | ||||||
| Effect of reduction in statutory rate | 12,000 | 18,000 | 61,000 | ||||||
| Adjustment due to change in estimates | 78,000 | - | - | ||||||
| Increase (decrease) in valuation allowance | (44,000 | ) | 989,000 | (23,000 | ) | ||||
| Deferred tax recovery | $ | - | $ | - | $ | - |
The Company’s deferred tax assets include approximately $8,000 (2010 - $10,000) related to deductions for share issue costs in excess of amounts deducted for financial reporting purposes. If and when the valuation allowance related to these amounts is reversed, the Company will recognize this benefit as an adjustment to share capital as opposed to income tax expense in the consolidated statements of loss.
The Company evaluates its valuation allowance requirements based on projected future operations. When circumstances change and this causes a change in management’s judgment about the recoverability of deferred tax assets, the impact of the change on the valuation allowance is reflected in current income. As management of the Company does not currently believe that it is more likely than not that the Company will receive the benefit of this asset, a valuation allowance equal to the deferred tax assets has been established at both December 31, 2011 and 2010.
As at December 31, 2011, the Company had net operating loss carry-forwards available to reduce taxable income in future years as follows:
| Country | Amount | Expiration Dates |
| United States – Federal | $ 19,900,000 | 2017 - 2031 |
| Canada (C$) | $ 6,600,000 | 2014 - 2031 |
GOLDEN QUEEN MINING CO. LTD.
(an exploration stage
company)
Notes to Consolidated Financial Statements
Years
Ended December 31, 2011, 2010 and 2009
(US dollars)
4. Income Taxes - Continued
These consolidated financial statements do not reflect the potential effect on future income taxes of the application of these losses.
The FASB’s guidance for “Accounting for Uncertainty in Income Taxes” clarifies the accounting for uncertainty in income taxes recognized in an enterprise’s financial statements, and prescribes a recognition threshold and measurement attribute for the financial statement recognition and measurement of a tax position taken or expected to be taken in a tax return. The Company has evaluated its tax positions for the years ended December 31, 2011 and 2010 and determined that it has no uncertain tax positions requiring financial statement recognition.
Because of the Company’s recent history of operating losses, management believes that recognition of the deferred tax assets arising from the above-mentioned future tax benefits is currently not likely to be realized and, accordingly, has provided a 100% valuation allowance against its net deferred tax assets due to the uncertainty surrounding the realization of such assets.
5. Share capital
Common shares - 2011
In January 2011, 100,000 stock options were exercised and the Company issued 100,000 common shares at C$0.77 per share for proceeds of $77,426 (C$77,000).
In March 2011, 50,000 stock options were exercised and the Company issued 50,000 common shares at C$0.77 per share for proceeds of $39,390 (C$38,500).
In April 2011, 1,050,000 stock options were exercised and the Company issued 1,050,000 common shares at C$0.77 per share for proceeds of $842,463 (C$808,500).
In August 2011, 50,000 stock options were exercised and the Company issued 50,000 common shares at C$0.26 per share for proceeds of $13,280 (C$13,000).
In November 2011, 2,500,000 warrants were exercised and the Company issued 1,250,000 common shares at C$1.75 per share and 1,250,000 common shares at C$2.00 per share for total proceeds of $4,594,237 (C$4,687,500).
Common shares – 2010
In January 2010, 700,000 stock options were exercised and the Company issued 700,000 common shares at C$0.35 per share for proceeds of $234,113 (C$245,000).
In April 2010, the Company granted 50,000 stock options to consultants, which are exercisable at C$1.24 per share and expire on April 18, 2015.
On June 1, 2010, the Company issued 5,000,000 units at C$1.60 per unit for gross proceeds of $7,634,316 (C$8,000,000) and incurred professional fees of $45,765 as share issuance costs. Each unit consisted of one common share, one-quarter of one Class A purchase warrant and one-quarter of one Class B purchase warrant. Each whole Class A warrant is exercisable to acquire one additional common share of the Company at a price of C$1.75. Each Class B warrant is exercisable to acquire one additional common share of the Company at a price of C$2.00. Both Class A and Class B warrants expire December 1, 2011. The aggregate fair value of the Class A and Class B purchase warrants was $1,726,518, which was recorded in derivative liability and the Company allocated the remaining proceeds of $5,907,798 to the common shares. The fair value of the warrants was determined using the Black-Scholes option pricing model with the following assumptions:
GOLDEN QUEEN MINING CO. LTD.
(an exploration stage
company)
Notes to Consolidated Financial Statements
Years
Ended December 31, 2011, 2010 and 2009
(US dollars)
5. Share capital - Continued
Common shares – 2010 - Continued
| 2010 | |
| Expected life years | 1.5 |
| Interest rate | 1.37% |
| Volatility | 114% |
| Dividend yield | Nil |
In September 2010, 50,000 stock options were exercised and the Company issued 50,000 common shares at C$0.26 per share for proceeds of $12,487 (C$13,000).
In October 2010, 100,000 stock options were exercised and the Company issued 100,000 common shares at C$0.26 per share for proceeds of $25,565 (C$26,000).
In connection with the guidance of ASC 815-40-15, as the options and warrants are exercisable in a currency other than the functional currency of the Company they do not meet the “fixed-for-fixed” criteria of the guidance. As a result, the Company was required to separately account for the Class A and Class B warrants issued in connection with the private placement noted above as a derivative instrument liability.
Common shares – 2009
In July 2009, the company issued 2,337,500 common shares at C$0.65 per share for proceeds of $1,396,648 (C$1,519,375).
During the three-month period from September to December 2009, 400,000 stock options were exercised and the Company issued 400,000 common shares at C$0.35 per share for proceeds of $131,085 (C$140,000).
Stock options
The Company has elected to use the Black-Scholes option pricing model to determine the fair value of stock options granted. In accordance with the accounting standard for employees, the compensation expense is amortized on a straight-line basis over the requisite service period, which approximates the vesting period. Compensation expense for stock options granted to non-employees is amortized over the contract services period or, if none exists, from the date of grant until the options vest. Compensation associated with unvested options granted to non-employees is remeasured on each balance sheet date using the Black-Scholes option pricing model.
GOLDEN QUEEN MINING CO. LTD.
(an exploration stage
company)
Notes to Consolidated Financial Statements
Years
Ended December 31, 2011, 2010 and 2009
(US dollars)
5. Share capital - Continued
Stock options continued
The following is a summary of stock option activity during the years ended December 31, 2011 and 2010:
| Weighted | ||||||
| Average Exercise | ||||||
| Shares | Price per Share | |||||
| Options outstanding and exercisable, January 1, 2009 | 2,300,000 | C$0.57 | ||||
| Granted | 1,950,000 | C$0.26 | ||||
| Exercised | (400,000 | ) | C$0.35 | |||
| Options outstanding and exercisable, January 1, 2010 | 3,850,000 | C$0.44 | ||||
| Granted | 50,000 | C$1.24 | ||||
| Exercised | (850,000 | ) | C$0.33 | |||
| Options outstanding and exercisable, December 31, 2010 | 3,050,000 | C$0.48 | ||||
| Exercised | (1,250,000 | ) | C$0.75 | |||
| Options outstanding and exercisable, December 31, 2011 | 1,800,000 | C$0.29 |
The stock-based compensation expense recognized on the grant date was $Nil (2010 - $46,275; 2009 - $357,989). Subsequent to the grant date, such options are revalued to fair value at each period-end (Note 10). The fair value of stock options granted as above is calculated using the following weighted average assumptions:
| 2010 | 2009 | |
| Expected life years | 5 | 5 |
| Interest rate | 1.95% | 2.04% |
| Volatility | 106% | 112.3% |
| Dividend yield | 0% | 0% |
As at December 31, 2011, the aggregate intrinsic value of the outstanding exercisable options was approximately $4,500,000 (2010 - $7,124,000; 2009 - $1,922,000). The total intrinsic value of 1,250,000 options exercised during 2011 was approximately $2,837,000 (2010 -$438,000; 2009 - $232,000).
There is no unamortized compensation expense as at December 31, 2011, 2010, and 2009, as all the outstanding options vested at the grant date.
GOLDEN QUEEN MINING CO. LTD.
(an exploration stage
company)
Notes to Consolidated Financial Statements
Years
Ended December 31, 2011, 2010 and 2009
(US dollars)
5. Share capital - Continued
Stock options - Continued
The following table summarizes information about stock options outstanding and exercisable at December 31, 2011:
| Weighted | |||
| Average | Weighted | ||
| Number | Remaining | Average | |
| Expiry | Outstanding and | Contractual Life | Exercise |
| Date | Exercisable | (Years) | Price |
| January 28, 2014 | 1,750,000 | 2.07 | C$0.26 |
| April 18, 2015 | 50,000 | 3.29 | C$1.24 |
| 1,800,000 | 2.11 | C$0.29 |
Warrants
The following is a summary of warrants activity during the years ended December 31, 2011 and 2010:
| Weighted | |||||||||||
| Weighted | Average | ||||||||||
| Average | Remaining | ||||||||||
| Exercise | Contractual | ||||||||||
| Price per | Life | ||||||||||
| Shares | Share | (Years) | Expiry Date | ||||||||
| Outstanding and exercisable, January 1, 2010 and 2009 | - | - | - | - | |||||||
| Issued | |||||||||||
| Class A | 1,250,000 | $1.75 | 0.92 | December 1, 2011 | |||||||
| Class B | 1,250,000 | C$2.00 | 0.92 | December 1, 2011 | |||||||
| Outstanding and exercisable, December 31, 2010 | 2,500,000 | C$1.88 | |||||||||
| Exercised | |||||||||||
| Class A | (1,250,000 | ) | $1.75 | - | December 1, 2011 | ||||||
| Class B | (1,250,000 | ) | C$2.00 | - | December 1, 2011 | ||||||
| Outstanding and exercisable, December 31, 2011 | - | C$1.88 | - |
As at December 31, 2011, the aggregate intrinsic value of the outstanding warrants was approximately $Nil (2010 - $2,325,000; 2009 - $Nil). The total intrinsic value of 2,500,000 warrants that were exercised during 2011 was approximately $1,635,000 (2010 - $Nil; 2009 - $Nil).
GOLDEN QUEEN MINING CO. LTD.
(an exploration stage
company)
Notes to Consolidated Financial Statements
Years
Ended December 31, 2011, 2010 and 2009
(US dollars)
6. Asset Retirement Obligations
The Company is required to provide the Bureau of Land Management, the State Office of Mine Reclamation and Kern County with a revised reclamation cost estimate annually. The financial assurance is adjusted once the cost estimate is approved (see Note 3).
As at December 31, 2011, the Company had provided reclamation financial assurance to the Bureau of Land Management, the State and Kern County totaling $296,180 (2010 - $286,653). This deposit earns interest at 0.1% per annum and is not available for working capital purposes.
The Company’s liability for reclamation of the property is estimated each year by an independent civil engineer. This estimate, once approved by state and county authorities, forms the basis for a cash deposit of reclamation financial assurance. In the absence of a long-term mining permit this estimate is the current obligation of the Company to clean up or reclaim its lands.
The Company estimated its asset retirement obligations based on its understanding of the requirements to reclaim and clean-up its Property. The Company estimated that total payments of approximately $415,000 over three years commencing in 2017 would be required to complete the reclamation obligations. In determining the estimated initial present value of the obligation, a discount factor of 9.0% (the credit-adjusted risk-free rate), and an inflation rate of 3.0% were used. The asset portion of the retirement obligations was written off in 2004. The following is a summary of asset retirement obligations:
| 2011 | 2010 | ||||||
| Balance, beginning of the year | $ | 193,545 | $ | 177,564 | |||
| Accretion expense | 33,667 | 15,981 | |||||
| Balance, end of the year | $ | 227,212 | $ | 193,545 |
7. Commitments and Contingencies
The Company has acquired a number of mineral properties outright and has acquired exclusive rights to explore, develop and mine the Property under various agreements with landowners.
The Company is required to make advance minimum royalty payments related to its mineral properties. The total advance minimum royalty in 2011 was $245,970 of which $13,723 remains unpaid (2010 - $185,276 of which $17,108 was unpaid, 2009 - $174,137) and the total advance minimum royalty owing for 2012 is expected to be approximately $188,000.
A mining lease agreement with a group of landowners expired in 2004. Negotiations with the group were completed and the agreements extended to 2041. Under the amended agreements, the Company paid advance minimum royalties of $7,500 per year for eight years for a total amount of $60,000 in August 2011 to bring the advance minimum royalties owing current to March 14, 2012.
The Company has agreed to issue 100,000 common shares as a finder’s fee upon commencement of commercial production on the Property in connection with certain property acquisitions. As of December 31, 2011, commercial production has not commenced and no shares have been issued.
GOLDEN QUEEN MINING CO. LTD.
(an exploration stage
company)
Notes to Consolidated Financial Statements
Years
Ended December 31, 2011, 2010 and 2009
(US dollars)
7. Commitments and Contingencies - Continued
In 2004, the Company entered into an agreement with the President of the Company to issue 300,000 bonus shares upon completion of certain milestones. Upon receipt by the Company of a bankable feasibility study and the decision to place the Property into commercial production, a bonus of 150,000 common shares would be issued. Upon commencement of commercial production on the Property, a bonus of 150,000 common shares would be issued. In May 2010, the Company entered into an amendment to the agreement whereby the 300,000 bonus shares would alternatively be issuable upon a change of control transaction, or upon a sale of all or substantially all of the Company’s assets, having a value at or above C$1.00 per share of the Company, with a further 300,000 bonus shares being issuable in the event the change of control transaction or asset sale occurred at a value at or above C$1.50 per share. This agreement is for a term of three years and shall automatically renew for two years. As at December 31, 2011, none of the milestones had been reached and no accrual was made in connection with these arrangements.
8. Related Party Transactions
Except as noted elsewhere in these consolidated financial statements, related party transactions are disclosed as follows:
For the year ended December 31, 2011, the Company paid $137,748 (2010 - $141,293, 2009 - $116,776) to Mr. H. L. Klingmann for services as President of the Company, paid $27,295 (2010 - $17,769, 2009 - $18,620) to Mr. Chester Shynkaryk for his consulting services to the Company, paid $20,218 (2010 - $Nil, 2009 - $Nil), of which $2,831 is payable (2010 - $Nil, 2009 - $Nil), to Mr. Ross McDonald for his services as CFO.
For the year ended December 31, 2011, the Company paid $2,022 (2010 - $1,974, 2009 - $1,752) to each of the four directors and $2,000 (2010 - $2,000, 2009 - $2,000) to a director as director’s fees.
All of the above transactions and balances are in the normal course of operations and are measured at the exchange amount.
9. Supplementary Disclosures of Cash Flow Information
| Amounts from Date | ||||||||||||
| of Inception | ||||||||||||
| Year Ended | Year Ended | Year Ended | (November 21, 1985) | |||||||||
| December 31, | December 31, | December 31, | through | |||||||||
| 2011 | 2010 | 2009 | December 31, 2011 | |||||||||
| Cash paid during year for: | ||||||||||||
| Interest | $ | - | $ | - | $ | - | $ | 1,192,911 | ||||
| Income taxes | $ | - | $ | - | $ | - | $ | - | ||||
| Non-cash financing and investing activities: | ||||||||||||
| Reclassification of derivative liability for exercised stock options and warrants | $ | 4,623,353 | $ | 654,033 | $ | 156,834 | $ | 5,434,220 | ||||
| Stock option compensation | $ | - | $ | 46,275 | $ | 357,989 | $ | 1,416,448 | ||||
| Financing charges related to modification of warrant’s term | $ | - | $ | - | $ | - | $ | 889,117 | ||||
| Exchange of notes for common shares | $ | - | $ | - | $ | - | $ | 1,727,282 | ||||
| Exchange of note for future royalty payments | $ | - | $ | - | $ | - | $ | 150,000 | ||||
| Common shares issued for mineral property | $ | - | $ | - | $ | - | $ | 304,811 | ||||
| Mineral property acquired through the issuance of long-term debt | $ | - | $ | - | $ | - | $ | 1,084,833 | ||||
| Common shares issued upon conversion of convertible debt | $ | - | $ | - | $ | - | $ | 414,917 | ||||
| Asset retirement obligations | $ | 33,667 | $ | 15,981 | $ | 14,661 | $ | 227,212 |
GOLDEN QUEEN MINING CO. LTD.
(an exploration stage
company)
Notes to Consolidated Financial Statements
Years
Ended December 31, 2011, 2010 and 2009
(US dollars)
10. Derivative Liability
As at January 1, 2009, the date on which the guidance of ASC 815-40-15 became effective for the Company, the Company’s stock options and warrants met the criteria of a derivative instrument liability because they were exercisable in a currency other than the functional currency of the Company and thus did not meet the “fixed-for-fixed” criteria of that guidance. As a result, the Company was required to separately account for the stock options and warrants as derivative instrument liabilities recorded at fair value and marked-to-market each period with the changes in the fair value each period charged or credited to income.
During the year ended December 31, 2011, a total of 1,250,000 stock options treated as derivative liabilities were exercised. Upon exercise of these options, the portion of the derivative liability that pertained to these options was remeasured and recorded at its fair value of $2,993,685, subsequent to which it was reclassified to additional paid-in capital. The Company measured the fair value of the derivative liability pertaining to the options exercised using the Black-Scholes pricing model with the following range of assumptions: expected volatility – 43.70% - 78.82%, expected life – 0.01 – 2.47 years, risk-free discount rate – 1.04% - 1.88%, dividend yield – 0.00% .
During the year ended December 31, 2010, a total of 850,000 stock options treated as derivative liabilities were exercised. Upon exercise of these options, the portion of the derivative liability that pertained to these options was remeasured and recorded at its fair value of $654,033. The Company measured the fair value of the derivative liability pertaining to the options exercised using the Black-Scholes pricing model with the following range of assumptions: expected volatility – 33% - 116%, expected life – 0.01 – 3.30 years, risk-free discount rate – 1.17% - 1.52%, dividend yield – 0.00% .
During the year ended December 31, 2009, a total of 400,000 stock options treated as a derivative liability were exercised. Upon exercise of these options, the portion of the derivative liability that pertained to these options was re-measured and recorded at its fair value of $156,834, subsequent to which it was reclassified to additional paid-in capital. The Company measured the fair value of the derivative liability pertaining to the options exercised using the Black-Scholes pricing model with the following range of assumptions: expected volatility – 100.45% - 108.23%, expected life – 0.28 – 0.44 years, risk-free discount rate – 1.23% - 1.52%, dividend yield – 0.00% .
As of December 31, 2011 and 2010, the Company had re-measured the remaining outstanding options and determined the fair value of the derivative liability to be $4,552,502 and $7,324,429, respectively, using the Black-Scholes option pricing model with the following assumptions:
| 2011 | 2010 | |
| Risk-free interest rate | 0.99% - 1.27% | 1.52% - 2.41% |
| Expected life of derivative liability | 2.08 to 3.30 years | 0.30 to 4.30 years |
| Expected volatility | 76.66% - 115.11% | 69.88% - 118.22% |
| Dividend rate | 0.00% | 0.00% |
GOLDEN QUEEN MINING CO. LTD.
(an exploration stage
company)
Notes to Consolidated Financial Statements
Years
Ended December 31, 2011, 2010 and 2009
(US dollars)
10. Derivative Liability - Continued
During the year ended December 31, 2011, a total of 2,500,000 warrants treated as derivative liabilities were exercised. Upon exercise of these warrants the portion of the derivative liability that pertained to these warrants was re-measured and recorded at its fair value of $1,629,668, subsequent to which it was reclassified to additional paid-in capital. The Company measured the fair value of the derivative liability that pertained to the warrants using the Black-Scholes pricing model with the following range of assumptions: expected volatility – 167.710%, expected life – 0.003 years, risk-free discount rate – 1.01%, dividend yield – 0.00% .
As of December 31, 2011 and 2010, the Company re-measured outstanding warrants and determined the fair value of the derivative liability to be $Nil (2010 - $3,065,339, 2009 - $Nil) using the Black-Scholes option pricing model with the following assumptions:
| 2011 | 2010 | 2009 | |
| Risk-free interest rate | - | 1.67% | - |
| Expected life of derivative liability | - | 0.92 years | - |
| Expected volatility | - | 73.32% | - |
| Dividend rate | - | 0.00% | - |
As of December 31, 2011 and 2010, the changes of derivative liability for options and warrants are as follows:
| 2011 | 2010 | |||||
| Balance, beginning of the year | $ | 10,389,768 | $ | 2,695,602 | ||
| Fair value of options granted | - | 46,275 | ||||
| Fair value of warrants issued | - | 1,726,518 | ||||
| Fair value of options exercised | (2,993,685 | ) | (654,033 | ) | ||
| Fair value of warrants exercised | (1,629,668 | ) | - | |||
| Change in fair value of options and warrants including foreign exchange | (1,213,913 | ) | 6,575,406 | |||
| Balance, end of the year | $ | 4,552,502 | $ | 10,389,768 |