Attached files
| file | filename |
|---|---|
| EX-95.1 - EXHIBIT 95.1 - GOLDEN QUEEN MINING CO LTD | tv505655_ex95-1.htm |
| EX-32.2 - EXHIBIT 32.2 - GOLDEN QUEEN MINING CO LTD | tv505655_ex32-2.htm |
| EX-32.1 - EXHIBIT 32.1 - GOLDEN QUEEN MINING CO LTD | tv505655_ex32-1.htm |
| EX-31.2 - EXHIBIT 31.2 - GOLDEN QUEEN MINING CO LTD | tv505655_ex31-2.htm |
| EX-31.1 - EXHIBIT 31.1 - GOLDEN QUEEN MINING CO LTD | tv505655_ex31-1.htm |
| EX-10.3 - EXHIBIT 10.3 - GOLDEN QUEEN MINING CO LTD | tv505655_ex10-3.htm |
UNITED STATES
SECURITIES AND EXCHANGE COMMISSION
Washington, D.C. 20549
Form 10-Q
x QUARTERLY REPORT UNDER SECTION 13 OR 15(d) OF THE SECURITIES EXCHANGE ACT OF 1934
For the quarterly period ended September 30, 2018
¨ TRANSITION REPORT UNDER SECTION 13 OR 15 (d) OF THE EXCHANGE ACT
For the transition period from _________ to __________________
000-21777
(Commission File Number)
GOLDEN QUEEN MINING CO. LTD.
(Exact name of registrant as specified in its charter)
| British Columbia, Canada | Not Applicable |
| (State or other jurisdiction of incorporation) | (IRS Employer Identification) No.) |
2300 – 1066 West Hastings Street
Vancouver, British Columbia
V6E 3X2 Canada
(Address of principal executive offices)
Issuer’s telephone number, including area code: (778) 373-1557
Former name, former address and former fiscal year, if changed since last report: N/A
Check whether the registrant (1) filed all reports required to be filed by sections 13 or 15(d) of the Securities and Exchange Act of 1934 during the preceding 12 months (or for such shorter period that the registrant was required to file such reports), and (2) has been subject to such filing requirements for the past 90 days. Yes x No ¨
Check whether the registrant has submitted electronically and posted on its corporate Web site, if any, every Interactive Data File required to be submitted and posted pursuant to Rule 405 of Regulation S-T (§232.405 of this chapter) during the preceding 12 months (or for such shorter period that the registrant was required to submit and post such files). Yes x No ¨
Check whether the registrant is a large accelerated filer, an accelerated filer, a non-accelerated filer, or a smaller reporting company. Large accelerated filer ¨ Accelerated filer ¨ Non-accelerated filer x Smaller reporting company x Emerging growth company ¨
Check whether the registrant is a shell company, as defined in Rule 12b-2 of the Exchange Act. Yes ¨ No x
State the number of shares outstanding of each of the issuer’s classes of common equity, as of the latest practicable date: As at November 8, 2018, the registrant’s outstanding common stock consisted of 300,101,444 shares.
PART I. FINANCIAL INFORMATION
Item 1. Financial Statements
GOLDEN QUEEN MINING CO. LTD.
Condensed Consolidated Interim Balance Sheets
(amounts expressed in thousands of US dollars - Unaudited)
| September 30, 2018 | December 31, 2017 | |||||||
| Assets | ||||||||
| Current assets: | ||||||||
| Cash | $ | 8,417 | $ | 2,937 | ||||
| Inventories (Note 4) | 20,327 | 9,028 | ||||||
| Prepaid expenses and other current assets | 309 | 699 | ||||||
| Total current assets | 29,053 | 12,664 | ||||||
| Property, plant, equipment and mineral interests (Note 5) | 137,981 | 141,848 | ||||||
| Advance minimum royalties | 471 | 304 | ||||||
| Total Assets | $ | 167,505 | $ | 154,816 | ||||
| Liabilities and Shareholders’ Equity | ||||||||
| Current liabilities: | ||||||||
| Accounts payable and accrued liabilities | $ | 6,888 | $ | 6,320 | ||||
| Interest payable | 677 | 664 | ||||||
| Credit facility (Note 12 (v)) | - | 3,000 | ||||||
| Current portion of note payable (Note 12 (ii)) | 25,096 | 7,712 | ||||||
| Current portion of loan payable (Note 6) | 7,534 | 7,629 | ||||||
| Derivative liability – Warrants (Note 7) | 236 | 441 | ||||||
| Total current liabilities | 40,431 | 25,766 | ||||||
| Note payable (Note 12 (ii)) | - | 22,387 | ||||||
| Loan payable (Note 6) | 6,743 | 9,614 | ||||||
| Asset retirement obligation (Note 8) | 2,455 | 1,838 | ||||||
| Deferred tax liability | 8,197 | 8,197 | ||||||
| Total liabilities | 57,826 | 67,802 | ||||||
| Temporary Equity | ||||||||
| Redeemable portion of non-controlling interest (Note 12 (iv)) | 22,868 | 24,214 | ||||||
| Shareholders’ Equity | ||||||||
| Common shares, no par value, unlimited shares authorized (2017 - unlimited); 300,101,444 (2017 – 111,148,683) shares issued and outstanding (Note 9) | 95,494 | 71,126 | ||||||
| Additional paid-in capital | 43,966 | 43,853 | ||||||
| Deficit accumulated | (96,952 | ) | (88,500 | ) | ||||
| Total shareholders’ equity attributable to GQM Ltd. | 42,508 | 26,479 | ||||||
| Non-controlling interest (Note 9 (iv)) | 44,303 | 36,321 | ||||||
| Total Shareholders’ Equity | 86,811 | 62,800 | ||||||
| Total Liabilities, Temporary Equity and Shareholders’ Equity | $ | 167,505 | $ | 154,816 | ||||
Going Concern (Note 2)
Commitments and Contingencies (Note 13)
Subsequent Event (Note 15)
Approved by the Directors:
| “Thomas M. Clay” | “Bryan A. Coates” | ||
| Thomas M. Clay, Director | Bryan A. Coates, Director |
See Accompanying Notes to Condensed Consolidated Interim Financial Statements
| 2 |
GOLDEN QUEEN MINING CO. LTD.
Condensed Consolidated Interim Statements of Loss and Comprehensive Loss
(amounts expressed in thousands of US dollars, except shares amounts - Unaudited)
| Three Months Ended September 30, | Three Months Ended September 30, | Nine Months Ended September 30, | Nine Months Ended September 30, | |||||||||||||
| 2018 | 2017 | 2018 | 2017 | |||||||||||||
| Revenues | ||||||||||||||||
| Sales | $ | 16,855 | $ | 16,496 | $ | 40,925 | $ | 48,182 | ||||||||
| Cost of Sales | ||||||||||||||||
| Direct mining costs | (14,469 | ) | (15,404 | ) | (35,615 | ) | (40,333 | ) | ||||||||
| Depreciation and depletion (Note 5) | (3,615 | ) | (2,931 | ) | (9,955 | ) | (8,429 | ) | ||||||||
| Loss from mine operations | (1,229 | ) | (1,839 | ) | (4,645 | ) | (580 | ) | ||||||||
| General and administrative expenses (Note 10) | (839 | ) | (1,171 | ) | (2,972 | ) | (3,297 | ) | ||||||||
| Operating loss | (2,068 | ) | (3,010 | ) | (7,617 | ) | (3,877 | ) | ||||||||
| Other income (expenses) | ||||||||||||||||
| Gain on derivative instruments (Note 7) | 136 | 1,139 | 204 | 3,033 | ||||||||||||
| Finance expense (Note 12 (iii) and 12 (v)) | (1,409 | ) | (1,295 | ) | (4,383 | ) | (3,592 | ) | ||||||||
| Interest income | 26 | 14 | 98 | 77 | ||||||||||||
| Other expenses | (42 | ) | (72 | ) | (118 | ) | (488 | ) | ||||||||
| Total other income (expenses) | (1,289 | ) | (214 | ) | (4,199 | ) | (970 | ) | ||||||||
| Net and comprehensive loss for the period | $ | (3,357 | ) | $ | (3,224 | ) | $ | (11,816 | ) | $ | (4,847 | ) | ||||
| Less: Net and comprehensive loss attributable to the non-controlling interest for the period (Note 12 (iv)) | 954 | 1,335 | 3,364 | 1,495 | ||||||||||||
| Net and comprehensive loss attributable to Golden Queen Mining Co Ltd. for the period | $ | (2,403 | ) | $ | (1,889 | ) | $ | (8,452 | ) | $ | (3,352 | ) | ||||
| Income (loss) per share – basic (Note 11) | $ | (0.01 | ) | $ | (0.02 | ) | $ | (0.03 | ) | $ | (0.03 | ) | ||||
| Income (loss) per share – diluted (Note 11) | $ | (0.01 | ) | $ | (0.02 | ) | $ | (0.03 | ) | $ | (0.03 | ) | ||||
| Weighted average number of common shares outstanding – basic | 300,101,444 | 111,148,683 | 263,418,307 | 111,137,694 | ||||||||||||
| Weighted average number of common shares outstanding - diluted | 300,101,444 | 111,148,683 | 263,418,307 | 111,137,694 | ||||||||||||
See Accompanying Notes to Condensed Consolidated Interim Financial Statements
| 3 |
GOLDEN QUEEN MINING CO. LTD.
Condensed Consolidated Interim Statements of Shareholders’ Equity, Non-controlling Interest and Redeemable Portion of Non-controlling Interest
(amounts expressed in thousands of US dollars, except shares amounts- Unaudited)
| Common shares | Amount | Additional Paid-in Capital | Deficit Accumulated | Total Shareholders’ Equity attributable to GQM Ltd | Non- controlling Interest | Total Shareholders’ Equity | Redeemable Portion of Non- controlling Interest | |||||||||||||||||||||||||
| Balance, December 31, 2016 | 111,048,683 | $ | 71,067 | $ | 43,652 | $ | (87,335 | ) | $ | 27,384 | $ | 39,327 | $ | 66,711 | $ | 26,220 | ||||||||||||||||
| Issuance of common shares (Note 9) | 100,000 | 59 | - | - | 59 | - | 59 | - | ||||||||||||||||||||||||
| Stock-based compensation | - | - | 133 | - | 133 | - | 133 | - | ||||||||||||||||||||||||
| Net loss for the period | - | - | - | (3,352 | ) | (3,352 | ) | (897 | ) | (4,249 | ) | (599 | ) | |||||||||||||||||||
| Balance, September 30, 2017 | 111,148,683 | $ | 71,126 | $ | 43,785 | $ | (90,687 | ) | $ | 24,224 | $ | 38,430 | $ | 62,654 | $ | 25,621 | ||||||||||||||||
| Balance, December 31, 2017 | 111,148,683 | $ | 71,126 | $ | 43,853 | $ | (88,500 | ) | $ | 26,479 | $ | 36,321 | $ | 62,800 | $ | 24,214 | ||||||||||||||||
| Issuance of common shares (Note 9) | 188,952,761 | 24,368 | - | - | 24,368 | - | 24,368 | - | ||||||||||||||||||||||||
| Capital contribution from non-controlling interest | - | - | - | - | - | 10,000 | 10,000 | - | ||||||||||||||||||||||||
| Stock-based compensation | - | - | 113 | - | 113 | - | 113 | - | ||||||||||||||||||||||||
| Net loss for the period | - | - | - | (8,452 | ) | (8,452 | ) | (2,018 | ) | (10,470 | ) | (1,346 | ) | |||||||||||||||||||
| Balance, September 30, 2018 | 300,101,444 | $ | 95,494 | $ | 43,966 | $ | (96,952 | ) | $ | 42,508 | $ | 44,303 | $ | 86,811 | $ | 22,868 | ||||||||||||||||
See Accompanying Notes to Condensed Consolidated Interim Financial Statements
| 4 |
GOLDEN QUEEN MINING CO. LTD.
Condensed Consolidated Interim Statements of Cash Flows
(amounts expressed in thousands of US dollars - Unaudited)
| Nine Months Ended September 30, | Nine Months Ended September 30, | |||||||
| 2018 | 2017 | |||||||
| Operating Activities | ||||||||
| Net loss for the period | $ | (11,816 | ) | $ | (4,847 | ) | ||
| Adjustment to reconcile net loss to cash used in operating activities: | ||||||||
| Depreciation and depletion | 9,955 | 8,429 | ||||||
| Amortization of debt discount and interest accrual | 1,708 | 1,250 | ||||||
| Accretion expense | 125 | 93 | ||||||
| Change in fair value of derivative liabilities (Note 7) | (205 | ) | (3,033 | ) | ||||
| Stock based compensation | 113 | 133 | ||||||
| Unrealized foreign exchange | (37 | ) | (48 | ) | ||||
| Non-cash finder fees | - | 59 | ||||||
| Changes in non-cash working capital items: | ||||||||
| Prepaid expenses & other current assets | 390 | 267 | ||||||
| Inventory | (11,299 | ) | (1,011 | ) | ||||
| Accounts payable & accrued liabilities | (124 | ) | 2,390 | |||||
| Interest payable | 677 | 1,915 | ||||||
| Cash generated from (used in) operating activities | (10,513 | ) | 5,597 | |||||
| Investment activities: | ||||||||
| Additions to property, plant, equipment and mineral interests | (2,585 | ) | (9,566 | ) | ||||
| Cash used in investing activities | (2,585 | ) | (9,566 | ) | ||||
| Financing activity: | ||||||||
| Issuance of common shares (Note 9) | 24,368 | - | ||||||
| Repayment of credit facility | (3,000 | ) | - | |||||
| Repayments of loan payable (Note 6) | (6,079 | ) | (4,649 | ) | ||||
| Repayments of note payable and accrued interest (Note 12 (ii)) | (6,711 | ) | - | |||||
| Capital contribution from non-controlling interest | 10,000 | - | ||||||
| Cash generated from (used in) financing activities | 18,578 | (4,649 | ) | |||||
| Net change in cash and cash equivalents | 5,480 | (8,618 | ) | |||||
| Cash and cash equivalents, beginning balance | 2,937 | 13,301 | ||||||
| Cash and cash equivalents, ending balance | $ | 8,417 | $ | 4,683 | ||||
Supplementary Disclosure of Cash Flow Information
| Nine Months Ended September 30, | Nine Months Ended September 30, | |||||||
| 2018 | 2017 | |||||||
| Cash paid during the period for: | ||||||||
| Interest on loan and note payable | $ | 2,037 | $ | 428 | ||||
| Non-cash financing and investing activities: | ||||||||
| Asset retirement costs charged to mineral property interests | $ | 617 | $ | 260 | ||||
| Mining equipment acquired through issuance of debt | $ | 3,113 | $ | 5,895 | ||||
| Mineral property expenditures included in accounts payable | $ | 102 | $ | 1,081 | ||||
| Non-cash finders’ fee | $ | - | $ | 59 | ||||
| Non-cash amortization of discount and interest expense | $ | 1,708 | $ | 1,250 | ||||
| Interest payable converted to principal balance | $ | - | $ | 1,560 | ||||
See Accompanying Notes to Condensed Consolidated Interim Financial Statements
| 5 |
GOLDEN QUEEN MINING CO. LTD.
Notes to Condensed Consolidated Interim Financial Statements
For the Three and Nine Months Ended September 30, 2018 and 2017
(amounts expressed in thousands of US dollars - Unaudited)
| 1. | Nature of Business |
Golden Queen Mining Co. Ltd. (“Golden Queen”, “GQM Ltd.” or the “Company”) is engaged in the operation of the Soledad Mountain Mine (“the Mine”), located in the Mojave Mining District, Kern County, California. The Company owns 50% of Golden Queen Mining Company, LLC (“GQM LLC”), the operator of the Mine. The remaining 50% is owned by Gauss LLC (“Gauss”).
| 2. | Basis of Presentation and Going Concern |
These unaudited condensed consolidated interim financial statements have been prepared in accordance with accounting principles generally accepted in the United States (“US GAAP”) applicable to going concern. The accounting policies followed in preparing these condensed consolidated interim financial statements are those used by the Company as set out in the audited consolidated financial statements for the year ended December 31, 2017 other than noted below.
Certain information and note disclosures normally included for annual consolidated financial statements prepared in accordance with US GAAP have been omitted. These unaudited condensed consolidated interim financial statements should be read together with the audited consolidated financial statements of the Company for the year ended December 31, 2017.
In the opinion of Management, all adjustments considered necessary (including reclassifications and normal recurring adjustments) to present fairly the financial position, results of operations and cash flows as at September 30, 2018 and for all periods presented, have been included in these unaudited condensed consolidated interim financial statements. The interim results are not necessarily indicative of results for the full year ending December 31, 2018, or future operating periods.
The Company’s access to the net assets of GQM LLC is determined by the Board of Managers of GQM LLC. The Board of Managers is not controlled by the Company and therefore there is no guarantee that any access to the net assets of GQM LLC would be provided to the Company in order to continue as a going concern. The Board of Managers of GQM LLC determine when and if distributions from GQM LLC are made to the holders of its membership units at their sole discretion.
The Company is required to pay the following amounts to the Clay Group on the following dates: $1.7 million of interest and principal on and October 1, 2018 (paid on October 1, 2018), $1.7 million of interest and principal on January 1, 2019, $3.9 million of interest and principal on April 1, 2019 and $21.7 million of interest and principal on May 21, 2019. In the nine months ended September 30, 2018, the cash used in operating activities was $10.5 million, however, management believes the Company will be able to meet its financial obligations for the 12 months period following the date of these financial statements except that it is currently unlikely the Company will be able to reimburse the final two payments of $3.9 million and $21.7 million on April 1, 2019 and May 21, 2019 respectively. The Company will need to receive cash distributions from GQM LLC to service its debt and such distributions are contingent on GQM LLC’s ability to generate positive cash flows. The Company reviewed the mine plan in light of the results for the nine months ended September 30, 2018 and has determined it is unlikely it will receive sufficient distributions from GQM LLC during this fiscal year to service its debt in early 2019. This situation raises substantial doubt about the Company’s ability to continue as a going concern. Consequently, in the third quarter of 2018, the Company initiated discussions with the Clay Group to restructure the reimbursement of the last debt payment. While the Company has been successful in re-negotiating the debt repayment terms with the Clay Group in the past, there can be no assurance that will be achieved going forward.
The unaudited condensed consolidated interim financial statements do not reflect adjustments to the carrying values of the assets and liabilities, the reported revenues and expenses, and the balance sheet classifications used, that would be necessary if the company were unable to realize its assets and settle its liabilities as a going concern in the normal course of operations. Such adjustments could be material.
| 6 |
GOLDEN QUEEN MINING CO. LTD.
Notes to Condensed Consolidated Interim Financial Statements
For the Three and Nine Months Ended September 30, 2018 and 2017
(amounts expressed in thousands of US dollars - Unaudited)
| 3. | Summary of Accounting Policies and Estimates and Judgements |
The preparation of financial statements in conformity with US GAAP requires management to make estimates and assumptions that affect the reported amounts of assets and liabilities and disclosure of contingent assets and liabilities at the date of the financial statements, and the reported amounts of revenues and expenses during the reporting period. Significant estimates and judgements have been made by Management in several areas including the accounting for the joint venture transaction and determination of the temporary and permanent non-controlling interest, the recoverability of mineral properties interests, royalty obligations, inventory valuation, asset retirement obligations, and derivative liability – warrants. Actual results could differ from those estimates.
New Accounting Pronouncements
Adopted
| (i) | In May 2014, the FASB issued Accounting Standards Update (“ASU”) 2014-09, “Revenue from Contracts with Customers (Topic 606).” The amendments in ASU 2014-09 affect any entity that either enters into contracts with customers to transfer goods or services or enters into contracts for the transfer of nonfinancial assets unless those contracts are within the scope of other standards (e.g., insurance contracts or lease contracts). This ASU superseded the revenue recognition requirements in Topic 605, Revenue Recognition, and most industry-specific guidance, and creates a Topic 606, Revenue from Contracts with Customers. The new standard provides a five-step approach to be applied to all contracts with customers and also requires expanded disclosures about revenue recognition. |
The Company has completed its assessment of the impact of the new revenue standard on the Company's consolidated financial statements and disclosures. The Company has completed the review of all contracts and determined that the adoption of this guidance has no material impact on amounts and timing of revenue recognition. The Company's revenue arises from contracts with customers in which the delivery of doré is the single performance obligation under the customer contract. Product pricing is determined at the point when contract is created by reference to active and freely traded commodity markets, for example, the London Bullion Market for both gold and silver. The Company enters into the contracts with parties who have an ability and intention to meet its obligations with respect to consideration payment, thus ensuring the collectability of such consideration. These contracts are not modified and contain no variable consideration.
| (ii) | In August 2016, ASC guidance was issued to amend the classification of certain cash receipts and cash payments in the statement of cash flows. The new guidance was effective for the Company’s fiscal year and interim periods beginning after December 15, 2017. The Company adopted the guidance effective January 1, 2018 and has retrospectively applied this guidance for all periods presented. There was no material impact from adoption of this guidance. |
Not Yet Adopted
| (iii) | February 2016, FASB issued ASC 842 that requires lessees to recognize lease assets and corresponding lease liabilities on the balance sheet for all leases with terms of more than 12 months. The update, which supersedes existing lease guidance, will continue to classify leases as either finance or operating, with the classification determining the pattern of expense recognition in the income statement. |
The ASU will be effective for annual and interim periods beginning January 1, 2019, with early adoption permitted, and is applicable on a modified retrospective basis with various optional practical expedients. The Company is currently assessing the impact of this standard.
| 7 |
GOLDEN QUEEN MINING CO. LTD.
Notes to Condensed Consolidated Interim Financial Statements
For the Three and Nine Months Ended September 30, 2018 and 2017
(amounts expressed in thousands of US dollars - Unaudited)
| 4. | Inventories |
Inventories consist primarily of production from the Company’s operation, in varying stages of the production process and supplies and spare parts, all of which are presented at the lower of cost or net realizable value. Inventories of the Company are comprised of:
| September 30, 2018 | December 31, 2017 | |||||||
| Stockpile inventory | $ | 2,603 | $ | 201 | ||||
| In-process inventory | 14,473 | 6,495 | ||||||
| Dore inventory | 841 | 320 | ||||||
| Supplies and spare parts | 2,410 | 2,012 | ||||||
| $ | 20,327 | $ | 9,028 | |||||
During the nine months ended September 30, 2018, the Company recorded a charge of $122 to bring the Dore inventory down to net realizable value.
| 5. | Property, Plant, Equipment and Mineral Interests |
Property, plant and equipment and mineral interests, are depreciated and depleted using either the units-of-production or straight-line method over the shorter of the estimated useful life of the asset or the expected life of mine. Assets under construction in progress are recorded at cost and re-allocated to its corresponding category when they become available for use.
| Land | Mineral
property interest and claims | Mine
development | Machinery
and equipment | Buildings
and infrastructure | Construction
in progress | Interest
capitalized | Total | |||||||||||||||||||||||||
| Cost | ||||||||||||||||||||||||||||||||
| At December 31, 2016 | $ | 3,893 | $ | 4,241 | $ | 42,033 | $ | 60,201 | $ | 28,604 | $ | 543 | $ | 5,886 | $ | 145,401 | ||||||||||||||||
| Additions | 98 | 817 | 354 | 17 | - | 19,597 | - | 20,883 | ||||||||||||||||||||||||
| Transfers | - | 222 | 8,625 | 11,239 | - | (20,086 | ) | - | - | |||||||||||||||||||||||
| Disposals | (22 | ) | - | (239 | ) | (1,391 | ) | (207 | ) | - | - | (1,859 | ) | |||||||||||||||||||
| At December 31, 2017 | $ | 3,969 | $ | 5,280 | $ | 50,773 | $ | 70,066 | $ | 28,397 | $ | 54 | $ | 5,886 | $ | 164,425 | ||||||||||||||||
| Additions | 163 | 5 | 499 | 9 | - | 5,412 | - | 6,088 | ||||||||||||||||||||||||
| Transfers | - | - | 711 | 4,520 | - | (5,231 | ) | - | - | |||||||||||||||||||||||
| Disposals | - | - | - | (8 | ) | (7 | ) | - | - | (15 | ) | |||||||||||||||||||||
| At September 30, 2018 | $ | 4,132 | $ | 5,285 | $ | 51,983 | $ | 74,587 | $ | 28,390 | $ | 235 | $ | 5,886 | $ | 170,498 | ||||||||||||||||
| Accumulated depreciation and depletion | ||||||||||||||||||||||||||||||||
| At December 31, 2016 | $ | - | $ | 67 | $ | 971 | $ | 7,129 | $ | 2,679 | $ | - | $ | 5 | $ | 10,851 | ||||||||||||||||
| Additions | - | 261 | 2,444 | 6,489 | 2,358 | - | 466 | 12,018 | ||||||||||||||||||||||||
| Disposals | - | - | - | (265 | ) | (27 | ) | - | - | (292 | ) | |||||||||||||||||||||
| At December 31, 2017 | $ | - | $ | 328 | $ | 3,415 | $ | 13,353 | $ | 5,010 | $ | - | $ | 471 | $ | 22,577 | ||||||||||||||||
| Additions | - | 191 | 1,882 | 5,798 | 1,769 | - | 315 | 9,955 | ||||||||||||||||||||||||
| Disposals | - | - | - | (8 | ) | (7 | ) | - | - | (15 | ) | |||||||||||||||||||||
| At September 30, 2018 | $ | - | $ | 519 | $ | 5,297 | $ | 19,143 | $ | 6,772 | $ | - | $ | 786 | $ | 32,517 | ||||||||||||||||
| Carrying values | ||||||||||||||||||||||||||||||||
| At December 31, 2017 | $ | 3,969 | $ | 4,952 | $ | 47,358 | $ | 56,713 | $ | 23,387 | $ | 54 | $ | 5,415 | $ | 141,848 | ||||||||||||||||
| At September 30, 2018 | $ | 4,132 | $ | 4,766 | $ | 46,686 | $ | 55,444 | $ | 21,618 | $ | 235 | $ | 5,100 | $ | 137,981 | ||||||||||||||||
| 8 |
GOLDEN QUEEN MINING CO. LTD.
Notes to Condensed Consolidated Interim Financial Statements
For the Three and Nine Months Ended September 30, 2018 and 2017
(amounts expressed in thousands of US dollars - Unaudited)
| 6. | Loan Payable |
As at September 30, 2018 and December 31, 2017, equipment financing balances are as follows:
| September 30, 2018 | December 31, 2017 | |||||||
| Balance, beginning of the period | $ | 17,243 | $ | 15,150 | ||||
| Additions | 3,751 | 10,727 | ||||||
| Down payments and taxes | (638 | ) | (1,839 | ) | ||||
| Settlements | - | (603 | ) | |||||
| Principal repayments | (6,079 | ) | (6,192 | ) | ||||
| Balance, end of the period | $ | 14,277 | $ | 17,243 | ||||
| Current portion | $ | 7,534 | $ | 7,629 | ||||
| Non-current portion | $ | 6,743 | $ | 9,614 | ||||
The terms of the equipment financing agreements are as follows:
September 30, 2018 | December 31, 2017 | |||||||
| Total acquisition costs | $ | 39,443 | $ | 35,692 | ||||
| Interest rates | 0.00% ~ 4.50% | 0.00% ~ 4.50% | ||||||
| Monthly payments | $ | 5 ~ 74 | $ | 5 ~ 74 | ||||
| Average remaining life (years) | 2.25 | 2.13 | ||||||
For the nine months ended September 30, 2018, the Company made total down payments of $638 (December 31, 2017 – $1,839). The down payments consist of the sales tax on the assets and a 10% payment of the pre-tax purchase price. All of the loan agreements are for a term of four years, except two which are for three years, and are secured by the underlying asset.
The following table outlines the principal payments to be made for each of the remaining years:
| Years | Principal Payments | |||
| 2018 and 2019 | $ | 8,417 | ||
| 2020 | 3,307 | |||
| 2021 | 2,119 | |||
| 2022 | 434 | |||
| Total | $ | 14,277 | ||
| 7. | Derivative Liabilities |
Share Purchase Warrants – Clay loans (Related Party (see Note 12 (ii))
On June 8, 2015, the Company issued 10,000,000 share purchase warrants to the Clay Group (the “June 2015 Warrants”) in connection with the June 2015 Loan. On February 22, 2018, the Company completed a rights offering at a share price lower than the original exercise price of $0.95 of the June 2015 Warrants. As per an anti-dilution provision included in the June 2015 Loan agreement, the exercise price of the June 2015 Warrants was revised to $0.7831 on the rights offering completion date. The expiry date of June 8, 2020 of the June 2015 Warrants remains unchanged.
On November 18, 2016, the Company issued 8,000,000 share purchase warrants to the Clay Group (the “November 2016 Warrants”) in connection with the November 2016 Loan. On February 22, 2018, the Company completed a rights offering at a share price lower than the original exercise price of $0.85 of the November 2016 Warrants. As per an anti-dilution provision included in the November 2016 Loan agreement, the exercise price of the November 2016 Warrants was revised to $0.6650 on the rights offering completion date. The expiry date of November 18, 2021 of the November 2016 Warrants remains unchanged.
| 9 |
GOLDEN QUEEN MINING CO. LTD.
Notes to Condensed Consolidated Interim Financial Statements
For the Three and Nine Months Ended September 30, 2018 and 2017
(amounts expressed in thousands of US dollars - Unaudited)
| 7. | Derivative Liabilities (continued) |
The share purchase warrants meet the definition of a derivative liability instrument as the exercise price is not a fixed price as described above. Therefore, the settlement feature does not meet the “fixed-for-fixed” criteria outlined in ASC 815-40-15.
The fair value of the derivative liabilities related to the Clay Group share purchase warrants as at September 30, 2018 was $235 (December 31, 2017 – $439). The derivative liabilities were calculated using the Black-Scholes pricing valuation model with the following assumptions:
| Warrants related to June 2015 Loan | September 30, 2018 | December 31, 2017 | ||||||
| Risk-free interest rate | 1.08 | % | 1.73 | % | ||||
| Expected life of derivative liability | 1.69 years | 2.44 years | ||||||
| Expected volatility | 80.84 | % | 78.59 | % | ||||
| Dividend rate | 0.00 | % | 0.00 | % | ||||
| Warrants related to November 2016 Loan | September 30, 2018 | December 31, 2017 | ||||||
| Risk-free interest rate | 1.40 | % | 1.73 | % | ||||
| Expected life of derivative liability | 3.15 years | 3.89 years | ||||||
| Expected volatility | 79.52 | % | 75.69 | % | ||||
| Dividend rate | 0.00 | % | 0.00 | % | ||||
The change in the derivative share purchase warrants is as follows:
September 30, 2018 | December 31, 2017 | |||||||
| Balance, beginning of the period | $ | 439 | $ | 5,458 | ||||
| Change in fair value | (204 | ) | (5,019 | ) | ||||
| Balance, end of the period | $ | 235 | $ | 439 | ||||
Share Purchase Warrants
On July 25, 2016, the Company issued 6,317,700 share purchase warrants with an exercise price of C$2.00 and an expiry date of July 25, 2019. As at September 30, 2018, the Company re-measured the share purchase warrants and determined the fair value of the derivative liability to be $1 (December 31, 2017 - $2).
| 8. | Asset Retirement Obligations |
Reclamation Financial Assurance
GQM LLC is required to provide the Bureau of Land Management, the State Office of Mine Reclamation and Kern County with a revised reclamation cost estimate annually. The financial assurance is adjusted once the cost estimate is approved.
This estimate, once approved by state and county authorities, forms the basis of reclamation financial assurance. The reclamation assurance provided as at September 30, 2018 was $1,749 (December 31, 2017 – $1,465).
GQM LLC is also required to provide financial assurance with the Lahontan Regional Water Quality Control Board (the “Regional Board”) for closure and reclamation costs related to the lined impoundments, which are defined as the Stage 1 and Stage 2 heap leach pads, the overflow pond, and the solution collection channel. The reclamation financial assurance estimate as at September 30, 2018 was $2,450 (December 31, 2017 – $1,869).
In addition to the above, GQM LLC is required to obtain and maintain financial assurance for initiating and completing corrective action and remediation of a reasonably foreseeable release from the Project’s waste management units as required by the Regional Board. The reclamation financial assurance estimate as at September 30, 2018 is $278 (December 31, 2017 – $278).
| 10 |
GOLDEN QUEEN MINING CO. LTD.
Notes to Condensed Consolidated Interim Financial Statements
For the Three and Nine Months Ended September 30, 2018 and 2017
(amounts expressed in thousands of US dollars - Unaudited)
| 8. | Asset Retirement Obligations (continued) |
GQM LLC entered into $4,921 (2017 – $3,612) in surety bond agreements in order to release its reclamation deposits and a bond for power of $444. GQM LLC pays a yearly premium of $101 (2017 – $90). Golden Queen Ltd. has provided a corporate guarantee on the surety bonds.
Asset Retirement Obligation
The total asset retirement obligation as at September 30, 2018, was $2,455 (December 31, 2017 – $1,838).
The Company estimated its asset retirement obligations based on its understanding of the requirements to reclaim and remediate its property based on its activities to date. As at September 30, 2018, the Company estimates the cash outflow related to these reclamation activities will be incurred in 2028. Reclamation provisions are measured at the expected value of future cash flows discounted to their present value using a discount rate based on a credit adjusted risk-free interest rate of 8.34% and an inflation rate of 2.41%.
The following is a summary of asset retirement obligations:
September 30, 2018 | December 31, 2017 | |||||||
| Balance, beginning of the period | $ | 1,838 | $ | 1,366 | ||||
| Accretion | 125 | 126 | ||||||
| Changes in cash flow estimates | 492 | 346 | ||||||
| Balance, end of the period | $ | 2,455 | $ | 1,838 | ||||
| 9. | Share Capital |
The Company’s common shares outstanding are no par value, voting shares with no preferences or rights attached to them.
Common shares
On January 17, 2017, the Company issued 100,000 shares for a total of $59 as finder fees which were recognized in general and administrative expenses in connection with the declaration of commercial production in December 2016.
On February 22, 2018, the Company closed a rights offering and issued 188,952,761 shares for total gross proceeds of $25,036. The Company paid associated fees of $668 which were classified as share issue costs.
Stock options
The Company’s current stock option plan (the “Plan”) was adopted by the Company in 2013 and approved by shareholders of the Company in 2013. The Plan provides a fixed number of 7,200,000 common shares of the Company that may be issued pursuant to the grant of stock options. The exercise price of stock options granted under the Plan shall be determined by the Company’s Board of Directors (the “Board”) but shall not be less than the volume-weighted, average trading price of the Company’s shares on the Toronto Stock Exchange (“TSX”) for the five (5) trading days immediately prior to the date of the grant. The expiry date of a stock option shall be the date so fixed by the Board subject to a maximum term of five (5) years.
The Company has elected to use the Black-Scholes option pricing model to determine the fair value of stock options granted. The compensation expense is amortized on a straight-line basis over the requisite service period, which approximates the vesting period.
| 11 |
GOLDEN QUEEN MINING CO. LTD.
Notes to Condensed Consolidated Interim Financial Statements
For the Three and Nine Months Ended September 30, 2018 and 2017
(amounts expressed in thousands of US dollars - Unaudited)
| 9. | Share Capital (continued) |
Stock options (continued)
The following is a summary of stock option activity during the nine months ended September 30, 2018:
| Shares | Weighted Average Exercise Price per Share | |||||||
| Options outstanding, December 31, 2016 | 1,555,000 | $ | 0.85 | |||||
| Options granted | 1,605,001 | $ | 0.38 | |||||
| Options forfeited | (166,667 | ) | $ | 0.64 | ||||
| Options expired | (393,333 | ) | $ | 1.13 | ||||
| Options outstanding, December 31, 2017 | 2,600,001 | $ | 0.54 | |||||
| Options forfeited | (75,000 | ) | $ | 0.29 | ||||
| Options expired | (200,000 | ) | $ | 1.48 | ||||
| Options outstanding, September 30, 2018 | 2,325,001 | $ | 0.46 | |||||
During the three and nine months ended September 30, 2018, the Company recognized $34 and $113 (the three and nine months ended September 30, 2017 - $48 and $133) in stock-based compensation relating to employee stock options that were issued and/or had vesting terms.
The following table summarizes information about stock options outstanding and exercisable as at September 30, 2018:
| Expiry Date | Number Outstanding | Number Exercisable | Remaining Contractual Life (years) | Exercise Price | ||||||||||||
| September 8, 2020 | 430,000 | 430,000 | 1.94 | $ | 0.58 | |||||||||||
| November 30, 2021 | 365,000 | 121,666 | 3.17 | $ | 0.66 | |||||||||||
| March 20, 2022 | 400,002 | 133,334 | 3.47 | $ | 0.65 | |||||||||||
| October 20, 2022 | 1,129,999 | - | 4.06 | $ | 0.29 | |||||||||||
| 2,325,001 | 685,000 | 3.43 | ||||||||||||||
As at September 30, 2018, the aggregate intrinsic value of the outstanding exercisable options was $nil (December 31, 2017 – $nil).
Warrants
As at September 30, 2018, 24,317,700 warrants were outstanding (December 31, 2017 – 24,317,700).
The following table summarizes information about share purchase warrants outstanding as at September 30, 2018:
| Expiry Date | Number Outstanding | Remaining Contractual Life (years) | Exercise Price | |||||||||
| June 8, 2020 | 10,000,000 | 1.69 | $ | 0.7831 | ||||||||
| July 25, 2019 (1) | 6,317,700 | 0.82 | C$ | 2.0000 | ||||||||
| November 18, 2021 | 8,000,000 | 3.14 | $ | 0.6650 | ||||||||
| 24,317,700 | 1.94 | |||||||||||
| (1) | Non-tradable share purchase warrants. |
| 12 |
GOLDEN QUEEN MINING CO. LTD.
Notes to Condensed Consolidated Interim Financial Statements
For the Three and Nine Months Ended September 30, 2018 and 2017
(amounts expressed in thousands of US dollars - Unaudited)
| 10. | General and Administrative Expenses |
General and administrative expenses are incurred to support the administration of the business that are not directly related to production. Significant components of general and administrative expenses are comprised of the following:
| Three Months Ended September 30, | Three Months Ended September 30, | Nine Months Ended September 30, | Nine Months Ended September 30, | |||||||||||||
| 2018 | 2017 | 2018 | 2017 | |||||||||||||
| Audit, legal and professional fees | $ | 115 | $ | 165 | $ | 524 | $ | 561 | ||||||||
| Salaries and benefits and director fees | 297 | 431 | 980 | 1,131 | ||||||||||||
| Regulatory fees and licenses | 28 | 15 | 153 | 85 | ||||||||||||
| Insurance | 163 | 122 | 446 | 369 | ||||||||||||
| Corporate administration | 236 | 438 | 869 | 1,151 | ||||||||||||
| $ | 839 | $ | 1,171 | $ | 2,972 | $ | 3,297 | |||||||||
| 11. | Loss Per Share |
| Three Months Ended September 30, | Three Months Ended September 30, | Nine Months Ended September 30, | Nine Months Ended September 30, | |||||||||||||
| 2018 | 2017 | 2018 | 2017 | |||||||||||||
| Numerator: | ||||||||||||||||
| Net loss attributable to the shareholders of the Company - numerator for basic and diluted | $ | (2,403 | ) | $ | (1,889 | ) | $ | (8,452 | ) | $ | (3,252 | ) | ||||
| Denominator: | ||||||||||||||||
| Weighted average number of common shares outstanding -basic and diluted | 300,101,444 | 111,148,683 | 263,418,307 | 111,137,694 | ||||||||||||
| Loss per share – basic and diluted | $ | (0.01 | ) | $ | (0.02 | ) | $ | (0.03 | ) | $ | (0.03 | ) | ||||
Weighted average number of shares for the three and nine months ended September 30, 2018 excludes 2,325,001 options (December 31, 2017 – 2,600,001) and 24,317,700 warrants (December 31, 2017 – 24,317,700) that were antidilutive.
| 12. | Related Party Transactions |
Except as noted elsewhere in these consolidated financial statements, related party transactions are disclosed as follows:
| (i) | Compensation of Key Management Personnel, Transactions with Related Parties and Related Party Balances |
For the three and nine months ended September 30, 2018, the Company recognized $125 and $424 (for the three and nine months ended September 30, 2017 – $163 and $490) salaries and fees for Officers and Directors.
As at September 30, 2018, $nil (December 31, 2017 – $38) was included in prepaid expenses and other current assets for closing fees paid to related parties.
As at September 30, 2018, $nil (December 31, 2017 – $463 for amended fees and accrued interest payable to related parties) was included in accounts payable and accrued liabilities for accrued interest payable to related parties and salaries and fees payable to Officers and Directors.
| 13 |
GOLDEN QUEEN MINING CO. LTD.
Notes to Condensed Consolidated Interim Financial Statements
For the Three and Nine Months Ended September 30, 2018 and 2017
(amounts expressed in thousands of US dollars - Unaudited)
| (ii) | Note Payable |
On November 18, 2016, the Company entered into a loan with the Clay Group for $31,000 (the “November 2016 Loan”), due on May 21, 2019 with an annual interest rate of 8%, payable quarterly. In connection with the November 2016 Loan the Company issued 8,000,000 common share purchase warrants exercisable for a period of five years expiring November 21, 2021. See Note 7.
| 12. | Related Party Transactions (continued) |
| (ii) | Note Payable (continued) |
On November 10, 2017, the Company and the Clay Group agreed to amend the November 2016 Loan by reducing the 2018 quarterly and 2019 Q1 principal payments from $2,500 to $1,000, adding the reduction of such payments pro-rata to the remaining 2019 payments, and increasing the annual interest rate from 8% to 10% effective January 1, 2018 (the “November 2017 Loan”). This amendment was accounted for as a debt modification.
The following table summarizes activity on the notes payable:
September 30, 2018 | December 31, 2017 | |||||||
| Balance, beginning of the period | $ | 30,099 | $ | 26,347 | ||||
| Interest payable transferred to principal balance | - | 2,212 | ||||||
| Accretion of discount on loans | 1,512 | 1,940 | ||||||
| Capitalized financing and legal fees | - | (400 | ) | |||||
| Accretion of capitalized financing and legal fees | 196 | - | ||||||
| Repayment of loans and interest | (6,711 | ) | - | |||||
| Balance, end of the period | $ | 25,096 | $ | 30,099 | ||||
| Current portion | $ | 25,096 | $ | 7,712 | ||||
| Non-current portion | $ | - | $ | 22,387 | ||||
| (iii) | Amortization of Discounts and Interest Expense |
The following table summarizes the amortization of discounts and interest on loans:
| Three Months Ended September 30, | Three Months Ended September 30, | Nine Months Ended September 30, | Nine Months Ended September 30, | |||||||||||||
| 2018 | 2017 | 2018 | 2017 | |||||||||||||
| Accretion of the Nov 2017 Loan discount | $ | 518 | $ | 510 | $ | 1,512 | $ | 1,250 | ||||||||
| Accretion of capitalized financing and legal fees | 66 | - | 196 | - | ||||||||||||
| Interest expense related to the Nov 2017 Loan | 678 | 642 | 2,087 | 1,914 | ||||||||||||
| Closing and commitment fees related to the Credit Facility | - | - | 40 | - | ||||||||||||
| Interest expense related to Komatsu financial loans (1) | 147 | 143 | 548 | 428 | ||||||||||||
| Accretion of discount and interest on loan | $ | 1,409 | $ | 1,295 | $ | 4,383 | $ | 3,592 | ||||||||
| (1) | Komatsu is not a related party and has only been included in the above table to reconcile the total interest expense incurred for the period … to the amounts capitalized and expensed. |
| (iv) | Joint Venture Transaction |
The Company has presented Gauss’ ownership in GQM LLC as a non-controlling interest amount on the balance sheet within the equity section. However, there are terms in the agreement that provide for the exit from the investment in GQM LLC for an initial member whose interest in GQM LLC becomes less than 20%.
| 14 |
GOLDEN QUEEN MINING CO. LTD.
Notes to Condensed Consolidated Interim Financial Statements
For the Three and Nine Months Ended September 30, 2018 and 2017
(amounts expressed in thousands of US dollars - Unaudited)
| 12. | Related Party Transactions (continued) |
| (iv) | Joint Venture Transaction (continued) |
If a member becomes less than a 20% interest holder, its remaining interest will (ultimately) be terminated through one of 3 events at the non-diluted member’s option:
a. Through conversion to a net smelter royalty (“NSR”);
b. Through a buy-out (at fair value) by the non-diluted member; or
c. Through a sale process by which the diluted member’s interest is sold.
The net assets of GQM LLC as at September 30, 2018 and December 31, 2017 are as follows:
September 30, 2018 | December 31, 2017 | |||||||
| Assets, GQM LLC | $ | 158,087 | $ | 149,095 | ||||
| Liabilities, GQM LLC | (23,746 | ) | (28,024 | ) | ||||
| Net assets, GQM LLC | $ | 134,341 | $ | 121,071 | ||||
Included in the assets above, is $3,980 (December 31, 2017 – $2,606) in cash held by GQM LLC which is directed specifically to fund capital expenditures required to continue with production and to settle GQM LLC’s obligations. The liabilities of GQM LLC do not have recourse to the general credit of Golden Queen except for $460 for two mining drill loans and $4,921 in surety bond agreements.
Non-Controlling Interest
The carrying value of the non-controlling interest is adjusted for net income and loss, distributions and contributions pursuant to ASC 810-10 based on the same percentage allocation used to calculate the initial book value of temporary equity.
| Three Months Ended September 30, | Three Months Ended September 30, | Nine Months Ended September 30, | Nine Months Ended September 30, | |||||||||||||
| 2018 | 2017 | 2018 | 2017 | |||||||||||||
| Net and comprehensive income (loss) in GQM LLC | $ | (1,909 | ) | $ | (2,674 | ) | $ | (6,728 | ) | $ | (2,991 | ) | ||||
| Non-controlling interest percentage | 50 | % | 50 | % | 50 | % | 50 | % | ||||||||
| Net and comprehensive income (loss) attributable to non-controlling interest | $ | (954 | ) | $ | (1,335 | ) | $ | (3,364 | ) | $ | (1,495 | ) | ||||
| Net and comprehensive income (loss) attributable to permanent non-controlling interest | $ | (572 | ) | $ | (801 | ) | $ | (2,018 | ) | $ | (897 | ) | ||||
| Net and comprehensive income (loss) attributable to temporary non-controlling interest | $ | (382 | ) | $ | (534 | ) | $ | (1,346 | ) | $ | (598 | ) | ||||
| Permanent Non- Controlling Interest | Temporary Non- Controlling Interest | |||||||
| Carrying value of non-controlling interest, December 31, 2017 | $ | 36,321 | $ | 24,214 | ||||
| Capital contribution | 10,000 | - | ||||||
| Net and comprehensive loss for the period | (2,018 | ) | (1,346 | ) | ||||
| Carrying value of non-controlling interest, September 30, 2018 | $ | 44,303 | $ | 22,868 | ||||
| 15 |
GOLDEN QUEEN MINING CO. LTD.
Notes to Condensed Consolidated Interim Financial Statements
For the Three and Nine Months Ended September 30, 2018 and 2017
(amounts expressed in thousands of US dollars - Unaudited)
| 12. | Related Party Transactions (continued) |
| (v) | Credit Facility |
On May 23, 2017, GQM LLC entered into a $5,000 one-year revolving credit agreement (the “Credit Facility”) in which Gauss Holdings LLC and Auvergne, LLC agreed to extend credit in the form of loans to GQM LLC. The Credit Facility commenced on July 1, 2017, bears interest at a rate of 12% per annum and is subject to a commitment fee of 1% per annum. For the three and nine months ended September 30, 2018, GQM LLC paid commitment fees of $40 (2017 – $20 and $40, respectively). The balance of the Credit Facility was $3,000 as at December 31, 2017. The Credit Facility expired on May 22, 2018 and the balance of $5 million was repaid in cash.
| 13. | Commitments and Contingencies |
Royalties
The Company has acquired a number of mineral property interests outright. It has acquired exclusive rights to explore, develop and mine other portions of the Mine under various mining lease agreements with landowners. Royalty amounts due to each landholder over the life of the Mine vary with each property.
Compliance with Environmental Regulations
The Company’s exploration and development activities are subject to laws and regulations controlling not only the exploration and mining of mineral properties, but also the effect of such activities on the environment. Compliance with such laws and regulations may necessitate additional capital outlays or affect the economics of a mine, and cause changes or delays in the Company’s activities.
Corporate Guaranties
The Company has provided corporate guaranties for two of GQM LLC’s mining drill loans. The Company has also provided a corporate guaranty for GQM LLC’s surety bonds.
| 14. | Financial Instruments |
Fair Value Measurements
All financial assets and financial liabilities are recorded at fair value on initial recognition. Transaction costs are expensed when they are incurred, unless they are directly attributable to the acquisition of qualifying assets, in which case they are added to the costs of those assets until such time as the assets are substantially ready for their intended use or sale.
The three levels of the fair value hierarchy are as follows:
| Level 1 | Unadjusted quoted prices in active markets that are accessible at the measurement date for identical, unrestricted assets or liabilities; |
| Level 2 | Quoted prices in markets that are not active, or inputs that are observable, either directly or indirectly, for substantially the full term of the asset or liability; |
| Level 3 | Prices or valuation techniques that require inputs that are both significant to the fair value measurement and unobservable (supported by little or no market activity). |
| September 30, 2018 | ||||||||||||||||
| Total | Level 1 | Level 2 | Level 3 | |||||||||||||
| Liabilities: | ||||||||||||||||
| Share purchase warrants – Related Party (see Note 7) | $ | 235 | $ | - | $ | 235 | $ | - | ||||||||
| Share purchase warrants – (see Note 7) | 1 | - | 1 | - | ||||||||||||
| $ | 236 | $ | - | $ | 236 | $ | - | |||||||||
| 16 |
GOLDEN QUEEN MINING CO. LTD.
Notes to Condensed Consolidated Interim Financial Statements
For the Three and Nine Months Ended September 30, 2018 and 2017
(amounts expressed in thousands of US dollars - Unaudited)
| 14. | Financial Instruments (continued) |
Fair Value Measurements (continued)
| December 31, 2017 | ||||||||||||||||
| Total | Level 1 | Level 2 | Level 3 | |||||||||||||
| Liabilities: | ||||||||||||||||
| Share purchase warrants – Related Party (see Note 7) | $ | 439 | $ | - | $ | 439 | $ | - | ||||||||
| Share purchase warrants – (see Note 7) | 2 | - | 2 | - | ||||||||||||
| $ | 441 | $ | - | $ | 441 | $ | - | |||||||||
Under fair value accounting, assets and liabilities are classified in their entirety based on the lowest level of input that is significant to the fair value measurement. The fair value measurement of the financial instruments above use observable inputs in option price models such as the binomial and the Black-Scholes valuation models.
Credit Risk
Credit risk is the risk that the counterparty to a financial instrument will cause a financial loss for the Company by failing to discharge its obligations. To mitigate exposure to credit risk on financial assets the Company has established policies to ensure liquidity of funds and ensure counterparties demonstrate minimum acceptable credit worthiness.
The Company maintains its US Dollar and Canadian Dollar cash in bank accounts with major financial institutions with high credit standings. Cash deposits held in the United States are insured by the Federal Deposit Insurance Corporation (“FDIC”) for up to $250 and Canadian Dollar cash deposits held in Canada are insured by the Canada Deposit Insurance Corporation (“CDIC”) for up to C$100.
Certain United States and Canadian bank accounts held by the Company exceed these federally insured limits or are uninsured as they relate to US Dollar deposits held in Canadian financial institutions. As at September 30, 2018, the Company’s cash balances held in United States and Canadian financial institutions include $8,417, which are not fully insured by the FDIC or CDIC. The Company has not experienced any losses on such accounts and management believes that using major financial institutions with high credit ratings mitigates the credit risk in cash.
Interest Rate Risk
The Company holds approximately 55% of its cash in bank deposit accounts with a single major financial institution. The interest rates received on these balances may fluctuate with changes in economic conditions. Based on the average cash balances during the three and nine months ended September 30, 2018, a 1% decrease in interest rates would have reduced the interest income for the three and nine months ended September 30, 2018, by an immaterial amount.
Foreign Currency Exchange Risk
Certain purchases of corporate overhead items are denominated in Canadian Dollar. As a result, currency exchange fluctuations may impact the costs of operations. Specifically, the appreciation of the Canadian Dollar against the US Dollar may result in an increase in the Canadian operating expenses in US dollar terms. As at September 30, 2018, the Company maintained the majority of its cash balance in US Dollars. The Company currently does not engage in any currency hedging activities.
| 17 |
GOLDEN QUEEN MINING CO. LTD.
Notes to Condensed Consolidated Interim Financial Statements
For the Three and Nine Months Ended September 30, 2018 and 2017
(amounts expressed in thousands of US dollars - Unaudited)
| 15. | Subsequent Events |
On October 12, 2018, GQM LLC entered into an agreement with Gauss Holdings LLC and Auvergne LLC (the “Lenders”) where by the Lenders are providing GQM LLC a revolving credit loan facility (the “Facility”) in the amount of $20 million. Through Gauss LLC, the Lenders are the other 50% owners of GQM LLC. Gauss Holdings LLC is wholly owned by Jefferies Financial Group, and Auvergne LLC is wholly owned by members of the Clay family.
Under the terms of the agreement, the maturity date of the Facility is March 31, 2020 and the annual interest rate on drawn amounts is 8%. The Company may prepay all or part of the Facility at any time prior to the maturity date, and amounts prepaid will not be subject to penalty.
GQM LLC has made an initial $5 million draw on the Facility.
In connection with the Facility, the Lenders were issued 21,486 warrants (the “GQM LLC Warrants”), with each warrant entitling the holder to purchase a unit of GQM LLC for a period of five (5) years at an exercise price of $475.384 per unit.
The GQM LLC Warrants represent a fully-diluted 7.5% interest in the equity of GQM LLC. If the GQM LLC warrants are exercised, the Company’s interest in GQM LLC will be diluted to 46.25%. The Company’s current interest in GQM LLC is 50%.
The Facility is secured by a pledge of the Company’s equity interest in GQM LLC.
| 18 |
Item 2. Management’s Discussion and Analysis of Financial Condition and Results of Operation
The following discussion of the operating results and financial condition of Golden Queen Mining Co. Ltd. (“Golden Queen”, “GQM Ltd.”, “Company”, “we”, “our” or “us”) is as at November 8, 2018 and should be read in conjunction with the unaudited condensed consolidated interim financial statements of the Company for the three and nine months ended September 30, 2018 and the notes thereto.
All amounts herein are presented in thousands of US dollars, except per share amounts, or unless otherwise noted.
Cautionary Note Regarding Forward-looking Statements
This Form 10-Q contains certain forward-looking statements, which relate to the intent, belief and current expectations of the Company’s management, as well as assumptions and parameters used in the feasibility study referenced in this report. These forward-looking statements are based upon numerous assumptions that involve risks and uncertainties and other factors that may cause actual results to differ materially from those indicated by such forward-looking statements. Such factors include among other things the receipt and compliance with the terms of required approvals and permits, results of operations and commodity prices. In addition, projected mining results, including quantity of ore, grade, production rates, operating costs and recovery rates, are subject to numerous risks normally associated with mining activity of the nature described in this report and in the feasibility study, and as a result actual results may differ substantially from projected results. Readers are cautioned not to place undue reliance on the forward-looking statements, which speak only as of the date the statements were made.
Cautionary Note to US Investors
We advise US investors that the mineral reserve estimates disclosed in this report have been prepared in accordance with Canadian regulations and may not qualify as “reserves” under the SEC Industry Guide 7. Information concerning mineral resources and reserves set forth herein may not be comparable with information presented by companies using only US standards in their public disclosure.
Mr. Tim Mazanek, SME is a qualified person for the purposes of NI 43-101 and has reviewed and approved the technical information in this Form 10-Q.
The Soledad Mountain Mine
Overview
The Company is engaged in the operation of the Soledad Mountain Mine (“the Mine”), located in the Mojave Mining District, Kern County, California. The Company currently owns 50% of Golden Queen Mining Company, LLC (“GQM LLC”), the operator of the Mine. The remaining 50% is owned by Gauss LLC (“Gauss”). The Mine is located just outside the town of Mojave in southern California and utilizes conventional open pit mining methods and cyanide heap leach and Merrill-Crowe processes to recover gold and silver from crushed, agglomerated ore. The Mine also produces small quantities of aggregate.
Highlights: Third Quarter Highlights
| · | Total of 4,837 kt of ore and waste (previous quarter 3,912 kt) were mined including 916 kt of ore (previous quarter 1,473 kt); |
| · | Plant processed a total of 931 kt of ore at an average grade of 0.025 oz/t (previous quarter 943 kt at an average grade of 0.020 oz/t); |
| · | Merrill-Crowe recovery was 95% in September, the highest recovery achieved since commencement; and |
| · | 12,943 ounces of gold and 121,843 ounces of silver were produced (previous quarter was 9,976 and 99,846 ounces, respectively). |
Project Update
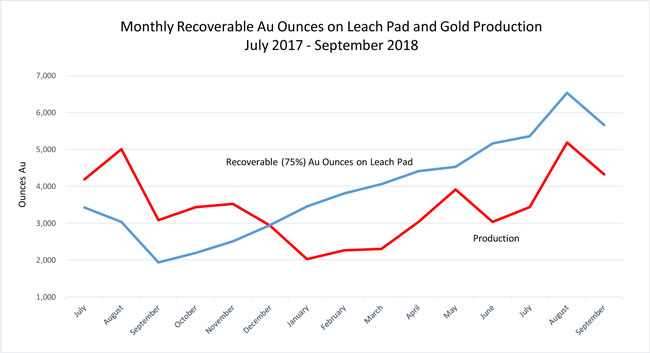
In the third quarter of 2018, the Company continued to develop the East Pit. It is anticipated that the transition to the East Pit will provide the majority of ore production for at least the next two years where higher ore tonnage and grade and lower waste tons are expected. The plan is to increase the delivery of ounces to the heap leach pad by selectively mining higher grade tons as much as practical. Operations during the third quarter of 2018 show continued improvement in gold ounces loaded on the pad. As a result of the drill program completed during first quarter of the year, a new life of mine plan is currently being prepared.
| 19 |
During the third quarter of 2018, Soledad Mountain recorded a mined gold grade of 0.026 ounces per ton, the highest quarterly result since the beginning of mine operations. It is anticipated that higher grade ore mined and processed during the third quarter of 2018 will benefit gold production in the fourth quarter of 2018 and the first quarter of 2019. Production in the third quarter was 12,943 ounces of gold and 121,843 ounces of silver. The improved result compared to preceding quarters was driven by the higher-grade ore placed on the pad since the beginning of the year.
Through the first 13 benches mined in the East Pit, ore production has encountered almost 35% more gold ounces than indicated in the mine plan based on the geological model. The strip ratio in the East Pit has been near expectation and there has been an increase in waste stripping at the top of the mountain during the quarter to facilitate ore mining in 2019 and 2020. This advanced stripping negatively impacts current operating costs.
For the third quarter, ore mining rate has been roughly matched to pad-loading production (little stockpile movement). The amount of tons mined increased due to increased stripping in the East Pit phase 2. During the period, there was significant unplanned downtime associated with the jaw and secondary crushers. In addition, the maintenance crew replaced the rolls on the HPGR during the third quarter, a year later than forecast. Merrill-Crowe plant performance improved greatly in the third Quarter. The recovery of gold from solution averaged over 90% in the quarter from the low 80s in previous quarters. Better clarifier performance as well as a change in the procedure for restarting filter presses after cleaning were responsible for the improvement.
Column testing of monthly sample composites show that leaching is generally in line with the feasibility study predictions. Actual leach results from the heap show good recovery that ties well with the projected recovery curves in the feasibility study for ultimate gold recovery. However, East Pit ore leaching exhibits slightly slower leach kinetics than the Northwest/Main Pit phase 1 ore. In addition, recently stacked ore has not been leached for a full cycle yet. It is expected that full-cycle leaching will produce results close to feasibility study ultimate recovery. Currently, less than half the pad is under leach due to the stacking configuration and this significantly delays the recovery of gold and silver from the latter parts of the leach cycle.
The Company has initiated the process of permitting additional infrastructure for ongoing operations and planned activities that are expected to extend the mine life of Soledad Mountain beyond the initial 11 years contemplated in the 2015 Feasibility Study. The process is ongoing and it is anticipated to take approximately one to two years.
| 20 |
For the three months ended September 30, 2018, the Company recorded aggregate sales of $3.6. The Company was added to the California AB 3098 list last year which allows the Company to sell its aggregate to state and municipal agencies. The Company will not include the sale of aggregate in cash flow projections until such time as a long-term contract for the sale of products has been secured.
There are currently a total of 218 persons employed on site.
Results of Operations
The following are the results of operations for the three and nine months ended September 30, 2018 and 2017:
| Three months ended | Nine months ended | |||||||||||||||||
| 30-Sep-18 | 30-Sep-17 | 30-Sep-18 | 30-Sep-17 | |||||||||||||||
| Mining - Key Metrics | ||||||||||||||||||
| Ore mined | k ton | 916 | 928 | 3,524 | 2,790 | |||||||||||||
ore mined | ||||||||||||||||||
| Waste mined: ore mined ratio | ratio | 4.3:1 | 4.3:1 | 2.6:1 | 3.9:1 | |||||||||||||
| Gold grade placed | oz/ton | 0.025 | 0.013 | 0.021 | 0.016 | |||||||||||||
| Silver grade placed | oz/ton | 0.399 | 0.180 | 0.355 | 0.203 | |||||||||||||
| Gold sold | oz | 12,798 | 12,255 | 29,219 | 36,068 | |||||||||||||
| Silver sold | oz | 100,408 | 47,977 | 250,147 | 163,856 | |||||||||||||
| Apparent cumulative recovery - gold (1) | % | 67.1 | % | 73.0 | % | 67.1 | % | 73.0 | % | |||||||||
| Apparent cumulative recovery - silver (1) | % | 28.5 | % | 25.8 | % | 28.5 | % | 25.8 | % | |||||||||
| Financial (1) | ||||||||||||||||||
| Revenue | $ | 16,855 | 16,496 | 40,925 | 48,182 | |||||||||||||
| Cost of sales, excluding depreciation and depletion (or Direct mining costs) | $ | 14,469 | 15,404 | 35,615 | 40,333 | |||||||||||||
| Depreciation and depletion | $ | 3,615 | 2,931 | 9,955 | 8,429 | |||||||||||||
| Loss from mine operations | $ | (1,229 | ) | (1,839 | ) | (4,645 | ) | (580 | ) | |||||||||
| General and administrative expenses | $ | (839 | ) | (1,171 | ) | (2,972 | ) | (3,297 | ) | |||||||||
| Total other income (expenses) | $ | (1,289 | ) | (214 | ) | (4,199 | ) | (970 | ) | |||||||||
| Net and comprehensive loss | $ | (3,357 | ) | (3,224 | ) | (11,816 | ) | (4,847 | ) | |||||||||
| Net and comprehensive income (loss) attributable to Golden Queen Mining Co Ltd. | $ | (2,403 | ) | (1,889 | ) | (8,452 | ) | (3,352 | ) | |||||||||
| Average realized gold price (1) | $/oz sold | 1,201 | 1,280 | 1,264 | 1,257 | |||||||||||||
| Average realized silver price (1) | $/oz sold | 14.77 | 16.89 | 15.90 | 17.23 | |||||||||||||
| Total cash costs - net of by-product credits (1)(2) | $/Au oz produced | 1,047 | 1,177 | 1,503 | 1,074 | |||||||||||||
| All-in sustaining costs - net of by-product credits (1) | $/Au oz produced | 1,086 | 1,502 | 1,692 | 1,517 | |||||||||||||
| Total cash costs (3) | $/t placed | 19.47 | 16.99 | 18.02 | 15.40 | |||||||||||||
| Off-site costs (1) | $/t placed | 0.53 | 0.78 | 0.59 | 0.77 | |||||||||||||
| (1) | Total cash costs, all-in sustaining costs, apparent cumulative recovery, off-site costs, average realized gold price and average realized silver price are financial performance measures with no standard meaning under US GAAP. Refer to “Non-US GAAP Financial Performance Measures” for further information. |
| (2) | Total cash costs – net of by-product credits figure incorporates inventory changes and others adjustment, refer to total cash costs reconciliation in “Non-US GAAP Financial Performance Measures” for details. |
| (3) | Total cash costs figure does not incorporate inventory changes and others adjustment. |
Financial Results
For the three and nine months ended September 30, 2018, the Company generated revenues from operations of $16,855 from the sale of 12,798 ounces of gold and 100,408 ounces of silver and $40,925 from the sale of 29,219 ounces of gold and 250,147 ounces of silver, respectively. In comparison, for the same periods of 2017 the Company generated revenues from operations of $16,496 from the sale of 12,255 ounces of gold and 47,977 ounces of silver and $48,182 from the sale of 36,068 ounces of gold and 163,586 ounces of silver. The decrease in revenue was caused by the lower gold price and, for the nine months, lower ounces sold.
| 21 |
The costs, excluding depreciation and depletion, applicable to sales incurred during the three and nine months ended September 30, 2018 were $14,469 and $35,615 (three and nine months ended September 30, 2017 - $15,404 and $40,333), respectively. The cost of sales, excluding depreciation and depletion, in the current period decreased in comparison with the prior period due to decreased revenues offset by increased stripping in preparation for East Pit phase 2. Costs of sales include mining, processing, maintenance and site support costs. Also, included in the costs of sales are refining, transportation costs, royalties and property taxes.
Depreciation and depletion expenses during the three and nine months ended September 30, 2018 were $3,615 and $9,955 (three and nine months ended September 30, 2017 – $2,931 and $8,429), respectively. The increase in 2018 compared to 2017 was mainly due to the addition of depreciable fixed assets of $19,409 in the third and fourth quarters of 2017 and the addition of depreciable fixed assets of $6,088 in the first three quarters of 2018. These new depreciable fixed assets consist primarily of mobile mining equipment.
General and administrative expenses for the three and nine months ended September 30, 2018 were $839 and $2,972 (three and nine months ended September 30, 2017 - $1,171 and $3,297), respectively. The decrease in 2018 compared to 2017 was mainly a result of lower legal and professional fees, salaries and benefits offset by higher insurance and regulatory fees. General and administrative expenses are being reduced in an effort to lower costs and improve liquidity.
For the three and nine months ended September 30, 2018, the Company incurred finance expenses of $1,409 and $4,383 compared to $1,295 and $3,592 for the three and nine months ended September 30, 2017. The increase in finance expenses was mainly due to an increase of 2% in the interest rate on the Clay Loan resulting in additional interest payable and increased accretion on the Clay Loan.
For the three and nine months ended September 30, 2018, the Company recorded gains of $136 and $204 on derivative instruments compared to gains of $1,139 and $3,033 on derivative instruments for the three and nine months ended September 30, 2017, respectively. The gain for the nine months ended September 30, 2018 was smaller due to insignificant downward movement of the Company’s share price compared to the same period of 2017.
Summary of Quarterly Results
Results for the eight most recent quarters are set out in the table below:
| Results for the quarter ended: | ||||||||||||||||
| 30-Sep-18 | 30-Jun-18 | 31-Mar-18 | 31-Dec-17 | |||||||||||||
| Revenue | $ | 16,855 | $ | 14,485 | $ | 9,585 | $ | 13,939 | ||||||||
| Net and comprehensive income (loss) | $ | (3,357 | ) | $ | 604 | $ | (9,063 | ) | $ | (1,327 | ) | |||||
| Net and comprehensive loss attributable to GQM Ltd. | $ | (2,403 | ) | $ | (632 | ) | $ | (5,417 | ) | (2,188 | ) | |||||
| Basic net loss per share | $ | (0.01 | ) | $ | (0.00 | ) | $ | (0.03 | ) | $ | (0.02 | ) | ||||
| Diluted net loss per share | $ | (0.01 | ) | $ | (0.00 | ) | $ | (0.03 | ) | $ | (0.02 | ) | ||||
| Results for the quarter ended: | ||||||||||||||||
| 30-Sep-17 | 30-Jun-17 | 31-Mar-17 | 31-Dec-16 | |||||||||||||
| Revenue | $ | 16,496 | $ | 16,882 | $ | 14,804 | $ | 10,278 | ||||||||
| Net and comprehensive income (loss) | $ | (3,224 | ) | $ | 1,192 | $ | (2,815 | ) | $ | (434 | ) | |||||
| Net and comprehensive income (loss) attributable to GQM Ltd. | $ | (1,889 | ) | $ | 962 | (2,425 | ) | 868 | ||||||||
| Basic net income (loss) per share | $ | (0.01 | ) | $ | 0.01 | $ | (0.02 | ) | $ | (0.01 | ) | |||||
| Diluted net income (loss) per share | $ | (0.01 | ) | $ | 0.01 | $ | (0.02 | ) | $ | (0.01 | ) | |||||
During the three months ended September 30, 2018, net and comprehensive loss of $3,357 was mainly due to the loss generated from mine operations of $1,229. Mine operations improvements and higher grade were offset by additional cost for East Pit phase 2 stripping, equipment overhauls and the lower gold price.
During the three months ended June 30, 2018, net and comprehensive income was $602 mainly as a result of income generated from mine operations of $2,112.
| 22 |
During the three months ended March 31, 2018, net and comprehensive loss was $9,063 mainly as a result of loss from mine operations of $6,449 due to higher direct mining costs as a result of developing the East Pit and lower revenues due to lower gold production as a result of fewer available gold ounces on the leach pad.
In general, the results of operations can vary from quarter to quarter depending upon the nature, timing and cost of activities undertaken, whether or not the Company incurs gains or losses on foreign exchange or grants stock options, and the movements in its derivative liability.
Reclamation Financial Assurance and Asset Retirement Obligation
Reclamation Financial Assurance
GQM LLC is required to provide the Bureau of Land Management, the State Office of Mine Reclamation and Kern County with a revised reclamation cost estimate annually. The financial assurance is adjusted once the cost estimate is approved.
This estimate, once approved by state and county authorities, forms the basis of reclamation financial assurance. The reclamation assurance provided as at September 30, 2018 was $1,749 (December 31, 2017 – $1,465).
GQM LLC is also required to provide financial assurance with the Lahontan Regional Water Quality Control Board (the “Regional Board”) for closure and reclamation costs related to the lined impoundments, which are defined as the Stage 1 and Stage 2 heap leach pads, the overflow pond, and the solution collection channel. The reclamation financial assurance estimate as at September 30, 2018 was $2,450 (December 31, 2017 – $1,869).
In addition to the above, GQM LLC is required to obtain and maintain financial assurance for initiating and completing corrective action and remediation of a reasonably foreseeable release from the Project’s waste management units as required by the Regional Board. The reclamation financial assurance estimate as at September 30, 2018 is $278 (December 31, 2017 – $278).
GQM LLC entered into $4,921 (2017 – $3,612) in surety bond agreements in order to release its reclamation deposits and a bond for power of $444. GQM LLC pays a yearly premium of $101 (2017 – $90). Golden Queen Ltd. has provided a corporate guarantee on the surety bonds.
Asset Retirement Obligation
The total asset retirement obligation as at September 30, 2018, was $2,455 (December 31, 2017 – $1,838).
The Company estimated its asset retirement obligations based on its understanding of the requirements to reclaim and remediate its property based on its activities to date. As at September 30, 2018, the Company estimates the cash outflow related to these reclamation activities will be incurred in 2028. Reclamation provisions are measured at the expected value of future cash flows discounted to their present value using a discount rate based on a credit adjusted risk-free interest rate of 8.34% and an inflation rate of 2.41%.
Off-balance Sheet Arrangements
The Company has no off-balance sheet arrangements.
Transactions with Related Parties
Except as noted elsewhere in this Form 10-Q, related party transactions are disclosed as follows:
| (i) | Compensation of Key Management Personnel, Transactions with Related Parties and Related Party Balances |
For the three and nine months ended September 30, 2018, the Company recognized $125 and $424 (for the three and nine months ended September 30, 2017 – $163 and $490) salaries and fees for Officers and Directors.
As at September 30, 2018, $nil (December 31, 2017 – $38) was included in prepaid expenses and other current assets for closing fees paid to related parties.
| 23 |
As at September 30, 2018, $nil (December 31, 2017 – $463) for amended fees and accrued interest payable to related parties was included in accounts payable and accrued liabilities for accrued interest payable to related parties and salaries and fees payable to Officers and Directors.
| (ii) | Note Payable |
On November 18, 2016, the Company entered into a loan with the Clay Group for $31,000 (the “November 2016 Loan”), due on May 21, 2019 and an annual interest rate of 8%, payable quarterly. In connection with the November 2016 Loan, the Company issued 8,000,000 common share purchase warrants exercisable for a period of five years expiring November 21, 2021. The common share purchase warrants have an exercise price of $0.85. As per an anti-dilution provision included in the November 2016 Loan agreement, the exercise price of the November 2016 Warrants was revised to $0.6650 on the rights offering completion date. The expiry date of November 18, 2021 of the November 2016 Warrants remains unchanged.
On November 10, 2017, the Company and the Clay Group entered into a letter agreement (the “Letter Agreement”) pursuant to which they agreed to amend the November 2016 Loan by reducing the 2018 quarterly and 2019 Q1 principal payments from $2,500 to $1,000, adding the reduction of such payments pro-rata to the remaining 2019 payments, and increasing the annual interest rate from 8% to 10% effective January 1, 2018 (the “November 2017 Loan”). On February 22, 2018, the Company and the Clay Group entered into definitive agreements to amend the terms of the November 2016 Loan and the registration rights agreement in accordance with the Letter Agreement. This amendment was accounted for as a debt modification.
The following table summarizes activity on the notes payable:
| September 30, 2018 | December 31, 2017 | |||||||
| Balance, beginning of the period | $ | 30,099 | $ | 26,347 | ||||
| Interest payable transferred to principal balance | - | 2,212 | ||||||
| Accretion of discount on loans | 1,512 | 1,940 | ||||||
| Capitalized financing and legal fees | - | (400 | ) | |||||
| Accretion of capitalized financing and legal fees | 196 | - | ||||||
| Repayment of loans and interest | (6,711 | ) | - | |||||
| Balance, end of the period | $ | 25,096 | $ | 30,099 | ||||
| Current portion | $ | 25,096 | $ | 7,712 | ||||
| Non-current portion | $ | - | $ | 22,387 | ||||
| (iii) | Amortization of Discounts and Interest Expense |
The following table summarizes the amortization of discounts and interest on loan:
| Three Months Ended September 30, | Three Months Ended September 30, | Nine Months Ended September 30, | Nine Months Ended September 30, | |||||||||||||
| 2018 | 2017 | 2018 | 2017 | |||||||||||||
| Accretion of the Nov 2017 Loan discount | $ | 518 | $ | 510 | $ | 1,512 | $ | 1,250 | ||||||||
| Accretion of capitalized financing and legal fees | 66 | - | 196 | - | ||||||||||||
| Interest expense related to the Nov 2017 Loan | 678 | 642 | 2,087 | 1,914 | ||||||||||||
| Closing and commitment fees related to the Credit Facility | - | - | 40 | - | ||||||||||||
| Interest expense related to Komatsu financial loans (1) | 147 | 143 | 548 | 428 | ||||||||||||
| Accretion of discount and interest on loan | $ | 1,409 | $ | 1,295 | $ | 4,383 | $ | 3,592 | ||||||||
(1) Komatsu is not a related party and has only been included in the above table to reconcile the total interest expense incurred for the period to the amounts capitalized and expensed.
| 24 |
| (iv) | Joint Venture Transaction |
The Company has presented Gauss’ ownership in GQM LLC as a non-controlling interest amount on the balance sheet within the equity section. However, there are terms in the agreement that provide for the exit from the investment in GQM LLC for an initial member whose interest in GQM LLC becomes less than 20%.
If a member becomes less than a 20% interest holder, its remaining interest will (ultimately) be terminated through one of three events at the non-diluted member’s option:
a. Through conversion to a net smelter royalty (“NSR”);
b. Through a buy-out (at fair value) by the non-diluted member; or
c. Through a sale process by which the diluted member’s interest is sold.
The net assets of GQM LLC as at September 30, 2018 and December 31, 2017 are as follows:
| September 30, 2018 | December 31, 2017 | |||||||
| Assets, GQM LLC | $ | 158,087 | $ | 149,095 | ||||
| Liabilities, GQM LLC | (23,746 | ) | (28,024 | ) | ||||
| Net assets, GQM LLC | $ | 134,341 | $ | 121,071 | ||||
Included in the assets above, is $3,980 (December 31, 2017 – $2,606) in cash held by GQM LLC which is directed specifically to fund capital expenditures required to continue with production and to settle GQM LLC’s obligations. The liabilities of GQM LLC do not have recourse to the general credit of Golden Queen except for $460 for two mining drill loans and $4,921 in surety bond agreements.
Non-Controlling Interest
The carrying value of the non-controlling interest is adjusted for net income and loss, distributions and contributions pursuant to ASC 810-10 based on the same percentage allocation used to calculate the initial book value of temporary equity.
| Three Months Ended September 30, | Three Months Ended September 30, | Nine Months Ended September 30, | Nine Months Ended September 30, | |||||||||||||
| 2018 | 2017 | 2018 | 2017 | |||||||||||||
| Net and comprehensive income (loss) in GQM LLC | $ | (1,909 | ) | $ | (2,674 | ) | $ | (6,728 | ) | $ | (2,991 | ) | ||||
| Non-controlling interest percentage | 50 | % | 50 | % | 50 | % | 50 | % | ||||||||
| Net and comprehensive income (loss) attributable to non-controlling interest | $ | (954 | ) | $ | (1,335 | ) | $ | (3,364 | ) | $ | (1,495 | ) | ||||
| Net and comprehensive income (loss) attributable to permanent non-controlling interest | $ | (572 | ) | $ | (801 | ) | $ | (2,018 | ) | $ | (897 | ) | ||||
| Net and comprehensive income (loss) attributable to temporary non-controlling interest | $ | (382 | ) | $ | (534 | ) | $ | (1,346 | ) | $ | (598 | ) | ||||
| Permanent Non- Controlling Interest | Temporary Non- Controlling Interest | |||||||
| Carrying value of non-controlling interest, December 31, 2017 | $ | 36,321 | $ | 24,214 | ||||
| Capital contribution | 10,000 | - | ||||||
| Net and comprehensive loss for the period | (2,018 | ) | (1,346 | ) | ||||
| Carrying value of non-controlling interest, September 30, 2018 | $ | 44,303 | $ | 22,868 | ||||
| 25 |
| (v) | Credit Facilities |
On May 23, 2017, GQM LLC entered into a $5,000 one-year revolving credit agreement (the “Credit Facility”) in which Gauss Holdings LLC and Auvergne, LLC agreed to extend credit in the form of loans to GQM LLC. The 2017 Credit Facility commenced on July 1, 2017, bore interest at a rate of 12% per annum and was subject to a commitment fee of 1% per annum. For the three and nine months ended September 30, 2018, GQM LLC paid commitment fees of $0 and $40, respectively (2017 – $20 and $40, respectively). The 2017 Credit Facility expired on May 22, 2018. The balance of the Credit Facility was $3,000 as at December 31, 2017, and the balance of $5,000 was repaid during the first quarter of 2018.
On October 12, 2018, the Company’s wholly-owned subsidiary, Golden Queen Mining Holdings, Inc., as a pledgor (“GQM Holdings” or “Borrower”), entered into a revolving credit agreement by and among GQM Holdings, Golden Queen Mining Company, LLC, as borrower, Gauss LLC, as a pledgor (“Gauss” and together with GQM Holdings, the “Pledgors”), Gauss Holdings LLC (“Gauss Holdings”) and Auvergne, LLC (“Auvergne” and together with Gauss Holdings, the “Lenders”), dated October 12, 2018 (the “Credit Agreement”).
Under the terms of the Credit Agreement, the Lenders have agreed to loan GQM LLC up to $20,000,000 (the “Commitment”) under a revolving credit facility (the “Facility”), which matures on March 31, 2020. GQM LLC may pre-pay all or part of the Facility at any time prior to the maturity date, and amounts prepaid will not be subject to penalty. Annual interest rate on drawn amounts under the Facility is 8% (plus an additional 2% upon an Event of Default (as defined in the Credit Agreement)), and GQM LLC agreed to pay the Lenders a commitment fee (the “Commitment Fee”) computed on a daily basis, equal to one percent (1%) per annum of the excess of (i) the Commitment, over (ii) the average daily amount of outstanding Facility balance for each fiscal quarter of the Borrower (increasing to 3% upon an Event of Default).
Under the terms of the Credit Agreement, GQM LLC issued 21,486 warrants (the “GQM LLC Warrants”), with each warrant entitling the holder to purchase a unit of GQM LLC for a period of five (5) years at an exercise price of $475.384 per unit.
The GQM LLC Warrants represent a fully-diluted 7.5% interest in the equity of GQM LLC. If the GQM LLC warrants are exercised, the Registrant’s interest in GQM LLC will be diluted to 46.25%. The Company’s current interest in GQM LLC is 50%.
The Facility is secured by a pledge of the Company’s equity interest in GQM LLC.
Fair Value of Financial Instruments
Fair Value Measurements
The three levels of the fair value hierarchy are as follows:
| Level 1 | Unadjusted quoted prices in active markets that are accessible at the measurement date for identical, unrestricted assets or liabilities; |
| Level 2 | Quoted prices in markets that are not active, or inputs that are observable, either directly or indirectly, for substantially the full term of the asset or liability; |
| Level 3 | Prices or valuation techniques that require inputs that are both significant to the fair value measurement and unobservable (supported by little or no market activity). |
| September 30, 2018 | ||||||||||||||||
| Total | Level 1 | Level 2 | Level 3 | |||||||||||||
| Liabilities: | ||||||||||||||||
| Share purchase warrants – Related Party | $ | 235 | $ | - | $ | 235 | $ | - | ||||||||
| Share purchase warrants | 1 | - | 1 | - | ||||||||||||
| $ | 236 | $ | - | $ | 236 | $ | - | |||||||||
| December 31, 2017 | ||||||||||||||||
| Total | Level 1 | Level 2 | Level 3 | |||||||||||||
| Liabilities: | ||||||||||||||||
| Share purchase warrants – Related Party | $ | 439 | $ | - | $ | 439 | $ | - | ||||||||
| Share purchase warrants | 2 | - | 2 | - | ||||||||||||
| $ | 441 | $ | - | $ | 441 | $ | - | |||||||||
Under fair value accounting, assets and liabilities are classified in their entirety based on the lowest level of input that is significant to the fair value measurement. The fair value measurement of the financial instruments above uses observable inputs in option price models such as the binomial and the Black-Scholes valuation models.
Please refer also to the note on fair value of derivative liability under Results of operations above for more information.
Select Non-Consolidated Figures
The Company has a 50% interest in GQM LLC, which meets the definition of a Variable Interest Entity (“VIE”). The Company consolidates entities which meet the definition of a VIE for which it is the primary beneficiary. The Company has determined it is the member of the related party group that is most closely associated with GQM LLC and, as a result, is the primary beneficiary who consolidates GQM LLC.
| 26 |
The following table shows figures attributable to the Company only as at September 30, 2018:
| GQM LLC | GQM LLC 50% Attributable to GQM Ltd. | GQM Ltd. on a Non- Consolidated Basis * | GQM Ltd. Attributable | |||||||||||||
| 100% | (1) | (2) | (1) + (2) | |||||||||||||
| Cash | $ | 3,980 | $ | 1,990 | $ | 4,437 | $ | 6,427 | ||||||||
| Short Term Debt | $ | 7,534 | $ | 3,767 | $ | 25,096 | $ | 28,863 | ||||||||
| Long Term Debt | $ | 6,743 | $ | 3,372 | $ | 0 | $ | 3,372 | ||||||||
| Working Capital/(Deficit) | $ | 17,536 | $ | 8,768 | $ | (21,383 | ) | $ | (12,615 | ) | ||||||
* includes GQM Holdings
The following table shows figures attributable to the Company only for the nine months ended September 30, 2018:
| GQM LLC | GQM LLC 50% Attributable to GQM Ltd. | GQM Ltd. on a Non- Consolidated Basis * | GQM Ltd. Attributable | |||||||||||||
| 100% | (1) | (2) | (1) + (2) | |||||||||||||
| Revenue | $ | 40,925 | $ | 20,463 | $ | - | $ | 20,463 | ||||||||
| Cost of sales including depreciation and depletion | $ | (45,258 | ) | $ | (22,629 | ) | $ | (312 | ) | $ | (22,941 | ) | ||||
| Accretion expense | $ | (126 | ) | $ | (63 | ) | $ | - | $ | (63 | ) | |||||
| G&A Expenses | $ | (1,738 | ) | $ | (869 | ) | $ | (1,122 | ) | $ | (1,991 | ) | ||||
| Share based payments | $ | - | $ | - | $ | (114 | ) | $ | (114 | ) | ||||||
| Decrease in fair value of derivative liability | $ | - | $ | - | $ | 204 | $ | 204 | ||||||||
| Finance Expense | $ | (588 | ) | $ | (294 | ) | $ | (3,795 | ) | $ | (4,089 | ) | ||||
| Interest Income | $ | 52 | $ | 26 | $ | 49 | $ | 75 | ||||||||
| Other | $ | 8 | $ | 4 | $ | - | $ | 4 | ||||||||
| Net Loss | $ | (6,725 | ) | $ | (3,362 | ) | $ | (5,090 | ) | $ | (8,452 | ) | ||||
* includes GQM Holdings
Liquidity and Capital Resources
The Company has generated $130,239 in revenues from operations since inception and as at September 30, 2018, had an accumulated deficit of $96,952 and working capital deficit of $11,378.
Cash from operating activities:
For the nine months ended September 30, 2018, $10,513 of cash was used in operating activities compared to $5,597 of cash generated from operating activities for the nine months ended September 30, 2017. The increased use of cash in 2018 was primarily due to increased direct mining costs and reduced revenue arising from lower production in 2018 compared to 2017.
Cash used in investing activities:
For the nine months ended September 30, 2018, $2,585 of cash was used in investing activities compared to $9,566 of cash used in investing activities for the nine months ended September 30, 2017. The significant construction costs from the 2017 period related construction of the second phase of the heap leach pad. Since the second phase of the heap leach pad was completed in September 2017, no significant costs were incurred in that regard in the nine months ended September 30, 2018.
Cash from financing activities:
For the nine months ended September 30, 2018, $18,578 of cash was generated from financing activities compared to $4,649 of cash used in financing activities for the nine months ended September 30, 2017.
| 27 |
Working capital:
The following table shows working capital as at September 30, 2018:
GQM
LLC | GQM Ltd. on a Non- Consolidated Basis * | GQM Ltd. on a Consolidated Basis ** | ||||||||||
| Current assets | $ | 24,550 | $ | 4,615 | $ | 29,053 | ||||||
| Current liabilities | (7,014 | ) | (25,999 | ) | (40,431 | ) | ||||||
| Working capital/(deficit) | $ | 17,536 | $ | (21,383 | ) | $ | (11,378 | ) | ||||
| * | includes GQM Holdings |
| ** | includes GQM Holdings and GQM LLC |
Golden Queen and GQM Holdings
As at September 30, 2018, Golden Queen and GQM Holdings had current assets of $4,615 (December 31, 2017 – $502) and current liabilities of $25,999 (December 31, 2017 – $9,194) for a working capital deficit of $21,383 (December 31, 2017 – working capital deficit of $8,692).
GQM LLC
As at September 30, 2018, GQM LLC had current assets of $24,550 (December 31, 2017 – $12,162) and current liabilities of $7,014 (December 31, 2017 – $16,572) for working capital of $17,536 (December 31, 2017 – working capital deficit of $4,410).
Outstanding Share Data
The number of shares issued and outstanding and the fully diluted share position are set out in the table below:
| Item | No. of Shares | |||||||
| Shares issued and outstanding as at December 31, 2017 | 111,148,683 | |||||||
| Shares issued as the result of a rights offering | 188,952,761 | |||||||
| Shares issued and outstanding as at September 30, 2018 | 300,101,444 | Exercise Price | Expiry Date | |||||
| Shares to be issued on exercise of directors and employees stock options | 2,325,001 | $0.29 to $0.66 | From 11/30/21 to 10/20/22 | |||||
| Shares to be issued on exercise of warrants | 24,317,700 | $0.665 to $0.95 and CAD $2.00 | From 06/08/20 to 11/18/21 | |||||
| Fully diluted November 8, 2018 | 326,744,145 | |||||||
The Company has unlimited authorized share capital.
Non-US GAAP Financial Performance Measures
Non-US GAAP financial measures are intended to provide additional information only and do not have any standard meaning prescribed by generally accepted accounting principles. These measures should not be considered in isolation or as a substitute for performance measures prepared in accordance with US GAAP.
Total Cash Costs
Total cash costs are derived from amounts included in the statement of operations and include direct mining costs and site general and administrative costs. The direct mining costs shown on the table below include mine site operating costs such as mining, processing, smelting, refining, third party transportation costs, advanced minimum royalties and production costs less silver metals revenues. Management has determined that silver revenues when compared with gold revenues, are immaterial and therefore are considered a by-product of the production of gold.
| 28 |
The table below shows a reconciliation of total cash costs per gold ounce and cash costs per gold ounce on a by-product basis:
| Three Months Ended | ||||||||||||||||
| September 30, 2018 | June 30, 2018 | March 31, 2018 | December 31, 2017 | |||||||||||||
| Total cash costs | ||||||||||||||||
| Mining | $ | 9,311 | $ | 8,087 | $ | 7,376 | $ | 7,174 | ||||||||
| Processing | 5,940 | 4,707 | 4,488 | 4,346 | ||||||||||||
| Indirect mining cost | 1,553 | 2,029 | 1,972 | 2,308 | ||||||||||||
| Inventory changes and others | (2,335 | ) | (6,693 | ) | (820 | ) | 1,970 | |||||||||
| Cost of sales | 14,469 | 8,130 | 13,016 | 15,798 | ||||||||||||
| Site general and administrative | 576 | 416 | 732 | 897 | ||||||||||||
| Cash costs before by-product credits | 15,045 | 8,546 | 13,748 | 16,695 | ||||||||||||
| Divided by gold produced (oz) | 12,943 | 9,976 | 6,579 | 9,886 | ||||||||||||
| Cash costs per ounce of gold produced ($/oz) | 1,162 | 857 | 2,090 | 1,689 | ||||||||||||
| Less: By-product silver credits per ounce ($/oz) | (115 | ) | (160 | ) | (136 | ) | (123 | ) | ||||||||
| Total cash cost per ounce of gold produced on a by-product basis ($/oz) | $ | 1,047 | $ | 697 | $ | 1,954 | $ | 1,566 | ||||||||
| Ore placed (tons) | 930,776 | 943,148 | 806,450 | 837,779 | ||||||||||||
| Total Cash Costs ($/t placed) | 19.47 | 16.56 | 18.06 | 17.52 | ||||||||||||
| Crusher mechanical availability (%) | 67 | % | 73 | % | 65 | % | 69 | % | ||||||||
| Apparent cumulative recovery (1) - gold (%) | 67.1 | % | 69.1 | % | 71.5 | % | 75.5 | % | ||||||||
| Apparent cumulative recovery (1) - silver (%) | 28.5 | % | 27.7 | % | 27.1 | % | 27.4 | % | ||||||||
(1) Note: Apparent cumulative recovery is the ratio of metal produced since beginning of leaching over total estimated metal contained in ore loaded to pad since beginning of operation.
All-in Sustaining Costs
Golden Queen defines all-in sustaining costs as the sum of direct mining costs (as defined under total cash costs), site and corporate general and administrative costs, share based payments, reclamation liability accretion and capital expenditures that are sustaining in nature. Adoption of the standard is voluntary and the cost measures presented may not be comparable to other similarly titled measures of other companies. Other companies may calculate these measures differently.
The table below shows a reconciliation of cash costs per gold ounce on a by-product basis and all-in sustaining costs per ounce:
| Three Months Ended | ||||||||||||||||
| September 30, 2018 | June 30, 2018 | March 31, 2018 | December 31, 2017 | |||||||||||||
| All-in sustaining costs | ||||||||||||||||
| Cash costs before by-product credits | $ | 15,045 | $ | 8,546 | $ | 13,748 | $ | 16,695 | ||||||||
| Silver by-product | (1,483 | ) | (1,598 | ) | (895 | ) | (1,221 | ) | ||||||||
| Total cash cost after by-product | 13,562 | 6,948 | 12,853 | 15,474 | ||||||||||||
| Corporate general and administrative expenses | 230 | 428 | 477 | 549 | ||||||||||||
| Share based payments | 33 | 35 | 45 | 68 | ||||||||||||
| Accretion expense | 42 | 42 | 42 | 32 | ||||||||||||
| Sustaining capital | 190 | 2,974 | 2,412 | 3,303 | ||||||||||||
| All-in sustaining costs | 14,057 | 10,427 | 15,829 | 19,426 | ||||||||||||
| Divided by gold produced (oz) | 12,943 | 9,976 | 6,579 | 9,886 | ||||||||||||
| All-in sustaining costs per gold ounce on a by-product basis | $ | 1,086 | $ | 1,045 | $ | 2,406 | $ | 1,965 | ||||||||
| 29 |
The following table reconciles the above non-US GAAP measures to the most directly comparable US GAAP measures:
| Three Months Ended | ||||||||||||||||
| September 30, 2018 | June 30, 2018 | March 31, 2018 | December 31, 2017 | |||||||||||||
| Cost of goods sold | $ | 18,084 | $ | 11,494 | $ | 16,034 | $ | 19,450 | ||||||||
| Less: depreciation and depletion | (3,615 | ) | (3,364 | ) | (2,976 | ) | (3,526 | ) | ||||||||
| Less: accretion expense | (42 | ) | (42 | ) | (42 | ) | (126 | ) | ||||||||
| Direct mining costs | 14,427 | 8,088 | 13,016 | 15,798 | ||||||||||||
| Add: site general and administrative expenses | 576 | 416 | 732 | 897 | ||||||||||||
| Cash costs before by-product credits | $ | 15,003 | $ | 8,504 | $ | 13,748 | $ | 16,695 | ||||||||
Summary of Significant Accounting Policies and Estimates
Full disclosure of the Company’s significant accounting policies and estimates in accordance with US GAAP can be found in notes of its audited consolidated financial statements for the year ended December 31, 2017 and unaudited condensed consolidated interim financial statements for the nine months ended September 30, 2018.
Additional Information
Further information on Golden Queen Mining Co. Ltd. is available on the SEDAR website at www.sedar.com and on the Company’s web site at www.goldenqueen.com.
Item 3. Quantitative and Qualitative Disclosures About Market Risk
Not applicable.
Item 4. Controls and Procedures.
Disclosure controls and procedures
The Company’s management, with the participation of the Company’s Chief Executive Officer and Chief Financial Officer, has evaluated the effectiveness of the Company’s disclosure controls and procedures, as such term is defined in Rules 13a-15(e) and 15d-15(e) under the Securities Exchange Act of 1934, as amended (the “Exchange Act”), as of the end of the period covered by this report.
The Company’s Chief Executive Officer and Chief Financial Officer have concluded that, as of the end of the period covered by this report, the Company’s disclosure controls and procedures were effective to ensure that information required to be disclosed by the Company in reports that it files or submits under the Exchange Act is (i) recorded, processed, summarized and reported within the time periods specified in the applicable Securities and Exchange Commission rules and forms and (ii) accumulated and communicated to the Company’s management, including the Company’s Chief Executive Officer and the Company’s Chief Financial Officer, as appropriate to allow timely decisions regarding required disclosure.
Management’s report on internal control over financial reporting
Changes in Internal Control
There were no changes in our internal control over financial reporting (as defined in Rule 13a-15(e) and Rule 15d-15(e) under the Exchange Act) during the quarter ended September 30, 2018 that have materially affected, or are reasonably likely to materially affect, our internal control over financial reporting, other than the Company has implemented a remediation plan and has addressed the deficiencies previously noted in the areas of personnel and controls and has engaged an external consultant to assist in the documentation and review of its internal controls.
| 30 |
Fraud Analysis
The Company is committed to preventing fraud and corruption and is developing an anti-fraud culture. To achieve this goal, the Company has committed to the following:
| 1. | Developing and maintaining effective controls to prevent fraud; |
| 2. | Ensuring that if fraud occurs a vigorous and prompt investigation takes place; |
| 3. | Taking appropriate disciplinary and legal actions; |
| 4. | Reviewing systems and procedures to prevent similar frauds; |
| 5. | Investigating whether there has been a failure in supervision and take appropriate disciplinary action if supervisory failures occurred; and |
| 6. | Recording and reporting all discovered cases of fraud. |
The following policies have been developed to support the Company’s goals:
| · | Insider Trading Policy |
| · | Managing Confidential Information Policy |
| · | Whistleblower Policy |
| · | Anti-corruption Policy |
All policies can be viewed in full on the Company’s website at www.goldenqueen.com
For the nine months ended September 30, 2018 and the year ended December 31, 2017, there were no reported instances of fraud.
Part II – Other Information
Item 1. Legal Proceedings
From time to time, we are a party to routine litigation and proceedings that are considered part of the ordinary course of our business. We are not aware of any material current, pending, or threatened litigation with respect to the Company.
Item 2. Unregistered Sales of Equity Securities and Use of Proceeds
Not applicable.
Item 3. Defaults Upon Senior Securities
Not applicable.
Item 4. Mine Safety Disclosures
GQM LLC is the operator of the Soledad Mountain mine (the “Project”), which is located in Mojave in Kern County, California. The mine safety disclosures required by section 1503(a) of the Dodd-Frank Wall Street Reform and Consumer Protection Act and Item 104 of Regulation S-K are included in Exhibit 95.1 of this Quarterly Report. There were no reportable incidents at GQM LLC during the three months ended September 30, 2018.
Item 5. Other Information
Not applicable.
| 31 |
Item 6. Exhibits
* Application has been made with the Securities and Exchange Commission to seek confidential treatment of certain provisions. Omitted materials for which confidential treatment has been requested has been filed separately with the Securities and Exchange Commission.
| 32 |
SIGNATURES
Pursuant to the requirements of the Securities Exchange Act of 1934, the registrant has duly caused this report to be signed on its behalf by the undersigned thereunto duly authorized.
Date: November 8, 2018
| GOLDEN QUEEN MINING CO. LTD. | |||
| (Registrant) | |||
| By: | /s/ Thomas M. Clay | ||
| Thomas M. Clay | |||
| Principal Executive Officer | |||
| By: | /s/ Guy Le Bel | ||
| Guy Le Bel | |||
| Principal Financial Officer | |||
| 33 |