Attached files
| file | filename |
|---|---|
| 8-K - FORM 8-K - Evolve Transition Infrastructure LP | d498238d8k.htm |
| EX-99.1 - EX-99.1 - Evolve Transition Infrastructure LP | d498238dex991.htm |
 Constellation Energy Partners LLC
Fourth Quarter and Full Year 2012
Earnings Presentation
March 5, 2013
Exhibit 99.2 |
 2
Forward-looking Statements Disclaimer
This presentation contains forward–looking statements that are subject to a number
of risks and uncertainties, many of which are beyond our control, which may
include statements about: the volatility of realized oil and natural gas prices; the conditions of the
capital markets, inflation, interest rates, availability of a credit facility to
support business requirements, liquidity, and general economic and political
conditions; the discovery, estimation, development and replacement of oil and natural gas reserves; our
business, financial, and operational strategy; our drilling locations; technology; our
cash flow, liquidity and financial position; the ability to extend or refinance
our reserve-based credit facility; the level of our borrowing base under our reserve-based credit facility;
the resumption or amount of our cash distributions; our hedging program and our
derivative positions; our production volumes; our lease operating expenses,
general and administrative costs and finding and development costs; the availability of drilling and
production equipment, labor and other services; our future operating results; our
prospect development and property acquisitions; the marketing of oil and natural
gas; competition in the oil and natural gas industry; the impact of the current global credit and economic
environment; the impact of weather and the occurrence of natural disasters such as
fires, floods, hurricanes, tornados, earthquakes, snow and ice storms and other
catastrophic events and natural disasters; governmental regulation, including environmental regulation,
and taxation of the oil and natural gas industry or publicly traded partnerships;
developments in oil-producing and natural gas producing countries; lack of
support from a sponsor; and our strategic plans, objectives, expectations, forecasts, budgets, estimates
and intentions for future operations. In some cases, forward–looking
statements can be identified by terminology such as “may,”
“could,” “should,” “expect,” “plan,”
“project,” “intend,” “anticipate,” “believe,” “estimate,” “predict,” “potential,” “pursue,”
“target,” “continue,” the negative of such terms or other
comparable terminology.
The forward–looking statements contained in this presentation are largely based on
our expectations, which reflect estimates and assumptions made by our
management. These estimates and assumptions reflect our best judgment based on currently known market
conditions and other factors. Although we believe such estimates and assumptions to be
reasonable, they are inherently uncertain and involve a number of risks and
uncertainties that are beyond our control. In addition, management’s assumptions about future events
may prove to be inaccurate. Management cautions all readers that the
forward–looking statements contained in this presentation are not
guarantees of future performance, and we cannot assure any reader that such statements will be realized or the forward–looking
events and circumstances will occur. Actual results may differ materially from
those anticipated or implied in the forward–looking statements due to
factors listed in the “Risk Factors” section in our SEC filings and elsewhere in those filings. All forward–looking
statements speak only as of the date of this presentation. We do not intend to publicly
update or revise any forward–looking statements as a result of new
information, future events or otherwise. These cautionary statements qualify all forward-looking
statements attributable to us or persons acting on our behalf.
|
 3
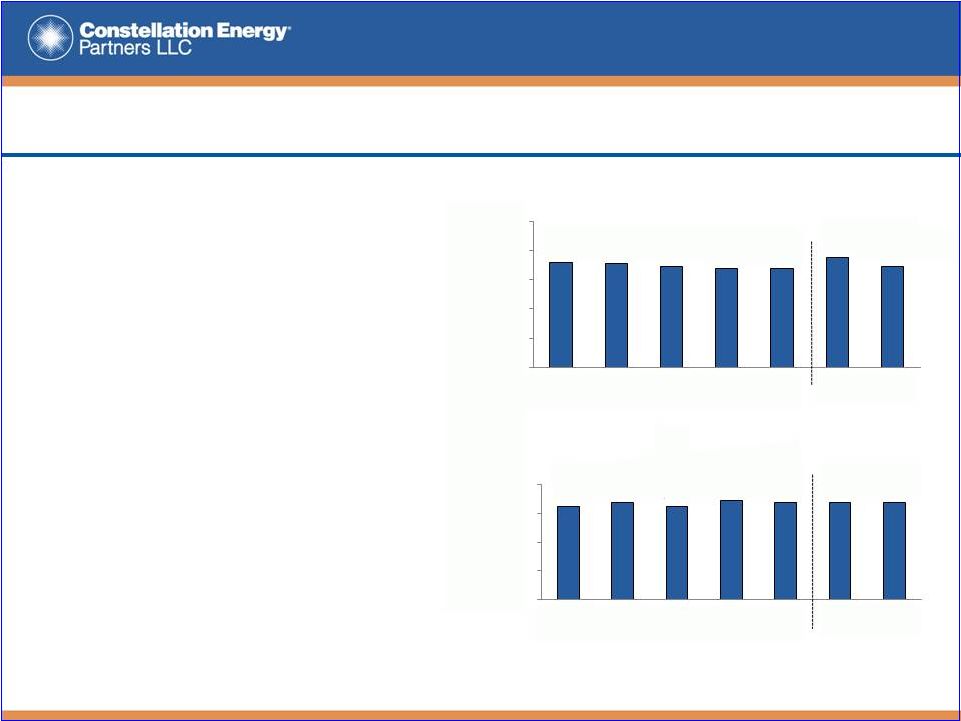
Updates
•
Q412 operating performance:
–
Average daily net production of 33.9 MMcfe
includes average daily net oil production of
approximately 396 Bbl, which is up 45% vs.
Q312
–
Operating cost of $3.38 per Mcfe, which is
down 2% vs. Q312
–
Resulted in $6.6 million in Adjusted EBITDA,
which is up 18% vs. Q312, for Adjusted
EBITDA of $24.5 million in 2012
•
Completed 38 net wells and
recompletions in Q412 resulting in
100 net wells and recompletions in
2012 with 18 additional net wells and
recompletions in progress at year-end
•
Capital
spending
of
$5.4
million
in
Q412 resulted in total capital spending
of $15.9 million in 2012
(1)
See Appendix
(1)
(2)
(2)
35.8
35.5
34.5
34.0
33.9
37.5
34.5
0.0
10.0
20.0
30.0
40.0
50.0
Q411
Q112
Q212
Q312
Q412
FY11
FY12
Average Daily Net Production
(MMcfe per day)
$3.26
$3.40
$3.24
$3.44
$3.38
$3.37
$3.37
$-
$1.00
$2.00
$3.00
$4.00
Q411
Q112
Q212
Q312
Q412
FY11
FY12
Operating Cost
($ per Mcfe)
Includes lease operating expenses, production taxes, general and administrative
expenses; excludes exploration costs and unit-based compensation program
expenses, which are non-cash items
|
 4
Robinson’s Bend Sale
•
Closed the sale of Robinson’s Bend
Field assets on February 28, 2013
–
Sale encompassed all of CEP’s assets in
the Black Warrior Basin
–
Under the terms of the agreement, a base
sale price of $63.0 million resulted in
$58.9 million in proceeds received at
closing
–
Allowing for estimated sales-related cost
impacts, net sales proceeds were
approximately $55.3 million
–
CEP used net sales proceeds to reduce
debt by $50.0 million
–
CEP is now $34.0 million drawn on a
borrowing base of $37.5 million (net debt
of approximately $21.9 million)
–
Since Q309, CEP has reduced debt
outstanding by $186.0 million or 85%
–
Decreased leverage allows CEP to remain
focused on the oil opportunities in our
Mid-Continent asset base
$ in millions
Amount
Sales Price (Dec. 1, 2012 Effective Date)
$63.0
NORM Deduction
-2.6
Adjustment for Dec. 1, 2012 Effective Date
-0.4
Escrowed Funds (NORM/NPDES)
-1.1
Proceeds Received at Closing
$58.9
Sales Commission
-0.9
Transaction Costs (Legal, Opinions, etc.)
-0.6
Swap Liquidation
-2.1
Net Sales Proceeds
$55.3
Debt Reduction
-50.0
Cash Retained at Closing
$5.3
Cash on Hand Prior to Closing
6.8
Proforma Cash on Hand at Closing
$12.1
Debt Outstanding at Closing
$34.0
Debt Outstanding (-) Proforma Cash on Hand at Closing
$21.9 |
 5
Our Continuing Focus on Oil Opportunities
•
Our
capital
program
has
been
focused
on
the
oil
potential
we
see
in
our
existing asset base and our most capital efficient recompletion opportunities
•
As a result of this focus, oil continues to be an increasingly important part of
our production mix
•
Drilling efforts are focused in the Pennsylvanian aged horizon with the
Burgess, Bartlesville, Red Fork and Skinner sandstones as primary targets
•
In 2013, we forecast capital spending of between $19.0 million and $21.0
million and anticipate that oil will account for about 15% of our production mix
(~ 548
Bbl/day)
and
about
50%
of
our
sales
revenue
*
*
Excludes hedge settlements, gains (losses) on mark-to-market activities, and
other revenue **
FY2013 Forecast oil production is based on the mid-point of CEP’s 2013
production forecast |
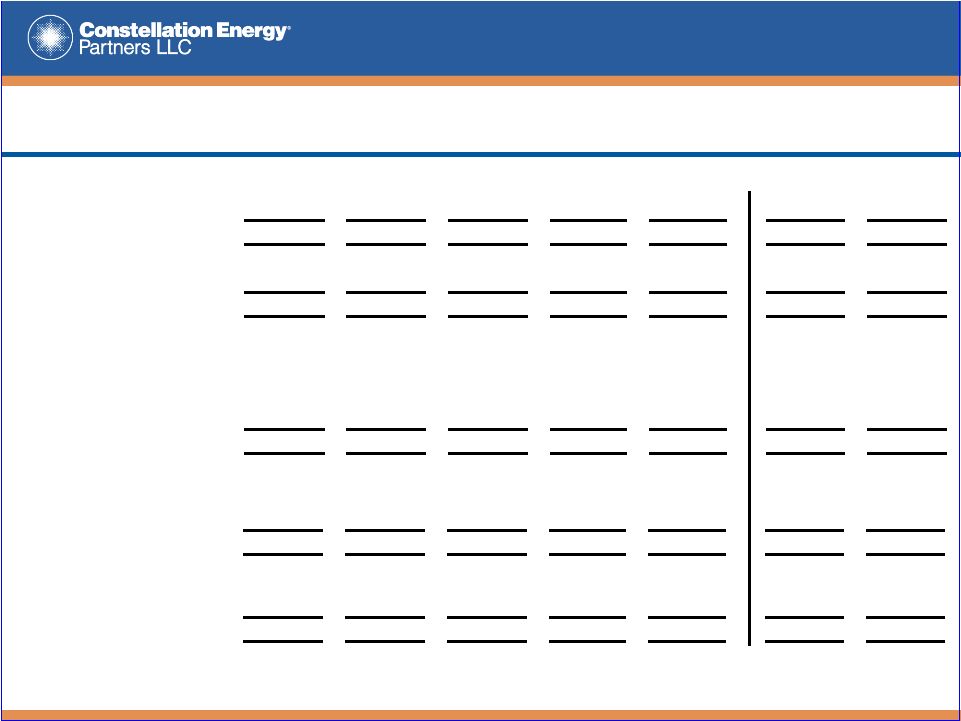
 6
Q412 Financial Results
19
(1)
Includes lease operating expenses, production taxes, general and administrative
expenses and unit-based compensation program expenses (2)
Includes loss (gain) on asset sale and exploration costs
(3)
Includes accretion expense and asset impairments
(4)
2011 results exclude $41.3 million in hedge settlements related to the company’s
Jun-11 hedge restructuring; including these hedge settlements, Adjusted EBITDA was $97.1 million
See Appendix
Q412 vs. Q312
Full Year
($ in 000’s unless noted)
Q412
Q312
2012
2011
Production (MMcfe)
3,119
3,126
12,613
13,679
Oil & Gas Sales
$17,521
$16,653
$68,041
$144,639
Gain (Loss) from Mark-to-Market Activities
(253)
(10,158)
(8,706)
(39,422)
Revenue
$17,268
$6,495
$59,335
$105,217
Operating Expenses
(1)
10,889
11,254
43,977
47,445
Cost of Sales
376
287
1,299
2,188
Other (Income) Expense
(2)
(33)
(21)
(147)
(99)
EBITDA
$6,036
$(5,025)
$14,206
$55,683
DD&A
(3)
81,148
4,604
95,016
25,981
Net Interest Expense
1,143
1,534
5,733
10,116
Net Income (Loss)
$(76,255)
$(11,163)
$(86,543)
$19,586
Adjusted EBITDA
$6,635
$5,639
$24,445
$55,257 |
 7
Net Asset Value ($ in millions)
*
Adjusted to reflect the sale of the Robinson’s Bend Field assets, which closed
February 28, 2013 (1)
Estimated by Netherland, Sewell & Associates in a report dated as of the last day
of the quarter shown using SEC reserve guidelines using a five year limit on
PUDs (2)
Based on (a) forward market prices on the last day of the quarter shown and (b) a 10%
discount rate (PV10) (3)
Current assets less current liabilities less the value of current risk management
balance sheet items (4)
Value of probable reserves is: Q412 $40.8 million
(5)
Value of possible reserves is: Q412 $14.5 million
(6)
Price
shown
is
as
of
the
market
close
on
the
last
day
of
trading
for
the
quarter
Quarter Ending:
Q412*
Value of Proved Reserves
(1),(2)
$116.4
+/-
Adjustments for:
Debt
-34.0
Working Capital
(3)
4.4
ARO
-7.7
Value of Hedges in Place
(2)
26.2
= Net Asset Value (NAV) --
Proved Reserves
(1),(2)
$105.3
÷
Units Outstanding
(millions)
24.2
= NAV/Unit --
Proved Reserves
(1),(2)
($/Unit)
$4.35
+ NAV/Unit --
Probable Reserves
(1),(2),(4)
($/Unit)
$1.69
+ NAV/Unit --
Possible Reserves
(1),(2),(5)
($/Unit)
$0.60
= NAV/Unit --
Total Reserves (3P)
(1),(2)
($/Unit)
$6.64 |
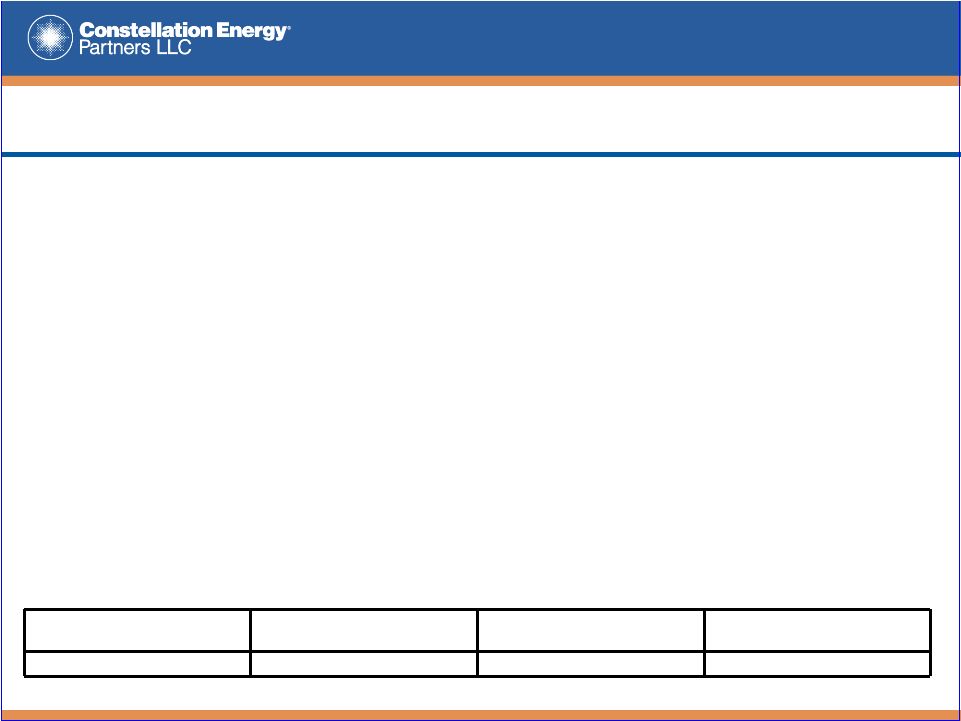
 G&A
Cost Reductions •
Changes that will impact our future operating results include:
–
Closure of our Tulsa, OK and Dewey, OK offices (employees relocated to our Skiatook,OK
field office)
–
Headcount reductions (impacts G&A and LOE)
–
Changes in compensation structure for employees and CEP’s board of managers
–
Changes in employee benefits structure
–
In-sourcing of accounting activities related to CEP’s Mid-Continent
assets –
Cancellation of the 2009 board advisory engagement with Tudor, Pickering, Holt & Co.
Securities, Inc.
(1)
Excludes LTIP
(2)
Excludes one-time cost of $0.8 million incurred in connection with headcount
reductions 33% Reduction Since
2010, Our First Full
Year Without a Sponsor
8
$18.6
$15.4
$14.6
$12.4
$0
$10
$20
2010
2011
2012
2013 Forecast
(Midpoint)
General & Administrative Costs
($ millions)
(2)
(1) |
 9
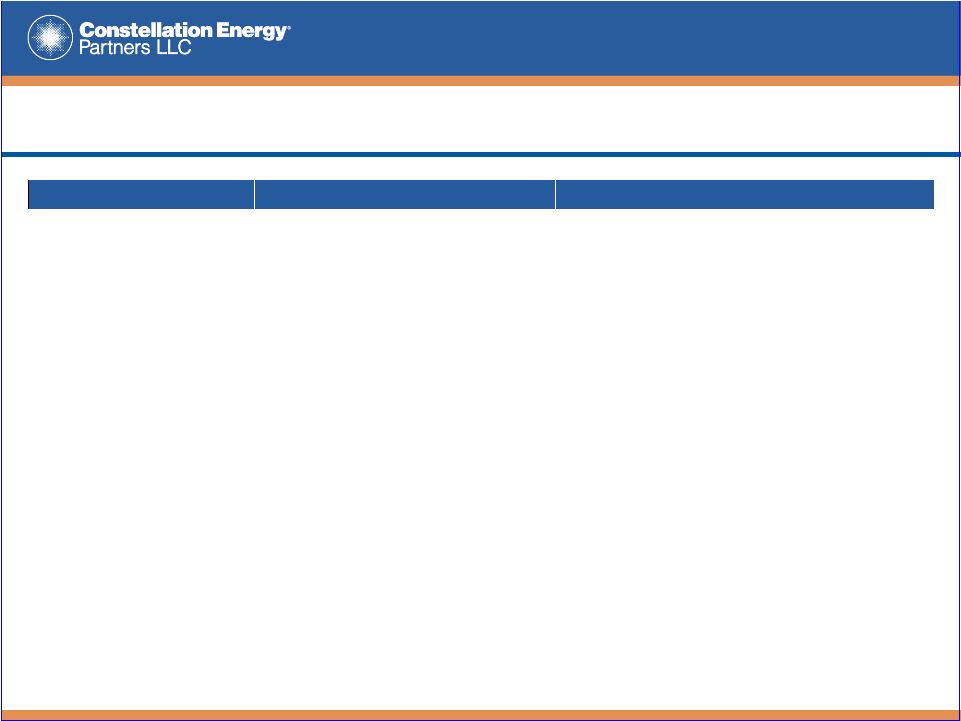
2013 Forecast
Forecast Component
2013 Forecast
Total Capital Spending
$19.0MM -
$21.0MM
Total Net Production
7.6 Bcfe –
8.6 Bcfe
Production Mix
Mcfe, Oil / Natural Gas
15% / 85%
Natural Gas
6.5 –
7.3 Bcfe
Oil
190,000 –
210,000 Bbls
Sales Revenue (Excludes Hedges)
Oil / Natural Gas
50% / 50%
NYMEX Hedges
Natural Gas
8.8 Bcfe at $5.59 per Mcfe
Basis Only Hedges
Mid-Con Basis –
Natural Gas
5.2 Bcfe at ($0.39) per Mcfe
WTI Hedges
Oil
147 Mbl at $96.28 per Bbl
Hedges as a % of Natural Gas Production
128%
(At Midpoint)
Hedges as a % of Oil Production
74%
(At Midpoint)
Differentials:
Mid-Con Natural Gas (Basis to NYMEX)
($0.14) per Mcfe
Mid-Con Oil (Marketing)
($2.50) per Bbl
Mid-Con Natural Gas (Gathering)
($0.50) per Mcfe
Operating Costs:
LOE
(1)
$17.0 MM –
$18.2 MM
Production Taxes
$1.6 MM -
$2.4 MM
G&A –
Corporate and Field Level
(2)
$12.8 MM -
$13.6 MM
Total
$31.4 MM -
$34.2 MM
Margin from Third Party Sales/Services
$1.75 MM -
$2.25 MM
Adjusted EBITDA
(3)
$23.0 MM -
$25.0 MM
Interest Expense
$2.0 MM
Maintenance Capital
$21.0 MM
(1)
Excludes exploration costs and unit-based compensation program expenses, which are
non-cash items (2)
Excludes unit-based compensation program expenses, which is a non-cash item;
Includes a one-time cost of $0.8 million incurred in connection with headcount reductions
(3)
We are unable to reconcile our forecast range of Adjusted EBITDA to GAAP net income or
operating income because we do not predict the future impact of adjustments to
net income (loss), such as (gains) losses from mark-to-market activities and
equity investments or asset impairments due to the difficulty of doing so, and we are unable to
address the probable significance of the unavailable reconciliation, in significant
part due to ranges in our forecast impacted by changes in oil and natural gas prices and
reserves which affect certain reconciliation items |
 Appendix |
 Cherokee Basin
Central Kansas Uplift
Woodford Shale
•
Proved reserves: 130 Bcfe
-
PDP as a % of total proved: 60%
-
Natural gas: 123 Bcfe (95%)
-
Oil: 1,042 MBbl (5%)
•
Net producing wells: 2,310
•
Net acres: over 727,000
•
Average working interest: 100% operated,
50% non-operated
•
Average net revenue interest: 80% operated,
40% non-operated
•
Pricing: ONEOK, Southern Star, CEGT East,
NGP MidCon, PEPL, WTI
•
Proved reserves: ~ 0.2 Bcfe
-
PDP as a % of total proved: 100%
-
Oil: 38 MBbl (100%)
•
Net producing wells: 6
•
Net Acres: approximately 893
•
Non-operated
•
Average working interest: 20%
•
Average net revenue interest: 16%
•
Pricing: WTI
•
Proved reserves: ~ 6 Bcfe
-
PDP as a % of total proved: 100%
-
Natural gas: 6 Bcfe (100%)
•
Net producing wells: 9
•
Net Acres: N/A, wellbores
•
Non-operated
•
Average working interest: 11%
•
Average net revenue interest: 9%
•
Pricing: CEGT East
11
Portfolio Summary
Statistics as of December 31, 2012; excludes assets divested in Q113; reserve values are
estimates based on forward prices on December 31, 2012; numbers may not add due to rounding
Portfolio
Existing Reserves
•
Total: 402 Bcfe
•
Proved reserves, total: 136 Bcfe
•
Proved oil reserves: 1,080 MBbl
•
Proved gas reserves: 129 Bcfe
•
Proved developed as a % of
total proved reserves: 62%
•
Proved R/P ratio: 17 years
•
Probable reserves, total: 119 Bcfe
•
Probable oil reserves: 876 MBbl
•
Probable gas reserves: 114 Bcfe
New Activity
•
Drilling focus: Cherokee Basin oil
opportunities in the Pennsylvanian aged
horizon with the Burgess, Bartlesville, Red
Fork and Skinner sandstones as primary
targets
•
New well costs: $170,000 to $450,000
•
Initial daily production,
new wells: 1 to 40 Bbl
•
Well depths: 700 to 2,700 feet
•
Well spacing: 10 to 160 acres
•
Recompletion costs: $45,000 to $65,000
•
Incremental daily production,
recompletions: 1 to 15 Bbl |
 12
Natural Gas Hedge Positions
(1)
(1)
As of March 5, 2013
(2)
NYMEX
(3)
Excludes an offset trade executed on 1,041,814 MMBtu at a fixed price of $3.662; this
trade will settle financially over the course of the year against the fixed price trades shown
NOTE: The company accounts for derivatives using the mark-to-market
accounting method. Fixed Price Swaps
(2)
MMBtu Hedged
Weighted Average Sales Price ($/MMBtu)
BOY 2013
6,187,500
5.75
(3)
2014
6,387,500
5.75
2015
1,839,490
4.30
Basis Swaps
MMBtu Hedged
Weighted Average Sales Price ($/MMBtu)
BOY 2013
3,832,587
0.39
2014
4,443,677
0.39 |
 13
Oil Hedge Positions
(1)
Fixed Price Swaps
Bbl Hedged
Weighted Average Sales Price ($/Bbl)
BOY 2013
106,757
$96.31
2014
113,127
$94.02
2015
87,680
$93.53
2016
66,117
$85.50
(1)
As of March 5, 2013
NOTE: The company accounts for derivatives using the mark-to-market
accounting method. |
 14
Non-GAAP Financial Measures
Use of Non-GAAP Financial Measures:
EBITDA and Adjusted EBITDA are non-GAAP financial measures that are reconciled to
their most comparable GAAP financial measure under Reconciliation of
Non-GAAP Financial Measures in this presentation. The reconciliations are only intended to be reviewed in
conjunction with the oral presentation to which they relate.
EBITDA is defined as net income (loss) adjusted by interest (income) expense, net;
depreciation, depletion and amortization; write-off of deferred financing
fees; asset impairments; and accretion expense. Adjusted EBITDA is defined as EBITDA adjusted by (gain) loss on
sale of assets; exploration costs; (gain) loss from equity investment; unit-based
compensation programs; (gain) loss from mark-to-market activities; and
unrealized (gain) loss on derivatives/hedge ineffectiveness. Although not presented herein, we define Distributable Cash
Flow as Adjusted EBITDA less maintenance capital expenditures and cash interest
expense. Maintenance capital expenditures are capital expenditures
that
we
expect
to
make
on
an
ongoing
basis
to
maintain
our
asset
base
(including
our
undeveloped
leasehold
acreage)
at
a
steady
level
over
the
long
term.
These
expenditures
include
the
drilling
and
completion
of
additional
development
wells
to
offset
the
expected production decline during such period from our producing properties, as well
as additions to our inventory of unproved properties or proved reserves required
to maintain our asset base. These
financial
measures
are
used
as
a
quantitative
standard
by
our
management
and
by
external
users
of
our
financial
statements
such
as investors, research analysts and others to assess the financial performance of our
assets without regard to financing methods, capital structure
or
historical
cost
basis;
the
ability
of
our
assets
to
generate
cash
sufficient
to
pay
interest
costs
and
support
our
indebtedness;
and our operating performance and return on capital as compared to those of other
companies in our industry, without regard to financing or capital
structure. These financial measures are not intended to represent cash flows for the period, nor are they presented
as a substitute for net income, operating income, cash flows from operating activities
or any other measure of financial performance or liquidity presented in
accordance with GAAP. Summary of Non-GAAP Financial Measures:
Non-GAAP Measure
Slide(s) Where Used in
Presentation
Most Comparable GAAP Measure
Slide Containing Reconciliations
Adjusted EBITDA, EBITDA
3, 6
Net Income
15 |
 Reconciliation Items
15
(1)
Includes accretion expense and asset impairments
(2)
YTD 2011 results include $41.3 million in hedge settlements related to the
company’s Jun-11 hedge restructuring (3)
Includes lease operating expenses, production taxes, general and administrative
expenses, exploration costs, and unit-based compensation program expenses
Reconciliation of Net Income (Loss)
to Adjusted EBITDA ($ in 000s)
YTD
2012
Q412
Q312
Q212
Q112
YTD
2011
Q411
Net income (loss)
$(86,543)
$(76,255)
$(11,163)
$(5,010)
$5,885
$19,586
$15,127
Interest (income) expense, net
5,733
1,143
1,534
1,437
1,619
10,116
1,186
DD&A
(1)
95,016
81,148
4,604
4,550
4,714
25,981
5,745
EBITDA
$14,206
$6,036
$(5,025)
$977
$12,218
$55,683
$22,058
(Gain) loss on sale of assets
7
7
--
(4)
4
19
(10)
Exploration costs
--
--
--
--
--
131
--
Unit-based compensation programs
1,526
339
506
394
287
1,341
317
(Gain) loss from mark-
to-market activities
(2)
8,706
253
10,158
4,897
(6,602)
39,422
(8,524)
Adjusted EBITDA
$24,445
$6,635
$5,639
$6,264
$5,907
$96,596
$13,841
Operating Expense
to Operating Cost ($/Mcfe)
YTD
2012
Q412
Q312
Q212
Q112
YTD
2011
Q411
Operating expenses
(3)
$3.49
$3.49
$3.60
$3.37
$3.49
$3.48
$3.36
Less:
Exploration costs
--
--
--
--
--
0.01
--
Less:
Unit-based compensation
incl. in operating expense
$0.12
0.11
0.16
0.13
0.09
0.10
0.10
Operating cost
$3.37
$3.38
$3.44
$3.24
$3.40
$3.37
$3.26 |