Attached files
| file | filename |
|---|---|
| 8-K - 8-K - VISTEON CORP | d467912d8k.htm |
 Delivering Value
Deutsche Bank Global Auto Industry Conference
January 15, 2013
Exhibit 99.1
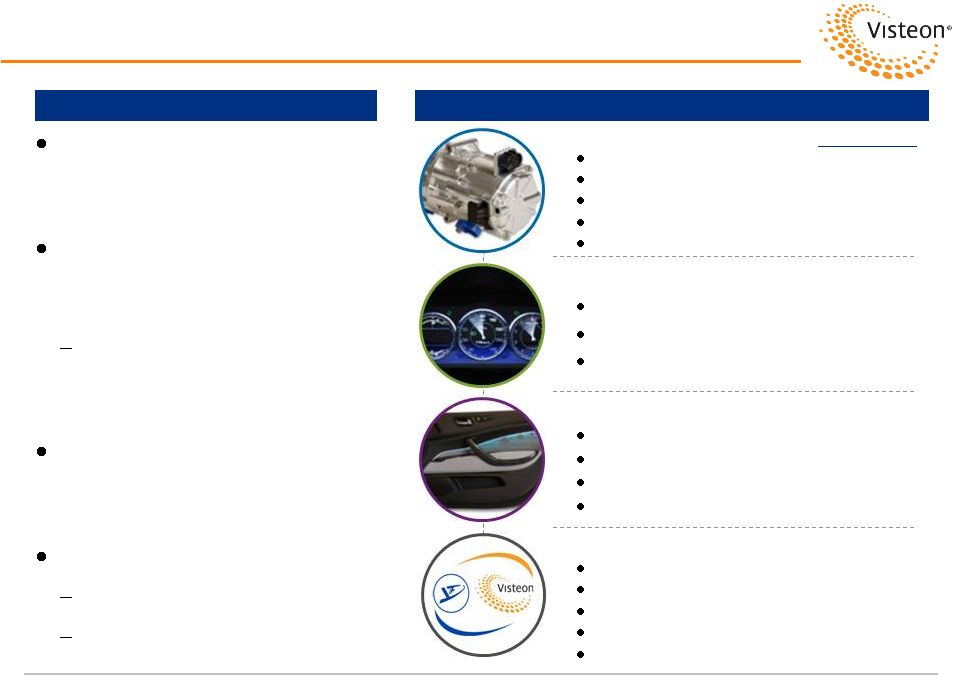
Halla Visteon Climate Control
Yanfeng Visteon
Electronics
Interiors
Our Family
of Businesses |
 Page 2
This
presentation
contains
"forward-looking
statements"
within
the
meaning
of
the
Private
Securities
Litigation
Reform
Act
of
1995. Forward-looking statements are not guarantees of future results and
conditions but rather are subject to various factors, risks and
uncertainties that could cause our actual results to differ materially from those expressed in these forward-
looking statements, including, but not limited to,
Caution should be taken not to place undue reliance on our forward-looking
statements, which represent our view only as of the
date
of
this
presentation,
and
which
we
assume
no
obligation
to
update.
our ability to satisfy future capital and liquidity requirements; including our
ability to access the credit and capital markets at the times and in the
amounts needed and on terms acceptable to us; our ability to comply with financial
and other covenants in our credit agreements; and the continuation of acceptable
supplier payment terms; our ability to satisfy pension and other
post-employment benefit obligations; our ability to access funds
generated by foreign subsidiaries and joint ventures on a timely and cost-effective basis;
our ability to execute on our transformational plans and cost-reduction
initiatives in the amounts and on the timing contemplated;
conditions within the automotive industry, including (i) the automotive vehicle
production volumes and schedules of our customers, (ii) the financial
condition of our customers or suppliers and the effects of any restructuring or
reorganization plans that may be undertaken by our customers or suppliers or work
stoppages at our customers or suppliers, and (iii) possible disruptions in
the supply of commodities to us or our customers due to financial distress,
work stoppages, natural disasters or civil unrest;
new business wins and re-wins do not represent firm orders or firm commitments
from customers, but are based on various assumptions, including the timing
and duration of product launches, vehicle production levels, customer price
reductions and currency exchange rates;
general
economic
conditions,
including
changes
in
interest
rates
and
fuel
prices;
the
timing
and
expenses
related
to
internal restructurings, employee reductions, acquisitions or dispositions and the
effect of pension and other post- employment benefit obligations;
increases in raw material and energy costs and our ability to offset or recover
these costs, increases in our warranty, product liability and recall costs
or the outcome of legal or regulatory proceedings to which we are or may become a
party; and
those factors identified in our filings with the SEC (including our Annual Report
on Form 10-K for the fiscal year ended December 31, 2011).
Forward-Looking Information |
 Page 3
Because not all companies use identical calculations, Adjusted EBITDA, Adjusted EPS
and Free Cash Flow used throughout this presentation may not be comparable
to other similarly titled measures of other companies.
In order to provide the forward-looking non-GAAP financial measures for
full-year 2012 and 2013, the Company is providing reconciliations to the
most directly comparable GAAP financial measures in the Appendix of this
presentation. The provision of these comparable GAAP financial
measures is not intended to indicate that the Company is explicitly or
implicitly providing projections on those GAAP financial measures, and actual
results for such measures are likely to vary from those presented. The
reconciliations include all information reasonably available to the Company
at the date of this presentation and the adjustments that management can
reasonably predict. Use of Non-GAAP Financial Information
|
 Page 4
Today We Will …
Present Visteon at a glance
Review 2012 key accomplishments
Provide update on Halla Visteon Climate Control (HVCC)
transaction progress
Offer additional Yanfeng Visteon insight
Discuss 2012 performance
Announce 2013 full-year guidance |
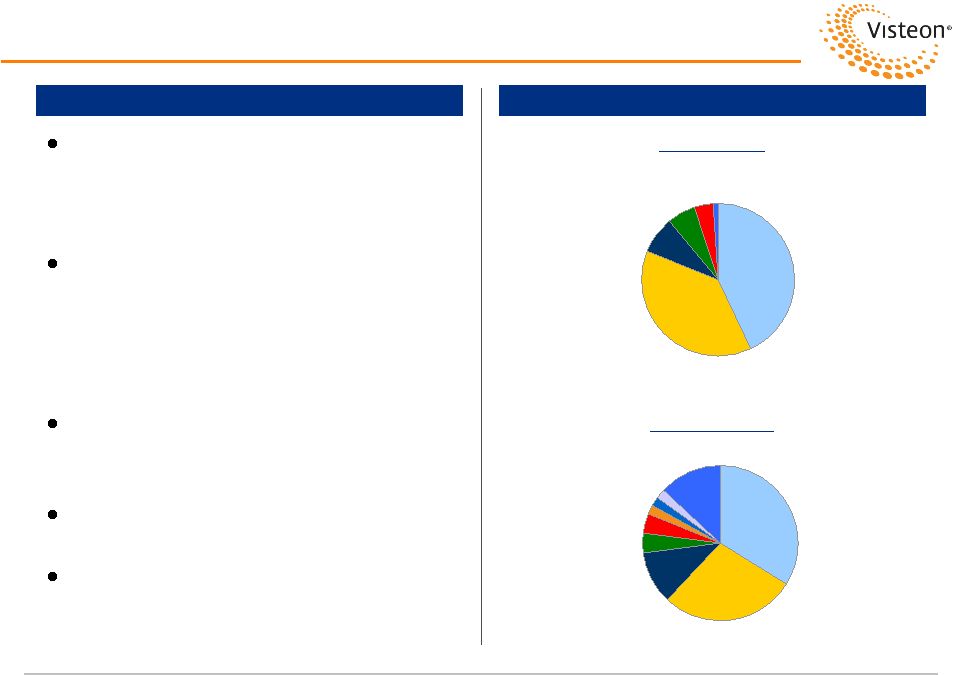
 Overview
Key Businesses
Global auto supplier of
climate, electronics and
interiors products
Worldwide manufacturing /
engineering footprint with
emphasis on low-cost regions
172 facilities in 28 countries
including non-consolidated
joint ventures
(1)
Strategically positioned to
capitalize on emerging-
market growth
2012 estimated sales:
$6.8 billion consolidated
$15.4 billion including JVs
(1)
$4.3 Billion
Climate
HVAC Systems
Powertrain Cooling
EV & Hybrid Battery Cooling
Compressors
Fluid Transport
Interiors
Cockpit Modules
Instrument Panels
Consoles
Door Trim
Electronics
Audio and Infotainment
Information and Controls
Vehicle Electronics
Visteon in Summary
$1.2 Billion
$1.4 Billion
2012E Sales
Page 5
Yanfeng Visteon
Interiors
Electronics
Seating
Exteriors
Safety
$7.1 Billion
Non-Consolidated
(1) Includes all non-consolidated joint ventures. For Yanfeng Visteon
sales, includes full year of Yanfeng seating sales as well as full year of Yanfeng Exterior and Safety sales. |
 2012
Achievements Announced and implemented strategic plan to create value for
stakeholders Initiated $100 million restructuring program to further reduce
fixed-cost structure, right-size operations and address
underperforming assets Completed several value-creating strategic and
financial actions Closed
Cadiz
plant
in
Spain
Sold Grace Lake Corporate Center
Divested Lighting operations
Sold R-TEK Interiors joint venture
Announced transaction to combine Visteon Climate w/ Halla
Concluded lump-sum pension buyout offer, used $301 million
in pension assets to reduce PBO by $411 million
Redeemed $50 million of bonds
Repurchased $50 million of stock
Visteon Continues to Lay the Groundwork for Shareholder Value Enhancement
Page 6
February
April
August
August
September
December
December
November |
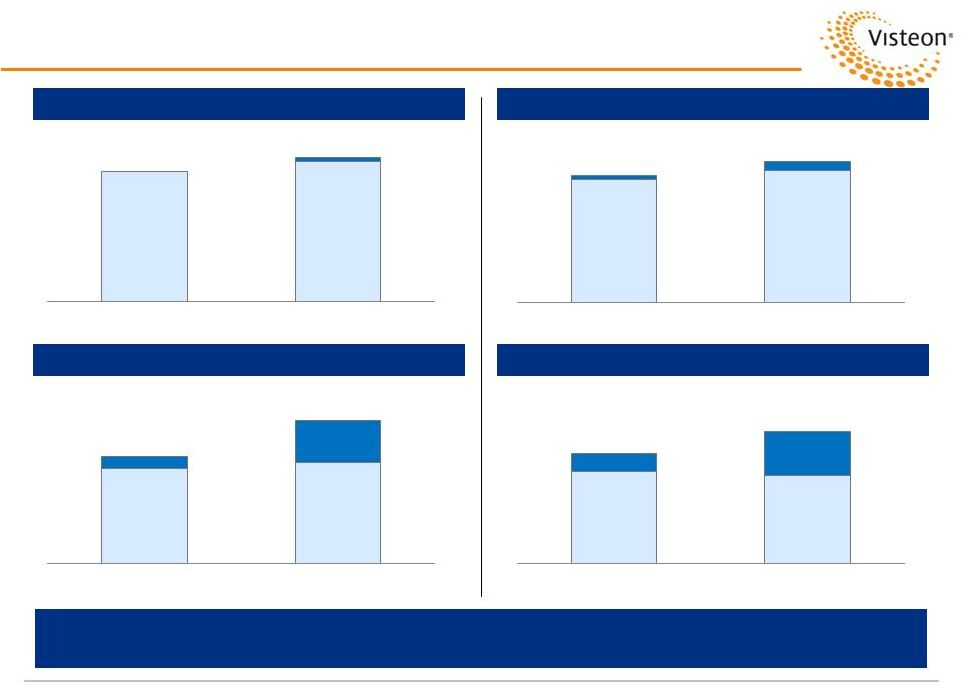
 Page 7
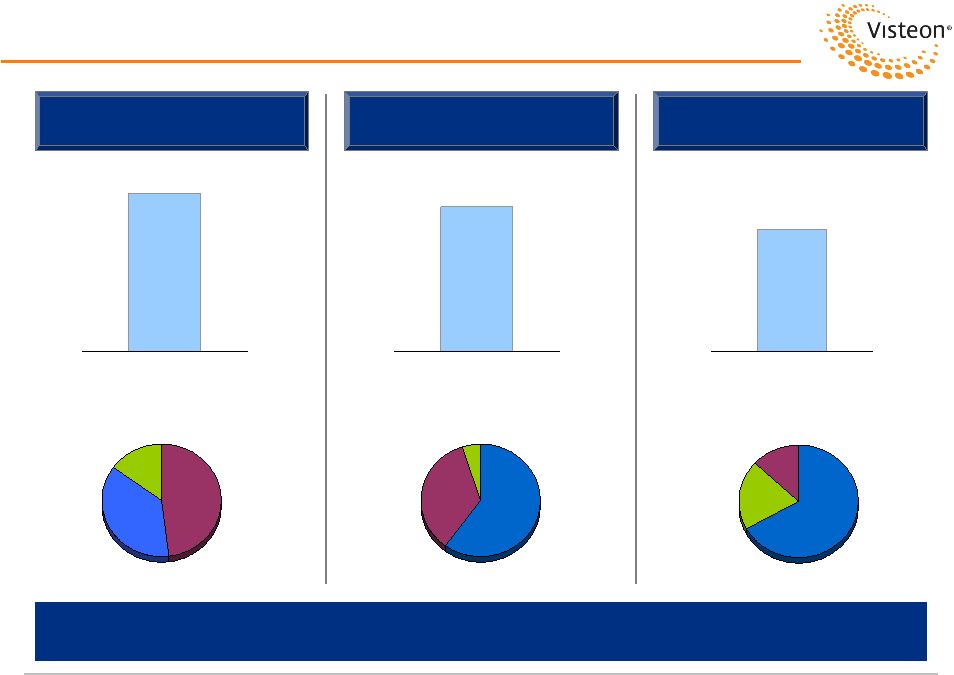
2012 New Business Wins
(Dollars in Millions)
$450
2012
($210)
2012
$750
2012
During
2012,
Visteon
was
Awarded
Approximately
$1
Billion
of
Net
New
Business,
Which Will Launch During the Next Five Years
Incremental New
Business Wins
Re-Wins
Lost Business
Climate
60%
Interiors
5%
Electronics
35%
Climate
67%
Electronics
13%
Interiors
20%
Electronics
48%
Interiors
15%
Climate
37% |
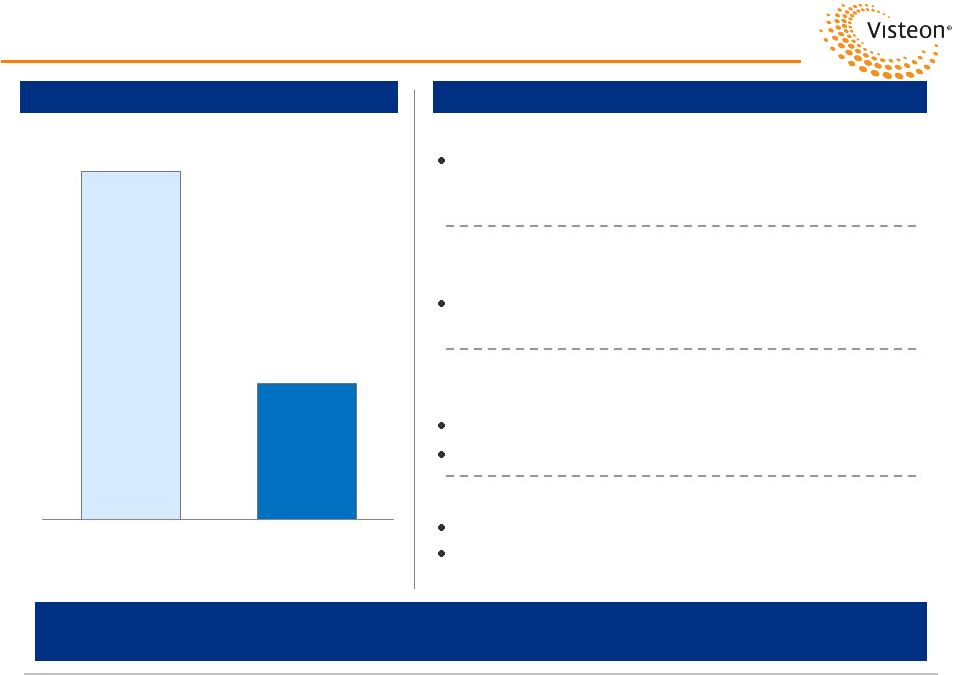
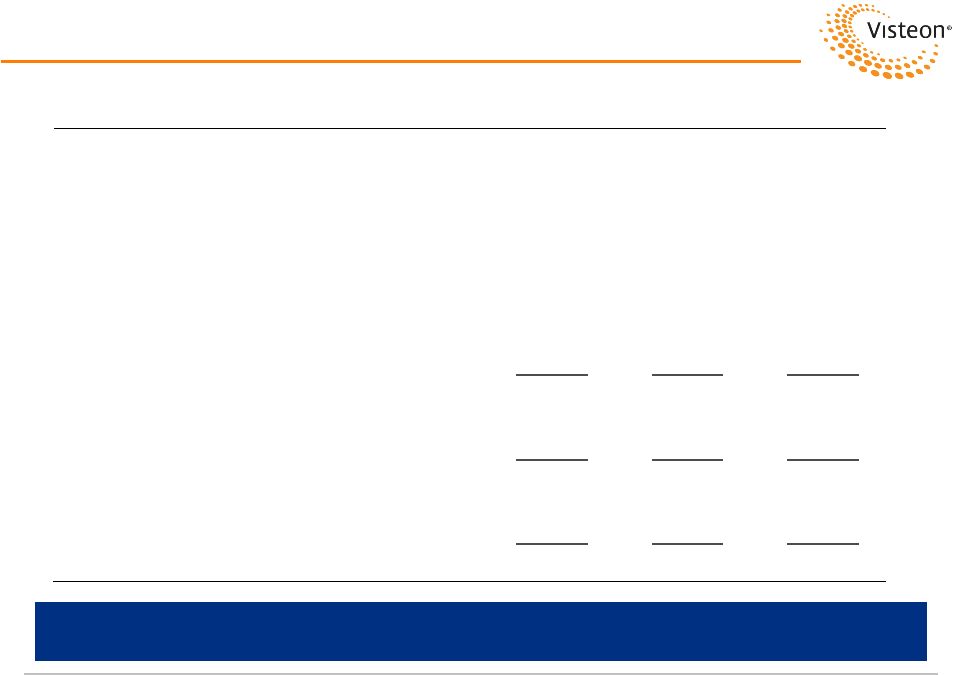
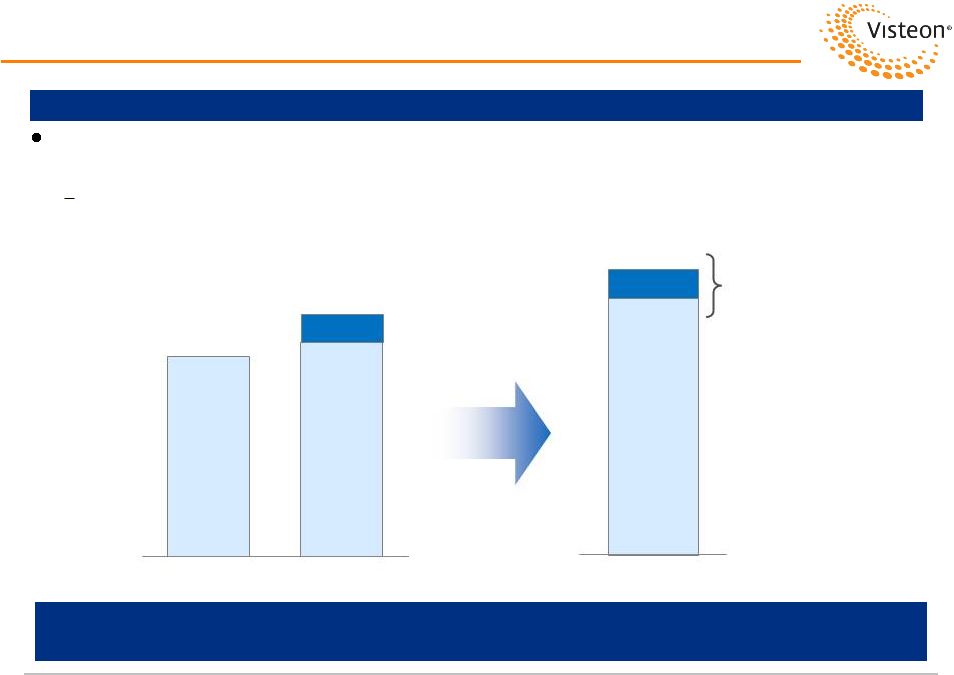 Backlog Fuels Visteon Future Growth
Visteon’s $800 Million Net Backlog Will Launch During the Next Three
Years and is Forecasted to Drive Sales Growth to $8.2 Billion by 2015
Page 8
$6.8B
$7.4B
$8.2B
Base
Including
Volume,
Currency,
Pricing
Net Backlog
Visteon Sales and Net Backlog
Addt’l Net
Backlog
Net backlog:
incremental new business net of lost business that will launch
during the next three years
Base
Including
Volume,
Currency,
Pricing
$0.8B
Total Net
Backlog
2015E Sales
2012E Sales
2013E Sales
0.4
0.4
Incremental new business includes 2012 wins as well as wins recognized in previous
years |
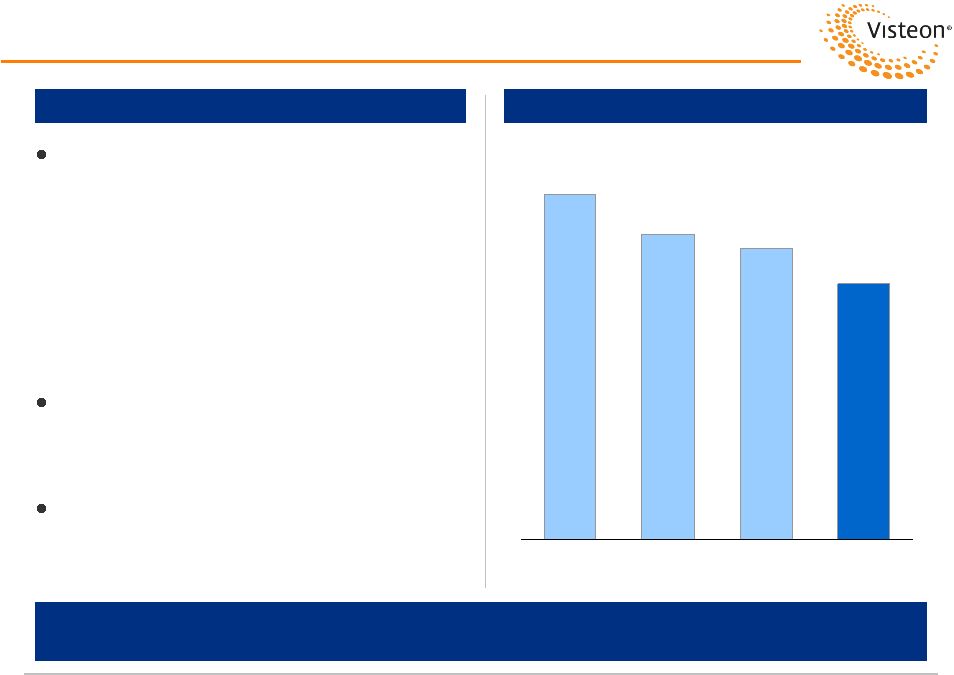 Fixed-Cost and SG&A Actions –
An Update
Initiative Underway to Reduce 2013 Fixed Costs and SG&A Expense to $410
Million Page 9
Visteon announced during its third
quarter 2012 earnings call a focused
plan to further reduce SG&A and other
fixed costs
–
“Other fixed costs”
include
information technology costs and
other costs of goods sold supporting
engineering staff
Achieved savings in 2012 and expect
an additional $20 million in efficiencies,
net of unfavorable currency in 2013
Savings will drive year-over-year SG&A
improvement in 2013 and 2014
$485
$430
$410
2011
2012E
2013E
Goal
(Dollars in Millions)
Fixed-Cost and SG&A Reduction Plan
Fixed-Costs and SG&A Spend
(1)
$340-$380
(1) Adjusted to exclude Lighting. |
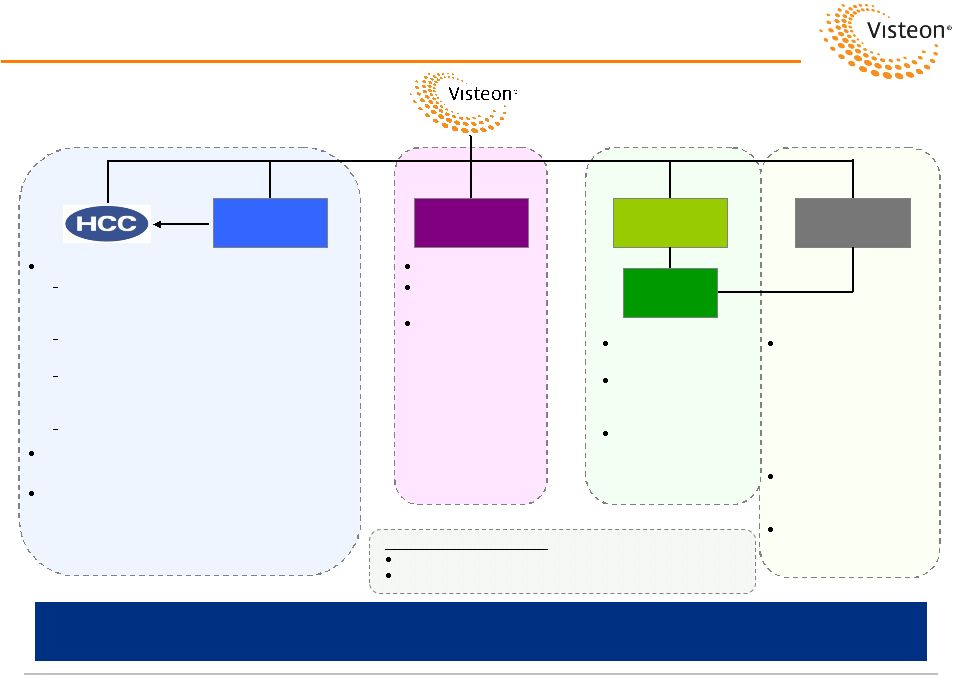 Page 10
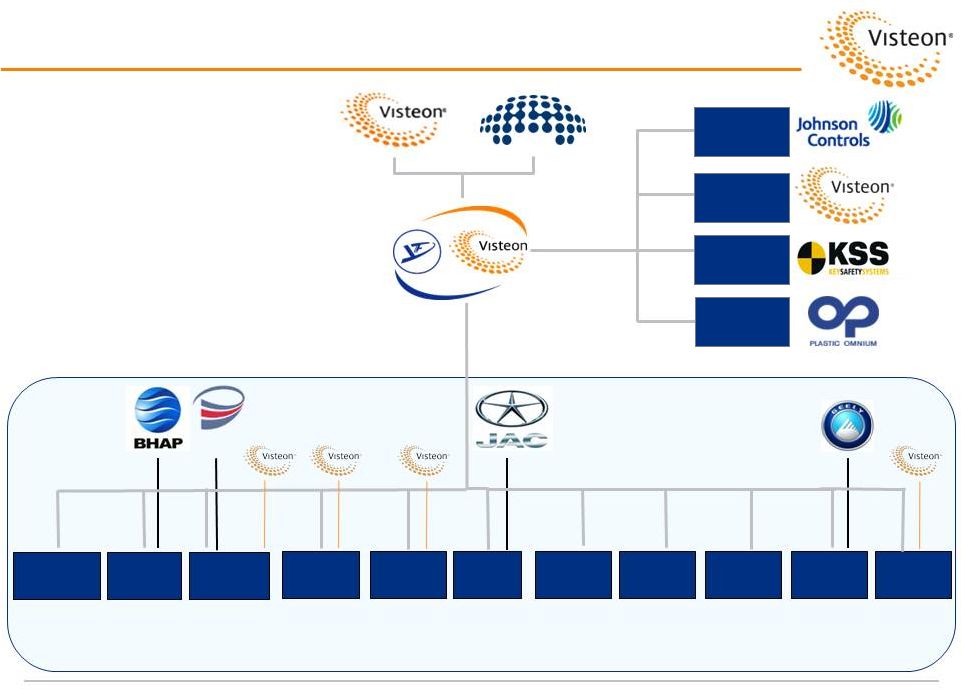
Visteon’s Strategic Plan –
The Value of Optionality
Visteon
Climate
Yanfeng
Visteon
70%
100%
50%
100%
100%
Visteon
Interiors
Visteon
Electronics
Contribute Visteon Climate to HCC for cash
Establishes “Halla Visteon Climate Control”
(HVCC) as single consolidated climate entity
with leadership of all global climate operations
Consolidation of these two operations into one
has been a major customer request
Headquartered in Korea with global customer
presence and Korean leadership supported by
international management team
Visteon remains equity holder (70%) in HVCC
Transfer limited SG&A and operating resources to
make business globally self-capable
Target transaction completion during Q1 2013
Remains non-core
Continue to pursue
options
Interiors will be
exited at a time
when value
objectives are met
#5 global market
position
Significant integration
and technology
synergies with YFVE
Focused on
optimizing global
scale and ownership
YFV
Electronics
60%
40%
YFV and affiliated
Yanfeng Visteon
Electronics represent a
dynamic marriage of
global presence with
Asian-centric power,
low-cost operations and
technological prowess
Core YFV business is
Interiors, which is non-
core to Visteon
Uncover value for
Visteon shareholders
Comprehensive Plan to Create Value for Customers and Shareholders
Corporate Right-sizing
Minimal footprint
Staff
businesses
with
lean
and
only
“necessary”
support |
 Halla Visteon Climate Control
Yanfeng Visteon
Electronics
Interiors
Our Family
of Businesses
Halla Visteon Climate Control (HVCC)
A Value-Creating Joint Venture
Deutsche Bank Global Auto Industry Conference
January 15, 2013 |
 Page 12
HVCC Transaction Update
Pro forma entity name changed to “Halla Visteon Climate Control”
Visteon to contribute majority of Visteon Climate business to Halla for cash
(small portion of business retained by Visteon)
Definitive agreement signed on January 11, 2013
$410 million gross proceeds to Visteon, financed by conservative
mix of
cash and debt at Halla
Estimated $353 million proceeds after purchase price adjustments
(i.e.
pension, debt, cash), taxes and fees
Accretive to Halla shareholders on EPS and EBITDA multiple basis
Diligence, negotiations and signing completed in less than 100 days after
announcement
Closing on track to be completed during first quarter 2013
Transition / integration work progressing
Proceeding as Expected |
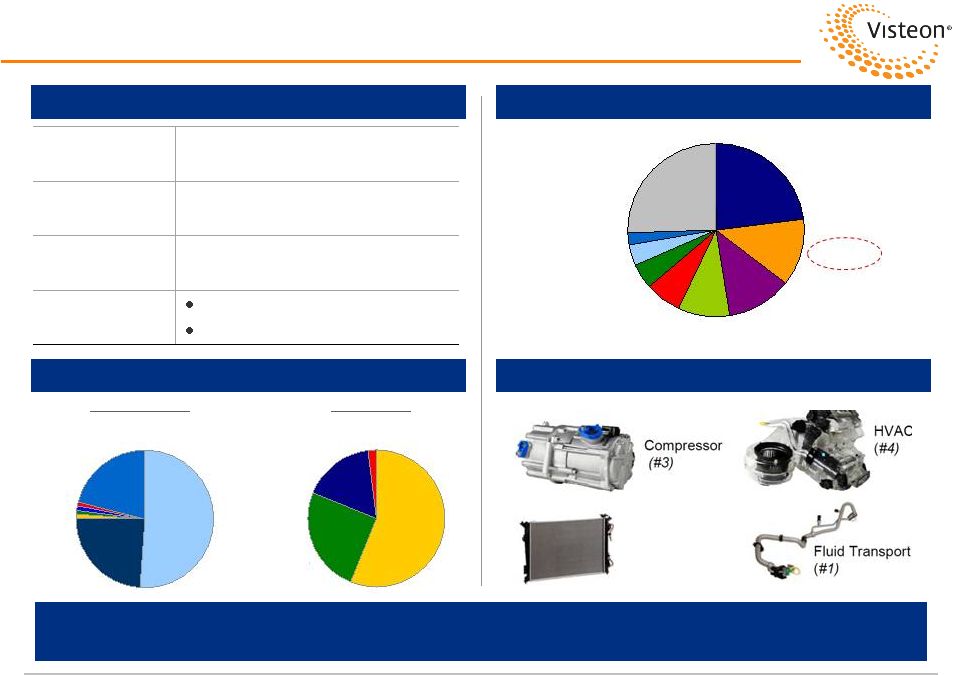 A
Valuable Organization Expected HVCC Financial Profile
Page 13
Overview
2012E
Climate
Global
Market
Share
(2)
Hyundai /
Kia
51%
Chrysler 1%
Suzuki 1%
VW 1%
Mazda1%
2012E
Sales
(1)
$4.1 Billion
2012E EBITDA
Margin
(1)
9.0%
Headcount
13,350
Mfg Facilities
Consolidated
26
Unconsolidated
6
By Customer
By Region
2012E Sales Breakdown
Key
Products
and
Market
Positions
(2)
HVCC
13%
Denso
23%
Valeo
12%
Delphi
7%
Behr
10%
Calsonic 5%
Other
24%
Modine 2%
Sanden 4%
Powertrain and EV /
Hybrid Cooling
(#4)
AP
56%
EU
25%
NA
17%
SA
2%
Other
21%
Ford
24%
(1)
HVCC represents total Climate segment estimated results minus those Climate operations that will be
retained. EBITDA margin excludes equity income and non-controlling interests. (2)
IHS unconsolidated unit share.
|
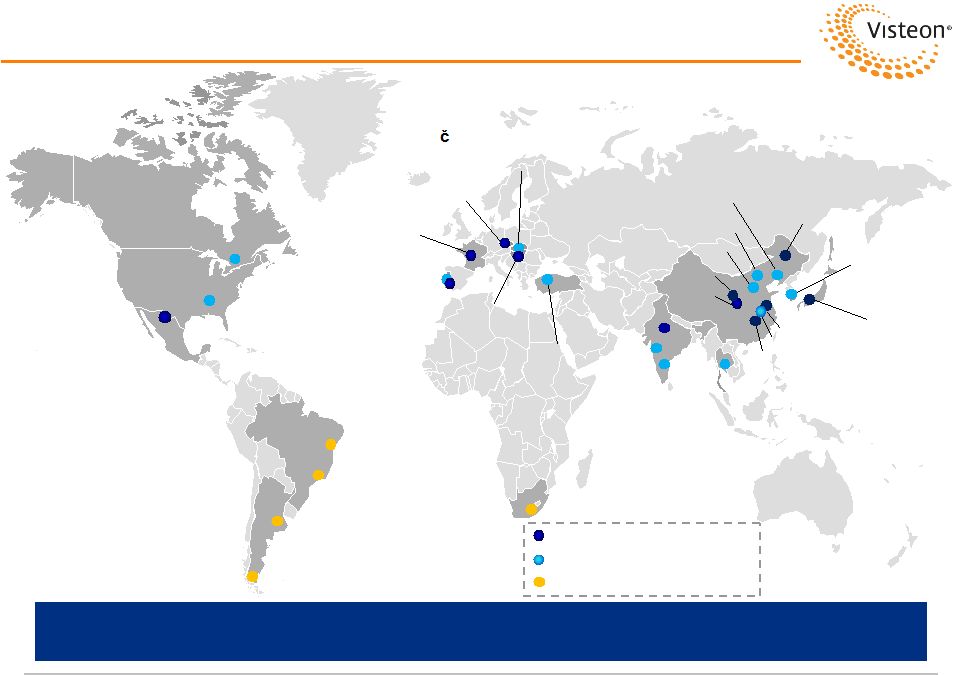 Page 14
The HVCC Manufacturing Footprint
Visteon in HVCC Perimeter
Halla
Visteon Transition Facilities
Low-Cost, Global Manufacturing Footprint Focused in Asia –
32 Manufacturing Sites Globally, Including Affiliates
Juarez (3 Plants)
MEXICO
São Paulo
BRAZIL
Quilmes
ARGENTINA
Belleville
CANADA
Shorter, AL
USA
Port Elizabeth
SOUTH AFRICA
Palmela (2)
PORTUGAL
Charleville
FRANCE
Nový
Ji
in,
Hluk,
Rychvald
CZECH REP
Szekesfehervar
HUNGARY
Ilava
SLOVAKIA
Gebze
TURKEY
Chennai
Bhiwadi
INDIA
Pune
Hiroshima,
Hofu
JAPAN
Rayong
THAILAND
Daejeon,
Pyeongtaek,
Ulsan
S. KOREA
Dalian
CHINA
Chongqing
Beijing
Wuhu
Changchun
Nanjing
Jinan
Chengdu
Nanchang
Rio Grande
Camaçari |
 Offer Full Range of Climate Products
Compressors
Powertrain
Cooling
EV &
Hybrid
Battery
Cooling
Fluid
Transport
HVAC
Page 15 |
 Key
Technologies Drive Strong Order Book and Awards Page 16
Strong Backlog Drives Sales
Recognized by Our Customers and Industry Experts
HVCC 3-year backlog of $700
million
–
Represents new business,
net of lost business
Strong backlog, higher
volumes and currency
impacts drive 7% forecasted
sales CAGR through 2015
2013E
2014E
2015E
3-Year Backlog
$700 Million |
 Page 17
HVCC Positioned to Fuel Growth
Clear #2 global Climate player, with 13% market share
Customer-focused solutions provider with worldwide presence
Leading product and technology portfolio
One of only two “full-line”
suppliers
Low-cost, Asian-centric manufacturing footprint
Strong balance sheet and cash flow profile
$700 million three-year backlog
Gaining share in growing markets
A World-Class Climate Organization |
 Halla Visteon Climate Control
Yanfeng Visteon
Electronics
Interiors
Our Family
of Businesses
Growth in China and Abroad
Deutsche Bank Global Auto Industry Conference
January 15, 2013 |
 Page 19
Yanfeng Visteon (YFV) Today
50% / 50% joint venture between
Visteon / HASCO (SAIC)
in China,
established in 1994
One of the largest auto suppliers in
China
with five primary businesses
–
Interiors, electronics, seating,
exteriors and safety
SVW, SGM and SAIC represent
about 65% of sales; export 11%
96 facilities and 29,000 employees
2012E total revenues of $7.1 billion
By Customer
SVW
34%
SGM 28%
SAIC 4%
Export
11%
Other 13%
CAFM 4%
JAC 2%
DF Nissan 2%
DPCA 2%
By Product
Overview
2011 Sales Breakdown
Interiors
43%
Seating
38%
Electronics
8%
Exterior
6%
Safety
4%
Tooling
1% |
 Page 20
YFV Structure
•
50% / 50% JV between
Visteon and HASCO (SAIC)
YFV
Beijing
2002
YFV
Tooling
2006
Dongfeng
Visteon
2003
YFV
Jinqiao
2004
60%
YFV
Electronics
2002
50%
2004
YF Key
Safety
50%
YFPO
Exterior
2007
YFV
Hefei
2007
YFV
Jiqiang
2008
YFV
Nanjing
2010
YFV
NJ FEM
2010
YFV
Zhejiang
2011
50%
YFJCI
Seating
1997
•
Technology JVs with
international partners
YFV
Chongqing
2001
•
Interior subsidiaries and
JVs with OEMs to expand
outside of Shanghai
YFV
India
2011
DETC
75%
50%
40%
75%
80%
51%
80%
80%
60%
99%
50%
20%
12.5%
25%
50%
50%
50%
Interiors Operations |
 Page 21
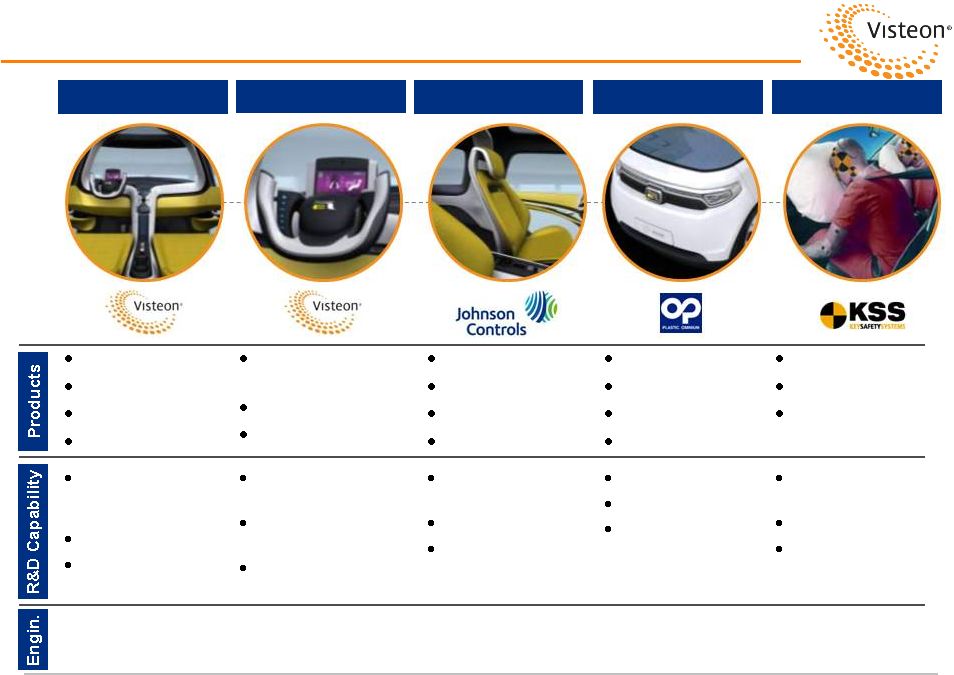
Five YFV Businesses: Strong Technical Capabilities
Cockpit
Instrument panels
Door panels
Console
Interior System
Driver
information
Entertainment
Controls
Seats
Trim covers
Mechanisms
Foam pads
Seating System
Bumpers
Body trim
Rear closures
Fenders
Exterior System
Steering wheels
Air bags
Seat belts
Safety System
Full-service
supplier (from styling
to production)
System integration
World-class testing
facilities
Globally integrated
technical centers
Safety testing
Acoustic and NVH
testing
Full design / engin.
capability
Advanced application
software
World-class testing
facilities
Structure design
CAE verification
New tech center
under construction
R&D / product
engineering
Crash simulation
Lifecycle testing
850
Engineers
555
Engineers
500
Engineers
330
Engineers
220
Engineers
Electronic System |
 Page 22
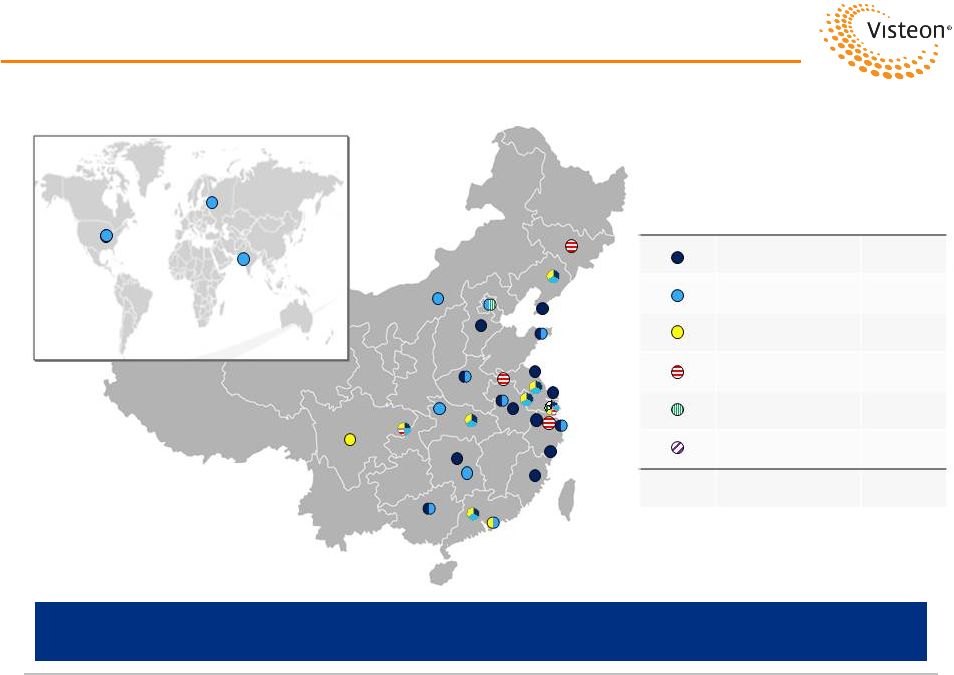
YFV’s Global Footprint
Extensive Footprint with 96 Facilities and 29,000 Employees
Note: As of October 2012.
Symbol
Business System
Facilities
Seating
39
Interiors
33
Exteriors
14
Electronics
7
Safety
2
Tooling
1
Total
96
Michigan, USA
Ruesselsheim, Germany
Kalol, India
Beijing
Changchun
Xuzhou
Shaoxing
Wuhan
Shi‘yan
Guangzhou
Yancheng
Liuzhou
Shanghai
Shenyang
Yantai
Yizheng
Wuhu
Hefei
Nanjing
Taizhou
Nantong
Fuzhou
Chongqing
Chengdu
Baotou
Baoding
Dalian
Zhuzhou
Changsha
Zhengzhou
Cixi
Hangzhou
Dongguan |
 Page 23
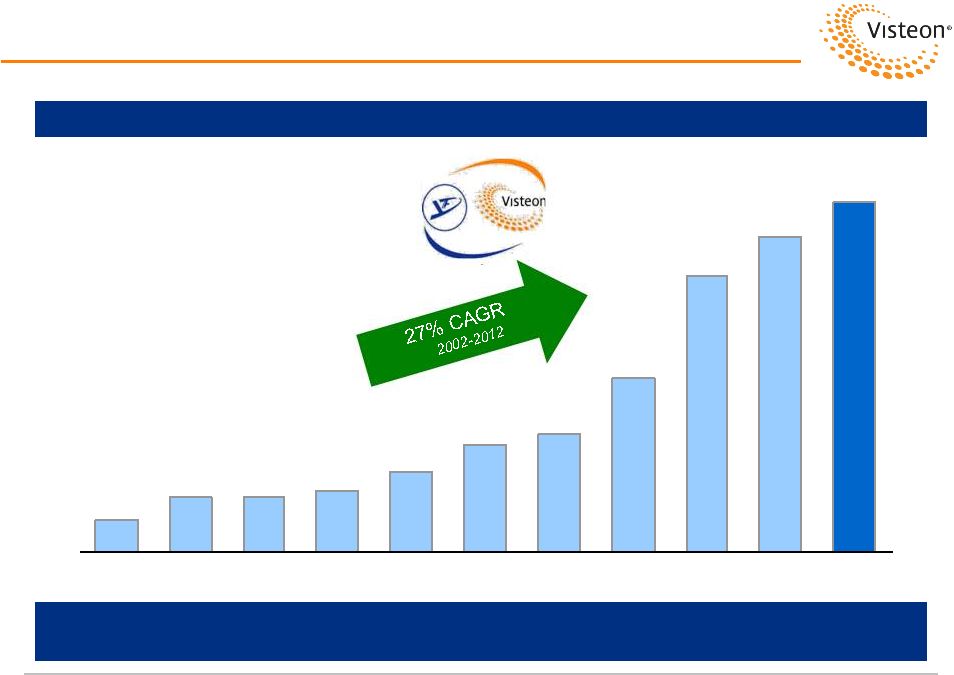
YFV’s Robust Historical Growth
(1) Non-U.S. GAAP figure. Represents People’s Republic of China GAAP
sales. 4.1
6.9
6.9
7.8
10.2
13.7
15.0
22.2
35.5
40.4
44.8
2002
2003
2004
2005
2006
2007
2008
2009
2010
2011
2012E
(RMB in Billions)
YFV Group Total Sales
(1)
27% Sales CAGR Since 2002 |
 Page 24
YFV: Well-Positioned in World’s Largest Auto Market
China Passenger Car Sales
Yanfeng Visteon Market Positions in China
(Units in Millions)
11% China Market CAGR
Yanfeng Visteon #1 China Auto Supplier
in Important Segments
Leading Market Positions Will Enable Yanfeng Visteon
to Capitalize on Strong China Market Growth
#1
Seats
Instrument panels
Door panels
Audio
Steering wheels
#2
Bumpers
#3
Clusters
Consoles
Source: IHS Automotive.
13.2
20.1
2012E
2016E |
 Page 25
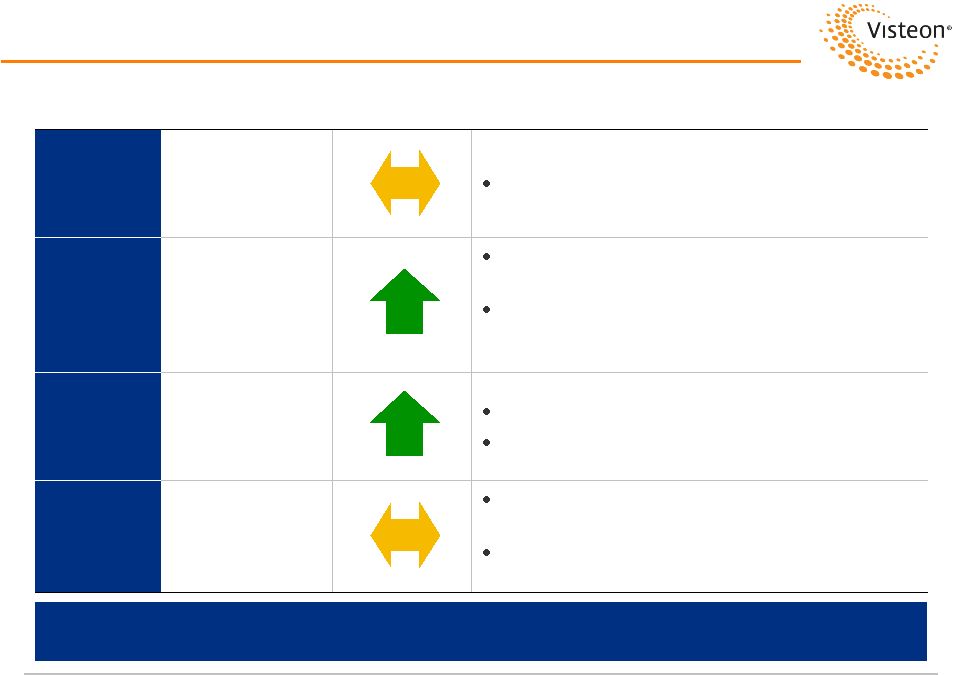
A Solid Outlook
YFV’s 2013 Outlook
Total
Sales
Double-Digit
Growth
Sales expected to increase by $1 billion, driven by:
Double-digit, year-over-year growth in Interiors, Seating, Exterior
and Safety, as well as solid growth for Electronics
Strong domestic sales, partially offset by weakness in exports
Growing SVW, SGM and SAIC sales
EBITDA
Double-Digit
Growth
EBITDA increase reflects:
Higher volumes and launch of significant new business, offset by:
•
Higher engineering costs to support new programs
•
Business mix changes and competitive market pressures
•
Costs related to new plant launches across all businesses
Net
Income
Solid
Growth
Net income reflects strong EBITDA growth, offset by:
Increase in D&A related to spending at several facilities, including 26
new
or
expanded
production
facilities,
that
will
generate
strong
sales
and earnings growth in future years
Increase in interest related to cash needs to fund investments
Higher taxes driven by higher tax rates for certain entities
2013 Outlook |
 Page 26
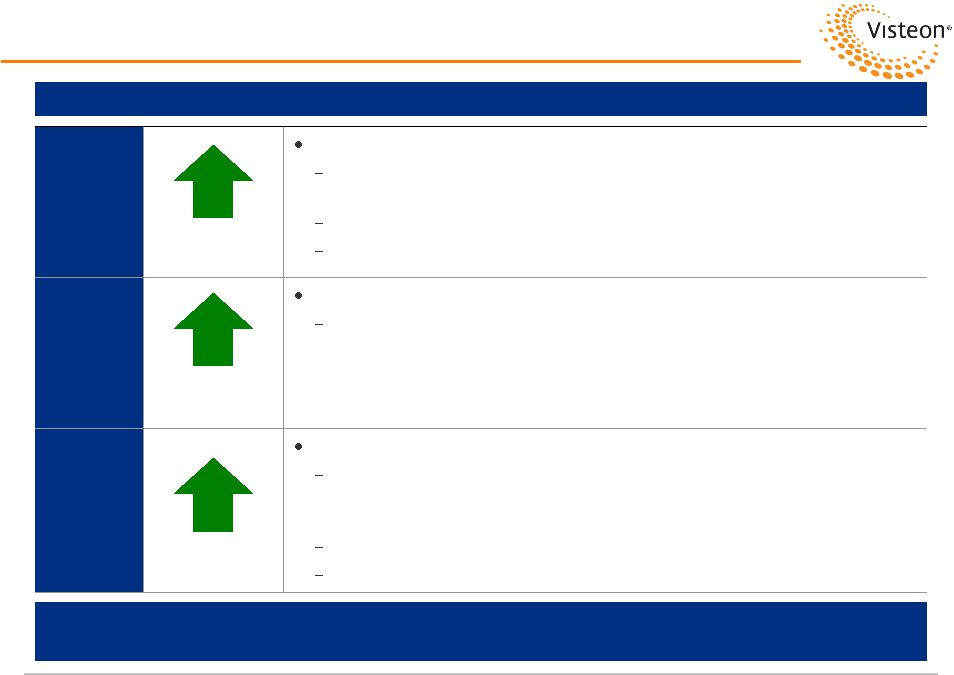
Strategic Initiatives at YFV
Expand domestic footprint to support growth of core customers
Grow customer base with local China OEMs; continued diversification
with select Chinese and Japanese OEMs
Support OEMs’
growth plans in China and abroad via cooperation with
Visteon and other partners
Strengthen technical capability in all business segments; enhance
tooling and equipment as a competitive advantage
Continue focus on development of new employees and YFV culture
Transition to Global Supplier While Strengthening Base Market
|
 Halla Visteon Climate Control
Yanfeng Visteon
Electronics
Interiors
Our Family
of Businesses
Financially Speaking
Deutsche Bank Global Auto Industry Conference
January 15, 2013 |
 Page 28
A Strong Capital Structure
9/30/12
6.75% Senior Notes due 2019
$495
Affiliate Debt / Other
100
Total Debt
$595
Cash
920
Net Debt
($325)
Visteon Leverage
Adjusted EBITDA (2012E Guidance Midpoint)
$600
Debt / Adjusted EBITDA
< 1.0x
Net Debt / Adjusted EBITDA
N/M
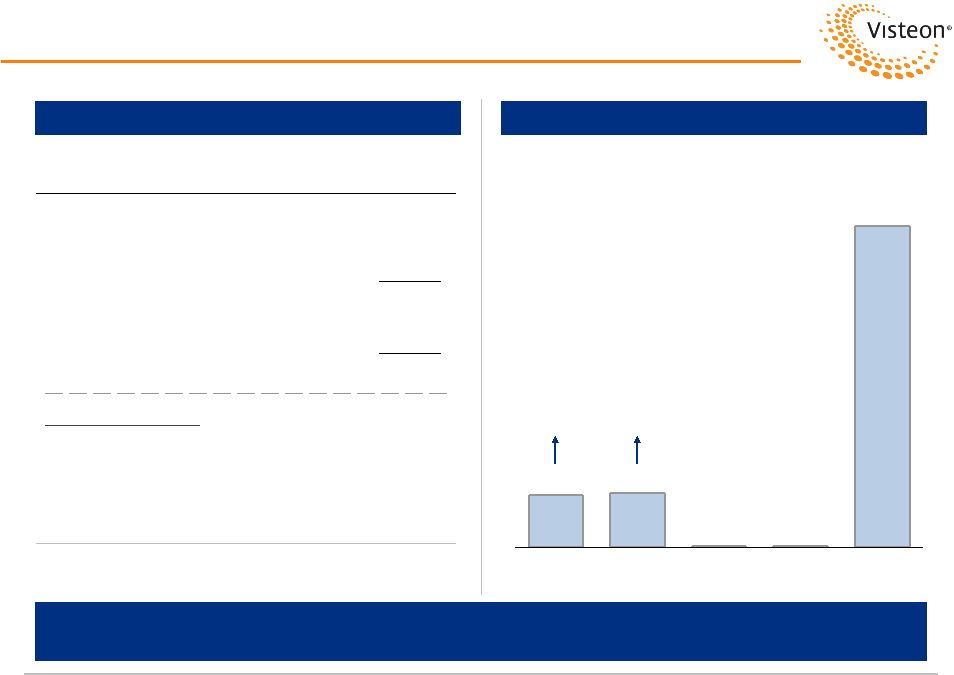
Visteon Debt and Cash
Visteon Debt Maturity Schedule
No Significant Near-Term Debt Maturities
and Strong Cash Balances and Liquidity
$72
$76
$1
$1
$445
2012
2013
2014
2015
2016+
(Dollars in Millions)
(2)
(1)
(1) Includes Halla debt of $75 million.
(2) Includes Halla cash of $351 million.
Annual
Working
Capital
Facility
Renewals
Includes
$50M Bond
Redemption
in Dec 2012 |
 Page 29
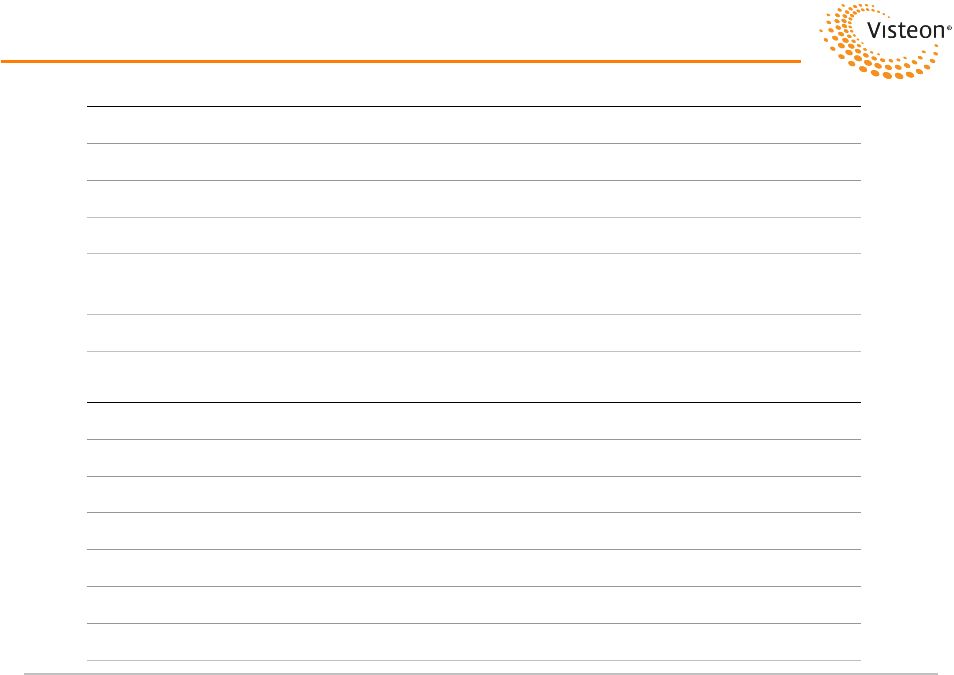
2012 Guidance Update
2012
Guidance
Current
Outlook
Commentary
Sales
$6.8 billion
Expect full-year sales to be in line with guidance
Adjusted
EBITDA
$590 -
$610
million
Expect to be at high-end of guidance or slightly
above
Q4 benefitted from the timing of several
commercial claims and engineering recoveries, as
well as SG&A savings
Adjusted
EPS
$2.77 -
$3.14
Expect to be at high-end of guidance
Driven by strong Adjusted EBITDA
Free Cash
Flow
+$25 million
Expect free cash flow to be positive and in line
with guidance
Reflects higher Adjusted EBITDA offset by trade
working capital
On Track to Achieve High-end (or Above) of 2012 Profit Guidance
|
 Page 30
2012 Adjusted EBITDA Recast
2012E
2012
Adjusted
EBITDA
Guidance
Midpoint
($590-$610)
$600
Exclude: Lighting and R-TEK
(30)
Exclude: Non-Cash Equity-Based Compensation Expense
+25
Add: Non-Controlling Interest from Climate Transaction
(10)
2012
Adjusted
EBITDA
Recast
Midpoint
($575-$595)
$585
Visteon’s 2012 Recasted Adjusted EBITDA is on the Same Basis as 2013
(Dollars in Millions)
Visteon
has
recasted
2012
estimated
Adjusted
EBITDA
to
be
on
the
same
basis
as
2013 Adjusted EBITDA. Three key adjustments:
Lighting and R-TEK:
entities sold in 2012 and will not be included in 2013
Non-Cash Equity-Based Compensation Expense:
in 2013, this item will be
excluded from Visteon’s Adjusted EBITDA
Non-Controlling
Interest
from
Climate
Transaction:
Visteon
will
incur
additional
non-controlling
interest
in
2013 related
to
Climate
entities
sold
to
Halla
Y/Y Change
in Methodology |
 (Units in
Millions) 2012E
2013E
% Growth
North America
Ford
2.8
3.0
6.2%
Hyundai / Kia
0.7
0.7
5.8
All Other
11.7
11.7
(0.1)
Subtotal
15.2
15.4
1.4%
Europe
Ford
1.4
1.3
(7.3%)
PSA
2.0
2.0
(0.2)
Renault / Nissan
2.3
2.2
(4.7)
Hyundai / Kia
0.9
0.9
(1.9)
All Other
12.3
12.3
(0.4)
Subtotal
19.0
18.7
(1.5%)
Asia
Hyundai / Kia
5.4
5.5
1.0%
All Other
35.2
36.3
3.1
Subtotal
40.6
41.8
2.8%
South America
Ford
0.4
0.4
0.3%
All Other
4.0
4.1
3.4
Subtotal
4.3
4.5
4.2%
Other
1.7
2.0
15.1
Total
80.9
82.4
1.9%
Page 31
2013 Volume and Currency Outlook
Source: IHS Automotive, October 2012 forecast. Used in conjunction with customer
data to develop Visteon’s internal volume forecast. (1) Hedges impact
transaction risk; do not impact translation risk. 2013 Production Volumes
2013 Exchange Rates
Visteon Assumptions
2012E
2013E
Exchange
Rates
$ / Euro
$1.28
$1.30
Korean Won / $
1,131
1,055
Effective
Rates
w/
Hedges
(1)
$ / Euro
$1.34
$1.30
Korean Won / $
1,122
1,094
Impact to Visteon
(Dollars in Millions)
Sales
EBITDA
Euro: $0.05 Decrease
($140)
($25)
KRW: 25 Decrease
$30
($12)
2013 Currency Sensitivity Analysis |
 $2.96 -
$4.19
Page 32
2013 Guidance
$6.8B
$7.3B -
$7.5B
$2.77 -
$3.14
$575M -
$595M
$100M -
$150M
$105M -
$125M
$620M -
$660M
Excl. Restructuring and Transaction-Related Cash
(1)
(1) Represents 2012 Adjusted EBITDA Recast. Please see page 42 of
presentation for calculation. Y/Y FX
Impact of
Positive
$125M
Y/Y FX
Impact of
Negative
($15M)
Strong Year-Over-Year Improvement for All Key Financial Metrics
Sales
Adjusted EBITDA
Adjusted EPS
Adjusted Free Cash Flow
2012E
2013E
2012E Recast
2013E
2012E
2013E
2012E
2013E |
 Page 33
Value-Creating Uses of Cash
Visteon Will Use Cash Balances to Drive Value for Shareholders Through
Share Repurchases, Restructuring and Operational Improvements
$920M
Visteon Cash
$353M
(1)
(1) Includes Halla cash of $351 million.
2013 Actions to Drive Shareholder Value
Visteon Cash
(9/30/2012)
HVCC Net Proceeds
Upsized total repurchase authorization to $300 million,
to be executed during the next two years (includes $50
million of repurchases in 2012)
$100 million to further reduce fixed-cost structure, right-
size operations and address underperforming assets
Strict focus on Y/Y operating improvements
Increasing 2013 guidance for all key financial metrics
Moving toward Q1 2013 closing of HVCC transaction
Progressing plans to divest Interiors business and
optimize Electronics business
Focus on Value Enhancing Transactions
Drive Fundamental Improvements
Across Our Operations
Focus Restructuring to Address
Cash / Value Draining Areas
Upsize Share Repurchase Program to $300M |
 Page 34
Strategic Imperatives
Reduce
Overhead
Focused on achieving lean corporate overhead structure
Plans being finalized and implemented
Divest
Interiors
Non-core business
Sale or alternative strategic placement of consolidated business
Optimize
Electronics
Address Electronics’
strategy and global position
Position business to unlock value of non-consolidated operations
Address
Legacy Issues
Address historically underperforming assets
Negotiate with customers for future sourcing commitments
Committed to Provide Improved Value for Our Customers and Shareholders
Unlock Value
of Yanfeng
Valuable asset with robust growth profile
Improve transparency and grow YFV value to Visteon shareholders
|
 Questions and Discussion |
 Halla Visteon Climate Control
Yanfeng Visteon
Electronics
Interiors
Our Family
of Businesses
Appendix
Deutsche Bank Global Auto Industry Conference
January 15, 2013 |
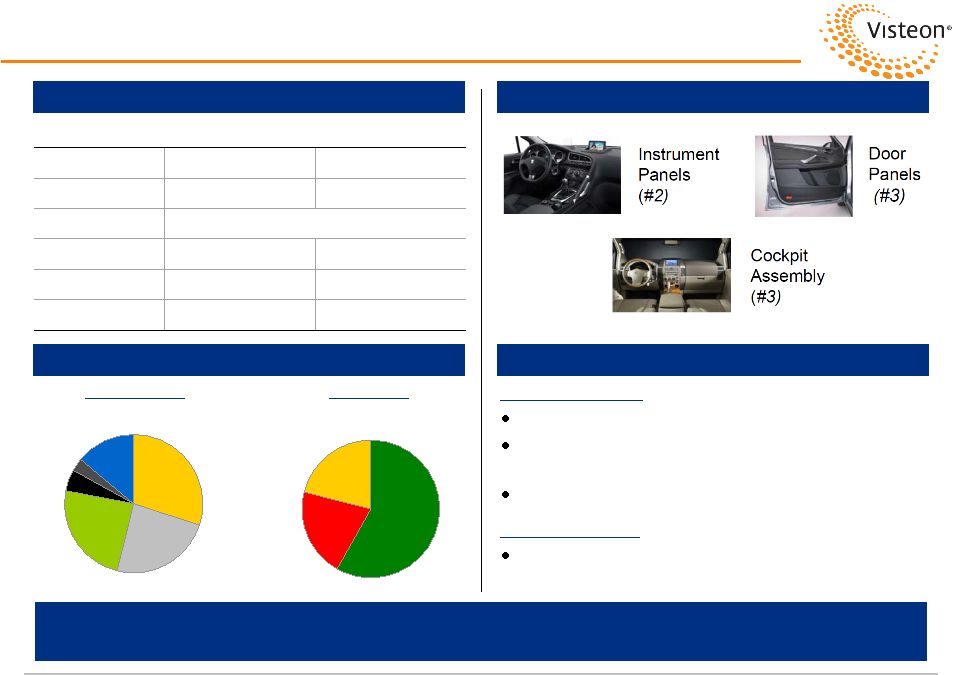 Page 37
Interiors Product Line
By Customer
By Region
EU
58%
SA
21%
AP
21%
Other
14%
GM
3%
VW
5%
PSA
24%
Ford
24%
Nissan /
Renault
30%
Note: 2012E Consolidated EBITDA excludes equity in affiliates and
non-controlling interests. Business Focus
New leadership in place to drive change
Maintain investment to drive continued long-term
technological offerings for customers
Capitalize on strong positions in Asia
Strategic Focus
Sale or alternative strategic placement of
consolidated business
Currently Evaluating All Strategic Opportunities for Interiors Business
Product Line Overview
Key Products and Market Positions
Go Forward Plan
2012E Consolidated Sales Breakdown
Note: Includes consolidated and non-consolidated entities.
Consolidated
Non-Consolidated
2012E Sales
$1.4 billion
$7.4 billion
2012E EBITDA
~$32 million
N/A
Mkt Position
#2 (12% Share)
Headcount
6,750
24,925
Mfg Facilities
27
90
Equity Income
–
~$140 million |
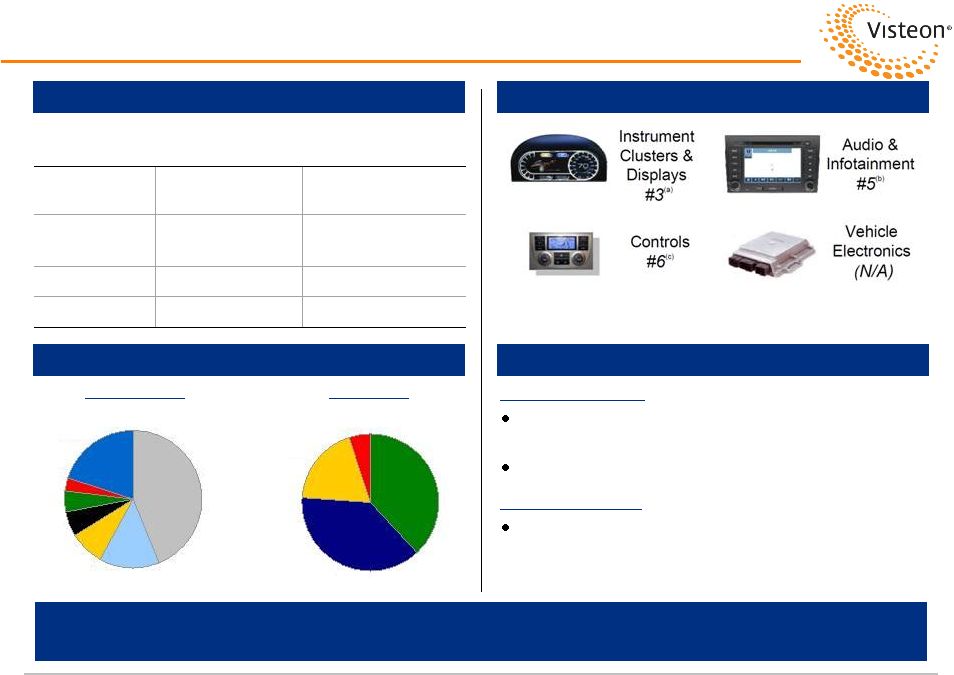 Page 38
Electronics Product Line
Product Line Overview
Key Products and Market Positions
Go Forward Plan
Note: Includes consolidated and non-consolidated entities.
(a)
Instrument Clusters
(b)
OEM Audio Head Units
(c)
Electronic Climate Controls
2012E Consolidated Sales Breakdown
By Customer
By Region
Tier 1 -
Ford
14%
Nissan / Renault
8%
Mazda 6%
JLR 5%
Mitsubishi
3%
Note:
EBITDA margin based on Adjusted EBITDA (excluding equity in affiliates and
non-controlling interests). (1)
Assumes consolidation of all YFVE 50%-plus-owned joint ventures.
Business
Focus
Continue to provide innovative solutions and
technologies for customers
Maintain disciplined investments in business
Strategic
Focus
Optimize global scale and ownership to create
the most value for Visteon customers and
shareholders
Address Electronics’
Strategy and Global Position
Consolidated
Consolidated +
YFVE Consolidation
2012E Sales
EBITDA Margin
$1.2 billion
(~6.0% Margin)
$1.8 billion
(~7.6% Margin)
Global Mkt
Position
#8 (4% Share)
#5 (6% Share)
Headcount
5,900
10,700
Mfg Facilities
9
16
(1)
Ford
44%
Other
20%
EU
38%
AP
19%
SA
5%
NA
38% |
 Note:
Discount
rate
for
plan
to
be
fully
funded
on
PBO
basis
is
6.25%.
Page 39
Lump Sum Program Reduced Net PBO Liability by $110 Million
and Significantly Reduced Future Pension Plan Volatility
(Dollars in Millions)
U.S. Pension Funding Status as of December 31, 2012
Preliminary Amounts (Estimated)
PBO
Asset Value
Unfunded
Actual
12/31/2011
Funded
Level
(4.87%
Discount
Rate)
$1,480
$1,151
$329
Interest on PBO
70
Stock Contribution (1/9/2012)
73
Cash Contribution
4
Asset Appreciation and Interest Income
114
Benefit Payments and Admin Expenses
(76)
(76)
12/31/2012 Funded Level (Before Discount Rate Change)
$1,474
$1,266
$208
Discount Rate Change to 3.89%
183
12/31/2012 Funded Level (After Discount Rate Change)
$1,657
$1,266
$391
Lump Sum Program
(411)
(301)
12/31/2012 Funded Level (After Lump Sum Program)
$1,246
$965
$281 |
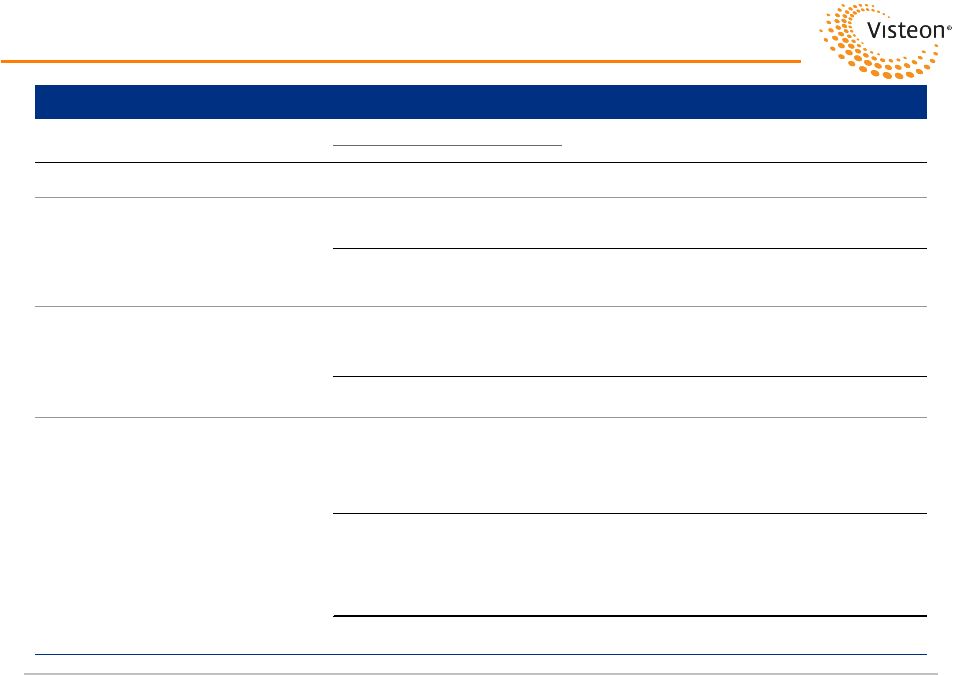
 Page 40
2013 Guidance
2013 Guidance
Product Sales
$7.3 B -
$7.5 B
Adjusted EBITDA
$620 M -
$660 M
Free Cash Flow
Free Cash Flow
(1)
($75) M -
$25 M
Adjusted Free Cash Flow
(ex. Restructuring and Transaction-Related Cash)
$100 M -
$150 M
Adjusted EPS
$2.96 -
$4.19
Other Selected Items:
2013 Guidance
Depreciation and Amortization
$275 M
Interest Payments
$55 M
Cash Taxes
Operating
$120 M -
$140 M
Climate Transaction
$20 M -
$40 M
Restructuring Payments
$75 M -
$125 M
Capital Spending
$250 M
(1)
Free cash flow equal to cash from operating activities, less capital expenditures.
Includes $75-$125 million of restructuring and $50 million in taxes and fees, primarily
related to Halla Visteon Climate Control transaction.
|
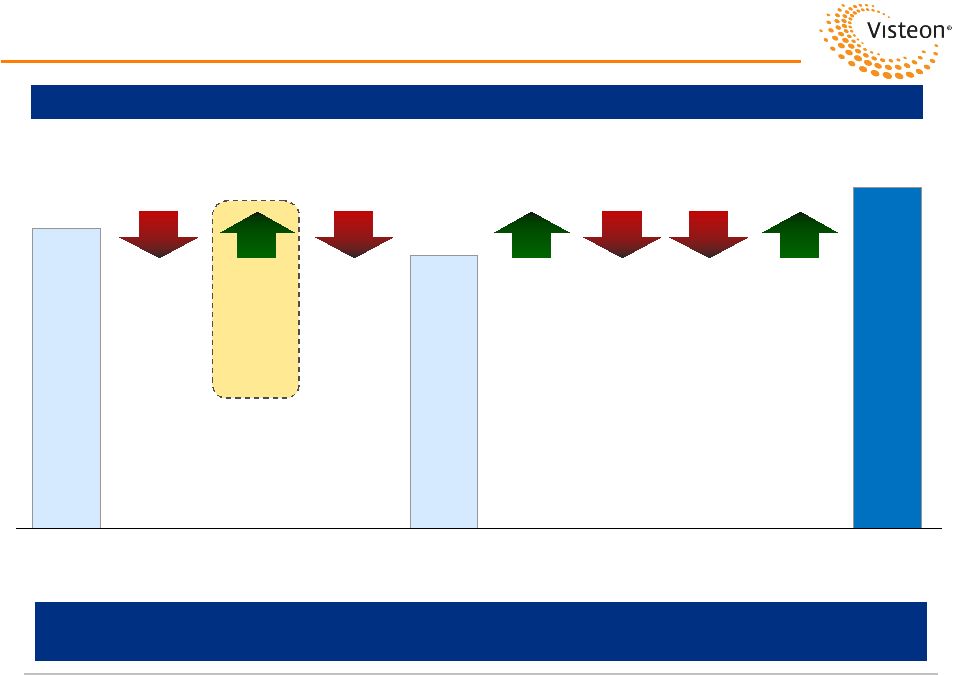 Page 41
2013 Adjusted EBITDA Drivers
Adjusted EBITDA Improvement Driven by Higher Volumes
and Administrative Staff Cost Reductions
Adjusted EBITDA
$600M
$640M
2012
Midpoint
2013
Midpoint
$585M
($30M)
Lighting
Disc Ops /
R-TEK
$25M
Equity-
Based
Comp
Expense
Volume
($10M)
NCI
Impact
of HVCC
Transaction
Currency
Net Cost
Performance
Y/Y Change
in Methodology
2012
Re-cast
Other
NCI |
 Page 42
Reconciliation of Non-GAAP Financial Information
Adjusted EBITDA
Free Cash Flow
+
+
(1)
(1) Could be impacted by timing of Fixed-Cost Restructuring Plan charges.
(2) 2011 and 2012 reconciliation not yet recast for equity-based compensation
expense. (2)
2012 FY Guidance Provided
2011
2012
During Q3 2012 Earnings
2013 FY Guidance
(Dollars in Millions)
Full Year
1st Qtr
2nd Qtr
3rd Qtr
Low-end
High-end
Low-end
High-end
Adjusted EBITDA
$685
$150
$151
$131
$590
$610
$620
$660
Interest expense, net
27
9
6
13
41
41
50
50
Loss on debt extinguishment
24
-
-
4
4
4
-
-
Provision for income taxes
127
27
42
33
140
140
160
120
Depreciation and amortization
295
64
67
64
260
260
275
275
Restructuring and other (income), expense net
11
63
11
(11)
80
80
150
100
Equity investment gain
-
-
(63)
-
(63)
(63)
-
-
Other non-operating costs, net
30
5
2
5
13
13
10
10
Non-cash equity-based compensation expense
-
-
-
-
-
-
20
20
Discontinued operations
91
11
11
8
30
30
-
-
Net Income (loss) attributable to Visteon
$80
($29)
$75
$15
$85
$105
($45)
$85
Reconciliations
to
2012
Adjusted
EBITDA
Recast
(2012
on
Same
Basis
as
2013)
2012 FY Guidance Recast
Low-end
High-end
Adjusted EBITDA
$590
$610
Exclude: Lighting and R-TEK operations
(30)
(30)
Exclude: Non-cash equity-based compensation expense
25
25
Add: Non-controlling interest from Climate transaction
(10)
(10)
Adjusted EBITDA Recast
$575
$595
2012 FY Guidance
2011
2012
Provided During
2013 FY Guidance
(Dollars in Millions)
Full Year
1st Qtr
2nd Qtr
3rd Qtr
Q3 2012 Earnings
Low-end
High-end
Cash from (used by) operating activities
$175
$19
($12)
$156
$255
$175
$275
Less: Capital expenditures
258
53
49
44
230
250
250
Free cash flow
($83)
($34)
($61)
$112
$25
($75)
$25
Reconciliations
to
Adjusted
Free
Cash
Flow
(ex.
Restructuring
and
Transaction-Related
Cash)
Low-end
High-end
Free cash flow
$25
$25
($75)
$25
Exclude: Restructuring cash payments
60
80
125
75
Exclude: Transaction-related cash
20
20
50
50
Adjusted free cash flow (ex. restructuring and transaction-related cash)
$105
$125
$100
$150 |
 Page 43
Earnings per Share
Adjusted EPS
2012 FY Guidance Provided
2011
2012
During Q3 2012 Earnings
2013 FY Guidance
(Dollars and Shares in Millions)
Full Year
1st Qtr
2nd Qtr
3rd Qtr
Low-end
High-end
Low-end
High-end
Net income (loss) attributable to Visteon
$80
($29)
$75
$15
$85
$105
($45)
$85
Average shares outstanding, diluted
52.0
51.9
53.7
53.8
53.5
53.5
52.3
51.3
Earnings per share
$1.54
($0.56)
$1.40
$0.28
$1.59
$1.96
($0.86)
$1.66
Memo:
Items
Included
in
Net
income
(loss)
attributable
to
Visteon
Restructuring and other income, (expense) net
(11)
(63)
(11)
11
(80)
(80)
(150)
(100)
Equity investment gain
-
-
63
-
63
63
-
-
Taxes related to equity investment gain
-
-
(6)
-
(6)
(6)
-
-
Taxes related to HVCC transaction
-
-
-
-
-
-
(40)
(20)
Other non-operating costs, net
(30)
(5)
(2)
(5)
(13)
(13)
(10)
(10)
Loss on debt extinguishments
(24)
-
-
(4)
(4)
(4)
-
-
Asset impairments and cost related to disc. ops.
(68)
(4)
(12)
(7)
(23)
(23)
-
-
Total
($133)
($72)
$32
($5)
($63)
($63)
($200)
($130)
Memo: Adjusted EPS
Net income (loss) attributable to Visteon
$80
($29)
$75
$15
$85
$105
($45)
$85
Items in net income (loss) attributable to Visteon
(133)
(72)
32
(5)
(63)
(63)
(200)
(130)
Adjusted net income (loss)
$213
$43
$43
$20
$148
$168
$155
$215
Average shares outstanding, diluted
52.0
51.9
53.7
53.8
53.5
53.5
52.3
51.3
Adjusted earnings per share
$4.10
$0.83
$0.80
$0.37
$2.77
$3.14
$2.96
$4.19 |
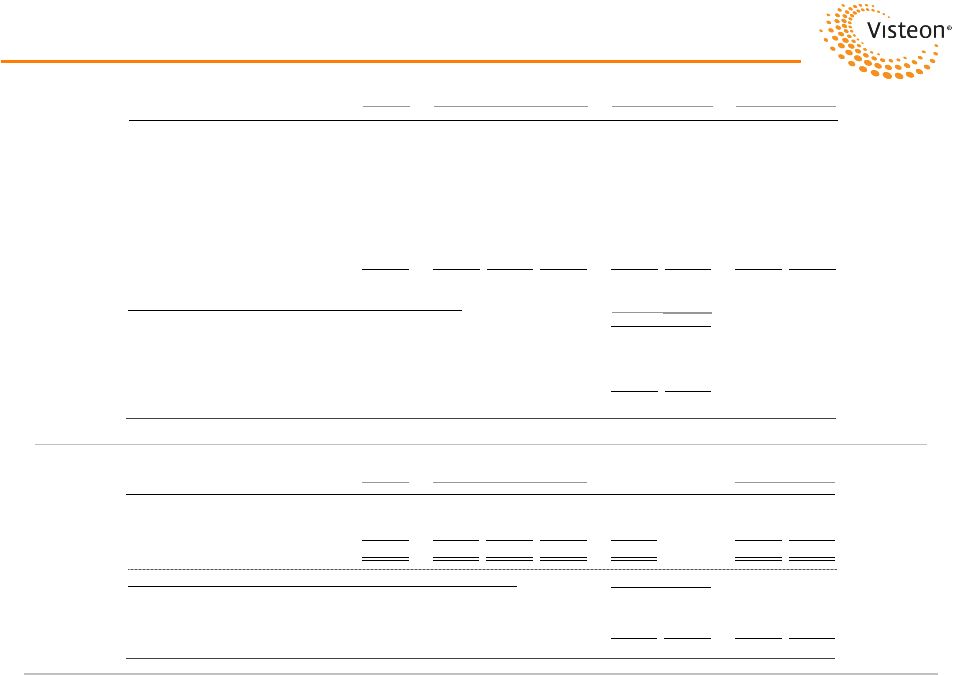
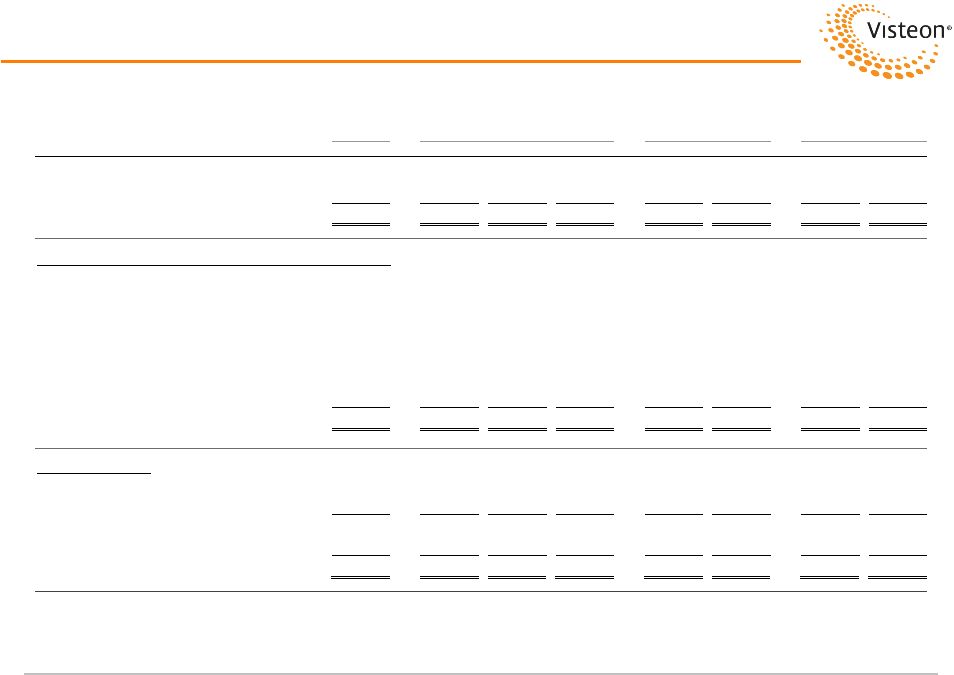
 Page 44
Adjusted EBITDA Reconciliation by Product Group
Disc Ops/
Total
(Dollars in Millions)
Total
Retained
HVCC
Electronics
Interiors
Elims
Visteon
Product Sales
$4,263
$152
$4,111
$1,243
$1,379
($105)
$6,780
Gross Margin
$380
$4
$376
$115
$73
-
$568
Employee Charges / Corp Severance
(1)
-
(1)
(4)
(1)
-
(6)
Adjusted Gross Margin
$381
$4
$377
$119
$74
-
$574
% of Product Sales
8.9%
2.6%
9.2%
9.6%
5.4%
8.5%
SG&A
Product Line Specific and Allocated SG&A
(192)
(8)
(184)
(81)
(74)
(16)
(363)
Employee Charges / Corp Severance
2
-
2
1
1
-
4
Adjusted SG&A
($190)
($8)
($182)
($80)
($73)
($16)
($359)
Adjusted EBITDA
Adjusted Gross Margin
$381
$4
$377
$119
$74
-
$574
Adjusted SG&A
(190)
(8)
(182)
(80)
(73)
(16)
(359)
Exclude D&A
177
3
174
36
31
16
260
Adjusted EBITDA (excl. Equity in Affil., NCI)
$368
($1)
$369
$75
$32
-
$475
% of Product Sales
8.6%
(0.7%)
9.0%
6.0%
2.3%
0.0%
7.0%
Equity in Affiliates
5
-
5
17
141
-
163
Noncontrolling Interests
(62)
-
(62)
(1)
(2)
-
(65)
Discontinued operations
-
-
-
-
-
27
27
Adjusted EBITDA
$311
($1)
$312
$91
$171
$27
$600
Climate
2012 FY PG Guidance Underlying Corporate Guidance Given During Q3 Earnings Call
|
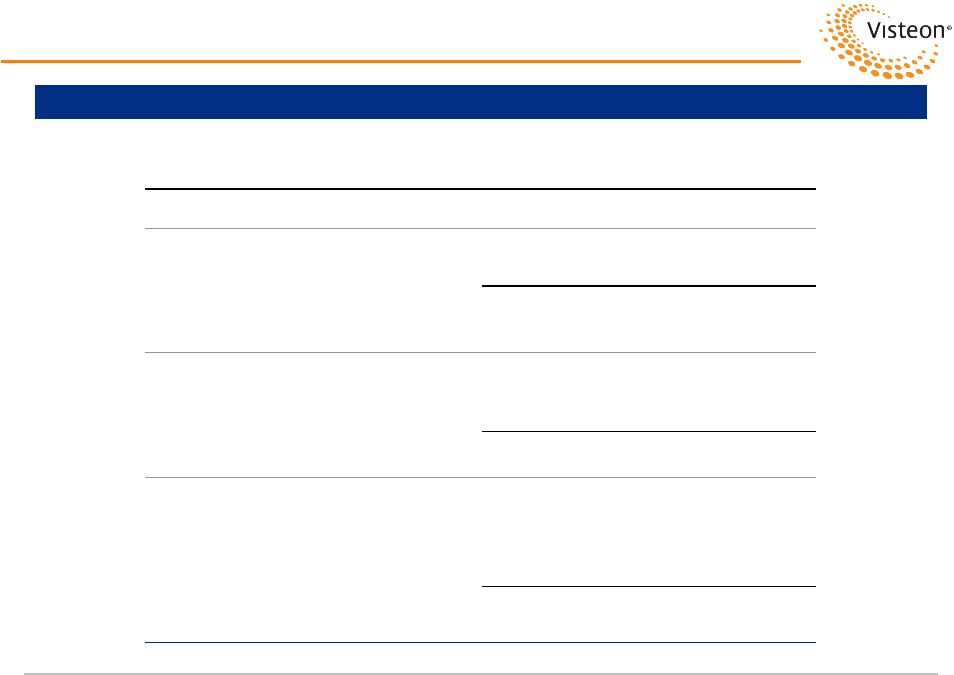 Combined
Electronics
(Dollars in Millions)
Electronics
YFVE
& YFVE
Product Sales
$1,243
$700
$1,783
Gross Margin
$115
$65
$180
Employee Charges / Corp Severance
(4)
-
(4)
Adjusted Gross Margin
$119
$65
$184
% of Product Sales
9.6%
9.3%
10.3%
SG&A
Product Line Specific and Allocated SG&A
(81)
(15)
(96)
Employee Charges / Corp Severance
1
-
1
Adjusted SG&A
($80)
($15)
($95)
Adjusted EBITDA
Adjusted Gross Margin
$119
$65
$184
Adjusted SG&A
(80)
(15)
(95)
Exclude D&A
36
10
46
Adjusted EBITDA (excl. Equity in Affil., NCI)
$75
$60
$135
% of Adjusted Sales
6.0%
8.6%
7.6%
Page 45
Electronics –
Consolidated + YFVE Reconciliation
(1) Includes Visteon / YFVE eliminations.
Note: YFVE estimates only, not purported to be U.S. GAAP.
(1)
2012 FY Electronics Guidance Underlying Corporate Guidance Given During Q3 Earnings Call |
 www.visteon.com |