Attached files
| file | filename |
|---|---|
| 8-K - FORM 8-K - E TRADE FINANCIAL CORP | d444837d8k.htm |
 E*TRADE
Financial Corporation KBW Securities Brokerage & Market Structure Conference
Matthew Audette, Chief Financial Officer
November 28, 2012
©
2012 E*TRADE Financial Corporation all rights
reserved. Exhibit 99.1
|
 ©
2012 E*TRADE Financial Corporation all rights reserved
Safe Harbor Statement
This presentation contains certain forward-looking statements regarding our business
strategy and the related impact, our strategic and capital plans, certain deleveraging
and cost-savings initiatives, the continuation of current trends,
future
events
and
the
future
performance
of
the
Company.
E*TRADE
claims
the
protection
of
the
safe
harbor
for forward-looking statements contained in the Private Securities Litigation Reform Act
of 1995 for all forward- looking statements. Various factors, including risks
and uncertainties referred to in the prospectus supplement related to this offering as
well as in the 10-K, 10-Q and other reports incorporated in the prospectus supplement
could cause our actual results to differ materially from those indicated by our projections or
other forward-looking statements.
Notice to investors
2
Non-GAAP Financial Measures
In addition to financial results prepared in accordance with Generally Accepted Accounting
Principles, or GAAP, this presentation will also contain certain non-GAAP financial
measures. Management uses these non-GAAP measures to evaluate our performance
and in planning for future periods. Management believes that adjusting GAAP measures by
excluding
or
including
certain
items
is
helpful
to
investors
and
analysts
who
may
wish
to
use
some
or
all
of
this
information to analyze our current performance, prospects and valuation. It is important to
note these non-GAAP measures
involve
judgment by
management and
should
be
considered
in
addition
to,
not
as
a
substitute for,
the most
directly comparable measures calculated and prepared in accordance with GAAP. Investors and
potential investors are encouraged to review the reconciliation of non-GAAP
financial measures with their most direct comparable GAAP financial measures included
as an appendix to this presentation. This
presentation presents data as of September 30, 2012, unless otherwise indicated.
|
 Improve market
position in retail brokerage •
Accelerate growth of the customer franchise
•
Continue to enhance the customer experience, improve satisfaction and retention
Capitalize on value of complementary brokerage businesses
•
Corporate Services Group
•
Market making operations
Enhance position in retirement & investing
•
Expand brand position for awareness and preference
•
Grow customer share of wallet
Continue to manage and de-risk the Bank
•
Mitigate
credit
losses
on
legacy
loan
portfolio
and
enhance
risk
profile
•
Build out enterprise risk management function
Strengthen overall financial and franchise position
•
Improve capital ratios through de-risking and de-leveraging
•
Focus on ultimately deploying excess Bank capital to parent to pay off corporate debt
•
Increase focus on cost reductions and efficiencies: Targeting $100M in run-rate
reductions Business strategy
©
2012 E*TRADE Financial Corporation all rights reserved
3 |
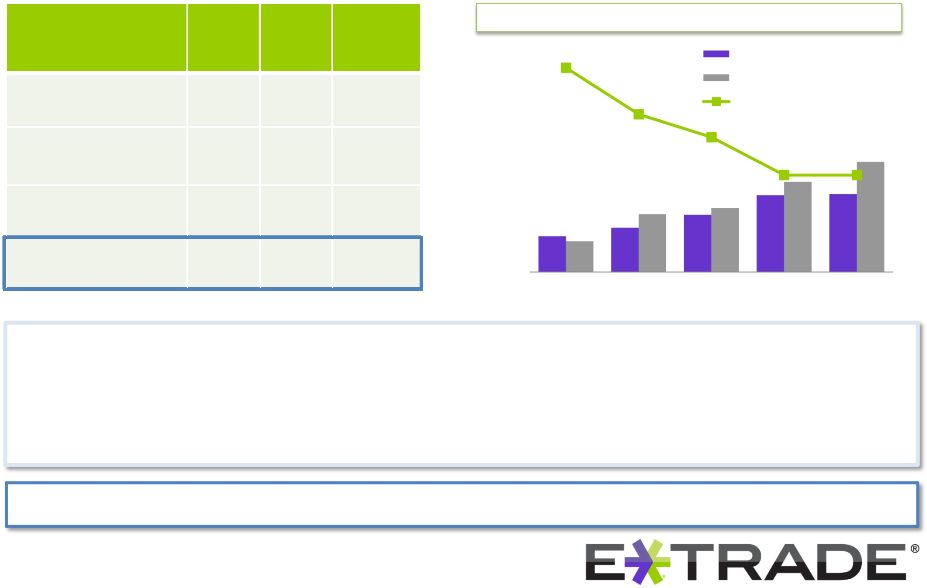
 $0.9B
$(2.2)B
$(1.3)B
$(0.9)B
$0.0B
$0.2B
Pre-tax income:
($ M)
Last 4 quarters
Driver
Long-term impact
of current strategy
Revenue
$1,907
$2,150
Provision
($403)
$0
Servicing
($64)
$0
FDIC expenses
($112)
($56)
Other operating expenses
($1,005)
($1,005)
Expenses, total
($1,181)
($1,061)
Operating income
$323
$1,089
Corporate interest expense
($181)
$0
Other
($51)
($51)
Pre-tax income
$91
$1,038
Should reduce to $0 as excess Bank capital is
deployed to parent to pay off corporate debt
$1.0B
Long-term
impact to
current
strategy
(1)
$0.1B
Net interest spread should improve to 300bps
with normalized rate environment
Should reduce to $0 as legacy portfolio runs off
Should reduce to $0 as legacy portfolio runs off
Should reduce by half as risk profile improves
Strengthen overall financial and franchise position
Long-term impact of current strategy to improve earnings
©
2012 E*TRADE Financial Corporation all rights reserved
4
$1.5
$0.5
($0.5)
($1.5)
($2.5)
($3.5)
2006
2007
2008
2009
2010
2011
Earnings before interest, taxes and credit costs
Provision / credit cost
Interest & other expense
Last 4
quarters |
 ©
2012 E*TRADE Financial Corporation all rights reserved
5
Strategic and Capital Plan submitted to Fed and OCC in June 2012 •
Outlined assumptions for capital levels and distributions under various operating conditions
over next 5 years •
Includes the assumption that the Bank begins distributing capital to the Parent by the
end of 2013 •
Plan assumes the Bank will dividend capital to the Parent above Tier 1 leverage ratio of 9.5%
•
9.5% target decreases by 50 bps each year beginning in 2014, ultimately settling at 8.0%
Capital ratios as of
9/30/12
Bank
Parent
Well-
capitalized
threshold
Total capital to
risk-weighted assets
(2)
19.3%
14.3%
10.0%
Tier 1 capital to
risk-weighted assets
(2)
18.0%
13.0%
6.0%
Tier 1 common
(3)
18.0%
10.9%
7.0%
Tier 1 leverage
(2)
7.9%
5.8%
5.0%
Bank excess capital / Corporate debt
(4)
Reducing balance sheet size / improving leverage ratio is integral to the successful execution
of the Capital Plan 3Q 08
3Q 09
3Q 10
3Q 11
3Q 12
Excess Tier 1 leverage
Excess Risk-based capital
Corporate debt
©
2012 E*TRADE Financial Corporation all rights reserved
Strengthen overall financial and franchise position
Focused on deleveraging to improve most constraining ratio: Tier
1 leverage
5
(5)
($B)
$3.5
$3.0
$2.5
$2.0
$1.5
$1.0
$0.5
$- |
 ©
2012 E*TRADE Financial Corporation all rights reserved
6
Drivers of change in balance sheet size
Focused on deleveraging to improve most constraining ratio: Tier
1 leverage
Strengthen overall financial and franchise position
$55
$50
$45
$40
2Q 2012
$49.2
$2.2
$(1.3)
$0.3
$50.4
$(3.0)
$(1.3)
$46.1
customer net
selling
deleveraging
actions
other
3Q 2012
planned
deleveraging
actions
October
customer net
buying
4Q 2012
pro forma
Deleveraging actions
completed during 3Q 2012
Deleveraging actions identified or
completed for 4Q 2012
TOTAL
Reduce wholesale borrowings
$520M
Transfer sweep deposits
$1,200M
Transfer customer deposits
$470M
Reduce wholesale borrowings
$900M
Default new customer cash to
money funds
$300M
Convert customer payables to money
funds
(6)
$900M
Total
$1,290M
Total
$3,000M
$4,290M |
 7
Strengthen overall financial and franchise position
Debt refinancing to significantly improve cash flow and reduce interest burden
Improved maturity profile
•
Lowest Senior Note coupons in the Company’s history
•
Improves annual earnings by approximately $60M or
$0.21 per share
(7)
•
Improves pro forma debt service coverage ratio for parent
cash to 3.9X from 2.6X
•
Lengthens maturity profile, eliminating nearest maturity
and extending weighted average maturity by +1 year
•
Call features allow prepayment flexibility
Transaction benefits
Weighted average maturity:
Pre-refi = 4.3 years
Post-refi = 5.5 years
Improved earnings
(7)
Transaction overview
•
Launched transaction to refinance debt on 11/5
•
Successfully raised $1.3B in Senior notes –
closed on 11/14
•
Issued call notice for $930M of Springing Lien Notes due
2017 and $243M of 7.875% Senior Notes due 2015
•
Will extinguish called notes on 12/1
Pre-
refi
Post-refi
$1.0
$0.8
$0.6
$0.4
$0.2
$0.0
2013
2014
2015
2016
2017
2018
2019
©
2012 E*TRADE Financial Corporation all rights reserved
Maturity
2015
2016
2017
Coupon
7.875%
6.75%
12.50%
Balance
$243
$435
$930
GAAP interest
expense
$19
$29
$137
After tax
$12
$18
$99
Total
10.25%
$1,608
$185
$129
2016
2017
2019
6.75%
6.00%
6.38%
$435
$505
$800
$29
$30
$51
$18
$19
$32
Total
6.36%
$1,740
$110
$69
$75
$60
Savings |
 Consolidated
DTA of $1.3B ($0.3B at parent; $1.0B at Bank)
Ability to include more in regulatory capital with ongoing
profitability
Source of corporate cash as subsidiaries reimburse the
parent for use of its DTA
Approximately 16 years to use; expect to utilize the full
amount
(8)
Strengthen overall financial and franchise position
Deferred tax asset: Embedded value realized with ongoing profitability
©
2012 E*TRADE Financial Corporation all rights reserved
8
Consolidated DTA = $1.3B;
only 6%
is included in regulatory capital
excluded from
regulatory
capital
Included in
regulatory
capital
$ B
Bank DTA = $1.0B;
only 26% is included in regulatory capital
$ B
$0.08
$1.27
excluded from
regulatory
capital
Included in
regulatory
capital
$0.3
$0.7
DTA
Pre-tax income equivalent
Parent company
Bank
$3.5B
$1.3B
4.0
3.0
2.0
1.0
0.0 |
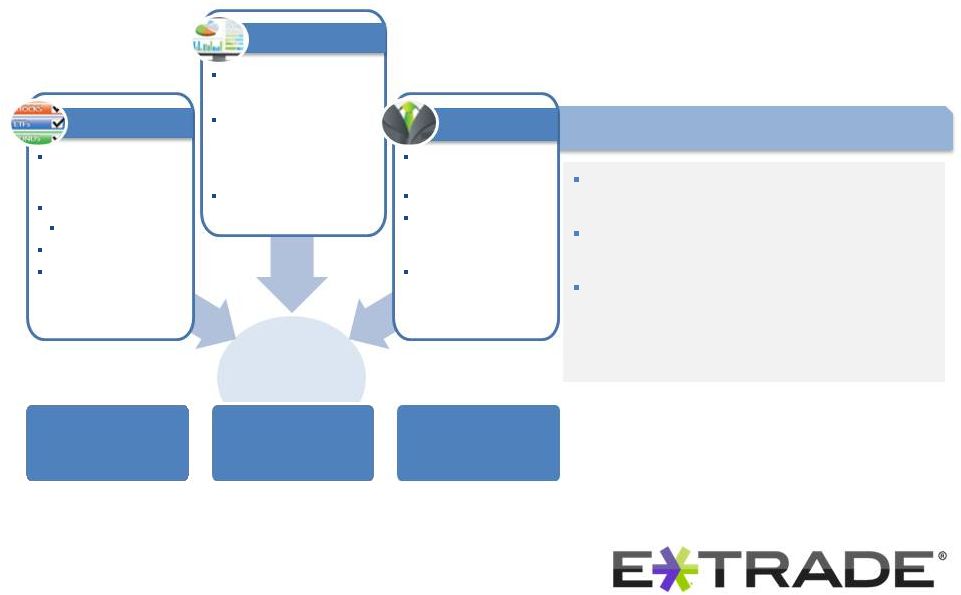
 Redesigned
public website Leading-edge platforms
Award-winning iconic brand & advertising
Committed to grow as a recognized leader with iconic brand and advertizing
(9)
(10)
(11)
Improve market position in retail brokerage
9
©
2012 E*TRADE Financial Corporation all rights reserved
|
 ©
2012 E*TRADE Financial Corporation all rights reserved
10
Improve market position in retail brokerage
Lower
attrition
Increase
net new assets /
share of wallet
Grow
high quality
account base
Increase asset-based
and commission-
based revenue
Key initiatives to drive success
•
Create leading online broker
experience:
•
E*TRADE.com
•
E*TRADE 360
•
E*TRADE Mobile
•
Education & research
•
E*TRADE Community
•
Focus on customer dissatisfiers
•
Continuous process improvement
•
Deliver best-in-class trading
experience:
•
E*TRADE.com
•
E*TRADE Pro
•
E*TRADE Mobile
•
Expand product engagement
through:
•
Platform enhancements
•
Idea generating tools
•
Education for all traders on
products, platforms, strategies and
risk management
•
Expand brand as a trusted
retirement and investing
provider
•
Deliver retirement advice &
planning:
•
Financial Consultants
•
Online planning tools
•
Managed Products
•
Increase awareness of needs-
based investing solutions:
•
Mutual funds
•
Fixed income
•
ETFs
•
Deepen relationships with
high-potential customers
Improve
customer experience
Enhance retail
trading offering
Grow retirement
& investing |
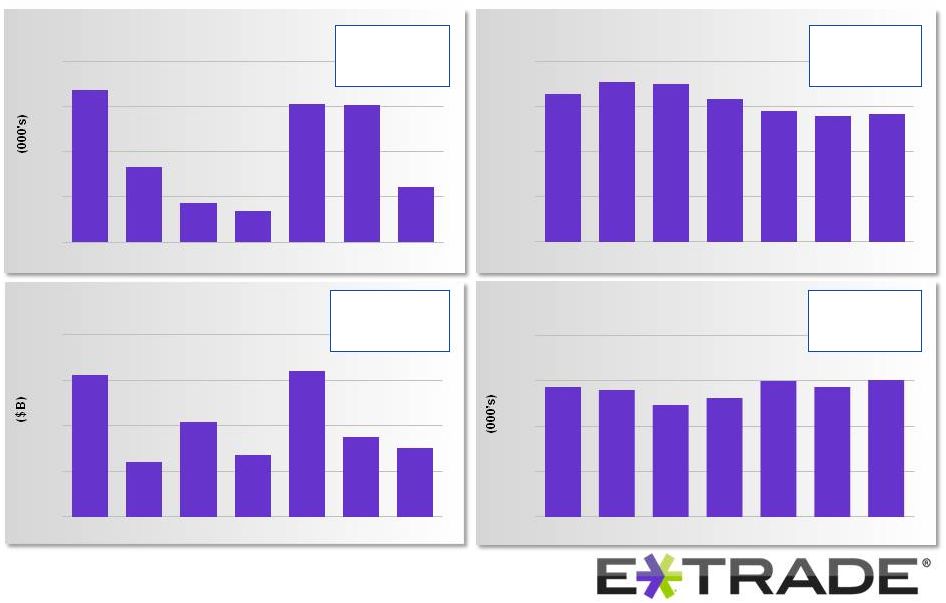 Net new
brokerage accounts
Net new brokerage
assets
(13)
Annualized brokerage
account attrition
(12)
2010: 12.2%
2011: 10.3%
YTD 2012: 8.7%
2010: 54k
2011: 99k
YTD 2012: 110k
2010: $8.1B
2011: $9.7B
YTD 2012: $8.1B
Average brokerage
assets per account
(14)
2010: $49k
2011: $54k
YTD 2012: $59k
Improve market position in retail brokerage
Accelerate growth of the customer franchise
©
2012 E*TRADE Financial Corporation all rights reserved
11
60
45
30
15
0
Q1 11
Q2 11
Q3 11
Q4 11
Q1 12
Q2 12
Q3 12
51
25
13
10
46
46
18
12%
9%
6%
3%
0%
Q1 11
Q2 11
Q3 11
Q4 11
Q1 12
Q2 12
Q3 12
9.9%
10.7%
10.5%
9.5%
8.7%
8.4%
8.5%
$5.0
$3.8
$2.5
$1.3
$0.0
Q1 11
Q2 11
Q3 11
Q4 11
Q1 12
Q2 12
Q3 12
$3.9
$1.5
$2.6
$1.7
$4.0
$2.2
$1.9
$80
$60
$40
$20
$
Q1 11
Q2 11
Q3 11
Q4 11
Q1 12
Q2 12
Q3 12
$57
$56
$49
$52
$60
$57
$60 |
 ©
2012 E*TRADE Financial Corporation all rights reserved
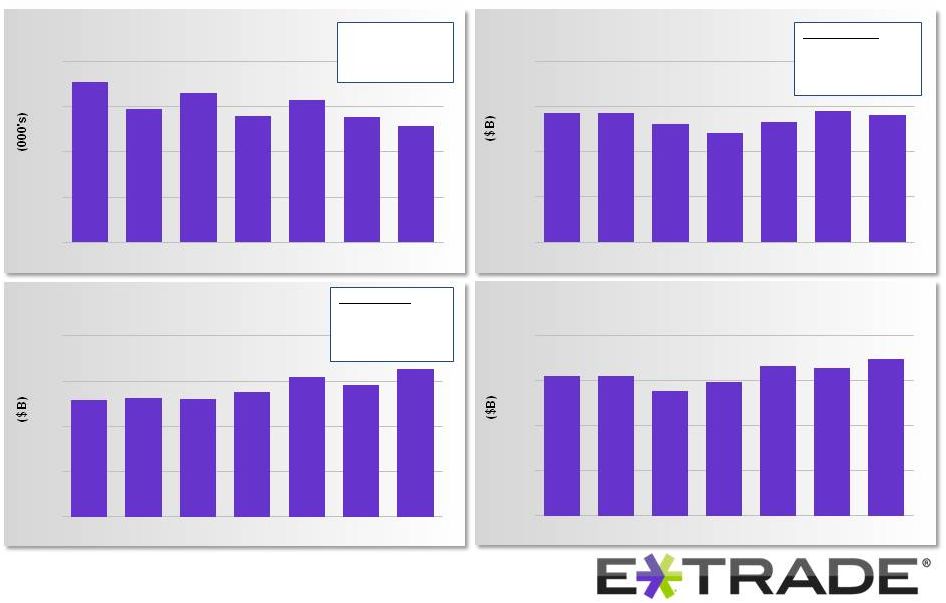
12
DARTs
Average cost:
2010: 12bps
2011: 11bps
YTD 2012: 12bps
2010: 151k
2011: 157k
YTD 2012: 141k
Average yield:
2010: 442bps
2011: 413bps
YTD 2012: 395bps
Retirement assets
Improve market position in retail brokerage
Accelerate growth of the customer franchise
177
148
165
140
157
139
129
$5.7
$5.7
$5.2
$5.3
$5.8
$5.6
$4.8
Customer margin
receivables
200
150
100
50
0
Q1 11
Q2 11
Q3 11
Q4 11
Q1 12
Q2 12
Q3 12
12
©
2012 E*TRADE Financial Corporation all rights reserved
$8
$6
$4
$2
$0
Q1 11
Q2 11
Q3 11
Q4 11
Q1 12
Q2 12
Q3 12
Brokerage-related
cash
$40
$30
$20
$10
$0
Q1 11
Q2 11
Q3 11
Q4 11
Q1 12
Q2 12
Q3 12
$26
$26
$26
$28
$31
$33
$29
$40
$30
$20
$10
$0
Q1 11
Q2 11
Q3 11
Q4 11
Q1 12
Q2 12
Q3 12
$31
$31
$28
$30
$33
$33
$35 |
 #1 ranking
in Kiplinger’s 2012 Best Online Brokers
-
five stars in Investment
Choices
Financial Consultant network highlights
Increased Financial Consultant headcount by over
40% since year-end 2010
Estimated 12% share of our customers’
investible
assets (36% for active traders; 10% for investors)
(15)
Identified segments best served by proactive
engagement with Financial Consultants
—
1-year post assignment seeing significant
improvement in engagement and retention
Accounts &
assets
8,100+ mutual funds
—
4,600 no-load
—
6,900 NTF
50,000+ bonds
Managed Accounts
(MIP & UMA)
Integrated into
advertising
Headcount of 270
Increased asset
penetration 1 year post
assignment
Complementary
retirement & portfolio
consultations
Products
†
Services
Financial
Consultants
Enhance position in retirement & investing
†
Unified Managed Accounts and Managed Investment Portfolios are offered by E*TRADE Capital
Management ©
2012 E*TRADE Financial Corporation all rights reserved
13
SM
Every ETF sold
Chartered Retirement
Planning Counselors
Retirement education
80+ Comm. Free
$34.6 billion in
retirement assets
20% of $174 billion of
brokerage-related assets
796k retirement
accounts
28% of brokerage accounts
$1.1 billion in managed
accounts
(2.5 years post inception) |
 Market making
business Leveraging world class technologies and superior execution
capabilities
Leading market share in ADRs; growing market share in
National Market Securities
Growing base of external customers, comprising 45+ external
clients
(47% y/y growth), and accounting for approximately half
of market making revenue
Corporate Services Group
Build on market leadership with 1,400+ corporate clients,
representing +20% of S&P 500
Foster strategically important channel for new brokerage
accounts, accounting for 25-30% of gross new accounts
1.1 million accounts; $23B in vested and $48B in unvested
options
Proceeds retention of 35%+ 3 months post exercise,
and 15%+ 12 months post exercise
Principal transactions revenue ($M)
Stock plan administration for
public companies
E*TRADE
#2 Player
#3 Player
6+ other providers
Capitalize on value of complementary brokerage businesses
©
2012 E*TRADE Financial Corporation all rights reserved
14
22%
48%
20%
10%
$30
$25
$20
$15
$10
$5
$0
$30
$24
$27
$25
$24
$21
$22 |
 ©
2012 E*TRADE Financial Corporation all rights reserved
15
Improvement in asset composition…
…Funding mix also continues to improve
•
Legacy loan portfolio now accounts for less than 30% of
average interest-earning assets, down from 55% in 3Q 2007
•
Average loan portfolio balances are down 64% from peak in
3Q 2007
•
Bank risk weighted assets are down 42% from peak in 3Q
2007, while average total assets are down 24%
•
More expensive wholesale funding channel now accounts
for only 17% of average interest-bearing liabilities, down
from 38% at its peak in 3Q 2007
•
Average wholesale funding is down 65% from its peak in 3Q
2007
•
Balance sheet strategy going forward is liability-driven, by
brokerage cash
Favorable mix shift in assets (lower risk) and liabilities (lower-cost)
Continue to manage and de-risk the Bank
15
©
2012 E*TRADE Financial Corporation all rights reserved
Agency securities, cash, and other
Legacy loans
Brokerage-related deposits and other
Wholesale funding
60
50
40
30
20
10
0
60
50
40
30
20
10
0
1Q
2007
1Q
2007
3Q
2007
1Q
2008
3Q
2008
1Q
2009
3Q
2009
1Q
2010
3Q
2010
1Q
2011
3Q
2011
1Q
2012
3Q
2012
1Q
2012
3Q
2012
3Q
2007
1Q
2008
3Q
2008
1Q
2009
3Q
2009
1Q
2010
3Q
2010
1Q
2011
3Q
2011 |
 ©
2012 E*TRADE Financial Corporation all rights reserved
16
Continue to manage and de-risk the Bank
Mitigate credit losses on legacy loan portfolio
Delinquencies
Loans 30-89 days past due
Provision for loan losses
Down 68%
from peak
in Q4 08
Down 73%
from peak
In 3Q 08
$1,200
$1,000
$800
$600
$400
$200
$0
$600
$500
$400
$300
$200
$100
$0
($ B)
Loan Balance
9/30/07
(16)
Paydowns
(17)
Charge-offs
Loan Balance
9/30/12
(16)
Average age
1-4 Family loans
Home equity
Consumer
TOTAL
$17
$12
$3
$32
($10)
($5)
($2)
($17)
($1)
($3)
($0)
($4)
$6
$4
$1
$11
6.4 yrs
6.7 yrs
8.8 yrs
©
2012 E*TRADE Financial Corporation all rights reserved
16
66% decline
Untimely reported borrower
bankruptcies
Provision
Qualitative reserve |
 ©
2012 E*TRADE Financial Corporation all rights reserved
17
Coverage of non-modified loans
Coverage of modified loans
Components of allowance for loan losses
(18)
Continue to manage and de-risk the Bank
Mitigate credit losses on legacy loan portfolio
1.2
0.9
0.6
0.3
0.0
4Q 10
1Q 10
2Q 10
3Q 10
1Q 11
2Q 11
3Q 11
4Q 11
1Q 12
2Q 12
3Q 12
90+ days past due non-modified loans
General reserve as a % of 90+ days past due non-modified loans
Modified loans
Prior charge-offs
Total expected losses on modified loans
1.8
1.2
0.6
0.0
1.8
1.2
0.6
0.0
80%
60%
40%
20%
0%
80%
60%
40%
20%
0%
1Q
2Q
3Q
4Q
1Q
2Q
3Q
4Q
1Q
2Q
3Q
2010
2010
2010
2010
2011
2011
2011
2011
2012
2012
2012
1Q
2Q
3Q
4Q
1Q
2Q
3Q
4Q
1Q
2Q
3Q
2010
2010
2010
2010
2011
2011
2011
2011
2012
2012
2012
©
2012 E*TRADE Financial Corporation all rights reserved
17
(18)
General reserve
= Expected losses over next 12 months for non-modified loans
Specific Valuation Allowance
= Expected losses over remaining life of modified loans
Qualitative reserve
= Accounts for factors not directly considered in our quantitative model
(19) |
 Continue to
manage and de-risk the Bank Optimize value of customer deposits
Average interest earning assets & net interest spread
Current drivers of net interest spread
1Q 10
2Q 10
3Q 10
4Q 10
1Q 11
2Q 11
3Q 11
4Q 11
1Q 12
2Q 12
3Q 12
$42.4
$41.0
$39.7
$41.5
$42.7
$42.9
$42.6
$42.7
$44.9
$44.8
$44.9
2.96%
2.89%
2.95%
2.88%
2.84%
2.89%
2.81%
2.66%
2.49%
2.44%
2.28%
©
2012 E*TRADE Financial Corporation all rights reserved
18
•
Deleveraging actions and resulting smaller balance sheet
•
Proactive and scheduled rundown of wholesale borrowings
•
Runoff of higher yielding legacy loan portfolio
•
Declining marginal reinvestment rate on agency securities |
 •
Avg loan size: $461k
•
84% of non-TDR portfolio is
adjustable for rate or amortization
•
Over $2.7B has previously reset
Continue to manage and de-risk the Bank
Visibility into future drivers of net interest spread
•
Loan portfolio continues to run off at approximately 20%
per year
•
Nearly 90% of 1-4 family loans resetting in the remainder
of 2012 are expected to reset to a lower payment
•
Majority of home equity lines do not begin to amortize
until after 2015, and balances continue to decline
•
Hedges on wholesale funding channels require us to
continue issuing short-term debt for next several years
Average cost 3-4%
1-4 family mortgages
Home equity lines of credit
•
Avg loan size: $74K
(20)
•
Avg est increase at conversion:
$150-200/mo. payment
2011
and prior
2011
and prior
19
$0.01
$0.2
$0.2
$0.3
$0.8
$1.0
0%
20%
40%
60%
80%
100%
$0.0
$0.4
$0.8
$1.2
$1.6
$2.0
$2.4
2012
2013
2014
2015
2016
2017
payment resets by year
Prior first-time resets
First-time resets
% of total first
time resets
0.0
1.0
2.0
3.0
4.0
5.0
8.0
Wholesale funding obligations will
expire over next ten years
$0.2
0.09
$0.2
$0.2
$0.9
$1.4
$0.4
0%
20%
40%
60%
80%
100%
$0.0
$0.4
$0.8
$1.2
$1.6
2012
2013
2014
2015
2016
2017
I/O to amortizing conversions
Prior conversions
Conversions
% of total conversions
6.0
7.0
$
©
2012 E*TRADE Financial Corporation all rights reserved
$0.9
$1.8 |
 •
Prolonged low interest rate environment
•
Home prices
•
Weak consumer / investor confidence
•
Heightened regulatory sensitivity
Environmental
Challenges
•
Mitigate credit losses on legacy loan portfolio
•
Improve capital structure
•
Complete regulatory transition to OCC & Fed
•
Build out enterprise risk management function
E*TRADE
Challenges
•
Accelerate growth of customer franchise
•
Expand brand as a trusted retirement and investing
provider
•
Cost reduction / efficiency gains
E*TRADE
Opportunities
Challenges and opportunities
©
2012 E*TRADE Financial Corporation all rights reserved
20 |
 |
 (1)
Excludes
impact
of
the
debt
exchange.
In
the
third
quarter
of
2009,
the
Company
exchanged
$1.7
billion
aggregate
principal
amount
of
interest-bearing
corporate
debt
for
an
equal
principal
amount of
newly-
issued
non-interest-bearing
convertible
debentures.
This
Debt
Exchange
resulted
in
a
non-cash
pre-tax
charge
of
$968
million.
The
following
table
provides
a
reconciliation
of
GAAP
net loss
to
non-
GAAP
net
loss
for
FY2009:
Appendix
(a)
Under
the
regulatory
guidelines
for
risk-based
capital,
on-balance
sheet
assets
and
credit
equivalent
amounts
of
derivatives
and
off-balance
sheet
items
are
assigned
to
one
of
several
broad
risk
categories
according
to
the
obligor
or,
if
relevant,
the
guarantor
or
the
nature
of
any
collateral.
The
aggregate
dollar
amount
in
each
risk
category
is
then
multiplied
by
the
risk
weight
associated
with
that
category.
The
resulting
weighted
values
from
each
of
the
risk
categories
are
aggregated
for
determining
total
risk-weighted
assets.
($000s)
FY 2009
Pre-tax loss
(1,835,431)
$
Add back: non-cash charge on Debt Exchange
968,254
Adjusted pre-tax loss
(867,177)
$
Q3 2012
Shareholders' equity
5,093.9
$
DEDUCT:
Losses in OCI on AFS debt securities and cash flow hedges, net of tax
(307.6)
Goodwill and other intangible assets, net of deferred tax liabilities
1,897.6
ADD:
Qualifying restricted core capital elements (TRUPs)
433.0
Subtotal
3,936.9
DEDUCT:
Disallowed servicing assets and deferred tax assets
1,259.1
Tier 1 capital
2,677.8
ADD:
Allowable allowance for loan losses
261.6
Total capital
2,939.4
$
Total average assets
49,400.8
$
DEDUCT:
Goodwill and other intangible assets, net of deferred tax liabilities
1,897.6
Subtotal
47,503.2
DEDUCT:
Disallowed servicing assets and deferred tax assets
1,259.1
Average total assets for leverage capital purposes
46,244.1
$
Total risk-weighted assets
(a)
20,614.9
$
Tier 1 leverage ratio (Tier 1 capital / Average total assets for
leverage
capital purposes)
5.8%
Tier 1 capital / Total risk-weighted assets
13.0%
Total capital / Total risk-weighted assets
14.3%
22
(2)
The
parent
total
capital
to
risk-weighted
assets,
Tier
1
capital
to
risk-weighted
assets
and
Tier
1
leverage
capital
ratios
are
based
on
the
Federal
Reserve
regulatory
minimum
well-capitalized
threshold,
although
the
parent
is
not
currently
subject
to
capital
requirements.
See
the
below
table
(dollars
in
millions)
and
the
Company’s
Form
10-Q
filed
November
1,
2012
for
a
reconciliation
of
those
non-
GAAP
measures
to
the
comparable
GAAP
measures.
©
2012 E*TRADE Financial Corporation all rights reserved
|
 Appendix
(3)
The
parent
Tier
1
common
ratio
is
Tier
1
capital
less
elements
of
Tier
1
capital
that
are
not
in
the
form
of
common
equity,
such
as
trust
preferred
securities,
divided
by
total
risk-weighted
assets
for
the
holding
company.
The
holding
company
is
not
yet
held
to
the
capital
requirements;
as
such,
the
7.0%
well-capitalized
threshold
is
not
based
on
regulatory
guidance.
See
below
table
(dollars
in
millions)
and
the
Company’s
Form
10-Q
filed
November
1,
2012
for
a
reconciliation
of
the
non-GAAP
measure
of
Tier
1
common
ratio
to
the
comparable
GAAP
measure.
(4)
Excess
to
regulatory
well
capitalized
minimums.
Debt
outstanding
does
not
include
the
Company’s
new
notes
issued
subsequent
to
3Q
2012
quarter-end.
(5)
Strategic
and
Capital
Plan
composed
of
the
Company’s
assumptions
and
targets.
Any
capital
distributions
would
be
subject
to
regulatory
approval
at
that
time.
(6)
Approximately
$1
billion
in
customer
payables
balances
have
received
regulatory
approval
for
conversion
to
money
funds,
with
approximately
$900M
scheduled
for
completion
during
Q4
2012
and
the
remainder
scheduled
during
Q1
2013.
(7)
Schedule
and
estimated
improvement
to
earnings
is
for
illustrative
purposes
and
does
not
attempt
to
forecast
future
tax
rates.
Therefore,
it
assumes
a
general
corporate
effective
tax
rate
of
38%.
The
GAAP
interest
expense
column
includes
stated
cash
interest
expense
on
the
notes,
as
well
as
2013
scheduled
amortization
of
the
original
issue
discount
on
the
12.5%
Springing
Lien
Notes
due
2017.
The
after-tax
row
accounts
for
the
non-deductibility
of
a
portion
of
the
interest
expense
on
the
2017
notes.
(8)
Assumes
tax
rate
of
38%.
(9)
E*TRADE
Securities
ratings
for
Online
Broker
by
SmartMoney
Magazine,
May
2012
Broker
Survey,
based
on
the
following
categories:
Trading
Tools
(5
stars),
Customer
Service
(4
stars),
Banking
Services
(4
stars),
Mutual
Funds
&
Investment
Products
(4
stars),
Research
(5
stars),
and
Commissions
and
Fees
(2
stars).
SmartMoney
is
a
registered
trademark,
a
joint
publishing
venture
between
Dow
Jones
&
Company,
Inc.
and
Hearst
SM
Partnership.
(10)
E*TRADE
Securities
ratings
for
Barron's
annual
ranking
of
the
Best
Online
Brokers
(March
12,
2012),
based
on
Trade
Experience
and
Technology,
Usability,
Mobile,
Range
of
Offerings,
Research
Amenities,
Portfolio
Analysis
&
Reports,
Customer
Service
&
Education
and
Costs.
E*TRADE
overall
ranked
#10.
(11)
E*TRADE
Securities
ratings
for
Online
Broker
by
Kiplinger
Personal
Finance,
November
2012
Online
Broker
Survey,
based
on
the
following
categories:
Investment
Choices
(5
stars),
Customer
Service
(5
stars),
User
Experience(4.5
stars),
Research
and
Tools
(4
stars),
Banking
(3.5
stars),
and
Fees
&
Commissions
(2.5
stars).
©
2012
The
Kiplinger
Washington
Editors.
All
rights
reserved.
(12)
The
attrition
rate
is
calculated
by
dividing
attriting
(a)
brokerage
accounts,
by
total
brokerage
accounts,
for
the
previous
period
end.
This
measure
is
presented
annually
and
on
an
annualized
basis
(where
it
appears
quarterly).
(a)
Attriting
brokerage
accounts:
Gross
new
brokerage
accounts,
less
net
new
brokerage
accounts.
(13)
The
net
new
brokerage
assets
metrics
treat
asset
flows
between
E*TRADE
entities
in
the
same
manner
as
unrelated
third
party
accounts.
(14)
Average
brokerage
assets
per
account
is
calculated
as
the
sum
of
security
holdings
and
brokerage
related
cash
divided
by
end
of
period
brokerage
accounts.
23
Q3 2012
Shareholders' equity
5,093.9
$
DEDUCT:
Losses in OCI on AFS debt securities and cash flow hedges, net of tax
(307.6)
Goodwill and other intangible assets, net of deferred tax liabilities
1,897.6
Subtotal
3,503.9
DEDUCT:
Disallowed servicing assets and deferred tax assets
1,259.1
Tier 1 common
2,244.8
$
Total risk-weighted assets
20,614.9
$
Tier 1 common ratio (Tier 1 common / Total risk-weighted assets)
10.9%
©
2012 E*TRADE Financial Corporation all rights reserved
|
 Appendix
(15) Based on data as of 6/30/12.
(16) Represents unpaid principal balances.
(17)
(18) Increased the qualitative reserve in Q4 2011 in anticipation of losses related to a
review of modification policies and practices pursuant to regulatory transition. Review was completed in Q1 2012:
Certain modified loans were charged-off against previously established SVA and the
qualitative reserve. (19) The total expected losses on TDRs includes both the
previously recorded charge-offs and the specific valuation allowance. (20) Excludes
$0 balance home equity lines of credit. 24
©
2012 E*TRADE Financial Corporation all rights reserved
Net paydowns includes paydowns on loans as well as limited origination activity, home equity
advances, repurchase activity, limited sale and securitization activities and transfers to real estate owned
assets. |