Attached files
| file | filename |
|---|---|
| 8-K - FORM 8-K - LegacyTexas Financial Group, Inc. | d429993d8k.htm |
| EX-99.1 - EX-99.1 - LegacyTexas Financial Group, Inc. | d429993dex991.htm |
Exhibit 99.2
| 1 NASDAQ: VPFG Third Quarter 2012 Earnings Kevin Hanigan - President and Chief Executive Officer Patti McKee - Executive Vice President and Chief Financial Officer |
| 2 Safe Harbor Statement Certain matters discussed on this call may contain forward^looking statements, which are subject to risks and uncertainties. A number of factors, many of which are beyond ViewPoint Financial Group, Inc.'s control, could cause actual results to differ materially from future results expressed or implied by such forward^looking statements. These risks and uncertainties include the risk of adverse impacts from general economic conditions, competition, interest rate sensitivity and exposure to regulatory and legislative changes. These and other factors that could cause results to differ materially from those described in the forward^looking statements can be found in our annual report on Form 10^K for the year ended December 31, 2011, and in other filings made by ViewPoint Financial Group, Inc. with the Securities and Exchange Commission. |
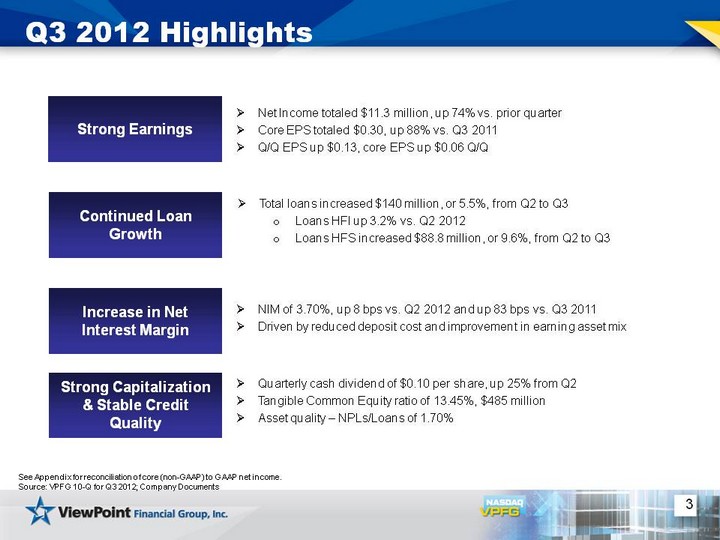
| 3 Q3 2012 Highlights Net Income totaled $11.3 million, up 74% vs. prior quarter Core EPS totaled $0.30, up 88% vs. Q3 2011 Q/Q EPS up $0.13, core EPS up $0.06 Q/Q Strong Earnings Continued Loan Growth Total loans increased $140 million, or 5.5%, from Q2 to Q3 Loans HFI up 3.2% vs. Q2 2012 Loans HFS increased $88.8 million, or 9.6%, from Q2 to Q3 Increase in Net Interest Margin NIM of 3.70%, up 8 bps vs. Q2 2012 and up 83 bps vs. Q3 2011 Driven by reduced deposit cost and improvement in earning asset mix Strong Capitalization & Stable Credit Quality Quarterly cash dividend of $0.10 per share, up 25% from Q2 Tangible Common Equity ratio of 13.45%, $485 million Asset quality - NPLs/Loans of 1.70% See Appendix for reconciliation of core (non-GAAP) to GAAP net income. Source: VPFG 10-Q for Q3 2012; Company Documents |
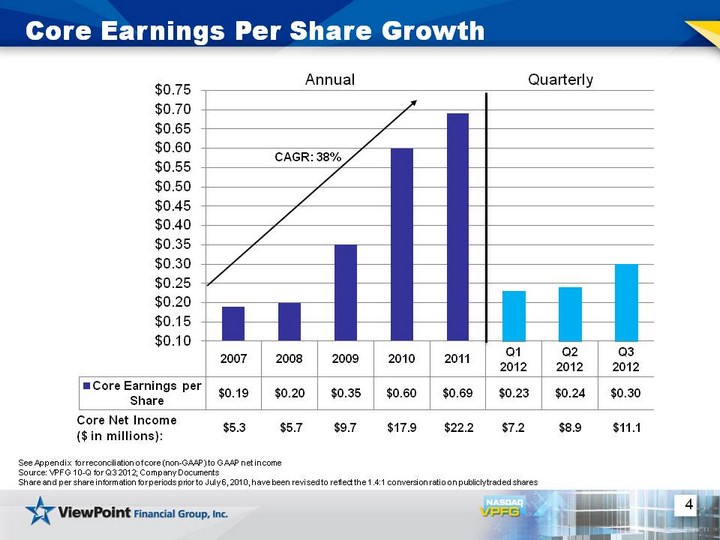
| 4 Core Earnings Per Share Growth CAGR: 38% See Appendix for reconciliation of core (non-GAAP) to GAAP net income Source: VPFG 10-Q for Q3 2012; Company Documents Share and per share information for periods prior to July 6, 2010, have been revised to reflect the 1.4:1 conversion ratio on publicly traded shares Annual Quarterly Core Net Income ($ in millions): $5.3 $5.7 $9.7 $17.9 $22.2 $7.2 $8.9 $11.1 |
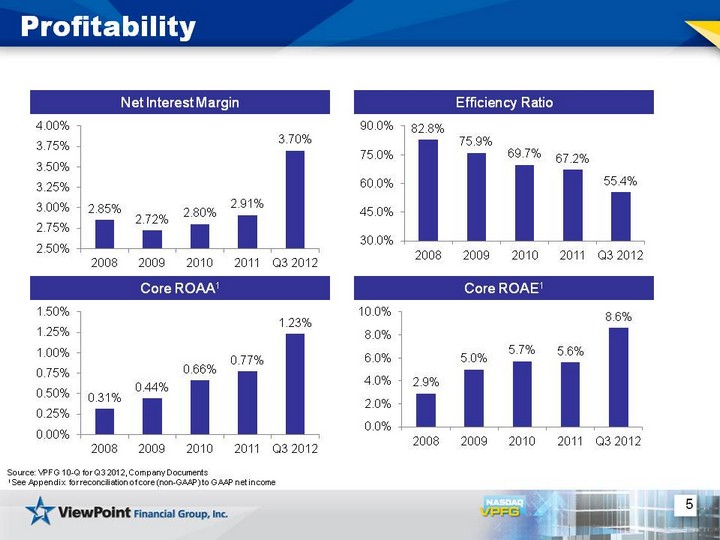
| 5 Profitability Net Interest Margin Source: VPFG 10-Q for Q3 2012, Company Documents 1 See Appendix for reconciliation of core (non-GAAP) to GAAP net income Efficiency Ratio Core ROAA1 Core ROAE1 |
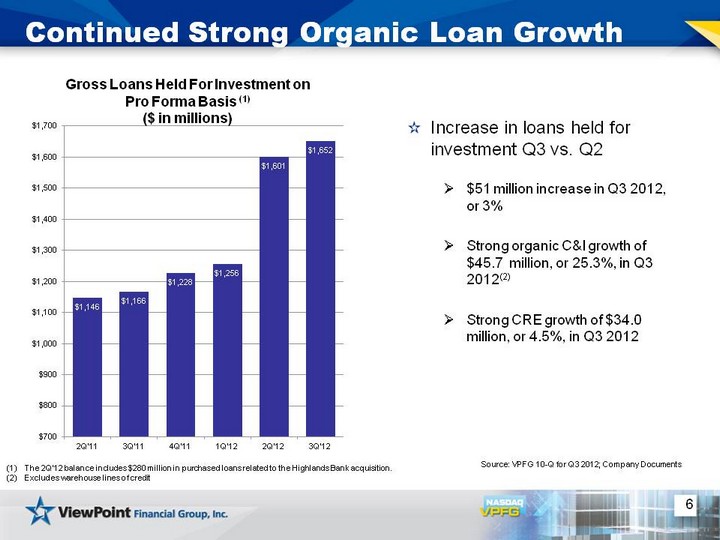
| 6 Continued Strong Organic Loan Growth Increase in loans held for investment Q3 vs. Q2 $51 million increase in Q3 2012, or 3% Strong organic C&I growth of $45.7 million, or 25.3%, in Q3 2012(2) Strong CRE growth of $34.0 million, or 4.5%, in Q3 2012 Gross Loans Held For Investment on Pro Forma Basis (1) ($ in millions) Source: VPFG 10-Q for Q3 2012; Company Documents The 2Q'12 balance includes $280 million in purchased loans related to the Highlands Bank acquisition. Excludes warehouse lines of credit |
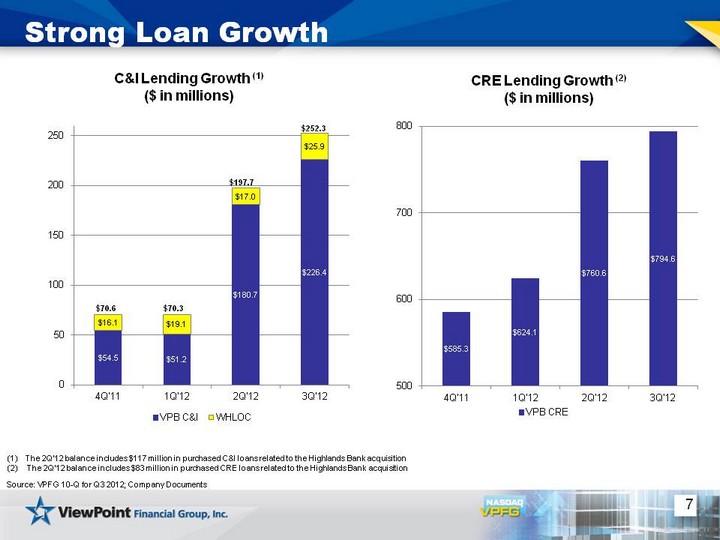
| 7 Strong Loan Growth C&I Lending Growth (1) ($ in millions) Source: VPFG 10-Q for Q3 2012; Company Documents The 2Q'12 balance includes $117 million in purchased C&I loans related to the Highlands Bank acquisition The 2Q'12 balance includes $83 million in purchased CRE loans related to the Highlands Bank acquisition CRE Lending Growth (2) ($ in millions) |
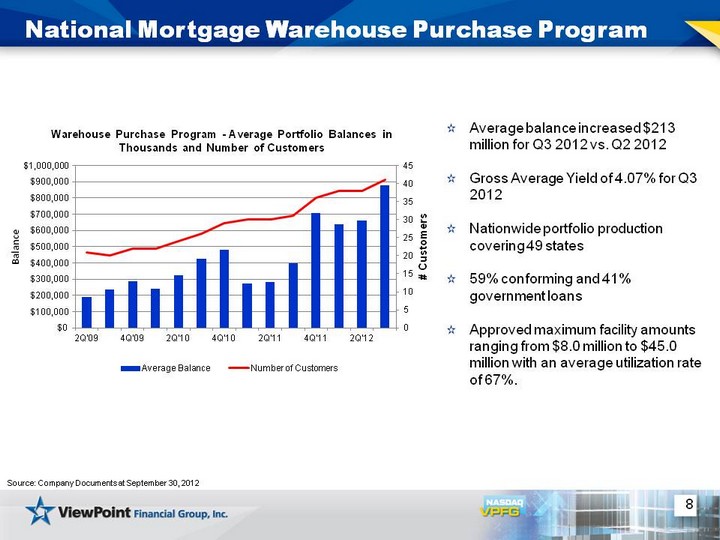
| 8 National Mortgage Warehouse Purchase Program Source: Company Documents at September 30, 2012 Average balance increased $213 million for Q3 2012 vs. Q2 2012 Gross Average Yield of 4.07% for Q3 2012 Nationwide portfolio production covering 49 states 59% conforming and 41% government loans Approved maximum facility amounts ranging from $8.0 million to $45.0 million with an average utilization rate of 67%. |
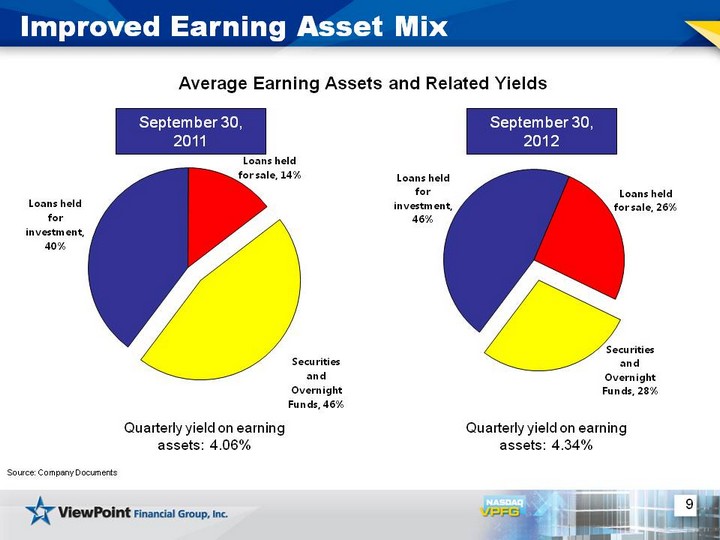
| 9 Improved Earning Asset Mix Source: Company Documents Average Earning Assets and Related Yields September 30, 2011 September 30, 2012 Quarterly yield on earning assets: 4.06% Quarterly yield on earning assets: 4.34% |
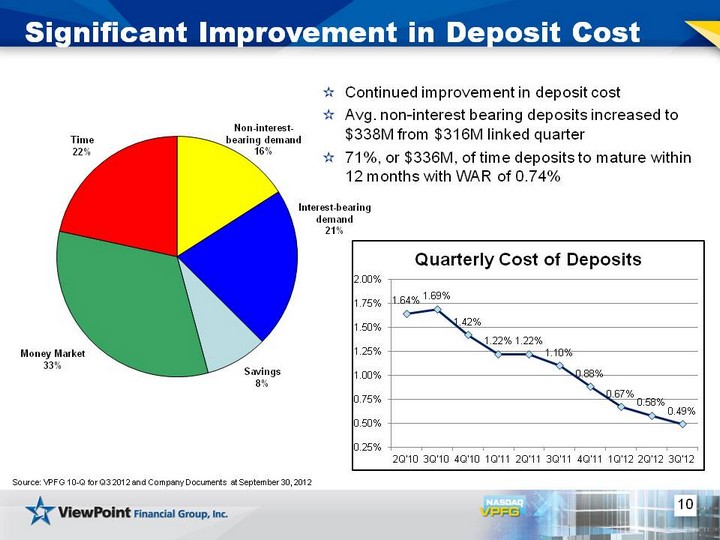
| 10 Significant Improvement in Deposit Cost Source: VPFG 10-Q for Q3 2012 and Company Documents at September 30, 2012 Continued improvement in deposit cost Avg. non-interest bearing deposits increased to $338M from $316M linked quarter 71%, or $336M, of time deposits to mature within 12 months with WAR of 0.74% |
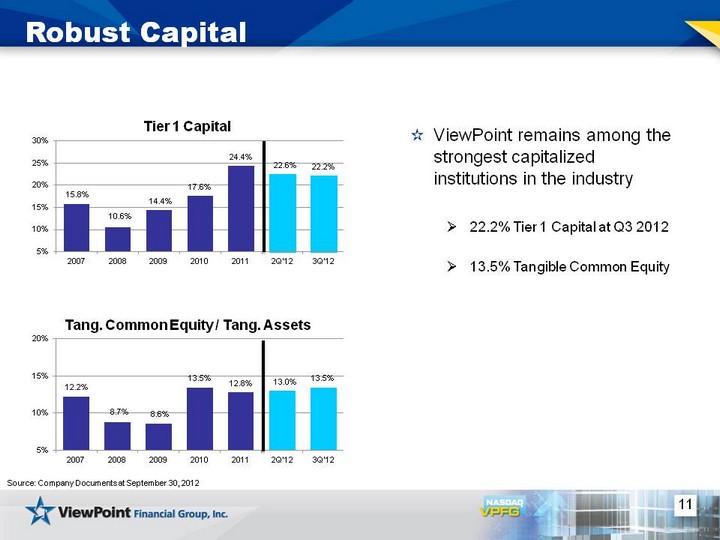
| 11 Robust Capital Tier 1 Capital Tang. Common Equity / Tang. Assets ViewPoint remains among the strongest capitalized institutions in the industry 22.2% Tier 1 Capital at Q3 2012 13.5% Tangible Common Equity Source: Company Documents at September 30, 2012 |
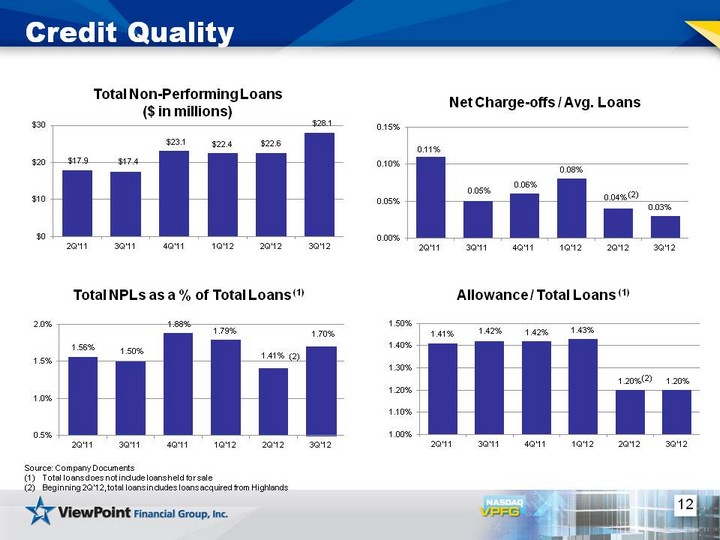
| 12 Credit Quality Total Non-Performing Loans ($ in millions) Total NPLs as a % of Total Loans (1) Allowance / Total Loans (1) Net Charge-offs / Avg. Loans Source: Company Documents Total loans does not include loans held for sale Beginning 2Q'12, total loans includes loans acquired from Highlands (2) (2) (2) |
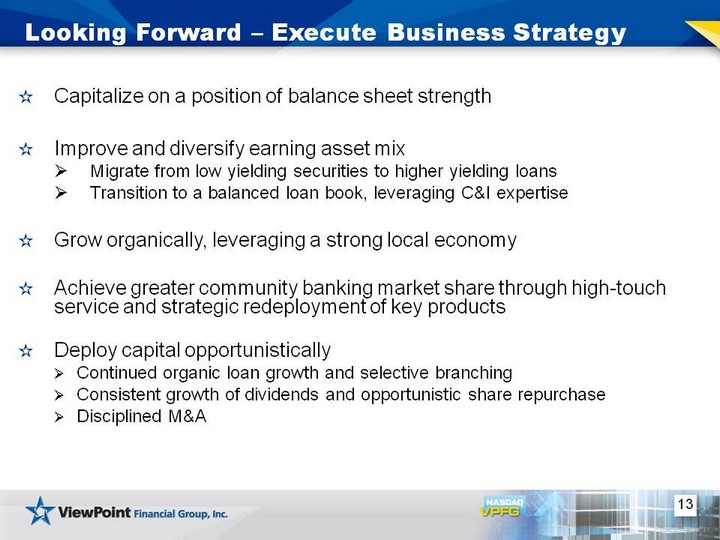
| 13 Capitalize on a position of balance sheet strength Improve and diversify earning asset mix Migrate from low yielding securities to higher yielding loans Transition to a balanced loan book, leveraging C&I expertise Grow organically, leveraging a strong local economy Achieve greater community banking market share through high-touch service and strategic redeployment of key products Deploy capital opportunistically Continued organic loan growth and selective branching Consistent growth of dividends and opportunistic share repurchase Disciplined M&A Looking Forward - Execute Business Strategy |

| 14 Questions? |
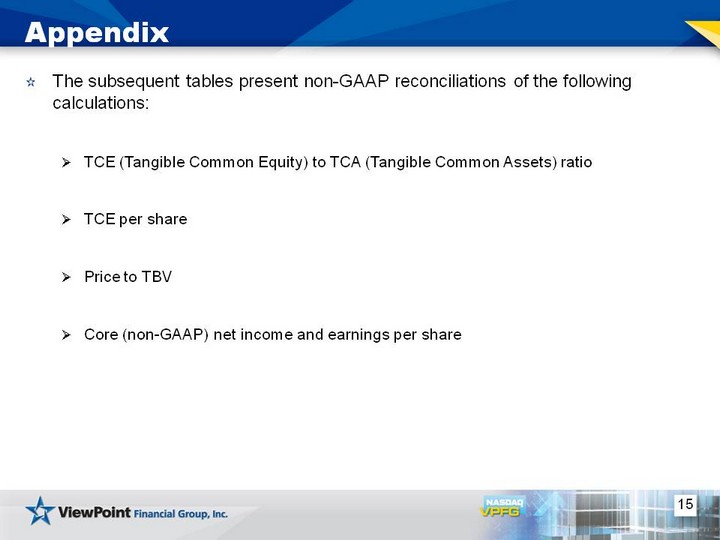
| 15 Appendix The subsequent tables present non-GAAP reconciliations of the following calculations: TCE (Tangible Common Equity) to TCA (Tangible Common Assets) ratio TCE per share Price to TBV Core (non-GAAP) net income and earnings per share |
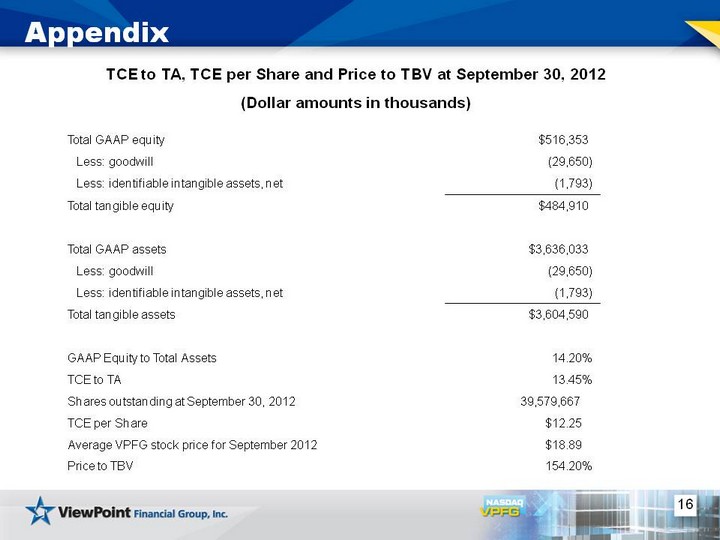
| 16 Appendix TCE to TA, TCE per Share and Price to TBV at September 30, 2012 (Dollar amounts in thousands) Total GAAP equity $516,353 Less: goodwill (29,650) Less: identifiable intangible assets, net (1,793) Total tangible equity $484,910 Total GAAP assets $3,636,033 Less: goodwill (29,650) Less: identifiable intangible assets, net (1,793) Total tangible assets $3,604,590 GAAP Equity to Total Assets 14.20% TCE to TA 13.45% Shares outstanding at September 30, 2012 39,579,667 TCE per Share $12.25 Average VPFG stock price for September 2012 $18.89 Price to TBV 154.20% |
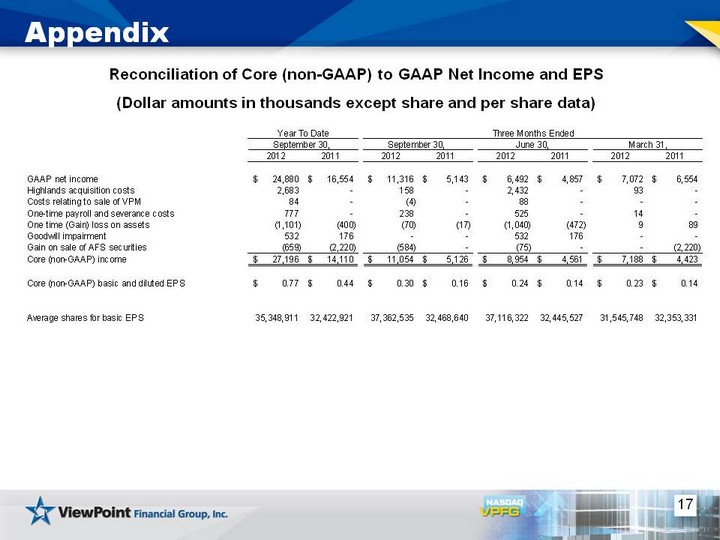
| 17 Appendix Reconciliation of Core (non-GAAP) to GAAP Net Income and EPS (Dollar amounts in thousands except share and per share data) |
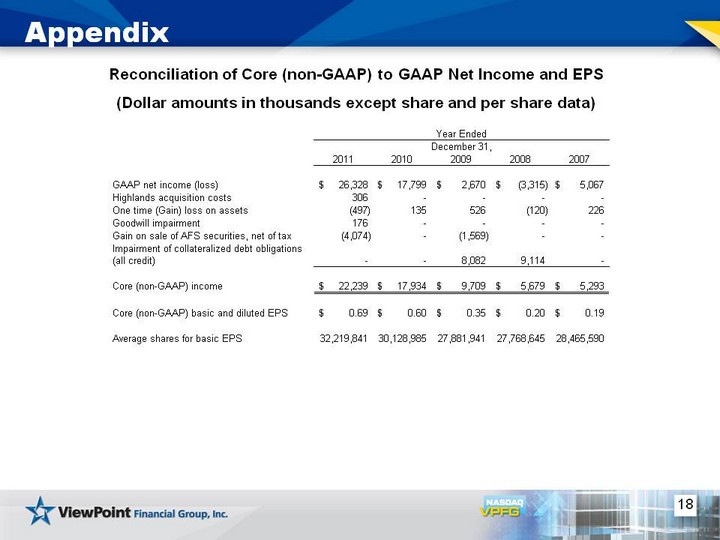
| 18 Appendix Reconciliation of Core (non-GAAP) to GAAP Net Income and EPS (Dollar amounts in thousands except share and per share data) |