Attached files
| file | filename |
|---|---|
| EX-32 - EXHIBIT 32 - LegacyTexas Financial Group, Inc. | exhibit32020161231.htm |
| EX-31.2 - EXHIBIT 31.2 - LegacyTexas Financial Group, Inc. | exhibit31220161231.htm |
| EX-31.1 - EXHIBIT 31.1 - LegacyTexas Financial Group, Inc. | exhibit31120161231.htm |
| EX-23 - EXHIBIT 23 - LegacyTexas Financial Group, Inc. | exhibit23020161231.htm |
| EX-21 - EXHIBIT 21 - LegacyTexas Financial Group, Inc. | exhibit21020161231.htm |
UNITED STATES
SECURITIES AND EXCHANGE COMMISSION
Washington, D.C. 20549
FORM 10-K
(Mark One)
þ | ANNUAL REPORT PURSUANT TO SECTION 13 OR 15(d) OF THE SECURITIES EXCHANGE ACT OF 1934 | |
For the fiscal year ended December 31, 2016
OR
¨ | TRANSITION REPORT PURSUANT TO SECTION 13 OR 15(d) OF THE SECURITIES EXCHANGE ACT OF 1934 | |
For the transition period from to
Commission file number 001-34737
LEGACYTEXAS FINANCIAL GROUP, INC.
(Exact name of registrant as specified in its charter)
Maryland | 27-2176993 | |
(State or other jurisdiction of incorporation or organization) | (I.R.S. Employer Identification No.) | |
5851 Legacy Circle, Plano, Texas | 75024 | |
(Address of Principal Executive Offices) | (Zip Code) | |
Registrant’s telephone number, including area code: (972) 578-5000
Securities registered pursuant to Section 12(b) of the Act:
Name of Each Exchange on Which | ||
Title of Each Class | Registered | |
Common Stock, par value $0.01 per share | Nasdaq Global Select Market | |
Securities registered pursuant to Section 12(g) of the Act: None
Indicate by check mark if the registrant is a well-known seasoned issuer, as defined in Rule 405 of the Securities Act. Yes þ No ¨
Indicate by check mark if the registrant is not required to file reports pursuant to Section 13 or Section 15(d) of the Act. Yes ¨ No þ
Indicate by check mark whether the registrant (1) has filed all reports required to be filed by Section 13 or 15(d) of the Securities Exchange Act of 1934 during the preceding 12 months (or for such shorter period that the registrant was required to file such reports) and (2) has been subject to such filing requirements for the past 90 days. Yes þ No ¨
Indicate by check mark whether the registrant has submitted electronically and posted on its corporate Web site, if any, every Interactive Data File required to be submitted and posted pursuant to Rule 405 of Regulation S-T during the preceding 12 months (or for such shorter period that the registrant was required to submit and post such files). Yes þ No ¨
Indicate by check mark if disclosure of delinquent filers pursuant to Item 405 of Regulation S-K is not contained herein, and will not be contained, to the best of registrant’s knowledge, in definitive proxy or information statement incorporated by reference in Part III of this Form 10-K or any amendment to this Form 10-K. ¨
Indicate by check mark whether the registrant is a large accelerated filer, an accelerated filer, a non-accelerated filer, or a smaller reporting company. See the definitions of “large accelerated filer,” “accelerated filer” and “smaller reporting company” in Rule 12b-2 of the Exchange Act. (Check one):
Large accelerated filer þ | Accelerated filer ¨ | Non-accelerated filer ¨ | Smaller reporting company ¨ | |||
(Do not check if a smaller reporting company) | ||||||
Indicate by check mark whether the registrant is a shell company (as defined in Rule 12b-2 of the Act). Yes ¨ No þ
The aggregate market value of the voting and non-voting common equity held by nonaffiliates of the Registrant was $1,245.8 million as of June 30, 2016, the last business day of the Registrant’s most recently completed second fiscal quarter. Solely for the purpose of this computation, it has been assumed that executive officers and directors of the Registrant are “affiliates”.
There were issued and outstanding 47,886,498 shares of the Registrant’s common stock as of February 7, 2017.
DOCUMENTS INCORPORATED BY REFERENCE:
Document | Part of Form 10-K | |
Portions of the definitive Proxy Statement to be used in conjunction with the Registrant’s Annual Meeting of Shareholders to be held on May 22, 2017. | Part III | |
LEGACYTEXAS FINANCIAL GROUP, INC.
FORM 10-K
December 31, 2016
INDEX
Page | |
PART I
Item 1. | Business |
The disclosures set forth in this item are qualified by Item 1A. Risk Factors and the section captioned “Special Note Regarding Forward-Looking Statements” in Item 7. Management’s Discussion and Analysis of Financial Condition and Results of Operations of this report and other cautionary statements set forth elsewhere in this report.
General
LegacyTexas Financial Group, Inc. is a Maryland corporation and LegacyTexas Bank is its wholly owned principal operating subsidiary. Unless the context otherwise requires, references in this document to the “Company” refer to LegacyTexas Financial Group, Inc. and references to the “Bank” refer to LegacyTexas Bank, the Company's wholly owned operating subsidiary. References to “we,” “us,” and “our” mean LegacyTexas Financial Group, Inc. and/or LegacyTexas Bank, as the context requires.
Regulators of the Bank are the Texas Department of Banking (“TDOB”) and the Board of Governors of the Federal Reserve System (“FRB”) with back-up oversight by the FDIC. The Bank is a Federal Reserve member bank required to have certain reserves and stock set by the FRB and a member of the Federal Home Loan Bank of Dallas, one of the 12 regional banks in the Federal Home Loan Bank System (“FHLB”). The Company is regulated by the FRB.
Business Strategies
Our principal business consists of attracting retail deposits from the general public and the business community and investing those funds, along with borrowed funds, in commercial real estate loans, secured and unsecured commercial and industrial loans, as well as permanent loans secured by first and second mortgages on one-to-four family residences and consumer loans. Additionally, the Warehouse Purchase Program allows mortgage banking company customers to close one-to- four family real estate loans in their own name and manage its cash flow needs until the loans are sold to investors. We also offer title services, as well as brokerage services for the purchase and sale of non-deposit investment and insurance products through a third party brokerage arrangement. Our operating revenues are derived principally from interest earned on interest-earning assets, including loans and investment securities, and service charges and fees on deposits and other account services. Our primary sources of funds are deposits, FHLB advances and other borrowings, and payments received on loans and securities. We offer a variety of deposit accounts that provide a wide range of interest rates and terms, generally including savings, money market, certificate of deposit and demand accounts.
Our principal objective is to be an independent, commercially-oriented, customer-focused financial services company, providing outstanding service and innovative products in our primary market area of North Texas. Our Board of Directors adopted a strategy designed to maintain growth and profitability, a strong capital position and high asset quality. This strategy primarily involves:
• | A strong focus on growth, both organically and through selective acquisitions |
We are a commercial bank that is focused on meeting the needs of businesses and consumers in the North Texas area by organically growing our loan portfolio while maintaining sound asset quality. We intend to fund loan growth with a low-cost deposit base, which includes increasing our non-interest-bearing demand deposits, especially in the commercial sector, and using our wide array of Treasury Management services to serve as a catalyst for deposit growth. We will also continue to pursue selective acquisitions that will enhance our commercial business model.
•An emphasis on the total customer relationship while diversifying income sources and practicing prudent and focused expense management
We offer both commercial and retail customers a wide range of products and services that provide us with diversification of revenue sources and help us to solidify customer relationships. Our focus on commercial loan growth will positively impact interest income, and increasing our non-interest-bearing demand deposit base will help fund loans at a low cost. We aim to know our customers and their businesses better than our competition, provide effective ideas and solutions for their financial needs, and execute the delivery of these products and services in an efficient and professional manner. We plan to balance non-interest income growth through our relationship-driven approach with prudent and focused core expense management.
4
•Maintain sound asset quality
We believe that asset quality is a key to long-term financial success. We seek to maintain sound asset quality and moderate credit risk by strictly adhering to our lending policies, which have historically resulted in low charge-off ratios. As we continue to grow and diversify our loan portfolio, we plan to adhere to sound credit management principles.
•Strategic capital deployment
We plan to maintain strong capital levels while increasing shareholder returns. Our current capital position provides us with the ability to pursue robust organic growth as well as acquisitions that will advance our business strategy.
Market Areas
We are headquartered in Plano, Texas, and currently operate 44 banking offices in the Dallas/Fort Worth Metroplex and surrounding counties. Based on the most recent branch deposit data provided by the FDIC (as of June 2016), we ranked first in deposit share in Collin County, with 17.74% of total deposits, and seventh in the Dallas/Fort Worth Metropolitan Statistical Area, with 2.25% of total deposits.
Our market area includes a diverse population of management, professional and sales personnel, office employees, manufacturing and transportation workers, service industry workers, government employees and self-employed individuals. The population includes a skilled work force with a wide range of education levels and ethnic backgrounds. Major employment sectors include transportation, financial services, health and social services, telecommunications, manufacturing, education, retail trades, and professional services. There are 20 companies headquartered in the Dallas/Fort Worth Metroplex which are on the 2016 Fortune 500 list, including Exxon Mobil, AT&T, American Airlines Group, Kimberly-Clark, Dr. Pepper Snapple Group, Texas Instruments, J.C. Penney, Dean Foods and Southwest Airlines.
For December 2016, the Dallas/Fort Worth Metroplex reported an unemployment rate (not seasonally adjusted) of 3.7%, compared to the national average of 4.5% (source is Bureau of Labor Statistics Local Area Unemployment Statistics Unemployment Rates for Metropolitan Areas, using the Dallas-Fort Worth-Arlington, Texas Metropolitan Statistical Area.)
5
Lending Activities
The following table presents information concerning the composition of our loan portfolio in dollar amounts and in percentages (before deductions for deferred fees and discounts and allowances for loan losses) as of the dates indicated.
December 31, | ||||||||||||||||||||||||||||||||||
2016 | 2015 | 2014 | 2013 | 2012 | ||||||||||||||||||||||||||||||
Amount | Percent | Amount | Percent | Amount | Percent | Amount | Percent | Amount | Percent | |||||||||||||||||||||||||
(Dollars in thousands) | ||||||||||||||||||||||||||||||||||
Loans held for investment: | ||||||||||||||||||||||||||||||||||
Commercial real estate | $ | 2,670,455 | 44.03 | % | $ | 2,177,543 | 42.98 | % | $ | 1,265,868 | 48.06 | % | $ | 1,091,200 | 53.23 | % | $ | 825,340 | 48.81 | % | ||||||||||||||
Commercial and industrial | 1,971,160 | 32.50 | 1,612,669 | 31.83 | 781,824 | 29.69 | 439,430 | 21.43 | 278,525 | 16.48 | ||||||||||||||||||||||||
Construction and land | 294,894 | 4.86 | 269,708 | 5.32 | 21,298 | 0.81 | 30,247 | 1.48 | 21,182 | 1.25 | ||||||||||||||||||||||||
Consumer real estate | 1,074,923 | 17.72 | 936,757 | 18.49 | 524,199 | 19.90 | 441,226 | 21.53 | 506,642 | 29.97 | ||||||||||||||||||||||||
Other consumer | 53,991 | 0.89 | 69,830 | 1.38 | 40,491 | 1.54 | 47,799 | 2.33 | 59,080 | 3.49 | ||||||||||||||||||||||||
Gross loans held for investment, excluding Warehouse Purchase Program | 6,065,423 | 100.00 | % | 5,066,507 | 100.00 | % | 2,633,680 | 100.00 | % | 2,049,902 | 100.00 | % | 1,690,769 | 100.00 | % | |||||||||||||||||||
Net of: | ||||||||||||||||||||||||||||||||||
Deferred fees and discounts, net | (2,251 | ) | (1,860 | ) | (2,927 | ) | (1,267 | ) | 486 | |||||||||||||||||||||||||
Allowance for loan losses | (64,576 | ) | (47,093 | ) | (25,549 | ) | (19,358 | ) | (18,051 | ) | ||||||||||||||||||||||||
Net loans held for investment, excluding Warehouse Purchase Program | 5,998,596 | 5,017,554 | 2,605,204 | 2,029,277 | 1,673,204 | |||||||||||||||||||||||||||||
Warehouse Purchase Program | 1,055,341 | 1,043,719 | 786,416 | 673,470 | 1,060,720 | |||||||||||||||||||||||||||||
Total loans held for investment, net | $ | 7,053,937 | $ | 6,061,273 | $ | 3,391,620 | $ | 2,702,747 | $ | 2,733,924 | ||||||||||||||||||||||||
Loans held for sale | $ | 21,279 | $ | 22,535 | $ | — | $ | — | $ | — | ||||||||||||||||||||||||
6
The following table shows the composition of our loan portfolio by fixed and adjustable rate as of the dates indicated.
December 31, | ||||||||||||||||||||||||||||||||||
2016 | 2015 | 2014 | 2013 | 2012 | ||||||||||||||||||||||||||||||
Amount | Percent | Amount | Percent | Amount | Percent | Amount | Percent | Amount | Percent | |||||||||||||||||||||||||
(Dollars in thousands) | ||||||||||||||||||||||||||||||||||
Fixed rate loans: | ||||||||||||||||||||||||||||||||||
Commercial real estate | $ | 1,638,656 | 27.02 | % | $ | 1,188,884 | 23.47 | % | $ | 728,168 | 27.65 | % | $ | 564,312 | 27.53 | % | $ | 445,885 | 26.37 | % | ||||||||||||||
Commercial and industrial | 212,456 | 3.50 | 664,057 | 13.11 | 67,592 | 2.57 | 76,002 | 3.71 | 46,805 | 2.77 | ||||||||||||||||||||||||
Construction and land | 57,287 | 0.94 | 85,099 | 1.68 | 5,764 | 0.22 | 8,948 | 0.43 | 4,662 | 0.28 | ||||||||||||||||||||||||
Consumer real estate | 589,051 | 9.71 | 508,295 | 10.03 | 337,109 | 12.80 | 326,122 | 15.91 | 383,879 | 22.70 | ||||||||||||||||||||||||
Other consumer | 45,942 | 0.76 | 58,259 | 1.15 | 32,257 | 1.22 | 38,705 | 1.89 | 49,035 | 2.90 | ||||||||||||||||||||||||
Total fixed rate loans | 2,543,392 | 41.93 | 2,504,594 | 49.44 | 1,170,890 | 44.46 | 1,014,089 | 49.47 | 930,266 | 55.02 | ||||||||||||||||||||||||
Adjustable rate loans: | ||||||||||||||||||||||||||||||||||
Commercial real estate | 1,031,799 | 17.01 | 988,659 | 19.51 | 537,700 | 20.42 | 526,888 | 25.70 | 379,455 | 22.44 | ||||||||||||||||||||||||
Commercial and industrial | 1,758,704 | 29.00 | 948,612 | 18.72 | 714,232 | 27.12 | 363,428 | 17.73 | 231,720 | 13.71 | ||||||||||||||||||||||||
Construction and land | 237,607 | 3.92 | 184,609 | 3.64 | 15,534 | 0.59 | 21,299 | 1.04 | 16,520 | 0.98 | ||||||||||||||||||||||||
Consumer real estate | 485,872 | 8.01 | 428,462 | 8.46 | 187,090 | 7.10 | 115,104 | 5.62 | 122,763 | 7.26 | ||||||||||||||||||||||||
Other consumer | 8,049 | 0.13 | 11,571 | 0.23 | 8,234 | 0.31 | 9,094 | 0.44 | 10,045 | 0.59 | ||||||||||||||||||||||||
Total adjustable rate loans | 3,522,031 | 58.07 | 2,561,913 | 50.56 | 1,462,790 | 55.54 | 1,035,813 | 50.53 | 760,503 | 44.98 | ||||||||||||||||||||||||
Gross loans held for investment, excluding Warehouse Purchase Program | 6,065,423 | 100.00 | % | 5,066,507 | 100.00 | % | 2,633,680 | 100.00 | % | 2,049,902 | 100.00 | % | 1,690,769 | 100.00 | % | |||||||||||||||||||
Net of: | ||||||||||||||||||||||||||||||||||
Deferred fees and discounts, net | (2,251 | ) | (1,860 | ) | (2,927 | ) | (1,267 | ) | 486 | |||||||||||||||||||||||||
Allowance for loan losses | (64,576 | ) | (47,093 | ) | (25,549 | ) | (19,358 | ) | (18,051 | ) | ||||||||||||||||||||||||
Net loans held for investment, excluding Warehouse Purchase Program | 5,998,596 | 5,017,554 | 2,605,204 | 2,029,277 | 1,673,204 | |||||||||||||||||||||||||||||
Warehouse Purchase Program: | ||||||||||||||||||||||||||||||||||
Fixed rate loans | — | — | % | — | — | % | 4,147 | 0.53 | % | 234 | 0.03 | % | — | — | % | |||||||||||||||||||
Adjustable rate loans | 1,055,341 | 100.00 | 1,043,719 | 100.00 | 782,269 | 99.47 | 673,236 | 99.97 | 1,060,720 | 100.00 | ||||||||||||||||||||||||
Total Warehouse Purchase Program | 1,055,341 | 100.00 | % | 1,043,719 | 100.00 | % | 786,416 | 100.00 | % | 673,470 | 100.00 | % | 1,060,720 | 100.00 | % | |||||||||||||||||||
Loans held for investment, net | $ | 7,053,937 | $ | 6,061,273 | $ | 3,391,620 | $ | 2,702,747 | $ | 2,733,924 | ||||||||||||||||||||||||
Loans held for sale | $ | 21,279 | $ | 22,535 | $ | — | $ | — | $ | — | ||||||||||||||||||||||||
7
The following schedules illustrate the contractual maturity and repricing information for the commercial and industrial and the construction and land portions of our loan portfolio at December 31, 2016. Loans which have adjustable or renegotiable interest rates are shown as maturing in the period during which the contract is due. Purchased credit impaired loans are reported at their contractual interest rate. The schedule does not reflect the effects of possible prepayments or enforcement of due-on-sale clauses.
Due During Years Ending December 31, | ||||||||||||||||
(Dollars in thousands) | 2017 1 | 2018 - 2021 | 2022 and following | Total | ||||||||||||
Commercial and industrial | $ | 662,876 | $ | 1,232,980 | $ | 75,304 | $ | 1,971,160 | ||||||||
Construction and land | 188,210 | 74,027 | 32,657 | 294,894 | ||||||||||||
1 Includes demand loans and loans having no stated maturity
(Dollars in thousands) | Maturities after One Year | ||
Loans with fixed interest rates | $ | 210,832 | |
Loans with floating or adjustable interest rates | 1,204,136 | ||
Lending Authority. Our Chief Credit Officer can approve cash secured loans up to $4 million, loans secured by other collateral up to $3.5 million and unsecured loans up to $2 million, while our Chief Executive Officer can approve cash secured loans up to $4 million, loans secured by other collateral up to $3.5 million and unsecured loans up to $3 million. The Senior Loan Committee has authority to approve loans over these signature authority amounts. At December 31, 2016, under federal regulation, the maximum amount we could lend to any one borrower and the borrower's related entities was approximately $200.8 million.
Commercial Real Estate Lending. The current focus of commercial real estate lending is direct relationships with investor-owned commercial projects primarily with experienced regional owners of three commercial product types: office, retail and multifamily. The office and retail secured projects are occupied by local, regional, and national tenants, while the primarily Class B multifamily secured projects are occupied by individuals unlikely to become single family homeowners. Although we finance other project types (industrial, self-storage facilities, mixed use, etc.), these other projects do not constitute a significant concentration of the commercial real estate portfolio. Our commercial real estate projects are primarily located in Texas, with the majority of the projects being located in major metropolitan markets, such as Dallas, Fort Worth, and Houston.
Our commercial real estate lending business model is relatively unique and its success has been tested over several years. The primary focus of the analysis and repayment reliance of the loan is almost exclusively the commercial project itself, as opposed to a combination of project and sponsorship reliance. By choosing this project reliance focus, we make sure the project has ample equity at loan inception rather than relying on it developing in the future when sponsorship liquidity might not equal project liquidity needs. This additional equity investment required at loan inception generally ensures that the project ownership is engaged and attentive to the project's ongoing success. We also have a Chief Appraiser in-house to help order, review, and approve appraisals, both commercial and residential.
Our reliance on loan structures that emphasize upfront equity rather than back-end guaranty of payment provides multiple benefits to us, most driven by the lower initial loan balance. For example, the lower loan balance typically drives the initial loan to value ratio of each project well below regulatory requirements for commercial projects. This lower ratio also provides a cushion in case appraised values drop as a result of reduced occupancy, reduced cash flow, or increased capitalization rates. The low loan balance also aids in achieving a higher debt yield ratio (net operating income to loan amount), and a higher debt service coverage ratio (net operating income to debt service requirement), both important metrics for us. Escrows for taxes and insurance are typically maintained for loans in this portfolio, as well as funds for tenant improvement, leasing commissions, or capital expenditures as needed. Regular financial information is gathered so we can stay apprised of the financial status of the project. Although a guaranty of payment is not utilized on these transactions, we do require annual statements on the sponsors in order to identify other projects likely to cause financial hardship to our borrower.
This portfolio also includes a smaller portion of commercial real estate loans to owner occupied businesses. These loans are typically characterized by higher loan to value ratios than our other commercial real estate loans, but generally come with an unlimited guaranty of payment from the company owner(s). At December 31, 2016, the commercial real estate lending portfolio totaled $2.67 billion.
8
Commercial and Industrial Lending. Our commercial and industrial portfolio has grown from 16.5% of gross loans held for investment (excluding Warehouse Purchase Program loans) at December 31, 2012, to 32.5% at December 31, 2016. Our commercial and industrial borrowers are typically located in Texas, but often provide their products and services regionally or nationally. Loans are generally secured by a pledge of business assets such as accounts receivable, inventory, equipment, or vehicles, with the objective of reducing loan balances more quickly than the decline in useful life or value of the asset. The likelihood of loans being paid depends on the success of the business itself, and economic conditions can play a large role in the long-term viability of a company. We generally obtain personal guarantees for privately held companies.
Financial information on these borrowers is required at regular intervals, with company information required on monthly or quarterly terms and annual personal financial statements required on owner/guarantors. Covenants are included in loan structure with the most common being leverage, liquidity and debt service covenants and generally include debt to tangible net worth or minimum tangible net worth, minimum current and liquidity ratios, and minimum Earnings Before Interest, Taxes, Depreciation, and Amortizations (EBITDA).
Energy loans, which are reported as commercial and industrial loans, totaled $527.2 million at December 31, 2016, representing approximately 8.7% of total loans held for investment (excluding Warehouse Purchase Program loans) and 26.7% of total commercial and industrial loans. In May 2013, we formed our Energy Finance group, which is comprised of a group of seasoned lenders, executives and credit risk professionals with more than 100 years of combined Texas energy experience, to focus on providing loans to private and public oil and gas companies throughout the United States. The group also offers the Bank's full array of commercial services, including Treasury Management and letters of credit, to its customers. Substantially all of the loans in the Energy portfolio are reserve based loans, secured by deeds of trust on properties containing proven oil and natural gas reserves. In addition to the reserve based energy loans, we have loans categorized as "Midstream and Other," which are typically related to the transmission of oil and natural gas and would only be indirectly impacted from declining commodity prices. At December 31, 2016, "Midstream and Other" loans had a total outstanding balance of $39.0 million. The energy lending portfolio continues to be an important part of our commercial business strategy. Due to the sensitivity of this portfolio to downward movements in oil and gas prices, we have seen migration in the portfolio into criticized classifications. Please see "Asset Quality" below.
At December 31, 2016, we had four relationships in the commercial and industrial loan portfolio (outside of the reserve based and midstream loans discussed above) that are involved in the energy exploration sector providing front-end services to companies who drill oil and gas wells and whose business could be impacted by the dramatic reduction in drilling activity as a result of a sustained drop in the price of oil and gas. These relationships totaled $2.4 million at December 31, 2016, of which one relationship totaling $97,000 is currently classified as Substandard and Impaired. The other relationships consist of performing loans and are not criticized.
Construction and Land Lending. The Company's 2015 merger with LegacyTexas Group, Inc. added a construction and land portfolio, which totaled $294.9 million at December 31, 2016. This portfolio is primarily made up of commercial entities constructing both commercial and residential projects in the Dallas Fort Worth area, totaling $265.7 million at December 31, 2016. Our requirements for commercial construction is predicated on dealing with reputable project developers, and financially capable contractors, on projects with good equity and significant pre-leasing. Requirements for builders of single family residential projects are similar, with additional controls over the amount of exposure to custom, speculative and model units being built, both financed by us and by competing institutions. Additionally, through the mortgage division acquired from LegacyTexas Group, Inc., we also originate one-time close residential construction loans to individuals for the construction and acquisition of personal residences. At December 31, 2016, we had $29.2 million in outstanding balances on residential construction loans to individuals, which generally provide for the payment of interest only during the construction phase, which is typically up to 12 months.
Consumer Real Estate Lending. Our consumer real estate lending portfolio, which totaled $1.07 billion at December 31, 2016, consists of one-to-four family real estate and home equity/home improvement loans. We primarily originate loans secured by first mortgages on owner-occupied, one-to-four family residences in our market area. All of the one-to-four family loans we originate are funded by us and either sold into the secondary market on a servicing released basis or retained in our portfolio. See “Loan Originations, Purchases, Sales, Repayments and Servicing” for more information. Sales of one-to-four family real estate loans can increase liquidity, provide funds for additional lending activities, and generate income. In 2016, we recognized $8.2 million in net gains on the sale of mortgage loans, which includes the gain recognized on $218.6 million of one-to-four family mortgage loans that were sold or committed for sale in 2016, fair value changes on mortgage derivatives and mortgage fees collected.
9
We underwrite one-to-four family owner-occupied loans based on the applicant’s ability to repay. This includes evaluating their employment, credit history and the value of the subject property. Properties securing our one-to-four family loans are appraised by independent fee appraisers who are selected in accordance with industry and regulatory standards. We require our borrowers to obtain title and hazard insurance, and flood insurance, if necessary.
We also originate consumer home equity and home improvement loans. All of our home equity loans are secured by Texas real estate. Under Texas law, home equity borrowers are allowed to borrow a maximum of 80% (combined LTV of the first lien, if any, plus the home equity loan) of the fair market value of their primary residence. The same 80% combined LTV maximum applies to home equity lines of credit, with the home equity line further limited to 50% of the fair market value of the home. As a result, our home equity loans and home equity lines of credit have low LTV ratios compared to similar loans in most other states. Home equity lines of credit are originated with an adjustable rate of interest based on the Wall Street Journal Prime (“Prime”) rate of interest plus a margin. Home equity lines of credit have up to a ten year draw period and amounts may be re-borrowed after payment at any time during the draw period. While the rate of interest continues to float, once the draw period has lapsed, the payment amount is calculated on a ten year period based on the loan balance at that time. For home improvement loans, borrowers are allowed to borrow a maximum of 90% of the fair market value of their primary residence.
Other Consumer Lending. We offer a variety of secured and unsecured consumer loans, including new and used automobile loans, recreational vehicle loans and loans secured by savings deposits. We originate these loans primarily in our market areas. At December 31, 2016, our other consumer loan portfolio totaled $54.0 million.
Warehouse Purchase Program. The Warehouse Purchase Program, which we initiated in July 2008, allows unaffiliated mortgage originators to close one-to-four family real estate loans in their own name and manage its cash flow needs until the loans are sold to investors. Although not bound by any legally binding commitment, when a purchase decision is made, we purchase a 100% participation interest in the mortgage loans originated by our mortgage banking company customers. The mortgage banking company customer closes mortgage loans consistent with underwriting standards established by the bank and approved investors and, once all pertinent documents are received, the participation interest is delivered by the Bank to the investor selected by the originator and approved by us.
The unaffiliated mortgage originating customers are located across the U.S. and originate loans primarily through traditional retail and/ or wholesale business models. These customers are strategically targeted for their experienced management teams and thoroughly analyzed to ensure long-term and profitable business models. By using this approach, we believe that this type of lending carries a lower risk profile than other one-to-four family mortgage loans held for investment in our portfolio, due to the short-term nature (averaging less than 30 days) of the exposure and the additional strength offered by the mortgage originator sponsorship.
At December 31, 2016, Warehouse Purchase Program maximum aggregate outstanding purchases ranged in size from $2 million to $100 million. The maximum aggregate outstanding purchases are priced using a combined base rate and a risk premium set for both product type (Prime, Jumbo, etc.) and age of the loan. The typical maximum aggregate outstanding purchase facility includes the payment guaranty of company owners holding significant ownership positions, along with non-interest-bearing compensating balance deposits in line with the maximum aggregate outstanding purchase limit. Typical covenants include minimum tangible net worth, maximum leverage and minimum liquidity. As loans age, the Company requires loan curtailments to reduce our risk involving loans that are not purchased by investors on a timely basis.
At December 31, 2016, the Bank had 43 mortgage banking company customers with a maximum aggregate exposure of $1.79 billion and an actual aggregate outstanding balance of $1.06 billion. The average mortgage loan being purchased by the Bank reflects a blend of both Conforming and Government loan characteristics, including an average loan to value ratio (LTV) of 81%, an average credit score of 726 and an average loan size of $273,000. These characteristics illustrate the low risk profile of loans purchased under the Warehouse Purchase Program. To date, we have not experienced a loss on any Warehouse Purchase Program loan.
Loan Originations, Purchases, Sales, Repayments and Servicing
We attempt to meet the needs of the markets we serve by originating thoroughly analyzed and documented loans to both businesses and consumers. These loans typically involve a direct relationship with the borrower, owner(s), and management of the borrowing entity in an attempt to better identify borrower needs and better identify risks to us that must be mitigated in the loan structure.
It is not unusual for a loan request to be so large as to exceed our house limit for transaction size, or for us to have an existing concentration to a particular borrower or industry, such that a smaller loan size is preferred. In these instances we will solicit one or more financial partners to take a portion of a transaction by way of purchasing a participation in the loan. The
10
participation agreement outlines the relationship between the Bank and the participant with regard to borrower access, loan servicing, and loan documents. The participant ends up having an indirect relationship with the borrower through the Bank; essentially becoming a “silent partner” in the transaction. The participant's transactional involvement is typically limited to only that provided by the Bank as “agent” in the transaction, and the participation interest is sold without recourse.
When a participation arrangement is unacceptable to the financial partner and a direct relationship with the borrower is the only structure acceptable, a syndication arrangement may be formed. In a syndication arrangement, the financial partner has a direct relationship with the borrower and has its own documents, with terms that mirror those of the other banks in the syndication group. Just like in a participation, the financial partner shares pro-rata in collateral, but because syndication partners are essentially equal in rights and responsibilities, there is usually a designated partner responsible for administering the flow of funds and information between the parties. The Bank has entered into the sale of both participations and syndications of loans to commercial real estate and commercial and industrial borrowers in an attempt to meet our borrowers' needs and stay within our own risk tolerances. During 2016, we sold $219.1 million in participations and syndications.
We have also entered into the purchase of both participation and syndication transactions as a means of assisting our financial partners who may have encountered excess loan exposure to their own borrowers. The rights and remedies of these purchases are essentially the same as outlined above for the sale of a participation or syndication. A participation purchased would give the Bank little to no access to our financial partner's borrower and we would have to accept the terms outlined and documents used for that borrower. During 2016, we purchased $319.0 million in participations and syndications.
We also sell whole residential real estate loans originated by our mortgage division to private investors, such as other banks and mortgage companies, generally subject to a provision for repurchase upon breach of representation, warranty or covenant. These loans are generally sold, on a servicing-released basis, for cash in amounts equal to the unpaid principal amount of the loans plus a servicing release premium. The sale amounts generally produce gains to us. In 2016, our mortgage division sold $219.5 million of residential real estate loans to investors.
Asset Quality
An accurate assessment of asset quality is essential to our long-term health. Failure to identify deterioration in our largest asset category, loans, could result in a shortfall of loan loss reserves needed for loans requiring charge-off, and a charge against capital would be required. Credit analysts, loan officers, and lending managers are charged with not only proper risk analysis before loans are made, but also after they are booked and performing as expected. The goal is to identify the proper risk status and take actions appropriate to that risk. We have a risk rating system and a loss reserve methodology for each category of loan that includes Pass, Special Mention, Substandard, Doubtful, and Loss. We also regularly engage the services of third party firms to perform an independent assessment of individual loan risk grades and the processes for risk identification.
We have a variety of monitoring tools that serve as indicators of potential borrower weakness and early warning signs of possible risk grade deterioration. For example, a borrower's inability to provide ongoing loan documentation, meet loan covenants, maintain positive balances in deposit accounts, and make loan payments as scheduled are all signs of potential deterioration in a borrower's financial condition and the need for a review of the asset risk grade. Borrowers who are unable to meet original loan terms and require concessions that we would not ordinarily grant are automatically downgraded and examined for the need for additional reserves to cover specific impairment. Loans are reviewed regularly to ensure that they are properly graded, structured to meet the borrower's cash flow capability, and considered in our calculation of the allowance for loan losses.
11
Delinquent Loans. The following table sets forth our loan delinquencies by type, by amount and by percentage of type at December 31, 2016. There were no past due Warehouse Purchase Program loans at December 31, 2016.
Loans Delinquent For: | |||||||||||||||||||||||||||
30-89 Days | 90 Days and Over | Total Loans Delinquent 30 Days or More | |||||||||||||||||||||||||
Number | Amount | Percent of Loan Category | Number | Amount | Percent of Loan Category | Number | Amount | Percent of Loan Category | |||||||||||||||||||
(Dollars in thousands) | |||||||||||||||||||||||||||
Commercial real estate | 8 | $ | 1,901 | 0.07 | % | 1 | $ | 766 | 0.03 | % | 9 | $ | 2,667 | 0.10 | % | ||||||||||||
Commercial and industrial | 47 | 21,405 | 1.09 | 16 | 46 | — | 63 | 21,451 | 1.09 | ||||||||||||||||||
Construction and land | 32 | 19,800 | 6.71 | 2 | — | — | 34 | 19,800 | 6.71 | ||||||||||||||||||
Consumer real estate | 116 | 12,403 | 1.15 | 15 | 1,199 | 0.11 | 131 | 13,602 | 1.26 | ||||||||||||||||||
Other consumer | 56 | 1,554 | 2.88 | 2 | 6 | 0.01 | 58 | 1,560 | 2.89 | ||||||||||||||||||
Total loans | 259 | $ | 57,063 | 0.94 | % | 36 | $ | 2,017 | 0.03 | % | 295 | $ | 59,080 | 0.97 | % | ||||||||||||
Non-performing Assets. The table below sets forth the amounts and categories of non-performing assets in our loan portfolio. Loans are placed on nonaccrual status when the collection of principal and/or interest becomes doubtful or other factors involving the loan warrant placing the loan on nonaccrual status. Loans that are past due 30 days or greater are considered delinquent. Interest income on loans is discontinued at the time the loan is 90 days delinquent unless the loan is well-secured and in process of collection. Consumer loans are typically charged off no later than 120 days past due. Past due status is based on the contractual terms of the loan. In all cases, loans are placed on nonaccrual status or charged-off at an earlier date if collection of principal or interest is considered doubtful. Nonaccrual loans include both smaller balance homogeneous loans that are collectively evaluated for impairment and individually classified impaired loans.
All interest accrued but not received for loans placed on nonaccrual status is reversed against interest income. Subsequent receipts on non-accrual loans are recorded as a reduction of principal, and interest income is recorded only after principal recovery is reasonably assured. Loans are returned to accrual status when all the principal and interest amounts contractually due are brought current and future payments are reasonably assured.
Troubled debt restructurings, also referred to as "TDRs" herein, which are accounted for under Accounting Standards Codification ("ASC") 310-40, are loans which have renegotiated loan terms to assist borrowers who are unable to meet the original terms of their loans. Such modifications to loan terms may include a below market interest rate, a reduction in principal, or a longer term to maturity. All TDRs are initially classified as nonaccrual loans, regardless of whether the loan was performing at the time it was restructured. Once a TDR has performed according to its modified terms for six months and the collection of future principal and interest under the revised terms is deemed probable, the Bank will consider placing the loan back on accrual status. At December 31, 2016, we had $12.2 million in TDRs, of which $454,000 were accruing interest and $11.7 million were classified as nonaccrual.
12
Years Ended December 31, | |||||||||||||||||||
2016 | 2015 | 2014 | 2013 | 2012 | |||||||||||||||
(Dollars in thousands) | |||||||||||||||||||
Nonaccrual loans: 1 | |||||||||||||||||||
Commercial real estate | $ | 5,195 | $ | 11,418 | $ | 6,703 | $ | 7,604 | $ | 13,567 | |||||||||
Commercial and industrial | 86,664 | 16,877 | 5,778 | 5,141 | 5,401 | ||||||||||||||
Construction and land | 11,385 | 33 | 149 | — | 134 | ||||||||||||||
Consumer real estate | 7,987 | 9,781 | 10,591 | 8,812 | 7,839 | ||||||||||||||
Other consumer | 158 | 107 | 286 | 567 | 262 | ||||||||||||||
Total non-performing loans | 111,389 | 38,216 | 23,507 | 22,124 | 27,203 | ||||||||||||||
Foreclosed assets: | |||||||||||||||||||
Commercial real estate | 10,638 | 4,784 | 551 | 102 | 485 | ||||||||||||||
Construction and land | 194 | 1,802 | — | 172 | 177 | ||||||||||||||
Consumer real estate | — | 106 | — | 204 | 1,224 | ||||||||||||||
Other consumer | 6 | — | — | 2 | 15 | ||||||||||||||
Total foreclosed assets | 10,838 | 6,692 | 551 | 480 | 1,901 | ||||||||||||||
Total non-performing assets | $ | 122,227 | $ | 44,908 | $ | 24,058 | $ | 22,604 | $ | 29,104 | |||||||||
Total non-performing assets as a percentage of total assets 2 | 1.46 | % | 0.58 | % | 0.58 | % | 0.64 | % | 0.79 | % | |||||||||
Total non-performing loans as a percentage of total loans held for investment, excluding Warehouse Purchase Program loans 2 | 1.84 | % | 0.75 | % | 0.89 | % | 1.08 | % | 1.61 | % | |||||||||
Performing troubled debt restructurings: | |||||||||||||||||||
Commercial real estate | $ | 154 | $ | 161 | $ | 702 | $ | — | $ | 3,384 | |||||||||
Commercial and industrial | — | 30 | 153 | 185 | 207 | ||||||||||||||
Construction and land | — | — | — | 2 | 5 | ||||||||||||||
Consumer real estate | 269 | 368 | 204 | 737 | 553 | ||||||||||||||
Other consumer | 31 | 46 | 39 | 47 | 67 | ||||||||||||||
Total | $ | 454 | $ | 605 | $ | 1,098 | $ | 971 | $ | 4,216 | |||||||||
1 There were no non-performing or TDR warehouse lines of credit or Warehouse Purchase Program loans for the periods presented.
2 Purchased credit impaired (PCI) loans, which were acquired in 2012 through the Highlands Bancshares, Inc. ("Highlands") acquisition and in 2015 through the LegacyTexas acquisition, are not considered non-performing loans, and therefore are not included in the numerator of the non-performing loans to total loans ratio, but are included in total loans, which is reflected in the denominator. Loans past due over 90 days that were still accruing interest totaled $141,000, $111,000, $612,000, $266,000, and $593,000 for the years ended December 31, 2016, 2015, 2014, 2013 and 2012, respectively, and consisted entirely of PCI loans.
For the year ended December 31, 2016, gross interest income which would have been recorded had the nonaccrual loans been current in accordance with their original terms throughout the entire year amounted to $1.7 million. No interest income on these loans was recorded for the year ended December 31, 2016.
Classified Assets. Loans and other assets, such as debt and equity securities, considered by management to be of lesser quality, are classified as “substandard,” “doubtful” or “loss.” An asset is considered “substandard” if it is inadequately protected by the current net worth and paying capacity of the obligor or of the collateral pledged, if any. “Substandard” assets include those characterized by the “distinct possibility” that the insured institution will sustain “some loss” if the deficiencies are not corrected. Assets classified as “doubtful” have all of the weaknesses of those classified “substandard,” with the added characteristic that the weaknesses present make “collection or liquidation in full,” on the basis of currently existing facts, conditions and values, “highly questionable and improbable.” Assets classified as “loss” are those considered “uncollectible” and of such little value that their continuance as assets without the establishment of a specific loss reserve is not warranted.
13
We regularly review the problem assets in our portfolio to determine the appropriate classification. The aggregate amount of classified assets at the dates indicated was as follows:
At December 31, | |||||||
2016 | 2015 | ||||||
(Dollars in thousands) | |||||||
Doubtful | $ | 2,880 | $ | 4,201 | |||
Substandard | 136,815 | 97,523 | |||||
Total classified loans | 139,695 | 101,724 | |||||
Foreclosed assets | 10,838 | 6,692 | |||||
Total classified assets | $ | 150,533 | $ | 108,416 | |||
Classified assets as a percentage of equity | 17.00 | % | 13.48 | % | |||
Classified assets as a percentage of assets | 1.80 | 1.41 | |||||
Classified assets as a percentage of total loans held for investment, excluding Warehouse Purchase Program loans | 2.48 | 2.14 | |||||
Substandard loans at December 31, 2016 increased by $39.3 million from December 31, 2015, which was primarily due to downgrades on energy loans related to collateral value deterioration and diminished operating performance. At December 31, 2016, our energy loans totaled $527.2 million, representing approximately 8.7% of total loans (excluding Warehouse Purchase Program loans). Additionally, in 2016, commercial and industrial substandard loans (excluding energy loans) and construction and land substandard loans increased by $27.2 million and $11.4 million, respectively, from December 31, 2015. The increase in commercial and industrial substandard loans (excluding energy loans) included a $12.1 million relationship with a borrower who owns and operates hospitals in Texas, while the increase in construction and land was due to a relationship with a residential home builder. Both relationships were downgraded to substandard in 2016 due to diminished operating performance. When establishing our allowance for loan losses, all portfolio and general economic factors are considered, including the level of criticized assets and the level of commodity prices. Please see “Comparison of Financial Condition at December 31, 2016, and December 31, 2015 — Allowance for Loan Losses” contained in Item 7 of this report for more information.
We had $21.3 million of potential problem loans at December 31, 2016, considered "other loans of concern," that are currently performing and do not meet the criteria for impairment, but where there is the distinct possibility that we could sustain some loss if credit deficiencies are not corrected. These possible credit problems may result in the future inclusion of these loans in the non-performing asset categories and were classified as "substandard" but were still accruing interest and were not considered impaired at December 31, 2016 (excluding PCI loans). Other loans of concern at December 31, 2016 decreased by $30.3 million from December 31 2015, primarily due to energy loans that migrated to substandard non-accrual during 2016. Please see “Comparison of Financial Condition at December 31, 2016, and December 31, 2015 — Allowance for Loan Losses” contained in Item 7 of this report for more information. Other loans of concern, which were performing at December 31, 2016, have been considered in management's analysis of potential loan losses.
Allowance for Loan Losses. The allowance for loan losses is maintained to cover losses that are estimated in accordance with US GAAP. It is our estimate of credit losses inherent in our loan portfolio at each balance sheet date. Our methodology for analyzing the allowance for loan losses consists of general and specific components. For the general component, we stratify the loan portfolio into homogeneous groups of loans that possess similar loss potential characteristics and apply a loss ratio to these groups of loans to estimate the credit losses in the loan portfolio. We use both historical loss ratios and qualitative loss factors assigned to major loan collateral types to establish general component loss allocations. Qualitative loss factors are based on management's judgment of company, market, industry or business specific data and external economic indicators, which may not yet be reflected in the historical loss ratios, and that could impact our specific loan portfolios. The Allowance for Loan Loss Committee sets and adjusts qualitative loss factors by regularly reviewing changes in underlying loan composition and the seasonality of specific portfolios. The Allowance for Loan Loss Committee also considers credit quality and trends relating to delinquency, non-performing and classified loans within our loan portfolio when evaluating qualitative loss factors. Additionally, the Allowance for Loan Loss Committee adjusts qualitative factors to account for the potential impact of external economic factors, including the unemployment rate, vacancy, capitalization rates, commodity prices and other pertinent economic data specific to our primary market area and lending portfolios.
For the specific component, the allowance for loan losses includes loans where management has concerns about the borrower's ability to repay and on individually analyzed loans found to be impaired. Management evaluates current information and events regarding a borrower's ability to repay its obligations and considers a loan to be impaired when the ultimate
14
collectability of amounts due, according to the contractual terms of the loan agreement, is in doubt. If an impaired loan is collateral-dependent, the fair value of the collateral, less the estimated cost to sell, is used to determine the amount of impairment. If an impaired loan is not collateral-dependent, the impairment amount is determined using the negative difference, if any, between the estimated discounted cash flows and the loan amount due. For impaired loans, the amount of the impairment can be adjusted, based on current data, until such time as the actual basis is established by acquisition of the collateral or until the basis is collected. Impairment losses are reflected in the allowance for loan losses through a charge to the provision for credit losses. Subsequent recoveries are credited to the allowance for loan losses. Cash receipts for accruing loans are applied to principal and interest under the contractual terms of the loan agreement. Cash receipts on impaired loans for which the accrual of interest has been discontinued are applied first to principal.
At December 31, 2016, $106.6 million in loans were individually impaired, with $4.8 million of the allowance for loan losses allocated to impaired loans at period-end (these figures do not include PCI loans). Please see “Comparison of Financial Condition at December 31, 2016, and December 31, 2015 — Loans” contained in Item 7 and Note 5 of the Notes to Consolidated Financial Statements contained in Item 8 of this report for more information.
At December 31, 2016, our allowance for loan losses was $64.6 million, or 1.06% of total loans held for investment, excluding the Warehouse Purchase Program loans. Assessing the allowance for loan losses is inherently subjective, as it requires making material estimates, including the amount and timing of future cash flows expected to be received on impaired loans that may be susceptible to significant change. In the opinion of management, the allowance, when taken as a whole, reflects estimated credit losses in our loan portfolio. See Notes 1 and 5 of the Notes to Consolidated Financial Statements contained in Item 8 of this report.
The following table sets forth an analysis of our allowance for loan losses.
Years Ended December 31, | |||||||||||||||||||
2016 | 2015 | 2014 | 2013 | 2012 | |||||||||||||||
(Dollars in thousands) | |||||||||||||||||||
Balance at beginning of period | $ | 47,093 | $ | 25,549 | $ | 19,358 | $ | 18,051 | $ | 17,487 | |||||||||
Charge-offs:1 | |||||||||||||||||||
Commercial real estate | 79 | 167 | — | 806 | 187 | ||||||||||||||
Commercial and industrial | 7,746 | 3,129 | 568 | 607 | 1,178 | ||||||||||||||
Construction and land | — | — | 51 | 31 | — | ||||||||||||||
Consumer real estate | 107 | 321 | 237 | 416 | 798 | ||||||||||||||
Other consumer | 927 | 1,090 | 605 | 621 | 1,039 | ||||||||||||||
Total charge-offs | 8,859 | 4,707 | 1,461 | 2,481 | 3,202 | ||||||||||||||
Recoveries:1 | |||||||||||||||||||
Commercial real estate | 21 | 29 | 435 | — | — | ||||||||||||||
Commercial and industrial | 472 | 246 | 94 | 124 | 114 | ||||||||||||||
Construction and land | — | — | 1 | — | — | ||||||||||||||
Consumer real estate | 109 | 85 | 38 | 77 | 70 | ||||||||||||||
Other consumer | 340 | 426 | 363 | 388 | 443 | ||||||||||||||
Total recoveries | 942 | 786 | 931 | 589 | 627 | ||||||||||||||
Net charge-offs | 7,917 | 3,921 | 530 | 1,892 | 2,575 | ||||||||||||||
Provision expense | 25,400 | 25,465 | 6,721 | 3,199 | 3,139 | ||||||||||||||
Balance at end of period | $ | 64,576 | $ | 47,093 | $ | 25,549 | $ | 19,358 | $ | 18,051 | |||||||||
Ratio of net charge-offs during the period to | |||||||||||||||||||
average loans outstanding during the period | 0.12 | % | 0.08 | % | 0.02 | % | 0.08 | % | 0.11 | % | |||||||||
Ratio of net charge-offs during the period to | |||||||||||||||||||
average non-performing assets | 9.47 | % | 11.37 | % | 2.27 | % | 7.32 | % | 9.45 | % | |||||||||
Allowance as a percentage of non-performing loans2 | 57.97 | % | 123.23 | % | 108.69 | % | 87.50 | % | 66.36 | % | |||||||||
Allowance as a percentage of total loans, excluding | |||||||||||||||||||
Warehouse Purchase Program (end of period) 2 | 1.06 | % | 0.93 | % | 0.97 | % | 0.94 | % | 1.07 | % | |||||||||
1 There was no net charge-off activity on Warehouse Purchase Program loans during the periods presented.
2 PCI loans, which were acquired in 2012 through the Highlands acquisition and in 2015 through the LegacyTexas acquisition, are not considered non-performing loans, and therefore are not included in the numerator of the non-performing loans to total loans ratio, but are included in total loans, which is reflected in the denominator. PCI loans had a carrying value of $7.0 million, $12.0 million, $6.6 million, $7.4 million and $12.8 million for the years ended December 31, 2016, 2015, 2014, 2013 and 2012, respectively.
15
The distribution of our allowance for losses on loans at the dates indicated is summarized below.
December 31, | ||||||||||||||||||||||||||||||||||
2016 | 2015 | 2014 | 2013 | 2012 | ||||||||||||||||||||||||||||||
Allocated Allowance | % 1 | Allocated Allowance | % 1 | Allocated Allowance | % 1 | Allocated Allowance | % 1 | Allocated Allowance | % 1 | |||||||||||||||||||||||||
(Dollars in thousands) | ||||||||||||||||||||||||||||||||||
Commercial real estate | $ | 18,303 | 44.03 | % | $ | 14,123 | 42.98 | % | $ | 11,830 | 48.06 | % | $ | 10,944 | 53.23 | % | $ | 11,182 | 48.81 | % | ||||||||||||||
Commercial and industrial | 35,464 | 32.50 | 24,975 | 31.83 | 9,068 | 29.69 | 4,536 | 21.43 | 2,574 | 16.48 | ||||||||||||||||||||||||
Construction and land | 5,075 | 4.86 | 3,013 | 5.32 | 174 | 0.81 | 212 | 1.48 | 149 | 1.25 | ||||||||||||||||||||||||
Consumer real estate | 4,484 | 17.72 | 3,992 | 18.49 | 4,069 | 19.90 | 3,280 | 21.53 | 3,528 | 29.97 | ||||||||||||||||||||||||
Other consumer | 1,250 | 0.89 | 990 | 1.38 | 408 | 1.54 | 386 | 2.33 | 618 | 3.49 | ||||||||||||||||||||||||
Total | $ | 64,576 | 100.00 | % | $ | 47,093 | 100.00 | % | $ | 25,549 | 100.00 | % | $ | 19,358 | 100.00 | % | $ | 18,051 | 100.00 | % | ||||||||||||||
1 Loans outstanding as a percentage of total loans held for investment, excluding Warehouse Purchase Program loans.
Investment Activities
We have broad investment authority, except for corporate equity securities, which are generally limited to stock in subsidiaries, certain housing projects and bank service companies. Debt securities are categorized by law and bank regulation into various types, with each type subject to different permitted investment levels calculated as percentages of capital, except for government and government-related obligations, which may be invested in without limit.
The Chief Financial Officer delegates the basic responsibility for the management of our investment portfolio to the Executive Vice President/Treasurer, subject to the direction and guidance of the Asset/Liability Management Committee. The Executive Vice President/Treasurer considers various factors when making decisions, including the marketability, duration, maturity and tax consequences of the proposed investment. The amount, mix, and maturity structure of investments will be affected by various market conditions, including the current and anticipated slope of the yield curve, the level of interest rates, the trend of new deposit inflows, and the anticipated demand for funds via deposit withdrawals and loan originations and purchases.
16
The general objectives of our investment portfolio are to provide liquidity when loan demand is high, to assist in maintaining earnings when loan demand is low and to optimize earnings while satisfactorily managing risk, including credit risk, reinvestment risk, liquidity risk and interest rate risk. Our investment securities currently consist primarily of agency collateralized mortgage obligations, agency mortgage-backed securities, Small Business Administration securitized loan pools consisting of only the U.S. government guaranteed portion, and Texas entity municipal bonds. These securities are of industry investment grade and possess acceptable credit risk. For more information, please see Note 4 of the Notes to Consolidated Financial Statements contained in Item 8 of this report and “Asset/Liability Management” contained in Item 7A of this report. We also have restricted securities, which totaled $43.3 million at December 31, 2016 and primarily consisted of Federal Home Loan Bank stock and Federal Reserve stock and is carried on the balance sheet at cost.
The following table sets forth the composition of our securities portfolio and other investments at the dates indicated. At December 31, 2016, our securities portfolio did not contain securities of any issuer with an aggregate book value in excess of 10% of our equity capital, excluding those issued by the United States Government or its agencies or United States GSEs.
December 31, | ||||||||||||||||||||||||
2016 | 2015 | 2014 | ||||||||||||||||||||||
Amortized Cost | Fair Value | Amortized Cost | Fair Value | Amortized Cost | Fair Value | |||||||||||||||||||
(Dollars in thousands) | ||||||||||||||||||||||||
Available for sale: | ||||||||||||||||||||||||
Agency residential mortgage-backed securities | $ | 220,744 | $ | 218,551 | $ | 224,582 | $ | 223,848 | $ | 144,368 | $ | 145,518 | ||||||||||||
Agency commercial mortgage-backed securities | 9,422 | 9,347 | 9,483 | 9,417 | — | — | ||||||||||||||||||
Agency collateralized mortgage obligations | 87,959 | 86,529 | 22,430 | 22,314 | 50,424 | 50,554 | ||||||||||||||||||
US government and agency securities | 2,150 | 2,251 | 14,906 | 15,054 | 3,475 | 3,627 | ||||||||||||||||||
Municipal bonds | 38,417 | 37,837 | 40,512 | 41,075 | — | — | ||||||||||||||||||
Total available for sale | 358,692 | 354,515 | 311,913 | 311,708 | 198,267 | 199,699 | ||||||||||||||||||
Held to maturity: | ||||||||||||||||||||||||
Agency residential mortgage-backed securities | 74,881 | 75,211 | 87,935 | 89,488 | 63,161 | 66,272 | ||||||||||||||||||
Agency commercial mortgage-backed securities | 28,023 | 28,693 | 24,848 | 25,697 | 25,301 | 26,396 | ||||||||||||||||||
Agency collateralized mortgage obligations | 40,707 | 41,371 | 59,174 | 60,206 | 86,470 | 88,156 | ||||||||||||||||||
Municipal bonds | 66,776 | 67,706 | 68,476 | 71,811 | 66,988 | 70,288 | ||||||||||||||||||
Total held to maturity | 210,387 | 212,981 | 240,433 | 247,202 | 241,920 | 251,112 | ||||||||||||||||||
Total investment securities | 569,079 | 567,496 | 552,346 | 558,910 | 440,187 | 450,811 | ||||||||||||||||||
FHLB stock and other restricted securities, at cost | 43,266 | 43,266 | 63,075 | 63,075 | 44,084 | 44,084 | ||||||||||||||||||
Total securities | $ | 612,345 | $ | 610,762 | $ | 615,421 | $ | 621,985 | $ | 484,271 | $ | 494,895 | ||||||||||||
17
The composition and contractual maturities of the investment securities portfolio as of December 31, 2016, excluding FHLB stock and other restricted securities, are indicated in the following table. Prepayment options exist for the US government and agency securities, agency collateralized mortgage obligations and agency mortgage-backed securities. In addition, many of the municipal bonds are callable prior to maturity. The weighted average yield is prospective and based on amortized cost.
1 year or less | After 1 to 5 years | After 5 to 10 years | After 10 years | Total Securities | ||||||||||||||||||||||||||||||||||
Amortized Cost | Weighted Average Yield | Amortized Cost | Weighted Average Yield | Amortized Cost | Weighted Average Yield | Amortized Cost | Weighted Average Yield | Amortized Cost | Weighted Average Yield | Fair Value | ||||||||||||||||||||||||||||
(Dollars in thousands) | ||||||||||||||||||||||||||||||||||||||
Available for sale: | ||||||||||||||||||||||||||||||||||||||
Agency residential mortgage-backed securities | $ | — | — | % | $ | 6,370 | 1.08 | % | $ | 47,844 | 1.83 | % | $ | 166,530 | 1.68 | % | $ | 220,744 | 1.69 | % | $ | 218,551 | ||||||||||||||||
Agency commercial mortgage-backed securities | — | — | 9,422 | 1.85 | — | — | — | — | 9,422 | 1.85 | 9,347 | |||||||||||||||||||||||||||
Agency residential collateralized mortgage obligations | — | — | — | — | 3,699 | 2.43 | 84,260 | 2.16 | 87,959 | 2.17 | 86,529 | |||||||||||||||||||||||||||
US government and agency securities | 72 | 3.34 | 578 | 3.59 | 1,500 | 3.37 | — | — | 2,150 | 3.43 | 2,251 | |||||||||||||||||||||||||||
Municipal bonds | 2,083 | 1.16 | 11,429 | 2.03 | 16,341 | 2.50 | 8,564 | 2.88 | 38,417 | 2.37 | 37,837 | |||||||||||||||||||||||||||
Total available for sale | 2,155 | 1.23 | 27,799 | 1.79 | 69,384 | 2.05 | 259,354 | 1.87 | 358,692 | 1.90 | 354,515 | |||||||||||||||||||||||||||
Held to maturity: | ||||||||||||||||||||||||||||||||||||||
Agency residential mortgage-backed securities | — | — | 10,608 | 3.63 | 22,700 | 2.95 | 41,573 | 2.21 | 74,881 | 2.64 | 75,211 | |||||||||||||||||||||||||||
Agency commercial mortgage-backed securities | — | — | 13,793 | 3.23 | 14,230 | 2.44 | — | — | 28,023 | 2.83 | 28,693 | |||||||||||||||||||||||||||
Agency residential collateralized mortgage obligations | — | — | 2,263 | 4.08 | 37,252 | 2.72 | 1,192 | (0.05 | ) | 40,707 | 2.71 | 41,371 | ||||||||||||||||||||||||||
Municipal bonds | 1,952 | 5.31 | 9,035 | 5.30 | 48,327 | 4.89 | 7,462 | 3.61 | 66,776 | 4.81 | 67,706 | |||||||||||||||||||||||||||
Total held to maturity | 1,952 | 5.31 | 35,699 | 3.92 | 122,509 | 3.58 | 50,227 | 2.37 | 210,387 | 3.37 | 212,981 | |||||||||||||||||||||||||||
Total investment securities | $ | 4,107 | 3.17 | % | $ | 63,498 | 2.99 | % | $ | 191,893 | 3.03 | % | $ | 309,581 | 1.95 | % | $ | 569,079 | 2.44 | % | $ | 567,496 | ||||||||||||||||
18
Sources of Funds
General. Our sources of funds are deposits, borrowings, payments of principal and interest on loans and investments, sales of loans and funds provided from operations.
Deposits. The Bank's deposit base is our primary source of funding and consists of core deposits from the communities served by our branch and office locations. We offer a variety of deposit accounts with a competitive range of interest rates and terms to both consumers and businesses. Deposits include interest-bearing and non-interest-bearing demand accounts, savings, money market, certificates of deposit and individual retirement accounts. These accounts earn interest at rates established by management based on competitive market factors, management's desire to increase certain product types or maturities, and in keeping with our asset/liability, liquidity and profitability objectives. Competitive products, competitive pricing and high touch customer service are important to attracting and retaining these deposits.
We have historically been an active bidder for public fund deposits within the state of Texas. This strategy has been refined to one which will seek to attract future public funds primarily in the direct markets that we serve and only at rates that are consistent with our strategy of providing a low cost source of core funding for the Bank. At December 31, 2016 and 2015, our public fund deposits totaled $1.00 billion and $708.7 million, respectively. At December 31, 2016, $774.9 million of the $1.00 billion in public funds were time deposits, of which $187.0 million of such time deposits had a maturity date over 12 months. Additionally, public funds at December 31, 2016 included $123.9 million in money market, $98.3 million in interest-bearing demand and $4.7 million in non-interest-bearing demand deposits.
We provide an avenue for large depositors to maintain full FDIC insurance coverage for all deposits up to $50 million or $75 million, depending on product. Under an agreement with Promontory Interfinancial Network, we participate in the Certificate of Deposit Account Registry Service (CDARS®) and the Insured Cash Sweep (ICS) money market product. These are deposit-matching programs which distribute excess balances on deposit with the Bank across other participating banks. In return, those participating financial institutions place their excess customer deposits with the Bank in a reciprocal amount. These products are designed to enhance our ability to attract and retain customers and increase deposits by providing additional FDIC insurance for large deposits. We also participate in the ICS One-Way Buy program, which allows the Bank to buy cost-effective wholesale funding on customizable terms. Due to the nature of the placement of the funds, CDARS® and ICS deposits are classified as “brokered deposits” by regulatory agencies. At December 31, 2016 and 2015, we had $355.5 million and $371.7 million, respectively, in aggregate CDARS® and ICS deposits.
The following table sets forth our deposit flows during the periods indicated.
Years Ended December 31, | |||||||||||
2016 | 2015 | 2014 | |||||||||
(Dollars in thousands) | |||||||||||
Opening balance | $ | 5,226,711 | $ | 2,657,809 | $ | 2,264,639 | |||||
Net deposits 1 | 1,117,731 | 2,555,775 | 384,958 | ||||||||
Interest | 21,034 | 13,127 | 8,212 | ||||||||
Ending balance | $ | 6,365,476 | $ | 5,226,711 | $ | 2,657,809 | |||||
Net increase | $ | 1,138,765 | $ | 2,568,902 | $ | 393,170 | |||||
Percent increase | 21.79 | % | 96.65 | % | 17.36 | % | |||||
1 2015 amount includes $1.63 billion in deposits acquired on January 1, 2015 in connection with the Company's merger with LegacyTexas Group, Inc.
19
The following table sets forth the dollar amount of deposits in the various types of deposit programs offered at the dates indicated.
December 31, | ||||||||||||||||||||
2016 | 2015 | 2014 | ||||||||||||||||||
Amount | Percent of Total | Amount | Percent of Total | Amount | Percent of Total | |||||||||||||||
(Dollars in thousands) | ||||||||||||||||||||
Transaction and Savings Deposits: | ||||||||||||||||||||
Non-interest-bearing demand | $ | 1,383,951 | 21.74 | % | $ | 1,170,272 | 22.38 | % | $ | 494,376 | 18.60 | % | ||||||||
Interest-bearing demand | 903,314 | 14.19 | 819,350 | 15.68 | 472,703 | 17.79 | ||||||||||||||
Savings and money market | 2,710,307 | 42.58 | 2,209,698 | 42.28 | 1,176,749 | 44.27 | ||||||||||||||
Total non-certificates | 4,997,572 | 78.51 | 4,199,320 | 80.34 | 2,143,828 | 80.66 | ||||||||||||||
Certificates: | ||||||||||||||||||||
0.00-1.99% | 1,356,657 | 21.31 | 1,006,050 | 19.25 | 491,520 | 18.49 | ||||||||||||||
2.00-3.99% | 11,226 | 0.18 | 21,317 | 0.41 | 21,972 | 0.83 | ||||||||||||||
4.00-5.99% | 21 | — | 20 | — | 486 | 0.02 | ||||||||||||||
6.00% and over | — | — | 4 | — | 3 | — | ||||||||||||||
Total certificates | 1,367,904 | 21.49 | 1,027,391 | 19.66 | 513,981 | 19.34 | ||||||||||||||
Total deposits | $ | 6,365,476 | 100.00 | % | $ | 5,226,711 | 100.00 | % | $ | 2,657,809 | 100.00 | % | ||||||||
The following table shows rate and maturity information for our certificates of deposit at December 31, 2016.
0.00-1.99% | 2.00-3.99% | 4.00-5.99% | Total | Percent of Total | |||||||||||||||
(Dollars in thousands) | |||||||||||||||||||
Certificates maturing in quarter ending: | |||||||||||||||||||
March 31, 2017 | $ | 358,160 | $ | 211 | $ | — | $ | 358,371 | 26.20 | % | |||||||||
June 30, 2017 | 239,344 | — | 21 | 239,365 | 17.50 | ||||||||||||||
September 30, 2017 | 243,548 | — | — | 243,548 | 17.80 | ||||||||||||||
December 31, 2017 | 151,502 | — | — | 151,502 | 11.08 | ||||||||||||||
March 31, 2018 | 47,118 | — | — | 47,118 | 3.44 | ||||||||||||||
June 30, 2018 | 86,968 | 32 | — | 87,000 | 6.36 | ||||||||||||||
September 30, 2018 | 111,709 | 1 | — | 111,710 | 8.17 | ||||||||||||||
December 31, 2018 | 10,322 | — | — | 10,322 | 0.75 | ||||||||||||||
Thereafter | 107,986 | 10,982 | — | 118,968 | 8.70 | ||||||||||||||
Total | $ | 1,356,657 | $ | 11,226 | $ | 21 | $ | 1,367,904 | 100.00 | % | |||||||||
Percent of Total | 99.18 | % | 0.82 | % | — | % | 100.00 | % | |||||||||||
20
The following table indicates the amount of our certificates of deposit by time remaining until maturity as of December 31, 2016.
Maturity | |||||||||||||||||||
3 Months or less | Over 3 to 6 Months | Over 6 to 12 Months | Over 12 Months | Total | |||||||||||||||
(Dollars in thousands) | |||||||||||||||||||
Certificates less than $100,000 | $ | 25,676 | $ | 24,183 | $ | 36,420 | $ | 48,912 | $ | 135,191 | |||||||||
Certificates of $100,000 or more | 156,187 | 75,095 | 87,337 | 139,225 | 457,844 | ||||||||||||||
Public funds¹ | 176,508 | 140,087 | 271,293 | 186,981 | 774,869 | ||||||||||||||
Total certificates | $ | 358,371 | $ | 239,365 | $ | 395,050 | $ | 375,118 | $ | 1,367,904 | |||||||||
¹Deposits from governmental and other public entities
Borrowings. Although deposits are our primary source of funds, we may utilize borrowings to manage interest rate risk or as a cost-effective source of funds when they can be invested at a positive interest rate spread for additional capacity to fund loan demand according to our asset/liability management goals. We also fund a portion of our Warehouse Purchase Program with short-term FHLB advances. Our borrowings consist primarily of advances from the FHLB of Dallas, repurchase agreements and subordinated debt.
We may obtain advances from the FHLB of Dallas upon the security of certain loans and securities. These advances may be made pursuant to several different credit programs, each of which has its own interest rate, range of maturities and call features. At December 31, 2016, we had $833.7 million in FHLB advances outstanding and the ability to borrow an additional $1.82 billion. In addition to FHLB advances, we may also use the discount window at the FRB or fed funds purchased from correspondent banks as a source of short-term funding. We did not have an outstanding balance with the FRB discount window or fed funds purchased from correspondent banks at December 31, 2016. See Note 11 of the Notes to Consolidated Financial Statements contained in Item 8 of this report for more information about our borrowings.
The following table sets forth the maximum month-end balance and daily average balance of FHLB advances, repurchase agreements, subordinated debt and other borrowings for the periods indicated.
Years Ended December 31, | |||||||||||
2016 | 2015 | 2014 | |||||||||
(Dollars in thousands) | |||||||||||
Maximum balance: | |||||||||||
FHLB advances | $ | 1,609,438 | $ | 1,439,904 | $ | 874,866 | |||||
Repurchase agreements | 86,691 | 89,772 | 25,000 | ||||||||
Subordinated debt and other borrowings | 134,103 | 85,290 | 55,000 | ||||||||
Average balance outstanding: | |||||||||||
FHLB advances | $ | 1,113,550 | $ | 914,077 | $ | 608,341 | |||||
Repurchase agreements | 69,153 | 75,271 | 25,000 | ||||||||
Subordinated debt and other borrowings | 104,639 | 24,931 | 342 | ||||||||
21
The following table sets forth certain information as to FHLB advances, repurchase agreements, subordinated debt and other borrowings at the dates indicated.
At December 31, | |||||||||||
2016 | 2015 | 2014 | |||||||||
(Dollars in thousands) | |||||||||||
FHLB advances at end of period | $ | 833,682 | $ | 1,439,904 | $ | 862,907 | |||||
Repurchase agreements at end of period | 86,691 | 83,269 | 25,000 | ||||||||
Subordinated debt and other borrowings at end of period | 134,032 | 84,992 | — | ||||||||
Weighted average rate of FHLB advances during the period | 0.64 | % | 0.72 | % | 1.25 | % | |||||
Weighted average rate of FHLB advances at end of period | 0.71 | % | 0.51 | % | 0.71 | % | |||||
Weighted average rate of repurchase agreements during the period | 1.22 | % | 1.18 | % | 3.22 | % | |||||
Weighted average rate of repurchase agreements at end of period | 0.98 | % | 1.08 | % | 3.22 | % | |||||
Weighted average rate of subordinated debt and other borrowings during the period | 5.77 | % | 4.21 | % | 0.56 | % | |||||
Weighted average rate of subordinated debt and other borrowings at end of period | 5.20 | % | 4.95 | % | — | % | |||||
How We Are Regulated
Set forth below is a brief description of certain laws and regulations that are applicable to the Company and the Bank. This description, as well as other descriptions of laws and regulations contained in this Form 10-K, is not complete and is qualified in its entirety by reference to the applicable laws and regulations.
Legislation is introduced from time to time in the United States Congress that may affect our operations. In addition, the regulations governing the Company and the Bank may be amended from time to time by the TDOB, the FRB, the FDIC, the Consumer Financial Protection Bureau ( the “CFPB”), the Securities and Exchange Commission (the “SEC”), or other agencies, as appropriate. Any legislative or regulatory changes in the future could adversely affect our operations and financial condition.
Regulators of the Bank are the TDOB and the FRB with back-up oversight by the FDIC. The Bank is required to have certain reserves and stock set by FRB. The Bank is a member of the Federal Home Loan Bank of Dallas, one of the 12 regional banks in the Federal Home Loan Bank System.
The Company. The Company is a bank holding company required to register and file reports with the FRB and is subject to regulation and examination by the FRB, including requirements that the Company serve as a source of financial and managerial strength for its FDIC-insured subsidiaries, particularly when such a subsidiary is in financial distress. In addition, the FRB has enforcement authority over the Company and any of its non-bank subsidiaries. The Company’s direct activities and those of its non-bank subsidiaries are subject to FRB regulation and generally must be closely related to banking, as determined by the FRB. The Company must obtain FRB approval to acquire substantially all the assets of another bank or bank holding company or to merge with another bank holding company. In addition, the Company must obtain FRB authorization to control more than 5% of the shares of any other bank or bank holding company and may not own more than 5% of any other entity engaged in activities not permitted for the Company. The FRB imposes capital requirements on the Company. See “- Regulatory Capital Requirements” below.
LegacyTexas Bank. The Bank is subject to regulation, examination and supervision by the FRB and the TDOB. The FRB oversees the Bank’s compliance with operations under federal law, regulations and policies, including consumer protection laws. The FRB extensively regulates many aspects of the Bank’s operations including branching, dividends, interest and fees collected, anti-money laundering activities, confidentiality of customer information, debit card operations, corporate governance, mergers and purchase and assumption transactions, insurance activities, securities investments, real estate investments, trust operations, lending activities, subsidiary operations and required capital levels. It also regulates the Bank’s transactions with affiliates (including the Company) and loans to insiders. This regulation and supervision primarily is intended for the protection of depositors and not for the purpose of protecting shareholders.
As a result of examinations, the FRB can require a supervised bank to establish additional reserves for loan losses, which decreases net income. The FRB and the other federal banking agencies have adopted guidelines establishing safety and soundness standards on such matters as loan underwriting and documentation, asset quality, earnings standards, internal controls and audit systems, interest rate risk exposure and compensation and other employee benefits. Any institution which
22
fails to comply with these standards must submit a compliance plan. The FRB also has extensive enforcement authority over all Federal Reserve member banks and their management, employees and affiliates. This enforcement authority includes, among other things, the ability to assess civil money penalties, to issue cease-and-desist or removal orders and to initiate injunctive actions. In general, these enforcement actions may be initiated for violations of laws and regulations and unsafe or unsound practices. Other actions or inactions may provide the basis for enforcement action, including misleading or untimely reports filed with the FRB. Except under certain circumstances, public disclosure of final enforcement actions by the FRB is required.
The Bank is also regulated by the TDOB, whose authority to regulate, examine and supervise the bank is generally the same as that of the FRB described above. As a Texas-chartered bank, the Bank has the powers provided under Texas law, which are generally at least as broad as those of a national bank. The Bank is subject to assessments by the TDOB. In 2016, the Bank’s assessments from the TDOB totaled $606,000.
FDIC Regulation and Insurance of Accounts. Deposits are insured up to applicable limits by the FDIC, and such insurance is backed by the full faith and credit of the United States Government. The basic deposit insurance level is generally $250,000, as specified in FDIC regulations. The Bank's deposit insurance premiums for the year ended December 31, 2016 were $4.4 million.
In accordance with the Dodd-Frank Act, the FDIC insurance premium is based on an institution’s total assets minus its Tier 1 capital, instead of based on its deposits. An institution’s premiums are determined based on its capital, supervisory ratings and other factors. Premium rates generally may increase if the FDIC deposit insurance fund is strained due to the cost of bank failures and the number of troubled banks. In addition, if the Bank experiences financial distress or operates in an unsafe or unsound manner, its deposit premiums may increase.
The FDIC may conduct examinations and some supervision of, require reporting by and exercise back-up enforcement authority against FDIC-insured institutions. It also may prohibit an institution from engaging in any activity that it determines by regulation or order to pose a serious risk to the deposit insurance fund and may terminate the Bank's deposit insurance if it determines that the institution has engaged in unsafe or unsound practices or is in an unsafe or unsound condition.
Regulatory Capital Requirements. Effective January 1, 2015 (with some changes transitioned into full effectiveness over two to four years), the Company and the Bank became subject to new capital regulations adopted by the FRB and the other federal banking agencies, which created a new required ratio for common equity Tier 1 (“CET1”) capital, increased the minimum leverage and Tier 1 capital ratios, changed the risk-weightings of certain assets for purposes of the risk-based capital ratios, created an additional capital conservation buffer over the required capital ratios, and changed what qualifies as capital for purposes of meeting the capital requirements.
Under these new capital regulations, the minimum capital ratios are: (1) a CET1 capital ratio of 4.5% of risk-weighted assets; (2) a Tier 1 capital ratio of 6.0% of risk-weighted assets; (3) a total risk-based capital ratio of 8.0% of risk-weighted assets; and (4) a leverage ratio (the ratio of Tier 1 capital to average total adjusted assets) of 4.0%. CET1 generally consists of common stock, retained earnings, accumulated other comprehensive income (“AOCI”) unless an institution elects to exclude AOCI from regulatory capital, and certain minority interests; all subject to applicable regulatory adjustments and deductions. Tier 1 capital generally consists of CET1 and noncumulative perpetual preferred stock. Tier 2 capital generally consists of other preferred stock and subordinated debt meeting certain conditions plus an amount of the allowance for loan and lease losses up to 1.25% of assets. Total capital is the sum of Tier 1 and Tier 2 capital.
A number of changes in what constitutes regulatory capital compared to the rules in effect prior to January 1, 2015 are subject to transition periods. These changes include the phasing-out of certain instruments as qualifying capital. Mortgage servicing rights and deferred tax assets over designated percentages of CET1 are deducted from capital. In addition, Tier 1 capital includes AOCI, which includes all unrealized gains and losses on available for sale debt and equity securities. However, because of our asset size, we were eligible for the one-time option of permanently opting out of the inclusion of unrealized gains and losses on available for sale debt and equity securities in our capital calculations. We elected this option.
For purposes of determining risk-based capital, assets and certain off-balance sheet items are risk-weighted from 0% to 1,250%, depending on the risk characteristics of the asset or item. The new regulations make certain changes in the risk-weighting of assets to better reflect credit risk and other risk exposure compared to the earlier capital rules. These include a 150% risk weight (up from 100%) for certain high volatility commercial real estate acquisition, development and construction loans and for non-residential mortgage loans that are 90 days past due or otherwise in nonaccrual status; a 20% (up from 0%) credit conversion factor for the unused portion of a commitment with an original maturity of one year or less that is not unconditionally cancellable; and a 250% risk weight (up from 100%) for mortgage servicing rights and deferred tax assets that are not deducted from capital.
23
In addition to the minimum CET1, Tier 1 and total risk-based capital ratios, the Company and the Bank must maintain a capital conservation buffer consisting of additional CET1 capital greater than 2.5% of risk-weighted assets above the required minimum levels in order to avoid limitations on paying dividends, repurchasing shares, and paying discretionary bonuses. The new capital conservation buffer requirement began on January 1, 2016 when a buffer greater than 0.625% of risk-weighted assets was required, which will increase each year until the buffer requirement is fully implemented on January 1, 2019.
Under the FRB’s prompt corrective action standards, in order to be considered well-capitalized, the Bank must have a ratio of CET1 capital to risk-weighted assets of 6.5%, a ratio of Tier 1 capital to risk-weighted assets of 8%, a ratio of total capital to risk-weighted assets of 10%, and a leverage ratio of 5%; and must not be subject to any written agreement, order, capital directive, or prompt corrective action directive to meet and maintain a specific capital level for any capital measure. In order to be considered adequately capitalized, an institution must have the minimum capital ratios described above. As of December 31, 2016, the Bank was “well-capitalized.” An institution that is not well-capitalized is subject to certain restrictions on brokered deposits and interest rates on deposits.
The federal banking regulators are required to take prompt corrective action if an institution fails to qualify as adequately capitalized. All institutions, regardless of their capital levels, are restricted from making any capital distribution or paying any management fees that would cause the institution to fail the requirements to qualify as adequately capitalized. An institution that is not at least adequately capitalized is: (i) subject to increased monitoring by the appropriate federal banking regulator; (ii) required to submit an acceptable capital restoration plan (including certain guarantees by any company controlling the institution) within 45 days; (iii) subject to asset growth limits; and (iv) required to obtain prior regulatory approval for acquisitions, branching and new lines of business. Additional restrictions and appointment of a receiver or conservator, can apply, depending on the institution's capital level. The FRB has jurisdiction over the Bank for purposes of prompt corrective action. When the FDIC as receiver liquidates an institution, the claims of depositors and the FDIC as their successor (for deposits covered by FDIC insurance) have priority over other unsecured claims against the institution, including claims of stockholders.
The federal banking agencies take into consideration concentrations of credit risk and risks from non-traditional activities, as well as an institution's ability to manage those risks, when determining the adequacy of an institution's capital, which is evaluated through the institution's regular safety and soundness examination. Under their regulations, the federal banking agencies also consider interest rate risk (when the interest rate sensitivity of an institution's assets does not match the sensitivity of its liabilities or its off-balance-sheet position) in the evaluation of a bank's capital adequacy. The banking agencies have issued guidance on evaluating interest rate risk.
The capital regulations for bank holding companies parallel the capital regulations for banks. To be considered "well capitalized," a bank holding company must have, on a consolidated basis, a total risk-based capital ratio of 10.0% or greater and a Tier 1 risk-based capital ratio of 6.0% or greater and must not be subject to an individual order, directive or agreement under which the FRB requires it to maintain a specific capital level. As of December 31, 2016, the Company was "well capitalized." For information on the Company’s regulatory capital ratios, see “Item 7 - Management’s Discussion and Analysis of Financial Condition and Results of Operations - Capital Resources.” We believe that the Company and the Bank will remain well-capitalized under the new capital rules, and will meet the capital conservation buffer requirement.
Limitations on Dividends and Other Capital Distributions. On an ongoing basis, the Company’s major source of funds consists of dividends or capital distributions from our wholly owned bank subsidiary, as well as $125.0 million of fixed-to-floating rate subordinated notes issued by the Company. The ability of a subsidiary bank to pay dividends depends on its earnings and capital levels and may be limited by their regulator's directives or orders. A bank generally must obtain regulatory approval of a dividend if the total dividends declared during the current year, including the proposed dividend, exceed net income for the current year and retained net income for the prior two years. It has been the Bank’s policy to maintain a strong capital position, so in times of financial or economic distress the Bank will be less likely to pay dividends to the Company. Our banking subsidiary's net income for the two years ended December 31, 2016 totaled $176.7 million and the amount paid to the Company during that two year period totaled $139.7 million, which included a payment to the Company in the amount of $115.2 million in January 2015 to cover the cash portion of the merger consideration paid to shareholders of LegacyTexas Group, Inc. See Note 16 of the Notes to Consolidated Financial Statements contained in Item 8 of this report.
The ability of the Company to pay dividends to its stockholders is dependent on the receipt of dividends from its bank subsidiary. Under Maryland law, the Company cannot pay cash dividends if it would render the Company unable to pay its debts (unless they are paid from recent earnings) or become insolvent.
24
The FRB has issued a policy statement on the payment of cash dividends by bank holding companies, which expresses the FRB’s view that a bank holding company should pay cash dividends only to the extent that its net income for the past year is sufficient to cover both the cash dividends and a rate of earnings retention that is consistent with the holding company’s capital needs, asset quality and overall financial condition. The FRB also indicated that it would be inappropriate for a company experiencing serious financial problems to borrow funds to pay dividends. Furthermore, a bank holding company may be prohibited from paying any dividends if the holding company’s bank subsidiary is not adequately capitalized. See “Regulatory Capital Requirements” above regarding restrictions on payment on dividends by the Company and the Bank in the event of an inadequate capital conservation buffer.
A bank holding company is required to give the FRB prior written notice of any purchase or redemption of its outstanding equity securities if the gross consideration for the purchase or redemption, when combined with the net consideration paid for all such purchases or redemptions during the preceding 12 months, is equal to 10% or more of the company’s consolidated net worth. The FRB may disapprove such a purchase or redemption if it determines that the proposal would constitute an unsafe or unsound practice or would violate any law, regulation, FRB order, or any condition imposed by, or written agreement with, the FRB. This notification requirement does not apply to any company that meets the well capitalized standard for bank holding companies, is well-managed, and is not subject to any unresolved supervisory issues.
Federal Securities Laws. The common stock of the Company is registered with the SEC under the Securities Exchange Act of 1934, as amended (the “Exchange Act”). Therefore, the Company is subject to the reporting, information disclosure, proxy solicitation, insider trading limits and other requirements imposed on public companies by the SEC under the Exchange Act. This includes limits on sales of stock by certain insiders and the filing of insider ownership reports with the SEC. The SEC and Nasdaq have adopted regulations under the Sarbanes-Oxley Act of 2002 and the Dodd Frank Act that apply to the Company as a Nasdaq-traded, public company, which seek to improve corporate governance, provide enhanced penalties for financial reporting improprieties and improve the reliability of disclosures in SEC filings.
Subsidiary and Other Activities
LegacyTexas Bank is authorized to invest in various types of subsidiaries. At December 31, 2016, the Bank operated one subsidiary, LegacyTexas Title Co. In 2016, the Bank sold the operations of LegacyTexas Insurance Services, Inc., which remains a non-operating subsidiary of the Bank.
Competition
The Texas market for banking services is highly competitive. Texas’ largest banking organizations are headquartered outside of Texas and are controlled by out-of-state organizations. We also compete with other providers of financial services, such as credit unions, consumer finance companies, insurance companies and commercial finance and leasing companies. We believe that many middle market companies and successful professionals and entrepreneurs are interested in banking with a company headquartered in, and with decision-making authority based in, Texas and with established Texas bankers who have the expertise to act as trusted advisors to the customer with regard to its banking needs. We believe our bank can offer customers more responsive and personalized service. We believe that, if we service these customers properly, we will be able to establish long-term relationships and provide multiple products to our customers, thereby enhancing our profitability.
Executive Officers of the Company
Officers are elected annually to serve for a one year term. As of the date of this report, our executive officers were as follows:
Kevin J. Hanigan. Mr. Hanigan, age 60, is a Director and the Chief Executive Officer of the Company and the Bank, positions he has held since the completion of the Highlands Bank acquisition with and into the Company in April 2012. Prior to joining the Company, Mr. Hanigan was the Chairman and Chief Executive Officer of Highlands Bank, serving in those roles since 2010. Prior to joining Highlands Bank, Mr. Hanigan was employed by Guaranty Bank starting in 1996, serving in numerous capacities including Chief Lending Officer, Executive in charge of Retail Banking, and finally as Chairman and Chief Executive Officer of Guaranty Bank and its parent company, Guaranty Financial Group, Inc. Mr. Hanigan began his career with Bank of the Southwest in Houston in June 1980. Mr. Hanigan earned his undergraduate degree and Master of Business Administration from Arizona State University. With over 36 years of experience working in the banking industry in Texas and serving as chief executive officer of several institutions, Mr. Hanigan brings outstanding leadership skills and a deep understanding of the local banking market and issues facing the banking industry.
Scott A. Almy. Mr. Almy, age 50, serves as Executive Vice President, Chief Operating Officer, Chief Risk Officer and General Counsel of the Company and the Bank, where he oversees the credit, loan administration, risk, compliance, audit,
25
information technology, human resources and legal functions of the Company and has more than 25 years of bank regulatory expertise. Prior to joining the Company in July 2012, Mr. Almy was the managing member of a private law firm in Dallas, where he focused on regulatory and transactional matters affecting banks, bank holding companies and other financial firms. Prior to that, he spent 15 years at Guaranty Financial Group, Inc. serving as general counsel and secretary for the company and its subsidiary, Guaranty Bank. Mr. Almy has a J.D. from Texas Tech University School of Law and a B.B.A. from Texas A&M University. He also completed the Executive Education Program in Advanced Risk Management at the Wharton School, University of Pennsylvania.
J. Mays Davenport. Mr. Davenport, age 48, serves as Executive Vice President and Chief Financial Officer of the Company and the Bank, positions he has held since the completion of the merger with LegacyTexas Group, Inc. in January 2015. Mr. Davenport oversees the Finance and Treasury functions of the Company, and also serves as a Director of LegacyTexas Title. Prior to joining the Company, Mr. Davenport served as Executive Vice President of the wholly owned subsidiary of LegacyTexas Group, Inc. since December 2004. Mr. Davenport is a licensed Certified Public Accountant in the State of Texas and has been serving the Texas banking community for over twenty years, including fourteen years in the practice of public accountancy with Arthur Andersen, Grant Thornton, Fisk & Robinson and RSM McGladrey LLP. Mr. Davenport is a Magna Cum Laude graduate of Texas A&M University with a B.B.A. in Finance and Accounting.
Charles D. Eikenberg. Mr. Eikenberg, age 62, serves as Executive Vice President of Community Banking for the Company and the Bank, where he oversees the community banking, administrative operations and marketing functions of the Company. He has over 35 years of experience as a Texas banker, primarily focused on consumer and retail banking. Mr. Eikenberg joined the Company as head of Community Banking in 2012 when the Company merged with Highlands Bank, where he served as Chief Retail Officer. Prior to joining Highlands, Mr. Eikenberg served as Senior Executive Vice President, Retail Banking at Guaranty Bank from 2006 to 2010. Prior to Guaranty he was with Bank One/Chase since 1990, serving in numerous senior positions for retail credit, investments and branch distribution. Mr. Eikenberg holds an M.B.A. from the University of Houston and a Bachelors Degree from Baylor University.
Thomas S. Swiley. Mr. Swiley, age 67, has served as Executive Vice President and Chief Lending Officer of the Company and the Bank since July 2012. Mr. Swiley oversees the Corporate Banking, Commercial Banking, Entrepreneurial Banking, Commercial Real Estate and Warehouse Lending Divisions of the Company, along with the Treasury Management Sales function. Mr. Swiley's extensive Texas banking career spans over thirty-five years, and includes six years as President, and President and Chief Operating Officer of Bank of Texas, N.A. He has also held various executive positions with other commercial banks, primarily with Bank of America and its predecessors. Mr. Swiley holds both a M.B.A. and B.B.A. from Southern Methodist University and is also a graduate of the Southwestern Graduate School of Banking.
Kevin Hanigan, Scott Almy and Charles Eikenberg all served as executive officers of Guaranty Bank and its holding company, Guaranty Financial Group, Inc., which filed for bankruptcy in August 2009.
Employees
At December 31, 2016, we had a total of 870 full-time employees and 26 part-time employees. Our employees are not represented by any collective bargaining group. Management considers its employee relations to be good.
Internet Website
We maintain a website with the address legacytexasfinancialgroup.com. The information contained on our website is not included as a part of, or incorporated by reference into, this Annual Report on Form 10-K. Other than an investor’s own Internet access charges, we make available free of charge through our website our Annual Reports on Form 10-K, Quarterly Reports on Form 10-Q and Current Reports on Form 8-K, and amendments to these reports, as soon as reasonably practicable after we have electronically filed such material with, or furnished such material to, the SEC.
Item 1A. | Risk Factors |
An investment in our common stock is not an insured deposit and is subject to risks inherent in our business. Before making an investment decision, you should carefully consider the risks and uncertainties described below together with all of the other information included and incorporated by reference in this report. In addition to the risks and uncertainties described below, other risks and uncertainties not currently known to us or that we currently deem to be immaterial also may materially and adversely affect our business, financial condition, capital levels, cash flows, liquidity, results of operations and prospects. The market price of our common stock could decline significantly due to any of these identified or other risks, and you could lose some or all of your investment. The risks discussed below also include forward-looking statements, and our actual results
26
may differ substantially from those discussed in these forward-looking statements. This report is qualified in its entirety by these risk factors.
Risks Related To Our Business
A return of recessionary conditions could result in increases in our level of non-performing loans and/or reduce demand for our products and services, which could have an adverse effect on our results of operations.
A return of recessionary conditions and/or negative developments in the domestic and international credit markets may significantly affect the markets in which we do business, the value of our loans and investments, and our ongoing operations, costs and profitability. Declines in real estate values and sales volumes, declines in oil and gas prices, and adverse employment conditions may result in higher than expected loan delinquencies and a decline in demand for our products and services. These negative events may cause us to incur losses and may adversely affect our capital, liquidity, and financial condition.
If economic conditions deteriorate in the state of Texas, the value of our collateral and borrowers' ability to repay loans may decline.
Substantially all of our loans are located in the state of Texas. Our financial results may be adversely affected by changes in prevailing economic conditions, including decreases in real estate values, changes in interest rates which may cause a decrease in interest rate spreads, further declines in oil and gas prices, adverse employment conditions, the monetary and fiscal policies of the federal government and other significant external events. Decreases in real estate values in the state of Texas could adversely affect the value of property used as collateral for some of our loans. As a result, the market value of the real estate underlying the loans may not, at any given time, be sufficient to satisfy the outstanding principal amount of the loans. In the event that we are required to foreclose on a property securing a loan, we may not recover funds in an amount equal to the remaining loan balance. Consequently, we would sustain loan losses and potentially incur a higher provision for credit losses, which would have an adverse impact on earnings. In addition, if oil prices were to experience a sustained decline, jobs related to the exploration, production and delivery of oil and gas, which had been expanding in previous years, may decline. Adverse changes in the Texas economy may have a negative effect on the ability of borrowers to make timely repayments of their loans, which would also have an adverse impact on earnings.
Our loan portfolio, and specifically our energy lending portfolio, could be impacted by declines in the prices of oil and natural gas, as well as other factors.
Energy loans, which are reported as commercial and industrial loans, totaled $527.2 million at December 31, 2016, representing approximately 8.7% of total loans (excluding Warehouse Purchase Program loans). As a result, the factors that impact the energy sector will have a greater effect on us than on more broadly diversified financial institutions. Companies with exposure to the energy sector, whether directly or indirectly, are subject to volatile fluctuations in price and supply of oil and gas, and can be impacted by governmental regulations, international politics and conflicts, including the lifting or imposition of sanctions on Iran, Russia or other oil producing countries, hostilities in the Middle East, terrorist attacks, the success of exploration projects, reduced demand as a result of increases in energy efficiency and energy conservation, natural disasters, clean-up and litigation costs associated with environmental damage and extensive regulation.
The vast majority of the loans in the Energy portfolio are reserve based loans, secured by deeds of trust on properties containing both oil and natural gas reserves. $39.0 million of the loans managed by the Energy Finance group are not secured by oil and gas reserves and are categorized as “Midstream and Other” loans. Loans in this category are typically related to the transmission of oil and natural gas and would only be indirectly impacted from declining commodity prices. Reserve based loans are typically less sensitive to declines in commodity prices than loans to companies that service the oil and gas industry, because once production is initiated in a well, it is generally not halted until reserves are gone, whereas companies that service the energy industry typically feel an immediate impact to large drops in oil prices since drilling and exploration is slowed immediately. With reserve based loans, the value of our collateral decreases as oil and natural gas prices decline. At December 31, 2016, we had four relationships in the commercial and industrial loan portfolio (outside of the reserve based and midstream loans discussed above) that were involved in the energy exploration sector providing front-end services to companies that drill oil and gas wells and whose business could be impacted by the dramatic reduction in drilling activity as a result of a sustained drop in the price of oil and gas. These relationships totaled $2.4 million at December 31, 2016, of which one relationship totaling $97,000 is currently classified as Substandard and Impaired. The other relationships consist of performing loans and are not criticized.
27
In the fourth quarter of 2015, the Company increased qualitative reserve factors applied to the energy loan portfolio due to the impact of pressure on the price of oil, and the Company has continued to apply elevated reserve amounts to the energy portfolio through 2016 due to sustained economic and regulatory uncertainty surrounding energy loans. The allowance for loan losses allocated to energy loans at December 31, 2016 totaled $19.2 million, up $7.2 million from $12.0 million at December 31, 2015. In addition to the $2.6 million in specific reserves on non-performing energy relationships, these reserve amounts continue to reflect elevated qualitative factors compared to the same period in 2015. In an effort to increase oil and gas prices, members of the Organization of Petroleum Exporting Countries’ (OPEC) recently agreed to limit oil production for six months starting in 2017, and several other oil producing nations have also agreed to lower their output, however, there are no assurances that setting these types of production caps will support higher prices for oil and gas or that actual production will be limited. Previous agreements have been broken by nations and there is no firm mechanism for enforcement. Sustained low oil and gas prices, or further declines in oil and gas pricing, could lead to additional risk rating downgrades, loan loss reserves, or losses.
Further, the economy in Texas as a whole could be negatively impacted if there are a high number of jobs lost related to a decline in oil production in the state, or if the impact of lower oil prices negatively affect other industries. Major regulatory shifts, such as those that may result as a consequences of environmental regulations, that create significant expense to oil and gas processing or recovery, could be one reason for a decline in oil production in Texas. In addition, subsidies created to fund alternative energy could make these other forms of energy more competitively priced and thus decrease the demand for oil and gas. A decline in the Texas economy related to oil production decline could impact our loan portfolios outside of the energy portfolio, if borrowers experience unemployment or loss of income and are unable to make payments on their loans.
Our loan portfolio possesses increased risk due to our percentage of commercial real estate and commercial and industrial loans.
Over the last several years, through organic growth and acquisitions, we have been re-balancing our loan portfolio by increasing our commercial lending to diversify our loan mix and improve the yield on our assets, and we anticipate that trend to continue. The credit risk related to these types of loans is considered to be greater than the risk related to our previous target asset of one-to-four family residential loans because the repayment of commercial real estate loans and commercial and industrial loans typically is dependent on the successful operation and income stream of the borrowers' business and the real estate securing the loans as collateral, both of which can be significantly affected by economic conditions. Additionally, commercial loans typically involve larger loan balances to single borrowers or groups of related borrowers compared to residential real estate loans. If loans that are collateralized by real estate become troubled and the value of the real estate has been significantly impaired, then we may not be able to recover the full contractual amount of principal and interest that we anticipated at the time we originated the loan, which could require us to increase our provision for credit losses and adversely affect our financial condition and results of our operation.
Several of our borrowers have more than one commercial real estate loan outstanding with us. Consequently, an adverse development with respect to one loan or one credit relationship can expose us to significantly greater risk of loss compared to an adverse development with respect to a one-to-four family residential mortgage loan. Finally, if we foreclose on a commercial real estate loan, our holding period for the collateral, if any, typically is longer than for one-to-four family residential property because there are fewer potential purchasers of the collateral. Since we plan to continue to increase our originations of these loans, it may be necessary to increase the level of our allowance for loan losses due to the increased risk characteristics associated with these types of loans. Any increase to our allowance for loan losses would adversely affect our earnings. Any delinquent payments or the failure to repay these loans would hurt our earnings.
Our Warehouse Purchase Program balances can fluctuate widely.
Because Warehouse Purchase Program balances are contingent upon residential mortgage lending activity, changes in the residential real estate market nationwide can lead to wide fluctuations of balances in this product, materially impacting both interest and non-interest income. Additionally, Warehouse Purchase Program period-end balances are generally higher than the average balance during the period due to increased mortgage activity that occurs at the end of a month, which can significantly impact the Company's reported capital ratios.
Changes in interest rates could adversely affect our results of operations and financial condition.
As with most financial institutions, our results of operations depend substantially on our net interest income, which is the difference between the interest income we earn on our interest-earning assets, such as loans and securities, and the interest expense we pay on our interest-bearing liabilities, such as deposits and borrowings. Interest rates, which remain largely at historically low levels, are highly sensitive to many factors that are beyond our control such as general economic conditions
28
and policies of the federal government, in particular the Federal Open Market Committee. In an attempt to help the overall economy, the FRB has kept interest rates low through its targeted Fed Funds rate. In December 2016, the FRB increased the Fed Funds rate by 25 basis points and indicates further increases during 2017, subject to economic conditions. As the FRB increases the Fed Funds rate, overall interest rates will likely rise, which may negatively impact the U.S. economic recovery. Further, changes in monetary policy, including changes in interest rates, could influence (i) the amount of interest we receive on loans and securities, (ii) the amount of interest we pay on deposits and borrowings, (iii) our ability to originate loans and obtain deposits, (iv) the fair value of our assets and liabilities, and (v) the reinvestment risk associated with a reduced duration of our mortgage-backed securities portfolio as borrowers refinance to reduce borrowing costs. When interest-bearing liabilities reprice or mature more quickly than interest-earning assets, an increase in interest rates generally would tend to result in a decrease in net interest income.
Although management believes it has implemented an effective asset and liability management strategy to manage the potential effects of changes in interest rates, including the use of adjustable rate and/or short-term assets, and FHLB advances or longer term repurchase agreements, any substantial, unexpected, prolonged change in market interest rates could have a material adverse effect on our financial condition and results of our operation and/or our strategies may not always be successful in managing the risk associated with changes in interest rates.
Liquidity risk could impair our ability to fund operations and jeopardize our financial condition.
Liquidity is essential to our business. We rely on a number of different sources in order to meet our potential liquidity demands. Our primary sources of liquidity are increases in deposit accounts, cash flows from loan payments and our securities portfolio. Borrowings also provide us with a source of funds to meet liquidity demands. An inability to raise funds through deposits, borrowings, the sale of loans and other sources could have a substantial negative effect on our liquidity. Our access to funding sources in amounts adequate to finance our activities or on terms which are acceptable to us could be impaired by factors that affect us specifically, or the financial services industry or economy in general. Factors that could detrimentally impact our access to liquidity sources include adverse regulatory action against us or a decrease in the level of our business activity as a result of a downturn in the markets in which our loans are concentrated. Our ability to borrow could also be impaired by factors that are not specific to us, such as a disruption in the financial markets or negative views and expectations about the prospects for the financial services industry in light of the recent turmoil faced by banking organizations or deterioration in credit markets.
At December 31, 2016, public funds totaled $1.00 billion, representing 15.7% of our total deposits. Public funds are bank deposits of state and local municipalities. These deposits are required to be secured by certain investment grade securities (including letters of credit from the FHLB) to ensure repayment, which on the one hand tends to reduce our contingent liquidity risk by making these funds somewhat less credit sensitive, but on the other hand reduces standby liquidity by restricting the potential liquidity of the pledged collateral. Although these funds historically have been a relatively stable source of funds for us, availability depends on the individual municipality's fiscal policies and cash flow needs.
Our growth or future losses may require us to raise additional capital in the future, but that capital may not be available when it is needed or the cost of that capital may be very high.
We are required by regulatory authorities to maintain adequate levels of capital to support our operations. We anticipate that our capital resources will satisfy our capital requirements for the foreseeable future. We may at some point need to raise additional capital to support continued growth or losses, both internally and through acquisitions. Any capital we obtain may result in the dilution of the interests of existing holders of our common stock.
Our ability to raise additional capital, if needed, will depend on conditions in the capital markets at that time (which are outside our control) and on our financial condition and performance. Accordingly, we cannot make assurances of our ability to raise additional capital if needed, or if the terms will be acceptable to us. If we cannot raise additional capital when needed, our ability to further expand our operations through internal growth and acquisitions could be materially impaired and our financial condition and liquidity could be materially and negatively affected.
Our ability to attract and retain key employees may change.
Our success depends, in large part, on our ability to attract and retain key employees, competition for which can be intense. We may not be able to hire or retain these employees. The unexpected loss of a key employee could have a material adverse impact on our business as the skills, knowledge of our market and institution, and the years of experience of a departing key employee which are all difficult to quickly replace with qualified personnel.
29
Our information systems may experience interruptions or breaches in security.
Our information systems may experience interruptions or breaches in security. We rely heavily on communications and information systems to conduct our business. Any failure, interruption or breach in security of these systems could result in disruptions to our accounting, deposit, loan and other systems, and adversely affect the Bank's customer relationships. While we have policies and procedures designed to prevent or limit the effect of these possible events, there can be no assurance that any such failure, interruption or security breach will not occur or, if any does occur, that it can be sufficiently remediated.
There have been increasing efforts on the part of third parties, including through cyberattacks, to breach data security at financial institutions or with respect to financial transactions. There have been several recent instances involving financial services and consumer-based companies reporting the unauthorized disclosure of client or customer information or the destruction or theft of corporate data. In addition, because the techniques used to cause such security breaches change frequently, often are not recognized until launched against a target and may originate from less regulated and remote areas around the world, we may be unable to proactively address these techniques or to implement adequate preventative measures. The ability of our customers to bank remotely, including online and through mobile devices, requires secure transmission of confidential information and increases the risk of data security breaches.
In addition, we outsource certain aspects of our data processing and other operational functions to certain third-party providers. If these third-party providers encounter difficulties, or if we have difficulty in communicating with them, our ability to adequately process and account for transactions may be affected. Threats to information security also exist in the processing of customer information through various other vendors and their personnel.
The occurrence of any failure, interruption or security breach of our systems or the systems of our third-party vendors, particularly if widespread or resulting in financial losses to customers, could require us to expend significant additional resources to modify our protective measures or to investigate and remediate vulnerabilities or other exposures, damage our reputation, result in a loss of customer business, subject us to additional regulatory scrutiny, and/or expose us to civil litigation and financial liability.
Natural disasters, severe weather events, worldwide hostilities, including terrorist attacks, and other external events may adversely affect the general economy, the financial services industry, the industries of our customers, and us in particular.
Natural disasters, severe weather events, including those prominent in our geographic footprint and those prominent in the geographic areas of our vendors and business partners, together with worldwide hostilities, including terrorist attacks, and other external events could have a significant impact on our ability to conduct our business. They could also affect the stability of our deposit base, our borrowers' ability to repay loans, impair collateral, result in a loss of revenue or an increase in expenses. Although management has established disaster recovery and business continuity procedures and plans, the occurrence of any such event may adversely affect our business, which in turn could have a material adverse effect on our financial condition and results of our operations.
We operate in a highly regulated environment and may be adversely affected by changes in federal and state laws and regulations that are expected to increase our costs of operations.
The Bank is currently subject to extensive examination, supervision and comprehensive regulation by the FRB and the TDOB and as a bank holding company the Company is subject to examination, supervision and regulation by the FRB. These regulatory authorities have extensive discretion in connection with their supervisory and enforcement activities, including the ability to impose restrictions on an institution's operations, reclassify assets, determine the adequacy of an institution's allowance for loan losses and determine the level of deposit insurance premiums assessed.
Additionally, the Dodd-Frank Wall Street Reform and Consumer Protection Act (the “Dodd-Frank Act”) has significantly changed the bank regulatory structure and affects the lending, deposit, investment, trading and operating activities of financial institutions and their holding companies. The Dodd-Frank Act requires various federal agencies to adopt a broad range of new implementing rules and regulations, and to prepare numerous studies and reports for Congress. The federal agencies are given significant discretion in drafting the implementing rules and regulations, and consequently, many of the details and much of the impact of the Dodd-Frank Act may not be known for many months or years.
The Dodd-Frank Act created the Consumer Financial Protection Bureau (the “CFPB”) with broad powers to supervise and enforce consumer protection laws. The CFPB has broad rule-making authority for a wide range of consumer protection laws that apply to all banks and savings institutions, including the authority to prohibit “unfair, deceptive or abusive” acts and
30
practices. The CFPB has examination and enforcement authority over all banks and savings institutions with more than $10 billion in assets. Financial institutions such as the Bank with $10 billion or less in assets are examined for compliance with the consumer laws by their primary bank regulators but are subject to the rules of the CFPB.
The CFPB has issued a number of final regulations and changes to certain consumer protections under existing laws. These final rules generally prohibit creditors from extending mortgage loans without regard for the consumer’s ability-to-repay and add restrictions and requirements to mortgage origination and servicing practices. In addition, these rules limit prepayment penalties and require the creditor to retain evidence of compliance with the ability-to-repay requirement for three years. Compliance with these rules has increased, and will likely continue to increase, our overall regulatory compliance costs and may require changes to our underwriting practices with respect to mortgage loans. Moreover, these rules may adversely affect the volume of mortgage loans that we underwrite and may subject us to increased potential liabilities related to such residential loan origination activities.
It is difficult to predict at this time all the specific impacts the Dodd-Frank Act and the implementing rules and regulations will have on community banks. However, they have and are expected to continue to increase our operating and compliance costs, which could adversely affect key operating efficiency ratios, and could increase our non-interest expense. See - “Business - How We Are Regulated” contained in Part I, Item I of this report.
Changes in laws and regulations and the cost of regulatory compliance with new laws and regulations may adversely affect our operations and our income and may decrease our efficiency.
We, directly and indirectly through the Bank, are subject to extensive regulation, supervision and examination by the TDOB, the FRB and the FDIC, and other regulatory bodies. These regulatory authorities have extensive discretion in connection with their supervisory and enforcement activities, including the ability to impose restrictions on a bank's operations, reclassify assets, determine the adequacy of a bank's allowance for loan losses and its risk weighting of its assets and determine the level of deposit insurance premiums assessed. Our business is highly regulated; therefore, the laws and applicable regulations are subject to frequent change. Any new regulations or legislation, change in existing regulations or oversight, whether a change in regulatory policy or a change in a regulator's interpretation of a law or regulation, could have a material impact on our operations.
The potential exists for additional federal or state laws and regulations, or changes in policy or interpretation, affecting lending and funding practices, interest rate risk management and liquidity standards. Moreover, bank regulatory agencies have been active in responding to concerns and trends identified in examinations, and have issued many formal enforcement orders requiring capital ratios in excess of regulatory requirements. Bank regulatory agencies, such as the TDOB and the FRB, regulate the activities in which we may engage primarily for the protection of depositors and not for the protection or benefit of potential investors. In addition, new laws and regulations may increase our costs of regulatory compliance and of doing business, and otherwise affect our operations. New laws and regulations may significantly affect the markets in which we do business, the markets for and value of our loans and investments, the fees we can charge and our ongoing operations, costs and profitability.
Non-compliance with the USA PATRIOT Act, Bank Secrecy Act, or other laws and regulations could result in fines or sanctions.
The USA PATRIOT and Bank Secrecy Acts require financial institutions to develop programs to prevent financial institutions from being used for money laundering and terrorist activities. If such activities are detected, financial institutions are obligated to file suspicious activity reports with the U.S. Treasury’s Office of Financial Crimes Enforcement Network. These rules require financial institutions to establish procedures for identifying and verifying the identity of customers seeking to open new financial accounts. Failure to comply with these regulations could result in fines or sanctions. During the last year, several banking institutions have received large fines for non-compliance with these laws and regulations. While we have developed policies and procedures designed to assist in compliance with these laws and regulations, no assurance can be given that these policies and procedures will be effective in preventing violations of these laws and regulations.
31
Legal and regulatory proceedings and related matters could adversely affect us or the financial services industry in general.
We, and other participants in the financial services industry upon whom we rely to operate, have been and may in the future become involved in legal and regulatory proceedings. Most of the proceedings we consider to be in the normal course of our business or typical for the industry, however it is inherently difficult to assess the outcome of these matters and there can be no assurance that anyone in particular, including us, will prevail in any proceeding or litigation. There could be substantial cost and management diversion in such litigation and proceedings, and any adverse determination could have a materially adversely effect on our business, brand or image, or our financial condition and results of our operations.
Our business may be adversely affected by increasing prevalence of fraud and other financial crimes.
As a financial institution, we are subject to risk of loss due to fraud and other financial crimes. Nationally, reported incidents of fraud and other financial crimes have increased. We believe we have controls in place to detect and prevent such losses but in some cases multi-party collusion or other sophisticated methods of hiding fraud, may not be readily detected or detectable, and could result in losses that affect our financial condition and results of our operations.
Financial crime is not limited to the financial services industry. Our customers could experience fraud in their businesses, which could materially impact their ability to repay their loans, and deposit customers in all financial institutions are constantly and unwittingly solicited by others in fraud schemes that vary from easily detectable and obvious attempts to high-level and very complex international schemes that could drain an account of millions of dollars and require detailed financial forensics to unravel. While we have controls in place, contractual agreements with our customers partitioning liability, and insurance to help mitigate the risk, none of these are guarantees that we will not experience a loss, potentially a loss that could have a material adverse effect on our financial condition, reputation and results of our operations.
Our business is reliant on outside vendors.
Our business is highly dependent on the use of certain outside vendors for our day-to-day operations, including such high level vendors as our data processing vendor, our card processing vendor and our on-line banking vendors. Our operations are exposed to risk that a vendor may not perform in accordance with established performance standards required in our agreements for any number of reasons including a change in their senior management, their financial condition, their product line or mix and how they support existing customers, or a simple change in their strategic focus. While we have comprehensive policies and procedures in place to mitigate risk at all phases of vendor management from selection, to performance monitoring and renewals, the failure of a vendor to perform in accordance with contractual agreements could be disruptive to our business, which could have a material adverse effect on our financial conditions and results of our operations.
New or changing tax, accounting, and regulatory rules and interpretations could significantly impact strategic initiatives, results of operations, cash flows, and financial condition.
The financial services industry is extensively regulated. Federal and state banking regulations are designed primarily to protect the deposit insurance funds and consumers, not to benefit our stockholders. These regulations may sometimes impose significant limitations on operations. Regulatory authorities have extensive discretion in connection with their supervisory and enforcement activities, including the imposition of restrictions on the operation of an institution, the classification of assets by the institution and the adequacy of an institution's allowance for loan losses. Additionally, actions by regulatory agencies or significant litigation against us could require us to devote significant time and resources to defending our business and may lead to penalties that materially affect us. These regulations, along with the currently existing tax, accounting, securities, insurance, and monetary laws, regulations, rules, standards, policies, and interpretations control the methods by which financial institutions conduct business, implement strategic initiatives and tax compliance, and govern financial reporting and disclosures. These laws, regulations, rules, standards, policies, and interpretations are constantly evolving and may change significantly over time. Any new regulations or legislation, change in existing regulations or oversight, whether a change in regulatory policy or a change in a regulator's interpretation of a law or regulation, could have a material impact on our operations, increase our costs of regulatory compliance and of doing business and/or otherwise adversely affect us and our profitability. Further, changes in accounting standards can be both difficult to predict and involve judgment and discretion in their interpretation by us and our independent registered public accounting firm. These changes could materially impact, potentially even retroactively, how we report our financial condition and results of our operations as could our interpretation of those changes. We cannot predict what restrictions may be imposed upon us with future legislation.
32
Our business initiatives and strategies, product lines, revenue enhancement or efficiency improvements may be less successful than anticipated or not realized at all.
We make certain projections and assumptions when we adopt or modify existing business initiatives and strategies, product lines, enter or expand our market presence, attempt to re-balance our loan portfolio, execute our customer retention plan or seek revenue enhancement or efficiency improvements. Our projections and assumptions may not be accurate and may be affected by numerous conditions outside of our control and therefore we may not be able to achieve desired or projected results on the timeline we anticipate, some benefits may not be fully realized or we may not realize any benefit at all.
Our customers may have difficulty weathering a downturn in the economy, which may impair their ability to repay their loans.
Historically we have, and will continue to, target our marketing and business development strategies primarily to local or regional, small-to-medium sized businesses, some of whom are in volatile industries such as energy and real estate. These firms are generally more vulnerable to economic downturns, whether large and sudden downturns or moderate downturns that are more prolonged, and may not have the capital needed to compete against their larger, more capitalized competitors or a particular business sector may be affected significantly more than other sectors or the economy as a whole, and these firms may therefore experience volatile operating results, which may affect their ability to repay their loans. Additionally, the continued success of these firms is frequently contingent on a small group of owners or senior management, and the death, disability or resignation of one or more of such individuals could also have a material adverse effect on the business and its ability to repay its loan obligations. Economic downturns and other events that affect the economy as a whole, or our customers business in particular, could cause us to incur credit losses that would have a material adverse effect on our financial condition and results of our operation.
The credit quality of our loans could decline.
Although we regularly review credit exposure related to particular customers, industry sectors and product lines, default risk may arise from circumstances that are difficult to predict or detect. In such circumstances, we could experience an increase in our provision for credit losses, reserve for credit loss, nonperforming assets, and net charge-offs, any of which could have a material adverse effect on our financial condition and results of our operation.
Our loan portfolio also contains adjustable rate loans. Borrowers with adjustable rate loans are exposed to increased monthly payments when the related interest rate adjusts upward under the terms of the loan from the initial fixed to the rate computed in accordance with the applicable index and margin. Any rise in prevailing market interest rates may result in increased payments for borrowers who have adjustable rate loans, increasing the possibility of default. Borrowers seeking to avoid these increased monthly payments by refinancing their loans may no longer be able to find available replacement loans at comparably lower interest rates. In addition, a decline in housing prices may leave borrowers with insufficient equity in the collateral to permit them to refinance or the inability to sell the collateral for an amount equal to or greater than the unpaid principal balance of their loans.
These potential negative events, which may have a greater impact on our earnings and capital than on the earnings and capital of other financial institutions due to our product mix, may cause us to incur losses, which would adversely affect our capital and liquidity and damage our financial condition and business operations.
Our allowance for loan losses may not be sufficient to cover actual loan losses and/or our non-performing assets may increase.
In determining the amount of the allowance for loan losses, we review our loans and our loss and delinquency experience, evaluate economic conditions and make various assumptions and judgments about the loan portfolio. Management recognizes that significant new growth in loan portfolios, such as the increased focus on commercial and industrial loans, new loan products and the refinancing of existing loans can result in portfolios not performing in a historical or projected manner. If our assumptions are incorrect, our allowance for loan losses may not be sufficient to cover actual losses, resulting in additions to our allowance, which decreases our net income.
Our banking regulators periodically review our allowance for loan losses. These entities may require us to recognize additions to the allowance for loan losses based on their judgments about information available to them at the time of their review. Any increase in our allowance for loan losses or loan charge‑offs as required by these authorities may have a material adverse effect on our financial condition and results of operations. Further, the Financial Accounting Standards Board has adopted a new accounting standard that will be effective for our first fiscal year after December 15, 2019. This standard, referred to as Current Expected Credit Loss, or CECL, will require financial institutions to determine periodic estimates of
33
lifetime expected credit losses on loans, and recognize the expected credit losses as allowances for loan losses. This will change the current method of providing allowances for loan losses that are probable, which may require us to increase our allowance for loan losses, and may greatly increase the types of data we would need to collect and review to determine the appropriate level of the allowance for loan losses.
Our level of non-performing and other classified assets adversely affect our net income in various ways, including interest accruals, reserves for credit losses, write-downs and additional costs, including carrying costs of other real estate owned assets.
In addition, we may find it necessary or desirable to foreclose on certain loans we originate or acquire, and the foreclosure process may be lengthy and expensive. While we believe we have made all proper filings to properly secure our loans, to the extent we have not properly perfected our lien or ownership interest in the collateral securing our loans, our anticipated priority and perfection of the applicable security interest may be jeopardized. Furthermore, claims may be asserted by other lenders, borrowers or other claimants that might interfere with enforcement of our rights. Borrowers may resist foreclosure actions by asserting numerous claims, counterclaims and defenses against us, including, without limitation, lender liability claims and defenses, even when the assertions may have no basis in fact, in an effort to prolong the foreclosure action and seek to force us into a modification of the loan or a favorable buy-out of the borrower’s position in the loan. Foreclosure actions can take several years or more to litigate. At any time prior to or during the foreclosure proceedings, the borrower may file for bankruptcy, which would have the effect of staying the foreclosure actions and further delaying the foreclosure process and potentially result in a reduction or discharge of a borrower’s debt. Foreclosure also may create a negative public perception of the related property, resulting in a diminution of its value. Even if we are successful in foreclosing on a loan, the liquidation proceeds upon sale of the underlying real estate may not be sufficient to recover our cost basis in the loan, resulting in a loss to us. Furthermore, any costs or delays involved in the foreclosure of the loan or a liquidation of the underlying property will further reduce the net proceeds and, thus, increase the loss.
Further, the resolution of non-performing assets requires the active involvement of management, which can distract them from the overall supervision of our operations and other income-producing activities, all of which can have a material adverse effect on our financial condition and results of operations.
Our Enterprise Risk Management program may not be able to adequately monitor or control perceived risks.
Our enterprise risk management (“ERM”) program, which is designed to formalize the practice of understanding and controlling the nature and amount of risk we take pursuing our business initiatives and strategies and to establish management accountability for the risks accepted, includes an institution-wide coordination of credit risk, operational risk, market risk, capital management and liquidity management.
In 2012, the FRB issued proposed rules (“Enhanced Prudential Standards”) for the management of enterprise wide risk applicable to complex or larger financial institutions over $10 billion in assets or are otherwise covered by the Dodd-Frank Act. Some of the requirements of the Enhanced Prudential Standards include a formal board-level risk committee and the establishment of a Chief Risk Officer with oversight of the ERM program. While the Enhanced Prudential Standards may not currently be a requirement for us, management believes that much of the Enhanced Prudential Standards represent industry best-practices and we have already implemented, or are in the process of implementing, many of its requirements.
While we have an ERM program with Board-level involvement, we may not be able to monitor or control all risks, which could have a materially adverse effect on our financial condition and results of our operations.
We pursue a strategy of supplementing internal growth by acquiring other financial companies or their assets and liabilities that we believe will help us fulfill our strategic objectives and enhance our earnings. There are risks associated with this strategy.
As part of our general growth strategy, we have partially expanded our business through acquisitions. We completed the Highlands acquisition in April 2012 and the acquisition of LegacyTexas Group, Inc. in January 2015. Although our business strategy emphasizes organic expansion, we continue, from time to time in the ordinary course of business, to engage in preliminary discussions with potential acquisition targets. There can be no assurance that, in the future, we will successfully identify suitable acquisition candidates, complete acquisitions and successfully integrate acquired operations into our existing operations or expand into new markets. The consummation of any future acquisitions may dilute shareholder value or may have an adverse effect upon our operating results while the operations of the acquired business are being integrated into our operations. In addition, once integrated, acquired operations may not achieve levels of profitability comparable to those achieved by our existing operations, or otherwise perform as expected. Further, transaction-related expenses may adversely affect our earnings. These adverse effects on our earnings and results of operations may have a negative impact on the value of
34
the Company’s stock. Acquiring banks, bank branches or other businesses involves risks commonly associated with acquisitions, including:
• | We may be exposed to potential asset quality issues or unknown or contingent liabilities of the banks, businesses, assets, and liabilities we acquire. If these issues or liabilities exceed our estimates, our results of operations and financial condition may be materially negatively affected; |
• | Prices at which acquisitions can be made fluctuate with market conditions. We have experienced times during which acquisitions could not be made in specific markets at prices we considered acceptable and expect that we will experience this condition in the future; |
• | The acquisition of other entities generally requires integration of systems, procedures and personnel of the acquired entity into our company to make the transaction economically successful. This integration process is complicated and time consuming and can also be disruptive to the customers of the acquired business. If the integration process is not conducted successfully and with minimal effect on the acquired business and its customers, we may not realize the anticipated economic benefits of particular acquisitions within the expected time frame, and we may lose customers or employees of the acquired business. We may also experience greater than anticipated customer losses even if the integration process is successful. |
• | To the extent our costs of an acquisition exceed the fair value of the net assets acquired, the acquisition will generate goodwill. As discussed below, we are required to assess our goodwill for impairment at least annually, and any goodwill impairment charge could have a material adverse effect on our results of operations and financial condition; |
• | To finance an acquisition, we may borrow funds, thereby increasing our leverage and diminishing our liquidity, or raise additional capital, which could dilute the interests of our existing stockholders; and |
• | While the Highlands and LegacyTexas Group, Inc. acquisitions enhanced our rate of growth, we may not be able to continue to sustain our past rate of growth or to grow at all in the future. |
Our securities portfolio may be negatively impacted by fluctuations in market value and interest rates.
Our securities portfolio may be impacted by fluctuations in market value, potentially reducing accumulated other comprehensive income and/or earnings. Fluctuations in market value may be caused by changes in market interest rates, rating agency actions in respect of the securities, defaults by the issuer or with respect to the underlying securities, lower market prices for securities and limited investor demand. Our securities portfolio is evaluated for other-than-temporary impairment. If this evaluation shows impairment to the actual or projected cash flows associated with one or more securities, a potential loss to earnings may occur. Changes in interest rates can also have an adverse effect on our financial condition, as our available for sale securities are reported at their estimated fair value, and therefore are impacted by fluctuations in interest rates. We increase or decrease our shareholders' equity by the amount of change in the estimated fair value of the available for sale securities, net of taxes. There can be no assurance that declines in the market value of our securities portfolio will not result in other-than-temporary impairments of these assets, which would lead to accounting charges that could have a material adverse effect on our net income and capital levels.
The value of our goodwill and other intangible assets may decline.
Goodwill and other intangible assets are subject to a decline, perhaps even significantly, for several reasons including if there is a significant decline in our expected future cash flows, change in the business environment, or a material and sustained decline in the market value of our stock, which may require us to take future charges related to the impairment of that goodwill and other intangible assets in the future, which could have a material adverse effect on our financial condition and results of our operations.
35
Strong competition within our market area may limit our growth and profitability.
Competition in the banking and financial services industry is intense. We compete with numerous commercial banks, savings institutions, mortgage brokerage firms, credit unions, finance companies, mutual funds, insurance companies, and brokerage and investment banking firms operating locally and elsewhere. Many of our competitors have substantially greater resources and lending limits than we have, have greater name recognition and market presence that benefit them in attracting business, and offer certain services that we do not or cannot provide. In addition, larger competitors may be able to price loans and deposits more aggressively than we do. Our profitability depends upon our continued ability to successfully compete in our market area. The greater resources and deposit and loan products offered by some of our competitors may limit our ability to increase our interest earning assets.
Risks Related to the Company's Common Stock
Regulatory and corporate governance anti-takeover provisions may make it difficult for you to receive a change-in-control premium.
Provisions of federal banking laws, including regulatory approval requirements, could make it more difficult for a third party to acquire the Company, even if doing so would be perceived to be beneficial to the Company's shareholders. These provisions effectively inhibit a non-negotiated merger or other business combination, which, in turn, could adversely affect the market price of the Company's common stock. With certain limited exceptions, federal regulations make it difficult for any one person or company or a group of persons from, directly or indirectly, acquiring more than 10% (5% if the acquirer is a bank holding company) of any class of our voting stock or obtaining the ability to control in any manner the election of a majority of our directors or otherwise direct the management or policies of our company without prior notice or application to and the approval of the appropriate federal regulator(s). Certain provisions of our corporate documents are also designed to make merger, tender offer or proxy contest more difficult, even if such events were perceived by many of our stockholders to be beneficial to their interests.
Our stock price can be volatile and its trading volume is generally less than other institutions.
Stock price volatility may make it more difficult for you to resell your common stock when you want and at prices you find attractive. Our stock price can fluctuate significantly in response to a variety of factors including the risk factors discussed elsewhere in this report that our outside of our control and which may occur regardless of our operating results. Also, although our common stock is currently listed for trading on the NASDAQ, the trading volume of our stock is less than that of other, larger financial services companies. Given the lower trading volume of our stock, significant sales of the stock, or the expectation of these sales, could cause the stock price to fall.
We may not continue to pay dividends on our stock.
Our shareholders are only entitled to receive Board declared dividends out of funds legally available for such payments. Although we have historically declared cash dividends, we are not required to do so and may reduce or eliminate future dividends. This could adversely affect the market price of our stock. Also, we are a bank holding company, and our ability to declare and pay dividends is dependent on certain federal regulatory considerations, including the guidelines of the FRB regarding capital adequacy and dividends. These guidelines relate to the ability of our wholly owned bank subsidiary to pay dividends or make other capital distributions to the Company. The ability of a subsidiary bank to pay dividends or make other capital distributions depends on its earnings and capital levels and may be limited by their regulator's directives or orders. In our case, our banking subsidiary generally must obtain regulatory approval of a dividend if the total dividends declared by the Bank during the current year, including any proposed dividend, exceeds its net income for the current year and retained net income for the prior two years. Our banking subsidiary's net income for the two years ended December 31, 2016 totaled $176.7 million and the amount paid to the Company during that two year period totaled $139.7 million, which included a payment to the Company in the amount of $115.2 million in January 2015 to cover the cash portion of the merger consideration paid to shareholders of LegacyTexas Group, Inc. See “How We Are Regulated - Limitations on Dividends and Other Capital Distributions” under Item 1 and Note 16 of the Notes to Consolidated Financial Statements contained in Item 8 of this report.
An investment in the Company's common stock is not an insured deposit.
The Company's common stock is not a bank deposit and, therefore, is not insured against loss by the FDIC, any other deposit insurance fund or by any other public or private entity. Investment in the Company's common stock is inherently risky for the reasons described in this “Risk Factors” section and elsewhere in this report and is subject to the same market forces that affect the price of common stock in any company. As a result, if you acquire the Company's common stock, you could lose some or all of your investment.
36
Item 1B. | Unresolved Staff Comments |
None.
Item 2. | Properties |
At December 31, 2016, our executive offices were located at 5851 Legacy Circle, Suite 1200, Plano, Texas. In addition to our executive offices, at December 31, 2016, we had three administrative offices, 45 full-service branches, one commercial loan production office located in Houston, Texas and a Warehouse Purchase Program office located in Littleton, Colorado. We lease the space in which our executive offices are located and own the majority of the space in which our other administrative offices are located. At December 31, 2016, we owned 25 of our branches, and leased the remaining facilities. The majority of our branches are located in the Dallas/ Fort Worth Metroplex in Texas, and include the cities of Addison, Allen, Carrollton, Coppell, Dallas, Plano, Euless, Flower Mound, Fort Worth, Frisco, Garland, Grand Prairie, Grapevine, McKinney, Richardson, Weatherford and Wylie. We also own two First National Bank of Jacksboro locations in Jack and Wise Counties in Texas. The net book value of our investment in premises, equipment and leaseholds, excluding computer equipment, was approximately $69.3 million at December 31, 2016. We believe that our current facilities are adequate to meet the present and immediately foreseeable needs of the Bank and the Company.
At December 31, 2016, we utilized IBM and Jack Henry Silverlake in-house data processing systems. The net book value of all of our data processing and computer equipment at December 31, 2016, was $4.9 million.
For more information about our premises and equipment, please see Note 8 of the Notes to Consolidated Financial Statements contained in Item 8 of this report.
Item 3. | Legal Proceedings |
We are involved from time to time as plaintiff or defendant in various legal actions arising in the normal course of our businesses. While the ultimate outcome of pending proceedings cannot be predicted with certainty, it is the opinion of management, after consultation with counsel representing us in such proceedings, that the resolution of these proceedings should not have a material adverse effect on our consolidated financial position or results of operations.
Item 4. | Mine Safety Disclosures. |
Not applicable.
PART II
Item 5. | Market for Registrant’s Common Equity, Related Shareholder Matters and Issuer Purchases of Equity Securities |
Our common stock is listed on the NASDAQ Global Select Market under the symbol “LTXB”. There were 1,699 holders of record of our common stock as of February 7, 2017.
37
The following table presents quarterly market high and low closing sales price information and cash dividends per share declared for our common stock for the two years ended December 31, 2016.
Market Price Range | Dividends | ||||||||||
High | Low | Declared | |||||||||
2016 | |||||||||||
Quarter ended March 31, 2016 | $ | 24.26 | $ | 17.01 | $ | 0.14 | |||||
Quarter ended June 30, 2016 | 28.27 | 17.94 | 0.14 | ||||||||
Quarter ended September 30, 2016 | 31.90 | 25.81 | 0.15 | ||||||||
Quarter ended December 31, 2016 | 43.81 | 31.59 | 0.15 | ||||||||
2015 | |||||||||||
Quarter ended March 31, 2015 | $ | 25.09 | $ | 19.82 | $ | 0.13 | |||||
Quarter ended June 30, 2015 | 30.86 | 22.67 | 0.13 | ||||||||
Quarter ended September 30, 2015 | 31.32 | 26.11 | 0.14 | ||||||||
Quarter ended December 31, 2015 | 31.97 | 24.59 | 0.14 | ||||||||
The timing and amount of cash dividends paid depends on our earnings, capital requirements, financial condition and other relevant factors. The primary source for dividends paid to shareholders are dividends or capital distributions paid to the Company from the Bank, our wholly owned subsidiary, as well as $125.0 million of fixed-to-floating rate subordinated notes issued by the Company. There are regulatory restrictions on the ability of the Bank to pay dividends. See “How We Are Regulated — Limitations on Dividends and Other Capital Distributions” under Item 1 of this report and Note 16 of Notes to Consolidated Financial Statements contained in Item 8 of this report.
Stock Repurchases
On August 22, 2012, the Company announced its intention to repurchase up to 5% of its total common shares outstanding, or approximately 1,978,871 shares. The stock repurchase program, which is open-ended, allows the Company to repurchase its shares from time to time in the open market and in negotiated transactions, depending upon market conditions. The Board of Directors of the Company also authorized management to enter into a trading plan with Sandler O'Neill & Partners, LP in accordance with Rule 10b5-1 of the Securities Exchange Act of 1934, as amended (the “Act”), to facilitate repurchases of its common stock pursuant to the above mentioned stock repurchase program (the “Rule 10b5-1 plan”). Stock repurchases under this program were suspended in November 2013 as a result of the Company's announced acquisition of LegacyTexas Group, Inc., which automatically triggered termination of the 10b5-1 plan. At the time the stock repurchase program was suspended, 83,800 shares were repurchased during 2013 at a weighted average price per share of $18.55.
Upon completion of the acquisition of LegacyTexas Group, Inc. on January 1, 2015, the Company entered into a new trading plan with Sandler O’Neill & Partners, LP in accordance with Rule 10b5-1 of the Act, to facilitate repurchases of its common stock pursuant to the above mentioned stock repurchase program. During the first quarter of 2015, 357,950 shares were repurchased and retired at an average price of $22.32.
On March 1, 2016, the Company announced the resumption of the above mentioned stock repurchase program and again entered into a new 10b5-1 plan with Sandler O’Neill & Partners, LP. No shares of Company stock were repurchased under this program in 2016, and 1,537,121 shares remain available for future repurchases under the program.
38
Equity Compensation Plans
Set forth below is information, at December 31, 2016, regarding the Company's equity compensation plans, both of which were approved by the Company's shareholders.
Number of Securities to be Issued upon Exercise of Outstanding Options | Weighted Average Exercise Price | Number of Securities Remaining Available for Issuance under Plans1 | |||||||
2007 Equity Incentive Plan | 1,021,877 | $ | 20.35 | 115,190 | |||||
2012 Equity Incentive Plan | 986,203 | 27.20 | 762,181 | ||||||
Total | 2,008,080 | $ | 23.71 | 877,371 | |||||
1 Includes 6,389 shares under the 2007 Equity Incentive Plan and 57,620 shares under the 2012 Equity Incentive Plan that may be awarded as restricted stock. | |||||||||
Shareholder Return Performance Graph Presentation
The line graph below compares the cumulative total shareholder return on the Company’s common stock to the cumulative total return of a broad index of the NASDAQ Stock Market and a regional banking index (Morningstar Banks - Regional - US) for the period December 31, 2011 through December 31, 2016.
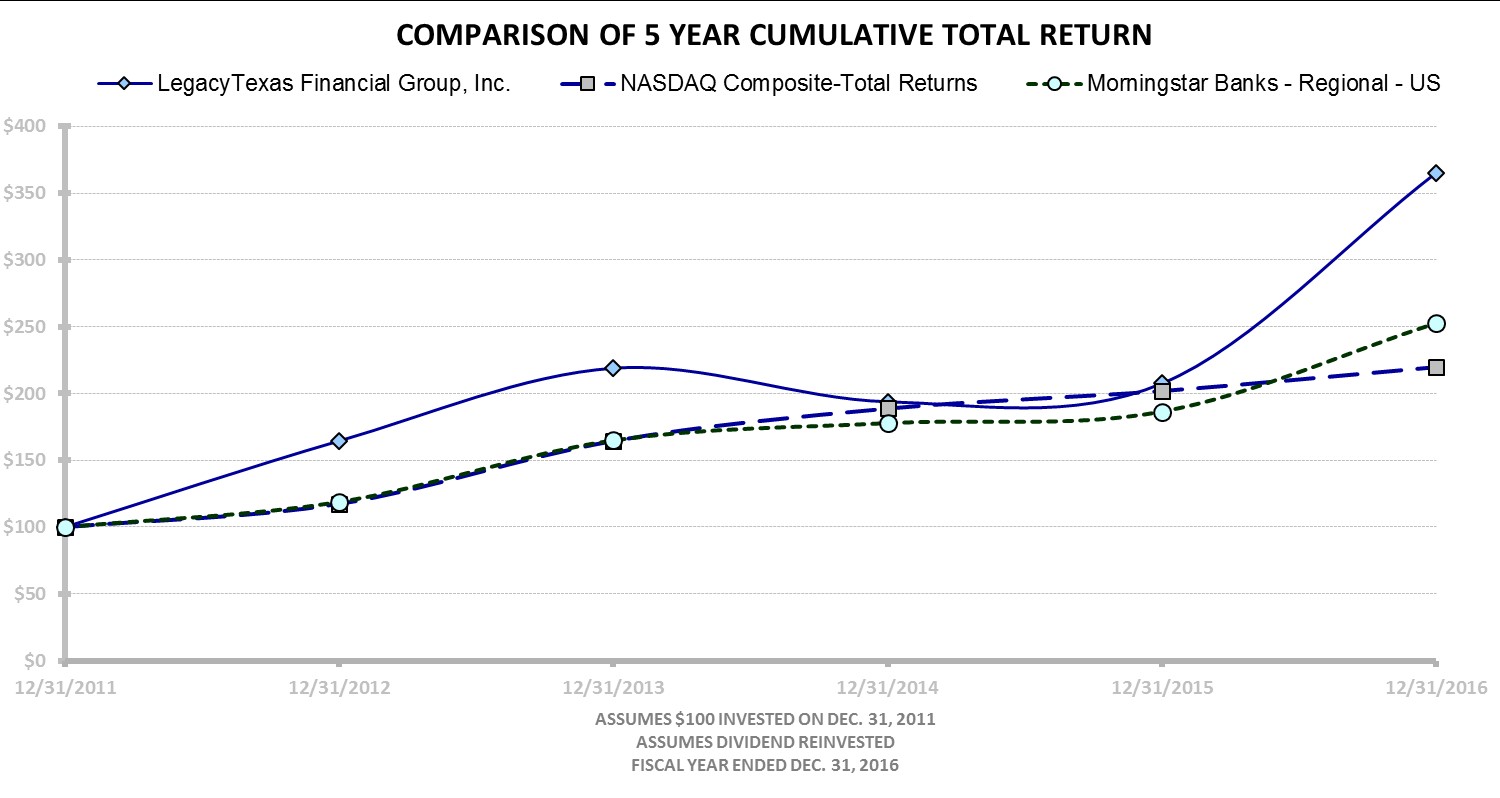
Historical stock price performance is not necessarily indicative of future stock price performance.
12/31/2011 | 12/31/2012 | 12/31/2013 | 12/31/2014 | 12/31/2015 | 12/31/2016 | ||||||||||||||||||
LegacyTexas Financial Group, Inc. | $ | 100.00 | $ | 164.49 | $ | 218.97 | $ | 193.85 | $ | 207.53 | $ | 365.33 | |||||||||||
NASDAQ Composite-Total Returns | 100.00 | 117.45 | 164.57 | 188.84 | 201.98 | 219.89 | |||||||||||||||||
Morningstar Banks - Regional - US | 100.00 | 118.79 | 164.82 | 177.71 | 186.29 | 252.37 | |||||||||||||||||
39
Item 6. | Selected Financial Data |
The summary information presented below under “Selected Financial Condition Data” and “Selected Operations Data” for each of the years ended December 31 is derived from our audited consolidated financial statements. The following information is only a summary and you should read it in conjunction with “Management’s Discussion and Analysis of Financial Condition and Results of Operations” contained in Item 7 of this report and “Financial Statements and Supplementary Data” contained in Item 8 of this report below.
At and For the Years Ended December 31, | |||||||||||||||||||
2016 | 2015 | 2014 | 2013 | 2012 | |||||||||||||||
(Dollars in thousands) | |||||||||||||||||||
Selected Financial Condition Data: | |||||||||||||||||||
Total assets | $ | 8,362,255 | $ | 7,691,940 | $ | 4,164,114 | $ | 3,525,232 | $ | 3,663,058 | |||||||||
Warehouse Purchase Program loans | 1,055,341 | 1,043,719 | 786,416 | 673,470 | 1,060,720 | ||||||||||||||
Loans receivable, excluding Warehouse Purchase Program loans, net | 5,998,596 | 5,017,554 | 2,605,204 | 2,029,277 | 1,673,204 | ||||||||||||||
Loans held for sale | 21,279 | 22,535 | — | — | — | ||||||||||||||
Securities available for sale, at fair value | 354,515 | 311,708 | 199,699 | 248,012 | 287,034 | ||||||||||||||
Securities held to maturity, at amortized cost | 210,387 | 240,433 | 241,920 | 294,583 | 360,554 | ||||||||||||||
FHLB stock and other restricted securities, at cost | 43,266 | 63,075 | 44,084 | 34,883 | 45,025 | ||||||||||||||
Bank-owned life insurance | 56,477 | 55,231 | 36,193 | 35,565 | 34,916 | ||||||||||||||
Deposits | 6,365,476 | 5,226,711 | 2,657,809 | 2,264,639 | 2,177,806 | ||||||||||||||
Borrowings | 1,054,405 | 1,608,165 | 887,907 | 664,096 | 917,208 | ||||||||||||||
Shareholders' equity | 885,365 | 804,076 | 568,223 | 544,460 | 520,871 | ||||||||||||||
Selected Operations Data: | |||||||||||||||||||
Total interest income | $ | 317,352 | $ | 262,692 | $ | 149,647 | $ | 137,089 | $ | 137,992 | |||||||||
Total interest expense | 35,083 | 21,615 | 16,640 | 18,869 | 22,169 | ||||||||||||||
Net interest income | 282,269 | 241,077 | 133,007 | 118,220 | 115,823 | ||||||||||||||
Provision for credit losses | 26,900 | 25,465 | 6,721 | 3,199 | 3,139 | ||||||||||||||
Net interest income after provision for credit losses | 255,369 | 215,612 | 126,286 | 115,021 | 112,684 | ||||||||||||||
Service charges and other fees | 36,690 | 30,936 | 19,382 | 18,715 | 20,091 | ||||||||||||||
Net gain on sale of mortgage loans | 8,225 | 8,036 | — | — | 5,436 | ||||||||||||||
Net gain (loss) on securities transactions | 56 | 203 | — | (177 | ) | 1,014 | |||||||||||||
Other non-interest income | 6,960 | 5,640 | 1,361 | 3,295 | 3,015 | ||||||||||||||
Total non-interest income | 51,931 | 44,815 | 20,743 | 21,833 | 29,556 | ||||||||||||||
Total non-interest expense | 156,377 | 151,555 | 98,092 | 88,877 | 87,690 | ||||||||||||||
Income before income tax expense | 150,923 | 108,872 | 48,937 | 47,977 | 54,550 | ||||||||||||||
Income tax expense | 53,102 | 37,956 | 17,659 | 16,289 | 19,309 | ||||||||||||||
Net income | $ | 97,821 | $ | 70,916 | $ | 31,278 | $ | 31,688 | $ | 35,241 | |||||||||
40
At and For the Years Ended December 31, | ||||||||||||||
2016 | 2015 | 2014 | 2013 | 2012 | ||||||||||
Selected Financial Ratios and Other Data (Unaudited): | ||||||||||||||
Performance Ratios: | ||||||||||||||
Return on assets (ratio of net income to average total assets) | 1.24 | % | 1.10 | % | 0.85 | % | 0.94 | % | 1.04 | % | ||||
Return on equity (ratio of net income to average equity) | 11.52 | 9.12 | 5.60 | 5.92 | 7.23 | |||||||||
Interest rate spread: | ||||||||||||||
Average during period | 3.65 | 3.88 | 3.63 | 3.51 | 3.43 | |||||||||
End of period | 3.43 | 3.24 | 3.21 | 3.36 | 3.18 | |||||||||
Net interest margin | 3.79 | 4.00 | 3.78 | 3.71 | 3.61 | |||||||||
Non-interest income to operating revenue | 14.06 | 14.57 | 12.17 | 13.74 | 17.64 | |||||||||
Operating expense to average total assets | 1.98 | 2.35 | 2.65 | 2.64 | 2.59 | |||||||||
Average interest-earning assets to average interest-bearing liabilities | 130.42 | 133.36 | 133.50 | 133.61 | 126.13 | |||||||||
Dividend payout ratio 1 | 28.29 | 36.31 | 61.34 | 40.33 | 43.84 | |||||||||
Asset Quality Ratios: | ||||||||||||||
Non-performing assets to total assets at end of period | 1.46 | 0.58 | 0.58 | 0.64 | 0.79 | |||||||||
Non-performing loans to total loans held for investment, excluding Warehouse Purchase Program loans | 1.84 | 0.75 | 0.89 | 1.08 | 1.61 | |||||||||
Non-performing loans to total loans held for investment | 1.56 | 0.63 | 0.69 | 0.81 | 0.99 | |||||||||
Allowance for loan losses to non-performing loans | 57.97 | 123.23 | 108.69 | 87.50 | 66.36 | |||||||||
Allowance for loan losses to total loans held for investment, excluding Warehouse Purchase Program loans | 1.06 | 0.93 | 0.97 | 0.94 | 1.07 | |||||||||
Allowance for loan losses to total loans held for investment | 0.91 | 0.77 | 0.75 | 0.71 | 0.66 | |||||||||
Capital Ratios: | ||||||||||||||
Equity to total assets at end of period | 10.59 | 10.45 | 13.65 | 15.44 | 14.22 | |||||||||
Average equity to average assets | 10.77 | 12.07 | 15.10 | 15.88 | 14.40 | |||||||||
Other Data: | ||||||||||||||
Number of branches | 45 | 47 | 31 | 31 | 31 | |||||||||
Number of loan production offices | 1 | 1 | 1 | 1 | 1 | |||||||||
1 In 2012, the Company prepaid the quarterly dividend for the first quarter of 2013 in December 2012, distributing an additional $0.10 per common share. Had the dividend been paid in 2013, the dividend payout ratios for the years ended December 31, 2013 and 2012 would have been 52.83% and 32.60%, respectively.
41
Item 7. | Management’s Discussion and Analysis of Financial Condition and Results of Operations |
Special Note Regarding Forward-Looking Statements
This document and other filings by the Company with the Securities and Exchange Commission (the “SEC”), as well as press releases or other public or stockholder communications released by the Company, may contain forward-looking statements, including, but not limited to, (i) statements regarding our financial condition, results of operations and business, (ii) statements about our plans, objectives, expectations and intentions and other statements that are not historical facts and (iii) other statements identified by the words or phrases "will likely result," "are expected to," "will continue," "is anticipated," "estimate," "project," "intends" or similar expressions that are intended to identify "forward-looking statements", within the meaning of the Private Securities Litigation Reform Act of 1995. These forward-looking statements are based on current beliefs and expectations of the Company’s management and are inherently subject to significant business, economic and competitive uncertainties and contingencies, many of which are beyond the Company’s control. In addition, these forward-looking statements are subject to assumptions with respect to future business strategies and decisions that are subject to change.
The following factors, among others, could cause actual results to differ materially from the anticipated results or other expectations expressed in the forward-looking statements: the expected cost savings, synergies and other financial benefits from acquisition or disposition transactions might not be realized within the expected time frames or at all and costs or difficulties relating to integration matters might be greater than expected; changes in economic conditions; fluctuations in interest rates; the risks of lending and investing activities, including changes in the level and direction of loan delinquencies and write-offs and changes in estimates of the adequacy of the allowance for loan losses; our ability to access cost-effective funding; fluctuations in real estate values and both residential and commercial real estate market conditions; demand for loans and deposits in our market area; fluctuations in the price of oil, natural gas and other commodities; competition; changes in management's business strategies; our ability to successfully integrate any assets, liabilities, customers, systems and management personnel we have acquired or may acquire into our operations and our ability to realize related revenue synergies and cost savings within expected time frames and any goodwill charges related thereto; results of examinations of us by the FRB and our bank subsidiary by the TDOB or other regulatory authorities, including the possibility that any such regulatory authority may, among other things, require us to increase our reserve for loan losses, write-down assets, change our regulatory capital position or affect our ability to borrow funds or maintain or increase deposits, which could adversely affect our liquidity and earnings; legislative or regulatory changes that adversely affect our business including the revenue impact from, and any mitigation actions taken in response, to the Dodd-Frank Wall Street Reform and Consumer Protection Act (the “Dodd-Frank Act”); changes in regulatory policies and principles, or the interpretation of regulatory capital or other rules; changes in accounting policies and practices, as may be adopted by the financial institution regulatory agencies, the Public Company Accounting Oversight Board or the Financial Accounting Standards Board; and other economic, competitive, governmental, regulatory, and technological factors affecting our operations, pricing, products and services; and the other risks set forth under Risk Factors under Item 1A. of this Form 10-K.
The factors listed above could materially affect our financial performance and could cause our actual results for future periods to differ materially from any opinions or statements expressed with respect to future periods in any current statements.
We do not undertake - and specifically decline any obligation - to publicly release the result of any revisions which may be made to any forward-looking statements to reflect events or circumstances after the date of such statements or to reflect the occurrence of anticipated or unanticipated events. When considering forward-looking statements, you should keep in mind these risks and uncertainties. You should not place undue reliance on any forward-looking statement, which speaks only as of the date made. You should refer to our periodic and current reports filed with the SEC for specific risks that could cause actual results to be significantly different from those expressed or implied by any forward-looking statements.
General
Our principal business consists of attracting retail deposits from the general public and the business community and investing those funds, along with borrowed funds, in commercial real estate loans, secured and unsecured commercial and industrial loans, as well as permanent loans secured by first and second mortgages on one-to-four family residences and consumer loans. Additionally, the Warehouse Purchase Program allows mortgage banking company customers to close one-to- four family real estate loans in their own name and manage its cash flow needs until the loans are sold to investors. We also offer title services and brokerage services for the purchase and sale of non-deposit investment and insurance products through a third party brokerage arrangement. Our operating revenues are derived principally from interest earned on interest-earning assets, including loans and investment securities and service charges and fees on deposits and other account services. Our primary sources of funds are deposits, FHLB advances and other borrowings, and payments received on loans and securities. We offer a variety of deposit accounts that provide a wide range of interest rates and terms, generally including savings, money
42
market, certificate of deposit and demand accounts. Our principal objective is to be an independent, commercially-oriented, customer-focused financial services company, providing outstanding service and innovative products in our primary market area of North Texas.
Critical Accounting Estimates
Certain of our accounting estimates are important to the portrayal of our financial condition, since they require management to make difficult, complex or subjective judgments, some of which may relate to matters that are inherently uncertain. Estimates are susceptible to material changes as a result of changes in facts and circumstances. Facts and circumstances which could affect these judgments include, but are not limited to, changes in interest rates, changes in the performance of the economy and changes in the financial condition of borrowers. Management believes that determining the allowance for loan losses is its most critical accounting estimate. Our accounting policies are discussed in detail in Note 1 of the Notes to Consolidated Financial Statements contained in Item 8 of this report.
Allowance for Loan Loss. The allowance for loan losses and related provision expense are susceptible to change if the credit quality of our loan portfolio changes, which is evidenced by many factors, including but not limited to charge-offs and non-performing loan trends. Generally, consumer real estate lending has a lower risk profile compared to other consumer lending (such as automobile loans). Commercial real estate and commercial and industrial lending, however, can have higher risk profiles than consumer loans due to these loans being larger in amount and more susceptible to fluctuations in industry, market and economic conditions. Additionally, the Company has increased qualitative reserve factors on energy loans due to the impact of continued pressure on the price of oil and gas, which has led to a sustained increase in economic and regulatory uncertainty surrounding energy loans. While management uses available information to recognize losses on loans, changes in economic conditions, the mix and size of the loan portfolio and individual borrower conditions can dramatically impact our level of allowance for loan losses in relatively short periods of time. Management believes that the allowance for loan losses is maintained at a level that represents coverage of our best estimate of credit losses in the loan portfolio as of December 31, 2016.
Management evaluates current information and events regarding a borrower's ability to repay its obligations and considers a loan to be impaired when the ultimate collectability of amounts due, according to the contractual terms of the loan agreement, is in doubt. If an impaired loan is collateral-dependent, the fair value of the collateral, less the estimated cost to sell, is used to determine the amount of impairment. If an impaired loan is not collateral-dependent, the impairment amount is determined using the negative difference, if any, between the estimated discounted cash flows and the loan amount due. For impaired loans, the amount of the impairment can be adjusted, based on current data, until such time as the actual basis is established by acquisition of the collateral or until the basis is collected. Impairment losses are reflected in the allowance for loan losses through a charge to the provision for credit losses. Subsequent recoveries are credited to the allowance for loan losses. Cash receipts for accruing loans are applied to principal and interest under the contractual terms of the loan agreement. Cash receipts on impaired loans for which the accrual of interest has been discontinued are applied first to principal.
Business Strategy
Our principal objective is to be an independent, commercially-oriented, customer-focused financial services company, providing outstanding service and innovative products in our primary market area of North Texas. Our Board of Directors adopted a strategy designed to maintain growth and profitability, a strong capital position and sound asset quality. Please see "Business Strategies" contained in Item 1 of this report for more information.
Comparison of Financial Condition at December 31, 2016 and December 31, 2015
General. Total assets increased by $670.3 million, or 8.7%, to $8.36 billion at December 31, 2016, from $7.69 billion at December 31, 2015, primarily due to a $1.01 billion increase in gross loans held for investment, including Warehouse Purchase Program loans. The increase in total assets due to loan portfolio growth was partially offset by a $326.4 million decline in cash and cash equivalents, which was primarily due to two large deposits totaling $196.4 million that were made on the last day of 2015, with $131.9 million of these deposits withdrawn during the 2016 period.
Loans. Gross loans held for investment, including Warehouse Purchase Program loans, increased by $1.01 billion, or 16.5%, to $7.12 billion at December 31, 2016, from $6.11 billion at December 31, 2015, while one-to-four family mortgage loans held for sale decreased $1.3 million, or 5.6%, to $21.3 million at December 31, 2016, from $22.5 million at December 31, 2015.
43
December 31, 2016 | December 31, 2015 | Dollar Change | Percent Change | |||||||||||
(Dollars in thousands) | ||||||||||||||
Commercial real estate | $ | 2,670,455 | $ | 2,177,543 | $ | 492,912 | 22.6 | % | ||||||
Commercial and industrial | 1,971,160 | 1,612,669 | 358,491 | 22.2 | ||||||||||
Construction and land | 294,894 | 269,708 | 25,186 | 9.3 | ||||||||||
Consumer real estate | 1,074,923 | 936,757 | 138,166 | 14.7 | ||||||||||
Other consumer | 53,991 | 69,830 | (15,839 | ) | (22.7 | ) | ||||||||
Gross loans held for investment, excluding Warehouse Purchase Program loans | 6,065,423 | 5,066,507 | 998,916 | 19.7 | ||||||||||
Warehouse Purchase Program loans | 1,055,341 | 1,043,719 | 11,622 | 1.1 | ||||||||||
Gross loans held for investment | 7,120,764 | 6,110,226 | 1,010,538 | 16.5 | ||||||||||
Loans held for sale | 21,279 | 22,535 | (1,256 | ) | (5.6 | ) | ||||||||
Gross loans | $ | 7,142,043 | $ | 6,132,761 | $ | 1,009,282 | 16.5 | % | ||||||
Gross loans held for investment at December 31, 2016, excluding Warehouse Purchase Program loans, grew $998.9 million, or 19.7%, from December 31, 2015, which included growth in all loan portfolios with the exception of a $15.8 million decline in other consumer loans. Commercial real estate and commercial and industrial loans at December 31, 2016 increased by $492.9 million and $358.5 million, respectively, from December 31, 2015. Consumer real estate and construction and land loans at December 31, 2016 increased by $138.2 million and $25.2 million, respectively, from December 31, 2015.
Reserve-based energy loans, which are reported as commercial and industrial loans, totaled $527.2 million at December 31, 2016, up $67.4 million from $459.8 million at December 31, 2015. Substantially all of the reserve-based energy loans are secured by deeds of trust on properties containing proven oil and natural gas reserves. Due to the sensitivity of the energy portfolio to downward movements in oil prices, the Bank has seen migration in the portfolio into criticized classifications during the past year. See "Allowance for Loan Losses" for more information.
At December 31, 2016, our reserve-based energy portfolio (reported above at $527.2 million) was secured by collateral that consisted of 50% natural gas reserves and 50% crude oil reserves. We encourage, and in some cases even require, borrowers to utilize commodity hedges, in order to stabilize cash flows during volatile commodity price environments. Hedges are used to guard against falling prices, and the goal is that the duration of the hedge will last long enough for prices to come back from any significant decline. Hedges will typically include minimum and maximum allowed percentage of production, a minimum and maximum allowed term, and a minimum price.
In addition to the reserve-based energy loans, the Bank has loans categorized as "Midstream and Other," which are typically related to the transmission of oil and natural gas and would only be indirectly impacted from declining commodity prices. At December 31, 2016, "Midstream and Other" loans had a total outstanding balance of $39.0 million, down $25.6 million from $64.6 million at December 31, 2015. Also, at December 31, 2016, we had four relationships in the commercial and industrial loan portfolio (aside from the reserve-based and midstream loans discussed above) that are involved in the energy exploration sector providing front-end service to companies who drill oil and gas wells and whose business could be impacted by the dramatic reduction in drilling activity as a result of the severe drop in the price of oil and gas. These relationships totaled $2.4 million at December 31, 2016.
Warehouse Purchase Program loans increased by $11.6 million, or 1.1%, to $1.06 billion at December 31, 2016 from $1.04 billion at December 31, 2015. Although not bound by any legally binding commitment, when a purchase decision is made, the Bank purchases a 100% participation interest in the loans originated by our mortgage banking company customers. The mortgage banking company closes mortgage loans consistent with underwriting standards established by approved investors and, once all pertinent documents are received, the participation interest is delivered by the Bank to the investor selected by the originator and approved by us. Loans funded by the Warehouse Purchase Program during the fourth quarter of 2016 consisted of 49% conforming, 41% government loans and 10% of other loan types, including Jumbo loans.
Allowance for Loan Losses. The allowance for loan losses is maintained to cover losses that are estimated in accordance with US GAAP. It is our estimate of credit losses in our loan portfolio at each balance sheet date. Our methodology for analyzing the allowance for loan losses consists of general and specific components. For more information about the calculation of our allowance for loan losses, please see "Business-Allowance for Loan Losses" contained in Item I and Notes 1 and 5 of the Notes to Consolidated Financial Statements contained in Item 8 of this report.
44
Our non-performing loans, which consist of nonaccrual loans, include both smaller balance homogeneous loans that are collectively evaluated for impairment and larger individually classified impaired loans. Loans are placed on nonaccrual status when the collection of principal and/or interest becomes doubtful or other factors involving the loan warrant placing the loan on nonaccrual status.
At December 31, 2016, we had $12.2 million of loans classified as TDRs, of which $454,000 were accruing interest and $11.7 million were classified as nonaccrual. For more information about the Company's TDRs, please see "Business -Non-performing Assets" contained in Item I and Notes 1 and 5 of the Notes to Consolidated Financial Statements contained in Item 8 of this report.
Non-performing loans to total loans held for investment, excluding Warehouse Purchase Program loans, was 1.84% at December 31, 2016 compared to 0.75% at December 31, 2015. Including Warehouse Purchase Program loans, non-performing loans to total loans held for investment was 1.56% at December 31, 2016 compared to 0.63% at December 31, 2015. Non-performing loans increased by $73.2 million to $111.4 million at December 31, 2016 from $38.2 million at December 31, 2015. This increase was primarily driven by a $55.5 million increase in non-performing energy loans, with downgrades resulting from collateral value declines and deteriorating financial conditions. We set aside $2.6 million at December 31, 2016 on these non-performing energy loans based on recent collateral valuations.
The below table shows criticized energy loans, based on our internal ratings, at December 31, 2016, September 30, 2016 and December 31, 2015.
December 31, 2016 | September 30, 2016 | Linked-Quarter Change | December 31, 2015 | Year-over-Year Change | |||||||||||||||
(Dollars in thousands) | |||||||||||||||||||
Special Mention (all performing) | $ | 141,794 | $ | 125,807 | $ | 15,987 | $ | 68,348 | $ | 73,446 | |||||||||
Substandard (performing) | — | 76,786 | (76,786 | ) | 38,712 | (38,712 | ) | ||||||||||||
Substandard (non-performing) | 67,576 | 22,033 | 45,543 | 12,110 | 55,466 | ||||||||||||||
$ | 209,370 | $ | 224,626 | $ | (15,256 | ) | $ | 119,170 | $ | 90,200 | |||||||||
Excluding the increase in non-performing energy loans from December 31, 2015, commercial and industrial non-performing loans included a $12.1 million relationship with a borrower who owns and operates hospitals in Texas that was placed on non-accrual status in the fourth quarter of 2016. Additionally, non-performing loans at December 31, 2016 included an $11.4 million increase in construction and land non-performing loans due to one relationship with a residential home builder. Both relationships were placed on non-accrual due to diminished operating performance, and no specific reserve was set aside on either of these relationships at December 31, 2016. These increases in non-performing loans were partially offset by a $6.2 million decrease in commercial real estate non-performing loans due to a non-performing commercial real estate property secured by a medical facility that was transferred into foreclosed assets in the 2016 period.
Our allowance for loan losses was $64.6 million at December 31, 2016 compared to $47.1 million at December 31, 2015, or 0.91% of total loans held for investment (including Warehouse Purchase Program loans) at December 31, 2016 compared to 0.77% at December 31, 2015. Our allowance for loan losses to non-performing loans was 57.97% at December 31, 2016 compared to 123.23% at December 31, 2015. The increase in the allowance for loan losses from December 31, 2015 was primarily related to energy loans, as well as increased loan production in the 2016 period. In the fourth quarter of 2015, we increased qualitative reserve factors applied to the energy loan portfolio due to the impact of pressure on the price of oil, and have continued to apply elevated reserve amounts to the energy portfolio through 2016 due to sustained economic and regulatory uncertainty surrounding energy loans. The allowance for loan losses allocated to energy loans at December 31, 2016 totaled $19.2 million, up $7.2 million from $12.0 million at December 31, 2015. In addition to the $2.6 million in specific reserves on non-performing energy relationships, these reserve amounts continue to reflect elevated qualitative factors compared to 2015. Since the inception of our Energy Finance Group, we have maintained a number of risk mitigation techniques, including sound underwriting (reasonable advance rates based on number and diversification of wells), sound policy (requiring hedges on production sales) and conservative collateral valuations (frequent borrowing base determinations at prices below NYMEX posted rates). All borrowing base valuations are performed by experienced and nationally recognized third party firms intimately familiar with the properties and their production history. We believe that the level of loan loss reserves for energy loans as of December 31, 2016 is sufficient to cover estimated credit losses in the portfolio based on currently available information; however, future sustained declines in oil pricing could lead to further risk rating downgrades, additional loan loss reserves or losses.
45
Due to the expansion of our lending business, as well as recent increased diversification of the types of off-balance sheet commitments offered by us, management established an allowance for credit losses on off-balance sheet lending-related commitments during the 2016 period. $1.5 million of the provision for credit loss for the year ended December 31, 2016 funded this allowance. This allowance for off-balance sheet credit loss is included in "other liabilities" on the consolidated balance sheets.
Securities. Our securities portfolio increased by $12.8 million, or 2.3%, to $564.9 million at December 31, 2016, from $552.1 million at December 31, 2015. During the year ended December 31, 2016, paydowns, calls and maturities of securities totaling $2.32 billion were primarily offset by purchases totaling $2.35 billion. The majority of these purchases were completed for tax strategy purposes. $7.7 million in securities were sold during the year ended December 31, 2016, for a net gain of $56,000.
Deposits. Total deposits increased by $1.14 billion, or 21.8%, to $6.37 billion at December 31, 2016, from $5.23 billion at December 31, 2015.
December 31, 2016 | December 31, 2015 | Dollar Change | Percent Change | |||||||||||
(Dollars in thousands) | ||||||||||||||
Non-interest-bearing demand | $ | 1,383,951 | $ | 1,170,272 | $ | 213,679 | 18.3 | % | ||||||
Interest-bearing demand | 903,314 | 819,350 | 83,964 | 10.2 | ||||||||||
Savings and money market | 2,710,307 | 2,209,698 | 500,609 | 22.7 | ||||||||||
Time | 1,367,904 | 1,027,391 | 340,513 | 33.1 | ||||||||||
Total deposits | $ | 6,365,476 | $ | 5,226,711 | $ | 1,138,765 | 21.8 | % | ||||||
Savings and money market and time deposits at December 31, 2016 increased by $500.6 million and $340.5 million, respectively, from December 31, 2015. Non-interest-bearing demand deposits increased by $213.7 million from December 31, 2015, while interest-bearing demand deposits increased by $84.0 million for the same period.
Borrowings. FHLB advances decreased $606.2 million, or 42.1%, to $833.7 million at December 31, 2016 from $1.44 billion at December 31, 2015. The outstanding balance of FHLB advances decreased primarily due to paydowns during 2016 on excess FHLB advances. At December 31, 2016, the Company was eligible to borrow an additional $1.82 billion from the FHLB.
The below table shows FHLB advances by maturity and weighted average rate at December 31, 2016:
Balance | Weighted Average Rate | |||||
(Dollars in thousands) | ||||||
Less than 90 days | $ | 3,495 | 4.53 | % | ||
90 days to less than one year | 612,051 | 0.65 | ||||
One to three years | 215,068 | 0.76 | ||||
After three to five years | 1,787 | 5.50 | ||||
After five years | 1,308 | 5.49 | ||||
833,709 | 0.71 | % | ||||
Restructuring prepayment penalty | (27 | ) | ||||
Total | $ | 833,682 | ||||
Additionally, we have eight available federal funds lines of credit with other financial institutions totaling $255.0 million and was eligible to borrow $46.7 million from the FRB discount window. In addition to FHLB advances, at December 31, 2016, we had a $25.0 million outstanding structured repurchase agreement with Credit Suisse, as well as $61.7 million in overnight repurchase agreements with depositors. Also, at December 31, 2016, subordinated debt totaled $134.0 million, which included $122.3 million of fixed-to-floating rate subordinated notes, as well as $11.7 million of trust preferred securities that were acquired through the merger with LegacyTexas Group, Inc. (reported net of purchase accounting fair value adjustments and debt issuance costs). Please see Note 11 of the Notes to Consolidated Financial Statements contained in Item 8 of this report for more information about borrowed funds.
46
Shareholders’ Equity. Total shareholders' equity increased by $81.3 million, or 10.1%, to $885.4 million at December 31, 2016, from $804.1 million at December 31, 2015.
December 31, 2016 | December 31, 2015 | Dollar Change | Percent Change | |||||||||||
(Dollars in thousands) | ||||||||||||||
Common stock | $ | 479 | $ | 476 | $ | 3 | 0.6 | % | ||||||
Additional paid-in capital | 589,408 | 576,753 | 12,655 | 2.2 | ||||||||||
Retained earnings | 310,641 | 240,496 | 70,145 | 29.2 | ||||||||||
Accumulated other comprehensive income (loss), net | (2,713 | ) | (133 | ) | (2,580 | ) | N/M 1 | |||||||
Unearned ESOP shares | (12,450 | ) | (13,516 | ) | 1,066 | (7.9 | ) | |||||||
Total shareholders’ equity | $ | 885,365 | $ | 804,076 | $ | 81,289 | 10.1 | % | ||||||
1 N/M - not meaningful
The increase in shareholders' equity at December 31, 2016, compared to December 31, 2015, was primarily due to net income of $97.8 million recognized during the year ended December 31, 2016, which was partially offset by the payment of quarterly dividends totaling $0.58 per common share, or $27.7 million, during the year ended December 31, 2016.
47
Comparison of Results of Operation for the Years Ended December 31, 2016, 2015, and 2014
General. Net income for the year ended December 31, 2016 was $97.8 million, an increase of $26.9 million, or 37.9%, from net income of $70.9 million for the year ended December 31, 2015. The increase in net income was driven by a $41.2 million increase in net interest income and an increase in non-interest income of $7.1 million, which was partially offset by a $1.4 million increase in the provision for credit losses and a $4.8 million increase in non-interest expense. Basic earnings per share for the year ended December 31, 2016 was $2.11, an increase of $0.57 from $1.54 for the year ended December 31, 2015. Diluted earnings per share for the year ended December 31, 2016 was $2.09, an increase of $0.56 from $1.53 for the year ended December 31, 2015.
Net income for the year ended December 31, 2015 increased by $39.6 million, or 126.7%, from net income of $31.3 million for the year ended December 31, 2014. The increase in net income for the year ended December 31, 2015 compared to the 2014 period was driven by a $108.1 million increase in net interest income and a $24.1 million increase in non-interest income, which was partially offset by a $53.5 million increase in non-interest expense and an $18.7 million increase in the provision for credit losses. Basic and diluted earnings per share for the year ended December 31, 2014 were $0.82 and $0.81 respectively.
Interest Income. Interest income increased by $54.7 million, or 20.8%, to $317.4 million for the year ended December 31, 2016, from $262.7 million for the year ended December 31, 2015. For the year ended December 31, 2015, interest income increased by $113.0 million, or 75.5%, from $149.6 million for the year ended December 31, 2014.
Years Ended December 31, | Change | |||||||||||||||||||||||||
2016 | 2015 | 2014 | 2016 versus 2015 | 2015 versus 2014 | ||||||||||||||||||||||
(Dollars in thousands) | Dollar | Percent | Dollar | Percent | ||||||||||||||||||||||
Interest and dividend income | ||||||||||||||||||||||||||
Loans, including fees | $ | 301,542 | $ | 248,665 | $ | 137,255 | $ | 52,877 | 21.3 | % | $ | 111,410 | 81.2 | % | ||||||||||||
Securities | 12,306 | 12,302 | 11,600 | 4 | — | 702 | 6.1 | |||||||||||||||||||
Interest-bearing deposits in other financial institutions | 1,878 | 631 | 249 | 1,247 | 197.6 | 382 | 153.4 | |||||||||||||||||||
FHLB and FRB stock and other | 1,626 | 1,094 | 543 | 532 | 48.6 | 551 | 101.5 | |||||||||||||||||||
$ | 317,352 | $ | 262,692 | $ | 149,647 | $ | 54,660 | 20.8 | % | $ | 113,045 | 75.5 | % | |||||||||||||
The increase in interest income for the year ended December 31, 2016 compared to the 2015 period was primarily due to a $52.9 million, or 21.3%, increase in interest income on loans, which was driven by increased volume in all loan categories with the exception of other consumer loans. The average balance of commercial real estate loans increased by $508.6 million to $2.45 billion from the year ended December 31, 2015, resulting in a $23.4 million increase in interest income, while the average balance of commercial and industrial loans increased by $406.1 million to $1.71 billion from the year ended December 31, 2015, resulting in a $16.4 million increase in interest income. The average balance of consumer real estate loans increased by $179.3 million to $1.02 billion from the year ended December 31, 2015, resulting in a $6.9 million increase in interest income, while the average balance of construction and land loans increased by $43.2 million to $282.1 million from the year ended December 31, 2015, resulting in a $1.2 million increase in interest income. The average balance of Warehouse Purchase Program loans increased by $196.6 million to $1.00 billion from the year ended December 31, 2015, which resulted in a $6.1 million increase in interest income. Interest income on loans for the year ended December 31, 2016 included $4.6 million in accretion of purchase accounting fair value adjustments on acquired loans. The average yield earned on all loan portfolios for the year ended December 31, 2016 declined compared to 2015, with the exception of other consumer loans, which increased by 15 basis points. The average yield earned on loans for the year ended December 31, 2016 was 4.65%, down 14 basis points from 4.79% for the year ended December 31, 2015.
The increase in interest income for the year ended December 31, 2015 compared to the 2014 period, was primarily due to a $111.4 million, or 81.2%, increase in interest income on loans, which was driven by increased volume in all loan categories resulting from the merger with LegacyTexas Group, Inc. on January 1, 2015, as well as organic growth since December 31, 2014. The average balance of commercial real estate loans increased by $778.3 million to $1.94 billion from the year ended December 31, 2014, resulting in a $38.4 million increase in interest income. The $778.3 million in growth included $551.0 million in commercial real estate loans acquired through the merger with LegacyTexas Group, Inc. The average balance of commercial and industrial loans increased by $694.1 million to $1.31 billion from the year ended December 31, 2014, resulting in a $34.6 million increase in interest income, which included a $923,000 interest recovery recognized on the resolution of an
48
impaired loan. The $694.1 million in growth included $337.1 million in commercial and industrial loans acquired through the merger with LegacyTexas Group, Inc. The average balance of consumer real estate loans increased by $349.6 million to $836.0 million from the year ended December 31, 2014, resulting in a $16.8 million increase in interest income. The $349.6 million in growth included $264.0 million in consumer real estate loans acquired through the merger with LegacyTexas Group, Inc. The average balance of construction and land loans increased by $217.4 million to $238.9 million from the year ended December 31, 2014, resulting in a $12.4 million increase in interest income. The $217.4 million in growth included $198.3 million in construction and land loans acquired through the merger with LegacyTexas Group, Inc. The average balance of Warehouse Purchase Program loans increased by $236.6 million to $808.2 million from the year ended December 31, 2014, which resulted in a $6.7 million increase in interest income. Interest income on loans for the year ended December 31, 2015 included $10.2 million in accretion of purchase accounting fair value adjustments on acquired loans. The average yield earned on all loan portfolios for the year ended December 31, 2015 declined compared to 2014, with the exception of commercial and industrial loans, which increased by 39 basis points. The average yield earned on loans for the year ended December 31, 2015 was 4.79%, up two basis points from 4.77% for the year ended December 31, 2014.
Interest Expense. Interest expense increased by $13.5 million, or 62.3%, to $35.1 million for the year ended December 31, 2016, from $21.6 million for the year ended December 31, 2015. For the year ended December 31, 2015, interest expense increased by $5.0 million, or 29.9%, from $16.6 million for the year ended December 31, 2014.
Years Ended December 31, | Change | |||||||||||||||||||||||||
2016 | 2015 | 2014 | 2016 versus 2015 | 2015 versus 2014 | ||||||||||||||||||||||
(Dollars in thousands) | Dollar | Percent | Dollar | Percent | ||||||||||||||||||||||
Interest expense | ||||||||||||||||||||||||||
Deposits | $ | 21,034 | $ | 13,127 | $ | 8,212 | $ | 7,907 | 60.2 | % | $ | 4,915 | 59.9 | % | ||||||||||||
FHLB advances | 7,167 | 6,552 | 7,610 | 615 | 9.4 | (1,058 | ) | (13.9 | ) | |||||||||||||||||
Repurchase agreement and other borrowings | 6,882 | 1,936 | 818 | 4,946 | 255.5 | 1,118 | 136.7 | |||||||||||||||||||
$ | 35,083 | $ | 21,615 | $ | 16,640 | $ | 13,468 | 62.3 | % | $ | 4,975 | 29.9 | % | |||||||||||||
The increase in interest expense for the year ended December 31, 2016 compared to the 2015 period was primarily due to increased volume in all deposit categories, as well as higher average rates paid in the 2016 period on all interest-bearing liabilities. A 12 basis point increase in the average rate and a $474.6 million increase in the average balance to $2.37 billion led to a $3.6 million increase in interest expense on savings and money market accounts for the year ended December 31, 2016 compared to the 2015 period. The average balance of time deposits increased by $368.5 million to $1.25 billion for the year ended December 31, 2016, while the average rate paid on time deposits increased by eight basis points, resulting in a $3.6 million increase in interest expense compared to the year ended December 31, 2015. The average balance of interest-bearing demand deposits increased by $82.8 million to $805.1 million for the year ended December 31, 2016, while the average rate paid on interest-bearing demand deposits increased by three basis points, resulting in a $677,000 increase in interest expense compared to the year ended December 31, 2015. A 25 basis point increase in the average rate and a $273.1 million increase in the average balance to $1.29 billion led to a $5.6 million increase in interest expense on borrowings for the year ended December 31, 2016 compared to the 2015 period.
The increase in interest expense for the year ended December 31, 2015 compared to the 2014 period was primarily due to increased volume in all deposit categories resulting from deposits acquired through the merger with LegacyTexas Group, Inc. on January 1, 2015, as well as organic growth since December 31, 2014. An $858.0 million increase in the average balance of savings and money market deposits to $1.90 billion from the year ended December 31, 2014 was partially offset by an 11 basis point reduction in the average rate, resulting in a $500,000 increase in interest expense. The $858.0 million in growth included $534.6 million in savings and money market deposits acquired through the merger with LegacyTexas Group, Inc. The average balance of time deposits increased by $381.4 million to $882.2 million from the year ended December 31, 2014, resulting in a $2.8 million increase in interest expense. The $381.4 million in growth included $336.8 million in time deposits acquired through the merger with LegacyTexas Group, Inc. The average balance of interest-bearing demand deposits increased by $261.1 million to $722.2 million from the year ended December 31, 2014, resulting in a $1.6 million increase in interest expense. The $261.1 million in growth included $258.7 million in interest-bearing demand deposits acquired through the merger with LegacyTexas Group, Inc. The average balance of borrowings increased by $380.6 million compared to the 2014 period, which was partially offset by a 49 basis point decline in the average rate paid on borrowings, resulting in interest expense increasing by $60,000 from the year ended December 31, 2014.
49
Net Interest Income. Net interest income increased by $41.2 million, or 17.1%, to $282.3 million for the year ended December 31, 2016 from $241.1 million for the year ended December 31, 2015. The net interest margin decreased by 21 basis points to 3.79% for the year ended December 31, 2016 from 4.00% for the 2015 period. The net interest rate spread decreased by 23 basis points to 3.65% for the year ended December 31, 2016 from 3.88% for the 2015 period. The average yield on earning assets for the year ended December 31, 2016 was 4.26%, a ten basis point decrease from the year ended December 31, 2015, which was primarily due to a decrease in acquisition-related accretion income recorded during the 2016 period compared to the 2015 period, as well as lower yields earned on loans in the 2016 period. The average cost of interest-bearing liabilities for the year ended December 31, 2016 was 0.61%, up 13 basis points from the year ended December 31, 2015.
Net interest income increased by $108.1 million, or 81.3%, to $241.1 million for the year ended December 31, 2015 from $133.0 million for the year ended December 31, 2014. The net interest margin increased by 22 basis points to 4.00% for the year ended December 31, 2015 from 3.78% for the 2014 period. The net interest rate spread increased by 25 basis points to 3.88% for the year ended December 31, 2015 from 3.63% for the 2014 period. The average yield on earning assets for the year ended December 31, 2015 was 4.36%, a ten basis point increase from the year ended December 31, 2014, which was primarily due to increased volume in higher-yielding commercial loans, as well as accretion income resulting from the merger with LegacyTexas Group, Inc. The average cost of interest-bearing liabilities for the year ended December 31, 2015 was 0.48%, down 15 basis points from the year ended December 31, 2014.
Provision for Credit Losses. The provision for credit losses was $26.9 million for the year ended December 31, 2016, an increase of $1.4 million from $25.5 million for the year ended December 31, 2015. The increase in the provision for credit losses compared to the 2015 period was primarily related to elevated qualitative reserve factors applied to the energy portfolio due to sustained economic and regulatory uncertainty surrounding energy loans, as well as increased loan production in the 2016 period. Over the past year, risk rating downgrades on energy loans and the balance of non-performing energy loans have increased. The allowance for loan losses allocated to energy loans at December 31, 2016 totaled $19.2 million, up $7.2 million from $12.0 million at December 31, 2015. For more information about the Company's allowance for loan losses, please see "Management's Discussion and Analysis - Comparison of Financial Condition at December 31, 2016 and December 31, 2015 - Allowance for Loan Losses" contained in Item 7 of this report. Provision for credit losses also included a $1.5 million expense recorded to establish a reserve for credit losses on off-balance sheet commitments, which resulted from the expansion of our lending business, as well as recent increased diversification of the types of off-balance sheet commitments offered by the Bank.
The provision for credit losses was $25.5 million for the year ended December 31, 2015, an increase of $18.7 million from $6.7 million for the year ended December 31, 2014. The increase in the provision for credit losses compared to the 2014 period was primarily related to increased qualitative reserve factors applied to the energy portfolio. The Company increased these qualitative factors in the fourth quarter of 2015 due to the impact of continued pressure on the price of oil and gas. In addition to the changes in qualitative factors related to energy lending, the increase in loan loss reserves and provision expense was caused by increased organic loan production, as well as loans acquired through the merger with LegacyTexas Group, Inc. that were re-underwritten following completion of the merger.
Non-interest Income. Non-interest income increased by $7.1 million, or 15.9%, to $51.9 million for the year ended December 31, 2016, from $44.8 million for the year ended December 31, 2015. For the year ended December 31, 2015, non-interest income increased by $24.1 million, or 116.0%, from $20.7 million for the year ended December 31, 2014.
Years Ended December 31, | Change | |||||||||||||||||||||||||
2016 | 2015 | 2014 | 2016 versus 2015 | 2015 versus 2014 | ||||||||||||||||||||||
(Dollars in thousands) | Dollar | Percent | Dollar | Percent | ||||||||||||||||||||||
Non-interest income | ||||||||||||||||||||||||||
Service charges and other fees | $ | 36,690 | $ | 30,936 | $ | 19,382 | $ | 5,754 | 18.6 | % | $ | 11,554 | 59.6 | % | ||||||||||||
Net gain on sale of mortgage loans held for sale | 8,225 | 8,036 | — | 189 | 2.4 | 8,036 | 100.0 | |||||||||||||||||||
Bank-owned life insurance income | 1,744 | 1,699 | 628 | 45 | 2.6 | 1,071 | 170.5 | |||||||||||||||||||
Net gain on securities transactions | 56 | 203 | — | (147 | ) | (72.4 | ) | 203 | 100.0 | |||||||||||||||||
Gain on sale and disposition of assets | 3,356 | 873 | 658 | 2,483 | 284.4 | 215 | 32.7 | |||||||||||||||||||
Other | 1,860 | 3,068 | 75 | (1,208 | ) | (39.4 | ) | 2,993 | N/M 1 | |||||||||||||||||
$ | 51,931 | $ | 44,815 | $ | 20,743 | $ | 7,116 | 15.9 | % | $ | 24,072 | 116.0 | % | |||||||||||||
1 N/M - not meaningful
50
The increase in non-interest income from the year ended December 31, 2015 was primarily due to a $5.8 million increase in service charges and other fees, which included a $3.0 million increase in commercial loan fee income (consisting of syndication, arrangement, non-usage and pre-payment fees), a $1.0 million increase in debit card interchange income, a $695,000 incentive payment received from Mastercard for 2015 transaction performance, a $699,000 increase in title premiums and a $474,000 increase in Warehouse Purchase Program fee income due to increased volume in that loan portfolio. These increases in service charges and other fees compared to the 2015 period were partially offset by a decline of $671,000 in insufficient funds fees. Gain on sale and disposition of assets for the year ended December 31, 2016 included a $3.9 million gain recorded on the sale of two buildings and a $1.2 million gain recorded on the 2016 sale of our insurance subsidiary operations, which were partially offset by a loss of $1.5 million on the 2016 sale of our Federal Housing Administration ("FHA") loan portfolio and a loss of $407,000 recorded in the 2016 period on the sale of a foreclosed property. Other non-interest income declined by $1.2 million compared to the year ended December 31, 2015, primarily due to $1.6 million less income recorded in the 2016 period from insurance activities due to the above-mentioned sale of our insurance subsidiary operations. Partially offsetting this decline in other non-interest income for the year ended December 31, 2016 was $498,000 in swap fee income recorded on interest rate derivative positions with our customers, with only $227,000 in comparable income recognized during the 2015 period.
Non-interest income increased by $24.1 million for the year ended December 31, 2015, compared to the year ended December 31, 2014, primarily due to an $11.6 million increase in service charges and other fees, which was driven by an $841,000 increase in commercial loan fee income, as well as growth in service charges related to accounts acquired through the merger with LegacyTexas Group, Inc., higher Warehouse Purchase Program fee income due to increased volume in that loan portfolio and the addition of $4.7 million of title income through the acquisition of LegacyTexas Group, Inc.'s title subsidiary. Additionally, we recognized $8.0 million in net gains on the sale of mortgage loans during the year ended December 31, 2015, which includes the gain recognized on $223.3 million of one-to-four family mortgage loans that were sold or committed for sale during the year ended December 31, 2015, fair value changes on mortgage derivatives and mortgage fees collected. Prior to the merger with LegacyTexas Group, Inc., we did not originate for resale or sell mortgage loans to outside investors; therefore, a comparable gain was not recorded in the 2014 period. Other non-interest income for the year ended December 31, 2015 included $2.9 million of insurance income added through the acquisition of LegacyTexas Group, Inc.
Non-interest Expense. Non-interest expense increased by $4.8 million, or 3.2%, to $156.4 million for the year ended December 31, 2016, from $151.6 million for the year ended December 31, 2015. For the year ended December 31, 2015, non-interest expense increased by $53.5 million, or 54.5%, from $98.1 million for the year ended December 31, 2014.
Years Ended December 31, | Change | |||||||||||||||||||||||||
2016 | 2015 | 2014 | 2016 versus 2015 | 2015 versus 2014 | ||||||||||||||||||||||
(Dollars in thousands) | Dollar | Percent | Dollar | Percent | ||||||||||||||||||||||
Non-interest expense | ||||||||||||||||||||||||||
Salaries and employee benefits | $ | 92,568 | $ | 92,527 | $ | 55,057 | $ | 41 | — | % | $ | 37,470 | 68.1 | % | ||||||||||||
Merger and acquisition costs | — | 1,553 | 10,291 | (1,553 | ) | (100.0 | ) | (8,738 | ) | (84.9 | ) | |||||||||||||||
Advertising | 3,861 | 3,773 | 1,535 | 88 | 2.3 | 2,238 | 145.8 | |||||||||||||||||||
Occupancy and equipment | 15,007 | 14,860 | 7,374 | 147 | 1.0 | 7,486 | 101.5 | |||||||||||||||||||
Outside professional services | 3,872 | 3,332 | 2,291 | 540 | 16.2 | 1,041 | 45.4 | |||||||||||||||||||
Regulatory assessments | 4,948 | 4,260 | 2,713 | 688 | 16.2 | 1,547 | 57.0 | |||||||||||||||||||
Data processing | 14,974 | 11,278 | 6,862 | 3,696 | 32.8 | 4,416 | 64.4 | |||||||||||||||||||
Office operations | 9,901 | 10,697 | 6,584 | (796 | ) | (7.4 | ) | 4,113 | 62.5 | |||||||||||||||||
Other | 11,246 | 9,275 | 5,385 | 1,971 | 21.3 | 3,890 | 72.2 | |||||||||||||||||||
$ | 156,377 | $ | 151,555 | $ | 98,092 | $ | 4,822 | 3.2 | % | $ | 53,463 | 54.5 | % | |||||||||||||
The increase in non-interest expense from the year ended December 31, 2015 included a $3.7 million increase in data processing expense primarily related to increased expenses for debit card issuance and processing services, as the Bank has converted all debit cards to the Europay, Mastercard and Visa ("EMV") chip technology to reduce future fraud, as well as increased costs compared to the prior year for system upgrades to enhance customer service and increase operating efficiency. Other non-interest expense increased by $2.0 million compared to December 31, 2015, due to an increase in debit card fraud losses in the 2016 period. During 2016, we identified $1.3 million of debit card fraud losses that were directly related to a breach in a franchised restaurant’s point of sale (“POS”) system that had been ongoing since the fall of 2015. The Company has identified all compromised cards related to this breach, and all cards were reissued prior to the end of the third quarter of 2016. Regulatory assessments expense increased by $688,000 during the year ended December 31, 2016 based on increases to our
51
asset size and balance of non-performing loans in the 2016 period (which increases our assessment rate). Outside professional services expense increased by $540,000 during the year ended December 31, 2016 due to increased consulting costs in the 2016 period. Salaries and employee benefits expense for the year ended December 31, 2016 included increases in base salary expense, incentive expense, health care costs, and share-based compensation expense, as the number of full-time equivalent employees increased to 885 at December 31, 2016, from 840 at December 31, 2015. These increases to salaries and employee benefits expense for the year ended December 31, 2016 were partially offset by decreased expense related to the payoff of one of the Company’s ESOP loans at the end of the third quarter of 2016, an increase in deferred salary costs related to loan originations that will be accounted for over the lives of the related loans, and a reduction in salary costs due to the sale of our insurance subsidiary operations in the second quarter of 2016. Non-interest expense for the year ended December 31, 2015 was reduced by $1.6 million in merger and acquisition costs related to the 2015 merger with LegacyTexas Group, Inc.
Non-interest expense increased by $53.5 million for the year ended December 31, 2015, compared to the year ended December 31, 2014. This was driven by a $37.5 million, or 68.1%, increase in salaries and employee benefits expense, primarily due to an increase in full-time equivalent employees to 840 at December 31, 2015, from 517 at December 31, 2014, largely related to the merger with LegacyTexas Group, Inc. Additionally, shortly following the completion of the LegacyTexas Group, Inc. merger, certain senior managers from LegacyTexas Group, Inc. who joined the Company and the Bank received immediately-vested stock awards, which resulted in $590,000 of share-based compensation expense recognized during the year ended December 31, 2015. Compared to the year ended December 31, 2014, occupancy and equipment expense increased by $7.5 million, or 101.5%, and office operations expense increased by $4.1 million, or 62.5%, primarily due to the addition of LegacyTexas Group, Inc.'s facilities. Data processing expense increased by $4.4 million, or 64.4%, from the comparable 2014 period, as the Company added LegacyTexas Group, Inc. into their information technology infrastructure and upgraded various systems to enhance customer service and increase efficiency. The increases in non-interest expense during the year ended December 31, 2015 related to the merger with LegacyTexas Group, Inc. were partially offset by an $8.7 million, or 84.9%, decrease in merger and acquisition costs related to the merger.
Income Tax Expense. For the year ended December 31, 2016, we recognized income tax expense of $53.1 million on our pre-tax income, which was an effective tax rate of 35.2%, compared to income tax expense of $38.0 million for the year ended December 31, 2015, which was an effective tax rate of 34.9%. The increase in the effective tax rate was primarily due to the significant difference between the book and tax basis of LegacyTexas Insurance Services, which was sold in 2016.
During the year ended December 31, 2014, income tax expense totaled $17.7 million, which was an effective tax rate of 36.1%. The decrease in the effective tax rate between the 2015 and the 2014 periods was primarily due to non-deductible costs associated with the merger with LegacyTexas Group, Inc. recognized in the 2014 period, as well as increased amounts of tax-exempt income on municipal securities and bank-owned life insurance in 2015.
Average Balances, Net Interest Income, Yields Earned and Rates Paid
The following table presents, for the periods indicated, the total dollar amount of interest income from average interest-earning assets and the resultant yields, as well as the interest expense on average interest-bearing liabilities, expressed both in dollars and rates. Also presented are the weighted average yields on interest-earning assets, rates paid on interest- bearing liabilities and the resultant spread. All average balances are daily average balances. Non-accruing loans have been included in the table as loans carrying a zero yield.
52
Years Ended December 31, | ||||||||||||||||||||||||||||||||
2016 | 2015 | 2014 | ||||||||||||||||||||||||||||||
Average Outstanding Balance | Interest Earned/Paid | Yield/ Rate | Average Outstanding Balance | Interest Earned/Paid | Yield/ Rate | Average Outstanding Balance | Interest Earned/Paid | Yield/ Rate | ||||||||||||||||||||||||
(Dollars in thousands) | ||||||||||||||||||||||||||||||||
Interest-earning assets: | ||||||||||||||||||||||||||||||||
Commercial real estate | $ | 2,448,730 | $ | 124,857 | 5.10 | % | $ | 1,940,113 | $ | 101,469 | 5.23 | % | $ | 1,161,822 | $ | 63,061 | 5.43 | % | ||||||||||||||
Warehouse Purchase Program | 1,004,797 | 33,094 | 3.29 | 808,163 | 27,041 | 3.35 | 571,612 | 20,334 | 3.56 | |||||||||||||||||||||||
Commercial and industrial | 1,713,845 | 76,968 | 4.49 | 1,307,743 | 60,609 | 4.63 | 613,691 | 26,026 | 4.24 | |||||||||||||||||||||||
Construction and land | 282,087 | 14,819 | 5.25 | 238,904 | 13,660 | 5.72 | 21,501 | 1,290 | 6.00 | |||||||||||||||||||||||
Consumer real estate | 1,015,324 | 47,615 | 4.69 | 836,020 | 40,741 | 4.87 | 486,437 | 23,903 | 4.91 | |||||||||||||||||||||||
Other consumer | 61,548 | 3,485 | 5.66 | 80,648 | 4,440 | 5.51 | 43,505 | 2,641 | 6.07 | |||||||||||||||||||||||
Loans held for sale | 19,991 | 704 | 3.52 | 18,818 | 705 | 3.75 | — | — | — | |||||||||||||||||||||||
Less: deferred fees and allowance for loan loss | (54,593 | ) | — | — | (34,478 | ) | — | — | (22,611 | ) | — | — | ||||||||||||||||||||
Loans receivable 1 | 6,491,729 | 301,542 | 4.65 | 5,195,931 | 248,665 | 4.79 | 2,875,957 | 137,255 | 4.77 | |||||||||||||||||||||||
Agency mortgage-backed securities | 344,119 | 6,996 | 2.03 | 341,406 | 6,857 | 2.01 | 259,461 | 5,694 | 2.19 | |||||||||||||||||||||||
Agency collateralized mortgage obligations | 91,161 | 2,072 | 2.27 | 112,415 | 2,239 | 1.99 | 164,865 | 3,579 | 2.17 | |||||||||||||||||||||||
Investment securities | 128,071 | 3,238 | 2.53 | 117,810 | 3,206 | 2.72 | 75,513 | 2,327 | 3.08 | |||||||||||||||||||||||
FHLB and FRB stock and other restricted securities | 56,922 | 1,626 | 2.86 | 58,710 | 1,094 | 1.86 | 36,792 | 543 | 1.48 | |||||||||||||||||||||||
Interest-earning deposit accounts | 339,325 | 1,878 | 0.55 | 194,301 | 631 | 0.32 | 102,872 | 249 | 0.24 | |||||||||||||||||||||||
Total interest-earning assets | 7,451,327 | 317,352 | 4.26 | 6,020,573 | 262,692 | 4.36 | 3,515,460 | 149,647 | 4.26 | |||||||||||||||||||||||
Non-interest-earning assets | 430,554 | 422,425 | 182,760 | |||||||||||||||||||||||||||||
Total assets | $ | 7,881,881 | $ | 6,442,998 | $ | 3,698,220 | ||||||||||||||||||||||||||
Interest-bearing liabilities: | ||||||||||||||||||||||||||||||||
Interest-bearing demand | $ | 805,059 | 3,974 | 0.49 | $ | 722,225 | 3,297 | 0.46 | $ | 461,090 | 1,653 | 0.36 | ||||||||||||||||||||
Savings and money market | 2,370,366 | 7,288 | 0.31 | 1,895,809 | 3,644 | 0.19 | 1,037,831 | 3,144 | 0.30 | |||||||||||||||||||||||
Time | 1,250,667 | 9,772 | 0.78 | 882,196 | 6,186 | 0.70 | 500,755 | 3,415 | 0.68 | |||||||||||||||||||||||
Borrowings | 1,287,342 | 14,049 | 1.09 | 1,014,279 | 8,488 | 0.84 | 633,683 | 8,428 | 1.33 | |||||||||||||||||||||||
Total interest-bearing liabilities | 5,713,434 | 35,083 | 0.61 | 4,514,509 | 21,615 | 0.48 | 2,633,359 | 16,640 | 0.63 | |||||||||||||||||||||||
Non-interest-bearing demand | 1,240,712 | 1,077,310 | 440,150 | |||||||||||||||||||||||||||||
Non-interest-bearing liabilities | 78,947 | 73,771 | 66,177 | |||||||||||||||||||||||||||||
Total liabilities | 7,033,093 | 5,665,590 | 3,139,686 | |||||||||||||||||||||||||||||
Total shareholders’ equity | 848,788 | 777,408 | 558,534 | |||||||||||||||||||||||||||||
Total liabilities and shareholders’ equity | $ | 7,881,881 | $ | 6,442,998 | $ | 3,698,220 | ||||||||||||||||||||||||||
Net interest income and margin | $ | 282,269 | 3.79 | % | $ | 241,077 | 4.00 | % | $ | 133,007 | 3.78 | % | ||||||||||||||||||||
Net interest income and margin (tax-equivalent basis) 2 | $ | 283,338 | 3.80 | % | $ | 242,128 | 4.02 | % | $ | 133,798 | 3.81 | % | ||||||||||||||||||||
Net interest rate spread | 3.65 | % | 3.88 | % | 3.63 | % | ||||||||||||||||||||||||||
Net earning assets | $ | 1,737,893 | $ | 1,506,064 | $ | 882,101 | ||||||||||||||||||||||||||
Average interest-earning assets to average interest-bearing liabilities | 130.42 | % | 133.36 | % | 133.50 | % | ||||||||||||||||||||||||||
1 | Calculated net of deferred fees, loan discounts, loans in process and allowance for loan losses. |
2 | In order to make pretax income and resultant yields on tax-exempt investments and loans comparable to those on taxable investments and loans, a tax-equivalent adjustment (a non-GAAP measure) has been computed using a federal income tax rate of 35% for 2016, 2015 and 2014. Tax-exempt investments and loans had an average balance of $106.0 million, $104.8 million and $67.6 million for the years ended December 31, 2016, 2015 and 2014, respectively. |
53
Rate/Volume Analysis
The following schedule presents the dollar amount of changes in interest income and interest expense for major components of interest-earning assets and interest-bearing liabilities. It distinguishes between the changes related to outstanding balances and those due to changes in interest rates. The change in interest attributable to rate has been determined by applying the change in rate between periods to average balances outstanding in the earlier period. The change in interest due to volume has been determined by applying the rate from the earlier period to the change in average balances outstanding between periods. Changes attributable to both rate and volume which cannot be segregated have been allocated proportionately based on the changes due to rate and the changes due to volume.
Years Ended December 31, | |||||||||||||||||||||||
2016 versus 2015 | 2015 versus 2014 | ||||||||||||||||||||||
Increase (Decrease) Due to | Total Increase | Increase (Decrease) Due to | Total Increase | ||||||||||||||||||||
Volume | Rate | (Decrease) | Volume | Rate | (Decrease) | ||||||||||||||||||
(Dollars in thousands) | |||||||||||||||||||||||
Interest-earning assets: | |||||||||||||||||||||||
Commercial real estate | $ | 25,992 | $ | (2,604 | ) | $ | 23,388 | $ | 40,784 | $ | (2,376 | ) | $ | 38,408 | |||||||||
Warehouse Purchase Program | 6,483 | (430 | ) | 6,053 | 7,978 | (1,271 | ) | 6,707 | |||||||||||||||
Commercial and industrial | 18,291 | (1,932 | ) | 16,359 | 31,959 | 2,624 | 34,583 | ||||||||||||||||
Construction and land | 2,331 | (1,172 | ) | 1,159 | 12,433 | (63 | ) | 12,370 | |||||||||||||||
Consumer real estate | 8,458 | (1,584 | ) | 6,874 | 17,038 | (200 | ) | 16,838 | |||||||||||||||
Other consumer | (1,078 | ) | 123 | (955 | ) | 2,066 | (267 | ) | 1,799 | ||||||||||||||
Loans held for sale | 43 | (44 | ) | (1 | ) | 705 | — | 705 | |||||||||||||||
Loans receivable | 60,520 | (7,643 | ) | 52,877 | 112,963 | (1,553 | ) | 111,410 | |||||||||||||||
Agency mortgage-backed securities | 55 | 84 | 139 | 1,678 | (515 | ) | 1,163 | ||||||||||||||||
Agency collateralized mortgage obligations | (457 | ) | 290 | (167 | ) | (1,064 | ) | (276 | ) | (1,340 | ) | ||||||||||||
Investment securities | 268 | (236 | ) | 32 | 1,177 | (298 | ) | 879 | |||||||||||||||
FHLB and FRB stock and other restricted securities | (34 | ) | 566 | 532 | 382 | 169 | 551 | ||||||||||||||||
Interest-earning deposit accounts | 642 | 605 | 1,247 | 276 | 106 | 382 | |||||||||||||||||
Total interest-earning assets | 60,994 | (6,334 | ) | 54,660 | 115,412 | (2,367 | ) | 113,045 | |||||||||||||||
Interest-bearing liabilities: | |||||||||||||||||||||||
Interest-bearing demand | 396 | 281 | 677 | 1,109 | 535 | 1,644 | |||||||||||||||||
Savings and money market | 1,073 | 2,571 | 3,644 | 1,940 | (1,440 | ) | 500 | ||||||||||||||||
Time | 2,816 | 770 | 3,586 | 2,672 | 99 | 2,771 | |||||||||||||||||
Borrowings | 2,611 | 2,950 | 5,561 | 3,901 | (3,841 | ) | 60 | ||||||||||||||||
Total interest-bearing liabilities | 6,896 | 6,572 | 13,468 | 9,622 | (4,647 | ) | 4,975 | ||||||||||||||||
Net interest income | $ | 54,098 | $ | (12,906 | ) | $ | 41,192 | $ | 105,790 | $ | 2,280 | $ | 108,070 | ||||||||||
54
Liquidity
Management maintains a liquidity position that it believes will adequately provide funding for loan demand and deposit run-off that may occur in the normal course of business. We rely on a number of different sources in order to meet our potential liquidity demands. The primary sources are increases in deposit accounts and cash flows from loan payments and the securities portfolio.
In addition to the primary sources of funds, management has several secondary sources available to meet potential funding requirements. At December 31, 2016, we had an additional borrowing capacity of $1.82 billion with the FHLB. Also, at December 31, 2016, we had $255.0 million in federal funds lines of credit available with other financial institutions. We may also use the discount window at the FRB as a source of short-term funding. FRB borrowing capacity varies based upon securities pledged to the discount window line. At December 31, 2016, securities pledged had a collateral value of $46.7 million.
At December 31, 2016, we had classified 62.8% of its securities portfolio as available for sale (including pledged securities), providing an additional source of liquidity. Management believes that because active markets exist and our securities portfolio is of high quality, our available for sale securities are marketable. Selling participations in loans we originate, including portions of commercial real estate loans, creates another source of liquidity and allows us to manage borrower concentration risk, as well as interest rate risk.
Liquidity management is both a daily and long-term function of business management. Short-term excess liquidity is generally placed in short-term investments, such as overnight deposits at the FRB and correspondent banks. On a longer term basis, we maintain a strategy of investing in various lending products and investment securities, including mortgage-backed securities.
Planning for our normal business liquidity needs, both expected and unexpected, is done on a daily and short-term basis through the cash management function. On a longer-term basis it is accomplished through the budget and strategic planning functions, with support from internal asset/liability management software model projections.
The Liquidity Committee monitors liquidity positions and projections. Liquidity contingency planning is part of the Committee's process by focusing on possible scenarios that would stress liquidity beyond the Bank's normal business liquidity needs. These scenarios may include macro-economic and bank specific situations focusing on high probability-high impact, high probability-low impact, low probability-high impact, and low probability-low impact stress events.
Management recognizes that the factors and conditions leading up to and occurring during a liquidity stress event cannot be precisely defined or listed. Nevertheless, management believes that liquidity stress events can be categorized into sources and uses of liquidity, and levels of severity, with responses that apply to various situations.
The Company, which is a separate legal entity from the Bank and must provide for its own liquidity, had liquid assets of $17.0 million on an unconsolidated basis at December 31, 2016. In addition to its operating expenses, the Company is responsible for paying any dividends declared to its shareholders, funds paid out for Company stock repurchases, and payments on trust-preferred securities and subordinated debt held at the Company level. The Company has the ability to receive dividends or capital distributions from the Bank, although there are regulatory restrictions on the ability of the Bank to pay dividends. See “How We Are Regulated - Limitations on Dividends and Other Capital Distributions” under Item 1 and Note 16 of the Notes to Consolidated Financial Statements contained in Item 8 of this report.
The Bank uses its sources of funds primarily to meet its expenses, pay maturing deposits and fund withdrawals, and to fund loan commitments. Total approved loan commitments (including Warehouse Purchase Program commitments, unused lines of credit and letters of credit) amounted to $2.56 billion and $1.71 billion at December 31, 2016 and 2015, respectively. It is management's policy to offer deposit rates that are competitive with other local financial institutions. Based on this management strategy, we believe that a majority of maturing deposits will remain with the Bank. Certificates of deposit scheduled to mature in one year or less at December 31, 2016 totaled $992.8 million with a weighted average rate of 0.73%.
During the year ended December 31, 2016, cash and cash equivalents decreased by $326.4 million, or 53.0%, to $289.2 million at December 31, 2016 from $615.6 million at December 31, 2015. The large balance of cash at December 31, 2015 was primarily due to two large deposits totaling $196.4 million that were made on the last day of 2015. Operating activities provided cash of $132.4 million and financing activities provided cash of $560.6 million, which was offset by cash used in investing activities of $1.02 billion. Primary sources of cash for the year ended December 31, 2016 included proceeds from pay-offs of Warehouse Purchase Program loans totaling $19.95 billion, proceeds from FHLB advances of $200.0 million and maturities, prepayments and calls of available for sale securities of $2.28 billion. Primary uses of cash for the year ended
55
December 31, 2016 included originations of Warehouse Purchase Program loans totaling $19.97 billion, repayments on FHLB advances of $806.2 million, net funding of loans held for investment of $1.01 billion and purchases of available for sale securities of $2.33 billion.
Please see Item 1A (Risk Factors) contained in Part 1 of this Form 10-K for information regarding liquidity risk.
Off-Balance Sheet Arrangements, Contractual Obligations and Commitments
The following table presents our contractual obligations and commitments to make future payments as of December 31, 2016. Commitments to extend credit to our borrowers are shown in aggregate and by payment due dates (not including any interest amounts.) In addition to the commitments below, we had overdraft protection available to the Bank's depositors in the amount of $85.7 million and credit card guarantees outstanding in the amount of $3.3 million at December 31, 2016.
December 31, 2016 | |||||||||||||||||||
Less than One Year | One through Three Years | Four through Five Years | After Five Years | Total | |||||||||||||||
(Dollars in thousands) | |||||||||||||||||||
Contractual obligations: | |||||||||||||||||||
Deposits without a stated maturity | $ | 4,997,572 | $ | — | $ | — | $ | — | $ | 4,997,572 | |||||||||
Certificates of deposit | 992,786 | 285,169 | 82,447 | 7,502 | 1,367,904 | ||||||||||||||
FHLB advances 1 | 615,546 | 215,068 | 1,787 | 1,308 | 833,709 | ||||||||||||||
Repurchase agreements | 61,691 | 25,000 | — | — | 86,691 | ||||||||||||||
Subordinated debt 1 | — | — | — | 140,464 | 140,464 | ||||||||||||||
Private equity fund for Community Reinvestment Act purposes | 2,080 | — | — | — | 2,080 | ||||||||||||||
Operating leases (premises) | 6,218 | 10,425 | 8,662 | 20,572 | 45,877 | ||||||||||||||
Total contractual obligations | $ | 6,675,893 | $ | 535,662 | $ | 92,896 | $ | 169,846 | 7,474,297 | ||||||||||
Off-balance sheet loan commitments: 2 | |||||||||||||||||||
Unused commitments to extend credit | $ | 713,230 | $ | 506,834 | $ | 370,406 | $ | 52,058 | 1,642,528 | ||||||||||
Unused capacity on Warehouse Purchase Program loans 3 | 892,659 | — | — | — | 892,659 | ||||||||||||||
Standby letters of credit | 20,447 | 2,865 | 5,886 | — | 29,198 | ||||||||||||||
Total loan commitments | $ | 1,626,336 | $ | 509,699 | $ | 376,292 | $ | 52,058 | 2,564,385 | ||||||||||
Total contractual obligations and loan commitments | $ | 10,038,682 | |||||||||||||||||
1 FHLB advances and subordinated debt are shown at their contractual amounts. Please see Note 11 of the Notes to Consolidated Financial Statements contained in Item 8 of this report for more information regarding adjustments to the contractual amount.
2 Loans having no stated maturity are reported in the “Less than One Year” category.
3 In regards to unused capacity on Warehouse Purchase Program loans, the Company has established a maximum purchase facility amount, but reserves the right, at any time, to refuse to buy any mortgage loans offered for sale by its mortgage banking company customers for any reason in the Company's sole and absolute discretion.
Capital Resources
The Bank and the Company are regulated by the TDOB and the FRB. Consistent with our goal to operate a sound and profitable organization, our policy is for the Company and its subsidiary bank to maintain “well-capitalized” status under the FRB regulations. Based on capital levels at December 31, 2016 and 2015, the Bank and the Company were considered to be well-capitalized. See “How We Are Regulated - Regulatory Capital Requirements.”
56
At December 31, 2016, the Bank's equity totaled $978.9 million. The Company's consolidated equity totaled $885.4 million, or 10.6% of total assets, at December 31, 2016. Warehouse Purchase Program loan volumes can increase significantly on the last day of the month, potentially leading to a significant difference between the ending and average balance of Warehouse Purchase Program loans. At December 31, 2016, Warehouse Purchase Program loans totaled $1.06 billion, compared to an average balance of $1.00 billion for the year then ended. Because the capital ratios below are calculated using ending risk-weighted assets and Warehouse Purchase Program loans are risk-weighted at 100%, the end of period increase in these balances can significantly impact the Company's reported capital ratios.
Actual | Required for Capital Adequacy Purposes | To Be Well-Capitalized | ||||||||||||||||||
Amount | Ratio | Amount | Ratio | Amount | Ratio | |||||||||||||||
December 31, 2016 | (Dollars in Thousands) | |||||||||||||||||||
Total risk-based capital | ||||||||||||||||||||
the Company | $ | 910,040 | 11.71 | % | $ | 621,870 | 8.00 | % | $ | 777,338 | 10.00 | % | ||||||||
the Bank | 869,523 | 11.19 | 621,840 | 8.00 | 777,300 | 10.00 | ||||||||||||||
Tier 1 risk-based capital | ||||||||||||||||||||
the Company | 721,600 | 9.28 | 466,403 | 6.00 | 466,403 | 6.00 | ||||||||||||||
the Bank | 803,374 | 10.34 | 466,380 | 6.00 | 621,840 | 8.00 | ||||||||||||||
Common equity tier 1 risk-based capital | ||||||||||||||||||||
the Company | 709,858 | 9.13 | 349,802 | 4.50 | n/a1 | n/a1 | ||||||||||||||
the Bank | 803,374 | 10.34 | 349,785 | 4.50 | 505,245 | 6.50 | ||||||||||||||
Tier 1 leverage | ||||||||||||||||||||
the Company | 721,600 | 8.73 | 330,782 | 4.00 | n/a1 | n/a1 | ||||||||||||||
the Bank | 803,374 | 9.71 | 330,873 | 4.00 | 413,591 | 5.00 | ||||||||||||||
December 31, 2015 | ||||||||||||||||||||
Total risk-based capital | ||||||||||||||||||||
the Company | $ | 755,689 | 11.58 | % | $ | 522,107 | 8.00 | % | $ | 652,634 | 10.00 | % | ||||||||
the Bank | 691,554 | 10.60 | 522,116 | 8.00 | 652,645 | 10.00 | ||||||||||||||
Tier 1 risk-based capital | ||||||||||||||||||||
the Company | 635,162 | 9.73 | 391,580 | 6.00 | 391,580 | 6.00 | ||||||||||||||
the Bank | 644,461 | 9.87 | 391,587 | 6.00 | 522,116 | 8.00 | ||||||||||||||
Common equity tier 1 risk-based capital | ||||||||||||||||||||
the Company | 623,604 | 9.56 | 293,685 | 4.50 | n/a1 | n/a1 | ||||||||||||||
the Bank | 644,461 | 9.87 | 293,690 | 4.50 | 424,219 | 6.50 | ||||||||||||||
Tier 1 leverage | ||||||||||||||||||||
the Company | 635,162 | 9.46 | 268,430 | 4.00 | n/a1 | n/a1 | ||||||||||||||
the Bank | 644,461 | 9.61 | 268,273 | 4.00 | 335,341 | 5.00 | ||||||||||||||
1 Not applicable
Pursuant to new capital regulations adopted by the FRB and the other federal banking agencies, the Company and the Bank must maintain a capital conservation buffer consisting of additional common equity tier 1 capital greater than 2.5% of risk-weighted assets above the required minimum levels of common equity tier 1 capital, tier 1 capital and total capital in order to avoid limitations on paying dividends, repurchasing shares, and paying discretionary bonuses. The new capital conservation buffer began to be phased in beginning on January 1, 2016 when a buffer greater than 0.625% of risk-weighted assets is required, which will increase each year until the buffer requirement is fully implemented on January 1, 2019. At December 31, 2016, the Company's and the Bank's common equity tier 1 capital exceeded the required capital conservation buffer.
57
Impact of Inflation
The effects of price changes and inflation can vary substantially for most financial institutions. While management believes that inflation affects the economic value of total assets, it believes that it is difficult to assess the overall impact. Management believes this to be the case due to the fact that generally neither the timing nor the magnitude of changes in the consumer price index (“CPI”) coincides with changes in interest rates or asset values. For example, the price of one or more of the components of the CPI may fluctuate considerably, influencing composite CPI, without having a corresponding effect on interest rates, asset values, or the cost of those goods and services normally purchased by the Bank. In years of high inflation, intermediate and long-term interest rates tend to increase, adversely impacting the market values of investment securities, mortgage loans and other long-term fixed rate loans. In addition, high inflation may lead to higher short-term interest rates, which tend to increase the cost of funds. In years of low inflation, the opposite may occur.
Recent Accounting Pronouncements
For discussion of Recent Accounting Pronouncements, please see Note 1 — Adoption of New Accounting Standards and Note 1 — Effect of Newly Issued But Not Yet Effective Accounting Standards of the Notes to Consolidated Financial Statements contained in Item 8 of this report.
Item 7A. | Quantitative and Qualitative Disclosures about Market Risk |
Asset/Liability Management
Our Risk When Interest Rates Change. The rates of interest we earn on assets and pay on liabilities generally are established contractually for a period of time. However, market rates change over time. Like other financial institutions, our results of operations are impacted by changes in market interest rates and the interest rate sensitivity of our assets and liabilities. The risk associated with changes in market interest rates and our ability to adapt to these changes is known as interest rate risk and is our most significant market risk.
How We Measure Our Risk of Interest Rate Changes. As part of our attempt to manage our exposure to changes in market interest rates and comply with applicable regulations, we calculate and monitor our interest rate risk. In doing so, we analyze and manage assets and liabilities based on their interest rates and contractual cash flows, timing of maturities, prepayment potential, repricing opportunities, and sensitivity to actual or potential changes in market interest rates.
We are subject to interest rate risk to the extent that our interest-bearing liabilities, primarily deposits, FHLB advances and other borrowings, reprice more rapidly or slowly, or at different rates (basis risk) than our interest-earning assets, primarily loans and investment securities.
The Bank calculates interest rate risk by entering relevant contractual and projected information into its asset/liability management software simulation model. Data required by the model includes balance, rate, pay down schedule, and maturity. For items that contractually reprice, the repricing index, spread, and frequency are entered, including any initial, periodic, and lifetime interest rate caps and floors.
The Bank has adopted an asset and liability management policy. This policy sets the foundation for monitoring and managing the potential for adverse effects of material prolonged increases or decreases in interest rates on our results of operations. The Board of Directors sets the asset and liability policy for the Bank, which is implemented by the Asset/Liability Management Committee.
The purpose of the Asset/Liability Management Committee is to monitor, communicate, coordinate, and direct asset/liability management consistent with our business plan and board-approved policies. The Committee directs and monitors the volume and mix of assets and funding sources, taking into account relative costs and spreads, interest rate sensitivity and liquidity needs. The objectives are to manage assets and funding sources to produce results that are consistent with liquidity, capital adequacy, interest rate risk, growth, and profitability goals.
The Committee meets on a quarterly basis to, among other things, protect capital through earnings stability over the interest rate cycle, maintain our well-capitalized status, and provide a reasonable return on investment. The Committee recommends appropriate strategy changes based on this review. The Committee is responsible for reviewing and reporting the effects of policy implementation and strategies to the Board of Directors at least quarterly. Senior managers oversee the process on a daily basis.
A key element of the Bank’s asset/liability management strategy is to protect earnings by managing the inherent maturity and repricing mismatches between its interest-earning assets and interest-bearing liabilities. The Bank generally
58
manages such earnings exposure through the addition of loans, investment securities and deposits with risk mitigating characteristics and by entering into appropriate term FHLB advance agreements.
As part of its efforts to monitor and manage interest rate risk, the Bank uses the economic value of equity (“EVE”) methodology adopted by the Federal Financial Institutions Examination Council ("FFEIC") as part of its capital regulations. In essence, the EVE approach calculates the difference between the present value of expected cash flows from assets and liabilities. In addition to monitoring selected measures of EVE, management also calculates and monitors potential effects on net interest income resulting from increases or decreases in market interest rates. This approach uses the earnings at risk (“EAR”) methodology adopted by the Joint Agency Policy Statement on Interest Rate Risk as part of its capital regulations. EAR calculates estimated net interest income using a flat balance sheet approach over a twelve month time horizon. The EAR process is used in conjunction with EVE measures to identify interest rate risk on both a global and account level basis. Management and the Board of Directors review EVE and EAR measurements at least quarterly to review historical trends, projected measurements, and to determine whether the Bank's interest rate exposure is within the limits established by the Board of Directors.
The Bank's asset/liability management strategy sets acceptable limits for the percentage change in EVE and EAR given changes in interest rates. For an instantaneous, parallel, and sustained interest rate increase or decrease of 100 basis points, the Bank's policy indicates that EVE should not decrease by more than 5%, and for increases of 200, 300, and 400 basis points, EVE should not decrease by more than 10%, 12.5%, and 15%, respectively. For an instantaneous, parallel, and sustained interest rate increase or decrease of 100 basis points, the Bank's policy indicates that EAR should not decrease by more than 7%, and for increases of 200, 300, and 400 basis points, EAR should not decrease by more than 10%, 13%, and 15%, respectively.
As illustrated in the tables below, the Bank was within policy limits for all scenarios tested. The tables presented below, as of December 31, 2016, and 2015, are internal analyses of our interest rate risk as measured by changes in EVE and EAR for instantaneous, parallel, and sustained shifts for all market rates and yield curves, in 100 basis point increments, up 400 basis points and down 100 basis points.
As illustrated in the tables below, our EVE would be negatively impacted by a parallel, instantaneous, and sustained increase in market rates. Such an increase in rates would negatively impact EVE as a result of the duration of assets, including loans and investments, being longer than the duration of liabilities, primarily deposit accounts and FHLB borrowings. As illustrated in the table below at December 31, 2016, our EAR would be positively impacted by a parallel, instantaneous, and sustained increase in market rates of 100, 200, 300, or 400 basis points.
Change in Interest Rates in Basis Points | Economic Value of Equity | Earnings at Risk (12 months) | |||||||||||||||||||
Estimated EVE | Estimated Increase / (Decrease) in EVE | EVE Ratio % | Estimated Net Interest Income | Increase / (Decrease) in Estimated Net Interest Income | |||||||||||||||||
$ Amount | $ Change | % Change | $ Amount | $ Change | % Change | ||||||||||||||||
December 31, 2016 | (Dollars in thousands) | ||||||||||||||||||||
400 | 1,137,560 | (127,508 | ) | (10.08 | ) | 14.74 | 312,457 | 1,807 | 0.58 | ||||||||||||
300 | 1,180,103 | (84,965 | ) | (6.72 | ) | 15.02 | 312,109 | 1,459 | 0.47 | ||||||||||||
200 | 1,216,125 | (48,943 | ) | (3.87 | ) | 15.21 | 311,549 | 899 | 0.29 | ||||||||||||
100 | 1,248,129 | (16,939 | ) | (1.34 | ) | 15.34 | 310,953 | 303 | 0.10 | ||||||||||||
— | 1,265,068 | — | — | 15.30 | 310,650 | — | — | ||||||||||||||
(100 | ) | 1,230,570 | (34,498 | ) | (2.73 | ) | 14.64 | 297,726 | (12,924 | ) | (4.16 | ) | |||||||||
December 31, 2015 | |||||||||||||||||||||
400 | 911,142 | (118,867 | ) | (11.54 | ) | 12.86 | 252,686 | (6,758 | ) | (2.60 | ) | ||||||||||
300 | 947,909 | (82,100 | ) | (7.97 | ) | 13.15 | 254,417 | (5,027 | ) | (1.94 | ) | ||||||||||
200 | 981,508 | (48,501 | ) | (4.71 | ) | 13.38 | 256,044 | (3,400 | ) | (1.31 | ) | ||||||||||
100 | 1,011,522 | (18,487 | ) | (1.79 | ) | 13.56 | 257,491 | (1,953 | ) | (0.75 | ) | ||||||||||
— | 1,030,009 | — | — | 13.58 | 259,444 | — | — | ||||||||||||||
(100 | ) | 999,211 | (30,798 | ) | (2.99 | ) | 12.96 | 248,731 | (10,713 | ) | (4.13 | ) | |||||||||
59
The Bank's EVE was $1.27 billion, or 15.30%, of the market value of portfolio assets as of December 31, 2016, a $235.1 million increase from $1.03 billion, or 13.58%, of the market value of portfolio assets as of December 31, 2015. Based upon the assumptions utilized, an immediate 200 basis point increase in market interest rates would result in a $48.9 million decrease in our EVE at December 31, 2016, compared to a $48.5 million decrease at December 31, 2015, and would result in a nine basis point decrease in our EVE ratio to 15.21% at December 31, 2016, compared to a 20 basis point decrease to 13.38% at December 31, 2015. An immediate 100 basis point decrease in market interest rates would result in a $34.5 million decrease in our EVE at December 31, 2016, compared to a $30.8 million decrease at December 31, 2015, and would result in a 66 basis point decrease in our EVE ratio to 14.64% at December 31, 2016, compared to a 62 basis point decrease in our EVE ratio to 12.96% at December 31, 2015.
The Bank's projected EAR for the twelve months ending December 31, 2017 was measured at $310.7 million, compared to $259.4 million for the twelve months ending December 31, 2016. Based on the assumptions utilized, an immediate 200 basis point increase in market rates would result in a $899,000, or 0.29%, increase in net interest income for the twelve months ending December 31, 2017, compared to a $3.4 million, or 1.31%, decrease for the twelve months ending December 31, 2016. An immediate 100 basis point decrease in market rates would result in a $12.9 million decrease in net interest income for the twelve months ending December 31, 2017, compared to a $10.7 million decrease for the twelve months ending December 31, 2016. In May 2015, we increased non-maturity deposit betas utilized in our interest rate risk model. The primary goal is to model anticipated higher sensitivities due to the current prolonged low rate environment and the signaled impending rate rise from the Federal Reserve.
We have implemented a strategic plan to mitigate interest rate risk. This plan includes the ongoing review of our current and projected mix of fixed rate versus variable rate loans, investments, deposits, and borrowings. When available and appropriate, high quality adjustable rate assets are purchased or originated. These assets generally may reduce our sensitivity to upward interest rate shocks. On the liability side of the balance sheet, borrowings are added as appropriate. These borrowings will be of a size and term so as to mitigate the impact of duration mismatches, reducing our sensitivity to upward interest rate shocks. These strategies are implemented as needed and as opportunities arise to mitigate interest rate risk without materially sacrificing earnings.
In managing our mix of assets and liabilities, while considering the relationship between long and short term interest rates, market conditions, and consumer preferences, we may place somewhat greater emphasis on maintaining or increasing the Bank's net interest margin than on strictly matching the interest rate sensitivity of its assets and liabilities.
Management also believes that at times the increased net income which may result from a mismatch in the actual maturity, repricing, or duration of its asset and liability portfolios can provide sufficient returns to justify the increased exposure to sudden and unexpected increases or decreases in interest rates which may result from such a mismatch. Management believes that the Bank's level of interest rate risk is acceptable under this approach.
In evaluating the Bank's exposure to market interest rate movements, certain shortcomings inherent in the method of analysis presented in the foregoing table must be considered. For example, although certain assets and liabilities may have similar maturities or repricing characteristics, their interest rate drivers may react in different degrees to changes in market interest rates (basis risk). Also, the interest rates on certain types of assets and liabilities may fluctuate in advance of changes in market interest rates, while interest rates on other types may lag behind changes in market interest rates. Additionally, certain assets, such as adjustable rate mortgages, have features which restrict changes in interest rates over the life of the asset (time to initial interest rate reset; interest rate reset frequency; initial, periodic, and lifetime caps and floors). Further, in the event of a significant change in market interest rates, loan and securities prepayment and time deposit early withdrawal levels may deviate significantly from those assumed in the table above. Assets with prepayment options and liabilities with early withdrawal options are being monitored, with assumptions stress tested on a regular basis. Current market rates and customer behavior are being considered in the management of interest rate risk. Finally, the ability of many borrowers to service their debt may decrease in the event of an interest rate increase. The Bank considers all of these factors in monitoring its exposure to interest rate risk. Of note, the current historically low interest rate environment has resulted in asymmetrical interest rate risk. The interest rates on certain repricing assets and liabilities cannot be fully shocked downward.
The Board of Directors and management believe that the Bank's ability to successfully manage and mitigate its exposure to interest rate risk is strengthened by several key factors. For example, the Bank manages its balance sheet duration and overall interest rate risk by placing a preference on originating and retaining adjustable rate loans. In addition, the Bank borrows at various maturities from the FHLB to mitigate mismatches between the asset and liability portfolios. Furthermore, the investment securities portfolio is used as a primary interest rate risk management tool through the duration and repricing targeting of purchases and sales.
60
Item 8. | Financial Statements and Supplementary Data |
LEGACYTEXAS FINANCIAL GROUP, INC.
FINANCIAL STATEMENTS
December 31, 2016, 2015, and 2014
INDEX
Page | |
CONSOLIDATED FINANCIAL STATEMENTS | |
61
Report of Independent Registered Public Accounting Firm
The Board of Directors and Shareholders
LegacyTexas Financial Group, Inc.
We have audited the accompanying consolidated balance sheets of LegacyTexas Financial Group, Inc. (the "Company") as of December 31, 2016 and 2015, and the related consolidated statements of income, comprehensive income, changes in shareholders’ equity and cash flows for each of the three years in the period ended December 31, 2016. These financial statements are the responsibility of the Company’s management. Our responsibility is to express an opinion on these financial statements based on our audits.
We conducted our audits in accordance with the standards of the Public Company Accounting Oversight Board (United States). Those standards require that we plan and perform the audit to obtain reasonable assurance about whether the financial statements are free of material misstatement. An audit includes examining, on a test basis, evidence supporting the amounts and disclosures in the financial statements. An audit also includes assessing the accounting principles used and significant estimates made by management, as well as evaluating the overall financial statement presentation. We believe that our audits provide a reasonable basis for our opinion.
In our opinion, the financial statements referred to above present fairly, in all material respects, the consolidated financial position of LegacyTexas Financial Group, Inc. at December 31, 2016 and 2015, and the consolidated results of their operations and their cash flows for each of the three years in the period ended December 31, 2016, in conformity with U.S. generally accepted accounting principles.
We also have audited, in accordance with the standards of the Public Company Accounting Oversight Board (United States), LegacyTexas Financial Group, Inc.’s internal control over financial reporting as of December 31, 2016, based on criteria established in Internal Control-Integrated Framework issued by the Committee of Sponsoring Organizations of the Treadway Commission (2013 framework) and our report dated February 9, 2017 expressed an unqualified opinion thereon.
/s/ Ernst & Young LLP
Dallas, Texas
February 9, 2017
62
CONSOLIDATED BALANCE SHEETS
Years ended December 31,
(Dollar amounts in thousands, except per share data)
2016 | 2015 | ||||||
ASSETS | |||||||
Cash and due from financial institutions | $ | 59,823 | $ | 53,847 | |||
Short-term interest-bearing deposits in other financial institutions | 229,389 | 561,792 | |||||
Total cash and cash equivalents | 289,212 | 615,639 | |||||
Securities available for sale, at fair value | 354,515 | 311,708 | |||||
Securities held to maturity (fair value: December 31, 2016 — $212,981, December 31, 2015— $247,202) | 210,387 | 240,433 | |||||
Loans held for sale, at fair value | 21,279 | 22,535 | |||||
Loans held for investment: | |||||||
Loans held for investment (net of allowance for loan losses of $64,576 at December 31, 2016 and $47,093 at December 31, 2015) | 5,998,596 | 5,017,554 | |||||
Loans held for investment - Warehouse Purchase Program | 1,055,341 | 1,043,719 | |||||
Total loans held for investment | 7,053,937 | 6,061,273 | |||||
Federal Home Loan Bank ("FHLB") stock and other restricted securities, at cost | 43,266 | 63,075 | |||||
Bank-owned life insurance | 56,477 | 55,231 | |||||
Premises and equipment, net | 74,226 | 77,637 | |||||
Goodwill | 178,559 | 180,776 | |||||
Other assets | 80,397 | 63,633 | |||||
Total assets | $ | 8,362,255 | $ | 7,691,940 | |||
LIABILITIES AND SHAREHOLDERS’ EQUITY | |||||||
Deposits | |||||||
Non-interest-bearing demand | $ | 1,383,951 | $ | 1,170,272 | |||
Interest-bearing demand | 903,314 | 819,350 | |||||
Savings and money market | 2,710,307 | 2,209,698 | |||||
Time | 1,367,904 | 1,027,391 | |||||
Total deposits | 6,365,476 | 5,226,711 | |||||
FHLB advances | 833,682 | 1,439,904 | |||||
Repurchase agreements | 86,691 | 83,269 | |||||
Subordinated debt | 134,032 | 84,992 | |||||
Accrued expenses and other liabilities | 57,009 | 52,988 | |||||
Total liabilities | 7,476,890 | 6,887,864 | |||||
Commitments and contingent liabilities (See Note 17) | |||||||
Shareholders’ equity | |||||||
Preferred stock, $.01 par value; 10,000,000 shares authorized; 0 shares issued — December 31, 2016 and December 31, 2015 | — | — | |||||
Common stock, $.01 par value; 90,000,000 shares authorized; shares issued 47,876,198 — December 31, 2016 and 47,645,826 shares issued — December 31, 2015 | 479 | 476 | |||||
Additional paid-in capital | 589,408 | 576,753 | |||||
Retained earnings | 310,641 | 240,496 | |||||
Accumulated other comprehensive income (loss), net | (2,713 | ) | (133 | ) | |||
Unearned Employee Stock Ownership Plan (ESOP) shares; 1,245,046 shares at December 31, 2016 and 1,365,457 shares at December 31, 2015 | (12,450 | ) | (13,516 | ) | |||
Total shareholders’ equity | 885,365 | 804,076 | |||||
Total liabilities and shareholders’ equity | $ | 8,362,255 | $ | 7,691,940 | |||
See accompanying notes to consolidated financial statements. | |||||||
63
CONSOLIDATED STATEMENTS OF INCOME
Years ended December 31,
(Dollar amounts in thousands, except per share data)
2016 | 2015 | 2014 | |||||||||
Interest and dividend income | |||||||||||
Loans, including fees | $ | 301,542 | $ | 248,665 | $ | 137,255 | |||||
Taxable securities | 9,254 | 9,307 | 9,352 | ||||||||
Nontaxable securities | 3,052 | 2,995 | 2,248 | ||||||||
Interest-bearing deposits in other financial institutions | 1,878 | 631 | 249 | ||||||||
FHLB and FRB stock and other | 1,626 | 1,094 | 543 | ||||||||
317,352 | 262,692 | 149,647 | |||||||||
Interest expense | |||||||||||
Deposits | 21,034 | 13,127 | 8,212 | ||||||||
FHLB advances | 7,167 | 6,552 | 7,610 | ||||||||
Repurchase agreements and other borrowings | 6,882 | 1,936 | 818 | ||||||||
35,083 | 21,615 | 16,640 | |||||||||
Net interest income | 282,269 | 241,077 | 133,007 | ||||||||
Provision for credit losses | 26,900 | 25,465 | 6,721 | ||||||||
Net interest income after provision for credit losses | 255,369 | 215,612 | 126,286 | ||||||||
Non-interest income | |||||||||||
Service charges and other fees | 36,690 | 30,936 | 19,382 | ||||||||
Net gain on sale of mortgage loans held for sale | 8,225 | 8,036 | — | ||||||||
Bank-owned life insurance income | 1,744 | 1,699 | 628 | ||||||||
Net gain on securities transactions | 56 | 203 | — | ||||||||
Gain on sale and disposition of assets | 3,356 | 873 | 658 | ||||||||
Other | 1,860 | 3,068 | 75 | ||||||||
51,931 | 44,815 | 20,743 | |||||||||
Non-interest expense | |||||||||||
Salaries and employee benefits | 92,568 | 92,527 | 55,057 | ||||||||
Merger and acquisition costs | — | 1,553 | 10,291 | ||||||||
Advertising | 3,861 | 3,773 | 1,535 | ||||||||
Occupancy and equipment | 15,007 | 14,860 | 7,374 | ||||||||
Outside professional services | 3,872 | 3,332 | 2,291 | ||||||||
Regulatory assessments | 4,948 | 4,260 | 2,713 | ||||||||
Data processing | 14,974 | 11,278 | 6,862 | ||||||||
Office operations | 9,901 | 10,697 | 6,584 | ||||||||
Other | 11,246 | 9,275 | 5,385 | ||||||||
156,377 | 151,555 | 98,092 | |||||||||
Income before income tax expense | 150,923 | 108,872 | 48,937 | ||||||||
Income tax expense | 53,102 | 37,956 | 17,659 | ||||||||
Net income | $ | 97,821 | $ | 70,916 | $ | 31,278 | |||||
Earnings per share: | |||||||||||
Basic | $ | 2.11 | $ | 1.54 | $ | 0.82 | |||||
Diluted | $ | 2.09 | $ | 1.53 | $ | 0.81 | |||||
Dividends declared per share | $ | 0.58 | $ | 0.54 | $ | 0.48 | |||||
See accompanying notes to consolidated financial statements. | |||||||||||
64
CONSOLIDATED STATEMENTS OF COMPREHENSIVE INCOME
Years ended December 31,
(Dollar amounts in thousands)
2016 | 2015 | 2014 | |||||||||
Net income | $ | 97,821 | $ | 70,916 | $ | 31,278 | |||||
Change in unrealized gains (losses) on securities available for sale | (3,917 | ) | (1,434 | ) | 2,022 | ||||||
Reclassification of amount realized through sale of securities | (56 | ) | (203 | ) | — | ||||||
Tax effect | 1,393 | 574 | (709 | ) | |||||||
Other comprehensive income (loss), net of tax | (2,580 | ) | (1,063 | ) | 1,313 | ||||||
Comprehensive income | $ | 95,241 | $ | 69,853 | $ | 32,591 | |||||
See accompanying notes to consolidated financial statements. | |||||||||||
65
CONSOLIDATED STATEMENTS OF CHANGES IN SHAREHOLDERS’ EQUITY
Years ended December 31,
(Dollar amounts in thousands, except per share data)
Common Stock | Additional Paid-In Capital | Retained Earnings | Accumulated Other Comprehensive Income (Loss), Net | Unearned ESOP Shares | Total Shareholders’ Equity | ||||||||||||||||||
Balance at December 31, 2013 | $ | 399 | $ | 377,657 | $ | 183,236 | $ | (383 | ) | $ | (16,449 | ) | $ | 544,460 | |||||||||
Net income | — | — | 31,278 | — | — | 31,278 | |||||||||||||||||
Other comprehensive income, net of tax | — | — | — | 1,313 | — | 1,313 | |||||||||||||||||
Dividends declared ($0.48 per share) | — | — | (19,187 | ) | — | — | (19,187 | ) | |||||||||||||||
ESOP shares earned, (184,194 shares) | — | 4,091 | — | — | 1,466 | 5,557 | |||||||||||||||||
Share-based compensation expense | — | 3,717 | — | — | — | 3,717 | |||||||||||||||||
Activity in employee stock plans, (76,035 shares) | 1 | 1,084 | — | — | — | 1,085 | |||||||||||||||||
Balance at December 31, 2014 | 400 | 386,549 | 195,327 | 930 | (14,983 | ) | 568,223 | ||||||||||||||||
Net income | — | — | 70,916 | — | — | 70,916 | |||||||||||||||||
Other comprehensive income (loss), net of tax | — | — | — | (1,063 | ) | — | (1,063 | ) | |||||||||||||||
Dividends declared ($0.54 per share) | — | — | (25,747 | ) | — | — | (25,747 | ) | |||||||||||||||
ESOP shares earned, (184,194 shares) | — | 4,284 | — | — | 1,467 | 5,751 | |||||||||||||||||
Share-based compensation expense | — | 5,477 | — | — | — | 5,477 | |||||||||||||||||
Activity in employee stock plans, (138,855 shares) | 1 | 1,283 | — | — | — | 1,284 | |||||||||||||||||
Share repurchase, (357,950 shares) | (4 | ) | (7,985 | ) | — | — | — | (7,989 | ) | ||||||||||||||
Acquisition of LegacyTexas Group, Inc., (7,850,070 shares) | 79 | 187,145 | — | — | — | 187,224 | |||||||||||||||||
Balance at December 31, 2015 | 476 | 576,753 | 240,496 | (133 | ) | (13,516 | ) | 804,076 | |||||||||||||||
Net income | — | — | 97,821 | — | — | 97,821 | |||||||||||||||||
Other comprehensive income (loss), net of tax | — | — | — | (2,580 | ) | — | (2,580 | ) | |||||||||||||||
Dividends declared ($0.58 per share) | — | — | (27,676 | ) | — | — | (27,676 | ) | |||||||||||||||
ESOP shares earned, (120,411 shares) | — | 2,889 | — | — | 1,066 | 3,955 | |||||||||||||||||
Share-based compensation expense | — | 6,014 | — | — | — | 6,014 | |||||||||||||||||
Activity in employee stock plans, (230,372 shares) | 3 | 3,752 | — | — | — | 3,755 | |||||||||||||||||
Balance at December 31, 2016 | $ | 479 | $ | 589,408 | $ | 310,641 | $ | (2,713 | ) | $ | (12,450 | ) | $ | 885,365 | |||||||||
See accompanying notes to consolidated financial statements. | |||||||||||||||||||||||
66
CONSOLIDATED STATEMENTS OF CASH FLOWS
Years ended December 31,
(Dollar amounts in thousands)
2016 | 2015 | 2014 | |||||||||
Cash flows from operating activities | |||||||||||
Net income | $ | 97,821 | $ | 70,916 | $ | 31,278 | |||||
Adjustments to reconcile net income to net cash provided by operating activities: | |||||||||||
Provision for credit losses | 26,900 | 25,465 | 6,721 | ||||||||
Depreciation and amortization | 7,081 | 7,196 | 4,393 | ||||||||
Deferred tax expense (benefit) | (6,798 | ) | (692 | ) | (1,414 | ) | |||||
Premium amortization and accretion of securities, net | 4,359 | 4,267 | 3,416 | ||||||||
Accretion related to acquired loans | (4,613 | ) | (10,241 | ) | (1,500 | ) | |||||
Net (gain) on securities transactions | (56 | ) | (203 | ) | — | ||||||
ESOP compensation expense | 3,955 | 5,751 | 5,557 | ||||||||
Share-based compensation expense | 6,014 | 5,477 | 3,717 | ||||||||
Net gain on loans held for sale | (8,225 | ) | (8,036 | ) | — | ||||||
Loans originated or purchased for sale | (218,288 | ) | (222,195 | ) | — | ||||||
Proceeds from sale of loans held for sale | 227,769 | 225,335 | — | ||||||||
FHLB stock dividends | (539 | ) | (152 | ) | (103 | ) | |||||
Bank-owned life insurance income | (1,744 | ) | (1,699 | ) | (628 | ) | |||||
(Gain) loss on sale and disposition of repossessed assets, premises and equipment | (3,524 | ) | (293 | ) | 1,824 | ||||||
Disposition of insurance subsidiary goodwill upon sale of subsidiary operations | 2,217 | — | — | ||||||||
Net change in deferred loan fees (costs) | 391 | (1,067 | ) | 1,660 | |||||||
Net change in accrued interest receivable | (3,238 | ) | (2,821 | ) | (443 | ) | |||||
Net change in other assets | (2,947 | ) | 8,444 | 117 | |||||||
Net change in other liabilities | 5,913 | (16,250 | ) | (2,571 | ) | ||||||
Net cash provided by operating activities | 132,448 | 89,202 | 52,024 | ||||||||
Cash flows from investing activities | |||||||||||
Available for sale securities: | |||||||||||
Maturities, prepayments and calls | 2,276,913 | 2,114,641 | 2,050,002 | ||||||||
Purchases | (2,334,558 | ) | (2,148,080 | ) | (2,001,501 | ) | |||||
Proceeds from sale of AFS securities | 7,700 | 36,984 | — | ||||||||
Held to maturity securities: | |||||||||||
Maturities, prepayments and calls | 41,384 | 49,730 | 57,000 | ||||||||
Purchases | (12,477 | ) | (15,933 | ) | (5,919 | ) | |||||
Originations of Warehouse Purchase Program loans | (19,966,527 | ) | (15,511,029 | ) | (11,913,793 | ) | |||||
Proceeds from pay-offs of Warehouse Purchase Program loans | 19,954,905 | 15,253,726 | 11,800,847 | ||||||||
Net change in loans held for investment, excluding Warehouse Purchase Program | (1,014,500 | ) | (1,030,016 | ) | (583,762 | ) | |||||
Redemption (purchase) of FHLB and FRB stock and other | 20,348 | (14,527 | ) | (9,098 | ) | ||||||
Cash received in excess of cash paid for acquisition of LegacyTexas Group, Inc. | — | 128,598 | — | ||||||||
Purchases of premises and equipment | (8,420 | ) | (5,660 | ) | (1,253 | ) | |||||
Proceeds from sale of assets | 15,803 | 10,121 | 621 | ||||||||
Net cash (used in) investing activities | (1,019,429 | ) | (1,131,445 | ) | (606,856 | ) | |||||
67
CONSOLIDATED STATEMENTS OF CASH FLOWS (Continued)
Years ended December 31,
(Dollar amounts in thousands)
2016 | 2015 | 2014 | |||||||||
Cash flows from financing activities | |||||||||||
Net change in deposits | 1,138,765 | 940,862 | 393,170 | ||||||||
Proceeds from FHLB advances | 200,000 | 1,350,000 | 712,000 | ||||||||
Repayments on FHLB advances | (806,222 | ) | (773,003 | ) | (488,189 | ) | |||||
Share repurchase | — | (7,989 | ) | — | |||||||
Proceeds from borrowings | 76,861 | 73,407 | — | ||||||||
Repayments of borrowings | (24,929 | ) | (32,953 | ) | — | ||||||
Payment of dividends | (27,676 | ) | (25,747 | ) | (19,187 | ) | |||||
Activity in employee stock plans | 3,755 | 1,284 | 1,085 | ||||||||
Net cash provided by financing activities | 560,554 | 1,525,861 | 598,879 | ||||||||
Net change in cash and cash equivalents | (326,427 | ) | 483,618 | 44,047 | |||||||
Beginning cash and cash equivalents | 615,639 | 132,021 | 87,974 | ||||||||
Ending cash and cash equivalents | $ | 289,212 | $ | 615,639 | $ | 132,021 | |||||
Supplemental cash flow information: | |||||||||||
Interest paid | $ | 34,625 | $ | 20,861 | $ | 16,807 | |||||
Income taxes paid | 60,854 | 36,835 | 15,941 | ||||||||
Supplemental noncash disclosures: | |||||||||||
Transfers from loans to other real estate owned | 10,780 | 3,287 | 954 | ||||||||
Common stock issued in consideration of LegacyTexas Group, Inc. acquisition | — | 187,224 | — | ||||||||
See accompanying notes to consolidated financial statements. | |||||||||||
68
LEGACYTEXAS FINANCIAL GROUP, INC.
NOTES TO CONSOLIDATED FINANCIAL STATEMENTS
(Dollar amounts in thousands, except per share data)
Note 1 — Summary of Significant Accounting Policies
Nature of Operations and Principles of Consolidation: The consolidated financial statements include LegacyTexas Financial Group, Inc. (the "Company"), whose business at December 31, 2016 primarily consisted of the operations of its wholly-owned subsidiary, LegacyTexas Bank (the "Bank"). In addition, the Company also offers title services through LegacyTexas Title Co., which is a wholly-owned subsidiary of the Bank. Intercompany transactions and balances are eliminated in consolidation.
At December 31, 2016, the Company provided financial services through 45 banking offices in the Dallas/Fort Worth Metroplex and surrounding counties. Its primary deposit products are demand, savings and certificate of deposit accounts, and its primary lending products are commercial real estate, commercial and industrial and consumer lending, including one- to four- family real estate loans. Most loans are secured by specific items of collateral, including business assets, commercial and residential real estate and consumer assets. Commercial loans are expected to be repaid from cash flow from operations of businesses.
Use of Estimates: To prepare financial statements in conformity with U.S. generally accepted accounting principles ("US GAAP"), management makes estimates and assumptions based on available information. These estimates and assumptions affect the amounts reported in the financial statements and the disclosures provided, and actual results could differ. The allowance for loan losses, valuation of other real estate owned, other-than-temporary impairment of securities, realization of deferred tax assets, and fair values of financial instruments are subject to change.
Cash Flows: Cash and cash equivalents include cash, deposits with other financial institutions with maturities less than 90 days, and federal funds sold. Net cash flows are reported for customer loan and deposit transactions, interest-bearing deposits in other financial institutions, federal funds purchased, Federal Home Loan Bank advances and repurchase agreements.
Restrictions on Cash: The Company maintains deposits with other financial institutions in amounts that exceed federal deposit insurance coverage. Management regularly evaluates the credit risk associated with the counterparties to these transactions and believes that the Company is not exposed to any significant credit risks on cash and cash equivalents. Cash balances equaling or exceeding escrow amounts are maintained at correspondent banks.
Securities: Securities that the Company has both the positive intent and ability to hold to maturity are classified as held to maturity and are carried at amortized cost. Securities that the Company intends to hold for an indefinite period of time, but not necessarily to maturity, are classified as available for sale and are carried at fair value. Unrealized gains and losses on securities classified as available for sale have been accounted for as accumulated other comprehensive income (loss), net of taxes.
Gains and losses on the sale of securities classified as available for sale are recorded on the trade date using the specific-identification method. Amortization of premiums and discounts are recognized in interest income over the period to maturity. Premiums and discounts on securities are amortized using the level-yield method without anticipating prepayment, except for mortgage-backed securities where prepayments are anticipated.
The Company evaluates securities for other-than-temporary impairment on at least a quarterly basis and more frequently when economic, market, or security specific concerns warrant such evaluation. Consideration is given to the length of time and the extent to which the fair value has been less than amortized cost, the financial condition and near-term prospects of the issuer, and the intent and ability of the Company to retain its investment for a period of time sufficient to allow for any anticipated recovery in fair value. In analyzing an issuer’s financial condition, the Company may consider whether the securities are issued by the federal government or its agencies, whether downgrades by bond rating agencies have occurred, and the results of reviews of the issuers’ financial condition. The Company conducts regular reviews of the bond agency ratings of securities and considers whether the securities were issued by or have principal and interest payments guaranteed by the federal government or its agencies. These reviews focus on the underlying rating of the issuer and also include the insurance rating of securities that have an insurance component or guarantee. The ratings and financial condition of the issuers are monitored, as well as the financial condition and ratings of the insurers and guarantors.
69
LEGACYTEXAS FINANCIAL GROUP, INC.
NOTES TO CONSOLIDATED FINANCIAL STATEMENTS
(Dollar amounts in thousands, except per share data) (Continued)
For periods in which other-than-temporary impairment of a debt security is recognized, the credit portion of the amount is determined by subtracting the present value of the stream of estimated cash flows as calculated in a discounted cash flow model and discounted at book yield from the prior period’s ending carrying value. The non-credit portion of the amount is determined by subtracting the credit portion of the impairment from the difference between the book value and fair value of the security. The credit related portion of the impairment is charged against income and the non-credit related portion is charged to equity as a component of accumulated other comprehensive income. The Company did not recognize any other-than-temporary impairment on its securities portfolio for the years ended December 31, 2016 and 2015.
Mortgage Loans Held for Sale: The Company elects the fair value option for recording residential mortgage loans held for sale in accordance with Accounting Standards Codification ("ASC") 825, "Financial Instruments". This election allows for a more effective offset of the changes in fair values of the loans and the derivative instruments used to economically hedge them without the burden of complying with the requirements for hedge accounting under ASC 815, “Derivatives and Hedging.”
Warehouse Purchase Program Loans: The Warehouse Purchase Program allows unaffiliated mortgage originators to close one-to-four family real estate loans in their own name and manage its cash flow needs until the loans are sold to investors. The mortgage banking company customer closes mortgage loans consistent with underwriting standards established by the Bank and approved investors and, once all pertinent documents are received, the participation interest is delivered by the Bank to the investor selected by the originator and approved by us. Although not bound by any legally binding commitment, when a purchase decision is made, we purchase a 100% participation interest in the mortgage loans originated by our mortgage banking company customers. All Warehouse Purchase Program loans are collectively evaluated for impairment and are purchased under several contractual requirements, providing safeguards to the Company. These safeguards include the requirement that our mortgage company customers have a takeout commitment or similar arrangement for each loan. To date, the Company has not experienced a loss on these loans and no allowance for loan losses has been allocated to them.
Loans: Loans that management has the intent and ability to hold for the foreseeable future or until maturity or payoff are reported at the principal balance outstanding, net of unearned interest, purchase premiums and discounts, deferred loan fees and costs, and an allowance for loan losses. Interest income is accrued on the unpaid principal balance. Loan origination fees, net of certain direct origination costs, are deferred and recognized in interest income using the level-yield method without anticipating prepayments.
Past due status is based on the contractual terms of the loan. Loans that are past due 30 days are considered delinquent. Interest income on loans is discontinued at the time the loan is 90 days delinquent unless the loan is well-secured and in process of collection. Non-mortgage consumer loans are typically charged off no later than 120 days past due. In all cases, loans are placed on nonaccrual or charged-off at an earlier date if collection of principal or interest is considered doubtful. Nonaccrual loans include both smaller balance homogeneous loans that are collectively evaluated for impairment and larger individually classified impaired loans.
All interest accrued but not received for loans placed on nonaccrual status is reversed against interest income. Subsequent receipts on non-accrual loans are recorded as a reduction of principal, and interest income is recorded only after principal recovery is reasonably assured. Loans are returned to accrual status when all the principal and interest amounts contractually due are brought current and future payments are reasonably assured.
For loans collateralized by real property and commercial and industrial loans, credit exposure is monitored by internally assigned grades used for classification of loans. A loan is considered “special mention” when management has determined that there is a potential weakness that deserves management's close attention. Loans rated as "special mention" are not adversely classified according to regulatory classifications and do not expose the Company to sufficient risk to warrant adverse classification. A loan is considered “substandard” if it is inadequately protected by the current net worth and paying capacity of the obligor or the collateral pledged, if any. “Substandard” loans include those characterized by the “distinct possibility” that the insured institution will sustain “some loss” if the deficiencies are not corrected, and the loan may or may not meet the criteria for impairment. Loans classified as “doubtful” have all of the weaknesses of those classified as “substandard”, with the added characteristic that the weaknesses present make “collection or liquidation in full,” on the basis of currently existing facts, conditions and values, “highly questionable and improbable.” All other loans that do not fall into the above mentioned categories are considered “pass” loans. Updates to internally assigned grades are made monthly and/or upon significant developments.
For other consumer loans (non-real estate), credit exposure is monitored by payment history of the loans. Non-performing other consumer loans are on nonaccrual status and are generally greater than 90 days past due.
70
LEGACYTEXAS FINANCIAL GROUP, INC.
NOTES TO CONSOLIDATED FINANCIAL STATEMENTS
(Dollar amounts in thousands, except per share data) (Continued)
Acquired Loans: Loans acquired through the completion of a transfer, including loans acquired in a business combination, that have evidence of deterioration of credit quality since origination and for which it is probable, at acquisition, that the Company will be unable to collect all contractually required payment receivable are initially recorded at fair value (as determined by the present value of expected future cash flows) with no valuation allowance. The difference between the undiscounted cash flows expected at acquisition and the investment in the loan, or the “accretable yield,” is recognized as interest income on a level-yield method over the life of the loan. Contractually required payments for interest and principal that exceed the undiscounted cash flows expected at acquisition, or the “nonaccretable difference,” are not recognized on the balance sheet and do not result in any yield adjustments, loss accruals or valuation allowances. Increases in expected cash flows, including prepayments, subsequent to the initial investment are recognized prospectively through adjustment of the yield on the loan over its remaining life. Decreases in expected cash flows are recognized as impairment. Valuation allowances on these impaired loans reflect only losses incurred after the acquisition (meaning the present value of all cash flows expected at acquisition that ultimately are not to be received). Revolving loans, including lines of credit, are excluded from acquired credit impaired loan accounting.
For acquired loans not deemed credit-impaired at acquisition, the differences between the initial fair value and the unpaid principal balance are recognized as interest income on a level-yield basis over the lives of the related loans. Subsequent to the acquisition date, methods utilized to estimate the required allowance for loan losses for these loans is similar to originated loans; however, a provision for credit losses will be recorded only to the extent the required allowance exceeds any remaining credit discounts.
Concentration of Credit Risk: Most of the Company’s business activity is with customers located within the North Texas region and a large portion of loans are secured by real estate in this area. Therefore, the Company’s exposure to credit risk is significantly affected by changes in the economy of the North Texas area.
Allowance for Loan Losses: The allowance for loan losses and related provision expense are susceptible to change if the credit quality of our loan portfolio changes, which is evidenced by many factors, including but not limited to charge-offs and non-performing loan trends. Generally, consumer real estate lending has a lower credit risk profile compared to other consumer lending (such as automobile loans). Commercial real estate and commercial and industrial lending, however, can have higher risk profiles than consumer loans due to these loans being larger in amount and non-homogeneous in structure and term. Changes in economic conditions, the mix and size of the loan portfolio, and individual borrower conditions can dramatically impact our level of allowance for loan losses in relatively short periods of time.
The allowance for loan losses is maintained to cover incurred losses that are estimated in accordance with US GAAP. It is our estimate of credit losses inherent in our loan portfolio at each balance sheet date. Our methodology for analyzing the allowance for loan losses consists of general and specific components. For the general component, we stratify the loan portfolio into homogeneous groups of loans that possess similar loss potential characteristics and apply a loss ratio to these groups of loans to estimate the credit losses in the loan portfolio. We use both historical loss ratios and qualitative loss factors assigned to major loan collateral types to establish general component loss allocations, inclusive of estimated loss emergence periods. Qualitative loss factors are based on management's judgment of company, market, industry or business specific data and external economic indicators, which are not yet reflected in the historical loss ratios, and that could impact the Company's specific loan portfolios. The Allowance for Loan Loss Committee sets and adjusts qualitative loss factors by regularly reviewing changes in underlying loan composition and the seasonality of specific portfolios. The Allowance for Loan Loss Committee also considers credit quality and trends relating to delinquency, non-performing and adversely rated loans within the Company's loan portfolio when evaluating qualitative loss factors. Additionally, the Allowance for Loan Loss Committee adjusts qualitative factors to account for the potential impact of external economic factors, including the unemployment rate, vacancy and capitalization rates and other pertinent economic data specific to our primary market area and lending portfolios.
For the specific component, the allowance for loan losses includes loans where management has concerns about the borrower's ability to repay and on individually analyzed loans found to be impaired. Management evaluates current information and events regarding a borrower's ability to repay its obligations and considers a loan to be impaired when the ultimate collectability of amounts due, according to the contractual terms of the loan agreement, is in doubt. If an impaired loan is collateral-dependent, the fair value of the collateral, less the estimated cost to sell, is used to determine the amount of impairment. If an impaired loan is not collateral-dependent, the impairment amount is determined using the negative difference, if any, between the estimated discounted cash flows and the loan amount due. For impaired loans, the amount of the impairment can be adjusted, based on current data, until such time as the actual basis is established by acquisition of the collateral or until the basis is collected. Impairment losses are reflected in the allowance for loan losses through a charge to the provision for credit losses. Subsequent recoveries are credited to the allowance for loan losses. Cash receipts for accruing loans are applied to principal
71
LEGACYTEXAS FINANCIAL GROUP, INC.
NOTES TO CONSOLIDATED FINANCIAL STATEMENTS
(Dollar amounts in thousands, except per share data) (Continued)
and interest under the contractual terms of the loan agreement. Cash receipts on impaired loans for which the accrual of interest has been discontinued are applied first to principal.
Large groups of smaller-balance homogeneous loans are collectively evaluated for impairment. As a result, the Company does not separately identify consumer real estate loans less than $417 or individual consumer non-real estate secured loans for impairment disclosures. The Company considers these loans to be homogeneous in nature due to the smaller dollar amount and the similar underwriting criteria.
A loan that has been modified is considered a troubled debt restructuring (“TDR”) when two conditions are met: 1) the borrower is experiencing financial difficulty and 2) concessions are made for the borrower's benefit that would not otherwise be considered for a borrower or transaction with similar credit risk characteristics. Modifications to loan terms may include a modification of the contractual interest rate to a below-market rate (even if the modified rate is higher than the original rate), forgiveness of accrued interest, forgiveness of a portion of principal, an extended repayment period or a deed in lieu of foreclosure or other transfer of assets other than cash to fully or partially satisfy a debt. The Company's policy is to place all TDRs on nonaccrual for a minimum period of six months. Loans qualify for return to accrual status once they have demonstrated performance with the restructured terms of the loan agreement for a minimum of six months and the collection of principal and interest under the revised terms is deemed probable. All TDRs are considered to be impaired loans.
FHLB stock and other restricted securities: FHLB, FRB and other restricted stock is carried at cost, classified as restricted securities and periodically evaluated for impairment based on the ultimate recoverability of the par value. Both cash and stock dividends are reported as interest income.
Bank-Owned Life Insurance: The Company has purchased life insurance policies on certain key employees. The purchase of these life insurance policies allows the Company to use tax-advantaged rates of return. Bank-owned life insurance is recorded at the amount that can be realized under the insurance contract at the balance sheet date, which is the cash surrender value adjusted for other charges or other amounts due that are probable at settlement.
Premises and Equipment: Land is carried at cost. Premises and equipment are stated at cost less accumulated depreciation. Buildings and related components are generally depreciated using the straight-line method with useful lives ranging from 10 to 30 years. Furniture, fixtures and equipment are generally depreciated using the straight-line method with useful lives ranging from 3 to 7 years. The cost of leasehold improvements is amortized over the shorter of the lease term or useful life using the straight-line method.
Goodwill: Goodwill represents the excess of the cost of businesses acquired over the fair value of the net assets acquired. According to ASC 350-20, "Intangibles- Goodwill and Other", goodwill shall be tested for impairment between annual tests if an event occurs or circumstances change that would more likely than not reduce the fair value below its carrying amount. Deterioration in economic market conditions, changes in key personnel, increased estimates of the effects of recent regulatory or legislative changes, or additional regulatory or legislative changes may result in declines in projected business performance beyond management's current expectations. Such declines in business performance could cause the estimated fair value of goodwill to decline, which could result in an impairment charge to earnings in a future period related to goodwill.
The Company evaluates goodwill for impairment on an annual basis or on an interim basis if an event occurs or circumstances change that would more likely than not reduce the fair value below its carrying amount, in accordance with ASC 350-20. During 2016, the Company changed its annual goodwill impairment testing date from December 31 to October 1. The Company believes that this new date is preferable as it provides additional time prior to the Company’s year-end to complete the annual goodwill impairment test, especially in the event of future acquisitions and growth. This change does not accelerate, delay, avoid or cause an impairment charge, nor does this change result in adjustments to previously issued financial statements.
The Company first assesses qualitative factors to determine whether it is more likely than not that the fair value of a reporting unit is less than its carrying amount as a basis for determining the need to perform the two-step test for goodwill impairment (the qualitative method). If the qualitative method cannot be used or if it determines, based on the qualified method, that the fair value is more likely than not less than the carrying amount, the Company uses the two-step test. Under the two-step test, the Company compares the estimated fair value of a reporting unit with its carrying amount, including goodwill. If the estimated fair value of a reporting unit exceeds its carrying amount, goodwill of the reporting unit is considered not impaired. If the carrying amount of a reporting unit exceeds its estimated fair value, the second step of the goodwill impairment test is performed to measure the amount of impairment loss, if any. Step two of the goodwill impairment test compares the implied estimated fair value of reporting unit goodwill with the carrying amount of that goodwill. If the carrying amount of goodwill
72
LEGACYTEXAS FINANCIAL GROUP, INC.
NOTES TO CONSOLIDATED FINANCIAL STATEMENTS
(Dollar amounts in thousands, except per share data) (Continued)
for that reporting unit exceeds the implied fair value of that unit's goodwill, an impairment loss is recognized in an amount equal to that excess. Additional information regarding goodwill and impairment testing can be found in Note 9 - Goodwill and Core Deposit Intangibles.
Identifiable Intangibles: Intangible assets are acquired assets that lack physical substance but can be distinguished from goodwill because of contractual or other legal rights or because the asset is capable of being sold or exchanged either on its own or in combination with a related contract, asset, or liability. The Company's intangible assets relate to core deposits and customer relationships. Intangible assets with definite useful lives are amortized on an accelerated basis over their estimated life. Intangible assets, premises and equipment and other long-lived assets are tested for impairment whenever events or changes in circumstances indicate the carrying amount of the assets may not be recoverable from future undiscounted cash flows. If impaired, the assets are recorded at fair value.
Foreclosed Assets: Assets acquired through loan foreclosure are initially recorded at the lower of the recorded investment in the loan at the time of foreclosure or the fair value less costs to sell, establishing a new cost basis. Any write-down in the carrying value of a property at the time of acquisition is charged-off to the allowance for loan losses. If fair value declines subsequent to foreclosure, a valuation allowance is recorded through expense. Operating costs after acquisition are expensed.
Derivative Financial Instruments: The Company enters into the following derivative financial instruments: interest rate lock commitments, forward mortgage-backed securities trades and interest rate swaps and caps. These financial instruments are not designated as hedging instruments and are used for asset and liability management and commercial customers' financing needs. All derivatives are carried at fair value in either other assets or other liabilities. For additional information on derivative financial instruments, see Note 7 — Derivative Financial Instruments.
Fair Value of Financial Instruments: In general, fair values of financial instruments are based upon quoted market prices, where available. If such quoted market prices are not available, fair value is based upon internally developed models that primarily use, as inputs, observable market-based parameters. Valuation adjustments may be made to ensure that financial instruments are recorded at fair value. These adjustments may include amounts to reflect counterparty credit quality and the Company’s creditworthiness, among other things, as well as unobservable parameters. Any such valuation adjustments are applied consistently over time. Fair value measurements and disclosures guidance establishes a three-level fair value hierarchy based on the markets in which the assets and liabilities are traded and the reliability of the assumptions used to determine fair value. For additional information on fair value measurements see Note 6 - Fair Value.
Repurchase/Resell Agreements: The Company sells certain securities under agreements to repurchase. The securities sold under these agreements are treated as collateralized borrowings and are recorded at amounts equal to the cash received. The contractual terms of the agreements to repurchase may require the Company to provide additional collateral if the fair value of the securities underlying the borrowings declines during the term of the agreement.
Brokerage Fee Income: Acting as an agent, the Company generates brokerage income by buying and selling securities on behalf of its customers through an independent third party and earning fees on the transactions. These fees are recorded on the trade date.
Advertising Expense: The Company expenses all advertising costs as they are incurred. Advertising expenses were $3,861, $3,773, and $1,535 in 2016, 2015, and 2014, respectively.
Share-Based Compensation: Compensation cost is recognized for stock options and restricted stock awards issued to employees and directors, based on the fair value of these awards at the date of grant. A Black-Scholes model is utilized to estimate the fair value of stock options, while the market price of the Company’s common stock at the date of grant is used for restricted stock awards. Compensation cost is recognized over the required service period, generally defined as the vesting period. For awards with time-based vesting, compensation cost is recognized on a straight-line basis over the requisite service period for the entire award. For awards with performance-based vesting conditions, compensation cost is recognized when the achievement of the performance condition is considered probable of achievement. If a performance condition is subsequently determined to be improbable of achievement, compensation cost is reversed.
Retirement Plans: Employee 401(k) and profit sharing plan expense is the amount of matching contributions as determined by formula. Deferred compensation and supplemental retirement plan expense allocates the benefits over years of service.
73
LEGACYTEXAS FINANCIAL GROUP, INC.
NOTES TO CONSOLIDATED FINANCIAL STATEMENTS
(Dollar amounts in thousands, except per share data) (Continued)
Income Taxes: Income tax expense is the total of the current year income tax due or refundable and the change in deferred tax assets and liabilities. Deferred tax assets and liabilities are the expected future tax amounts for the temporary differences between carrying amounts and tax bases of assets and liabilities, computed using enacted tax rates. A valuation allowance, if needed, reduces deferred tax assets to the amount expected to be realized.
A tax position is recognized as a benefit only if it is “more likely than not” that the tax position would be sustained in a tax examination, with a tax examination being presumed to occur. The amount recognized is the largest amount of tax benefit that is greater than 50% likely of being realized on examination. For tax positions not meeting the “more likely than not” test, no tax benefit is recorded. The Company did not have any material uncertain tax positions which would require accrual at December 31, 2016 or 2015.
The Company recognizes interest and/or penalties related to income tax matters in income tax expense and did not have any amounts accrued for interest and penalties for the years ended December 31, 2016 or 2015. The Company files a consolidated income tax return with its subsidiaries. Federal income tax expense or benefit has been allocated to subsidiaries on a separate return basis.
Earnings per common share: The Company calculated earnings per common share in accordance with ASC 260, “Earnings Per Share,” which provides that unvested share-based payment awards that contain nonforfeitable rights to dividends or dividend equivalents (whether paid or unpaid) are participating securities and shall be included in the computation of earnings per share pursuant to the two-class method. The Company has determined that its outstanding non-vested stock awards are participating securities. Accordingly, earnings per common share is computed using the two-class method prescribed under ASC 260.
Under the two-class method, basic earnings per common share is computed by dividing net earnings allocated to common stock by the weighted-average number of common shares outstanding during the applicable period, excluding outstanding participating securities. Diluted earnings per common share is computed using the weighted-average number of shares determined for the basic earnings per common share computation plus the dilutive effect of stock compensation using the treasury stock method. A reconciliation of the weighted-average shares used in calculating basic earnings per common share and the weighted average common shares used in calculating diluted earnings per common share for the reported periods is provided in Note 3 — Earnings Per Common Share.
Comprehensive Income (Loss): Comprehensive income (loss) consists of net income and other comprehensive income (loss). Other comprehensive income (loss) includes unrealized gains and losses on securities available for sale, net of taxes, which are also recognized as a separate component of equity.
Employee stock ownership plan (ESOP): The Company accounts for its ESOP in accordance with ASC 718-40, "Employee Stock Ownership Plans." Accordingly, since the Company sponsors the ESOP with an employer loan, neither the ESOP’s loan payable nor the Company’s loan receivable are reported in the Company’s consolidated balance sheet. Likewise, the Company does not recognize interest income or interest cost on the loan.
Unallocated shares held by the ESOP are recorded as unearned ESOP shares in the consolidated statement of changes in shareholders’ equity. As shares are committed to be released for allocation, the Company recognizes compensation expense equal to the average market price of the shares for the period. Dividends on allocated ESOP shares reduce retained earnings; dividends on unearned ESOP shares reduce principal and accrued interest payable on the ESOP loan.
Dividend Restriction: Banking regulations require maintaining certain capital levels and may limit the dividends paid by the Bank to the Company or by the Company to shareholders.
Loss Contingencies: Loss contingencies, including claims and legal actions arising in the ordinary course of business, are recorded as liabilities when the likelihood of loss is probable and an amount or range of loss can be reasonably estimated. Management does not believe there now are such matters that will have a material effect on the financial statements.
Transfers of Financial Assets: Transfers of financial assets are accounted for as sales when control over the assets has been surrendered. Control over transferred assets is deemed to be surrendered when (i) the assets have been isolated from the Company, (ii) the transferee has the right (free of conditions that constrain it from taking advantage of that right) to pledge or exchange the transferred assets, and (iii) the Company does not maintain effective control over the transferred assets through either (a) an agreement that entitles and obligates the Company to repurchase or redeem them before their maturity or (b) the ability to unilaterally cause the holder to return specific assets.
74
LEGACYTEXAS FINANCIAL GROUP, INC.
NOTES TO CONSOLIDATED FINANCIAL STATEMENTS
(Dollar amounts in thousands, except per share data) (Continued)
Operating Segments: The Company has determined that all of its banking operations comprise one segment under ASC 280, Segment Reporting, since all offer similar products and services, operate with similar processes, and have similar customers. Additionally, the Company has determined that the Bank's title and insurance subsidiaries do not meet the materiality threshold to require segment disclosure under ASC 280. In 2016, the Bank sold the operations of LegacyTexas Insurance Services, Inc.
Loan Commitments and Related Financial Instruments: Financial instruments include off-balance sheet credit instruments, such as commitments to make loans and commercial letters of credit, issued to meet customer financing needs. The face amount for these items represents the exposure to loss, before considering customer collateral or ability to repay. Such financial instruments are recorded when they are funded.
Reclassifications: Some items in the prior year financial statements were reclassified to conform to the current presentation.
Adoption of New Accounting Standards:
In June 2014, the Financial Accounting Standards Board (the "FASB") issued Accounting Standards Update ("ASU") 2014-12, Accounting for Share-Based Payments When the Terms of an Award Provide that a Performance Target Could Be Achieved after the Requisite Service Period. This ASU requires that a performance target that affects vesting and that could be achieved after the requisite service period be treated as a performance condition. The amendments were effective for annual periods, and interim periods within those years, beginning after December 15, 2015. The adoption of this ASU did not impact the Company's financial statements.
In August 2014, the FASB issued ASU 2014-15, Disclosure of Uncertainties about an Entity's Ability to Continue as a Going Concern. This ASU defines management’s responsibility to evaluate whether there is substantial doubt about an organization’s ability to continue as a going concern and to provide related disclosures in the notes to financial statements. This ASU was effective for annual periods ending after December 15, 2016, and interim periods within annual periods beginning after December 15, 2016. Management does not have substantial doubt about the Company's ability to continue as a going concern within one year after the date of these financial statements; therefore, no additional disclosure on this topic is required.
In January 2015, the FASB issued ASU 2015-01, Simplifying Income Statement Presentation by Eliminating the Concept of Extraordinary Items. This ASU simplifies income statement presentation by eliminating the need to determine whether to classify an item as an extraordinary item and retains current presentation and disclosure requirements for an event or transaction that is of an unusual nature or of a type that indicates infrequency of occurrence. Transactions that meet both criteria would now also follow such presentation and disclosure requirements. The ASU was effective in annual periods, and interim periods within those annual periods, beginning after December 15, 2015 and did not impact the Company's current disclosures.
In February 2015, the FASB issued ASU 2015-02, Amendments to the Consolidation Analysis. This ASU affects all reporting entities that have variable interests in other legal entities and, in some cases, consolidation conclusions will change. In other cases, reporting entities will need to provide additional disclosures about entities that currently are not considered variable interest entities but will be considered variable interest entities under the new guidance if they have a variable interest in those entities. Reporting entities will need to re-evaluate their consolidation conclusions and potentially revise their documentation. The ASU was effective in annual and interim periods beginning after December 15, 2015. The adoption of this ASU did not impact the Company's consolidation analysis.
In May 2015, the FASB issued ASU 2015-07, Disclosures for Investments in Certain Entities that Calculate Net Asset Value per Share. This ASU eliminates the current requirement to categorize within the fair value hierarchy investments whose fair values are measured at net asset value ("NAV"). Instead, entities will be required to disclose the fair values of such investments so that financial statement users can reconcile amounts reported in the fair value hierarchy table and the amounts reported on the balance sheet. The ASU was effective in annual and interim periods beginning after December 15, 2015. The Company does not currently have any investments measured at NAV within its fair value hierarchy and this ASU did not have an impact on the Company's statement of income or financial condition.
In September 2015, the FASB issued ASU 2015-16, Business Combinations (Topic 805): Simplifying the Accounting for Measurement-Period Adjustments. To simplify the accounting for adjustments made to provisional amounts recognized in a business combination, this ASU eliminates the requirement to retrospectively account for those adjustments. The ASU requires an entity to present separately on the face of the income statement or disclose in the notes the portion of the amount recorded in current-period earnings by line item that would have been recorded in previous reporting periods if the adjustment to the provisional amounts had been recognized as of the acquisition date. For public business entities, the amendments were
75
LEGACYTEXAS FINANCIAL GROUP, INC.
NOTES TO CONSOLIDATED FINANCIAL STATEMENTS
(Dollar amounts in thousands, except per share data) (Continued)
effective for fiscal years beginning after December 15, 2015, including interim periods within those fiscal years. The adoption of this ASU did not impact the Company's financial statements.
Effect of Newly Issued But Not Yet Effective Accounting Standards
In May 2014, the FASB issued ASU 2014-09, Revenue from Contracts with Customers. This ASU states that an entity should recognize revenue to depict the transfer of promised goods or services to customers in an amount that reflects the consideration to which the entity expects to be entitled in exchange for those goods or services. This ASU affects entities that enter into contracts with customers to transfer goods or services or enter into contracts for the transfer of nonfinancial assets, unless those contracts are within the scope of other standards. In August 2015, the FASB issued ASU 2015-14, "Revenue from Contracts with Customers (Topic 606): Deferral of the Effective Date," which deferred the effective date of ASU 2014-09 for public entities to annual reporting periods beginning after December 15, 2017, including interim reporting periods within that reporting period. Our revenue is comprised of net interest income on financial assets and financial liabilities, which is explicitly excluded from the scope of ASU 2014-09, and non-interest income. ASU 2014-09 could require us to change how we recognize certain recurring revenue streams; however, we do not expect these changes to have a significant impact on our financial statements. We continue to evaluate the impact of ASU 2014-09 on components of non-interest income. We expect to adopt the standard in the first quarter of 2018 with a cumulative effect adjustment to opening retained earnings, if such adjustment is deemed to be significant.
In January 2016, the FASB issued ASU 2016-01, Recognition and Measurements of Financial Assets and Financial Liabilities. This ASU requires that all equity investments be measured at fair value with changes in the fair value recognized through net income (other than those accounted for under the equity method of accounting or those that result in consolidation of the investee). This ASU also requires that an entity present separately in other comprehensive income the portion of the total change in the fair value of a liability resulting from a change in the instrument-specific credit risk when the entity has elected to measure the liability at fair value in accordance with the fair value option for financial instruments. In addition, this ASU eliminates the requirement to disclose the fair value of financial instruments measured at amortized cost for entities that are not public business entities and the requirement to disclose the method(s) and significant assumptions used to estimate the fair value that is required to be disclosed for financial instruments measured at amortized cost on the balance sheet for public business entities. For public business entities, this ASU is effective for annual periods beginning after December 15, 2017, and interim periods therein. The adoption of this ASU is not expected to have a significant impact on the Company's financial statements and disclosures.
In February 2016, the FASB issued ASU 2016-02, Leases. This ASU requires lessees to put most leases on their balance sheets but recognize expenses in the income statement in a manner similar to current accounting treatment. This ASU changes the guidance on sale-leaseback transactions, initial direct costs and lease execution costs, and, for lessors, modifies the classification criteria and the accounting for sales-type and direct financing leases. For public business entities, this ASU is effective for annual periods beginning after December 15, 2018, and interim periods therein. Entities are required to use a modified retrospective approach for leases that exist or are entered into after the beginning of the earliest comparative period in the financial statements. The Company is evaluating the impact of this ASU on its financial statements and disclosures.
In March 2016, the FASB issued ASU 2016-05, Effect of Derivative Contract Novations on Existing Hedge Accounting Relationships. This ASU clarifies that a change in the counterparty of a derivative contract (i.e., a novation) in a hedge accounting relationship does not, in and of itself, require dedesignation of the hedge accounting relationship. For public business entities, this ASU is effective for financial statements issued for fiscal years beginning after December 15, 2016, and interim periods therein. The adoption of this ASU is not expected to have a significant impact on the Company's financial statements and disclosures.
In March 2016, the FASB issued ASU 2016-06, Contingent Put and Call Options in Debt Instruments. This ASU clarifies the requirements for assessing whether contingent call (put) options that can accelerate the payment of principal on debt instruments are clearly and closely related to their debt hosts. An entity performing the assessment under this ASU is required to assess the embedded call (put) options solely in accordance with the four-step decision sequence. The amendments apply to all entities that are issuers of or investors in debt instruments (or hybrid financial instruments that are determined to have a debt host) with embedded call (put) options. For public business entities, this ASU is effective for financial statements issued for fiscal years beginning after December 15, 2016, and interim periods therein. The adoption of this ASU is not expected to have a significant impact on the Company's financial statements and disclosures.
76
LEGACYTEXAS FINANCIAL GROUP, INC.
NOTES TO CONSOLIDATED FINANCIAL STATEMENTS
(Dollar amounts in thousands, except per share data) (Continued)
In March 2016, the FASB issued ASU 2016-07, Simplifying the Transition to the Equity Method of Accounting. This ASU eliminates the requirement for an investor to retrospectively apply the equity method when an investment that it had accounted for by another method qualifies for use of the equity method. This ASU is effective for fiscal years beginning after December 15, 2016, and interim periods therein. The adoption of this ASU is not expected to have a significant impact on the Company's financial statements.
In March 2016, the FASB issued ASU 2016-09, Improvements to Employee Share-Based Payment Accounting. This ASU simplifies several aspects of the accounting for employee share-based payment transactions, including the income tax consequences, classification of awards as either equity or liabilities, and classification on the statement of cash flows. For public business entities, this ASU is effective for financial statements issued for fiscal years beginning after December 15, 2016, and interim periods therein. The adoption of this ASU is not expected to have a significant impact on the Company's financial statements.
In June 2016, the FASB issued ASU 2016-13, Measurement of Credit Losses on Financial Instruments. This ASU removes the thresholds that companies apply to measure credit losses on financial instruments measured at amortized cost, such as loans, receivables, and held-to-maturity debt securities. Under current US GAAP, companies generally recognize credit losses when it is probable that the loss has been incurred. This revised guidance will remove all recognition thresholds and will require companies to recognize an allowance for lifetime expected credit losses. Credit losses will be immediately recognized through net income; the amount recognized will be based on the current estimate of contractual cash flows not expected to be collected over the financial asset’s contractual term. ASU 2016-13 also amends the credit loss measurement guidance for available for sale debt securities. For public business entities, this ASU is effective for financial statements issued for fiscal years and for interim periods within those fiscal years beginning after December 15, 2019. The Company is evaluating the impact of this ASU on its financial statements and disclosures.
In August 2016, the FASB issued ASU 2016-15, Classification of Certain Cash Receipts and Cash Payments. This ASU is intended to reduce diversity in practice in how certain transactions are classified in the statement of cash flows, including debt prepayment or debt extinguishment costs, settlement of zero-coupon debt instruments, contingent consideration payments made after a business combination, proceeds from the settlement of insurance claims, and distributions received from equity method investments. For public business entities, this ASU is effective for financial statements issued for fiscal years beginning after December 15, 2017, and interim periods therein. The adoption of this ASU is not expected to have a significant impact on the Company's financial statements.
In October 2016, the FASB issued ASU 2016-16, Intra-Entity Transfers of Assets other than Inventory. This ASU eliminates the exception for all intra-entity sales of assets other than inventory. As a result, a reporting entity would recognize the tax expense from the sale of the asset in the seller’s tax jurisdiction when the transfer occurs, even though the pre-tax effects of that transaction are eliminated in consolidation. Any deferred tax asset that arises in the buyer’s jurisdiction would also be recognized at the time of the transfer. For public business entities, this ASU is effective for financial statements issued for fiscal years beginning after December 15, 2017, and interim periods therein. The adoption of this ASU is not expected to have a significant impact on the Company's financial statements.
77
LEGACYTEXAS FINANCIAL GROUP, INC.
NOTES TO CONSOLIDATED FINANCIAL STATEMENTS
(Dollar amounts in thousands, except per share data) (Continued)
Note 2 - Share Transactions
On August 22, 2012, the Company announced its intention to repurchase up to 5% of its total common shares outstanding, or approximately 1,978,871 shares. The stock repurchase program, which is open-ended, allows the Company to repurchase its shares from time to time in the open market and in negotiated transactions, depending upon market conditions. The Board of Directors of the Company also authorized management to enter into a trading plan with Sandler O'Neill & Partners, LP in accordance with Rule 10b5-1 of the Securities Exchange Act of 1934, as amended (the “Act”), to facilitate repurchases of its common stock pursuant to the above mentioned stock repurchase program (the “Rule 10b5-1 plan”). Stock repurchases under this program were suspended in November 2013 as a result of the Company's announced acquisition of LegacyTexas Group, Inc., which automatically triggered termination of the 10b5-1 plan. At the time the stock repurchase program was suspended, 83,800 shares were repurchased during 2013 at a weighted average price per share of $18.55.
Upon completion of the acquisition of LegacyTexas Group, Inc. on January 1, 2015, the Company entered into a new trading plan with Sandler O’Neill & Partners, LP to facilitate repurchases of its common stock pursuant to the above mentioned stock repurchase program. During 2015, 357,950 shares were repurchased and retired at an average price of $22.32.
On March 1, 2016, the Company announced the resumption of the above mentioned stock repurchase program and again entered into a new 10b5-1 plan with Sandler O’Neill & Partners, LP. No shares of Company stock were repurchased under this program in 2016, and 1,537,121 shares remain available for future repurchases under the program.
78
LEGACYTEXAS FINANCIAL GROUP, INC.
NOTES TO CONSOLIDATED FINANCIAL STATEMENTS
(Dollar amounts in thousands, except per share data) (Continued)
Note 3 — Earnings Per Common Share
Basic earnings per common share is computed by dividing net income (which has been adjusted for distributed and undistributed earnings to participating securities) by the weighted-average number of common shares outstanding for the period, reduced for average unallocated ESOP shares and average unvested restricted stock awards. Unvested share-based awards that contain nonforfeitable rights to dividends or dividend equivalents (whether paid or unpaid) are participating securities and shall be included in the computation of earnings per share pursuant to the two-class method described in ASC 260-10-45-60B. Diluted earnings per common share reflects the potential dilution that could occur if securities or other contracts to issue common stock (such as stock awards and options) were exercised or converted to common stock, or resulted in the issuance of common stock that then shared in the Company’s earnings. Diluted earnings per common share is computed by dividing net income by the weighted-average number of common shares outstanding for the period increased for the dilutive effect of unexercised stock options and unvested restricted stock awards. The dilutive effect of the unexercised stock options and unvested restricted stock awards is calculated under the treasury stock method utilizing the average market value of the Company’s stock for the period. A reconciliation of the numerator and denominator of the basic and diluted earnings per common share computation for the years ended December 31, 2016, 2015 and 2014 is as follows:
Years Ended December 31, | |||||||||||
2016 | 2015 | 2014 | |||||||||
Basic earnings per share: | |||||||||||
Numerator: | |||||||||||
Net income | $ | 97,821 | $ | 70,916 | $ | 31,278 | |||||
Distributed and undistributed earnings to participating securities | (497 | ) | (534 | ) | (336 | ) | |||||
Income available to common shareholders | $ | 97,324 | $ | 70,382 | $ | 30,942 | |||||
Denominator: | |||||||||||
Weighted average common shares outstanding | 47,721,179 | 47,659,389 | 39,979,853 | ||||||||
Less: Average unallocated ESOP shares | (1,301,356 | ) | (1,464,324 | ) | (1,648,518 | ) | |||||
Average unvested restricted stock awards | (235,749 | ) | (347,781 | ) | (412,270 | ) | |||||
Average shares for basic earnings per share | 46,184,074 | 45,847,284 | 37,919,065 | ||||||||
Basic earnings per common share | $ | 2.11 | $ | 1.54 | $ | 0.82 | |||||
Diluted earnings per share: | |||||||||||
Numerator: | |||||||||||
Income available to common shareholders | $ | 97,324 | $ | 70,382 | $ | 30,942 | |||||
Denominator: | |||||||||||
Average shares for basic earnings per share | 46,184,074 | 45,847,284 | 37,919,065 | ||||||||
Dilutive effect of share-based compensation plan | 300,893 | 278,163 | 243,029 | ||||||||
Average shares for diluted earnings per share | 46,484,967 | 46,125,447 | 38,162,094 | ||||||||
Diluted earnings per common share | $ | 2.09 | $ | 1.53 | $ | 0.81 | |||||
Share awards excluded in the computation of diluted earnings per share because the exercise price was greater than the common stock average market price and were therefore anti-dilutive | 1,384,784 | 1,012,771 | 412,706 | ||||||||
79
LEGACYTEXAS FINANCIAL GROUP, INC.
NOTES TO CONSOLIDATED FINANCIAL STATEMENTS
(Dollar amounts in thousands, except per share data) (Continued)
Note 4 - Securities
The amortized cost, related gross unrealized gains and losses recognized in accumulated other comprehensive income (loss), and the fair value of securities available for sale were as follows:
December 31, 2016 | Amortized Cost | Gross Unrealized Gains | Gross Unrealized Losses | Fair Value | |||||||||||
Agency residential mortgage-backed securities 1 | $ | 220,744 | $ | 635 | $ | 2,828 | $ | 218,551 | |||||||
Agency commercial mortgage-backed securities 1 | 9,422 | — | 75 | 9,347 | |||||||||||
Agency residential collateralized mortgage obligations 1 | 87,959 | 22 | 1,452 | 86,529 | |||||||||||
US government and agency securities | 2,150 | 101 | — | 2,251 | |||||||||||
Municipal bonds | 38,417 | 47 | 627 | 37,837 | |||||||||||
Total securities | $ | 358,692 | $ | 805 | $ | 4,982 | $ | 354,515 | |||||||
December 31, 2015 | |||||||||||||||
Agency residential mortgage-backed securities 1 | $ | 224,582 | $ | 841 | $ | 1,575 | $ | 223,848 | |||||||
Agency commercial mortgage-backed securities 1 | 9,483 | — | 66 | 9,417 | |||||||||||
Agency residential collateralized mortgage obligations 1 | 22,430 | 26 | 142 | 22,314 | |||||||||||
US government and agency securities | 14,906 | 148 | — | 15,054 | |||||||||||
Municipal bonds | 40,512 | 637 | 74 | 41,075 | |||||||||||
Total securities | $ | 311,913 | $ | 1,652 | $ | 1,857 | $ | 311,708 | |||||||
1 Mortgage-backed securities and collateralized mortgage obligations are issued and/or guaranteed by U.S. government agencies or U.S. government-sponsored enterprises.
The amortized cost (carrying amount), unrealized gains and losses, and fair value of securities held to maturity were as follows:
December 31, 2016 | Amortized Cost | Gross Unrealized Gains | Gross Unrealized Losses | Fair Value | |||||||||||
Agency residential mortgage-backed securities 1 | $ | 74,881 | $ | 1,147 | $ | 817 | $ | 75,211 | |||||||
Agency commercial mortgage-backed securities 1 | 28,023 | 836 | 166 | 28,693 | |||||||||||
Agency residential collateralized mortgage obligations 1 | 40,707 | 697 | 33 | 41,371 | |||||||||||
Municipal bonds | 66,776 | 1,635 | 705 | 67,706 | |||||||||||
Total securities | $ | 210,387 | $ | 4,315 | $ | 1,721 | $ | 212,981 | |||||||
December 31, 2015 | |||||||||||||||
Agency residential mortgage-backed securities 1 | $ | 87,935 | $ | 1,837 | $ | 284 | $ | 89,488 | |||||||
Agency commercial mortgage-backed securities 1 | 24,848 | 913 | 64 | 25,697 | |||||||||||
Agency residential collateralized mortgage obligations 1 | 59,174 | 1,087 | 55 | 60,206 | |||||||||||
Municipal bonds | 68,476 | 3,447 | 112 | 71,811 | |||||||||||
Total securities | $ | 240,433 | $ | 7,284 | $ | 515 | $ | 247,202 | |||||||
1 Mortgage-backed securities and collateralized mortgage obligations are issued and/or guaranteed by U.S. government agencies or U.S. government-sponsored enterprises.
80
LEGACYTEXAS FINANCIAL GROUP, INC.
NOTES TO CONSOLIDATED FINANCIAL STATEMENTS
(Dollar amounts in thousands, except per share data) (Continued)
The amortized cost (carrying amount) and fair value of held to maturity debt securities and the fair value of available for sale debt securities at December 31, 2016 by contractual maturity are set forth below in the table below. Securities with contractual payments not due at a single maturity date, including mortgage backed securities and collateralized mortgage obligations, are shown separately.
Held to maturity | Available for sale | ||||||||||
Carrying Amount | Fair Value | Fair Value | |||||||||
Due in one year or less | $ | 1,952 | $ | 1,965 | $ | 2,159 | |||||
Due after one to five years | 9,035 | 9,293 | 11,909 | ||||||||
Due after five to ten years | 48,327 | 49,226 | 17,648 | ||||||||
Due after ten years | 7,462 | 7,222 | 8,372 | ||||||||
Agency residential mortgage-backed securities | 74,881 | 75,211 | 218,551 | ||||||||
Agency commercial mortgage-backed securities | 28,023 | 28,693 | 9,347 | ||||||||
Agency residential collateralized mortgage obligations | 40,707 | 41,371 | 86,529 | ||||||||
Total | $ | 210,387 | $ | 212,981 | $ | 354,515 | |||||
Securities with a carrying value of $224,674 and $280,629 at December 31, 2016 and 2015, respectively, were pledged to secure public deposits, repurchase agreements and for other purposes required or permitted by law.
At December 31, 2016 and 2015, there were no holdings of securities of any one issuer, other than the U.S. Government and its agencies or U.S. Government Sponsored Enterprises, in an amount greater than 10% of shareholders’ equity.
Sales activity of securities for the years ended December 31, 2016, 2015 and 2014 was as follows. All securities sold were classified as available for sale.
December 31, | |||||||||||
2016 | 2015 | 2014 | |||||||||
Proceeds | $ | 7,700 | $ | 36,984 | $ | — | |||||
Gross gains | 72 | 278 | — | ||||||||
Gross losses | 7 | 50 | — | ||||||||
Tax expense of securities gains/losses reclassified from accumulated other comprehensive income | 23 | 80 | — | ||||||||
81
LEGACYTEXAS FINANCIAL GROUP, INC.
NOTES TO CONSOLIDATED FINANCIAL STATEMENTS
(Dollar amounts in thousands, except per share data) (Continued)
Securities with unrealized losses at December 31, 2016 and 2015, aggregated by investment category and length of time that individual securities have been in a continuous unrealized loss position, were as follows:
AFS | Less than 12 Months | 12 Months or More | Total | ||||||||||||||||||||
December 31, 2016 | Fair Value | Unrealized Loss | Fair Value | Unrealized Loss | Fair Value | Unrealized Loss | |||||||||||||||||
Agency residential mortgage-backed securities 1 | $ | 167,503 | $ | 2,770 | $ | 7,516 | $ | 58 | $ | 175,019 | $ | 2,828 | |||||||||||
Agency commercial mortgage-backed securities 1 | 9,347 | 75 | — | — | 9,347 | 75 | |||||||||||||||||
Agency residential collateralized mortgage obligations 1 | 72,822 | 1,420 | 2,649 | 32 | 75,471 | 1,452 | |||||||||||||||||
Municipal bonds | 26,911 | 512 | 3,412 | 115 | 30,323 | 627 | |||||||||||||||||
Total temporarily impaired | $ | 276,583 | $ | 4,777 | $ | 13,577 | $ | 205 | $ | 290,160 | $ | 4,982 | |||||||||||
December 31, 2015 | |||||||||||||||||||||||
Agency residential mortgage-backed securities 1 | $ | 158,172 | $ | 1,353 | $ | 10,474 | $ | 222 | $ | 168,646 | $ | 1,575 | |||||||||||
Agency commercial mortgage-backed securities 1 | 9,417 | 66 | — | — | 9,417 | 66 | |||||||||||||||||
Agency residential collateralized mortgage obligations 1 | 13,517 | 81 | 6,992 | 61 | 20,509 | 142 | |||||||||||||||||
Municipal bonds | 7,249 | 74 | — | — | 7,249 | 74 | |||||||||||||||||
Total temporarily impaired | $ | 188,355 | $ | 1,574 | $ | 17,466 | $ | 283 | $ | 205,821 | $ | 1,857 | |||||||||||
HTM | Less than 12 Months | 12 Months or More | Total | ||||||||||||||||||||
December 31, 2016 | Fair Value | Unrealized Loss | Fair Value | Unrealized Loss | Fair Value | Unrealized Loss | |||||||||||||||||
Agency residential mortgage-backed securities 1 | $ | 41,375 | $ | 817 | $ | — | $ | — | $ | 41,375 | $ | 817 | |||||||||||
Agency commercial mortgage-backed securities 1 | 7,273 | 166 | — | — | 7,273 | 166 | |||||||||||||||||
Agency residential collateralized mortgage obligations 1 | 6,322 | 11 | 1,451 | 22 | 7,773 | 33 | |||||||||||||||||
Municipal bonds | 19,362 | 658 | 1,045 | 47 | 20,407 | 705 | |||||||||||||||||
Total temporarily impaired | $ | 74,332 | $ | 1,652 | $ | 2,496 | $ | 69 | $ | 76,828 | $ | 1,721 | |||||||||||
December 31, 2015 | |||||||||||||||||||||||
Agency residential mortgage-backed securities 1 | $ | 41,935 | $ | 284 | $ | — | $ | — | $ | 41,935 | $ | 284 | |||||||||||
Agency commercial mortgage-backed securities 1 | 3,805 | 64 | — | — | 3,805 | 64 | |||||||||||||||||
Agency residential collateralized mortgage obligations 1 | 3,714 | 6 | 3,060 | 49 | 6,774 | 55 | |||||||||||||||||
Municipal bonds | 1,638 | 10 | 6,369 | 102 | 8,007 | 112 | |||||||||||||||||
Total temporarily impaired | $ | 51,092 | $ | 364 | $ | 9,429 | $ | 151 | $ | 60,521 | $ | 515 | |||||||||||
1 Mortgage-backed securities and collateralized mortgage obligations are issued and/or guaranteed by U.S. government agencies or U.S. government-sponsored enterprises.
As of December 31, 2016, 241 securities had unrealized losses, 21 of which had been in an unrealized loss position for over 12 months at December 31, 2016. The Company does not believe these unrealized losses are other-than-temporary and at December 31, 2016 had the intent and ability to retain its investment in the issuer for a period of time sufficient to allow for any anticipated recovery in fair value. All principal and interest payments are being received on time and in full.
82
LEGACYTEXAS FINANCIAL GROUP, INC.
NOTES TO CONSOLIDATED FINANCIAL STATEMENTS
(Dollar amounts in thousands, except per share data) (Continued)
Note 5 - Loans
Loans consist of the following:
December 31, 2016 | December 31, 2015 | ||||||
Loans held for sale | $ | 21,279 | $ | 22,535 | |||
Loans held for investment: | |||||||
Commercial real estate | $ | 2,670,455 | $ | 2,177,543 | |||
Commercial and industrial | 1,971,160 | 1,612,669 | |||||
Construction and land | 294,894 | 269,708 | |||||
Consumer real estate | 1,074,923 | 936,757 | |||||
Other consumer | 53,991 | 69,830 | |||||
Gross loans held for investment, excluding Warehouse Purchase Program | 6,065,423 | 5,066,507 | |||||
Net of: | |||||||
Deferred fees and discounts, net | (2,251 | ) | (1,860 | ) | |||
Allowance for loan losses | (64,576 | ) | (47,093 | ) | |||
Net loans held for investment, excluding Warehouse Purchase Program | 5,998,596 | 5,017,554 | |||||
Warehouse Purchase Program | 1,055,341 | 1,043,719 | |||||
Total loans held for investment | $ | 7,053,937 | $ | 6,061,273 | |||
Activity in the allowance for loan losses for the years ended December 31, 2016, 2015 and 2014, segregated by portfolio segment and evaluation for impairment, is set forth below. The below activity does not include Warehouse Purchase Program loans, which are collectively evaluated for impairment and are purchased under several contractual requirements, providing safeguards to the Company. To date, the Company has not experienced a loss on these loans and no allowance for loan losses has been allocated to them. At December 31, 2016, 2015 and 2014, the allowance for loan impairment related to purchased credit impaired ("PCI") loans totaled $180, $150, and $180, respectively.
December 31, 2016 | Commercial Real Estate | Commercial and Industrial | Construction and Land | Consumer Real Estate | Other Consumer | Total | ||||||||||||||||||
Allowance for loan losses: | ||||||||||||||||||||||||
Beginning balance - January 1, 2016 | $ | 14,123 | $ | 24,975 | $ | 3,013 | $ | 3,992 | $ | 990 | $ | 47,093 | ||||||||||||
Charge-offs | (79 | ) | (7,746 | ) | — | (107 | ) | (927 | ) | (8,859 | ) | |||||||||||||
Recoveries | 21 | 472 | — | 109 | 340 | 942 | ||||||||||||||||||
Provision expense | 4,238 | 17,763 | 2,062 | 490 | 847 | 25,400 | ||||||||||||||||||
Ending balance - December 31, 2016 | $ | 18,303 | $ | 35,464 | $ | 5,075 | $ | 4,484 | $ | 1,250 | $ | 64,576 | ||||||||||||
Allowance ending balance: | ||||||||||||||||||||||||
Individually evaluated for impairment | $ | 300 | $ | 4,521 | $ | — | $ | 138 | $ | 52 | $ | 5,011 | ||||||||||||
Collectively evaluated for impairment | 18,003 | 30,943 | 5,075 | 4,346 | 1,198 | 59,565 | ||||||||||||||||||
Loans: | ||||||||||||||||||||||||
Individually evaluated for impairment | 5,195 | 86,664 | 11,385 | 3,300 | 75 | 106,619 | ||||||||||||||||||
Collectively evaluated for impairment | 2,659,644 | 1,884,263 | 283,509 | 1,070,732 | 53,683 | 5,951,831 | ||||||||||||||||||
PCI loans | 5,616 | 233 | — | 891 | 233 | 6,973 | ||||||||||||||||||
Ending balance | $ | 2,670,455 | $ | 1,971,160 | $ | 294,894 | $ | 1,074,923 | $ | 53,991 | $ | 6,065,423 | ||||||||||||
83
LEGACYTEXAS FINANCIAL GROUP, INC.
NOTES TO CONSOLIDATED FINANCIAL STATEMENTS
(Dollar amounts in thousands, except per share data) (Continued)
December 31, 2015 | Commercial Real Estate | Commercial and Industrial | Construction and Land | Consumer Real Estate | Other Consumer | Total | ||||||||||||||||||
Allowance for loan losses: | ||||||||||||||||||||||||
Beginning balance - January 1, 2015 | $ | 11,830 | $ | 9,068 | $ | 174 | $ | 4,069 | $ | 408 | $ | 25,549 | ||||||||||||
Charge-offs | (167 | ) | (3,129 | ) | — | (321 | ) | (1,090 | ) | (4,707 | ) | |||||||||||||
Recoveries | 29 | 246 | — | 85 | 426 | 786 | ||||||||||||||||||
Provision expense | 2,431 | 18,790 | 2,839 | 159 | 1,246 | 25,465 | ||||||||||||||||||
Ending balance - December 31, 2015 | $ | 14,123 | $ | 24,975 | $ | 3,013 | $ | 3,992 | $ | 990 | $ | 47,093 | ||||||||||||
Allowance ending balance: | ||||||||||||||||||||||||
Individually evaluated for impairment | $ | 366 | $ | 1,470 | $ | — | $ | 81 | $ | 61 | $ | 1,978 | ||||||||||||
Collectively evaluated for impairment | 13,757 | 23,505 | 3,013 | 3,911 | 929 | 45,115 | ||||||||||||||||||
Loans: | ||||||||||||||||||||||||
Individually evaluated for impairment | 11,580 | 16,906 | 33 | 4,767 | 120 | 33,406 | ||||||||||||||||||
Collectively evaluated for impairment | 2,155,351 | 1,595,548 | 269,675 | 931,140 | 69,433 | 5,021,147 | ||||||||||||||||||
PCI loans | 10,612 | 215 | — | 850 | 277 | 11,954 | ||||||||||||||||||
Ending balance | $ | 2,177,543 | $ | 1,612,669 | $ | 269,708 | $ | 936,757 | $ | 69,830 | $ | 5,066,507 | ||||||||||||
December 31, 2014 | Commercial Real Estate | Commercial and Industrial | Construction and Land | Consumer Real Estate | Other Consumer | Total | ||||||||||||||||||
Allowance for loan losses: | ||||||||||||||||||||||||
Beginning balance - January 1, 2014 | $ | 10,944 | $ | 4,536 | $ | 212 | $ | 3,280 | $ | 386 | $ | 19,358 | ||||||||||||
Charge-offs | — | (568 | ) | (51 | ) | (237 | ) | (605 | ) | (1,461 | ) | |||||||||||||
Recoveries | 435 | 94 | 1 | 38 | 363 | 931 | ||||||||||||||||||
Provision expense | 451 | 5,006 | 12 | 988 | 264 | 6,721 | ||||||||||||||||||
Ending balance - December 31, 2014 | $ | 11,830 | $ | 9,068 | $ | 174 | $ | 4,069 | $ | 408 | $ | 25,549 | ||||||||||||
Allowance ending balance: | ||||||||||||||||||||||||
Individually evaluated for impairment | $ | 826 | $ | 1,840 | $ | — | $ | 223 | $ | 6 | $ | 2,895 | ||||||||||||
Collectively evaluated for impairment | 11,004 | 7,228 | 174 | 3,846 | 402 | 22,654 | ||||||||||||||||||
Loans: | ||||||||||||||||||||||||
Individually evaluated for impairment | 7,405 | 5,929 | 103 | 5,607 | 284 | 19,328 | ||||||||||||||||||
Collectively evaluated for impairment | 1,253,336 | 775,699 | 21,195 | 517,492 | 40,042 | 2,607,764 | ||||||||||||||||||
PCI loans | 5,127 | 196 | — | 1,100 | 165 | 6,588 | ||||||||||||||||||
Ending balance | $ | 1,265,868 | $ | 781,824 | $ | 21,298 | $ | 524,199 | $ | 40,491 | $ | 2,633,680 | ||||||||||||
Changes in the allowance for off-balance sheet credit losses on lending-related commitments, included in "accrued expenses and other liabilities" on the consolidated balance sheets, are summarized in the following table. Please see Note 17 - Commitments and Contingent Liabilities for more information.
Year Ended December 31, 2016 | ||||
Balance at beginning of period | $ | — | ||
Charge-offs on lending-related commitments | — | |||
Provision for credit losses on lending-related commitments | 1,500 | |||
Balance at end of period | $ | 1,500 | ||
84
LEGACYTEXAS FINANCIAL GROUP, INC.
NOTES TO CONSOLIDATED FINANCIAL STATEMENTS
(Dollar amounts in thousands, except per share data) (Continued)
Impaired loans at December 31, 2016 and 2015, were as follows 1:
December 31, 2016 | Unpaid Principal Balance | Recorded Investment With No Allowance | Recorded Investment With Allowance | Total Recorded Investment | Related Allowance | |||||||||||||||
Commercial real estate | $ | 5,388 | $ | 4,429 | $ | 766 | $ | 5,195 | $ | 272 | ||||||||||
Commercial and industrial | 87,756 | 73,377 | 13,287 | 86,664 | 4,519 | |||||||||||||||
Construction and land | 11,384 | 11,385 | — | 11,385 | — | |||||||||||||||
Consumer real estate | 3,766 | 3,290 | 10 | 3,300 | 10 | |||||||||||||||
Other consumer | 107 | 33 | 42 | 75 | 30 | |||||||||||||||
Total | $ | 108,401 | $ | 92,514 | $ | 14,105 | $ | 106,619 | $ | 4,831 | ||||||||||
December 31, 2015 | ||||||||||||||||||||
Commercial real estate | $ | 11,682 | $ | 10,618 | $ | 962 | $ | 11,580 | $ | 303 | ||||||||||
Commercial and industrial | 18,649 | 13,894 | 3,012 | 16,906 | 1,467 | |||||||||||||||
Construction and land | 38 | 33 | — | 33 | — | |||||||||||||||
Consumer real estate | 5,327 | 4,754 | 13 | 4,767 | 13 | |||||||||||||||
Other consumer | 199 | 49 | 71 | 120 | 45 | |||||||||||||||
Total | $ | 35,895 | $ | 29,348 | $ | 4,058 | $ | 33,406 | $ | 1,828 | ||||||||||
1 No Warehouse Purchase Program loans were impaired at December 31, 2016 or 2015. Loans reported do not include PCI loans.
Income on impaired loans at December 31, 2016, 2015 and 2014, was as follows1
December 31, 2016 | December 31, 2015 | December 31, 2014 | |||||||||||||||||||||
Average Recorded Investment | Interest Income Recognized | Average Recorded Investment | Interest Income Recognized | Average Recorded Investment | Interest Income Recognized | ||||||||||||||||||
Commercial real estate | $ | 5,240 | $ | 9 | $ | 8,178 | $ | 24 | $ | 8,128 | $ | 23 | |||||||||||
Commercial and industrial | 28,634 | 1 | 19,595 | 8 | 6,119 | 11 | |||||||||||||||||
Construction and land | 901 | — | 84 | — | 54 | — | |||||||||||||||||
Consumer real estate | 4,831 | 14 | 5,269 | 7 | 5,008 | 26 | |||||||||||||||||
Other consumer | 95 | 4 | 202 | 2 | 433 | 5 | |||||||||||||||||
Total | $ | 39,701 | $ | 28 | $ | 33,328 | $ | 41 | $ | 19,742 | $ | 65 | |||||||||||
1 Loans reported do not include PCI loans.
85
LEGACYTEXAS FINANCIAL GROUP, INC.
NOTES TO CONSOLIDATED FINANCIAL STATEMENTS
(Dollar amounts in thousands, except per share data) (Continued)
Loans past due over 90 days that were still accruing interest totaled $141 and $111 at December 31, 2016 and 2015, which consisted entirely of PCI loans. At December 31, 2016, no PCI loans were considered non-performing loans. No Warehouse Purchase Program loans were non-performing at December 31, 2016 or 2015. Non-performing (nonaccrual) loans were as follows:
December 31, | |||||||
2016 | 2015 | ||||||
Commercial real estate | $ | 5,195 | $ | 11,418 | |||
Commercial and industrial | 86,664 | 16,877 | |||||
Construction and land | 11,385 | 33 | |||||
Consumer real estate | 7,987 | 9,781 | |||||
Other consumer | 158 | 107 | |||||
Total | $ | 111,389 | $ | 38,216 | |||
For the years ended December 31, 2016, 2015 and 2014, gross interest income which would have been recorded had the non-accruing loans been current in accordance with their original terms amounted to $1,746, $1,594 and $1,192, respectively. No interest income was recorded on these loans for the years ended December 31, 2016, 2015 and 2014.
The outstanding balances of TDRs are shown below:
December 31, | |||||||
2016 | 2015 | ||||||
Nonaccrual TDRs (1) | $ | 11,701 | $ | 6,207 | |||
Performing TDRs (2) | 454 | 605 | |||||
Total | $ | 12,155 | $ | 6,812 | |||
Specific reserves on TDRs | $ | 1,686 | $ | 487 | |||
Outstanding commitments to lend additional funds to borrowers with TDR loans | — | — | |||||
1 Nonaccrual TDR loans are included in the nonaccrual loan totals.
2 Performing TDR loans are loans that have been performing under the restructured terms for at least six months and the Company is accruing interest on these loans.
86
LEGACYTEXAS FINANCIAL GROUP, INC.
NOTES TO CONSOLIDATED FINANCIAL STATEMENTS
(Dollar amounts in thousands, except per share data) (Continued)
The following table provides the recorded balances of loans modified as a TDR during the years ended December 31, 2016, 2015 and 2014.
December 31, 2016 | Principal Deferrals 1 | Combination of Rate Reduction & Principal Deferral | Other | Total | |||||||||||
Commercial and industrial | $ | 685 | $ | — | $ | 7,090 | (2) | $ | 7,775 | ||||||
Consumer real estate | — | 79 | — | 79 | |||||||||||
Other consumer | 1 | — | — | 1 | |||||||||||
Total | $ | 686 | $ | 79 | $ | 7,090 | $ | 7,855 | |||||||
December 31, 2015 | |||||||||||||||
Commercial real estate | $ | 100 | $ | — | $ | — | $ | 100 | |||||||
Commercial and industrial | — | — | 191 | 191 | |||||||||||
Consumer real estate | 209 | 60 | 36 | 305 | |||||||||||
Other consumer | 1 | — | 3 | 4 | |||||||||||
Total | $ | 310 | $ | 60 | $ | 230 | $ | 600 | |||||||
December 31, 2014 | |||||||||||||||
Commercial and industrial | $ | 28 | $ | — | $ | 1,750 | $ | 1,778 | |||||||
Construction and land | — | — | 102 | 102 | |||||||||||
Consumer real estate | 197 | 262 | 461 | 920 | |||||||||||
Other consumer | 11 | 6 | — | 17 | |||||||||||
Total | $ | 236 | $ | 268 | $ | 2,313 | $ | 2,817 | |||||||
1 Principal deferrals include Chapter 7 bankruptcy loans for which the court has discharged the borrower's obligation and the borrower has not reaffirmed the debt. Such loans are placed on non-accrual status.
2 Includes a $6.2 million reserve-based energy relationship; the primary modification to this relationship was suspension of required borrowing base payments.
Loans modified as a TDR during the years ended December 31, 2016, 2015 and 2014, which experienced a subsequent payment default during the periods, are shown below. A payment default is defined as a loan that was 90 days or more past due.
Years Ended December 31, | |||||||||||
2016 | 2015 | 2014 | |||||||||
Consumer real estate | $ | 31 | $ | 178 | $ | 107 | |||||
Loans acquired with evidence of credit quality deterioration at acquisition, for which it was probable that the Company would not be able to collect all contractual amounts due, were accounted for as PCI loans. The carrying amount of PCI loans included in the consolidated balance sheets and the related outstanding balances at December 31, 2016 and 2015 are set forth in the table below. The outstanding balance represents the total amount owed, including accrued but unpaid interest, and any amounts previously charged off.
December 31, | |||||||
2016 | 2015 | ||||||
Carrying amount 1 | $ | 6,793 | $ | 11,804 | |||
Outstanding balance | 7,597 | 13,053 | |||||
1 The carrying amounts are reported net of allowance for loan losses of $180 and $150 as of December 31, 2016 and 2015.
87
LEGACYTEXAS FINANCIAL GROUP, INC.
NOTES TO CONSOLIDATED FINANCIAL STATEMENTS
(Dollar amounts in thousands, except per share data) (Continued)
Changes in the accretable yield for PCI loans for the years ended December 31, 2016 and 2015, are as follows:
December 31, | |||||||
2016 | 2015 | ||||||
Balance at beginning of period | $ | 3,356 | $ | 2,100 | |||
Additions | — | 1,907 | |||||
Reclassifications (to) from nonaccretable | 429 | 1,754 | |||||
Disposals | (359 | ) | (1,007 | ) | |||
Accretion | (911 | ) | (1,398 | ) | |||
Balance at end of period | $ | 2,515 | $ | 3,356 | |||
Below is an analysis of the age of recorded investment in loans that were past due at December 31, 2016 and 2015. No Warehouse Purchase Program loans were delinquent at December 31, 2016 or 2015 and therefore are not included in the following table.
December 31, 2016 | 30-59 Days Past Due | 60-89 Days Past Due | 90 Days and Greater Past Due | Total Loans Past Due | Current Loans 1 | Total Loans | ||||||||||||||||||
Commercial real estate | $ | 1,829 | $ | 72 | $ | 766 | $ | 2,667 | $ | 2,667,788 | $ | 2,670,455 | ||||||||||||
Commercial and industrial | 20,910 | 495 | 46 | 21,451 | 1,949,709 | 1,971,160 | ||||||||||||||||||
Construction and land | 19,517 | 283 | — | 19,800 | 275,094 | 294,894 | ||||||||||||||||||
Consumer real estate | 10,487 | 1,916 | 1,199 | 13,602 | 1,061,321 | 1,074,923 | ||||||||||||||||||
Other consumer | 1,523 | 31 | 6 | 1,560 | 52,431 | 53,991 | ||||||||||||||||||
Total | $ | 54,266 | $ | 2,797 | $ | 2,017 | $ | 59,080 | $ | 6,006,343 | $ | 6,065,423 | ||||||||||||
December 31, 2015 | ||||||||||||||||||||||||
Commercial real estate | $ | 16 | $ | 176 | $ | 10,269 | $ | 10,461 | $ | 2,167,082 | $ | 2,177,543 | ||||||||||||
Commercial and industrial | 884 | 670 | 12,255 | 13,809 | 1,598,860 | 1,612,669 | ||||||||||||||||||
Construction and land | 623 | — | — | 623 | 269,085 | 269,708 | ||||||||||||||||||
Consumer real estate | 10,880 | 2,463 | 3,458 | 16,801 | 919,956 | 936,757 | ||||||||||||||||||
Other consumer | 463 | 37 | — | 500 | 69,330 | 69,830 | ||||||||||||||||||
Total | $ | 12,866 | $ | 3,346 | $ | 25,982 | $ | 42,194 | $ | 5,024,313 | $ | 5,066,507 | ||||||||||||
1 Includes acquired PCI loans with a total carrying value of $6,729 and $11,328 at December 31, 2016 and 2015, respectively.
88
LEGACYTEXAS FINANCIAL GROUP, INC.
NOTES TO CONSOLIDATED FINANCIAL STATEMENTS
(Dollar amounts in thousands, except per share data) (Continued)
The recorded investment in loans by credit quality indicators at December 31, 2016 and 2015, was as follows.
Real Estate and Commercial and Industrial Credit Exposure
Credit Risk Profile by Internally Assigned Grade
December 31, 2016 | Commercial Real Estate | Commercial and Industrial | Construction and Land | Consumer Real Estate | ||||||||||||
Grade:1 | ||||||||||||||||
Pass | $ | 2,648,842 | $ | 1,712,171 | $ | 283,423 | $ | 1,062,549 | ||||||||
Special Mention | 7,972 | 155,110 | — | 2,083 | ||||||||||||
Substandard | 12,875 | 103,815 | 11,471 | 8,252 | ||||||||||||
Doubtful | 766 | 64 | — | 2,039 | ||||||||||||
Total | $ | 2,670,455 | $ | 1,971,160 | $ | 294,894 | $ | 1,074,923 | ||||||||
December 31, 2015 | ||||||||||||||||
Grade:1 | ||||||||||||||||
Pass | $ | 2,135,539 | $ | 1,460,725 | $ | 269,582 | $ | 920,519 | ||||||||
Special Mention | 13,633 | 92,048 | — | 3,327 | ||||||||||||
Substandard | 27,572 | 59,835 | 93 | 9,606 | ||||||||||||
Doubtful | 799 | 61 | 33 | 3,305 | ||||||||||||
Total | $ | 2,177,543 | $ | 1,612,669 | $ | 269,708 | $ | 936,757 | ||||||||
1 PCI loans are included in the substandard or doubtful categories for December 31, 2016 and 2015, respectively. These categories are generally consistent with the "substandard" and "doubtful" categories as defined by regulatory authorities.
Warehouse Purchase Program Credit Exposure
All Warehouse Purchase Program loans were graded pass as of December 31, 2016 and 2015.
Consumer Other Credit Exposure
Credit Risk Profile Based on Payment Activity
December 31, 2016 | December 31, 2015 | ||||||
Performing | $ | 53,833 | $ | 69,723 | |||
Non-performing | 158 | 107 | |||||
Total | $ | 53,991 | $ | 69,830 | |||
Note 6 - Fair Value
ASC 820, “Fair Value Measurements and Disclosures”, establishes a fair value hierarchy which requires an entity to maximize the use of observable inputs and minimize the use of unobservable inputs when measuring fair value. The standard describes three levels of inputs that may be used to measure fair value:
Level 1: Quoted prices (unadjusted) for identical assets or liabilities in active markets that the entity has the ability to access as of the measurement date.
Level 2: Significant other observable inputs other than Level 1 prices such as quoted prices for similar assets or liabilities; quoted prices in markets that are not active; or other inputs that are observable or can be corroborated by observable market data.
89
LEGACYTEXAS FINANCIAL GROUP, INC.
NOTES TO CONSOLIDATED FINANCIAL STATEMENTS
(Dollar amounts in thousands, except per share data) (Continued)
Level 3: Prices or valuation techniques that require inputs that are both significant and unobservable in the market. These instruments are valued using the best information available, some of which is internally developed, and reflects a reporting entity’s own assumptions about the risk premiums that market participants would generally require and the assumptions they would use.
Assets and Liabilities Measured on a Recurring Basis
Assets and liabilities measured at fair value on a recurring basis are summarized below.
Fair Value Measurements Using Level 2 | |||||||
December 31, 2016 | December 31, 2015 | ||||||
Assets: | |||||||
Agency residential mortgage-backed securities | $ | 218,551 | $ | 223,848 | |||
Agency commercial mortgage-backed securities | 9,347 | 9,417 | |||||
Agency residential collateralized mortgage obligations | 86,529 | 22,314 | |||||
US government and agency securities | 2,251 | 15,054 | |||||
Municipal bonds | 37,837 | 41,075 | |||||
Total securities available for sale | $ | 354,515 | $ | 311,708 | |||
Loans held for sale1 | $ | 21,279 | $ | 22,535 | |||
Derivative financial instruments: | |||||||
Interest rate lock commitments | 379 | 421 | |||||
Forward mortgage-backed securities trades | 36 | 15 | |||||
Loan customer counterparty | — | 260 | |||||
Financial institution counterparty | 1,369 | — | |||||
Liabilities: | |||||||
Derivative financial instruments: | |||||||
Interest rate lock commitments | — | — | |||||
Forward mortgage-backed securities trades | 80 | 29 | |||||
Loan customer counterparty | 1,369 | — | |||||
Financial institution counterparty | — | 260 | |||||
1 At December 31, 2016 and 2015, loans held for sale had an aggregate outstanding principal balance of $20,946 and $21,851. There were no mortgage loans held for sale that were 90 days or greater past due or on non-accrual at December 31, 2016.
The following methodologies were used to measure the fair value of financial assets and liabilities valued on a recurring basis:
Securities available for sale - The fair values of securities available for sale are determined by matrix pricing, which is a mathematical technique widely used in the industry to value debt securities without relying exclusively on quoted prices for the specific securities but rather by relying on the securities' relationship to other benchmark quoted securities (Level 2 inputs).
Residential mortgage loans held for sale - Mortgage loans held for sale, which are sold on a servicing released basis, are valued using a market approach by utilizing either: (i) the fair value of securities backed by similar mortgage loans, adjusted for certain factors to approximate the fair value of a whole mortgage loan, including the value attributable to mortgage servicing and credit risk, (ii) current commitments to purchase loans or (iii) recent observable market trades for similar loans, adjusted to credit risk and other individual loan characteristics. As these prices are derived from market observable inputs, the Company classifies these valuations as Level 2 in the fair value disclosures. Interest income on mortgage loans held for sale is recognized based on the contractual rates and reflected in interest income on loans held for sale in the consolidated income statement. The Company has no continuing involvement in any residential mortgage loans sold.
Derivative instruments - The Company enters into a variety of derivative instruments as part of its hedging strategy and measures these instruments at fair value on a recurring basis in the balance sheet. The majority of these derivatives are forward mortgage-backed securities and are exchange-traded or traded within highly active dealer markets. In order to determine the fair
90
LEGACYTEXAS FINANCIAL GROUP, INC.
NOTES TO CONSOLIDATED FINANCIAL STATEMENTS
(Dollar amounts in thousands, except per share data) (Continued)
value of these instruments, the Company utilized the exchange price or dealer market price for the particular derivative contract; therefore these contracts are classified as Level 2. In addition, the Company enters into interest rate lock commitments ("IRLCs") with prospective borrowers. These commitments are carried at fair value based on the fair value of the underlying mortgage loans which are based on observable market data. The Company adjusts the outstanding IRLCs with prospective borrowers based on an expectation that it will be exercised and the loan will be funded. These commitments are classified as Level 2 in the fair value disclosures, as the valuations are based on market observable inputs.
The Company also enters into certain interest rate derivative positions that are not designated as hedging instruments. The estimated fair value of these commercial loan interest rate swaps are obtained from a pricing service that provides the swaps' unwind value (Level 2 inputs). Please see Note 7 — Derivative Financial Instruments for more information.
Assets and Liabilities Measured on a Non-Recurring Basis
Assets measured at fair value on a non-recurring basis are summarized below. There were no liabilities measured at fair value on a non-recurring basis as of December 31, 2016 or 2015.
Fair Value Measurements Using Level 3 | ||||||||
December 31, 2016 | December 31, 2015 | |||||||
Assets: | ||||||||
Impaired loans | $ | 9,274 | $ | 2,230 | ||||
Foreclosed assets: | ||||||||
Commercial real estate | 10,638 | 4,784 | ||||||
Construction and land | 194 | 1,802 | ||||||
Consumer real estate | — | 106 | ||||||
Other | 6 | — | ||||||
Methodologies used to measure the fair value of financial assets and liabilities valued on a non-recurring basis are shown below:
Impaired loans - Impaired loans that are collateral dependent are measured for impairment using the fair value of the collateral adjusted by additional Level 3 inputs, such as discounts of market value, estimated marketing costs and estimated legal expenses. Impaired loans secured by real estate, receivables or inventory had discounts determined by management on an individual loan basis. Impaired loans that are not collateral dependent are measured for impairment by a discounted cash flow analysis using a net present value calculation that utilizes data from the loan file before and after the modification.
Foreclosed assets - These assets are measured at the lower of book or fair value less costs to sell using third party appraisals, listing agreements or sale contracts, which may be adjusted by additional Level 3 inputs, such as discounts of market value, estimated marketing costs and estimated legal expenses. Management may also consider additional adjustments on specific properties due to the age of the appraisal, expected holding period, lack of comparable sales, or if the other real estate owned is a special use property. At December 31, 2016, the Company had $92 in residential mortgage loans in the process of foreclosure.
The Credit Risk Management department evaluates the valuations on impaired loans and foreclosed assets at least quarterly. The valuations on impaired loans are reviewed at least quarterly by the Allowance for Loan Loss Committee and are considered in the calculation of the allowance for loan losses. Unobservable inputs, such as discounts to collateral, are monitored and adjusted if market conditions change.
91
LEGACYTEXAS FINANCIAL GROUP, INC.
NOTES TO CONSOLIDATED FINANCIAL STATEMENTS
(Dollar amounts in thousands, except per share data) (Continued)
Fair Value of Financial Instruments Not Recorded at Fair Value
The carrying amount and fair value information of financial instruments not recorded at fair value in their entirety on a recurring basis on the Company's consolidated balance sheets at December 31, 2016 and 2015, were as follows:
Fair Value | ||||||||||||||||
December 31, 2016 | Carrying Amount | Level 1 | Level 2 | Level 3 | ||||||||||||
Financial assets | ||||||||||||||||
Cash and cash equivalents | $ | 289,212 | $ | 289,212 | $ | — | $ | — | ||||||||
Securities held to maturity | 210,387 | — | 212,981 | — | ||||||||||||
Loans held for investment, net | 5,998,596 | — | — | 6,080,165 | ||||||||||||
Loans held for investment - Warehouse Purchase Program | 1,055,341 | — | — | 1,055,219 | ||||||||||||
FHLB and other restricted securities, at cost | 43,266 | — | 43,266 | — | ||||||||||||
Accrued interest receivable | 20,347 | 20,347 | — | — | ||||||||||||
Financial liabilities | ||||||||||||||||
Deposits | $ | 6,365,476 | $ | — | $ | — | $ | 5,989,933 | ||||||||
FHLB advances | 833,682 | — | — | 830,930 | ||||||||||||
Repurchase agreements | 86,691 | — | — | 84,265 | ||||||||||||
Subordinated debt | 134,032 | — | — | 121,743 | ||||||||||||
Accrued interest payable | 2,111 | 2,111 | — | — | ||||||||||||
December 31, 2015 | ||||||||||||||||
Financial assets | ||||||||||||||||
Cash and cash equivalents | $ | 615,639 | $ | 615,639 | $ | — | $ | — | ||||||||
Securities held to maturity | 240,433 | — | 247,202 | — | ||||||||||||
Loans held for investment, net | 5,017,554 | — | — | 5,083,093 | ||||||||||||
Loans held for investment - Warehouse Purchase Program | 1,043,719 | — | — | 1,042,434 | ||||||||||||
FHLB and other restricted securities, at cost | 63,075 | — | 63,075 | — | ||||||||||||
Accrued interest receivable | 17,109 | 17,109 | — | — | ||||||||||||
Financial liabilities | ||||||||||||||||
Deposits | $ | 5,226,711 | $ | — | $ | — | $ | 4,920,648 | ||||||||
FHLB advances | 1,439,904 | — | — | 1,433,125 | ||||||||||||
Repurchase agreement | 83,269 | — | — | 81,956 | ||||||||||||
Subordinated debt | 84,992 | — | — | 85,771 | ||||||||||||
Accrued interest payable | 1,653 | 1,653 | — | — | ||||||||||||
The following methods and assumptions were used to estimate the fair values of each class of financial instrument presented:
Cash and cash equivalents - Due to their short term nature, the carrying amount approximates the estimated fair value.
Securities held to maturity - The fair values of these securities is determined by matrix pricing, which is a mathematical technique widely used in the industry to value debt securities without relying exclusively on quoted prices for the specific securities but rather by relying on the securities' relationship to other benchmark quoted securities (Level 2 inputs).
Loans held for investment (including Warehouse Purchase Program loans) - Fair value is based on discounted cash flows using current market offering rates, estimated life, and applicable credit risk.
92
LEGACYTEXAS FINANCIAL GROUP, INC.
NOTES TO CONSOLIDATED FINANCIAL STATEMENTS
(Dollar amounts in thousands, except per share data) (Continued)
FHLB stock and other restricted securities - The fair value on these securities is their cost basis due to restrictions on transferability.
Accrued interest receivable - Due to their short term nature, the carrying amount approximates the estimated fair value.
Deposits - Fair value is calculated using the FHLB advance curve to discount cash flows based on the estimated life of the deposits.
FHLB advances - Fair value is calculated using the FHLB advance curve to discount cash flows based on the contractual repayment schedule.
Repurchase agreement - The fair value is based on discounting the estimated cash flows using the current rate at which similar borrowings would be made with similar terms and remaining maturities.
Subordinated debt - The estimated fair value is based on current market rates on similar debt in the market.
Accrued interest payable - Due to their short term nature, the carrying amount approximates the estimated fair value.
The fair value of off-balance sheet items is based on the current fees or costs that would be charged to enter into or terminate such arrangements and are not considered significant to this presentation.
Note 7 — Derivative Financial Instruments
The following table provides the outstanding notional balances and fair values of outstanding derivative positions at December 31, 2016 and 2015.
December 31, 2016 | December 31, 2015 | |||||||||||||||||||||||
Outstanding Notional Balance | Asset Derivative Fair Value | Liability Derivative Fair Value | Outstanding Notional Balance | Asset Derivative Fair Value | Liability Derivative Fair Value | |||||||||||||||||||
IRLCs | $ | 10,952 | $ | 379 | $ | — | $ | 12,518 | $ | 421 | $ | — | ||||||||||||
Forward mortgage-backed securities trades | 18,613 | 36 | 80 | 20,374 | 15 | 29 | ||||||||||||||||||
Commercial loan interest rate swaps and caps: | ||||||||||||||||||||||||
Loan customer counterparty | 112,294 | — | 1,369 | 24,796 | $ | 260 | — | |||||||||||||||||
Financial institution counterparty | 112,294 | 1,369 | — | 24,796 | — | 260 | ||||||||||||||||||
IRLCs - The Company enters into IRLCs with prospective residential mortgage borrowers whereby the interest rate on the loan is determined prior to funding and the borrowers have locked into that interest rate. The estimated fair values of IRLCs are based on the fair value of the related mortgage loan which is based observable market data. The Company adjusts the outstanding IRLCs based on the expectation that it will be exercised and the loan will be funded.
Forward mortgage-backed securities trades - To manage the price risk associated with IRLCs, the Company enters into forward sales of mortgage-backed securities in an amount similar to the portion of the IRLC expected to close, assuming no change in mortgage interest rates. In addition, to manage the interest rate risk associated with mortgage loans held for sale, the Company enters into forward sales of mortgage-backed securities to deliver mortgage loan inventory to investors. The estimated fair values of forward sales of mortgage-backed securities and forward sale commitments are based on quoted market values.
Interest rate swaps and caps - These derivative positions relate to transactions in which we enter into an interest rate swap or cap with a customer, while at the same time entering into an offsetting interest rate swap or cap with another financial institution. An interest rate swap transaction allows our customer to effectively convert a variable rate loan to a fixed rate. In connection with each swap, we agree to pay interest to the customer on a notional amount at a variable interest rate and receive interest from the customer on a similar notional amount at a fixed interest rate. At the same time, we agree to pay another financial institution the same fixed interest rate on the same notional amount and receive the same variable interest rate on the
93
LEGACYTEXAS FINANCIAL GROUP, INC.
NOTES TO CONSOLIDATED FINANCIAL STATEMENTS
(Dollar amounts in thousands, except per share data) (Continued)
same notional amount. In connection with each interest rate cap, we sell a cap to the customer and agree to pay interest if the underlying index exceeds the strike price defined in the cap agreement. Simultaneously we purchase a cap with matching terms from another financial institution which agrees to pay us if the underlying index exceeds the strike price.
The commercial loan customer counterparty weighted average received and paid interest rates for interest rate swaps outstanding at December 31, 2016 and 2015 are presented in the following table.
Weighted-Average Interest Rate | ||||||||||||
December 31, 2016 | December 31, 2015 | |||||||||||
Received | Paid | Received | Paid | |||||||||
Loan customer counterparty | 3.12 | % | 2.36 | % | 5.01 | % | 3.37 | % | ||||
Our credit exposure on interest rate swaps is limited to the net favorable value of all swaps by each counterparty, which was approximately $118 at December 31, 2016. This credit exposure is partly mitigated as transactions with customers are generally secured by the collateral, if any, securing the underlying transaction being hedged. Our credit exposure, net of collateral pledged, relating to interest rate swaps with upstream financial institution counterparties was approximately $1,335 at December 31, 2016. A credit support annex is in place and allows the bank to call collateral from upstream financial institution counterparties. Collateral levels are monitored and adjusted on a regular basis for changes in interest rate swap values. Our cash collateral pledged for interest rate swaps and included in our interest-bearing deposits, which totaled $1,950 and $300 at December 31, 2016 and 2015 respectively, is in excess of our credit exposure.
The initial and subsequent changes in the fair value of IRLCs and the forward sales of mortgage-back securities are recorded in net gain on sale of mortgage loans. These gains and losses were not attributable to instrument-specific credit risk. For interest rate swaps and caps, because we act as an intermediary for our customer, changes in the fair value of the underlying derivative contracts substantially offset each other and do not have a material impact on our results of operations. Income (loss) for the years ending December 31, 2016, 2015 and 2014 was as follows:
Derivatives not designated as hedging instruments | Years Ended December 31, | |||||||||||
2016 | 2015 | 2014 | ||||||||||
IRLC's | $ | (43 | ) | $ | 8 | $ | — | |||||
Forward mortgage-backed securities trades | 13 | (195 | ) | — | ||||||||
94
LEGACYTEXAS FINANCIAL GROUP, INC.
NOTES TO CONSOLIDATED FINANCIAL STATEMENTS
(Dollar amounts in thousands, except per share data) (Continued)
Note 8 — Premises and Equipment
Premises and equipment were as follows:
December 31, | |||||||
2016 | 2015 | ||||||
Land | $ | 23,636 | $ | 25,546 | |||
Buildings | 59,298 | 60,807 | |||||
Furniture, fixtures and equipment | 19,561 | 18,848 | |||||
Leasehold improvements | 7,674 | 7,556 | |||||
110,169 | 112,757 | ||||||
Less: accumulated depreciation | (35,943 | ) | (35,120 | ) | |||
Total | $ | 74,226 | $ | 77,637 | |||
Depreciation expense was $6,186, $6,550 and $4,047 for 2016, 2015 and 2014, respectively.
Operating Leases: The Company leases certain bank or loan production office properties and equipment under operating leases. Certain leases contain renewal options that may be exercised. Rent expense was $7,928, $6,895 and $2,317 for 2016, 2015 and 2014, respectively.
Rent commitments, before considering applicable renewal options, as of December 31, 2016, were as follows:
Balance | |||
2017 | $ | 6,218 | |
2018 | 5,634 | ||
2019 | 4,791 | ||
2020 | 4,424 | ||
2021 | 4,238 | ||
Thereafter | 20,572 | ||
Total | $ | 45,877 | |
The Company leases office space in certain locations to other unaffiliated tenants. Rental income of $704 was recognized during 2016. This rental income is recorded in the consolidated statement of income as an offset to occupancy expense. Aggregate future minimum rental payments to be received under non-cancelable subleases at December 31, 2016, were $1,087. At December 31, 2016, the Company had no commitments for future locations and held two parcels of land for future development. The Company sold one of these parcels of land in January 2017, resulting in a gain of $1,304.
95
LEGACYTEXAS FINANCIAL GROUP, INC.
NOTES TO CONSOLIDATED FINANCIAL STATEMENTS
(Dollar amounts in thousands, except per share data) (Continued)
Note 9 - Goodwill and Core Deposit Intangibles
Goodwill and other intangible assets are presented in the table below. Changes in the carrying amount of the Company's goodwill and core deposit intangibles (“CDI”) for years ended December 31, 2016 and 2015, were as follows:
Goodwill | Core Deposit Intangibles | ||||||
Balance as of December 31, 2014 | $ | 29,650 | $ | 616 | |||
LegacyTexas Group, Inc. acquisition | 151,126 | 880 | |||||
Amortization of core deposit intangible | — | (466 | ) | ||||
Balance as of December 31, 2015 | 180,776 | 1,030 | |||||
Disposition of insurance subsidiary goodwill upon the sale of subsidiary operations | (2,217 | ) | — | ||||
Amortization of core deposit intangible | — | (365 | ) | ||||
Balance as of December 31, 2016 | $ | 178,559 | $ | 665 | |||
Management performs an evaluation annually, and more frequently if a triggering event occurs, of whether any impairment of the goodwill or other intangibles has occurred.
CDI are amortized on an accelerated basis over their estimated lives with a weighted average amortization period of 8 years. The CDI amortization expense is reported in other non-interest expense on the Company's consolidated statements of income. The estimated aggregate future amortization expense for CDI remaining as of December 31, 2016 is as follows:
Balance | |||
2017 | $ | 263 | |
2018 | 156 | ||
2019 | 101 | ||
2020 | 73 | ||
2021 | 48 | ||
Thereafter | 24 | ||
Note 10 - Deposits
Time deposits of $250 or more totaled $951,688 and $503,719 at December 31, 2016 and 2015, respectively. The $250 FDIC insurance coverage limit applies per depositor, per insured depository institution, for each account ownership category.
At December 31, 2016 and 2015, the Company had $355,455 and $371,692 in reciprocal deposits, respectively. These consisted entirely of certificates of deposit made under the Company's participation in the Certificate of Deposit Account Registry Service® (CDARS®) and Insured Cash Sweep (ICS) money market product. Through CDARS®, the Company can provide a depositor the ability to place up to $50,000 on deposit with the Company while receiving FDIC insurance on the entire deposit by placing customer funds in excess of the FDIC deposit limits with other financial institutions in the CDARS® network. In return, these financial institutions place customer funds with the Company on a reciprocal basis. Similarly, customer funds in our ICS money market product are swept from a transaction account at the Company into money market accounts at multiple banks to allow access to FDIC insurance coverage through multiple accounts, up to $75,000. Regulators consider reciprocal deposits to be brokered deposits.
96
LEGACYTEXAS FINANCIAL GROUP, INC.
NOTES TO CONSOLIDATED FINANCIAL STATEMENTS
(Dollar amounts in thousands, except per share data) (Continued)
At December 31, 2016, scheduled maturities of time deposits for the next five years with the weighted average rate at the end of the period were as follows:
Balance | Weighted Average Rate | |||||
2017 | $ | 992,786 | 0.73 | % | ||
2018 | 256,150 | 0.99 | ||||
2019 | 29,019 | 0.98 | ||||
2020 | 22,858 | 1.39 | ||||
2021 and thereafter | 67,091 | 1.65 | ||||
Total | $ | 1,367,904 | 0.84 | % | ||
At December 31, 2016 and 2015, the Company's deposits included public funds totaling $1,001,820 and $708,723, respectively. At December 31, 2016 and 2015, overdrawn deposits of $340 and $1,177 were reclassified as unsecured consumer loans.
Interest expense on deposits is summarized as follows:
Years Ended December 31, | |||||||||||
2016 | 2015 | 2014 | |||||||||
Interest-bearing demand | $ | 3,974 | $ | 3,297 | $ | 1,653 | |||||
Savings and money market | 7,288 | 3,644 | 3,144 | ||||||||
Time | 9,772 | 6,186 | 3,415 | ||||||||
Total | $ | 21,034 | $ | 13,127 | $ | 8,212 | |||||
97
LEGACYTEXAS FINANCIAL GROUP, INC.
NOTES TO CONSOLIDATED FINANCIAL STATEMENTS
(Dollar amounts in thousands, except per share data) (Continued)
Note 11 - Borrowed Funds
Borrowed funds are summarized as follows:
December 31, | ||||||||||||||
2016 | 2015 | |||||||||||||
Amount | Rate1 | Amount | Rate1 | |||||||||||
Federal Home Loan Bank advances | $ | 833,682 | 0.71 | % | $ | 1,439,904 | 0.51 | % | ||||||
Repurchase Agreements | ||||||||||||||
Credit Suisse structured repurchase agreement | 25,000 | 3.02 | 25,000 | 3.22 | ||||||||||
Overnight repurchase agreements with depositors | 61,691 | 0.15 | 58,269 | 0.16 | ||||||||||
Subordinated Debt | ||||||||||||||
Fixed to floating rate note maturing on December 1, 2025 | 125,000 | 5.58 | 75,000 | 5.50 | ||||||||||
Junior subordinated debentures | 15,464 | 2.66 | 15,464 | 2.21 | ||||||||||
1 Rate at period-end, with the exception of the fixed to floating rate subordinated debt note, which is a weighted average rate calculated using period-end rates.
Federal Home Loan Bank ("FHLB") Advances
At December 31, 2016, advances from the FHLB had interest rates ranging from 0.46% to 6.00%. At December 31, 2015, advances from the FHLB had interest rates ranging from 0.28% to 6.00%. At December 31, 2016, the Company had $800,000 in variable rate FHLB advances.
In 2010, certain FHLB fixed-rate advances were modified. The early repayment of the debt resulted in a prepayment penalty, which is being amortized to interest expense as an adjustment to the cost of the new FHLB advances. The prepayment penalty, net of accumulated amortization, was $27 and $456 at December 31, 2016 and 2015.
The advances were collateralized by mortgage and commercial loans with FHLB collateral values of $1,877,506 and $1,461,248 under a blanket lien arrangement at December 31, 2016 and 2015, respectively. Additionally, securities safekept at FHLB and FHLB stock are used as collateral for advances. Based on this collateral, the Company was eligible to borrow an additional $1,821,693 and $1,030,732 at December 31, 2016 and 2015, respectively. The current agreement provided for a maximum borrowing amount of approximately $3,601,739 and $3,025,653 at December 31, 2016 and 2015, respectively.
Repurchase Agreements
Repurchase agreements ("repos") which are classified as securities transactions, are not insured by the FDIC, are not guaranteed, and may lose value. A repo is an agreement between two parties whereby one party (a bank as counterparty) sells the other (as customer) a security at a specified price with a commitment to buy the security back at a fixed time and price. Repos are accounted for as collateralized borrowings and are recorded at amounts equal to cash received.
Inherent in repurchase agreements is a risk that the fair value of the collateral pledged on the agreements could decline below the amount obligated under the agreements. To mitigate this risk to the customer, the Company, as the bank counterparty, marks securities sold under repos to fair value on a daily basis and provides 115% market value protection on overnight repos and 112% market value protection on its structured repo.
In April 2008, the Company entered into a 10-year term structured repurchase callable agreement for $25,000 to leverage the balance sheet and increase liquidity. The interest rate adjusts quarterly to 6.25% less the 90 day LIBOR, subject to a lifetime cap of 3.02%. At December 31, 2016, the Company also had $61,691 in overnight repurchase agreements with depositors.
Subordinated Debt
In November 2015, the Company issued $75,000 of Fixed-to-Floating Rate Subordinated Notes (the “Notes”) that mature on December 1, 2025 (the “Maturity Date”). In September 2016, the Company issued an additional $50,000 of Notes that mature on the Maturity Date. The Notes, which qualify as Tier 2 capital for regulatory purposes, have an interest rate of 5.50% and 5.69%, respectively, per annum, payable semi-annually on each December 1 and June 1 through December 1, 2020. From and
98
LEGACYTEXAS FINANCIAL GROUP, INC.
NOTES TO CONSOLIDATED FINANCIAL STATEMENTS
(Dollar amounts in thousands, except per share data) (Continued)
including December 1, 2020 through maturity or earlier redemption, the interest rate will reset quarterly to an interest rate per annum equal to the then current three-month LIBOR rate plus 3.89%, payable on March 1, June 1, September 1, and December 1 of each year through the maturity date or earlier redemption. The Company may, at its option, beginning on December 1, 2020 and on any scheduled interest payment date thereafter, redeem the Notes, in whole or in part, at a redemption price equal to 100% of the principal amount of the Notes to be redeemed plus accrued and unpaid interest to, but excluding, the date of redemption. Any partial redemption will be made pro rata among all of the holders.
The Notes were sold at an underwriting discount and the discount, as well as debt issuance costs, are netted against the subordinated debt liability on the balance sheet in accordance with ASU 2015-03. The unamortized underwriting discount and debt issuance costs totaled $2,709 at December 31, 2016. The Notes are subordinated in right of payment to all of the Company's senior indebtedness and effectively subordinated to all existing and future debt and all other liabilities of the Company's subsidiaries.
Upon the acquisition of LegacyTexas Group, Inc., the Company acquired $15,000 (15,000 shares with a liquidation amount of $1 per security) of Floating Rate Cumulative Trust Preferred Securities ("TruPS") and $464 of common stock through an unconsolidated subsidiary, Legacy Capital Trust III ("Trust III"). Trust III invested the total proceeds from the sale of TruPS and common stock (totaling $15,464) in floating rate Junior Subordinated Debentures (the "Trust III Debentures") issued by the Company. The terms of the Trust III Debentures are such that they qualify as Tier I capital for regulatory purposes. Interest on the Trust III Debentures is payable quarterly on March 15, June 15, September 15 and December 15 of each year, at a rate equal to the three month LIBOR rate plus 1.70% (2.66% at December 31, 2016). Principal is due at maturity on December 15, 2036. The TruPS are guaranteed by the Company and are subject to redemption. The Company may redeem the Trust III Debentures, in whole or in part, on any March 15, June 15, September 15 and December 15 at an amount equal to the principal amount being redeemed plus accrued and unpaid interest to the redemption date. At December 31, 2016 and 2015, the Trust III Debentures were reduced by a purchase accounting fair value discount of $3,723 and $3,905, respectively.
Also upon the acquisition of LegacyTexas Group, Inc., the Company acquired $15,000 of TruPS and $464 of common stock through an unconsolidated subsidiary. The subsidiary invested the total proceeds from the sale of the TruPS and common stock in floating rate Junior Subordinated Debentures issued by LegacyTexas Group, Inc. On April 7, 2015, the Company paid this debt in full.
Other Borrowing Information
At December 31, 2016, borrowed funds, reported gross of purchase accounting fair value discounts, prepayment penalties and debt issuance costs, were structured to contractually pay down as follows:
FHLB Advances | Repurchase Agreements | Subordinated Debt | Total | ||||||||||||
2017 | $ | 615,546 | $ | 61,691 | $ | — | $ | 677,237 | |||||||
2018 | 212,754 | 25,000 | — | 237,754 | |||||||||||
2019 | 2,314 | — | — | 2,314 | |||||||||||
2020 | 931 | — | — | 931 | |||||||||||
2021 | 856 | — | — | 856 | |||||||||||
Thereafter | 1,308 | — | 140,464 | 141,772 | |||||||||||
$ | 833,709 | $ | 86,691 | $ | 140,464 | $ | 1,060,864 | ||||||||
Upon the acquisition of LegacyTexas Group, Inc., the Company assumed long-term notes totaling $8,900. These notes were paid off during the first quarter of 2015.
At December 31, 2016 and 2015, the Company had borrowing availability representing the collateral value assigned to the securities pledged to the discount window through the FRB of $46,725 and $35,632, respectively. Additionally, uncommitted, unsecured Fed Fund lines of credit totaling $255,000 and $285,000 were available at December 31, 2016 and 2015, respectively, from multiple correspondent banks.
99
LEGACYTEXAS FINANCIAL GROUP, INC.
NOTES TO CONSOLIDATED FINANCIAL STATEMENTS
(Dollar amounts in thousands, except per share data) (Continued)
Note 12 — Benefits
Employee Stock Ownership (“ESOP”) and 401(k) Plan: The Company offers a KSOP plan composed of an ESOP and 401(k) plan. Employees may participate under the 401(k) portion of the KSOP as of the date they first complete an hour of service with the Bank. Employees are eligible to receive a matching contribution of 100% of employee contributions up to a maximum of 5% of the employee's qualifying compensation. Matching expense for 2016, 2015 and 2014 was $2,479, $2,130 and $1,283, respectively.
The ESOP portion of the KSOP was established in connection with the 2006 minority stock offering. In 2006 the ESOP purchased shares of common stock financed by a term loan from the Company. This note was fully repaid in September 2016, and all shares have been allocated to participant accounts. In 2010, the ESOP purchased 1,588,587 shares of common stock with proceeds from a 30 year note in the amount of $15,886 from the Company. The Company's Board of Directors determines the amount of contribution to the ESOP annually but is required to make contributions sufficient to service the ESOP's debt. Dividends on unallocated shares held by the ESOP are applied to the ESOP note payable. Shares are released for allocation to eligible employees as the ESOP debt is repaid. Eligible employees receive an allocation of released shares at the end of the calendar year on a relative compensation basis. Employees are eligible if they meet the minimum service and eligibility requirements. The dividends paid on allocated shares are paid to employee accounts. Contributions to the ESOP were $1,468, $2,060, and $2,060 during 2016, 2015 and 2014, and expense was $3,174, $4,914 and $4,725 for December 31, 2016, 2015 and 2014, respectively.
Shares held by the ESOP at December 31 are categorized as follows:
2016 | 2015 | ||||||
Allocated to participants | 1,643,294 | 1,522,883 | |||||
Unearned | 1,245,046 | 1,365,457 | |||||
Total ESOP shares | 2,888,340 | 2,888,340 | |||||
Fair value of unearned shares at December 31 | $ | 53,612 | $ | 34,164 | |||
Deferred Compensation Plan: The Company has entered into certain non-qualified deferred compensation agreements with members of the executive management team, directors and certain employees. These agreements, which are subject to the rules of section 409(a) of the Internal Revenue Code, relate to the voluntary deferral of compensation received and do not have an employer contribution. The accrued liability as of December 31, 2016 and 2015 was $3,344 and $4,086, respectively.
Included in other assets is a universal life insurance policy, as well as variable and fixed annuity contracts, totaling $3,534 and $4,272 at December 31, 2016 and 2015, respectively. The Company is the owner and beneficiary of the policy, which pays interest on the funds invested. The life insurance policy is recorded at the net cash surrender value, or the amount that can be realized.
Bank-Owned Life Insurance: The Company is the sole owner of life insurance policies pertaining to certain employees and directors. The selected insured employees and directors agreed to a share of the death benefit while they remain actively employed with the Company or serve on its board. In the event of death while actively employed with the Company, the employee's or director's designated beneficiary will receive an income tax free death benefit paid.
The Company also is the sole owner of other life insurance policies that do not share the death benefit with the employees. The total balance of the bank-owned life insurance policies, reported as an asset, at December 31, 2016 and 2015 totaled $56,477 and $55,231.
100
LEGACYTEXAS FINANCIAL GROUP, INC.
NOTES TO CONSOLIDATED FINANCIAL STATEMENTS
(Dollar amounts in thousands, except per share data) (Continued)
Note 13 - Share-based Compensation
The Company has shareholder approved share-based compensation plans that are accounted for under ASC 718, Compensation - Stock Compensation, which requires companies to record compensation cost for share-based payment transactions with employees in return for employment service. Under the plans, options to purchase 3,370,040 shares of common stock and 1,348,016 restricted shares of common stock were made available. The plans allow for the Company to grant restricted stock, restricted stock units, stock options and stock appreciation rights to directors, advisory directors, officers and other employees. Shares issued in connection with stock compensation awards are issued from available authorized shares. Compensation cost charged to income for share-based compensation, which is reported in non-interest expense as salaries and employee benefits expense, is presented below:
Years ended December 31, | |||||||||||
2016 | 2015 | 2014 | |||||||||
Restricted stock | $ | 3,477 | $ | 3,459 | $ | 2,561 | |||||
Stock options | 2,537 | 2,018 | 1,156 | ||||||||
Income tax benefit | 2,105 | 1,917 | 1,301 | ||||||||
A summary of activity in the restricted stock portion of the Company's stock plans for 2016, 2015 and 2014 is presented below:
Time-Based Shares | Performance-Based Shares | ||||||||||||
Shares | Weighted- Average Grant Date Fair Value 1 | Shares | Weighted- Average Grant Date Fair Value 2 | ||||||||||
Non-vested at January 1, 2014 | 381,402 | $ | 20.39 | 82,400 | $ | 27.45 | |||||||
Granted | 20,000 | 24.69 | — | — | |||||||||
Vested | (103,799 | ) | 20.32 | — | — | ||||||||
Non-vested at December 31, 2014 | 297,603 | 20.45 | 82,400 | 23.89 | |||||||||
Granted | 80,000 | 21.23 | — | — | |||||||||
Vested | (131,142 | ) | 19.98 | (20,600 | ) | 23.89 | |||||||
Non-vested at December 31, 2015 | 246,461 | 20.98 | 61,800 | 25.02 | |||||||||
Granted | 55,180 | 29.29 | 40,200 | 29.29 | |||||||||
Vested | (101,465 | ) | 20.70 | (20,600 | ) | 25.02 | |||||||
Non-vested at December 31, 2016 | 200,176 | $ | 23.79 | 81,400 | $ | 43.06 | |||||||
1 For restricted stock awards with time-based vesting conditions, the grant date fair value is based upon the closing stock price as quoted on the NASDAQ Stock Market on the grant date.
2 For restricted stock awards with performance-based vesting conditions, the value of the award is based upon the closing stock price as quoted on the NASDAQ Stock Market on the date of vesting. Until the final value is determined on the vesting date, the Company estimates the fair value quarterly based upon the closing stock price as quoted on the NASDAQ Stock Market near the last business day of each calendar quarter end.
As of December 31, 2016, there was $5,398 of total unrecognized compensation expense related to non-vested restricted shares awarded under the Company's stock plans. That expense is expected to be recognized over a weighted-average period of 1.40 years. The total fair value of shares vested during the years ended December 31, 2016 and 2015, was $2,615 and $3,113, respectively. Total restricted shares available for future issuance under the plans totaled 64,009 at December 31, 2016 with 1,409,004 shares having been issued under the plans through December 31, 2016.
101
LEGACYTEXAS FINANCIAL GROUP, INC.
NOTES TO CONSOLIDATED FINANCIAL STATEMENTS
(Dollar amounts in thousands, except per share data) (Continued)
Under the terms of the plans, stock options may not be granted with an exercise price less than the fair market value of the Company’s common stock on the date the option is granted and may not be exercised later than ten years after the grant date. The fair market value is the closing stock price as quoted on the NASDAQ Stock Market on the date of grant.
The fair value of each option award is estimated on the date of grant using a closed form option valuation (Black-Scholes) model that uses the assumptions noted in the table below. The risk-free interest rate is the implied yield available on U.S. Treasury zero-coupon issues with a remaining term equal to the expected term of the stock option in effect at the time of the grant. Although the contractual term of the stock options granted is ten years, the expected term of the stock is less because option restrictions do not permit recipients to sell or hedge their options and therefore, we believe, encourage exercise of the options before the end of the contractual term. The expected term of stock options is based on employees' actual vesting behavior and expected volatilities are based on historical volatilities of the Company’s common stock. Expected dividends are the estimated dividend rate over the expected term of the stock options. For awards with performance-based vesting conditions, compensation cost is recognized when the achievement of the performance condition is considered probable of achievement. If a performance condition is subsequently determined to be improbable of achievement, compensation cost is reversed.
The weighted average fair value of stock options granted during 2016, 2015 and 2014 was $7.77, $6.82 and $7.17, respectively. The fair value of options granted was determined using the following weighted-average assumptions as of grant date:
2016 | 2015 | 2014 | ||||||
Risk-free interest rate | 1.37 | % | 1.80 | % | 2.16 | % | ||
Expected term of stock options (years) | 6.3 | 6.2 | 6.2 | |||||
Expected stock price volatility | 32.07 | % | 31.14 | % | 30.96 | % | ||
Expected dividends | 1.93 | % | 1.95 | % | 1.84 | % | ||
102
LEGACYTEXAS FINANCIAL GROUP, INC.
NOTES TO CONSOLIDATED FINANCIAL STATEMENTS
(Dollar amounts in thousands, except per share data) (Continued)
A summary of activity in the stock option portion of the Company's share-based compensation plans as of the years ended December 31, 2016, 2015 and 2014 is presented below:
Options | Shares | Weighted- Average Exercise Price | Weighted- Average Remaining Contractual Term | Aggregate Intrinsic Value | ||||||||||
Outstanding at January 1, 2014 | 1,173,618 | $ | 18.16 | 8.4 | $ | 10,903 | ||||||||
Granted | 328,750 | 26.09 | 10.0 | — | ||||||||||
Exercised | (56,035 | ) | 13.66 | — | 652 | |||||||||
Forfeited | (75,460 | ) | 17.63 | — | — | |||||||||
Outstanding at December 31, 2014 | 1,370,873 | 20.27 | 8.0 | 5,679 | ||||||||||
Granted | 633,000 | 25.66 | 10.0 | — | ||||||||||
Exercised | (58,855 | ) | 16.12 | — | 644 | |||||||||
Forfeited | (79,268 | ) | 20.89 | — | — | |||||||||
Outstanding at December 31, 2015 | 1,865,750 | 22.21 | 7.9 | 6,401 | ||||||||||
Granted | 392,838 | 29.15 | 10.0 | — | ||||||||||
Exercised | (175,192 | ) | 19.08 | — | 2,251 | |||||||||
Forfeited | (75,316 | ) | 25.57 | — | — | |||||||||
Outstanding at December 31, 2016 | 2,008,080 | $ | 23.71 | 7.4 | $ | 38,850 | ||||||||
Fully vested and expected to vest | 1,990,524 | $ | 23.68 | 7.4 | $ | 38,585 | ||||||||
Exercisable at December 31, 2016 | 719,156 | $ | 20.51 | 6.2 | $ | 16,218 | ||||||||
As of December 31, 2016, there was $7,091 of total unrecognized compensation expense related to non-vested stock options. That expense is expected to be recognized over a weighted-average period of 2.45 years. At December 31, 2016, the Company applied an estimated forfeiture rate of 5% based on historical activity. The intrinsic value for stock options is calculated based on the difference between the exercise price of the underlying awards and the market price of our common stock as of the reporting date.
103
LEGACYTEXAS FINANCIAL GROUP, INC.
NOTES TO CONSOLIDATED FINANCIAL STATEMENTS
(Dollar amounts in thousands, except per share data) (Continued)
Note 14 — Income Taxes
The Company's pre-tax income is subject to federal income tax and state margin tax at a combined rate of 36% for 2016, 2015 and 2014. Income tax expense for 2016, 2015 and 2014, was as follows:
2016 | 2015 | 2014 | |||||||||
Current expense | $ | 59,900 | $ | 38,648 | $ | 19,073 | |||||
Deferred expense | (6,798 | ) | (692 | ) | (1,414 | ) | |||||
Total income tax expense | $ | 53,102 | $ | 37,956 | $ | 17,659 | |||||
At December 31, 2016 and 2015, deferred tax assets and liabilities were due to the following:
December 31, | |||||||
2016 | 2015 | ||||||
Deferred tax assets: | |||||||
Allowance for loan losses | $ | 22,602 | $ | 16,483 | |||
Deferred compensation arrangements | 1,261 | 1,536 | |||||
Self-funded health insurance | 241 | 203 | |||||
Non-accrual interest | 966 | 632 | |||||
Restricted stock and stock options | 3,132 | 2,275 | |||||
Accrued expenses | 1,255 | 715 | |||||
Fair value mark on purchased loans | 2,348 | 3,838 | |||||
Net unrealized loss on securities available for sale | 1,465 | 72 | |||||
Other | 2,121 | 811 | |||||
35,391 | 26,565 | ||||||
Deferred tax liabilities: | |||||||
Depreciation | (336 | ) | (1,011 | ) | |||
Partnerships — CRA-purposed private equity funds | (1,697 | ) | (1,328 | ) | |||
Fair value mark on subordinated debt | (1,303 | ) | (1,367 | ) | |||
Other | (2,824 | ) | (1,819 | ) | |||
(6,160 | ) | (5,525 | ) | ||||
Net deferred tax asset | $ | 29,231 | $ | 21,040 | |||
The net deferred tax asset is recorded on the consolidated balance sheets under “other assets.” Management performed an analysis related to the Company's deferred tax asset for each of the years ended December 31, 2016 and 2015 and, based upon these analyses, no valuation allowance was deemed necessary as of December 31, 2016 or 2015.
104
LEGACYTEXAS FINANCIAL GROUP, INC.
NOTES TO CONSOLIDATED FINANCIAL STATEMENTS
(Dollar amounts in thousands, except per share data) (Continued)
Effective tax rates differ from the federal statutory rate of 35% in 2016, 2015 and 2014, applied to income before income taxes due to the following:
At and for the Year Ended December 31, | |||||||||||
2016 | 2015 | 2014 | |||||||||
Federal statutory rate times financial statement income | $ | 52,823 | $ | 38,105 | $ | 17,128 | |||||
Effect of: | |||||||||||
State taxes, net of federal benefit | 267 | 37 | 66 | ||||||||
Tax credit on CRA-purposed private equity fund | — | — | (58 | ) | |||||||
Bank-owned life insurance income | (436 | ) | (419 | ) | (220 | ) | |||||
Municipal interest income | (1,041 | ) | (1,025 | ) | (772 | ) | |||||
ESOP shares released | 757 | 1,207 | 1,140 | ||||||||
One-time merger expenses | — | — | 381 | ||||||||
Sale of LegacyTexas Insurance Services, Inc. | 640 | — | — | ||||||||
Other | 92 | 51 | (6 | ) | |||||||
Total income tax expense | $ | 53,102 | $ | 37,956 | $ | 17,659 | |||||
Effective Tax Rate | 35.18 | % | 34.86 | % | 36.09 | % | |||||
The Company files income tax returns in the U.S. federal jurisdiction and several U.S. state jurisdictions. The Company is generally no longer subject to U.S. federal income tax examinations for tax years prior to 2013.
Note 15 — Related Party Transactions
Loans to executive officers, directors, and their affiliates during 2016 were as follows:
Balance | |||
Beginning balance | $ | 15,365 | |
New loans | 21 | ||
Effect of changes in composition of related parties | — | ||
Repayments | (49 | ) | |
Ending balance | $ | 15,337 | |
None of the above loans were considered non-performing or potential problem loans. These loans are made in the ordinary course of business and on substantially the same terms, including interest rates and collateral, as those prevailing at the time for comparable transactions with other unaffiliated persons and do not involve more than normal risk of collectability. Deposits from executive officers, directors, and their affiliates at December 31, 2016 and 2015 were $48,761 and $44,907, respectively.
105
LEGACYTEXAS FINANCIAL GROUP, INC.
NOTES TO CONSOLIDATED FINANCIAL STATEMENTS
(Dollar amounts in thousands, except per share data) (Continued)
Note 16 — Regulatory Capital Matters
Banks and bank holding companies are subject to regulatory capital requirements administered by federal banking agencies. Capital adequacy guidelines and, additionally for banks, prompt corrective action regulations, involve quantitative measures of assets, liabilities, and certain off‑balance sheet items calculated under regulatory accounting practices. Capital amounts and classifications are also subject to qualitative judgments by regulators. Failure to meet capital requirements can initiate regulatory action.
The Bank and the Company are regulated by the Texas Department of Banking ("TDOB") and the Board of Governors of the Federal Reserve System ("FRB"). The ability of a subsidiary bank to pay dividends depends on its earnings and capital levels and may be limited by their regulator's directives or orders. A bank generally must obtain regulatory approval of a dividend if the total dividends declared during the current year, including the proposed dividend, exceed net income for the current year and retained net income for the prior two years.
Prompt corrective action regulations provide five classifications: well-capitalized, adequately capitalized, undercapitalized, significantly undercapitalized and critically undercapitalized, although these terms are not used to represent overall financial condition. If an institution is adequately capitalized, regulatory approval is required to accept brokered deposits. If an institution is undercapitalized, capital distributions are limited, as is asset growth and expansion, and capital restoration plans are required. At December 31, 2016 and 2015, the most recent regulatory notification categorized the Bank and the Company as well-capitalized under the regulatory framework for prompt corrective action. There are no conditions or events since that notification that management believes have changed the institution's category. Management believes that, at December 31, 2016, the Bank and the Company met all capital adequacy requirements to which they were subject.
106
LEGACYTEXAS FINANCIAL GROUP, INC.
NOTES TO CONSOLIDATED FINANCIAL STATEMENTS
(Dollar amounts in thousands, except per share data) (Continued)
Actual | Required for Capital Adequacy Purposes | To Be Well-Capitalized | ||||||||||||||||||
Amount | Ratio | Amount | Ratio | Amount | Ratio | |||||||||||||||
As of December 31, 2016 | ||||||||||||||||||||
Total risk-based capital | ||||||||||||||||||||
the Company | $ | 910,040 | 11.71 | % | $ | 621,870 | 8.00 | % | $ | 777,338 | 10.00 | % | ||||||||
the Bank | 869,523 | 11.19 | 621,840 | 8.00 | 777,300 | 10.00 | ||||||||||||||
Tier 1 risk-based capital | ||||||||||||||||||||
the Company | 721,600 | 9.28 | 466,403 | 6.00 | 466,403 | 6.00 | ||||||||||||||
the Bank | 803,374 | 10.34 | 466,380 | 6.00 | 621,840 | 8.00 | ||||||||||||||
Common equity tier 1 risk-based capital | ||||||||||||||||||||
the Company | 709,858 | 9.13 | 349,802 | 4.50 | n/a1 | n/a1 | ||||||||||||||
the Bank | 803,374 | 10.34 | 349,785 | 4.50 | 505,245 | 6.50 | ||||||||||||||
Tier 1 leverage | ||||||||||||||||||||
the Company | 721,600 | 8.73 | 330,782 | 4.00 | n/a1 | n/a1 | ||||||||||||||
the Bank | 803,374 | 9.71 | 330,873 | 4.00 | 413,591 | 5.00 | ||||||||||||||
As of December 31, 2015 | ||||||||||||||||||||
Total risk-based capital | ||||||||||||||||||||
the Company | $ | 755,689 | 11.58 | % | $ | 522,107 | 8.00 | % | $ | 652,634 | 10.00 | % | ||||||||
the Bank | 691,554 | 10.60 | 522,116 | 8.00 | 652,645 | 10.00 | ||||||||||||||
Tier 1 risk-based capital | ||||||||||||||||||||
the Company | 635,162 | 9.73 | 391,580 | 6.00 | 391,580 | 6.00 | ||||||||||||||
the Bank | 644,461 | 9.87 | 391,587 | 6.00 | 522,116 | 8.00 | ||||||||||||||
Common equity tier 1 risk-based capital | ||||||||||||||||||||
the Company | 623,604 | 9.56 | 293,685 | 4.50 | n/a1 | n/a1 | ||||||||||||||
the Bank | 644,461 | 9.87 | 293,690 | 4.50 | 424,219 | 6.50 | ||||||||||||||
Tier 1 leverage | ||||||||||||||||||||
the Company | 635,162 | 9.46 | 268,430 | 4.00 | n/a1 | n/a1 | ||||||||||||||
the Bank | 644,461 | 9.61 | 268,273 | 4.00 | 335,341 | 5.00 | ||||||||||||||
1 Not applicable
107
LEGACYTEXAS FINANCIAL GROUP, INC.
NOTES TO CONSOLIDATED FINANCIAL STATEMENTS
(Dollar amounts in thousands, except per share data) (Continued)
Note 17 - Commitments and Contingent Liabilities
In the normal course of business, the Company enters into various transactions which, in accordance with US GAAP, are not included in its consolidated balance sheets. The Company enters into these transactions to meet the financing needs of its customers. These transactions include commitments to extend credit and standby letters of credit which involve, to varying degrees, elements of credit and interest rate risk. Credit losses up to the face amount of these instruments could occur, although material losses are not anticipated. The Company's credit policies applied to loan originations are also applied to these commitment requests, including obtaining collateral at the exercise of the commitment.
The contractual amounts of financial instruments with off‑balance sheet risk at December 31, 2016 and 2015, are summarized below. Please see Part II-Item 7- "Off-Balance Sheet Arrangements, Contractual Obligation and Commitments" of this Form 10-K for information related to commitment maturities.
December 31, | |||||||
2016 | 2015 | ||||||
Unused commitments to extend credit | $ | 1,642,528 | $ | 1,211,964 | |||
Unused capacity on Warehouse Purchase Program loans | 892,659 | 476,281 | |||||
Standby letters of credit | 29,198 | 18,644 | |||||
Total unused commitments/capacity | $ | 2,564,385 | $ | 1,706,889 | |||
Unused commitments to extend credit - The Company enters into contractual commitments to extend credit, normally with fixed expiration dates or termination clauses, at specified rates and for specific purposes. Since many commitments expire without being drawn upon, the total contractual amount of commitments does not necessarily represent future cash requirements of the Company. Substantially all of the Company's commitments to extend credit are contingent upon customers maintaining specific credit standards at the time of future loan funding.
Unused capacity on Warehouse Purchase Program loans - In regard to unused capacity on Warehouse Purchase Program loans, the Company has established maximum purchase facility amounts, but reserves the right, at any time, to refuse to buy any mortgage loans offered for sale by each customer, for any reason in the Company's sole and absolute discretion.
Standby letters of credit - Standby letters of credit are conditional commitments issued by the Company to guarantee the performance of a customer to a third party. The credit risk involved in issuing letters of credit is essentially the same as that involved in extending loan facilities to customers.
In addition to the commitments above, the Company guarantees the credit card debt of certain customers to the merchant bank that issues the credit cards. These guarantees are in place for as long as the guaranteed credit card is open. At December 31, 2016 and 2015, these credit card guarantees totaled $3,335 and $1,028, respectively. This amount represents the maximum potential amount of future payments under the guarantee, which the Company is responsible for in the event of customer non-payment.
In the third quarter of 2016, the Company established an allowance for credit losses on off-balance sheet lending-related commitments through a charge to provision for credit losses on the Company's consolidated statement of income. The establishment of this allowance for credit losses on off-balance sheet lending-related commitments was due to the expansion of the Company's lending business, as well as recent increased diversification of the types of off-balance sheet commitments offered by the Company. At December 31, 2016, this allowance for credit losses on off-balance sheet lending-related commitments, included in "other liabilities" on the Company's consolidated balance sheets, totaled $1,500. Because business processes and credit risks associated with unfunded credit commitments are essentially the same as for loans, the company utilizes similar processes to estimate its liability for unfunded credit commitments.
In addition to the commitments above, the Company had overdraft protection available in the amounts of $85,709 and $87,077 at December 31, 2016 and 2015, respectively.
The Company, at December 31, 2016, had FHLB letters of credit of $946,338 pledged to secure public deposits, repurchase agreements, and for other purposes required or permitted by law.
At December 31, 2016, the Company had $2,080 of unfunded commitments recorded in other liabilities in its consolidated
108
LEGACYTEXAS FINANCIAL GROUP, INC.
NOTES TO CONSOLIDATED FINANCIAL STATEMENTS
(Dollar amounts in thousands, except per share data) (Continued)
balance sheet related to investments in community development-oriented private equity funds used for Community Reinvestment Act purposes. The total investment in these equity funds was $11,168, with an average ownership of 5.3%.
Liability for Mortgage Loan Repurchase Losses
Residential mortgage loans are sold in the secondary market with standard representations and warranties regarding certain characteristics such as the quality of the loan, the absence of fraud, the eligibility of the loan for sale and the future servicing associated with the loan. The Company may be required to repurchase these loans at par, or make-whole or indemnify the purchasers for losses incurred when representations and warranties are breached.
The company maintains a repurchase liability related to residential mortgage loans sold with representations and warranty provisions. This repurchase liability is reported in other liabilities on the consolidated balance sheets and reflects management’s estimate of losses based on historical repurchase and loss trends, as well as other factors that may result in anticipated losses different from historical loss trends. Adjustments to this reserve are recorded in other non-interest expense on the consolidated statements of income. The liability was $143 and $147 at December 31, 2016 and 2015, respectively.
109
LEGACYTEXAS FINANCIAL GROUP, INC.
NOTES TO CONSOLIDATED FINANCIAL STATEMENTS
(Dollar amounts in thousands, except per share data) (Continued)
Note 18 - Parent Company Only Condensed Financial Information
Condensed financial information of the Company is as follows:
CONDENSED BALANCE SHEETS
December 31,
2016 | 2015 | ||||||
ASSETS | |||||||
Cash on deposit at subsidiary | $ | 16,962 | $ | 42,980 | |||
Investment in banking subsidiary | 978,880 | 824,933 | |||||
Receivable from banking subsidiary | 10,317 | 7,456 | |||||
ESOP note receivable and other assets | 13,999 | 14,498 | |||||
Total assets | $ | 1,020,158 | $ | 889,867 | |||
LIABILITIES AND SHAREHOLDERS’ EQUITY | |||||||
Borrowings | $ | 134,032 | $ | 84,992 | |||
Other liabilities | 761 | 799 | |||||
Shareholders’ equity | 885,365 | 804,076 | |||||
Total liabilities and shareholders’ equity | $ | 1,020,158 | $ | 889,867 | |||
CONDENSED STATEMENTS OF INCOME
December 31,
2016 | 2015 | 2014 | |||||||||
Cash dividends from subsidiary | $ | — | $ | 24,500 | $ | 19,187 | |||||
Excess of earnings over dividend from subsidiary | 103,572 | 48,677 | 20,044 | ||||||||
Interest income on ESOP loan | 487 | 565 | 633 | ||||||||
Interest income on subordinated debt | 11 | 17 | — | ||||||||
Other income | — | 5 | — | ||||||||
104,070 | 73,764 | 39,864 | |||||||||
Interest expense | 6,040 | 1,046 | — | ||||||||
Operating expenses | 3,236 | 3,009 | 13,036 | ||||||||
Earnings before income tax benefit | 94,794 | 69,709 | 26,828 | ||||||||
Income tax benefit | 3,027 | 1,207 | 4,450 | ||||||||
Net income | $ | 97,821 | $ | 70,916 | $ | 31,278 | |||||
110
LEGACYTEXAS FINANCIAL GROUP, INC.
NOTES TO CONSOLIDATED FINANCIAL STATEMENTS
(Dollar amounts in thousands, except per share data) (Continued)
CONDENSED STATEMENTS OF CASH FLOWS
December 31,
2016 | 2015 | 2014 | |||||||||
Cash flows from operating activities | |||||||||||
Net income | $ | 97,821 | $ | 70,916 | $ | 31,278 | |||||
Adjustments to reconcile net income to net cash from operating activities: | |||||||||||
Excess of earnings over dividend from subsidiary | (103,572 | ) | (48,677 | ) | (20,044 | ) | |||||
Amortization | 530 | 171 | — | ||||||||
Activity in share-based compensation plans | 3,152 | 3,068 | 3,096 | ||||||||
Net change in intercompany receivable | — | — | (31,395 | ) | |||||||
Net change in other assets | (481 | ) | 6,931 | (1,820 | ) | ||||||
Net change in other liabilities | (38 | ) | (14,544 | ) | 4,134 | ||||||
Net cash provided by (used in) operating activities | (2,588 | ) | 17,865 | (14,751 | ) | ||||||
Cash flows from investing activities | |||||||||||
Capital contribution (to) from subsidiary | (49,000 | ) | (40,000 | ) | 31,395 | ||||||
Cash and cash equivalents acquired from LegacyTexas Group, Inc. | — | 201 | — | ||||||||
Payments received on ESOP notes receivable | 981 | 1,495 | 1,427 | ||||||||
Net cash provided by (used in) investing activities | (48,019 | ) | (38,304 | ) | 32,822 | ||||||
Cash flows from financing activities | |||||||||||
Proceeds from borrowings | 73,439 | 73,407 | — | ||||||||
Repayments of borrowings | (24,929 | ) | (24,364 | ) | — | ||||||
Share repurchase | — | (7,989 | ) | — | |||||||
Net issuance of common stock under employee stock plans | 3,755 | 1,284 | 1,085 | ||||||||
Payment of dividends | (27,676 | ) | (25,747 | ) | (19,187 | ) | |||||
Net cash provided by (used in) financing activities | 24,589 | 16,591 | (18,102 | ) | |||||||
Net change in cash and cash equivalents | (26,018 | ) | (3,848 | ) | (31 | ) | |||||
Beginning cash and cash equivalents | 42,980 | 46,828 | 46,859 | ||||||||
Ending cash and cash equivalents | $ | 16,962 | $ | 42,980 | $ | 46,828 | |||||
111
LEGACYTEXAS FINANCIAL GROUP, INC.
NOTES TO CONSOLIDATED FINANCIAL STATEMENTS
(Dollar amounts in thousands, except per share data) (Continued)
NOTE 19 - Quarterly Financial Data (Unaudited)
Net Interest Income | Provision for Credit Losses | Securities Gains and (Losses) | Earnings per Share | ||||||||||||||||||||||||||
Interest Income | Interest Expense | Net Income | Basic | Diluted | |||||||||||||||||||||||||
2016 | |||||||||||||||||||||||||||||
First quarter | $ | 72,608 | $ | 7,257 | $ | 65,351 | $ | 8,800 | $ | — | $ | 22,082 | 0.48 | 0.48 | |||||||||||||||
Second quarter | 77,336 | 7,982 | 69,354 | 6,800 | 65 | 23,217 | 0.50 | 0.50 | |||||||||||||||||||||
Third quarter | 82,911 | 9,431 | 73,480 | 3,467 | (3 | ) | 27,217 | 0.59 | 0.58 | ||||||||||||||||||||
Fourth quarter | 84,497 | 10,413 | 74,084 | 7,833 | (6 | ) | 25,305 | 0.54 | 0.54 | ||||||||||||||||||||
2015 | |||||||||||||||||||||||||||||
First quarter | $ | 61,618 | $ | 5,292 | $ | 56,326 | $ | 3,000 | $ | 211 | $ | 16,324 | 0.35 | 0.35 | |||||||||||||||
Second quarter | 64,967 | 5,146 | 59,821 | 3,750 | — | 20,251 | 0.44 | 0.44 | |||||||||||||||||||||
Third quarter | 66,525 | 5,337 | 61,188 | 7,515 | (25 | ) | 17,895 | 0.39 | 0.38 | ||||||||||||||||||||
Fourth quarter | 69,582 | 5,840 | 63,742 | 11,200 | 17 | 16,446 | 0.36 | 0.35 | |||||||||||||||||||||
Note 20 — Subsequent Events
The Company evaluated events from the date of the consolidated financial statements on December 31, 2016 through the issuance of those consolidated financial statements included in this Annual Report on Form 10-K dated February 9, 2017.
112
Item 9. | Changes in and Disagreements with Accountants on Accounting and Financial Disclosure |
None.
Item 9A. | Controls and Procedures |
(a) | Evaluation of Disclosure Controls and Procedures: An evaluation of our disclosure controls and procedures (as defined in Rule 13a-15(e) under the Securities Exchange Act of 1934 (the “Act”)) as of December 31, 2016, was carried out under the supervision and with the participation of our Chief Executive Officer, Principal Financial Officer and several other members of our senior management. Our Chief Executive Officer and Principal Financial Officer concluded that, as of December 31, 2016, our disclosure controls and procedures were effective in ensuring that the information we are required to disclose in the reports we file or submit under the Act is (i) accumulated and communicated to our management (including the Chief Executive Officer and Principal Financial Officer) in a timely manner, and (ii) recorded, processed, summarized and reported within the time periods specified in the SEC’s rules and forms. |
(b) | Management’s Report on Internal Control Over Financial Reporting: Management of the Company is responsible for establishing and maintaining an effective system of internal control over financial reporting. The Company’s system of internal control over financial reporting is designed to provide reasonable assurance regarding the reliability of financial reporting and the preparation of financial statements for external purposes in accordance with generally accepted accounting principles. There are inherent limitations in the effectiveness of any system of internal control over financial reporting, including the possibility of human error and circumvention or overriding of controls. Accordingly, even an effective system of internal control over financial reporting can provide only reasonable assurance with respect to financial statement preparation. Projections of any evaluation of effectiveness to future periods are subject to the risks that controls may become inadequate because of changes in conditions or that the degree of compliance with the policies or procedures may deteriorate. |
Management assessed the Company’s systems of internal control over financial reporting as of December 31, 2016. This assessment was based on criteria for effective internal control over financial reporting described in Internal Control — Integrated Framework issued by the Committee of Sponsoring Organizations of the Treadway Commission (2013 framework). Based on this assessment, management believes that, as of December 31, 2016, the Company maintained effective internal control over financial reporting based on those criteria. The Company’s independent registered public accounting firm that audited the financial statements included in this annual report on Form 10-K has issued an attestation report on the Company’s internal control over financial reporting. The attestation report of Ernst & Young LLP appears below.
Report of Independent Registered Public Accounting Firm
The Board of Directors and Shareholders of
LegacyTexas Financial Group, Inc.
We have audited LegacyTexas Financial Group, Inc.’s (the "Company's") internal control over financial reporting as of December 31, 2016, based on criteria established in Internal Control-Integrated Framework issued by the Committee of Sponsoring Organizations of the Treadway Commission (2013 framework) (the COSO criteria). LegacyTexas Financial Group, Inc.’s management is responsible for maintaining effective internal control over financial reporting, and for its assessment of the effectiveness of internal control over financial reporting included in the accompanying Management’s Report on Internal Control Over Financial Reporting. Our responsibility is to express an opinion on the Company’s internal control over financial reporting based on our audit.
We conducted our audit in accordance with the standards of the Public Company Accounting Oversight Board (United States). Those standards require that we plan and perform the audit to obtain reasonable assurance about whether effective internal control over financial reporting was maintained in all material respects. Our audit included obtaining an understanding of internal control over financial reporting, assessing the risk that a material weakness exists, testing and evaluating the design and operating effectiveness of internal control based on the assessed risk, and performing such other procedures as we considered necessary in the circumstances. We believe that our audit provides a reasonable basis for our opinion.
A company’s internal control over financial reporting is a process designed to provide reasonable assurance regarding the reliability of financial reporting and the preparation of financial statements for external purposes in accordance with generally accepted accounting principles. A company’s internal control over financial reporting includes those policies and procedures that (1) pertain
113
to the maintenance of records that, in reasonable detail, accurately and fairly reflect the transactions and dispositions of the assets of the company; (2) provide reasonable assurance that transactions are recorded as necessary to permit preparation of financial statements in accordance with generally accepted accounting principles, and that receipts and expenditures of the company are being made only in accordance with authorizations of management and directors of the company; and (3) provide reasonable assurance regarding prevention or timely detection of unauthorized acquisition, use, or disposition of the company’s assets that could have a material effect on the financial statements.
Because of its inherent limitations, internal control over financial reporting may not prevent or detect misstatements. Also, projections of any evaluation of effectiveness to future periods are subject to the risk that controls may become inadequate because of changes in conditions, or that the degree of compliance with the policies or procedures may deteriorate.
In our opinion, LegacyTexas Financial Group, Inc. maintained, in all material respects, effective internal control over financial reporting as of December 31, 2016, based on the COSO criteria.
We also have audited, in accordance with the standards of the Public Company Accounting Oversight Board (United States), the consolidated balance sheets as of December 31, 2016 and 2015, and the related consolidated statements of income, comprehensive income, changes in shareholders’ equity, and cash flows for each of the three years in the period ended December 31, 2016 of LegacyTexas Financial Group, Inc. and our report dated February 9, 2017 expressed an unqualified opinion thereon.
/s/ Ernst & Young
Dallas, Texas
February 9, 2017
(c) | Changes in Internal Control Over Financial Reporting: During the quarter ended December 31, 2016, no change occurred in our internal control over financial reporting that has materially affected, or is reasonably likely to materially affect, our internal control over financial reporting. |
Item 9B. | Other Information |
Not applicable.
114
PART III
Item 10. | Directors, Executive Officers and Corporate Governance |
Directors and Executive Officers. The information concerning our directors required by this item is incorporated herein by reference from our definitive proxy statement for our Annual Meeting of Shareholders being held on May 22, 2017, a copy of which will be filed with the Securities and Exchange Commission not later than 120 days after the end of our fiscal year. Information required by this item regarding the audit committee of the Company’s Board of Directors, including information regarding the audit committee financial expert serving on the audit committee, is incorporated herein by reference from our definitive proxy statement for our Annual Meeting of Shareholders being held on May 22, 2017, a copy of which will be filed with the Securities and Exchange Commission not later than 120 days after the end of our fiscal year. Information about our executive officers is contained under the caption “Executive Officers” in Part I of this Form 10-K, and is incorporated herein by this reference.
Section 16(a) Beneficial Ownership Reporting Compliance. The information concerning compliance with the reporting requirements of Section 16(a) of the Securities Exchange Act of 1934 by our directors, officers and ten percent shareholders required by this item is incorporated herein by reference from our definitive proxy statement for our Annual Meeting of Shareholders being held on May 22, 2017, a copy of which will be filed with the Securities and Exchange Commission not later than 120 days after the end of our fiscal year.
Code of Ethics. We have adopted a code of ethics that applies to our principal executive officer, principal financial officer and persons performing similar functions, and to all of our other employees and our directors. A copy of our code of ethics is available on our Internet website address, www.legacytexasfinancialgroup.com.
Nominating Committee Procedures. There have been no material changes to the procedures by which shareholders may recommend nominees to our Board of Directors since last described to shareholders.
Item 11. | Executive Compensation |
The information concerning compensation required by this item is incorporated herein by reference from our definitive proxy statement for our Annual Meeting of Shareholders being held on May 22, 2017, a copy of which will be filed with the Securities and Exchange Commission not later than 120 days after the end of our fiscal year.
Item 12. | Security Ownership of Certain Beneficial Owners and Management and Related Shareholder Matters |
The information concerning security ownership of certain beneficial owners and management and our equity incentive plan required by this item is incorporated herein by reference from our definitive proxy statement for our Annual Meeting of Shareholders being held on May 22, 2017, a copy of which will be filed with the Securities and Exchange Commission not later than 120 days after the end of our fiscal year. Information regarding our equity compensation plans is included in Item 5 of this Form 10-K.
Item 13. | Certain Relationships and Related Transactions, and Director Independence |
The information concerning certain relationships and related transactions and director independence required by this item is incorporated herein by reference from our definitive proxy statement for our Annual Meeting of Shareholders being held on May 22, 2017, a copy of which will be filed with the Securities and Exchange Commission not later than 120 days after the end of our fiscal year.
Item 14. | Principal Accountant Fees and Services |
The information concerning principal accountant fees and services is incorporated herein by reference from our definitive proxy statement for our Annual Meeting of Shareholders being held on May 22, 2017, a copy of which will be filed not later than 120 days after the end of our fiscal year.
115
PART IV
Item 15. | Exhibits, Financial Statement Schedules |
(a)(1) | Financial Statements: See Part II—Item 8. Financial Statements and Supplementary Data. |
(a)(2) | Financial Statement Schedules: All financial statement schedules have been omitted as the information is included in the notes to the consolidated financial statements or is not required under the related instructions or is not applicable. |
(a)(3) | Exhibits: See below. |
(b) | Exhibits: |
Exhibit | |||
Number | Description | ||
2.1 | Agreement and Plan of Merger, dated as of November 25, 2013, by and between the Registrant and LegacyTexas Group, Inc. (incorporated herein by reference to Exhibit 2.1 of the Registrant’s Current Report on Form 8-K filed with the SEC on November 25, 2013 (File No. 001-34737)) | ||
2.2 | Amendment No. One to the Agreement and Plan of Merger, dated as of February 19, 2014, by and between the Registrant and LegacyTexas Group, Inc. (incorporated herein by reference to Exhibit 2.3 of the Registrant’s Annual Report on Form 10-K filed with the SEC on February 26, 2014 (File No. 001-34737)) | ||
2.3 | Amendment No. Two to the Agreement and Plan of Merger, dated as of August 29, 2014, by and between the Registrant and LegacyTexas Group, Inc. (incorporated herein by reference to Exhibit 2.1 of the Registrant’s Current Report on Form 8-K filed with the SEC on August 29, 2014 (File No. 001-34737)) | ||
3.1 | Charter of the Registrant (incorporated herein by reference to Exhibit 3.1 of the Registrant’s Current Report on Form 8-K filed with the SEC on January 6, 2015 (File No. 001-34737)) | ||
3.2 | Bylaws of the Registrant (incorporated herein by reference to Exhibit 3.2 of the Registrant’s Current Report on Form 8-K filed with the SEC on January 6, 2015 (File No. 001-34737)) | ||
4.1 | Certificate of Registrant’s Common Stock (incorporated herein by reference to Exhibit 4.1 of the Registrant’s Current Report on Form 8-K filed with the SEC on January 6, 2015 (File No. 001-34737)) | ||
4.2 | The Registrant hereby agrees to furnish to the Commission, upon request, the instruments defining the rights of the holders of each issue of long-term debt of the Registrant and its consolidated subsidiaries. | ||
10.1 | ViewPoint Bank Deferred Compensation Plan (incorporated herein by reference to Exhibit 10.7 to the Registrant’s Registration Statement on Form S-1, as amended (File No. 0-24566-01)) | ||
10.2 | Amended and Restated ViewPoint Bank Supplemental Executive Retirement Plan (incorporated herein by reference to Exhibit 10.8 to the Registrant’s Registration Statement on Form S-1, as amended (File No. 0-24566-01)) | ||
10.3 | 2016 Executive Annual Incentive Plan (incorporated herein by reference to Exhibit 10.1 to the Registrant’s Current Report on Form 8-K filed with the SEC on March 3, 2016 (File No. 001-34737)) | ||
10.4 | Change in Control and Severance Benefits Agreement entered into between the Registrant and Mays Davenport (incorporated herein by reference to Exhibit 10.1 to the Registrant's Current Report on Form 8-K filed with the SEC on November 25, 2013 (File No. 001-34737)). | ||
10.5 | Form of Change In Control and Severance Benefits Agreement entered into between the Registrant and the following executive officers: Scott A. Almy, Charles D. Eikenberg, Thomas S. Swiley, and Mark L. Williamson (incorporated herein by reference to Exhibit 10.1 to the Registrant's Current Report on Form 8-K filed with the SEC on December 2, 2013 (File No. 001-34737)). | ||
116
10.6 | Amended and Restated Executive Employment Agreement entered into by the Registrant on December 2, 2013 with Kevin J. Hanigan (incorporated herein by reference to Exhibit 10.2 to the Registrant's Current Report on Form 8-K filed with the SEC on December 2, 2013 (File No. 001-34737)). | ||
10.7 | Registrant's 2007 Equity Incentive Plan (incorporated herein by reference to Appendix A to the proxy statement filed with the SEC on March 30, 2007 (File No. 001-32992)) | ||
10.8 | Registrant's 2012 Equity Incentive Plan (incorporated herein by reference to Appendix A to the Registrant's proxy statement filed with the SEC on April 4, 2012 (File No. 001-34737)) | ||
10.9 | Forms of Incentive Stock Option, Non-Qualified Stock Option, and Restricted Stock (time and performance-based) Agreements under the 2012 Equity Incentive Plan (incorporated herein by reference to the Exhibits to the Registrant's Registration Statement on Form S-8 filed with the SEC on June 14, 2012 (File No. 333-182122)) | ||
10.10 | Form of 2012 Equity Incentive Plan Restricted Stock Award and Non-Solicitation Agreement (incorporated herein by reference to Exhibit 10.10 to the Registrant's Quarterly Report on Form 10-Q filed with the SEC on July 26, 2016 (File No. 001-34737)) | ||
10.11 | Form of 2012 Equity Incentive Plan Non-Employee Restricted Stock Award Agreement (incorporated herein by reference to Exhibit 10.11 to the Registrant's Quarterly Report on Form 10-Q filed with the SEC on July 26, 2016 (File No. 001-34737)) | ||
11 | Statement regarding computation of per share earnings (See Note 3 of the Notes to Consolidated Audited Financial Statements included in this Form 10-K). | ||
21 | Subsidiaries of the Registrant | ||
23 | Consent of Independent Registered Public Accounting Firm | ||
24 | Power of Attorney (on signature page) | ||
31.1 | Rule 13a — 14(a)/15d — 14(a) Certification (Chief Executive Officer) | ||
31.2 | Rule 13a — 14(a)/15d — 14(a) Certification (Principal Financial Officer) | ||
32 | Section 1350 Certifications | ||
101 | Financial statements from Annual Report on Form 10-K of the Registrant for the year ended December 31, 2016, formatted in eXtensible Business Reporting Language (XBRL): (i) the Consolidated Balance Sheets, (ii) the Consolidated Statements of Income, (iii) the Consolidated Statements of Comprehensive Income, (iv) the Consolidated Statements of Changes in Shareholders’ Equity, (v) the Consolidated Statements of Cash Flows and (vi) the Notes to Consolidated Audited Financial Statements. | ||
117
SIGNATURES
Pursuant to the requirements of Section 13 or 15 (d) of the Securities Exchange Act of 1934, the Registrant has duly caused this report to be signed on its behalf by the undersigned hereunto duly authorized.
LEGACYTEXAS FINANCIAL GROUP, INC. (Registrant) | ||||
Date: | February 9, 2017 | By: | /s/ Kevin J. Hanigan | |
Kevin J. Hanigan | ||||
President and Chief Executive Officer (Principal Executive Officer) | ||||
KNOW ALL MEN BY THESE PRESENTS, that each person whose signature appears below constitutes and appoints each of Kevin J. Hanigan and J. Mays Davenport his or her true and lawful attorney-in-fact and agent, with full power of substitution and re-substitution, for him/her and in his/her name, place and stead, in any and all capacities, to sign any amendment to LegacyTexas Financial Group, Inc.’s Annual Report on Form 10-K for the year ended December 31, 2016, and to file the same, with all exhibits thereto, and all other documents in connection therewith, with the Securities and Exchange Commission, granting unto each said attorney-in-fact and agent full power and authority to do and perform each and every act and thing requisite and necessary to be done, as fully to all intents and purposes as he or she might or could do in person, hereby ratifying and confirming said attorney-in-fact and agent or his or her substitute or substitutes may lawfully do or cause to be done by virtue hereof.
Pursuant to the requirements of the Securities Exchange Act of 1934, this report has been signed below by the following persons on behalf of the Registrant and in the capacities and on the dates indicated.
/s/ Anthony J. LeVecchio | Date: | February 9, 2017 |
Anthony J. LeVecchio, Chairman of the Board and Director | ||
/s/ Arcilia Acosta | Date: | February 9, 2017 |
Arcilia Acosta, Director | ||
/s/ George A. Fisk | Date: | February 9, 2017 |
George A. Fisk, Director | ||
/s/ Bruce W. Hunt | Date: | February 9, 2017 |
Bruce W. Hunt, Director | ||
/s/ James Brian McCall | Date: | February 9, 2017 |
James Brian McCall, Director | ||
/s/ Karen H. O'Shea | Date: | February 9, 2017 |
Karen H. O'Shea, Director | ||
/s/ Greg Wilkinson | Date: | February 9, 2017 |
Greg Wilkinson, Director | ||
/s/ J. Mays Davenport | Date: | February 9, 2017 |
J. Mays Davenport, Executive Vice President and Chief Financial Officer (Principal Financial and Accounting Officer) | ||
118
EXHIBIT INDEX
Exhibits: | ||
21 | Subsidiaries of the Registrant | |
23 | Consent of Independent Registered Public Accounting Firm | |
31.1 | Certification of the Chief Executive Officer | |
31.2 | Certification of the Principal Financial Officer | |
32 | Section 1350 Certifications | |
101 | Financial statements from Annual Report on Form 10-K of the Registrant for the year ended December 31, 2016, formatted in eXtensible Business Reporting Language (XBRL): (i) the Consolidated Balance Sheets, (ii) the Consolidated Statements of Income, (iii) the Consolidated Statements of Comprehensive Income, (iv) the Consolidated Statements of Changes in Shareholders’ Equity, (v) the Consolidated Statements of Cash Flows and (vi) the Notes to Consolidated Audited Financial Statements. | |
119