Attached files
| file | filename |
|---|---|
| 8-K - 8-K - Knight-Swift Transportation Holdings Inc. | d425939d8k.htm |
Exhibit 99

October 22, 2012
Dear Fellow Stockholders of Swift Transportation Company (NYSE: SWFT),
A summary of our key results for the three and nine months ended September 30th is shown below:
| Three Months Ended September 30, | Nine Months Ended September 30, | |||||||||||||||
| 2012 | 2011 | 2012 | 2011 | |||||||||||||
| Unaudited | ||||||||||||||||
| ($ in millions, except per share data) | ||||||||||||||||
| Operating Revenue |
$ | 871.1 | $ | 863.8 | $ | 2,570.6 | $ | 2,473.2 | ||||||||
| Net Revenue1 |
$ | 702.4 | $ | 691.3 | $ | 2,063.1 | $ | 1,984.5 | ||||||||
| Operating Ratio |
91.9 | % | 89.6 | % | 91.6 | % | 91.5 | % | ||||||||
| Adjusted Operating Ratio2 |
89.4 | % | 86.4 | % | 89.0 | % | 88.8 | % | ||||||||
| EBITDA |
$ | 124.2 | $ | 145.6 | $ | 357.8 | $ | 377.4 | ||||||||
| Adjusted EBITDA2 |
$ | 125.6 | $ | 146.4 | $ | 385.2 | $ | 382.9 | ||||||||
| Diluted EPS |
$ | 0.20 | $ | 0.22 | $ | 0.49 | $ | 0.38 | ||||||||
| Adjusted EPS2 |
$ | 0.21 | $ | 0.25 | $ | 0.62 | $ | 0.50 | ||||||||
| 1 | Net Revenue is operating revenue, excluding fuel surcharge revenue |
| 2 | See GAAP to Non-GAAP reconciliation in the schedules following this letter |
Highlights (discussed in more detail below, including GAAP to non-GAAP reconciliations):
| • | Third quarter 2012 Adjusted EPS of $0.21 versus $0.25 in the third quarter of 2011 reflects continued operational improvements offset by softer freight volumes combined with rising fuel costs and absorption of previously announced driver and owner-operator pay changes |
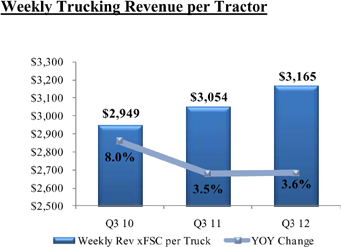
| • | Revenue per truck per week increased 3.6% over the third quarter 2011 driven by continued improvement in asset utilization and revenue per loaded mile |
| • | Deadhead of 11.4% for the third quarter of 2012 represents the lowest level since 2006 |
| • | Intermodal business continues to grow significantly, increasing 41.5% in the third quarter on a year over year basis |
| • | Reduction in Net Debt of $32 million during the quarter, bringing the year to date reduction to $104 million, which is ahead of our annual target of $50—$100 million |

|
1 |
Earnings Overview
For the third quarter ended September 30, 2012, we realized adjusted diluted earnings per share, or Adjusted EPS, of $0.21 compared to $0.25 per share in the same quarter of 2011. Diluted earnings per share, in accordance with GAAP, for the third quarter of 2012 and 2011 were $0.20 and $0.22, respectively. A reconciliation of GAAP results to non-GAAP results, as adjusted to exclude certain non-cash or special items, is provided in the schedules following this letter.
We continue to see positive year over year trends in our operational metrics despite the softness in the freight market experienced in the third quarter. Intermodal Revenue grew by 41.5% in the third quarter of 2012 when compared with the same quarter of 2011, asset utilization improved as we continue to focus on Return on Net Assets (RONA), our third quarter deadhead is at its lowest level since 2006, our driver retention improved dramatically from the second quarter, and our debt continues to decline as we make voluntary debt payments. The initiatives we have implemented are having a positive impact, and as the market strengthens, these initiatives should enable us to achieve even better results.
The larger cost increases on a year over year basis include higher fuel expense, further impacted by the lag effect of our fuel surcharge program, and driver/owner-operator pay packages. Fuel prices increased by over $0.40 per gallon in the third quarter of 2012 compared to a decrease of roughly $0.06 per gallon in the third quarter of 2011. Due to the lag effect associated with billing fuel as explained below, the year over year negative impact due to fuel recovery in the third quarter of 2012 was approximately $0.035-$0.040 per share. As we discussed in our second quarter Letter to Stockholders, we implemented a driver incentive program and an owner-operator banded-pay program at the beginning of the third quarter. These programs reward our drivers and owner-operators for behaviors that should help Swift become more efficient as well as enable our driving partners to take home more money. The programs have been well received and are a contributing factor, along with our focus on a driver friendly environment, to our improved retention and recruitment levels. We estimate the combined cost of these changes to be roughly $0.020-$.025 per share in the third quarter of 2012 before considering any operational benefits.
Consistent with seasonal trends, July freight volumes were down sequentially for our trucking services and were then generally consistent throughout the remainder of the third quarter. We did not see a pickup in mid-August similar to prior year industry seasonal patterns; however, we did experience a slight uptick in the last week of September, which has continued through the first couple weeks of October. We believe that freight volumes will remain on this trend through the holiday season. Additionally, we are expecting a benefit from our typical seasonal projects in the fourth quarter.
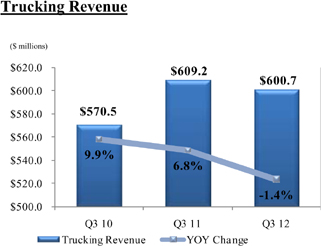
Trucking Revenue and Metrics
Trucking Revenue, which excludes fuel surcharge revenue, decreased 1.4% during the third quarter of 2012, largely due to a 4.9% reduction in the size of our average operational fleet count. Although we had 738 fewer trucks in the third quarter of 2012 when compared to the third quarter of 2011, we were able to generate relatively consistent revenue figures by improving our Weekly Trucking Revenue per Tractor, which is a combination of revenue per loaded mile and loaded miles per truck per week (loaded utilization). Our loaded utilization continued its upward momentum with our over-the-road linehaul service improving 73 miles per truck per week during the third quarter of 2012, when compared to the prior year. Growth in trucking revenue per loaded mile, excluding fuel surcharges, slowed to less than 2% for the third quarter of 2012 versus the third quarter of 2011. This metric is negatively impacted by the continued shift in business mix from our over-the-road linehaul service to our other service offerings. If the current mix trends and the overall trends in the current freight environment continue, trucking revenue per loaded mile improvement for the full year could fall between 2.0%—3.0%, as opposed to the 3.0%—3.5% discussed previously.
|
|
2 |
|
|
Average Operational Truck Count
As a result of the softer freight environment, we made the decision to slightly reduce our truck count in order to better align our capacity with market freight volumes, enabling us to generate higher returns on our assets. Consequently, our average operational truck count decreased sequentially by 1.3% or 185 trucks to 14,442 during the third quarter 2012 compared to 14,627 during the second quarter of 2012. This equates to a 4.9% reduction from the third quarter of 2011.
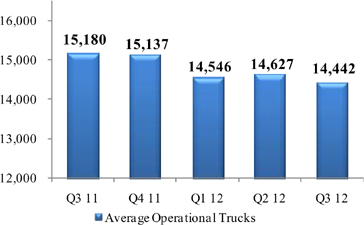
We continue to monitor the freight environment and expect to adjust our truck count to match market conditions. As such, as volumes began to rise at the end of the third quarter and into the first three weeks of October, we expanded our fleet and are currently near 14,600. If volumes decline at the end of the fourth quarter, following the holiday season, we will likely reduce our fleet again at that time.
|
|
3 |
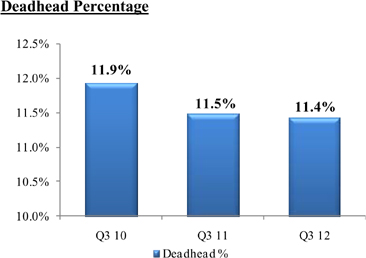
Another key statistic that directly impacts profitability is deadhead percentage, which represents the percent of total miles driven without revenue-generating freight being transported. The adjacent chart illustrates our continued improvement in this measure. We achieved 11.4% deadhead for the third quarter of 2012, which represents a 10 bps and 50 bps reduction from the third quarter of 2011 and 2010, respectively. These improvements are due to better management of our fleet size and our network. As a result of the various network engineering initiatives, which we have shared in previous quarters, our deadhead percentage for the third quarter was at its lowest level since the third quarter of 2006.
Other Revenue
Other Revenue includes revenue generated by our intermodal and brokerage services, excluding the revenue associated with dray or other truck moves performed by Swift (which are recorded in our trucking revenue), as well as revenue generated by our subsidiaries offering support services to customers and owner-operators, including shop maintenance, equipment leasing, and insurance. In the third quarter of 2012, Other Revenue increased 23.8% compared to the same quarter in 2011 driven primarily by growth in our intermodal business.
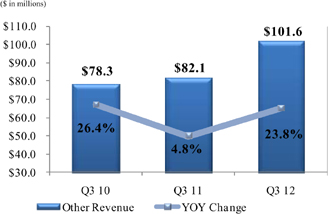
Our intermodal business continued its positive trends with revenue growth of 41.5% over the third quarter of 2011, and a sequential increase of 8.9%. As discussed previously, our plan for the second half of 2012 was to add 2,000+ intermodal containers. As of September 30, 2012, we have received approximately 1,500 of those containers. As we add them into our network, these incremental containers, combined with new customer orders, should facilitate continued favorable revenue trends for this business.
|
|
4 |
Operating Expenses
| YOY | QOQ | |||||||||||||||||||||||
| Q3 ’12 |
Q3 ’11 | Variance1 | ($ in millions) | Q3 ’12 | Q2 ’12 | Variance1 | ||||||||||||||||||
| $ | 871.1 | $ | 863.8 | 0.8 | % | Total Revenue | $ | 871.1 | $ | 872.6 | -0.2 | % | ||||||||||||
| (168.7 | ) | (172.5 | ) | -2.2 | % | Less: Fuel Surcharge Revenue | (168.7 | ) | (176.0 | ) | -4.1 | % | ||||||||||||
|
|
|
|
|
|
|
|
|
|||||||||||||||||
| $ | 702.4 | $ | 691.3 | 1.6 | % | Net Revenue | $ | 702.4 | $ | 696.6 | 0.8 | % | ||||||||||||
|
|
|
|
|
|
|
|
|
|
|
|
|
|||||||||||||
| $ | 200.0 | $ | 197.0 | -1.5 | % | Salaries, Wages & Benefits | $ | 200.0 | $ | 198.6 | -0.7 | % | ||||||||||||
| 28.5 | % | 28.5 | % | 0 | bps | % of Net Revenue | 28.5 | % | 28.5 | % | 0 | bps | ||||||||||||
| $ | 63.8 | $ | 61.8 | -3.2 | % | Operating Supplies & Expenses | $ | 63.8 | $ | 63.4 | -0.6 | % | ||||||||||||
| 9.1 | % | 8.9 | % | -20 | bps | % of Net Revenue | 9.1 | % | 9.1 | % | 0 | bps | ||||||||||||
| $ | 25.7 | $ | 21.3 | -21.0 | % | Insurance & Claims | $ | 25.7 | $ | 26.3 | 2.2 | % | ||||||||||||
| 3.7 | % | 3.1 | % | -60 | bps | % of Net Revenue | 3.7 | % | 3.8 | % | 10 | bps | ||||||||||||
| $ | 6.2 | $ | 6.8 | 9.7 | % | Communication & Utilities | $ | 6.2 | $ | 6.0 | -3.0 | % | ||||||||||||
| 0.9 | % | 1.0 | % | 10 | bps | % of Net Revenue | 0.9 | % | 0.9 | % | 0 | bps | ||||||||||||
| $ | 14.9 | $ | 16.5 | 9.1 | % | Operating Taxes & Licenses | $ | 14.9 | $ | 15.4 | 3.2 | % | ||||||||||||
| 2.1 | % | 2.4 | % | 30 | bps | % of Net Revenue | 2.1 | % | 2.2 | % | 10 | bps | ||||||||||||
| 1 | Positive numbers represent favorable variances, negative numbers represent unfavorable variances |
The table above highlights some of our cost categories for the third quarter of 2012, compared to the third quarter of 2011 and the second quarter of 2012, showing each as a percent of Net Revenue, which excludes fuel surcharge revenue. Fuel surcharge revenue can be volatile and is primarily dependent upon the cost of fuel and not specifically related to our non-fuel operational expenses. Therefore, we believe that Net Revenue is a better measure for analyzing our expenses and operating metrics.
Salaries wages and benefits increased $3.0 million to $200.0 million during the third quarter of 2012 compared to $197.0 million for the third quarter of 2011. This year over year increase resulted from the company driver pay changes and an increase in the number of non-driving employees, partially offset by a reduction in the number of miles driven by our company drivers. As discussed in our prior quarter Letter to Stockholders, in July, we implemented a driver pay program that provides a bonus for drivers if they met certain performance criteria. This bonus program, as well as a wage increase for certain drivers, increased driver wages by approximately $3.5 million during the third quarter of 2012. As a percent of Net Revenue, salaries, wages and benefits remained flat at 28.5% due to the items mentioned above, partially offset by growth in our intermodal business.
Insurance and claims expense increased by $4.4 million, from $21.3 million for the third quarter of 2011, to $25.7 million for the third quarter of 2012. As discussed in our third quarter 2011 Letter to Stockholders, insurance expense in that quarter was lower than expected due to favorable actuarial adjustments in the prior year loss layers. As a percent of Net Revenue, insurance and claims was 3.7% for the third quarter of 2012 which is in line with the second quarter of 2012 as well as the full year guidance given at the beginning of 2012.
|
|
5 |
Fuel Expense
| Q3 ’12 |
Q3 ’11 | ($ in millions, except D.O.E Diesel Fuel Index) | Q3 ’12 | Q2 ’12 | ||||||||||||
| $ | 151.7 | $ | 159.7 | Fuel Expense | $ | 151.7 | $ | 145.8 | ||||||||
| 17.4 | % | 18.5 | % | % of Total Revenue | 17.4 | % | 16.7 | % | ||||||||
| $168.7 | $ | 172.5 | Fuel Surcharge Revenue (FSR) | $ | 168.7 | $ | 176.0 | |||||||||
| (73.7 | ) | (68.0 | ) | Less: FSR Reimbursed to Third Parties | (73.7 | ) | (72.7 | ) | ||||||||
|
|
|
|
|
|
|
|
|
|||||||||
| $ | 95.0 | $ | 104.5 | Company Fuel Surcharge Revenue | $ | 95.0 | $ | 103.3 | ||||||||
|
|
|
|
|
|
|
|
|
|||||||||
| $ | 151.7 | $ | 159.7 | Fuel Expense | $ | 151.7 | $ | 145.8 | ||||||||
| (95.0 | ) | (104.5 | ) | Less: Company FSR | (95.0 | ) | (103.3 | ) | ||||||||
|
|
|
|
|
|
|
|
|
|||||||||
| $ | 56.7 | $ | 55.2 | Net Fuel Expense | $ | 56.7 | $ | 42.5 | ||||||||
|
|
|
|
|
|
|
|
|
|||||||||
| 8.1 | % | 8.0 | % | % of Net Revenue | 8.1 | % | 6.1 | % | ||||||||
| $ | 3.924 | $ | 3.867 | Average D.O.E. Diesel Fuel Index | $ | 3.924 | $ | 3.963 | ||||||||
| 1.5 | % | 31.5 | % | Year over Year % Change | 1.5 | % | -1.3 | % | ||||||||
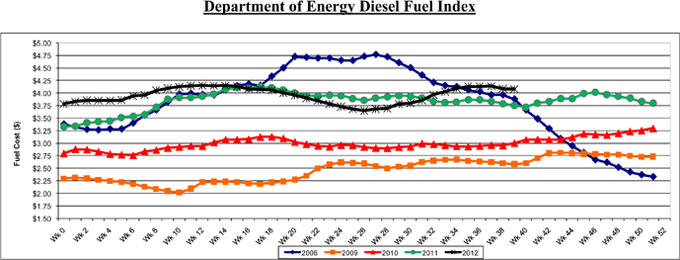
Fuel expense for the third quarter of 2012 was $151.7 million, representing a decrease of 5.0% from the third quarter of 2011. We collect fuel surcharge revenue from our customers to help mitigate increases in fuel prices. The surcharges are primarily based on the Department of Energy (D.O.E.) Diesel Fuel Index, which is set each week based on retail prices at various truck stops around the country. We utilize a portion of our fuel surcharge revenue to reimburse owner-operators and other third parties, such as the railroads, who also must pay for fuel. To evaluate the effectiveness of our fuel surcharges, we deduct the portion we pay to third parties, and then subtract the remaining company-related fuel surcharge revenue from our fuel expense. This calculation of Net Fuel Expense is shown above.
Net Fuel Expense increased to $56.7 million in the third quarter of 2012 compared to $55.2 million in 2011. This increase was driven by the lag in fuel recovery associated with increasing fuel prices in the third quarter of 2012 compared with decreasing fuel prices in the third quarter of 2011, mostly offset by a reduction in gallons consumed due to a 4.1% reduction in the number of miles driven by company tractors and improved fuel efficiency. As we have discussed previously, in periods of rising prices, we are negatively impacted due to the structural lag in billing fuel surcharges. We typically bill fuel surcharges based on the D.O.E. average from the prior week, but we pay for fuel based on current day prices. In periods of falling prices, we benefit from this lag as we recover some of the losses incurred as prices rose. Within the third quarter of 2012, the D.O.E. index increased 12% or over $0.40 per gallon, whereas in the third quarter of 2011 fuel prices were falling. The year over year negative impact associated with the lag in fuel surcharge recovery during the third quarter of 2012 is roughly $0.035 to $0.040 per share.
Sequentially, Net Fuel Expense increased $14.2 million to $56.7 for the third quarter of 2012 compared with $42.5 million for the second quarter of 2012. This increase can be attributed to the increase in fuel prices throughout the third quarter of 2012 and the associated fuel surcharge recovery lag. As you may recall, in our Letter to Stockholders for the second quarter of 2012, we cited an 11% reduction in the D.O.E. index within that quarter, which contributed a benefit of $0.030—$0.035 per share in the second quarter, on a year over year basis.
|
|
6 |
Historical fuel prices are shown in the graph below:
Purchased Transportation
Purchased transportation includes payments to owner-operators, railroads and other third parties we use for intermodal drayage and other brokered business. In the third quarter of 2012, this expense increased $24.2 million over the third quarter of 2011. A portion of the payments made to our partners is for fuel reimbursements. Fuel reimbursements increased $5.7 million year over year, primarily associated with the growth in our intermodal business.
| Q3 ’12 |
Q3 ’11 | ($ in millions) | Q3 ’12 | Q2 ’12 | ||||||||||||
| $ | 258.9 | $ | 234.7 | Purchased Transportation | $ | 258.9 | $ | 252.7 | ||||||||
| 29.7 | % | 27.2 | % | % of Total Revenue | 29.7 | % | 29.0 | % | ||||||||
| (73.7 | ) | (68.0 | ) | Less: FSR Reimbursed to Third Parties | (73.7 | ) | (72.7 | ) | ||||||||
|
|
|
|
|
|
|
|
|
|||||||||
| $ | 185.2 | $ | 166.7 | Net Purchased Transportation | $ | 185.2 | $ | 180.0 | ||||||||
| 26.4 | % | 24.1 | % | % of Net Revenue | 26.4 | % | 25.8 | % | ||||||||
During the third quarter of 2012, excluding fuel reimbursements, Net Purchased Transportation increased $18.5 million year over year and $5.2 million sequentially. Both year over year and sequential increases are predominantly associated with increased intermodal volumes. As a percent of Net Revenue, Net Purchased Transportation increased 230 bps year over year and we expect this to continue to increase as we grow intermodal volumes faster than truckload volumes. As discussed previously, during the third quarter of 2012, we implemented an owner-operator banded pay program to incent our owner-operators to participate in all of our freight offerings. We estimate that $1.5-$2.0 million of the sequential increase in Net Purchased Transportation expense was a direct result of this program.
|
|
7 |
Rental Expense and Depreciation & Amortization of Property and Equipment
Due to fluctuations in the amount of tractors leased versus owned, we combine our rental expense with depreciation and amortization of property and equipment for analytical purposes as shown in the table below:
| Q3 ’12 |
Q3 ’11 | ($ in millions) | Q3 ’12 | Q2 ’12 | ||||||||||||
| $ | 28.9 | $ | 23.7 | Rental Expense | $ | 28.9 | $ | 26.6 | ||||||||
| 4.1 | % | 3.4 | % | % of Net Revenue | 4.1 | % | 3.8 | % | ||||||||
| $ | 49.3 | $ | 51.1 | Depreciation & Amortization of Property and Equipment | $ | 49.3 | $ | 50.4 | ||||||||
| 7.0 | % | 7.4 | % | % of Net Revenue | 7.0 | % | 7.2 | % | ||||||||
|
|
|
|
|
|
|
|
|
|||||||||
| $ | 78.2 | $ | 74.7 | Combined Rental Expense and Depreciation | $ | 78.2 | $ | 77.0 | ||||||||
| 11.1 | % | 10.8 | % | % of Net Revenue | 11.1 | % | 11.0 | % | ||||||||
Combined rental and depreciation expense in the third quarter of 2012 increased $3.5 million to $78.2 million from the third quarter of 2011. This increase is due to the rising costs of new equipment, a higher percentage of leased versus owned assets as well as growth in the number of trailers and intermodal containers. These expenses are partially offset by a reduction in the total number of tractors.
Total equipment counts are shown below:
| 9/30/2012 | 6/30/2012 | 9/30/2011 | ||||||||||
| Tractors: |
||||||||||||
| Company |
||||||||||||
| Owned |
5,625 | 6,158 | 6,432 | |||||||||
| Leased—operating leases |
3,554 | 3,443 | 2,837 | |||||||||
| Leased—capital leases |
2,411 | 2,248 | 2,562 | |||||||||
|
|
|
|
|
|
|
|||||||
| Total company tractors |
11,590 | 11,849 | 11,831 | |||||||||
|
|
|
|
|
|
|
|||||||
| Owner-operator |
||||||||||||
| Financed through the Company |
3,060 | 3,051 | 3,092 | |||||||||
| Other |
1,012 | 975 | 1,222 | |||||||||
|
|
|
|
|
|
|
|||||||
| Total owner-operator tractors |
4,072 | 4,026 | 4,314 | |||||||||
|
|
|
|
|
|
|
|||||||
| Total tractors |
15,662 | 15,875 | 16,145 | |||||||||
|
|
|
|
|
|
|
|||||||
| Trailers |
51,926 | 51,641 | 49,935 | |||||||||
|
|
|
|
|
|
|
|||||||
| Containers |
8,290 | 6,783 | 5,873 | |||||||||
|
|
|
|
|
|
|
|||||||
Gain on Disposal of Property and Equipment
Gain on disposal of property and equipment was $2.7 million in the third quarter of 2012 compared to $2.9 million in the third quarter of 2011 and was in line with the guidance given in our second quarter 2012 Letter to Stockholders. Future gains and losses will depend on the used truck market, our contracts with manufacturers, and our disposition volumes for tractors and trailers, all of which can vary depending on freight demand. Although this line item is difficult to predict, based on our current expectations for the method and number of dispositions this year, we expect gains to be in the range of $1.0—$2.0 million for the fourth quarter of 2012.
|
|
8 |
Interest Expense and Debt Balances
| Rates | Maturity | June 30, 2012 Actual |
Q3 Changes |
Sept. 30, 2012 Actual |
||||||||||||
| A/R Securitization |
CP + 125, 40 unused | Jun 2014 | $ | 203.0 | $ | 1.0 | $ | 204.0 | ||||||||
| Revolver ($400mm) |
Libor + 325, 50 unused | Sep 2016 | — | — | $ | — | ||||||||||
| Term Loan B-1 |
Libor + 375 | Dec 2016 | 183.7 | (6.0 | ) | $ | 177.7 | |||||||||
| Term Loan B-2 |
Libor + 375, 125 Floor | Dec 2017 | 643.4 | (25.0 | ) | $ | 618.4 | |||||||||
| Senior Secured 2nd Lien Notes |
10.00% | Nov 2018 | 500.0 | — | $ | 500.0 | ||||||||||
| Capital Leases & Other Debt |
Various | Various | 138.0 | 6.4 | $ | 144.4 | ||||||||||
|
|
|
|
|
|
|
|||||||||||
| Total Debt |
$ | 1,668.1 | ($ | 23.6 | ) | $ | 1,644.5 | |||||||||
| Letters of Credit |
3.25% | $ | 160.5 | (0.4 | ) | $ | 160.1 | |||||||||
Interest expense, comprised of debt interest expense, the amortization of deferred financing costs and original issue discount, and excluding amortization of previous losses on our terminated interest rate swaps, decreased by $8.5 million in the third quarter of 2012 to $28.1 million, compared with $36.6 for the third quarter of 2011. The decrease was largely due to lower interest rates from refinancing our senior credit facility in the first quarter of 2012 as well as the continued reduction of our debt balances that has been an area of focus since our initial public offering in December 2010. During the third quarter of 2012, we made a $6.0 million voluntary payment on our Term Loan B-1 and a $25.0 million voluntary payment on our Term Loan B-2. Further, on October 15, 2012, we made an additional payment of $6.0 million on our Term Loan B-1. As a result of our various voluntary prepayments, our next required principal payment on our Term Loan B-1 is March 31, 2014, and we have no additional required principal payments on our Term Loan B-2 until its maturity in December of 2017. Year to date through September 30th, we have reduced our net debt by $104 million which is above our annual target of $50—$100 million. In addition to the prepayments discussed above, we plan to further reduce our net debt in the fourth quarter of 2012 by $30—$50 million.
Income Taxes
Income tax in accordance with GAAP for the third quarter of 2012 was a provision of $15.0 million resulting in an effective tax rate of 34.9%. During the third quarter, we realized tax benefits from additional employment tax credits claimed on our 2011 tax return. We expect the full year effective tax rate in accordance with GAAP to be approximately 35%, reflecting the tax benefit realized in the first quarter of 2012 as well as the employment tax credits discussed above. For Adjusted EPS calculation purposes we will continue to use a normalized tax rate of 39% for each quarter and the full year.
|
|
9 |
Cash Flow and Capital Expenditures
We continue to generate positive cash flows from operations. We generated $259.2 million of cash from operations through the nine months ended September 30, 2012 compared with $217.2 million during the same period in 2011. Our 2012 year to date Net Cash Capital Expenditures are $112.9 million. Cash used in financing activities through September 30, 2012 was $191.2 million, primarily driven by the voluntary repayments of our debt. As a result, our unrestricted cash balance at September 30, 2012 is $43.3 million.
Capital Expenditures
| ($ Millions) | Q3 2012 | Q3 2011 | YTD 2012 | YTD 2011 | ||||||||||||
| Net Cash Capital Expenditures |
39.0 | 26.4 | 112.9 | 121.2 | ||||||||||||
| Addback: Proceeds from Sales |
32.4 | 30.5 | 89.6 | 46.9 | ||||||||||||
|
|
|
|
|
|
|
|
|
|||||||||
| Gross Cash Capital Expenditures |
$ | 71.4 | $ | 56.9 | $ | 202.5 | $ | 168.1 | ||||||||
| Capital Leases |
19.1 | — | 38.5 | 0.7 | ||||||||||||
| Operating Leases |
48.2 | 64.7 | 218.3 | 196.9 | ||||||||||||
|
|
|
|
|
|
|
|
|
|||||||||
| Capital & Operating Lease Total |
$ | 67.3 | $ | 64.7 | $ | 256.8 | $ | 197.6 | ||||||||
|
|
|
|
|
|
|
|
|
|||||||||
| Gross Investment in Equipment & Facilities |
$ | 138.7 | $ | 121.6 | $ | 459.3 | $ | 365.7 | ||||||||
|
|
|
|
|
|
|
|
|
|||||||||
Original Value of Expired Leases
| ($ Millions) | Q3 2012 | Q3 2011 | YTD 2012 | YTD 2011 | ||||||||||||
| Capital Leases |
10.8 | 18.7 | 30.4 | 47.6 | ||||||||||||
| Operating Leases |
51.5 | 21.1 | 81.8 | 45.4 | ||||||||||||
|
|
|
|
|
|
|
|
|
|||||||||
| Total |
$ | 62.3 | $ | 39.8 | $ | 112.3 | $ | 93.0 | ||||||||
|
|
|
|
|
|
|
|
|
|||||||||
Net cash capital expenditures were $39.0 million in the third quarter of 2012, reflecting gross cash capital expenditures of $71.4 million and $32.4 million of proceeds from the sale of equipment. Additionally, we acquired $67.3 million of equipment with capital and operating leases, of which approximately $15.8 million was equipment leased to owner-operators through our IEL subsidiary. In the quarter, we terminated equipment under operating and capital leases with original values of $62.3 million. As discussed previously, we decided to reduce our truck count to better align our capacity with the market’s freight volumes. As a result, we are currently anticipating the full year 2012 Net Cash Capital Expenditures to be between $170 and $185 million which is down from the $190—$220 million guidance given in the second quarter 2012 Letter to Stockholders. Currently, we are projecting our Net Cash Capital Expenditures to be between $220 – $250 million for the full year 2013, but we may adjust that amount in order to match market conditions and maximize return on our assets.
|
|
10 |
Debt and Liquidity Summaries
Net Debt and Leverage Ratio
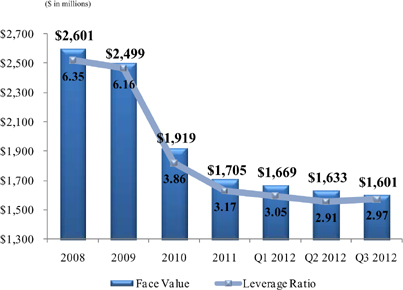
As we have stated previously, our goal is to continue to reduce our leverage ratio through EBITDA growth and debt repayments. In the third quarter of 2012, we reduced our net debt by an additional $32 million to $1.60 billion. This brings our total reduction in net debt for 2012 to $104 million, which is above our $50-$100 million per year target. Our leverage ratio climbed slightly from the second quarter to 2.97:1.00 at September 30, 2012. This increase is due to lower Adjusted EBITDA in the third quarter of 2012 when compared with the third quarter of 2011. We expect our leverage ratio to be approximately 2.90 by December 31, 2012 with the expected fourth quarter debt payments as previously discussed. We continue to maintain compliance with all of the covenants in our credit agreement as of September 30, 2012.
Liquidity Summary
| ($ millions) | 9/30/2012 | 12/31/2011 | 12/31/2010 | |||||||||
| Unrestricted Cash |
$ | 43.3 | $ | 82.1 | $ | 47.5 | ||||||
| Total Revolver Commitment |
$ | 400.0 | $ | 400.0 | $ | 400.0 | ||||||
| Less: Amount Drawn |
$ | — | $ | — | $ | — | ||||||
| Amounts under LOC |
$ | (160.1 | ) | $ | (167.5 | ) | $ | (153.2 | ) | |||
|
|
|
|
|
|
|
|||||||
| Available Under Revolver |
$ | 239.9 | $ | 232.5 | $ | 246.8 | ||||||
|
|
|
|
|
|
|
|||||||
| Total Available under AR Facility |
$ | 263.7 | $ | 249.8 | $ | 174.0 | ||||||
| Less: Amount Drawn |
$ | (204.0 | ) | $ | (180.0 | ) | $ | (171.5 | ) | |||
|
|
|
|
|
|
|
|||||||
| Available Under AR Facility |
$ | 59.7 | $ | 69.8 | $ | 2.5 | ||||||
|
|
|
|
|
|
|
|||||||
| Total Liquidity |
$ | 342.9 | $ | 384.4 | $ | 296.8 | ||||||
|
|
|
|
|
|
|
|||||||
| Restricted Cash and Investments |
$ | 73.0 | $ | 71.7 | $ | 84.6 | ||||||
|
|
|
|
|
|
|
|||||||
| Total Liquidity Including Restricted Cash and Investments |
$ | 416.0 | $ | 456.1 | $ | 381.4 | ||||||
|
|
|
|
|
|
|
|||||||
Our liquidity position, at September 30, 2012, noted in the chart below, remains strong with a total of $416.0 million available, including $43.3 million of unrestricted cash and $73.0 million of restricted cash and investments in our captive insurance companies that are reserved for the future payment of outstanding claims. Our $400.0 million revolving credit facility remains undrawn, and we had $160.1 million of letters of credit outstanding primarily for insurance collateral purposes, leaving $239.9 million available. We also had $59.7 million available on our accounts receivable securitization facility.
|
|
11 |
Guidance Summary
| • | Truckload average revenue per loaded mile, excluding fuel surcharges, expected to improve between 2% and 3% in 2012 (on a full year basis) |
| • | Intermodal container growth of 500 units expected in the fourth quarter |
| • | Gains on disposal of equipment expected to be in the range of $1.0—$2.0 million for the fourth quarter |
| • | Full year 2012 Net Cash Capital Expenditures expected to be between $170 and $185 million with the full year 2013 expectation to be between $220—$250 million |
| • | Net leverage ratio target of 2.90 by December 31, 2012 |
| • | Additional reduction in net debt expected to be between $30—$50 million in the fourth quarter of 2012 |
In the first half of 2012, we shared our internal goal of 20% EPS growth for the full year 2012. The economy and the resulting freight environment are softer than we anticipated when we established these goals. We are proud of the progress we have made thus far on our internal goals of improved utilization, deadhead reduction, debt reduction, and other initiatives that will ultimately drive an increased return on net assets. We are continuing to focus on achieving the 20% year over year EPS growth target; however, in light of the headwinds our economy and industry are facing, we believe the current consensus estimate of $0.90 for the full year 2012 is more likely.
Summary
The freight environment during the year, and especially the third quarter, has not been nearly as robust as we had hoped. However we are pleased with the improvements we are making in several key areas. The incentive pay changes made to driver and owner-operators have yielded positive results in our ability to recruit and retain drivers. Our Intermodal business continues to deliver strong growth. We are investing in technology and people to expand and enhance our logistics business. We are paying down debt and better utilizing our assets. As we have said over the last several quarters, we are continuing to focus on improving in the areas that we believe will enable us to improve our RONA and generate positive returns. Our third quarter results reflect the progress we are making in these areas.
Sincerely,
| Jerry Moyes | Richard Stocking | Ginnie Henkels | ||
| Chief Executive Officer | Chief Operating Officer | Chief Financial Officer |
|
|
12 |
Conference Call Q&A Session
Swift Transportation management will host a Q&A session at 11:00 a.m. Eastern Daylight Time on Tuesday, October 23rd to answer questions about the Company’s financial results. Please email your questions to Investor_Relations@swifttrans.com prior to 7:00 p.m. Eastern Daylight Time on Monday, October 22nd.
Participants may access the call using the following dial-in numbers:
U.S./Canada: (877) 897-8479
International/Local: (706) 902-1947
Conference ID: 38765698
The live webcast, letter to stockholders, transcript of the Q&A, and the replay of the earnings Q&A session can be accessed via our investor relations website at ir.swifttrans.com.
IR Contact:
Jason Bates
Vice President of Finance &
Investor Relations Officer
623.907.7335
Forward Looking Statements & Use of Non-GAAP Measures
This letter contains statements that may constitute forward-looking statements, which are based on information currently available, usually identified by words such as “anticipates,” “believes,” “estimates”, “plans,” “projects,” “expects,” “hopes,” “intends,” “will,” “could,” “should” “may,” or similar expressions which speak only as of the date the statement was made. Such forward-looking statements are made pursuant to the safe harbor provisions of the Private Securities Litigation Reform Act of 1995. Such statements include, but are not limited to, statements concerning: trends relating to our operations, freight volumes, leverage, utilization, revenue, expenses, seasonal freight fluctuations and demand patterns, effective tax rate for the full year 2012, fleet size and composition between company and owner-operator trucks, profitability and related metrics; loaded rate per mile; truck load revenue per loaded mile; the timing and level of fleet growth and truck count; the impact of the implementation of a driver/owner-operator incentive program; expectations of property and equipment dispositions and anticipated gains relative thereto during the remainder of 2012; expected increase in purchased transportation expenses; impact of reduction or increases in fuel prices; expectations regarding our leverage ratio for the remainder of 2012; estimated net cash capital expenditures for the remainder of 2012 as well as full year 2013; our expectations of intermodal growth; our intentions to use excess cash flows to repay debt generally and the amount of additional debt repayments in the fourth quarter; Adjusted EPS growth for full year 2012; increasing returns on net assets; expected addition of intermodal containers during the remainder of 2012 and anticipated revenue growth therefrom; and the ability to generate returns for shareholders. Such forward-looking statements are inherently uncertain, are based upon the current beliefs, assumptions and expectations of Company management and current market conditions, which are subject to significant risks and uncertainties as set forth in the Risk Factor Section of our Annual Report Form 10-K for the year ended December 31, 2011. As to the Company’s business and financial performance, the following factors, among others, could cause actual results to differ materially from those in forward-looking statements: the amount and velocity of changes in fuel
|
|
13 |
prices and our ability to recover fuel prices through our fuel surcharge program; the direction and duration of any trends, in pricing and volumes; assumptions regarding demand; any future recessionary economic cycles and downturns in customers’ business cycles, particularly in market segments and industries in which we have a significant concentration of customers; increasing competition from trucking, rail, intermodal, and brokerage competitors; a significant reduction in, or termination of, our trucking services by a key customer; our ability to achieve our strategy of growing our revenue; volatility in the price or availability of fuel; increases in new equipment prices or replacement costs; our significant ongoing capital requirements; the regulatory environment in which we operate, including existing regulations and changes in existing regulations, or violations by us of existing or future regulations; the costs of environmental and safety compliance and/or the imposition of liabilities under environmental and safety laws and regulations; difficulties in driver recruitment and retention; increases in driver compensation to the extent not offset by increases in freight rates; changes in rules or legislation by the National Labor Relations Board or Congress and/or union organizing efforts; potential volatility or decrease in the amount of earnings as a result of our claims exposure through our wholly-owned captive insurance companies; risks relating to our captive insurance companies; uncertainties associated with our operations in Mexico; our ability to attract and maintain relationships with owner-operators; the possible re-classification of our owner-operators as employees; adverse results from litigation; our ability to retain or replace key personnel; conflicts of interest or potential litigation that may arise from other businesses owned by Jerry Moyes, including pledges of Swift stock by Jerry Moyes; our dependence on third parties for intermodal and brokerage business; potential failure in computer or communications systems; our ability to execute or integrate any future acquisitions successfully; seasonal factors such as harsh weather conditions that increase operating costs; our ability to sustain cost savings realized as part of recent cost reduction initiatives; our history of net losses; goodwill impairment; our level of indebtedness and our ability to service our outstanding indebtedness, including compliance with our indebtedness covenants, and the impact such indebtedness may have on the way we operate our business. You should understand that many important factors, in addition to those listed above and in our filings with the SEC, could impact us financially. As a result of these and other factors, actual results may differ from those set forth in the forward-looking statements and the prices of the Company’s securities may fluctuate dramatically. The Company makes no commitment, and disclaims any duty, to update or revise any forward-looking statements to reflect future events, new information or changes in these expectations. In addition to our GAAP results, this Letter to Stockholders also includes certain non-GAAP financial measures as defined by the SEC. The calculation of each measure, including a reconciliation to the most closely related GAAP measure and the reasons management believes each non-GAAP measure is useful, are included in the attached schedules.
|
|
14 |
CONSOLIDATED STATEMENTS OF OPERATIONS (UNAUDITED)
THREE AND NINE MONTHS ENDED SEPTEMBER 30, 2012 AND 2011
| Three Months
Ended September 30, |
Nine Months
Ended September 30, |
|||||||||||||||
| 2012 | 2011 | 2012 | 2011 | |||||||||||||
| (Unaudited) | ||||||||||||||||
| (Amounts in thousands, except per share data) | ||||||||||||||||
| Operating revenue |
$ | 871,094 | $ | 863,826 | $ | 2,570,563 | $ | 2,473,185 | ||||||||
|
|
|
|
|
|
|
|
|
|||||||||
| Operating expenses: |
||||||||||||||||
| Salaries, wages and employee benefits |
199,965 | 197,046 | 598,718 | 595,078 | ||||||||||||
| Operating supplies and expenses |
63,766 | 61,794 | 182,187 | 177,664 | ||||||||||||
| Fuel |
151,726 | 159,719 | 450,555 | 478,537 | ||||||||||||
| Purchased transportation |
258,855 | 234,743 | 744,742 | 652,460 | ||||||||||||
| Rental expense |
28,873 | 23,685 | 78,948 | 60,898 | ||||||||||||
| Insurance and claims |
25,707 | 21,252 | 82,565 | 71,853 | ||||||||||||
| Depreciation and amortization of property and equipment |
49,288 | 51,058 | 150,071 | 152,969 | ||||||||||||
| Amortization of intangibles |
4,203 | 4,509 | 12,721 | 13,853 | ||||||||||||
| Impairments |
— | — | 1,065 | — | ||||||||||||
| Gain on disposal of property and equipment |
(2,746 | ) | (2,946 | ) | (10,614 | ) | (5,901 | ) | ||||||||
| Communication and utilities |
6,154 | 6,819 | 18,375 | 19,614 | ||||||||||||
| Operating taxes and licenses |
14,946 | 16,450 | 46,294 | 47,167 | ||||||||||||
|
|
|
|
|
|
|
|
|
|||||||||
| Total operating expenses |
800,737 | 774,129 | 2,355,627 | 2,264,192 | ||||||||||||
|
|
|
|
|
|
|
|
|
|||||||||
| Operating income |
70,357 | 89,697 | 214,936 | 208,993 | ||||||||||||
|
|
|
|
|
|
|
|
|
|||||||||
| Other (income) expenses: |
||||||||||||||||
| Interest expense |
28,149 | 36,629 | 90,478 | 110,761 | ||||||||||||
| Derivative interest expense |
448 | 3,384 | 5,101 | 12,067 | ||||||||||||
| Interest income |
(667 | ) | (562 | ) | (1,503 | ) | (1,500 | ) | ||||||||
| Loss on debt extinguishment |
— | — | 22,219 | — | ||||||||||||
| Other |
(385 | ) | (380 | ) | (2,286 | ) | (1,555 | ) | ||||||||
|
|
|
|
|
|
|
|
|
|||||||||
| Total other (income) expenses, net |
27,545 | 39,071 | 114,009 | 119,773 | ||||||||||||
|
|
|
|
|
|
|
|
|
|||||||||
| Income before income taxes |
42,812 | 50,626 | 100,927 | 89,220 | ||||||||||||
| Income tax expense |
14,960 | 19,676 | 33,188 | 35,482 | ||||||||||||
|
|
|
|
|
|
|
|
|
|||||||||
| Net income |
$ | 27,852 | $ | 30,950 | $ | 67,739 | $ | 53,738 | ||||||||
|
|
|
|
|
|
|
|
|
|||||||||
| Basic earnings per share |
$ | 0.20 | $ | 0.22 | $ | 0.49 | $ | 0.39 | ||||||||
|
|
|
|
|
|
|
|
|
|||||||||
| Diluted earnings per share |
$ | 0.20 | $ | 0.22 | $ | 0.49 | $ | 0.38 | ||||||||
|
|
|
|
|
|
|
|
|
|||||||||
| Shares used in per share calculations |
||||||||||||||||
| Basic |
139,535 | 139,498 | 139,526 | 139,039 | ||||||||||||
|
|
|
|
|
|
|
|
|
|||||||||
| Diluted |
139,546 | 139,503 | 139,631 | 139,709 | ||||||||||||
|
|
|
|
|
|
|
|
|
|||||||||
|
|
15 |
ADJUSTED EPS RECONCILIATION (UNAUDITED) (a)
THREE AND NINE MONTHS ENDED SEPTEMBER 30, 2012, 2011 AND 2010
| Three Months
Ended September 30, |
Nine Months
Ended September 30, |
|||||||||||||||||||||||
| 2012 | 2011 | 2010 | 2012 | 2011 | 2010 | |||||||||||||||||||
| Diluted earnings (loss) per share |
$ | 0.20 | $ | 0.22 | $ | (0.02 | ) | $ | 0.49 | $ | 0.38 | $ | (1.28 | ) | ||||||||||
| Adjusted for: |
||||||||||||||||||||||||
| Income tax expense (benefit) |
0.11 | 0.14 | 0.05 | 0.24 | 0.25 | (0.03 | ) | |||||||||||||||||
|
|
|
|
|
|
|
|
|
|
|
|
|
|||||||||||||
| Income (loss) before income taxes |
0.31 | 0.36 | 0.03 | 0.72 | 0.64 | (1.31 | ) | |||||||||||||||||
|
|
|
|
|
|
|
|
|
|
|
|
|
|||||||||||||
| Non-cash impairments(b) |
— | — | — | 0.01 | — | 0.02 | ||||||||||||||||||
| Loss on debt extinguishment (c) |
— | — | — | 0.16 | — | — | ||||||||||||||||||
| Other special non-cash items(d) |
— | — | — | — | — | 0.12 | ||||||||||||||||||
| Mark-to-market adjustment of interest rate swaps(e) |
— | — | 0.11 | — | — | 0.39 | ||||||||||||||||||
| Amortization of certain intangibles(f) |
0.03 | 0.03 | 0.08 | 0.08 | 0.09 | 0.25 | ||||||||||||||||||
| Amortization of unrealized losses on interest rate swaps(g) |
— | 0.02 | — | 0.04 | 0.09 | — | ||||||||||||||||||
|
|
|
|
|
|
|
|
|
|
|
|
|
|||||||||||||
| Adjusted income (loss) before income taxes |
0.34 | 0.42 | 0.22 | 1.01 | 0.82 | (0.53 | ) | |||||||||||||||||
| Provision for income tax (benefit) expense at normalized effective rate |
0.13 | 0.16 | 0.09 | 0.39 | 0.32 | (0.21 | ) | |||||||||||||||||
|
|
|
|
|
|
|
|
|
|
|
|
|
|||||||||||||
| Adjusted EPS |
$ | 0.21 | $ | 0.25 | $ | 0.13 | $ | 0.62 | $ | 0.50 | $ | (0.32 | ) | |||||||||||
|
|
|
|
|
|
|
|
|
|
|
|
|
|||||||||||||
| (a) | We define Adjusted EPS as (1) income (loss) before income taxes plus (i) amortization of the intangibles from our 2007 going-private transaction, (ii) non-cash impairments, (iii) other special non-cash items, (iv) excludable transaction costs, (v) the mark-to-market adjustment on our interest rate swaps that is recognized in the statement of operations in a given period, and (vi) the amortization of previous losses recorded in accumulated other comprehensive income (loss) (“OCI”) related to the interest rate swaps we terminated upon our IPO and refinancing transactions in December 2010; (2) reduced by income taxes at 39%, our normalized effective tax rate; (3) divided by weighted average diluted shares outstanding. We believe the presentation of financial results excluding the impact of the items noted above provides a consistent basis for comparing our results from period to period and to those of our peers due to the non-comparable nature of the intangibles from our going-private transaction, the historical volatility of the interest rate derivative agreements and the non-operating nature of the impairment charges, transaction costs and other adjustment items. Adjusted EPS is not presented in accordance with GAAP and should be considered in addition to, not as a substitute for, or superior to, measures of financial performance in accordance with GAAP. The numbers reflected in the above table are calculated on a per share basis and may not foot due to rounding. |
| (b) | In the first quarter of 2012, real property with a carrying amount of $1.7 million was written down to its fair value of $0.6 million, resulting in a pre-tax impairment charge of $1.1 million. In the first quarter of 2010, revenue equipment with a carrying value of $3.6 million was written down to its fair value of $2.3 million, resulting in an impairment charge of $1.3 million. |
| (c) | On May 21, 2012, the Company completed the call of its remaining $15.2 million face value 12.50% fixed rate notes due May 15, 2017, at a price of 106.25% of face value pursuant to the terms of the indenture governing the notes, resulting in a loss on debt extinguishment of $1.3 million, representing the call premium and write-off of the remaining unamortized deferred financing fees. On March 6, 2012, the Company entered into an Amended and Restated Credit Agreement (“New Agreement”). The New Agreement replaced the then-existing, remaining $874 million face value first lien term loan, which was scheduled to mature in December 2016. The replacement of the then-existing first lien term loan resulted in a loss on debt extinguishment of $20.9 million in the first quarter of 2012, representing the write-off of the unamortized original issue discount and deferred financing fees associated with the original term loan. |
| (d) | Incremental pre-tax depreciation expense of $7.4 million reflecting management’s revised estimates regarding salvage value and useful lives for approximately 7,000 dry van trailers, which management decided during the first quarter of 2010 to scrap over the next few years. |
| (e) | Mark-to-market adjustment of interest rate swaps of $6.6 million and $23.4 million in the three and nine months ended September 30, 2010, respectively, reflects the portion of the change in fair value of these financial instruments which was recorded in earnings and excludes any portion recorded in accumulated other OCI under cash flow hedge accounting. |
| (f) | Amortization of certain intangibles reflects the non-cash amortization expense of $3.9 million, $4.2 million and $4.7 million for the three months ended September 30, 2012, 2011 and 2010, respectively, and $11.8 million, $13.0 million and $14.8 million for the nine months ended September 30, 2012, 2011 and 2010, respectively, relating to certain intangible assets identified in the 2007 going-private transaction through which Swift Corporation acquired Swift Transportation Co. |
|
|
16 |
| (g) | Amortization of unrealized losses on interest rate swaps reflects the non-cash amortization expense of $0.4 million and $3.4 million for the three months ended September 30, 2012 and 2011, respectively and $5.1 million and $12.1 million for the nine months ended September 30, 2012 and 2011, respectively, included in derivative interest expense in the consolidated statements of operations and is comprised of previous losses recorded in accumulated OCI related to the interest rate swaps we terminated upon our IPO and concurrent refinancing transactions in December 2010. Such losses were incurred in prior periods when hedge accounting applied to the swaps and are being expensed in relation to the hedged interest payments through the original maturity of the swaps in August 2012. |
|
|
17 |
ADJUSTED OPERATING INCOME AND OPERATING RATIO RECONCILIATION (UNAUDITED) (a)
THREE AND NINE MONTHS ENDED SEPTEMBER 30, 2012, 2011 AND 2010
| Three Months
Ended September 30, |
Nine Months
Ended, September 30, |
|||||||||||||||||||||||
| 2012 | 2011 | 2010 | 2012 | 2011 | 2010 | |||||||||||||||||||
| (Amounts in thousands) | ||||||||||||||||||||||||
| Operating revenue |
$ | 871,094 | $ | 863,826 | $ | 758,281 | $ | 2,570,563 | $ | 2,473,185 | $ | 2,149,296 | ||||||||||||
| Less: Fuel surcharge revenue |
168,738 | 172,537 | 109,420 | 507,469 | 488,670 | 310,339 | ||||||||||||||||||
|
|
|
|
|
|
|
|
|
|
|
|
|
|||||||||||||
| Net Revenue |
702,356 | 691,289 | 648,861 | 2,063,094 | 1,984,515 | 1,838,957 | ||||||||||||||||||
|
|
|
|
|
|
|
|
|
|
|
|
|
|||||||||||||
| Operating expense |
800,737 | 774,129 | 676,181 | 2,355,627 | 2,264,192 | 1,982,814 | ||||||||||||||||||
| Adjusted for: |
||||||||||||||||||||||||
| Fuel surcharge revenue |
(168,738 | ) | (172,537 | ) | (109,420 | ) | (507,469 | ) | (488,670 | ) | (310,339 | ) | ||||||||||||
| Amortization of certain intangibles (b) |
(3,912 | ) | (4,218 | ) | (4,663 | ) | (11,846 | ) | (12,979 | ) | (14,757 | ) | ||||||||||||
| Non-cash impairments (c) |
— | — | — | (1,065 | ) | — | (1,274 | ) | ||||||||||||||||
| Other items (d) |
— | — | — | — | — | (7,382 | ) | |||||||||||||||||
|
|
|
|
|
|
|
|
|
|
|
|
|
|||||||||||||
| Adjusted operating expense |
628,087 | 597,374 | 562,098 | 1,835,247 | 1,762,543 | 1,649,062 | ||||||||||||||||||
|
|
|
|
|
|
|
|
|
|
|
|
|
|||||||||||||
| Adjusted operating income |
$ | 74,269 | $ | 93,915 | $ | 86,763 | $ | 227,847 | $ | 221,972 | $ | 189,895 | ||||||||||||
|
|
|
|
|
|
|
|
|
|
|
|
|
|||||||||||||
| Adjusted Operating Ratio |
89.4 | % | 86.4 | % | 86.6 | % | 89.0 | % | 88.8 | % | 89.7 | % | ||||||||||||
| Operating Ratio |
91.9 | % | 89.6 | % | 89.2 | % | 91.6 | % | 91.5 | % | 92.3 | % | ||||||||||||
| (a) | We define Adjusted Operating Ratio as (a) total operating expenses, less (i) fuel surcharges, (ii) amortization of the intangibles from our 2007 going-private transaction, (iii) non-cash impairment charges, (iv) other special non-cash items, and (v) excludable transaction costs, as a percentage of (b) total revenue excluding fuel surcharge revenue. For the year ended December 31, 2011, we revised the calculation of Adjusted Operating Ratio to eliminate the impact of the non-cash amortization of the intangibles from our 2007 going-private transaction to be consistent with the calculation of our Adjusted EPS. The three and nine months ended September 30, 2011 and 2010 presented above has been revised to reflect the revised definition. We believe fuel surcharge is sometimes volatile and eliminating the impact of this source of revenue (by netting fuel surcharge revenue against fuel expense) affords a more consistent basis for comparing our results of operations. We also believe excluding impairments, non-comparable nature of the intangibles from our going-private transaction and other special items enhances the comparability of our performance from period to period. Adjusted Operating Ratio is not a recognized measure under GAAP. Adjusted Operating Ratio should be considered in addition to, not as a substitute for, or superior to, measures of financial performance in accordance with GAAP. |
| (b) | Amortization of certain intangibles reflects the non-cash amortization expense of $3.9 million, $4.2 million and $4.7 million for the three months ended September 30, 2012, 2011 and 2010, respectively, and $11.8 million, $13.0 million and $14.8 million for the nine months ended September 30, 2012, 2011 and 2010, respectively, relating to certain intangible assets identified in the 2007 going-private transaction through which Swift Corporation acquired Swift Transportation Co. |
| (c) | In the first quarter of 2012, real property with a carrying amount of $1.7 million was written down to its fair value of $0.6 million, resulting in a pre-tax impairment charge of $1.1 million. In the first quarter of 2010, revenue equipment with a carrying value of $3.6 million was written down to its fair value of $2.3 million, resulting in an impairment charge of $1.3 million. |
| (d) | Incremental pre-tax depreciation expense of $7.4 million reflecting management’s revised estimates regarding salvage value and useful lives for approximately 7,000 dry van trailers, which management decided during the first quarter of 2010 to scrap over the next few years. |
|
|
18 |
ADJUSTED EARNINGS BEFORE INTEREST, TAXES, DEPRECIATION AND AMORTIZATION (UNAUDITED) (a)
THREE AND NINE MONTHS ENDED SEPTEMBER 30, 2012, 2011 AND 2010
| Three Months
Ended September 30, |
Nine Months
Ended September 30, |
|||||||||||||||||||||||
| 2012 | 2011 | 2010 | 2012 | 2011 | 2010 | |||||||||||||||||||
| (Amounts in thousands) | ||||||||||||||||||||||||
| Net income (loss) |
$ | 27,852 | $ | 30,950 | $ | (1,019 | ) | $ | 67,739 | $ | 53,738 | $ | (77,099 | ) | ||||||||||
| Adjusted for: |
||||||||||||||||||||||||
| Depreciation and amortization of property and equipment |
49,288 | 51,058 | 48,027 | 150,071 | 152,969 | 156,449 | ||||||||||||||||||
| Amortization of intangibles |
4,203 | 4,509 | 4,955 | 12,721 | 13,853 | 15,632 | ||||||||||||||||||
| Interest expense |
28,149 | 36,629 | 64,095 | 90,478 | 110,761 | 189,459 | ||||||||||||||||||
| Derivative interest expense |
448 | 3,384 | 16,963 | 5,101 | 12,067 | 58,969 | ||||||||||||||||||
| Interest income |
(667 | ) | (562 | ) | (297 | ) | (1,503 | ) | (1,500 | ) | (800 | ) | ||||||||||||
| Income tax expense (benefit) |
14,960 | 19,676 | 2,970 | 33,188 | 35,482 | (1,595 | ) | |||||||||||||||||
|
|
|
|
|
|
|
|
|
|
|
|
|
|||||||||||||
| Earnings before interest, taxes, depreciation and amortization (EBITDA) |
$ | 124,233 | $ | 145,644 | $ | 135,694 | $ | 357,795 | $ | 377,370 | $ | 341,015 | ||||||||||||
|
|
|
|
|
|
|
|
|
|
|
|
|
|||||||||||||
| Non-cash equity compensation (b) |
1,398 | 781 | — | 4,131 | 5,524 | — | ||||||||||||||||||
| Loss on debt extinguishment (c) |
— | — | — | 22,219 | — | — | ||||||||||||||||||
| Non-cash impairments (d) |
— | — | — | 1,065 | — | 1,274 | ||||||||||||||||||
|
|
|
|
|
|
|
|
|
|
|
|
|
|||||||||||||
| Adjusted earnings before interest, taxes, depreciation and amortization (Adjusted EBITDA) |
$ | 125,631 | $ | 146,425 | $ | 135,694 | $ | 385,210 | $ | 382,894 | $ | 342,289 | ||||||||||||
|
|
|
|
|
|
|
|
|
|
|
|
|
|||||||||||||
| (a) | We define Adjusted EBITDA as net income (loss) plus (i) depreciation and amortization, (ii) interest and derivative interest expense, including other fees and charges associated with indebtedness, net of interest income, (iii) income taxes, (iv) non-cash equity compensation expense, (v) non-cash impairments, (vi) other special non-cash items, and (vii) excludable transaction costs. We believe that Adjusted EBITDA is a relevant measure for estimating the cash generated by our operations that would be available to cover capital expenditures, taxes, interest and other investments and that it enhances an investor’s understanding of our financial performance. We use Adjusted EBITDA for business planning purposes and in measuring our performance relative to that of our competitors. Our method of computing Adjusted EBITDA is consistent with that used in our senior secured credit agreement for covenant compliance purposes and may differ from similarly titled measures of other companies. Adjusted EBITDA is not a recognized measure under GAAP. Adjusted EBITDA should be considered in addition to, not as a substitute for or superior to, net income, cash flow from operations, operating income or any other performance measures derived in accordance with GAAP as measures of operating performance or operating cash flows as a measure of liquidity. |
| (b) | Represents recurring non-cash equity compensation expense following our IPO, on a pre-tax basis. In accordance with the terms of our senior credit agreement, this expense is added back in the calculation of Adjusted EBITDA for covenant compliance purposes. |
| (c) | On May 21, 2012, the Company completed the call of its remaining $15.2 million face value 12.50% fixed rate notes due May 15, 2017, at a price of 106.25% of face value pursuant to the terms of the indenture governing the notes, resulting in a loss on debt extinguishment of $1.3 million, representing the call premium and write-off of the remaining unamortized deferred financing fees. On March 6, 2012, the Company entered into an Amended and Restated Credit Agreement (“New Agreement”). The New Agreement replaced the then-existing, remaining $874 million face value first lien term loan, which was scheduled to mature in December 2016. The replacement of the then-existing first lien term loan resulted in a loss on debt extinguishment of $20.9 million in the first quarter of 2012, representing the write-off of the unamortized original issue discount and deferred financing fees associated with the original term loan. |
| (d) | In the first quarter of 2012, real property with a carrying amount of $1.7 million was written down to its fair value of $0.6 million, resulting in a pre-tax impairment charge of $1.1 million. In the first quarter of 2010, revenue equipment with a carrying value of $3.6 million was written down to its fair value of $2.3 million, resulting in an impairment charge of $1.3 million. |
|
|
19 |
OPERATING STATISTICS (UNAUDITED)
| Three Months
Ended September 30, |
Nine Months
Ended September 30, |
|||||||||||||||
| 2012 | 2011 | 2012 | 2011 | |||||||||||||
| Trucking revenue (1,2) |
$ | 600,725 | $ | 609,226 | $ | 1,780,310 | 1,766,215 | |||||||||
| Weekly trucking revenue per tractor (2) |
$ | 3,165 | $ | 3,054 | 3,128 | 2,990 | ||||||||||
| Deadhead miles percentage |
11.43 | % | 11.49 | % | 11.64 | % | 11.79 | % | ||||||||
| Average loaded length of haul (miles) |
420 | 427 | 415 | 428 | ||||||||||||
| Average tractors available for dispatch |
||||||||||||||||
| Company |
10,394 | 10,980 | 10,510 | 11,079 | ||||||||||||
| Owner-operator |
4,047 | 4,200 | 4,028 | 4,068 | ||||||||||||
|
|
|
|
|
|
|
|
|
|||||||||
| Total |
14,442 | 15,180 | 14,538 | 15,147 | ||||||||||||
|
|
|
|
|
|
|
|
|
|||||||||
Notes to Operating Statistics:
| (1) | In thousands. |
| (2) | Excludes fuel surcharge, rail, third party carrier, leasing, and other shop and miscellaneous revenue. |
|
|
20 |
CONSOLIDATED BALANCE SHEET (UNAUDITED)
AS OF SEPTEMBER 30, 2012 AND DECEMBER 31, 2011
(In thousands, except share data)
| September 30, | December 31, | |||||||
| 2012 | 2011 | |||||||
| (Unaudited) | ||||||||
| ASSETS | ||||||||
| Current assets: |
||||||||
| Cash and cash equivalents |
$ | 43,321 | $ | 82,084 | ||||
| Restricted cash |
54,832 | 71,724 | ||||||
| Fixed maturity securities, held to maturity, amortized cost |
18,216 | — | ||||||
| Accounts receivable, net |
360,324 | 324,035 | ||||||
| Equipment sales receivable |
4,644 | 5,500 | ||||||
| Income tax refund receivable (1) |
15,086 | 3,396 | ||||||
| Inventories and supplies |
18,356 | 17,441 | ||||||
| Assets held for sale |
14,982 | 13,571 | ||||||
| Prepaid taxes, licenses, insurance and other |
48,231 | 46,559 | ||||||
| Deferred income taxes |
61,568 | 96,885 | ||||||
| Current portion of notes receivable |
5,263 | 6,455 | ||||||
|
|
|
|
|
|||||
| Total current assets |
644,823 | 667,650 | ||||||
|
|
|
|
|
|||||
| Property and equipment, at cost: |
||||||||
| Revenue and service equipment |
1,712,464 | 1,674,452 | ||||||
| Land |
125,788 | 133,711 | ||||||
| Facilities and improvements |
234,251 | 229,420 | ||||||
| Furniture and office equipment |
43,345 | 41,183 | ||||||
|
|
|
|
|
|||||
| Total property and equipment |
2,115,848 | 2,078,766 | ||||||
| Less: accumulated depreciation and amortization |
804,786 | 778,769 | ||||||
|
|
|
|
|
|||||
| Net property and equipment |
1,311,062 | 1,299,997 | ||||||
| Other assets |
68,814 | 68,791 | ||||||
| Intangible assets, net |
337,765 | 350,486 | ||||||
| Goodwill |
253,256 | 253,256 | ||||||
|
|
|
|
|
|||||
| Total assets |
$ | 2,615,720 | $ | 2,640,180 | ||||
|
|
|
|
|
|||||
| LIABILITIES AND STOCKHOLDERS’ EQUITY | ||||||||
| Current liabilities: |
||||||||
| Accounts payable |
$ | 112,504 | $ | 81,688 | ||||
| Accrued liabilities |
110,585 | 101,327 | ||||||
| Current portion of claims accruals |
70,827 | 73,266 | ||||||
| Current portion of long-term debt and obligations under capital leases (2) |
41,102 | 59,339 | ||||||
| Fair value of guarantees |
1,195 | 1,195 | ||||||
| Current portion of fair value of interest rate swaps |
993 | — | ||||||
|
|
|
|
|
|||||
| Total current liabilities |
337,206 | 316,815 | ||||||
|
|
|
|
|
|||||
| Long-term debt and obligations under capital leases (2) |
1,389,768 | 1,530,104 | ||||||
| Claims accruals, less current portion |
105,289 | 96,277 | ||||||
| Fair value of interest rate swaps, less current portion |
11,780 | 10,061 | ||||||
| Deferred income taxes (1) |
384,870 | 395,239 | ||||||
| Securitization of accounts receivable |
204,000 | 180,000 | ||||||
| Other liabilities |
— | 4,131 | ||||||
|
|
|
|
|
|||||
| Total liabilities |
2,432,913 | 2,532,627 | ||||||
|
|
|
|
|
|||||
| Stockholders’ equity: |
||||||||
| Class A common stock |
870 | 859 | ||||||
| Class B common stock |
525 | 536 | ||||||
| Additional paid-in capital |
895,976 | 891,899 | ||||||
| Accumulated deficit (1) |
(707,018 | ) | (774,757 | ) | ||||
| Accumulated other comprehensive loss |
(7,748 | ) | (11,186 | ) | ||||
| Noncontrolling interests |
202 | 202 | ||||||
|
|
|
|
|
|||||
| Total stockholders’ equity |
182,807 | 107,553 | ||||||
|
|
|
|
|
|||||
| Total liabilities and stockholders’ equity |
$ | 2,615,720 | $ | 2,640,180 | ||||
|
|
|
|
|
|||||
|
|
21 |
Notes to Selected Consolidated Balance Sheet Data:
| (1) | The Company recently completed an analysis of its current and deferred tax assets and liabilities, and determined that it had overstated its income tax expense for the year ended December 31, 2009 for certain items incorrectly identified as permanently nondeductible. The Company believes the correction of this error is not material to its previously issued historical consolidated financial statements. The Company has adjusted certain balances within the consolidated balance sheets as of December 31, 2009, 2010 and 2011 to correct this immaterial error. The consolidated statement of operations, consolidated statement of comprehensive income, and consolidated statement of cash flows for the three and nine months ended September 30, 2012 and 2011 and for the years ended December 31, 2011 and 2010 were not impacted by this correction. For the year ended December 31, 2009, the impact of the immaterial correction resulted in income tax expense decreasing from $326.7 million to $305.3 million, net loss decreasing from $435.6 million to $414.3 million and basic and diluted loss per share decreasing from $7.25 per share to $6.89 per share. The consolidated balance sheets as of December 31, 2010 and 2011 reflect an adjustment to decrease accumulated deficit by $21.4 million, a reduction of the deferred tax liability of $19.9 million and an increase in the income tax refund receivable of $1.5 million. As a result of the correction of this immaterial error, the Company’s federal net operating loss carryforward expiring by 2030 increased from $186.1 million to $239.4 million as of September 30, 2012. |
| (2) | On May 21, 2012, the Company completed its call of its remaining $15.2 million face value 12.50% fixed rate notes due May 15, 2017, at a premium of 106.25. The Company paid total proceeds of $16.2 million, which included the aggregate outstanding principal balance, premium and unpaid interest through closing. The call of the fixed rate notes resulted in a loss on debt extinguishment of $1.3 million representing the call premium and write-off of the remaining unamortized deferred financing fees. |
On March 6, 2012, the Company entered into an Amended and Restated Credit Agreement (“New Agreement”). The New Agreement replaced the then-existing $874 million face value first lien term loan, which was scheduled to mature in December 2016 and accrued interest at the LIBOR rate plus 4.50%, including a minimum LIBOR rate of 1.50%, with a $200 million face value first lien term loan B-1 tranche and a $674 million face value first lien term loan B-2 tranche. The $200 million first lien term loan B-1 tranche accrues interest at the LIBOR rate plus 3.75% with no LIBOR rate minimum and includes scheduled quarterly principal payments beginning June 30, 2012 of $5.0 million per quarter through December 2013 and generally $10.0 million per quarter thereafter until the B-1 tranche maturity in December 2016. The $674 million first lien term loan B-2 tranche accrues interest at the LIBOR rate plus 3.75%, including a minimum LIBOR rate of 1.25%, and includes scheduled quarterly principal payments of 0.25% of the original loan amount until the B-2 tranche maturity in December 2017. The replacement of the then-existing first lien term loan resulted in a loss on debt extinguishment of $20.9 million in the first quarter of 2012, representing the write-off of the unamortized original issue discount and deferred financing fees associated with the original term loan.
Total debt and capital lease obligations as of September 30, 2012 includes $177.3 million net carrying value of first lien term loan B-1 tranche, $616.9 million net carrying value of first lien term loan B-2 tranche, $492.2 million net carrying value of senior second priority secured notes, and $144.5 million of other secured indebtedness and capital lease obligations. Total debt and capital lease obligations as of December 31, 2011 includes $925.5 million net carrying value of senior secured first lien term loan, $491.3 million net carrying value of senior second priority secured notes, $15.6 million of unsecured fixed rate notes, and $157.0 million of other secured indebtedness and capital lease obligations.
|
|
22 |
CONSOLIDATED STATEMENTS OF CASH FLOWS (UNAUDITED)
NINE MONTHS ENDED SEPTEMBER 30, 2012 AND 2011
| Nine Months Ended September 30, | ||||||||
| 2012 | 2011 | |||||||
| Cash flows from operating activities: |
||||||||
| Net income |
$ | 67,739 | $ | 53,738 | ||||
| Adjustments to reconcile net income to net cash provided by operating activities: |
||||||||
| Depreciation and amortization of property, equipment and intangibles |
162,792 | 166,822 | ||||||
| Amortization of debt issuance costs, original issue discount, and losses on terminated swaps |
9,368 | 17,665 | ||||||
| Gain on disposal of property and equipment less write-off of totaled tractors |
(9,287 | ) | (4,139 | ) | ||||
| Impairment of property and equipment |
1,065 | — | ||||||
| Equity losses of investee |
683 | — | ||||||
| Deferred income taxes |
25,997 | 32,752 | ||||||
| Provision for allowance for losses on accounts receivable |
996 | (530 | ) | |||||
| Non-cash equity compensation |
4,131 | 5,524 | ||||||
| Loss on debt extinguishment |
22,219 | 217 | ||||||
| Increase (decrease) in cash resulting from changes in: |
||||||||
| Accounts receivable |
(37,285 | ) | (57,095 | ) | ||||
| Inventories and supplies |
(915 | ) | (7,670 | ) | ||||
| Prepaid expenses and other current assets |
(13,362 | ) | (4,742 | ) | ||||
| Other assets |
(687 | ) | (12,310 | ) | ||||
| Accounts payable, accrued and other liabilities |
25,792 | 26,989 | ||||||
|
|
|
|
|
|||||
| Net cash provided by operating activities |
259,246 | 217,221 | ||||||
|
|
|
|
|
|||||
| Cash flows from investing activities: |
||||||||
| Decrease in restricted cash |
16,892 | 9,994 | ||||||
| Change in fixed maturity securities-restricted |
(18,216 | ) | — | |||||
| Funding of note receivable |
(7,500 | ) | — | |||||
| Proceeds from sale of property and equipment |
89,610 | 46,869 | ||||||
| Capital expenditures |
(202,464 | ) | (168,046 | ) | ||||
| Payments received on notes receivable |
4,357 | 5,118 | ||||||
| Expenditures on assets held for sale |
(5,935 | ) | (6,093 | ) | ||||
| Payments received on assets held for sale |
11,337 | 9,089 | ||||||
| Payments received on equipment sale receivables |
5,580 | — | ||||||
| Other investing activities |
(500 | ) | — | |||||
|
|
|
|
|
|||||
| Net cash used in investing activities |
(106,839 | ) | (103,069 | ) | ||||
|
|
|
|
|
|||||
| Cash flows from financing activities: |
||||||||
| Proceeds from issuance of Class A common stock, net of issuance costs |
— | 62,994 | ||||||
| Repayment of long-term debt and capital leases |
(215,141 | ) | (189,390 | ) | ||||
| Borrowings under accounts receivable securitization |
211,000 | 164,000 | ||||||
| Repayment of accounts receivable securitization |
(187,000 | ) | (155,500 | ) | ||||
| Proceeds from long-term debt |
10,000 | — | ||||||
| Payment of deferred loan costs |
(9,023 | ) | (3,711 | ) | ||||
| Other financing activities |
(1,006 | ) | 138 | |||||
|
|
|
|
|
|||||
| Net cash used in financing activities |
(191,170 | ) | (121,469 | ) | ||||
|
|
|
|
|
|||||
| Net decrease in cash and cash equivalents |
(38,763 | ) | (7,317 | ) | ||||
|
|
|
|
|
|||||
| Cash and cash equivalents at beginning of period |
82,084 | 47,494 | ||||||
| Cash and cash equivalents at end of period |
$ | 43,321 | $ | 40,177 | ||||
|
|
|
|
|
|||||
| Supplemental disclosure of cash flow information: |
||||||||
| Cash paid during the period for: |
||||||||
| Interest |
$ | 79,400 | $ | 73,181 | ||||
|
|
|
|
|
|||||
| Income taxes |
$ | 19,229 | $ | 7,537 | ||||
|
|
|
|
|
|||||
| Supplemental schedule of: |
||||||||
| Non-cash investing activities: |
||||||||
| Equipment sales receivables |
$ | 4,723 | $ | 6,058 | ||||
|
|
|
|
|
|||||
| Equipment purchase accrual |
$ | 19,310 | $ | 7,952 | ||||
|
|
|
|
|
|||||
| Notes receivable from sale of assets |
$ | 3,353 | $ | 3,264 | ||||
|
|
|
|
|
|||||
| Non-cash financing activities: |
||||||||
| Accrued deferred loan costs |
$ | 228 | — | |||||
|
|
|
|
|
|||||
| Capital lease additions |
$ | 38,453 | $ | 705 | ||||
|
|
|
|
|
|||||
|
|
23 |