Attached files
| file | filename |
|---|---|
| 8-K - FORM 8-K - BROADRIDGE FINANCIAL SOLUTIONS, INC. | d410591d8k.htm |
 September 2012
Continued Market Leadership
through Execution and Innovation
Investor Presentation
©
2012 Broadridge Financial Solutions, Inc.
Broadridge and the Broadridge logo are registered trademarks of Broadridge
Financial Solutions, Inc. Exhibit 99.1 |
 1
Forward-Looking Statements This press
release and other written or oral statements made from time to time by representatives of Broadridge may contain “forward-looking
statements” within the meaning of the Private Securities Litigation Reform Act of 1995.
Statements that are not historical in nature, and which may be identified by the use of words
like “expects,” “assumes,” “projects,” “anticipates,” “estimates,” “we believe,” “could be” and other words of similar
meaning, are forward-looking statements. In particular, information appearing in the
“Fiscal Year 2013 Financial Guidance” section are forward- looking
statements. These statements are based on management’s expectations and assumptions and are subject to risks and uncertainties that
may cause actual results to differ materially from those expressed. These risks and
uncertainties include those risk factors discussed in Part I, “Item 1A. Risk Factors”
of our Annual Report on Form 10-K for the fiscal year ended June 30, 2012 (the “2012 Annual Report”), as they may be
updated in any future reports filed with the Securities and Exchange Commission. All
forward-looking statements speak only as of the date of this press release and are
expressly qualified in their entirety by reference to the factors discussed in the 2012 Annual Report. These risks include:
the success of Broadridge in retaining and selling additional services to its existing clients and in
obtaining new clients; Broadridge’s reliance on a relatively small number of clients, the
continued financial health of those clients, and the continued use by such clients of Broadridge’s services
with favorable pricing terms; changes in laws and regulations affecting the investor communication
services provided by Broadridge; declines in participation and activity in the securities
markets; overall market and economic conditions and their impact on the securities markets; any material
breach of Broadridge security affecting its clients’ customer information; the failure of
Broadridge’s outsourced data center services provider to provide the anticipated levels of
service; any significant slowdown or failure of Broadridge’s systems or error in the performance of Broadridge’s
services; Broadridge’s failure to keep pace with changes in technology and demands of its
clients; Broadridge’s ability to attract and retain key personnel; the impact of new
acquisitions and divestitures; and competitive conditions. Broadridge disclaims any obligation to update or revise
forward-looking statements that may be made to reflect events or circumstances that arise after
the date made or to reflect the occurrence of unanticipated events, other than as required by
law.
Non-GAAP Financial Measures In certain
circumstances, results have been presented that are not generally accepted accounting principles measures (“Non-GAAP”) and should
be viewed in addition to, and not as a substitute for, the Company’s reported results. Net
earnings, diluted earnings per share and pre-tax earnings margins excluding the Penson
Charges, net, IBM Migration costs, and restructuring charges are Non-GAAP measures. These measures
are adjusted to exclude costs incurred by the Company in connection with assets the Company held as a
result of the sale of substantially all of its securities clearing contracts to Penson, the
Penson outsourcing services agreement and the migration of its data center to IBM, and restructuring
charges, as Broadridge believes this information helps investors understand the effect of these items
on reported results and provides a better representation of our actual performance. Free
cash flow is a Non-GAAP measure and is defined as cash flow from operating activities, less
capital expenditures and purchases of intangibles. Management believes such Non-GAAP
measures provide investors with a more complete understanding of Broadridge’s underlying
operational results. These Non-GAAP measures are indicators that management uses to provide
additional meaningful comparisons between current results and prior reported results, and as a basis
for planning and forecasting for future periods. Accompanying this presentation is a
reconciliation of Non-GAAP measures to the comparable GAAP measures.
Pre-Spin Financial Information
Financial information presented for periods prior to the March 30, 2007 spin-off of Broadridge
from Automatic Data Processing, Inc. (“ADP”) represents the operations of the
brokerage services business which were operated as part of ADP. Broadridge’s financial results for periods
before the spin-off from ADP may not be indicative of our future performance and do not
necessarily reflect what our results would have been had Broadridge operated as a separate,
stand-alone entity during the periods presented, including changes in our operations and capitalization as a
result of the spin-off from ADP. Use of Material Contained Herein
The information contained in this presentation is being provided for your convenience and information
only. This information is accurate as of the date of its initial presentation. If
you plan to use this information for any purpose, verification of its continued accuracy is your responsibility.
Broadridge assumes no duty to update or revise the information contained in this presentation.
You may reproduce information contained in this presentation provided you do not alter, edit,
or delete any of the content and provided you identify the source of the information as Broadridge
Financial Solutions, Inc., which owns the copyright.
Broadridge and the Broadridge logo are registered trademarks of Broadridge Financial Solutions, Inc. |
 2
Broadridge Overview |
 3
Broadridge is a strong, resilient business
with significant growth potential
History of market leadership
–
Proven ability to address increasingly complex customer needs
through technology
–
Innovation and thought leader in industry for >50 years
Strong position in large and attractive markets
–
Leader in investor communications and global securities
processing –
Resilient through financial crisis due to mission-critical nature of
services –
Deeply respected by industry and regulators
–
Room for expansion into naturally adjacent markets
Excellent team
–
Results-driven and deeply experienced management team aligned
with long-term interests of shareholders
–
Highly engaged associates -
one of the best large companies to work for in
NY
1
for 5
th
consecutive year
1. As recognized by the NY Society of Human Resources in
2008-2012 |
 4
Broadridge Strategy Statement
Our vision is to be the leading provider of Investor
Communications and Technology and Operations Solutions to
Banks/Broker-Dealers, Mutual Funds, and Corporate Issuers
globally
–
Our mission is to drive the industry we serve to higher levels of efficiency
and compliance; to partner with financial institutions and public companies
to enable their growth; and to provide innovative outsourcing solutions for
mission-critical activities
–
We will grow our businesses by leveraging our unique network, our market
position, and our brand/service reputation
–
We will do so with a combination of organic growth and M&A
–
We anticipate that this approach will drive 6-9% revenue growth and
low-to- mid-teens earnings growth
–
We expect to pay a meaningful dividend and to opportunistically buy back
shares |
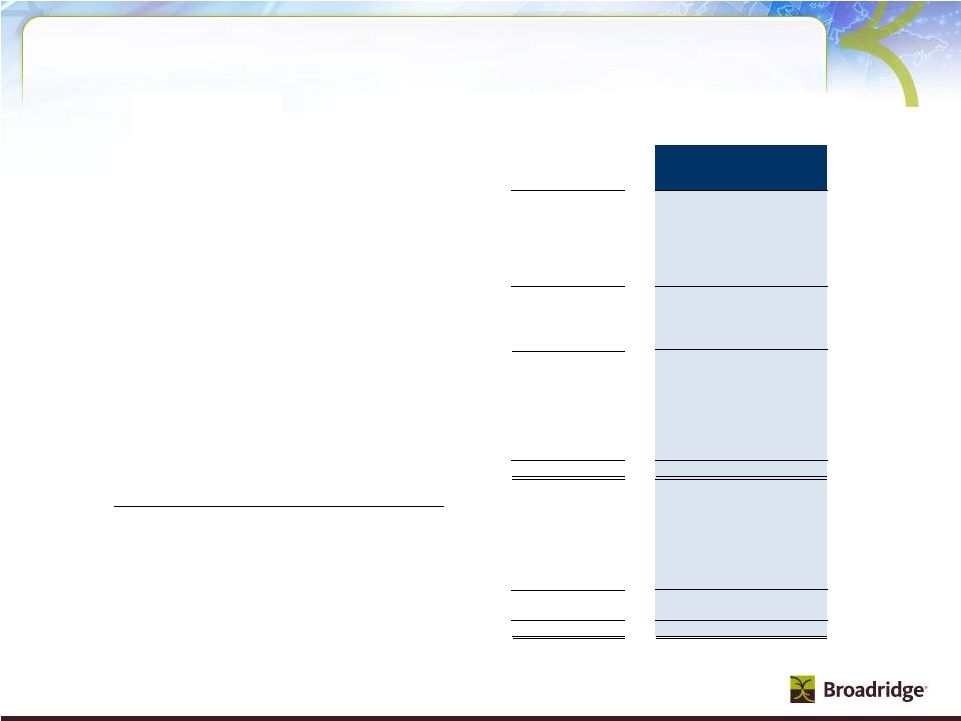
 5
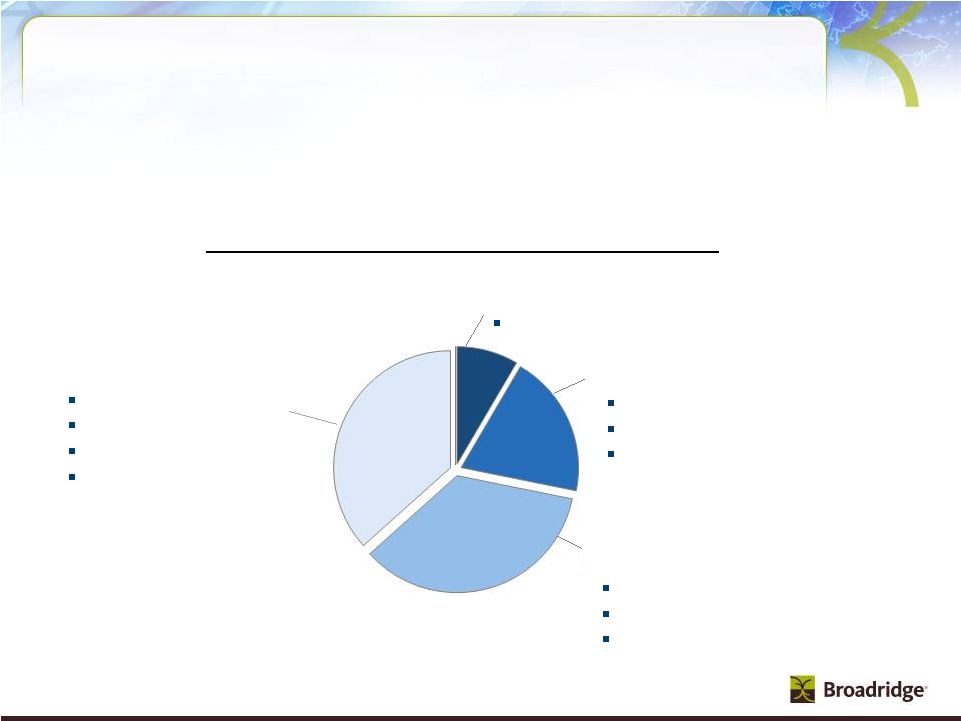
Recurring Fee Revenue
Investor Communication Solutions
$B
1.5
0.5
2012
2007
Growth through difficult
market environment
•
Proxy services for ~85%
of outstanding
shares in US
•
Processed >600 billion shares in 2012
•
Used by >5,500 institutional investors
globally
•
Eliminates >50%
of physical mailings
•
~450K
votes through mobile apps during
2012 proxy season
New businesses
Tuck-in acquisitions
Broadridge is well positioned to accelerate growth
and continue driving strong free cash flow
~7% CAGR
Securities Processing Solutions
Enable clients
to process in
>50 countries
Processes >$4.5 trillion
(average) in equity and
fixed income trades per
day
1.0
Our market position is differentiated
and sustainable |
 6
Investor Communication
Solutions
Securities Processing
Solutions
We are
the leader in several markets
Market
Rank
Bank/Broker-Dealer
Regulatory
Communications
Broker-Dealer
Transactional
Communications
Corporate Issuer
Regulatory
Communications
Mutual Fund Proxy
Mail and Tabulation
Market
Rank
US Brokerage
Processing
US Fixed Income
Processing
Canadian Brokerage
Processing
#1
#1
#1
#1
#1
#1
#1
1. Marketshare based on Broadridge estimates
1
1 |
 7
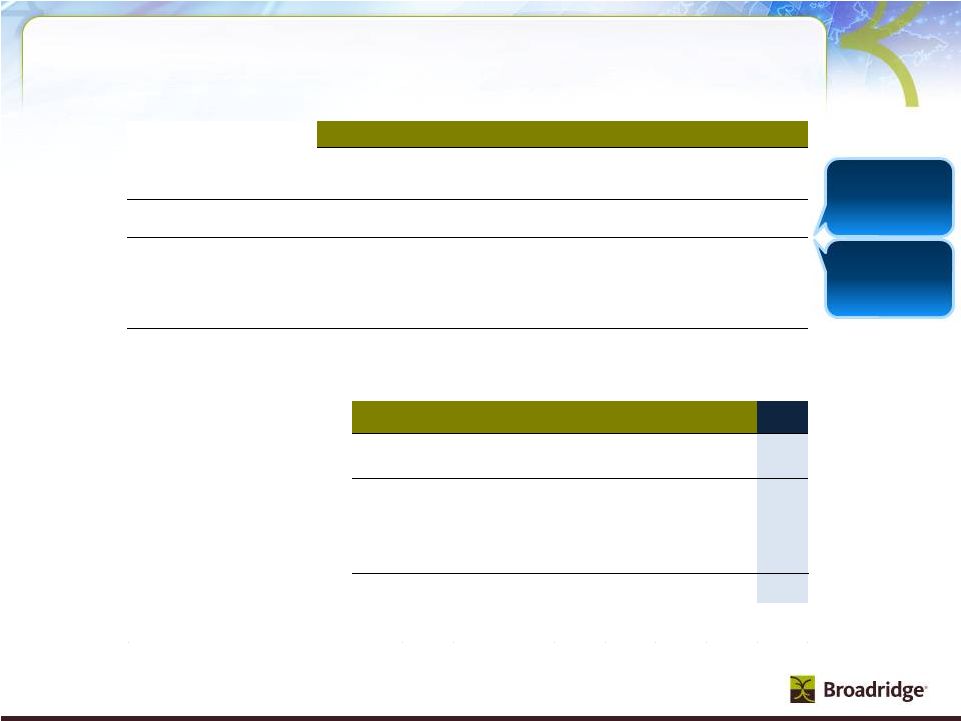
Investor Communication Solutions (ICS) |
 Mutual Fund—Natural adjacencies
Transaction reporting
Imaging and workflow, etc.
Mutual Fund—Core
Retirement processing
Data aggregation
Marketing communications
Proxy/solicitation
Large and attractive markets –
Investor
Communications is a $10B+ market
BBD—Emerging products
Global proxy and communications
Tax reporting and outsourcing
Security class actions
Advisor services
Bank/Broker-Dealer (BBD)—Core
Regulatory communications
(proxy, interims, etc.)
Customer communications
(transaction statements, etc.)
Total addressable market $10B+ fee revenue
Issuer
Transfer agency
Shareholder analytics
Investor communications
BBD—Natural adjacencies
Enterprise archiving
On-boarding
International tax reclaim
Sources: BCG, Bain, Patpatia, Broadridge estimates
$1.3B
$0.9B
$2.0B
$3.0B
$1.8B
$1.7B
8 |
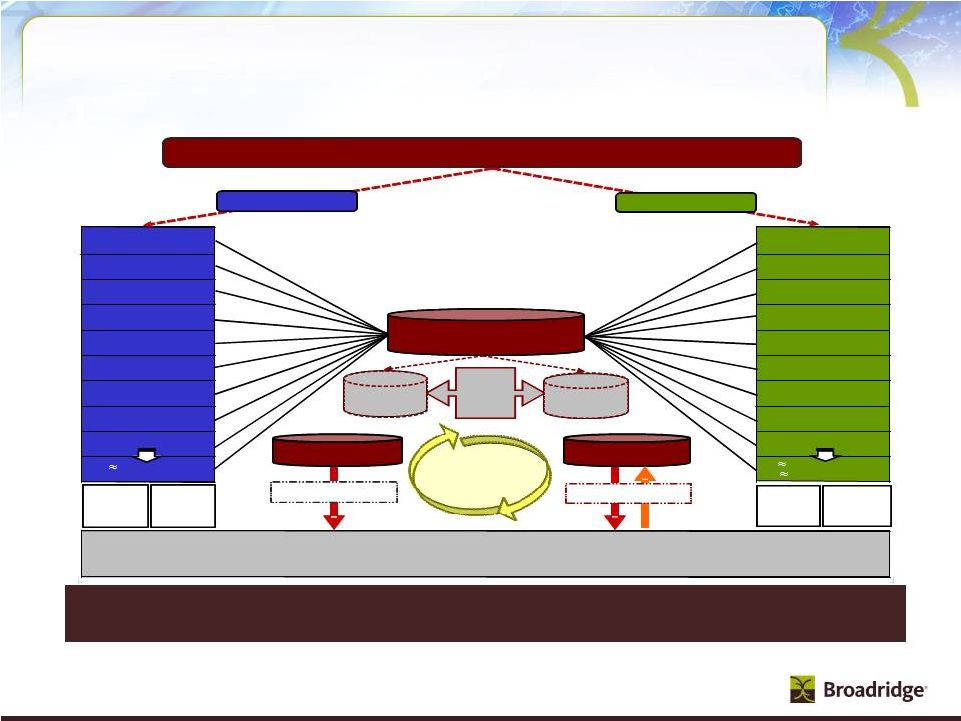 ICS Unique
Business Systems Processing Model PROXY & INTERIMS PROCESSING OVERVIEW
"THE PLUMBING"
Broker/Bank 1
Issuer 1 / Fund 1
Broker/Bank 2
Issuer 2 / Fund 2
Broker/Bank 3
Issuer 3 / Fund 3
Broker/Bank 4
Issuer 4 / Fund 4
Broker/Bank 5
Issuer 5 / Fund 5
Broker/Bank 6
Issuer 6 / Fund 6
Broker/Bank 7
Issuer 7 / Fund 7
Broker/Bank 8
Issuer 8 / Fund 8
Broker/Bank 9
Issuer 9 / Fund 9
800+
(1)
(3)
Funds 700+
(4)
ANNUAL CORPORATE ISSUER AND MUTUAL FUND EVENTS
Approximately 12,000 Events Per Year
(Annual Corporate Issuer Shareholder Meetings and Mutual Fund Proxy Meetings)
Proxy Distribution
>40% of
accounts
require
special
processing
Vote Processing
Managing
~350M
active
positions
(2)
Majority of
all shares
are held in
street
-
side
Shareholder
Preferences
Database
Shareholder
Consent
Database
Equity and Mutual Fund Shareholders
Broadridge
manages
>1,600
Corporate
Issuers
Electronic or
Physical Vote Return
Data Hub and Platform
Electronic or
Physical Delivery
Street-side Processing
BROADRIDGE
Proxy Processing System
Over 8 million lines of code and approximately 500,000 function points
Supported by 150+ dedicated programmers
Broadridge
processes on
average 85%
of U.S. shares
outstanding
Registered Processing
Issuers 10,000+
Brokers/Banks
9
Proxy and Interim processing system is the “plumbing”
supporting the voting
process for corporate governance
(1)
Represents Broadridge’s estimated total number of brokerage firms
and banks in the U.S. and international markets
(2)
Represents Broadridge’s estimated total number of positions
managed by U.S. brokers and banks
(3)
Represents Broadridge’s estimated total number of corporate
issuers in the U.S.
(4) Represents total number of Fund Sponsors in the
U.S. who manage over 16,000 funds including Mutual Funds, Closed-end Funds, ETFs and
UITs, according to the Investment Company Institute’s 2009
Investment Company Year Book
> 50% of Hard Copy
Mailings Eliminated
via E-
Delivery and
Suppressions
85% of Shares Voted
Electronically |
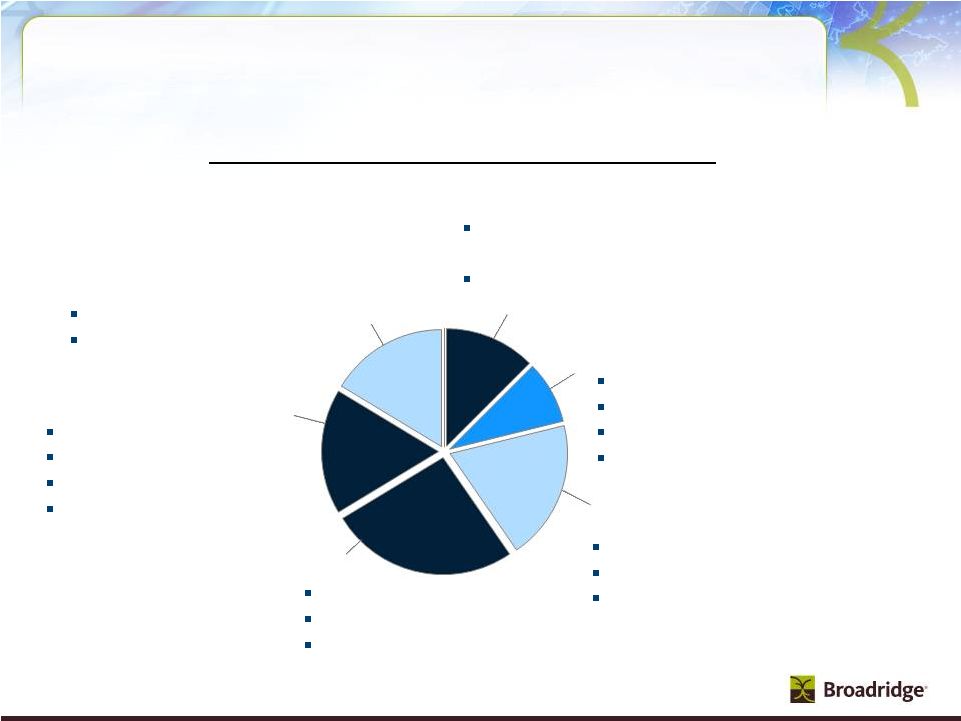
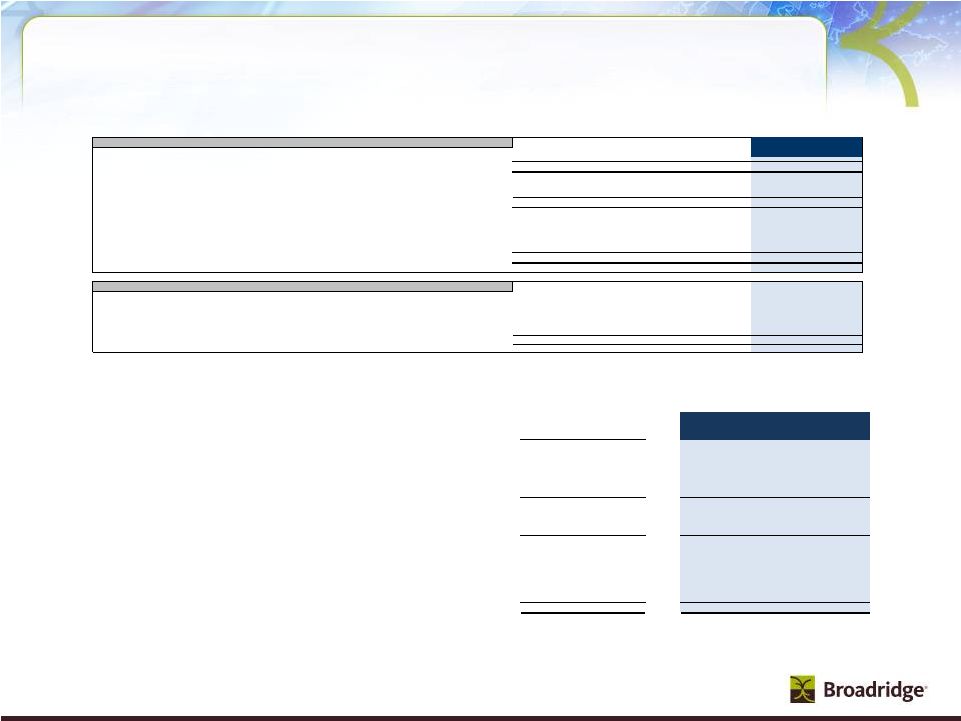
 ICS Product and
Client Revenue Overview We have a strong and diverse product
offering…
ICS is highly resilient due to our deep customer relationships with our
Bank/Broker-Dealer clients
…and we have deep and longstanding
client relationships
Increase in electronic
distribution reduces postage
revenue and increases profits
FY12 Client Revenues
(Based on who pays BR as agent)
Other
$146M (9%)
Fulfillment
$132M (8%)
Transaction
Reporting
$165M (10%)
Interims
$160M (10%)
Proxy
$327M (20%)
Bank/Broker
-
Dealer
(29%)
Mutual Fund
(41%)
Corporate
Issuer
(30%)
10
Primarily
Postage
Distribution
$704M (43%)
FY12 Product Revenues |
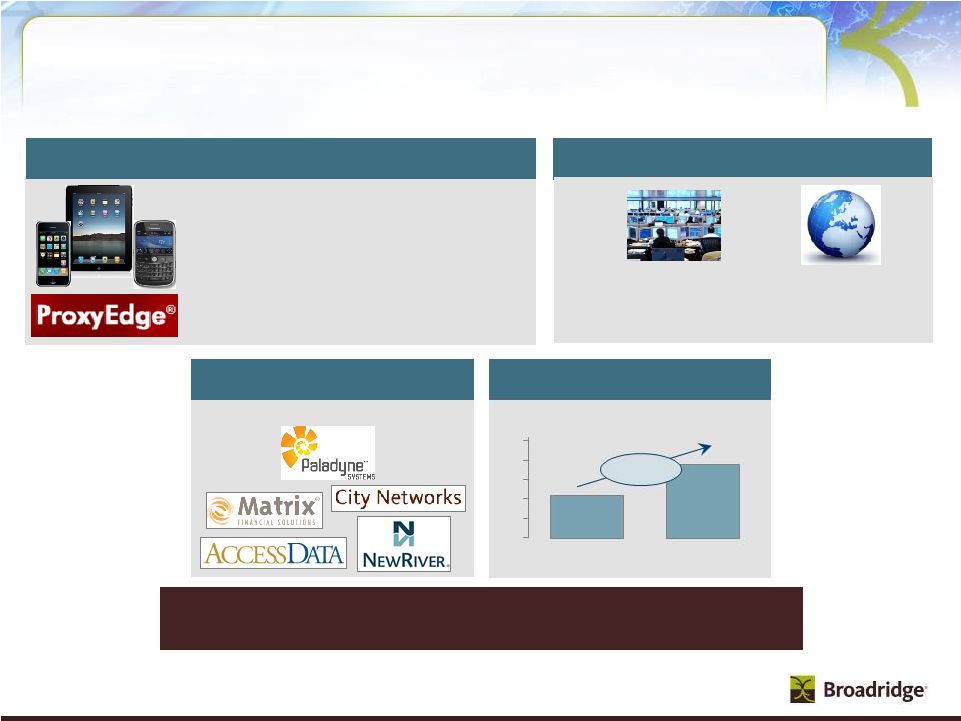
 ICS-Bank/Broker-Dealer
What We Do:
Regulatory communications
–
Beneficial proxy and interims for equities
–
Beneficial mutual fund compliance
communications
Customer communications
–
Transaction statements, trade confirmations
and other reporting
Global and emerging products
–
Advisor services
–
Global proxy and communications
–
Tax reporting and outsourcing
–
Securities class actions
Competitive Advantages:
Indispensible data hub with established
relationships with majority of BBDs
Strong market position and innovative
leadership
–
First/only certified voting results
–
First e-delivery, phone, web and mobile voting
platform
Proprietary systems, network and
databases
–
ProxyEdge®
–
institutional voting and record
keeping platform
–
Preference and consent database
Unmatched scale with highest level data
security (ISO 27001)
11 |
 What We Do:
Mutual Fund trade processing in the
defined contribution/trust space
(Matrix)
Data aggregation and analytics
(Access Data)
Marketing/Regulatory
communications including content
(NewRiver)
Registered proxy and solicitation
ICS-Mutual Funds
Competitive Advantages:
Long-standing relationships across
industry
Serve every mutual fund and majority of
banks/broker-dealers
Unique data capabilities
Proprietary platform to allow mutual funds to
understand their clients
Innovative business applications that address
unique industry issues such as compliance
and distribution payments
Largest electronic repository for mutual fund
regulatory data
Industry-leading ICS products with
unmatched scale
Leverage to create cost-effective products for
mutual funds
12 |
 13
What We Do:
Beneficial proxy service
Registered shareholder communications
–
Registered proxy
–
Interim communications
Transfer agency (TA)
–
Stock share registry, ownership
transfers and dividend calculation
Enhanced issuer solutions
–
Shareholder analytics
–
Virtual shareholder meetings
–
Shareholder forums
–
Global proxy services
ICS-Issuers
shareholder communications to all types of
shareholders
shareholder communications annually as well as
record-keeping, corporate actions and other
shareholder account servicing
positions allows Issuers to more effectively
reach their shareholders
innovate the proxy process and help guide
Issuers through a complex regulatory
environment
Competitive Advantages:
Market Position
–
only full service provider of
Unmatched Scale
–
able to leverage one billion plus
Unmatched Data
–
unique dataset of investors and
Thought Leadership
–
unmatched expertise to |
 14
Securities Processing Solutions (SPS) |
 15
Sources: Tower Group, Chartis, Aite, IM2, Broadridge internal estimates
Technology and Operations spend adds
~$14B to our SPS addressable market
Securities and investment firms’
overall technology and operations
spend is over $100 billion and growing at 5%
$1.2B
$2.8B
~$5.0B
Adjacent markets
Middle-office
Buy-side services
Derivatives processing
Fixed Income market
data and analytics
~$5.2B
North American BPO
Middle-
and back-office
Data center services
Select corporate functions
US Brokerage Processing
Core equities and fixed income
Global Processing
Core equities and fixed income
Global BPO
Reconciliations
Total addressable market ~ $14B fee revenue |
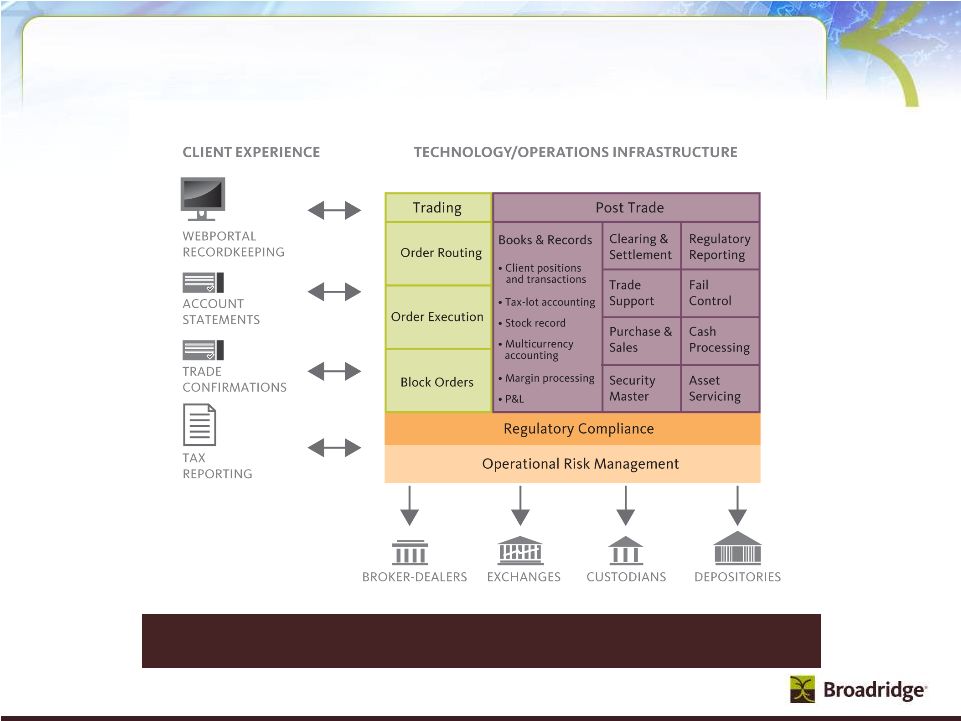 16
Broadridge global processing behind the scenes
Broadridge simplifies complex processes |
 17
Securities Processing North America Market Share
Overview
1
M
A
R
K
E
T
S
H
A
R
E
FY12 Product Revenues
Outsourcing
(~13%)
$82M
Fixed Income (~15%)
Transactions, $54M
Non-transactions, $45M
Equity
(~72%)
Transactions, $137M
Non-transactions, $338M
Equity Processing Client Volume
U.S. $ Fixed Income Client Volume
Operations Outsourcing
Broadridge
~30%
Competitors
~20%
In-house
~50%
Broadridge
~8%
Untapped
Market
~92%
(>$1 Billion)
Competitors
~2%
In-house
~43%
Broadridge
~55%
17
1. All market share information is based on management’s estimates
and is part of much larger market. No attempt has been made
to size such market |
  18
SPS Top 15 Clients for FY12
SPS client relationships are stable in volatile
market
Top
Equity Processing
Fixed Income
Clients
Retail
Institutional
Processing
Outsourcing
Alliance Bernstein
Bank of America/Merrill Lynch
Barclays Capital Services
BMO Nesbitt Burns
CIBC World Markets
Deutsche Bank
E*Trade Group
Edward Jones
Jefferies & Company
JP Morgan Chase
Mizuho Securities USA
Penson
Royal Bank of Canada
Scotia Capital
UBS Securities
Note: The above schedule is an alphabetical listing of the top 15 SPS clients which
represent ~70% of SPS revenues as of June 30, 2012. |
 What We Do:
Best-of-breed processing solutions
–
Leading global platform
–
Broad asset class coverage
Broad suite of add-on or point solutions
–
Desk top applications used by brokers
and traders
–
Workflow and reconciliation
applications
–
Data aggregation and warehousing
tools
Industry-leading global business process
outsourcing (BPO) solutions
SPS-Technology and Operations
19
Competitive Advantages:
Unique global technology platform
provides processing access to over 50
countries
Breadth of asset classes on single
“platform”
Flexible business model that can be
tailored to unique client needs
Trusted brand
Leading market position and scale |
 20
Financial Strategy |
 Our financial
strategy is a key part of our value creation strategy
~40% dividend payout, but expect no less than 72 cents
per share annually subject to Board approval
Organic growth with limited financial risk
–
Avoid significant balance sheet risk
–
Invest in projects delivering at least 20% IRR
Tuck-in acquisitions with clear growth profile and returns
–
Accretive to growth, margins, and earnings
–
>20% IRR in conservative business case
Long-term investment-grade debt rating
–
Adjusted Debt/EBITDAR ratio
1
target is 2:1
Excess cash used opportunistically to offset dilution and
reduce share count through buybacks
1. Adjusted Debt/EBITDAR ratio calculated as (Debt + 5x Rent Expense) / (EBITDA +
Rent Expense) 21 |
 22
Appendix |
 23
Revenue Growth Drivers and EBIT Margin
EBIT margins do not include one-time charges or benefits reflected as
Non-GAAP adjustments, including ~$10M expected in FY13 for outsourcing
restructuring In FY13, acquisitions since spin-off are expected to
represent ~10% of revenue, ~7% of EBT and ~10% EBITDA. FY12 and FY13
includes amortization of acquired intangibles of ~$20M (~100 bps) Historical
CAGR Actual
Full Yr
Forecast
(FY05-FY10)
FY11
FY12
FY13
6%
(2)%
Total Revenue Growth
6%
3-4%
4%
3%
Closed
Sales
(Recurring)
3%
4-5%
(2)%
(1)%
(1)%
(1)%
2%
2%
Net New Business
2%
3-4%
3%
1%
Internal Growth
(a)
1%
0%
0%
4%
Acquisitions
3%
0%
5%
7%
Total Recurring
6%
3-4%
1%
(6)%
Event-Driven
(b)
0%
0%
0%
(4)%
Distribution
(c)
0%
0%
0%
1%
FX/Other
0%
0%
13.1%
EBIT
Margin
(Non-GAAP)
13.9%
14.9 -
15.7%
(a) Internal Growth includes SPS Equity & Fixed Income Trades, ICS Equity &
Mutual Fund Stock Record Growth, Transaction Reporting and Time & Materials
(b) Event-Driven includes ICS Proxy Contest/Specials, Mutual Fund Proxy and
Marketing Communications Fulfillment (c) Distribution includes
pass-through fees from Matrix Client Losses
|
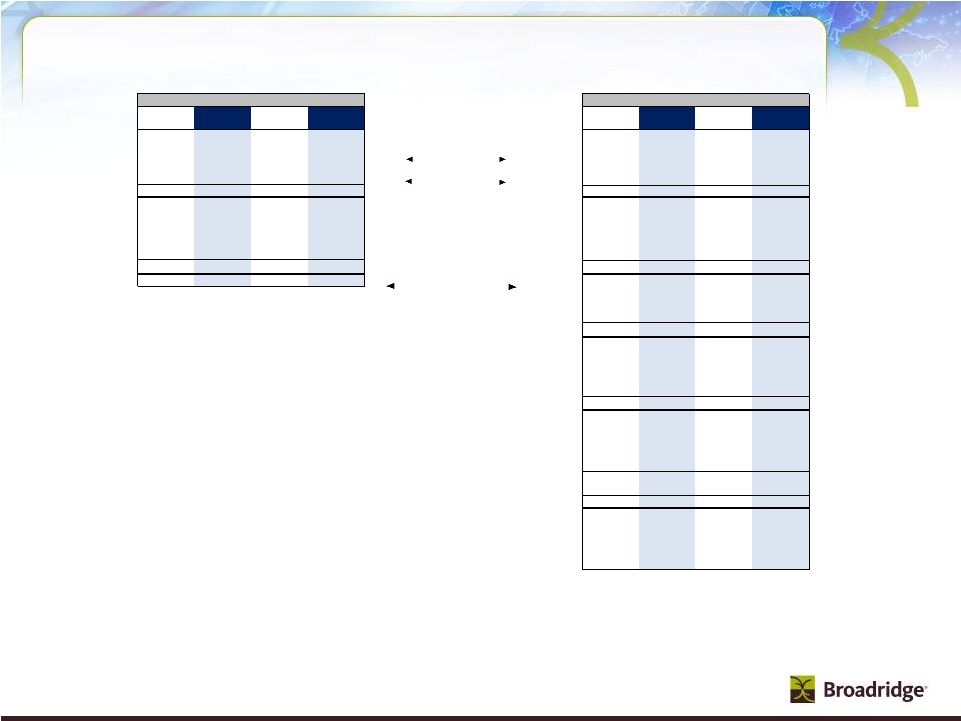   24
Broadridge 4Q and FY12 from Continuing Operations
Revenue
FY11
FY12
FY11
FY12
Q4
Q4
Full Yr
Full Yr
$617
$630
$1,559
$1,634
1%
2%
-7%
5%
$152
$167
$594
$655
10%
10%
11%
10%
$769
$797
$2,153
$2,290
3%
4%
-2%
6%
$0
$0
$0
$0
$7
$3
$14
$13
$776
$800
$2,167
$2,304
3%
3%
-2%
6%
($ in millions)
ICS
Growth % / Margin %
SPS
Growth % / Margin %
Total Segments
Margin %
Other
(a)
FX
(b)
Total Broadridge (Non-GAAP)
(a)
Growth % / Margin %
Interest & Other
Total EBT (Non-GAAP)
(a)
Margin %
Income taxes
(a)
Tax Rate
Total Net Earnings (Non-GAAP)
(a)
Margin %
IBM Migration costs
Restructuring charges
Penson Charges, net
(c)
Non-GAAP Items (Net of Taxes)
Total Net Earnings (GAAP)
Margin %
Diluted Shares
Diluted EPS (Non-GAAP)
(a)
Diluted EPS (GAAP)
Earnings
FY11
FY12
FY11
FY12
Q4
Q4
Full Yr
Full Yr
$174
$187
$213
$243
28.3%
29.7%
13.7%
14.9%
$20
$18
$87
$91
13.2%
11.0%
14.7%
13.9%
$194
$205
$301
$334
25.3%
25.8%
14.0%
14.6%
($8)
($11)
($25)
($28)
$3
$5
$9
$14
$190
$200
$285
$319
24.4%
24.9%
13.1%
13.9%
($2)
($4)
($8)
($13)
$188
$196
$276
$306
24.2%
24.5%
12.7%
13.3%
($68)
($68)
($100)
($108)
36.3%
34.7%
36.3%
35.4%
$119
$128
$176
$198
15.4%
16.0%
8.1%
8.6%
($4)
($7)
($4)
($15)
$0
($4)
$0
($4)
$0
($33)
$0
($54)
($4)
($44)
($4)
($73)
$115
$83
$172
$125
14.9%
10.4%
7.9%
5.4%
127
128
128
128
$0.94
$1.00
$1.37
$1.55
$0.91
$0.65
$1.34
$0.98
(b) Includes impacts of FX P&L and FX Transaction Activity.
(a) FY12 Q4 excludes the IBM Migration costs of $12M (after tax $7M, or $0.06 EPS impact),
restructuring charges of $7M (after tax $4M, or 0.03 EPS impact) and Penson Charges, net, of
$42M (after tax $33M, or $0.26 EPS impact). FY12 Full Year excludes the IBM Migration costs of $25M (after tax $15M, or $0.12 EPS impact), restructuring charges of $7M
(after tax $4M, or 0.03 EPS impact) and Penson Charges, net, of $74M (after tax $54M, or $0.42 EPS
impact). (c) FY12 Q4 and FY12 Full Year includes Penson deferred client conversion and startup
costs, OTTI charges, shutdown costs, less the elimination of the obligation to pay or credit
Penson fees. FY12 Full Year also includes the cancellation of the Note Receivable.
|
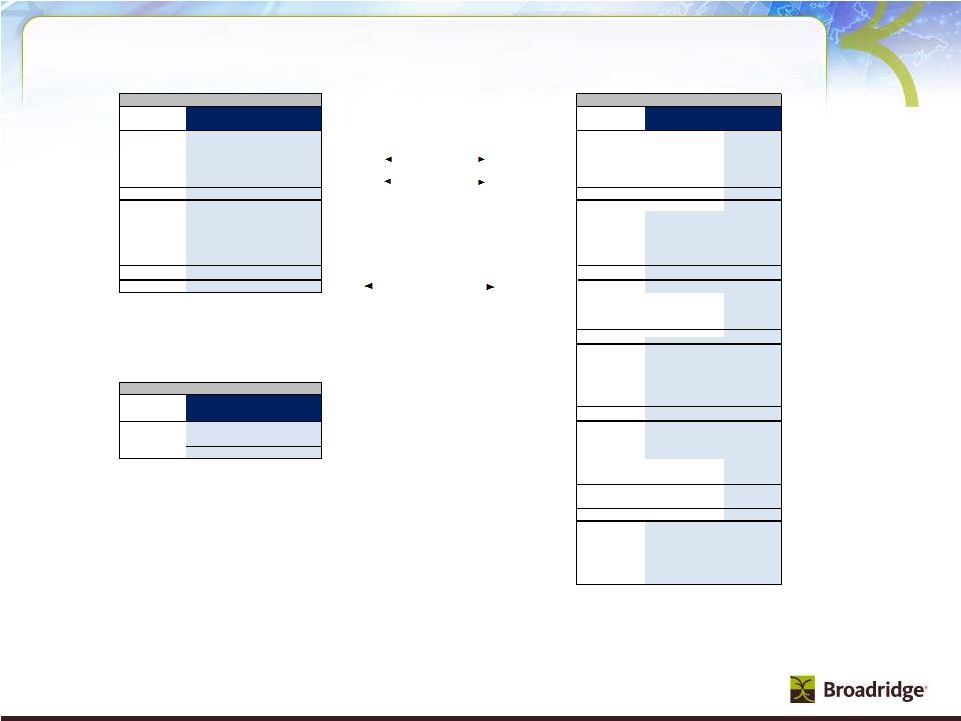          25
Broadridge FY13 Guidance from Continuing Operations
Revenue
FY12
FY13 Range
Actual
Low
High
$1,634
$1,695
$1,707
5%
4%
4%
$655
$658
$683
10%
0%
4%
$2,290
$2,353
$2,390
6%
3%
4%
$0
$0
$0
$13
$13
$13
$2,304
$2,366
$2,403
6%
3%
4%
Recurring Closed Sales
FY13 Range
Segments
Low
High
ICS
$50
$70
SPS
$60
$80
Total
$110
$150
Earnings
FY12
FY13 Range
Actual
Low
High
$243
$291
$299
14.9%
17.2%
17.5%
$91
$79
$102
13.9%
12.0%
15.0%
$334
$370
$401
14.6%
15.7%
16.8%
($28)
($30)
($37)
$14
$13
$13
$319
$353
$377
13.9%
14.9%
15.7%
($13)
($17)
($21)
$306
$336
$356
13.3%
14.2%
14.8%
($108)
($124)
($132)
35.4%
37.0%
37.0%
$198
$212
$224
8.6%
8.9%
9.3%
($15)
$0
$0
($4)
$0
$0
($54)
($6)
($6)
($73)
($6)
($6)
$125
$205
$218
5.4%
8.7%
9.1%
128
128
128
$1.55
$1.65
$1.75
$0.98
$1.60
$1.70
(b) Includes impacts of FX P&L and FX Transaction Activity.
* Guidance does not take into consideration the effect of any future acquisitions, additional debt
and/or share repurchases in excess of the repurchases needed to achieve our 128 million diluted
weighted-average outstanding shares guidance. (a) FY12 excludes the IBM Migration costs of
$25M (after tax $15M, or $0.12 EPS impact), restructuring charges of $7M (after tax $4M, or 0.03 EPS
impact) and Penson Charges, net, of $74M (after tax $54M, or $0.42 EPS impact). FY13 excludes
estimated charges relating to Penson. (c) FY12 includes Penson deferred client conversion and
startup costs, OTTI charges, shutdown costs, cancellation of the note receivable, less the
elimination of the obligation to pay or credit Penson fees. FY13 includes estimated charges
relating to Penson. ($ in millions)
ICS
Growth % / Margin %
SPS
Growth % / Margin %
Total Segments
Margin %
Other
(a)
FX
(b)
Total Broadridge (Non-GAAP)
(a)
Growth % / Margin %
Interest & Other
Total EBT (Non-GAAP)
(a)
Margin %
Income taxes
(a)
Tax Rate
Total Net Earnings (Non-GAAP)
(a)
Margin %
IBM Migration costs
Restructuring charges
Penson Charges, net
(c)
Non-GAAP Items (Net of Taxes)
Total Net Earnings (GAAP)
Margin %
Diluted Shares
Diluted EPS (Non-GAAP)
(a)
Diluted EPS (GAAP) |
 26
Cash Flow –
FY12 Results and FY13 Forecast
(a)
Guidance does not take into consideration the effect of any future acquisitions,
additional debt and/or share repurchases in excess of the repurchases needed to achieve our 128 million diluted
weighted-average shares outstanding guidance.
(b)
FY12 includes IBM Migration costs of $25M.
Year ended
June 2012
Low
High
Free Cash Flow
(Non-GAAP)
:
Net earnings from continuing operations (GAAP)
125
$
205
$
218
$
Depreciation and amortization (includes other LT assets)
92
95
105
Stock-based compensation expense
28
31
31
Other
60
(5)
5
Subtotal
305
326
359
Working capital changes
72
(15)
(15)
Long-term assets & liabilities changes (b)
(79)
(60)
(50)
Net cash flow (used in) provided by continuing operating activities
298
251
294
Cash Flows From Investing Activities
IBM / ITO data center investment
(8)
-
-
Penson
(7)
-
-
Capital expenditures & software purchases
(39)
(55)
(45)
Free cash flow (Non-GAAP)
244
$
196
$
249
$
Cash Flows From Other Investing and Financing Activities
Acquisitions
(72)
-
-
Stock repurchases net of options proceeds
(8)
-
-
Proceeds from borrowing net of debt repayments
-
-
-
Dividends paid
(78)
(86)
(86)
Other
(7)
(5)
5
Net change in cash and cash equivalents
79
105
168
Cash and cash equivalents, at the beginning of year
242
321
321
Cash and cash equivalents, at the end of period
321
426
$
489
$
($ millions)
Unaudited
Free Cash Flow -
Non-GAAP
FY13 Range
(a)
$
|
 27
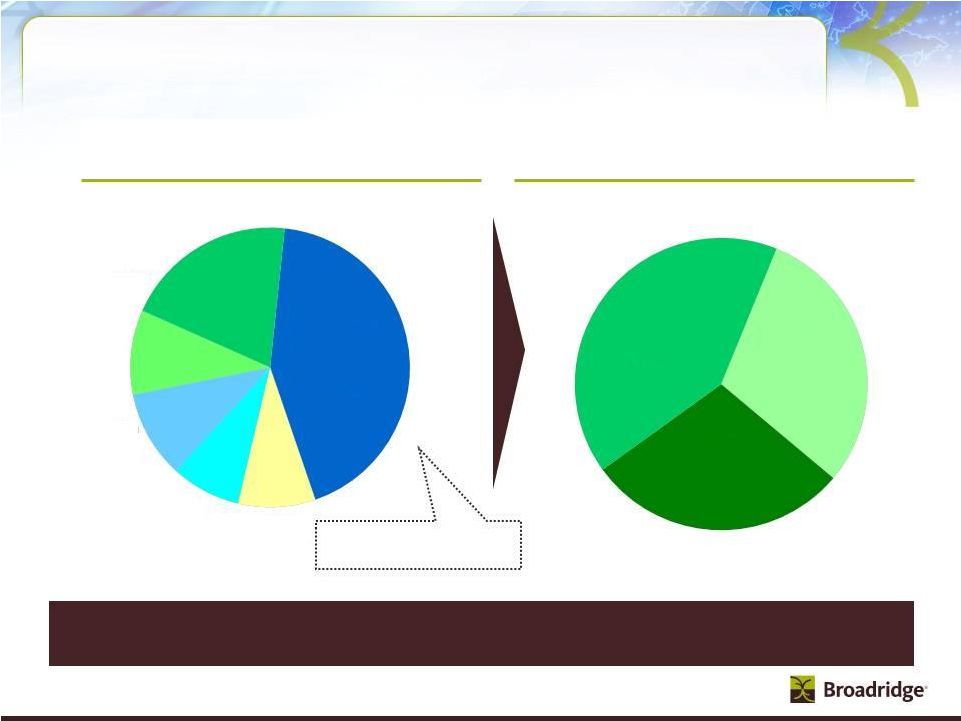
Revenues and Closed Sales FY05-FY12
Organic
~50%
Growth Contribution
Acquisitions
~50%
Growth Contribution
($ in millions)
Recurring Fee Revenues
FY05
FY06
FY07
FY08
FY09
FY10
FY11
FY12
ICS
444
$
513
$
519
$
558
$
583
$
610
$
650
$
699
$
Growth
16%
1%
8%
4%
5%
7%
8%
SPS
459
$
458
$
509
$
515
$
537
$
513
$
522
$
545
$
Growth
0%
11%
1%
4%
-4%
2%
4%
Segment Recurring Fee Revenues
903
$
971
$
1,028
$
1,073
$
1,120
$
1,123
$
1,172
$
1,244
$
Growth
7%
6%
4%
4%
0%
4%
6%
Acquisitions
(cumulative)
0
$
18
$
28
$
28
$
33
$
45
$
141
$
209
$
Total Recurring Fee Revenues
903
$
988
$
1,056
$
1,101
$
1,153
$
1,168
$
1,313
$
1,453
$
9%
7%
4%
5%
1%
12%
11%
Event-Driven
128
$
153
$
203
$
200
$
180
$
257
$
135
$
132
$
Growth
20%
33%
-1%
-10%
43%
-47%
-2%
Distribution
649
$
730
$
821
$
808
$
757
$
781
$
704
$
704
$
Growth
12%
12%
-2%
-6%
3%
-10%
0%
Other/FX
(25)
$
(19)
$
(12)
$
22
$
(17)
$
4
$
14
$
14
$
Total Revenues
1,656
$
1,853
$
2,068
$
2,131
$
2,072
$
2,209
$
2,167
$
2,304
$
Growth
12%
12%
3%
-3%
7%
-2%
6%
Recurring Closed Sales
77
$
92
$
63
$
82
$
95
$
119
$
113
$
120
$
Growth
19%
-32%
30%
16%
25%
-5%
6%
($ in millions)
Forecast
Event-Driven Fee Revenues
(a)
FY05
FY06
FY07
FY08
FY09
FY10
FY11
FY12
FY13
Mutual Fund Proxy
51
$
61
$
79
$
92
$
55
$
150
$
39
$
28
$
27
$
Mutual Fund Supplemental
39
$
43
$
51
$
49
$
58
$
48
$
44
$
47
$
46
$
Contest/ Specials/ Other Communications
38
$
49
$
73
$
59
$
67
$
59
$
52
$
57
$
56
$
Total Event-Driven Fee Revenues
128
$
153
$
203
$
200
$
180
$
257
$
135
$
132
$
129
$
Growth
20%
33%
-1%
-10%
43%
-47%
-2%
Recurring Distribution Revenues
(b)
496
$
562
$
593
$
580
$
567
$
564
$
573
$
597
$
~$597
Growth
13%
6%
-2%
-2%
-1%
2%
4%
ED Distribution Revenues
(b)
153
$
169
$
228
$
228
$
190
$
217
$
131
$
107
$
~$107
Growth
10%
35%
0%
-17%
14%
-39%
-18%
Total Distribution Revenues
649
$
730
$
821
$
808
$
757
$
781
$
704
$
704
$
~$704
Growth
12%
12%
-2%
-6%
3%
-10%
0%
(a) Includes reclassification of Pre-sale Fulfillment from event-driven revenues to
recurring revenues. (b) Includes reclassification of Pre-sale Fulfillment
related distribution revenues and Matrix pass-through administrative services from event-driven revenues to recurring revenues. |
 28
Reconciliation of Non-GAAP to GAAP Measures
Total EBT from continuing operations (EBT) Reconciliation
4Q11
4Q12
FY11
FY12
FY13 Range
($ in millions)
Actual
Actual
Actual
Actual
Low
High
EBIT (Non-GAAP)
$190
$200
$285
$319
$353
$377
Margin %
24.4%
24.9%
13.1%
13.9%
14.9%
15.7%
Interest & Other
($2)
($4)
($8)
($13)
($17)
($21)
Total EBT (Non-GAAP)
$188
$196
$276
$306
$336
$356
Margin %
24.2%
24.5%
12.7%
13.3%
14.2%
14.8%
IBM Migration costs
($6)
($12)
($6)
($25)
$0
$0
Restructuring charges
$0
($7)
$0
($7)
$0
$0
Penson Charges, net
$0
($42)
$0
($74)
($10)
($10)
Total EBT (GAAP)
$181
$135
$270
$201
$326
$346
Margin %
23.3%
16.9%
12.4%
8.7%
13.8%
14.4%
Diluted EPS from continuing operations (Diluted EPS) Reconciliation
Diluted EPS (Non-GAAP)
$0.94
$1.00
$1.37
$1.55
$1.65
$1.75
IBM Migration costs
(0.03)
(0.06)
(0.03)
(0.12)
0.00
0.00
Restructuring charges
0.00
(0.03)
0.00
(0.03)
0.00
0.00
Penson Charges, net
0.00
(0.26)
0.00
(0.42)
(0.05)
(0.05)
Diluted EPS (GAAP)
$0.91
$0.65
$1.34
$0.98
$1.60
$1.70
Year ended
June 2012
Low
High
Net earnings from continuing operations (GAAP)
125
$
205
$
218
$
Depreciation and amortization (includes other LT assets)
92
95
105
Stock-based compensation expense
28
31
31
Other
60
(5)
5
Subtotal
305
326
359
Working capital changes
72
(15)
(15)
(79)
(60)
(50)
Net cash flow (used in) provided by continuing operating activities
298
251
294
Cash Flows From Investing Activities
IBM / ITO data center investment
(8)
-
-
Penson
(7)
-
-
Capital expenditures & software purchases
(39)
(55)
(45)
Free cash flow (Non-GAAP)
244
$
196
$
249
$
($ millions)
Unaudited
FY13 Range
(a)
Long-term assets & liabilities changes (b) (a)
Guidance does not take into consideration the effect of any future acquisitions, additional debt
and/or share repurchases in excess of the repurchases needed to achieve our 128 million diluted weighted-average shares
outstanding
guidance.
(b)
FY12 includes IBM Migration costs of $25M.
Free Cash Flow
(Non-GAAP)
: |
  29
ICS Key Segment Revenue Stats
RC= Recurring
ED= Event-Driven
In millions
Fee Revenues
4Q11
4Q12
FY11
FY12
Type
Proxy
Equities
198.3
$
202.7
$
279.5
$
282.8
$
RC
Stock Record Position Growth
1%
1%
0%
1%
Pieces
214.2
214.4
283.8
280.5
Mutual Funds
8.9
$
8.9
$
39.0
$
28.2
$
ED
Pieces
10.4
12.0
51.4
41.7
Contests/Specials
4.7
$
6.0
$
15.0
$
15.7
$
ED
Pieces
4.9
6.3
15.8
17.0
Total Proxy
211.9
$
217.6
$
333.5
$
326.7
$
Total Pieces
229.5
232.7
351.0
339.2
Notice and Access Opt-in %
59%
64%
58%
64%
Suppression %
55%
60%
53%
59%
Interims
Mutual Funds (Annual/Semi-Annual Reports/Annual Prospectuses)
25.6
$
28.3
$
102.1
$
113.0
$
RC
Position Growth
7%
8%
9%
9%
Pieces
139.2
145.4
525.3
583.5
Mutual Funds (Supplemental Prospectuses) & Other
9.9
$
11.9
$
44.0
$
46.8
$
ED
Pieces
55.2
59.0
253.2
250.2
Total Interims
35.5
$
40.2
$
146.1
$
159.8
$
Total Pieces
194.4
204.3
778.5
833.7
Transaction
Transaction Reporting/Customer Communications
37.9
$
40.6
$
156.2
$
164.5
$
RC
Reporting
Fulfillment
Fulfillment (a)
31.4
$
37.5
$
117.0
$
132.1
$
RC
Other
Other - Recurring (b)
28.1
$
28.5
$
65.4
$
105.3
$
RC
Communications
Other - Event-Driven (c)
11.5
$
13.5
$
37.0
$
41.2
$
ED
Total Other
39.6
$
42.0
$
102.4
$
146.5
$
Total Fee Revenues
356.3
$
377.9
$
855.2
$
929.6
$
Total Distribution Revenues (d)
260.6
$
252.2
$
704.2
$
704.4
$
Total Revenues as reported - GAAP
616.9
$
630.1
$
1,559.4
$
1,634.0
$
FY13 Ranges
Low
High
Total RC Fees
321.3
$
337.6
$
720.2
$
797.7
$
862
$
874
$
% RC Growth
12%
5%
14%
11%
8%
10%
Total ED Fees
35.0
$
40.3
$
135.0
$
131.9
$
129
$
129
$
Low
High
Sales
2%
3%
2%
3%
3%
3%
Losses
-1%
-1%
0%
-1%
-1%
-1%
Key
Net New Business
1%
2%
2%
2%
2%
2%
Revenue
Internal growth
1%
1%
0%
1%
2%
2%
Drivers
Recurring (Excluding Acquisitions)
2%
3%
2%
3%
4%
4%
Acquisitions
3%
0%
3%
2%
0%
0%
Total Recurring
5%
3%
5%
5%
4%
4%
Event-Driven
-3%
1%
-7%
0%
0%
0%
Distribution
-1%
-2%
-5%
0%
0%
0%
TOTAL
1%
2%
-7%
5%
4%
4%
(a) Consolidated Pre-sale and Post-sale Fulfillment and reclassified Pre-sale from
event-driven to recurring revenues. (b) Other Recurring Fee Revenue includes Matrix, New
River, StockTrans, Access Data, Forefield and Tax Reporting. (c) Other event-driven
includes 1.3M pieces for 4Q11, 2.2M for 4Q12, 8.3M for FY11 and 7.9M for FY12, primarily related to corporate actions.
(d) Total Distribution revenues primarily include pass-through revenues related to the physical
mailing of Proxy and Interims, as well as Matrix administrative services. Note: Certain prior
period amounts have been reclassified to conform with current period presentation. |
 30
SPS and Outsourcing Key Segment Revenue Stats
RC= Recurring
ED= Event-Driven
In millions
4Q11
4Q12
FY11
FY12
Type
Equity
Transaction-Based
Equity Trades (a)
35.5
$
32.4
$
141.4
$
137.1
$
RC
Internal Trade Volume
965
901
964
957
Internal Trade Growth
-4%
-7%
-1%
-1%
Trade Volume (Average Trades per Day in '000)
972
908
983
963
Non-Transaction
Other Equity Services
77.5
$
85.5
$
308.4
$
337.6
$
RC
Total Equity
113.0
$
117.9
$
449.8
$
474.7
$
Fixed Income
Transaction-Based
Fixed Income Trades (a)
12.3
$
13.9
$
47.7
$
54.0
$
RC
Internal Trade Volume
249
272
254
271
Internal Trade Growth
6%
9%
16%
6%
Trade Volume (Average Trades per Day in '000
261
297
259
294
Non-Transaction
Other Fixed Income Services
10.3
$
11.1
$
38.5
$
44.7
$
RC
Total Fixed Income
22.6
$
25.0
$
86.1
$
98.6
$
Outsourcing
Outsourcing
16.4
$
23.8
$
57.7
$
82.2
$
RC
# of Clients
11
17
11
17
152.0
$
166.6
$
593.6
$
655.5
$
FY13 Ranges
Low
High
Sales
3%
6%
4%
5%
6%
8%
Losses
-2%
-1%
-3%
-1%
-2%
-2%
Key
Net New Business
1%
5%
1%
4%
4%
6%
Revenue
Transaction & Non-transaction
1%
0%
3%
1%
-1%
1%
Drivers
Concessions
-1%
-2%
-2%
-2%
-4%
-4%
Internal growth
0%
-2%
1%
-1%
-5%
-3%
Acquisitions
9%
7%
9%
7%
1%
1%
TOTAL
10%
10%
11%
10%
0%
4%
(a) Equities and Fixed Income trade volumes have been adjusted to exclude trades
processed under fixed-price contracts and semi-variable step contracts. The revenue related to
these contracts was re-classified from 'Transaction-Based' to
'Non-Transaction'. Total Net Revenue as reported - GAAP |
 Broadridge ICS
Definitions 31
Equities -
Refers to the proxy services we provide in connection with annual stockholder
meetings for publicly traded corporate issuers. Annual meetings of public
companies include shares held in "street name" (meaning that they are held of record by brokers or banks, which in turn hold
the shares on behalf of their clients, the ultimate beneficial owners) and shares
held in "registered name" (shares registered directly in the names
of their owners).
Mutual Funds -
Refers to the proxy services we provide for funds, classes or trusts of an
investment company. Open-ended mutual funds are not required to have
annual meetings. As a result, mutual fund proxy services provided to open-ended mutual funds are driven by a "triggering
event." These triggering events can be a change in directors, fee structures,
investment restrictions, or mergers of funds. Contests
-
Refers
to
the
proxy
services
we
provide
when
a
separate
agenda
is
put
forth
by
one
or
more
stockholders
that
is
in
opposition
to the
proposals presented by management of the company which is separately distributed
and tabulated from the company’s proxy materials.
Specials -
Refers to the proxy services we provide in connection with stockholder meetings
held outside of the normal annual meeting cycle and are primarily driven by
special events (e.g., mergers and acquisitions in which the company being acquired is a public company and needs to
solicit the approval of its stockholders).
Mutual
Funds
(Annual/Semi-Annual
Reports/Annual
Prospectuses)
–
Refers
to
the
services
we
provide
investment
companies
in
connection
with
information
they
are
required
by
regulation
to
distribute
periodically
to
their
investors.
These
reports
contain
pertinent
information
such as holdings, fund performance, and other required disclosure.
Mutual
Funds
(Supplemental
Prospectuses)
–
Refers
primarily
to
information
required
to
be
provided
by
mutual
funds
to
supplement
information
previously
provided
in
an
annual
mutual
fund
prospectus
(e.g.,
change
in
portfolio
managers,
closing
funds
or
class
of
shares
to
investors, or restating or clarifying items in the original prospectus). The
events could occur at any time throughout the year. Other – Refers to communications
provided by corporate issuers and investment companies to investors including newsletters, notices, tax
information, marketing materials and other information not required to be
distributed by regulation. Transaction
Reporting
–
Refers
primarily
to
the
printing
and
distribution
of
account
statements,
trade
confirmations
and
tax
reporting
documents to account holders, including electronic delivery and archival
services. Post-Sale Fulfillment
– Refers primarily to the
distribution of prospectuses, offering documents, and required regulatory disclosure information
to investors in connection with purchases of securities.
Pre-Sale
Fulfillment
–
Refers
to
the
distribution
of
marketing
literature,
welcome
kits,
enrollment
kits,
and
investor
information
to
prospective
investors, existing stockholders and other targeted recipients on behalf of
broker-dealers, mutual fund companies and 401(k) administrators. Other – Refers to the services we
provide in connection with the distribution of communications material not included in the above definitions
such as non-objecting beneficial owner (NOBO) lists, and corporate actions
such as mergers, acquisitions, and tender offer transactions. Proxy
Interims
Transaction Reporting
Fulfillment
Other Communications |