Attached files
| file | filename |
|---|---|
| 8-K - FORM 8-K - E TRADE FINANCIAL CORP | d408953d8k.htm |
 E*TRADE
Financial Corporation Barclays Global Financial Services Conference
Frank J. Petrilli, Chairman and Interim CEO
September 11, 2012
©
2012 E*TRADE Financial Corporation. All rights reserved.
This presentation contains confidential information and may not be disclosed
without E*TRADE Financial Corporation’s written permission.
Exhibit 99.1 |
 ©
2012 E*TRADE FINANCIAL Corp. All rights reserved.
This presentation contains confidential information and may not be disclosed
without E*TRADE FINANCIAL Corporation’s written permission.
2
Notice to investors
Safe Harbor Statement
This presentation contains certain projections or other forward-looking statements
regarding future events or the future performance of the Company. Various factors,
including risks and uncertainties referred to in the 10Ks, 10Qs and other reports E*TRADE
Financial Corporation periodically files with the SEC, could cause our actual results
to differ materially from those indicated by our projections or other
forward-looking statements. This presentation also contains disclosure of
non-GAAP financial measures. A reconciliation of these financial measures to the
most directly comparable GAAP financial measures can
be found on the investor relations site at
https://investor.etrade.com. Forward-Looking
Statements The statements contained in this presentation that are forward looking are
based on current expectations that are subject to a number of uncertainties and risks,
and actual results may differ materially. Further information about these risks and
uncertainties can be found in the Company’s annual, quarterly and current reports
on Form 10-K, Form 10-Q and Form 8-K previously filed by E*TRADE Financial
Corporation with the SEC (including
information under the caption “Risk Factors”). Any forward-looking statement
included in this release speaks only as of the date of this communication; the Company
disclaims any obligation to update any information. |
 ©
2012 E*TRADE FINANCIAL Corp. All rights reserved.
This presentation contains confidential information and may not be disclosed
without E*TRADE FINANCIAL Corporation’s written permission.
3
E*TRADE’s Mission |
 ©
2012 E*TRADE FINANCIAL Corp. All rights reserved.
This presentation contains confidential information and may not be disclosed
without E*TRADE FINANCIAL Corporation’s written permission.
4
Improve market position in retail brokerage
•
Accelerate growth of the customer franchise
•
Continue to enhance the customer experience, improve satisfaction and retention
Capitalize on value of complementary brokerage businesses
•
Corporate Services Group
•
Market making operations
Enhance position in retirement & investing
•
Expand brand position for awareness and preference
•
Grow customer share of wallet
Continue to manage and de-risk the Bank
•
Mitigate
credit
losses
on
legacy
loan
portfolio
and
enhance
risk
profile
•
Build out enterprise risk management function
Strengthen overall financial and franchise position
•
Improve capital ratios through de-risking and de-leveraging
•
Focus on ultimately deploying excess Bank capital to parent to pay off high cost debt
•
Increase focus on cost reductions and efficiencies
Business Strategy |
 ©
2012 E*TRADE FINANCIAL Corp. All rights reserved.
This presentation contains confidential information and may not be disclosed
without E*TRADE FINANCIAL Corporation’s written permission.
5
Strengthen overall financial and franchise position
Ongoing improvement in net income
$627
($1,442)
($809)
($525)
($28)
$157
$102
($1,500)
($1,000)
($500)
$500
$1,000
FY 2006
FY 2007
FY 2008
FY 2009
FY 2010
FY 2011
1H 2012
(1)
$0 |
 ©
2012 E*TRADE FINANCIAL Corp. All rights reserved.
This presentation contains confidential information and may not be disclosed without
E*TRADE FINANCIAL Corporation’s written permission.
6
Strengthen overall financial and franchise position
$0.9B
$(2.2)B
$(1.3)B
$(0.9)B
$0.0B
$0.2B
Pre-tax income:
Defined path to improved earnings through current strategy
$1.0B
Long-term
impact to
current
strategy
(1)
$0.2B
($ M)
Last 4 quarters
Revenue
Provision
Servicing
FDIC expenses
Other
Expenses, total
Operating income
Interest & other
Pre-tax income
$1,924
($361)
($67)
($116)
($1,050)
($1,233)
$330
($180)
$150
Long-term impact
to current strategy
$2,108
$0
$0
($58)
($1,050)
($1,108)
$1,000
$0
$1,000
Net Interest Spread should improve to 300bps
with normalized rate environment
Should reduce to $0 as legacy portfolio runs off
Should reduce to $0 as legacy portfolio runs off
Should reduce by half as risk profile improves
Should reduce to $0 as excess Bank capital is
deployed to parent to pay off high cost debt
($3.5)
($2.5)
($1.5)
($0.5)
$0.5
$1.5
2006
2007
2008
2009
2010
2011
Last 4
quarters
Earnings before interest, taxes and credit costs
Provision / credit costs
Interest & other expense |
 ©
2012 E*TRADE FINANCIAL Corp. All rights reserved.
This presentation contains confidential information and may not be disclosed
without E*TRADE FINANCIAL Corporation’s written permission.
7
Strengthen overall financial and franchise position
Focus on increasing shareholder value through a more efficient capital structure
Capital ratios as of
6/30/12
Bank
Parent
Well-
capitalized
threshold
Total capital to
risk-weighted assets
(2)
18.0%
13.4%
10.0%
Tier 1 capital to
risk-weighted assets
(2)
16.7%
12.2%
6.0%
Tier 1 common
(3)
16.7%
10.2%
7.0%
Tier 1 leverage
(2)
7.9%
5.7%
5.0%
Bank excess capital / Parent debt
Focused on de-leveraging to improving most constraining ratio: Tier 1 leverage
$930M
of 12.5%
notes
Non-core
liabilities
= 35% of
total
On average, each $1B reduction in balance sheet size equates to:
13-15 bps of improvement to consolidated Tier 1 leverage ratio
16-18 bps of improvement to Bank Tier 1 leverage ratio
Net interest spread on reduced balances equates to 125-150 bps
De-leveraging options include:
Move non-core deposits off balance sheet
Move portion of sweep deposits off balance sheet
Reduce wholesale funding
Reducing leverage is integral to ultimately deploying excess Bank capital to parent to
pay off high-cost debt; and to gaining nearer-term flexibility to refinance
high-cost debt Refinancing the full $930M of 12.5% notes at first call date
(12/1/12) would result in a pre-tax loss of approximately $266 million:
~ $116 million for call premium
~ $150 million for original issue discount
$-
$0.5
$1.0
$1.5
$2.0
$2.5
$3.0
$3.5
$4.0
2Q 2008
2Q 2009
2Q 2010
2Q 2011
Q2 2012
($B)
Tier 1 capital
Risk-based capital
Parent debt
sweep
deposits
$20.5
customer
payables
$5.1
wholesale
funding
$7.5
other
deposits
$7.4
other
$2.1 |
 ©
2012 E*TRADE FINANCIAL Corp. All rights reserved.
This presentation contains confidential information and may not be disclosed
without E*TRADE FINANCIAL Corporation’s written permission.
8
Strengthen overall financial and franchise position
Deferred tax asset: Embedded value realized with ongoing profitability
Consolidated DTA of $1.5B
($0.4B at parent; $1.1B at Bank)
Ability to include more in regulatory capital with ongoing
profitability
Source of corporate cash as subsidiaries reimburse the
parent for use of its DTA
Approximately 16 years to use; expect to utilize the full
amount |
 ©
2012 E*TRADE FINANCIAL Corp. All rights reserved.
This presentation contains confidential information and may not be disclosed
without E*TRADE FINANCIAL Corporation’s written permission.
9
Improve market position in retail brokerage
Lower
Attrition
Increase
Net New Assets /
Share of Wallet
Grow
High Quality
Account Base
Increase
Asset-Based
and Commission-
Based Revenue
Key initiatives to drive success
•
Create leading online broker
experience:
•
E*TRADE.com
•
E*TRADE 360
•
E*TRADE Mobile
•
Education & research
•
E*TRADE Community
•
Focus on customer dissatisfiers
•
Continuous process improvement
•
Deliver best-in-class trading
experience:
•
E*TRADE.com
•
E*TRADE Pro
•
E*TRADE Mobile
•
Expand product engagement
through:
•
Platform enhancements
•
Idea generating tools
•
Education for all traders on
products, platforms, strategies and
risk management
•
Expand brand as a trusted
retirement and investing
provider
•
Deliver retirement advice &
planning:
•
Financial Consultants
•
Online planning tools
•
Managed Products
•
Increase awareness of needs-
based investing solutions:
•
Mutual funds
•
Fixed income
•
ETFs
•
Deepen relationships with
high-potential customers
Improve
Improve
customer experience
customer experience
Grow retirement
Grow retirement
& investing
& investing
Enhance retail
Enhance retail
trading offering
trading offering |
 ©
2012 E*TRADE FINANCIAL Corp. All rights reserved.
This presentation contains confidential information and may not be disclosed
without E*TRADE FINANCIAL Corporation’s written permission.
10
Improve market position in retail brokerage
Accelerate growth of the customer franchise
Net new brokerage
accounts
Net new brokerage
assets
(5)
Annualized brokerage
account attrition
(4)
Average brokerage
assets per account
(6)
Annualized brokerage
account attrition
(4)
51
25
13
10
46
46
0
15
30
45
60
Q1 11
Q2 11
Q3 11
Q4 11
Q1 12
Q2 12
9.9%
10.7%
10.5%
9.5%
8.7%
8.4%
0%
3%
6%
9%
12%
Q1 11
Q2 11
Q3 11
Q4 11
Q1 12
Q2 12
$3.9
$1.5
$2.6
$1.7
$4.0
$2.2
$0.0
$1.3
$2.5
$3.8
$5.0
Q1 11
Q2 11
Q3 11
Q4 11
Q1 12
Q2 12
$57
$56
$49
$52
$60
$57
$
$20
$40
$60
$80
Q1 11
Q2 11
Q3 11
Q4 11
Q1 12
Q2 12
2010: 12.2%
2011: 10.3%
1H 2012:
8.6%
2010: 54k
2011: 99k
1H 2012: 92k
2010: $8.1B
2011: $9.7B
1H 2012: $6.2B
2010: $49k
2011: $54k
1H 2012: $58k |
 ©
2012 E*TRADE FINANCIAL Corp. All rights reserved.
This presentation contains confidential information and may not be disclosed
without E*TRADE FINANCIAL Corporation’s written permission.
11
DARTs
Improve market position in retail brokerage
Accelerate growth of the customer franchise
Average cost:
2010: 12bps
2011: 11bps
1H 2012: 12bps
2010: 151k
2011: 157k
1H 2012: 148k
Average yield:
2010: 442bps
2011: 413bps
1H 2012: 396bps
Retirement assets
177
148
165
140
157
139
0
50
100
150
200
Q1 11
Q2 11
Q3 11
Q4 11
Q1 12
Q2 12
$5.7
$5.7
$5.2
$4.8
$5.3
$5.8
$0
$2
$4
$6
$8
Q1 11
Q2 11
Q3 11
Q4 11
Q1 12
Q2 12
Customer margin
receivables
$26
$26
$26
$28
$31
$29
$0
$10
$30
$40
Q1 11
Q2 11
Q3 11
Q4 11
Q1 12
Q2 12
Brokerage-related
cash
$31
$31
$28
$30
$33
$33
$0
$10
$30
$40
Q1 11
Q2 11
Q3 11
Q4 11
Q1 12
Q2 12
$20
$20 |
 ©
2012 E*TRADE FINANCIAL Corp. All rights reserved.
This presentation contains confidential information and may not be disclosed
without E*TRADE FINANCIAL Corporation’s written permission.
12
Enhance position in retirement & investing
Retooled marketing focused on retirement & investing to evolve the brand
NEW
Public Site
NEW
TV Commercials
NEW
Print & Online
Grew Financial Consultant headcount by over 40% since year-end 2010
We estimate
we
have
a
12%
share
of
our
customers’
investible
assets
(36%
for
active
traders;
10%
for
investors)
(7)
Have identified segments best served by proactive engagement with Financial Consultants
—
One year post assignment seeing significant improvement in engagement and retention
Financial Consultant network highlights |
 ©
2012 E*TRADE FINANCIAL Corp. All rights reserved.
This presentation contains confidential information and may not be disclosed
without E*TRADE FINANCIAL Corporation’s written permission.
13
Chartered Retirement
Kiplinger’s 2011 “Best Of”
Retirement Calculator
Retirement education
8,100+ mutual funds
4,600 no-load/6,900 no
transaction fee
90+ commission-free
50,000+ bonds
Unified Managed Accounts
Managed Investment
Portfolios
Financial Consultants
Services
Products
†
Integrated into advertising
Headcount of 270
Increased asset penetration
1year post assignment
Complementary retirement
and portfolio consultations
Enhance position in retirement & investing
†
Unified Managed Accounts and Managed Investment Portfolios are offered by E*TRADE Capital
Management 794k retirement accounts
28% of brokerage accounts
$954 million in managed
investment accounts
(2.5 years post inception)
$32.7 billion in retirement
assets
20% of $164 billion of brokerage-
related assets
Accounts &
assets
Integrated retirement & investing offering to drive accounts & assets
SM
Every ETF sold
Planning
Counselors |
 ©
2012 E*TRADE FINANCIAL Corp. All rights reserved.
This presentation contains confidential information and may not be disclosed
without E*TRADE FINANCIAL Corporation’s written permission.
14
Market making business
Leveraging world class technologies and superior execution
capabilities
Leading market share in ADRs; growing market share in
National Market Securities
Growing base of external customers, comprising 40+ external
clients
(32% y/y growth), and accounting for approximately
half of market making revenue
Corporate Services Group
Build on market leadership with 1,400+ corporate clients,
representing +20% of S&P 500
Foster strategically important channel for new brokerage
accounts, accounting for 25-30% of gross new accounts
1.1 million accounts; $21B in vested and $44B in unvested
options
Proceeds retention of 35%+ 3 months post exercise,
and 15%+ 12 months post exercise
Capitalize on value of complementary brokerage businesses |
 ©
2012 E*TRADE FINANCIAL Corp. All rights reserved.
This presentation contains confidential information and may not be disclosed
without E*TRADE FINANCIAL Corporation’s written permission.
15
Favorable mix shift in assets (lower risk) and liabilities (lower-cost)
Continue to manage and de-risk the Bank
Improvement in asset composition…
…Funding mix also continues to improve
•
Legacy loan portfolio now accounts for less than 30% of
total interest earning assets, down from over 60% at the
peak in 1Q 2008
•
Loan portfolio balances are down 62% from peak in 3Q
2007
•
Risk weighted assets are down 39% from peak in 3Q 2007,
while absolute assets are down 24%
•
More expensive wholesale funding channel now accounts
for only 18% of interest-bearing liabilities, down from 38%
at its peak in 3Q 2007
•
Absolute size of wholesale funding is down 65% from its
peak in 3Q 2007
•
Balance sheet strategy going forward is liability-driven, by
brokerage cash
0
10
20
30
40
50
60
1Q
2007
4Q
2007
3Q
2008
2Q
2009
1Q
2010
4Q
2010
3Q
2011
2Q
2012
Brokerage
-related deposits and other
Wholesale funding
0
10
20
30
40
50
60
1Q
2007
4Q
2007
3Q
2008
2Q
2009
1Q
2010
4Q
2010
3Q
2011
2Q
2012
Agency securities, cash, and other
Legacy loans |
 ©
2012 E*TRADE FINANCIAL Corp. All rights reserved.
This presentation contains confidential information and may not be disclosed
without E*TRADE FINANCIAL Corporation’s written permission.
16
Continue to manage and de-risk the Bank
Mitigate credit losses on legacy loan portfolio
($ B)
Loan balance
9/30/07
(8)
Paydowns
(9)
Charge-offs
Loan balance
6/30/12
(8)
Average age
1-4 Family loans
$17
($10)
($1)
$6
6.2 yrs
Home equity
$12
($4)
($3)
$5
6.4 yrs
Consumer
$3
($2)
($0)
$1
8.6 yrs
TOTAL
$32
($16)
($4)
$12
Delinquencies
Loans 30-89 days past due
Provision for loan losses |
 ©
2012 E*TRADE FINANCIAL Corp. All rights reserved.
This presentation contains confidential information and may not be disclosed
without E*TRADE FINANCIAL Corporation’s written permission.
17
Continue to manage and de-risk the Bank
Mitigate credit losses on legacy loan portfolio
•
Increased the qualitative reserve in Q4
2011 in anticipation of losses related to a
review of modification policies and
practices pursuant to regulatory transition
•
Review was completed in Q1 2012: Certain
modified loans were charged-off against
previously established SVA and the
qualitative reserve.
0.0
0.3
0.6
0.9
1.2
1Q 10
2Q 10
3Q 10
4Q 10
1Q 11
2Q 11
3Q 11
4Q 11
1Q 12
2Q 12
Components of allowance for loan losses
Coverage of non-modified loans
Coverage of modified loans
©
2012 E*TRADE FINANCIAL Corp. All rights reserved.
This presentation contains confidential information and may not be disclosed
without E*TRADE FINANCIAL Corporation’s written permission.
17
General reserve
= Expected losses over next 12 months for non-modified loans
Qualitative
reserve
=
Accounts
for
factors
not
directly
considered
in
our
quantitative
model
Specific
Valuation Allowance
= Expected losses over remaining life of modified loans
|
 ©
2012 E*TRADE FINANCIAL Corp. All rights reserved.
This presentation contains confidential information and may not be disclosed
without E*TRADE FINANCIAL Corporation’s written permission.
18
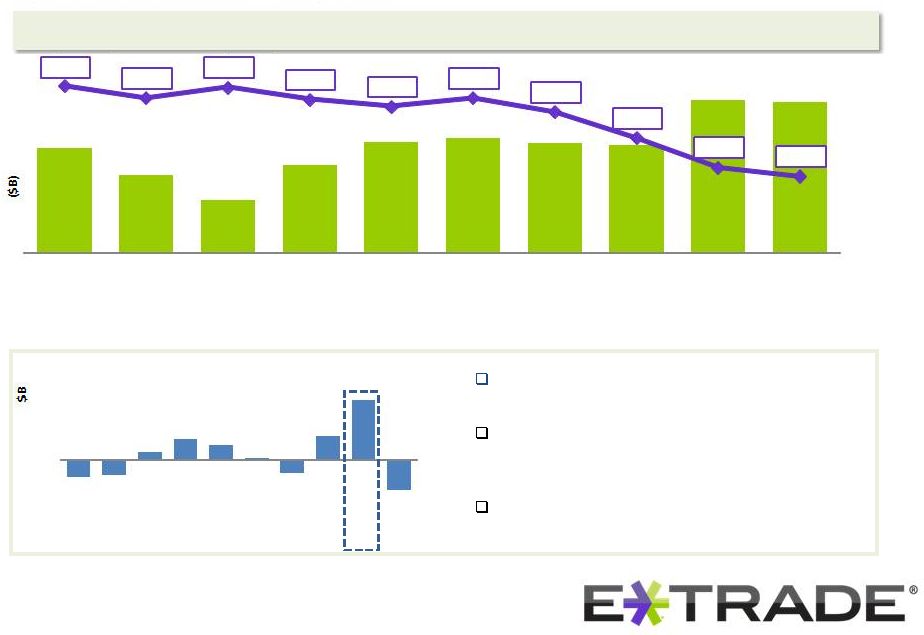
Continue to manage and de-risk the Bank
Optimize value of customer deposits
Growth in balance sheet during Q1 2012 was the largest
since 3Q 2007
Marginal spread on a balance sheet that is increasing in
size is lower given the Company’s philosophy to
maintain a moderate level of interest rate risk
Expectation for net interest spread to average slightly
above 240bps in 2012
2.00%
2.20%
2.40%
2.60%
2.80%
3.00%
37
$42.4
$41.0
$39.7
$41.5
$42.7
$42.9
$42.7
$42.6
$44.9
$44.8
2.96%
2.89%
2.95%
2.88%
2.84%
2.89%
2.81%
2.66%
2.49%
2.44%
1Q 10
2Q 10
3Q 10
4Q 10
1Q 11
2Q 11
3Q 11
4Q 11
1Q 12
2Q 12
Average interest earning assets & net interest spread
($2)
$0
$2
$4
1Q
2010
2Q
2010
3Q
2010
4Q
2010
1Q
2011
2Q
2011
3Q
2011
4Q
2011
1Q
2012
2Q
2012
Growth in deposits
Customer deposits driving balance sheet size |
 ©
2012 E*TRADE FINANCIAL Corp. All rights reserved.
This presentation contains confidential information and may not be disclosed without
E*TRADE FINANCIAL Corporation’s written permission.
19
Continue to manage and de-risk the Bank
Visibility into future drivers of net interest spread
1-4 family mortgages
Home equity lines of credit
•
Loan portfolio continues to run off at approximately 20%
per year
•
Nearly 70% of 1-4 family loans resetting in the remainder of
2012 are expected to reset to a lower payment
•
Majority of home equity lines do not begin to amortize until
after 2015, and balances continue to decline
•
Hedges on wholesale funding channels require us to
continue issuing short-term debt for next several years
Average cost 3-
4%
Wholesale funding obligations will expire over
the next ten years |
 ©
2012 E*TRADE FINANCIAL Corp. All rights reserved.
This presentation contains confidential information and may not be disclosed
without E*TRADE FINANCIAL Corporation’s written permission.
20
•
Prolonged low interest rate environment
•
Home prices
•
Weak consumer / investor confidence
•
Heightened regulatory sensitivity
Environmental
Challenges
•
Mitigate credit losses on legacy loan portfolio
•
Improve capital structure
•
Complete regulatory transition to OCC & Fed
•
Build out enterprise risk management function
E*TRADE
Challenges
•
Accelerate growth of customer franchise
•
Expand brand as a trusted retirement and investing
provider
•
Cost reduction / efficiency gains
E*TRADE
Opportunities
Challenges and opportunities |
 |
 ©
2012 E*TRADE FINANCIAL Corp. All rights reserved.
This presentation contains confidential information and may not be disclosed
without E*TRADE FINANCIAL Corporation’s written permission.
22
Appendix
FY 2009
Net loss
(1,297,762)
$
Add back: non-cash charge on Debt Exchange
772,908
Adjusted net loss
(524,854)
$
The fund's prospectus contains its investment objectives, risks, charges, expenses and other
important information and should be read and considered carefully before investing. For a current
prospectus, visit www.etrade.com
Explanation of Non-GAAP Measures and Certain Metrics
Management believes that Bank earnings before taxes and before credit losses and E*TRADE Financial ratios are appropriate measures for evaluating the operating and liquidity performance of the
Company. Management believes that adjusting GAAP measures by excluding or including certain
items from the related GAAP measures is helpful to investors and analysts who may wish to use
some or all of this information to analyze our current performance, prospects and valuation.
Management uses non-GAAP information internally to evaluate our operating performance in
formulating our budget for future periods.
(1) Excludes impact of the debt exchange. In the third quarter of 2009, the Company exchanged
$1.7 billion aggregate principal amount of interest-bearing corporate debt for an equal principal
amount of newly-issued non-interest-bearing convertible debentures. This Debt
Exchange resulted in a non-cash charge of $723 million. The following table provides a reconciliation of GAAP net
loss to non-GAAP net loss for FY2009:
(2) The parent total capital to risk-weighted assets, Tier 1 capital to risk-weighted
assets and Tier 1 leverage capital ratios are based on the Federal Reserve regulatory minimum well-capitalized
threshold, although the parent is not currently subject to capital requirements. See the
Company’s Form 10-Q filed August 3, 2012 for a reconciliation of those non-GAAP measures to the
comparable GAAP measures.
(3) The parent Tier 1 common ratio is Tier 1 capital less elements of Tier 1 capital that are
not in the form of common equity, such as trust preferred securities, divided by total risk-weighted assets for
the holding company. The holding company is not yet held to the capital requirements; as such,
the 7.0% well-capitalized threshold is not based on regulatory guidance. See the Company’s Form
10-Q filed August 3, 2012 for a reconciliation of the non-GAAP measure of Tier 1
common ratio to the comparable GAAP measure.
(a) Attriting brokerage accounts: Gross new brokerage accounts, less net new brokerage
accounts.
(5) The net new brokerage assets metrics treat asset flows between E*TRADE entities in the
same manner as unrelated third party accounts.
(6) Average brokerage assets per account is calculated as the sum of security holdings and
brokerage related cash divided by end of period brokerage accounts.
(7) Based on data as of 6/30/12.
(8) Represents unpaid principal balances.
(9) Net paydowns includes paydowns on loans as well as limited origination activity, home
equity advances, repurchase activity, limited sale and securitization activities and transfers to real estate
owned assets.
(10) The total expected losses on TDRs includes both the previously recorded charge-offs
and the specific valuation allowance.
(11) Excludes $0 balance home equity lines of credit.
annualized basis (where it appears quarterly).
(4) The attrition rate is calculated by dividing attriting
brokerage accounts, by total brokerage accounts, for the previous period end. This measure is presented annually and on an
(a) |