Attached files
| file | filename |
|---|---|
| 8-K - FORM 8-K - Gas Natural Inc. | d348818d8k.htm |
Exhibit 99.1
Exhibit 99.1
AGA Financial Forum
May 7, 2012
Kevin J. Degenstein
President & COO
Thomas J. Smith
Vice President • CFO & Director
Safe Harbor Statement
These slides contain (and the accompanying oral discussion will contain) “forward-looking statements” within the meaning of the Private Securities Litigation Reform Act of 1995. Such statements involve known and unknown risks, uncertainties and other factors that could cause the actual results of the Company to differ materially from the results expressed or implied by such statements, including but not limited to the Company’s continued ability to make dividend payments, the company’s ability to implement its business plan, the company’s ability to consummate its pending acquisitions and to successfully integrate the operations of the acquired companies; fluctuating energy commodity prices, the possibility that regulators may not permit the company to pass through all of its increased costs to its customers, changes in the utility regulatory environment, wholesale and retail competition, weather conditions, litigation risks, risks associated with contracts accounted for as derivatives, and other factors disclosed in the Company’s periodic reports filed with the Securities and Exchange Commission. Consequently such forward looking statements should be regarded as the Company’s current plans, estimates and beliefs. The Company does not undertake and specifically declines any obligation to publicly release the results of any revisions to these forward-looking statements that may be made to reflect any future events or circumstances after the date of such statements or to reflect the occurrence of anticipated or unanticipated events.
| 2 |
|
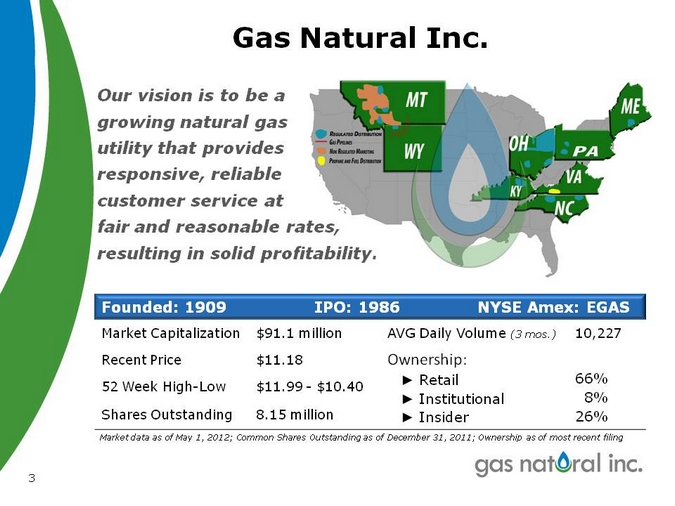
Gas Natural Inc.
Our vision is to be a growing natural gas utility that provides responsive, reliable customer service at fair and reasonable rates, resulting in solid profitability.
Founded: 1909 IPO: 1986 NYSE Amex: EGAS
Market Capitalization $91.1 million AVG Daily Volume (3 mos.) 10,227
Recent Price $11.18 Ownership:
Retail 66%
52 Week High-Low $11.99—$10.40
Institutional 8% Shares Outstanding 8.15 million Insider 26%
Market data as of May 1, 2012; Common Shares Outstanding as of December 31, 2011; Ownership as of most recent filing
| 3 |
|
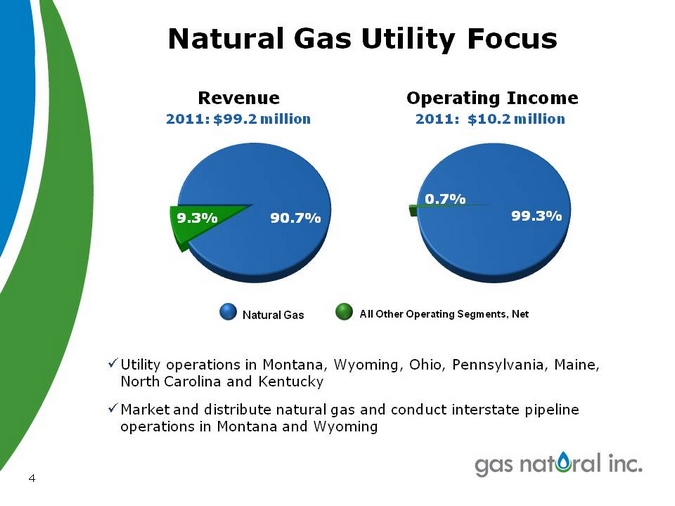
Natural Gas Utility Focus
Revenue Operating Income
2011: $99.2 million 2011: $10.2 million
0.7%
9.3% 90.7% 99.3%
Natural Gas All Other Operating Segments, Net
9Utility operations in Montana, Wyoming, Ohio, Pennsylvania, Maine, North Carolina and Kentucky
9Market and distribute natural gas and conduct interstate pipeline operations in Montana and Wyoming
| 4 |
|
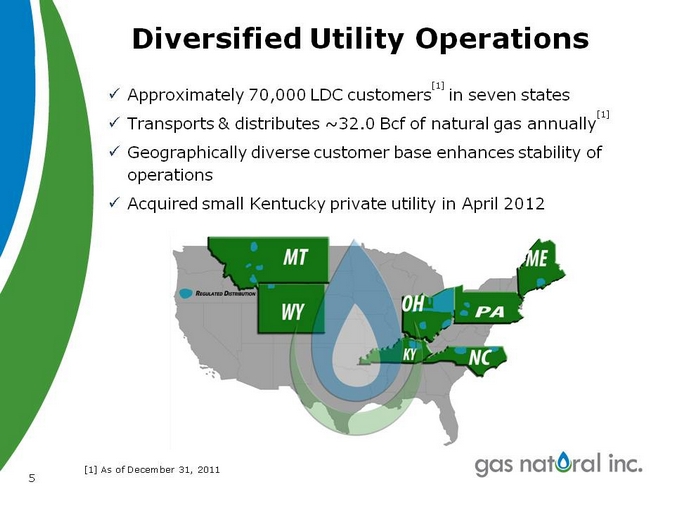
Diversified Utility Operations
Approximately 70,000 LDC customers[1] in seven states
Transports & distributes ~32.0 Bcf of natural gas annually[1]
Geographically diverse customer base enhances stability of operations
Acquired small Kentucky private utility in April 2012
[1] As of December 31, 2011
5
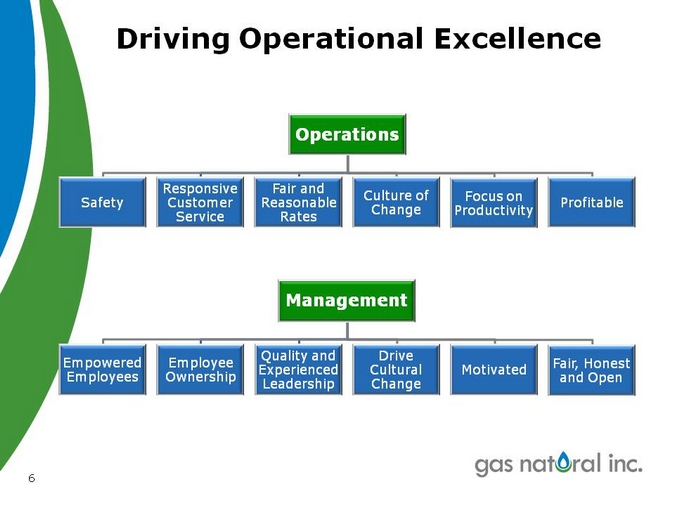
Driving Operational Excellence
Operations
Responsive Fair and
Culture of Focus on
Safety Customer Reasonable Profitable Change Productivity Service Rates
Management
Quality and Drive
Empowered Employee Fair, Honest Experienced Cultural Motivated Employees Ownership and Open Leadership Change
| 6 |
|
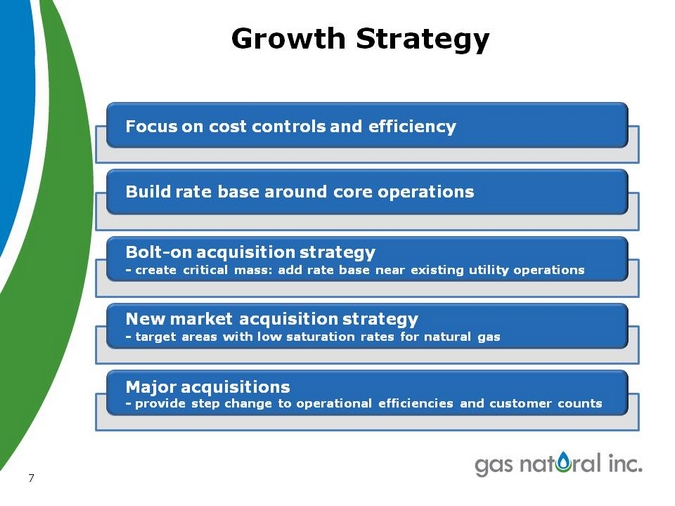
Growth Strategy
Focus on cost controls and efficiency
Build rate base around core operations
Bolt-on acquisition strategy
create critical mass: add rate base near existing utility operations
New market acquisition strategy
target areas with low saturation rates for natural gas
Major acquisitions
provide step change to operational efficiencies and customer counts
| 7 |
|
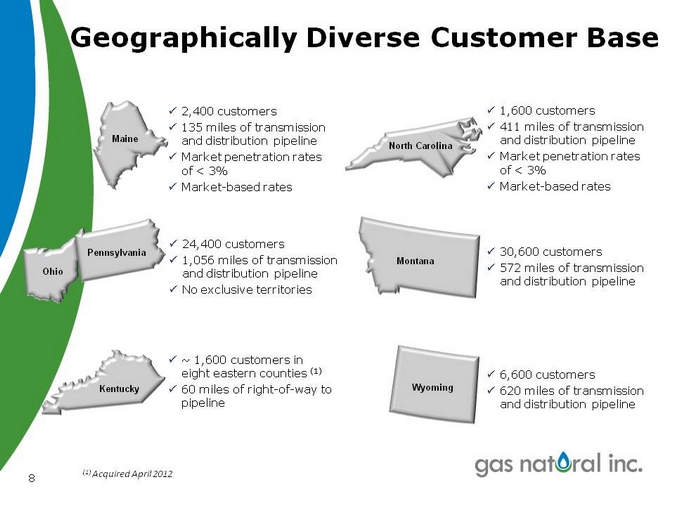
Geographically Diverse Customer Base
Maine
| (1) |
|
Acquired April 2012 |
| 8 |
|
2,400 customers
135 miles of transmission and distribution pipeline
Market penetration rates of < 3% Market-based rates
Pennsylvania
24,400 customers
1,056 miles of transmission and distribution pipeline
No exclusive territories
North Carolina
1,600 customers
411 miles of transmission and distribution pipeline Market penetration rates of < 3% Market-based rates
Montana
30,600 customers 572 miles of transmission and distribution pipeline
[Graphic Appears Here]
~ 1,600 customers in eight eastern counties (1)
60 miles of right-of-way to pipeline
Wyoming
6,600 customers
620 miles of transmission and distribution pipeline
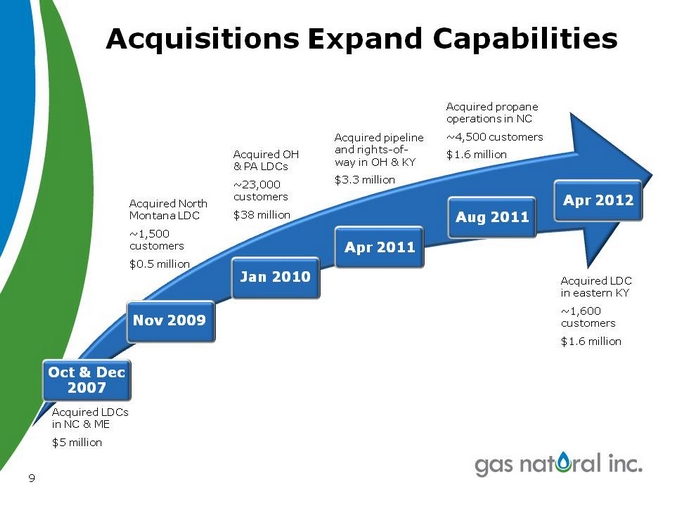
Acquisitions Expand Capabilities
Acquired propane operations in NC
Acquired pipeline ~4,500 customers Acquired OH and rights-of- $1.6 million
& PA LDCs way in OH & KY
~23,000 $3.3 million customers Apr 2012 Acquired North
Montana LDC $38 million Aug 2011
~1,500 customers Apr 2011
$0.5 million Jan 2010
Acquired LDC in eastern KY ~1,600 Nov 2009 customers
$1.6 million
9
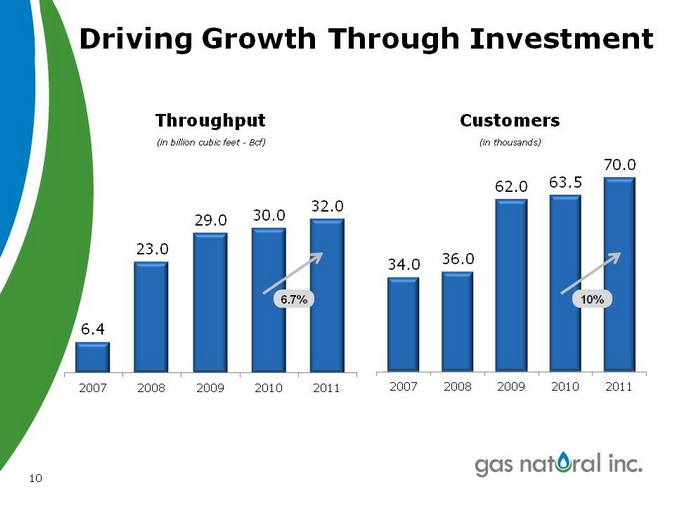
Driving Growth Through Investment
Throughput Customers
(in billion cubic feet—Bcf) (in thousands)
70.0
62.0 63.5
32.0
29.0 30.0
23.0
34.0 36.0
6.7% 10%
6.4
2007 2008 2009 2010 2011 2007 2008 2009 2010 2011
10
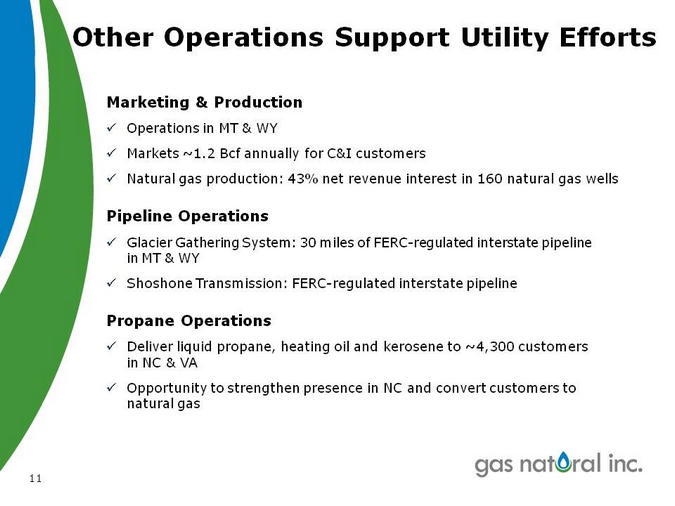
Other Operations Support Utility Efforts
Marketing & Production
operations in MT & WY
markets ~1.2 Bcf annually for C&I customers
Natural gas production: 43% net revenue interest in 160 natural gas wells
Pipeline Operations
Glacier Gathering System: 30 miles of FERC-regulated interstate pipeline in MT & WY
Shoshone transmission: FERC-regulated interstate pipeline
Propane Operations
deliver liquid propane, heating oil and kerosene to ~4,300 customers in NC & VA
opportunity to strengthen presence in NC and convert customers to natural gas
11
Financial Highlights
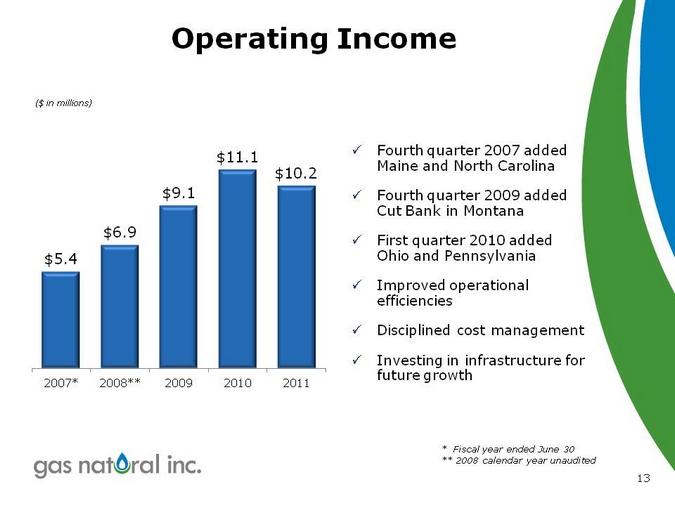
Operating Income
Fiscal year ended June 30
2008 calendar year unaudited
13
($ in millions)
$5.4
$6.9
$9.1
$11.1
$10.2
2007* 2008** 2009 2010 2011
Fourth quarter 2007 added Maine and North Carolina
Fourth quarter 2009 added Cut Bank in Montana
First quarter 2010 added Ohio and Pennsylvania
Improved operational efficiencies Disciplined cost management
Investing in infrastructure for future growth
* Fiscal year ended June 30
** 2008 calendar year unaudited
13
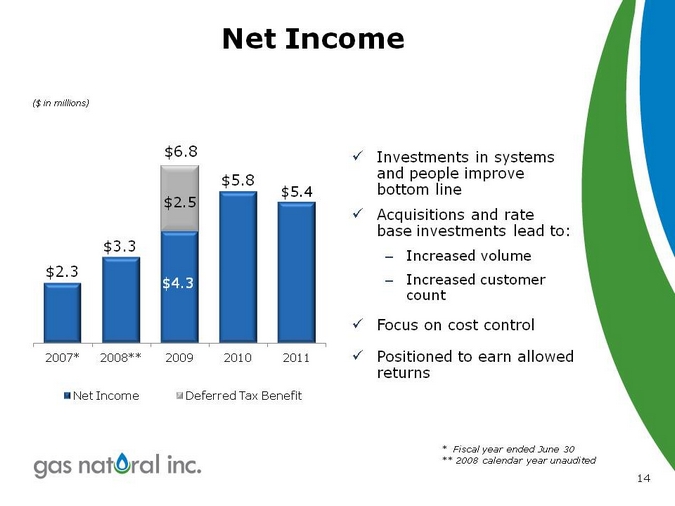
Net Income
($ in millions)
$6.8
$5.8
$2.5 $5.4
$3.3
$2.3
$4.3
2007* 2008** 2009 2010 2011
Net Income Deferred Tax Benefit
Investments in systems
and people improve
bottom line
Acquisitions and rate
base investments lead to:
–
Increased volume
–
Increased customer count
Focus on cost control
Positioned to earn allowed
returns
Fiscal year ended June 30
2008 calendar year unaudited
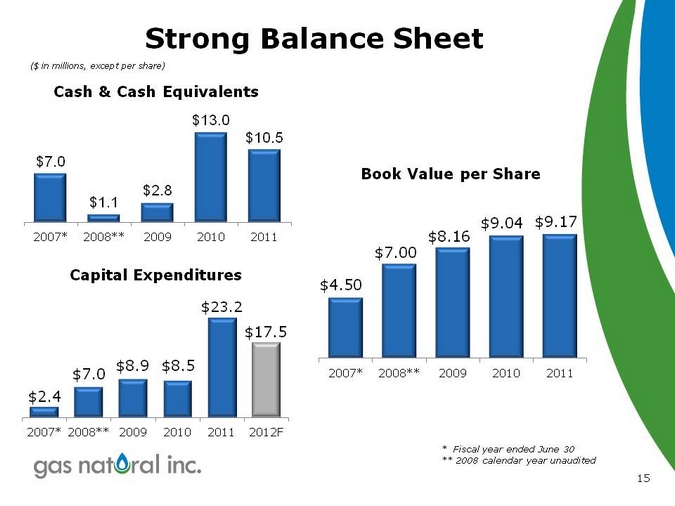
Strong Balance Sheet
($ in millions, except per share)
Cash & Cash Equivalents
Fiscal year ended June 30
2008 calendar year unaudited
15
$7.0
$1.1
$2.8
$13.0
$10.5
2007* 2008** 2009 2010 2011
Book Value per Share
$4.50
$7.00
$8.16
$9.04
$9.17
2007* 2008** 2009 2010 2011
Capital Expenditures
$2.4
$7.0
$8.9
$8.5
$23.2
$17.5
2007* 2008** 2009 2010 2011 2012F
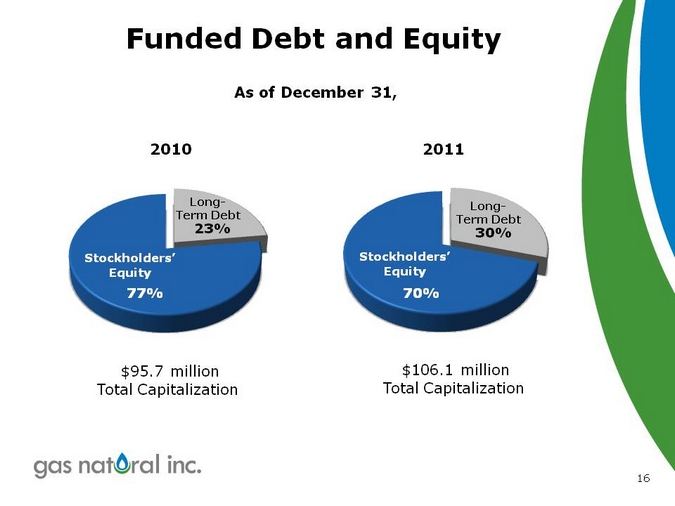
funded debt and equity
as of December 31,
2010
2011
long-term debt 23%
stockholders’ equity 77%
long-term debt 30%
stockholders’ equity 70%
$95.7 million total capitalization
$106.1 million
total capitalization
16
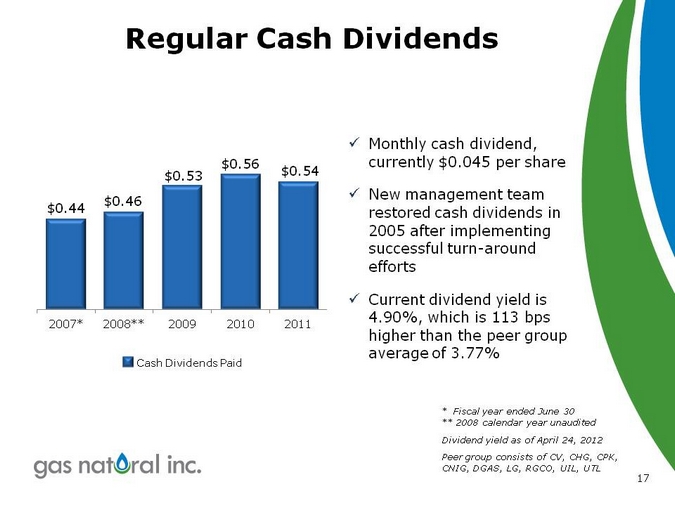
Regular Cash Dividends
$0.56
$0.53 $0.54
$0.46
$0.44
2007* 2008** 2009 2010 2011
Fiscal year ended June 30
2008 calendar year unaudited
Dividend yield as of April 24, 2012
Peer group consists of CV, CHG, CPK, CNIG, DGAS, LG, RGCO, UIL, UTL
17
Monthly cash dividend, currently $0.045 per share New management team restored cash dividends in 2005 after implementing successful turn-around efforts Current dividend yield is 4.90%, which is 113 bps higher than the peer group average of 3.77%
Cash Dividends Paid
Company Highlights
Growth-Oriented Utilities Focused Acquisition Strategy Geographically Diverse Customer Base Experienced Leadership Team
18

AGA Financial Forum
May 7, 2012
Kevin J. Degenstein
President & COO
Thomas J. Smith
Vice President • CFO & Director