Attached files
| file | filename |
|---|---|
| 8-K - FORM 8-K - BROADRIDGE FINANCIAL SOLUTIONS, INC. | d348203d8k.htm |
| EX-99.1 - PRESS RELEASE DATED MAY 8, 2012 - BROADRIDGE FINANCIAL SOLUTIONS, INC. | d348203dex991.htm |
 ©
2012 Broadridge Financial Solutions, Inc.
Broadridge and the Broadridge logo are registered trademarks of Broadridge
Financial Solutions, Inc. May 8, 2012
Earnings Webcast & Conference Call
Third Quarter Fiscal Year 2012
Exhibit 99.2 |
 1
Forward-Looking Statements This presentation
and other written or oral statements made from time to time by representatives of Broadridge may contain “forward-looking
statements” within the meaning of the Private Securities Litigation Reform Act of 1995.
Statements that are not historical in nature, and which may be identified by the use of words
like “expects,” “assumes,” “projects,” “anticipates,” “estimates,” “we believe,” “could be” and other words of similar
meaning, are forward-looking statements. In particular, information appearing in the
“Fiscal Year 2012 Financial Guidance” section and statements about our future
financial performance are forward-looking statements. These statements are based on management’s expectations
and assumptions and are subject to risks and uncertainties that may cause actual results to differ
materially from those expressed. These risks and uncertainties include those risk factors
discussed in Part I, “Item 1A. Risk Factors” of our Annual Report on Form 10-K for the fiscal year
ended June 30, 2011 (the “2011 Annual Report”), as they may be updated in any future reports
filed with the Securities and Exchange Commission. All forward-looking statements
speak only as of the date of this presentation and are expressly qualified in their entirety by reference
to the factors discussed in the 2011 Annual Report. These risks include: the success of
Broadridge in retaining and selling additional services to its existing clients and in
obtaining new clients; Broadridge’s reliance on a relatively small number of clients, the continued financial health of those
clients, and the continued use by such clients of Broadridge’s sevices with favorable pricing
terms; changes in laws and regulations affecting the investor communication services provided
by Broadridge; declines in participation and activity in the securities markets; overall market and
economic conditions and their impact on the securities markets; any material breach of Broadridge
security affecting its clients’ customer information; the failure of Broadridge’s
outsourced data center services provider to provide the anticipated levels of service; any significant
slowdown or failure of Broadridge’s systems or error in the performance of Broadridge’s
services; Broadridge’s failure to keep pace with changes in technology and demands of its
clients; Broadridge’s ability to attract and retain key personnel; the impact of new acquisitions and divestitures;
and competitive conditions. Broadridge disclaims any obligation to update or revise
forward-looking statements that may be made to reflect events or circumstances that arise
after the date made or to reflect the occurrence of unanticipated events, other than as required by law.
Non-GAAP Financial Measures In certain
circumstances, results have been presented that are not generally accepted accounting principles measures (“Non-GAAP”) and should
be viewed in addition to, and not as a substitute for, the Company’s reported results. Net
earnings, diluted earnings per share and pre-tax earnings margins excluding the Penson
Impairment charges and the IBM Migration costs, and free cash flow are Non-GAAP measures. These
measures are adjusted to exclude costs to be incurred in connection with the Penson Impairment charges
and the IBM Migration costs as Broadridge believes this information helps investors understand
the effect of the Penson Impairment charges and the IBM Migration costs on reported results and
provides a better representation of our actual performance. Free cash flow is a Non-GAAP measure and is defined as cash
flow from operating activities, less capital expenditures and purchases of intangibles.
Management believes such Non-GAAP measures provide investors with a more complete
understanding of Broadridge’s underlying operational results. These Non-GAAP measures are indicators that
management uses to provide additional meaningful comparisons between current results and prior
reported results, and as a basis for planning and forecasting for future periods.
Accompanying this release is a reconciliation of Non-GAAP measures to the comparable GAAP measures.
Pre-Spin Financial Information
Financial information presented for periods prior to the March 30, 2007 spin-off of Broadridge
from Automatic Data Processing, Inc. (“ADP”) represents the operations of the
brokerage services business which were operated as part of ADP. Broadridge’s financial results for periods
before the spin-off from ADP may not be indicative of our future performance and do not
necessarily reflect what our results would have been had Broadridge operated as a separate,
stand-alone entity during the periods presented, including changes in our operations and capitalization as a
result of the spin-off from ADP. Use of
Material Contained Herein The information contained in this presentation is being provided for your convenience and information
only. This information is accurate as of the date of its initial presentation. If
you plan to use this information for any purpose, verification of its continued accuracy is your responsibility.
Broadridge assumes no duty to update or revise the information contained in this presentation.
You may reproduce information contained in this presentation provided you do not alter, edit,
or delete any of the content and provided you identify the source of the information as Broadridge
Financial Solutions, Inc., which owns the copyright.
Broadridge and the Broadridge logo are registered trademarks of Broadridge Financial Solutions, Inc. |
 2
Today’s Agenda
Opening Remarks and Other
Rich Daly, CEO
Key Topics
Third Quarter and YTD FY 2012
Dan Sheldon, CFO
Highlights and Segment Results
Summary
Rich Daly, CEO
Q&A
Rich Daly, CEO
Dan Sheldon, CFO
Closing Remarks
Rich Daly, CEO |
 3
Opening Remarks
Key Topics:
Financial Highlights
Closed Sales Performance |
 4
Financial Highlights
Solid revenue growth
Revenues were up 4% for the quarter
•
Recurring revenues were up 9%
–
Approximately 50% organic and 50% from acquisitions
•
Event-driven revenues down slightly for the quarter
Year-to-date revenues were up 8%
•
Recurring revenues were up 13%
Non-GAAP diluted earnings per share (EPS) were up
Third quarter Non-GAAP diluted EPS of $0.28 were up 12%
•
Primarily due to increased revenues and cost containment
Year-to-date Non-GAAP diluted EPS of $0.55 were up 25%
Penson
Conversion completed in January 2012, processing completely on Broadridge
platform Impairment charge on Penson note receivable
Restructuring efforts continue
Full year guidance
Reaffirming Non-GAAP diluted EPS of $1.50 to $1.60
Revenue growth range now 7% to 8% |
 5
Closed Sales Performance
Year-to-date recurring revenue closed sales were $79M vs
$72M in the prior year
ICS recurring revenue closed sales year-to-date were $44M
SPS recurring revenue closed sales year-to-date were
$35M
Pipeline remains strong across existing and new products
Reaffirming our full year recurring revenue closed sales
guidance of $110M to $150M |
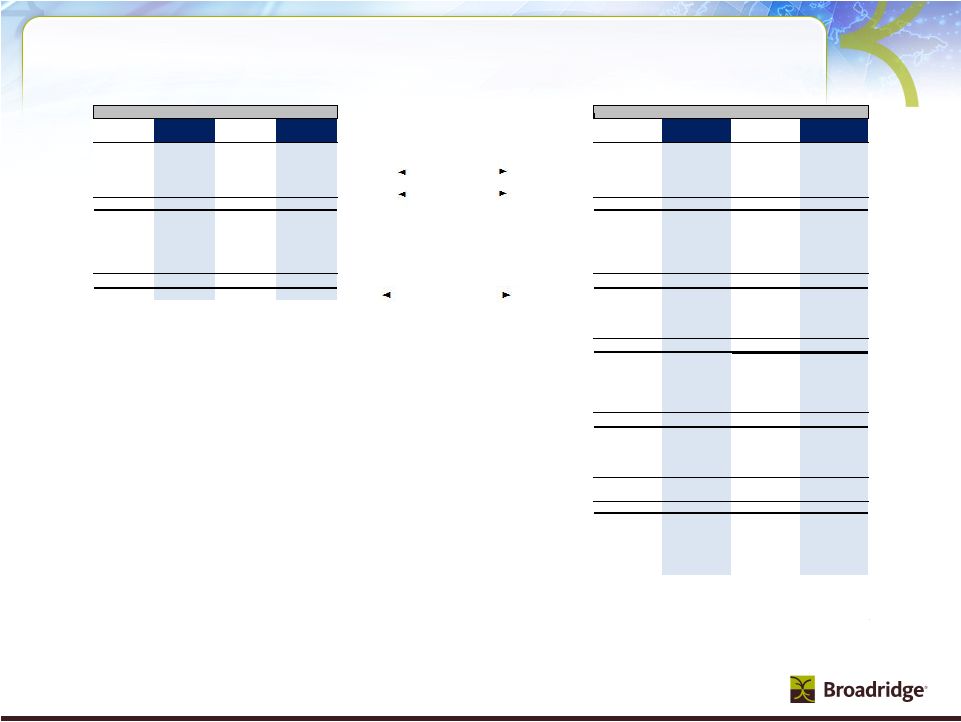
 6
Revenue Growth Drivers, EBIT and Free Cash Flow
Free cash flow excluding IBM Migration costs of ~$73M and Penson’s conversion
costs of ~$20M are expected to increase FY12 range from $136-188M to
~$230-280M (Recurring)
Closed Sales
EBIT Margin
(Non-GAAP)
Historical CAGR
Actual
3Q
3Q YTD
Forecast
(FY05-FY10)
FY11
FY12
FY12
FY12
6%
(2)%
Total Revenue Growth
4%
8%
7-8%
4%
3%
3%
3%
4%
(2)%
(1)%
Client Losses
(1)%
(1)%
(1)%
2%
2%
Net New Business
2%
2%
3%
3%
1%
Internal Growth
(a)
1%
2%
1%
0%
4%
Acquisitions
3%
4%
3%
5%
7%
Total Recurring
6%
8%
7%
1%
(6)%
Event-Driven
(b)
(1)%
(1)%
0%
0%
(4)%
Distribution
(c)
(1)%
1%
0-1%
0%
1%
FX/Other
0%
0%
0%
13.1%
11.1%
8.0%
13.6-14.1%
(a) Internal Growth includes SPS Equity & Fixed Income Trades, ICS Equity &
Mutual Fund Stock Record Growth, Transaction Reporting and Time & Materials
(b) Event-Driven includes ICS Proxy Contest/Specials, Mutual Fund Proxy and
Marketing Communications Fulfillment (c) Distribution includes
pass-through fees from Matrix |
 7
Penson –
Impairment Analysis
Note
Receivable
-
full
principal
amount
of
~$21M
charge
in
Q3 –
Balance $0M (cancellation due to Penson restructuring)
Long-Term
Investments
(Penson
Stock)
-
~$11M
charge
YTD –
Balance ~$2M (Other-than-temporary impairment/mark-to-
market)
Deferred
Client
Conversion
and
Start-up
Costs
-
Balance
~$47M
(anticipate recoverability at this time based upon projected future
cash flows) |
 Segment Results
& Forecast – Investor Communication Solutions
Recurring business activities continue to provide momentum and drive
the quarter, YTD, and the expected full year results
Net new business (closed sales less client losses), acquisitions, and internal
growth on track to contribute 12% recurring fee growth and 6 points to
total revenue on a full year basis
Client revenue retention levels at 99% which we
expect to maintain YTD internal growth factors trending in line with
full year expectations (equity position growth +1%, interim position growth
+9%) Event-driven fee revenue outlook slightly behind prior
guidance Change in revenue guidance primarily driven by distribution
mix Higher recurring fee revenue and cost containment initiatives expected to
lead to 90 to 150 bps margin improvement
Revenue/Growth
EBIT/Growth
Margin/Growth
YTD:
Q3:
FY12:
$374M / 1%
$1,004M / 7%
$1,648 to 1,655M / 6%
$37M / 23%
$56M / 43%
$241 to 251M / 13 to 18%
9.9% / 170 bps
5.6% / 150 bps
14.6 to 15.0% / 90 to 150 bps
(Non-GAAP)
(Non-GAAP)
8 |
 Segment Results
& Forecast – Securities Processing Solutions
Q3 and YTD revenues up ~10%, split 50/50 between new business and a
combination of acquisitions and the Penson outsourcing agreement
which is
expected to continue for the rest of the year
Closed sales in Q3 of $6M. YTD closed sales are $35M with a full year
forecast of $45- 65M. Upper end of range dependent on closing
larger deals Client revenue retention rate of 99%
Non-trade growth driven by acquisitions
Lower trade volumes
Margins negatively impacted for quarter and YTD by reduction of trade volumes
and integration of Paladyne acquisition
Revenue/Growth
EBIT/Growth
Margin/Growth
YTD:
Q3:
FY12:
$169M / +10%
$489M / +11%
$654 to 660M / +10 to +11%
$25M / (8)%
$73M / +8%
$91 to 97M / +5 to +11%
14.6% / (300) bps
14.9% / (30) bps
13.9 to 14.7% / (80) to +0 bps
(Non-GAAP)
(Non-GAAP)
9 |
 Summary
Solid operating results for the quarter and year-to-date
Recurring fee revenue and closed sales results continue to be strong
Event-driven revenues have not returned to historical normal levels
Non-GAAP earnings were up for the quarter and year-to-date
Strong
closed
sales
pipeline,
strong
brand
and
expanding
product
breadth
Anticipate IBM data center migration will be substantially completed by fiscal
year-end
Acquisitions have been successfully integrated
Earnings Guidance
7% to 8% revenue growth
$1.50 to $1.60 Non-GAAP diluted EPS
Expect to provide EPS guidance of $1.80 in FY13 contingent on:
99% client revenue retention
Continuing strong closed sales
Return of event-driven revenues to historical normal levels should generate an
incremental $0.20 EPS in FY13
10 |
 Q&A
There are no slides during this portion of the presentation
11 |
 Closing Comments
There are no slides during this portion of the presentation
12 |
 Appendix
13 |
 Segment Results
& Forecast – Other & Foreign Exchange (FX)
Corporate
Expenses:
Q3
results
as
expected
Penson Impairment
charges:
Non-cash YTD charges consist of common stock ($11M)
and note receivable ($21M)
Interest,
net:
FY12
reflects
higher
average
debt
balance
and
refinancing
of
our
credit
facilities
YTD
3Q12
3Q12
Low
High
Corporate Expenses
$(5)M
$(18)M
$(28)M
$(32)M
IBM Migration costs
$(6)M
$(13)M
$(33)M
$(33)M
Penson Impairment charges
$(22)M
$(32)M
$(32)M
$(32)M
Interest Expense, net
$(3)M
$(10)M
$(14)M
$(14)M
FX -
P&L -
Revenue
$3M
$10M
$9M
$15M
-
EBIT
$4M
$9M
$10M
$12M
-
Transaction Activity
$(1)M
$(1)M
$(1)M
$(1)M
FY12 Range
14 |
 Broadridge 3Q
and YTD from Continuing Operations Revenue
Earnings
FY11
FY12
FY11
FY12
FY11
FY12
FY11
FY12
Q3
Q3
YTD Q3
YTD Q3
($ in millions)
Q3
Q3
YTD Q3
YTD Q3
$369
$374
$942
$1,004
ICS
$30
$37
$39
$56
3%
1%
-11%
7%
Growth % / Margin %
8.2%
9.9%
4.1%
5.6%
$154
$169
$442
$489
SPS
$27
$25
$67
$73
15%
10%
11%
11%
Growth % / Margin %
17.6%
14.6%
15.2%
14.9%
$523
$543
$1,384
$1,493
Total Segments
$57
$62
$106
$129
7%
4%
-5%
8%
Margin %
10.9%
11.4%
7.7%
8.6%
$0
$0
$0
$0
Other
(a)
($7)
($4)
($17)
($17)
$4
$3
$7
$10
FX
(b)
$3
$3
$6
$8
$527
$547
$1,391
$1,503
Total Broadridge (Non-GAAP)
(a)
$53
$60
$95
$120
7%
4%
-5%
8%
Growth % / Margin %
10.1%
11.1%
6.8%
8.0%
Interest & Other
(c)
($2)
($3)
($6)
($10)
Total EBT (Non-GAAP)
(a),(c)
$51
$57
$89
$110
Margin %
9.7%
10.4%
6.4%
7.3%
Income taxes
(a),(c)
($18)
($21)
($32)
($40)
Tax Rate
36.2%
37.2%
36.2%
36.6%
Total Net Earnings (Non-GAAP)
(a),(c)
$33
$36
$57
$70
Margin %
6.2%
6.6%
4.1%
4.7%
IBM Migration costs
$0
($4)
$0
($8)
Penson Impairment charges
(d)
$0
($14)
$0
($20)
Non-GAAP Items (Net of Taxes)
$0
($18)
$0
($28)
Total Net Earnings (GAAP)
$33
$18
$57
$42
Margin %
6.2%
3.3%
4.1%
2.8%
(a)
Diluted Shares
128
128
129
127
Diluted EPS (Non-GAAP)
(a),(c)
$0.25
$0.28
$0.44
$0.55
Diluted EPS (GAAP)
$0.25
$0.14
$0.44
$0.33
(b) Includes impacts of FX P&L and FX Transaction Activity.
(d) Represents
impairment
charges
on
the
Penson
common
stock
and
Penson
note
receivable.
(a) FY12
Q3
excludes
the
IBM
Migration
costs
of
$6M
(after
tax
$4M,
or
$0.03
EPS
impact).
FY12
YTD
Q3
excludes
the
IBM
Migration
costs
of
$13M
(after
tax
$8M,
or
$0.06
EPS
impact).
(c) FY12 Q3 excludes Penson Impairment charges of $23M (after tax $14M, or $0.11
EPS impact). FY12 YTD Q3 excludes Penson Impairment charges of $32M (after tax $21M, or $0.16 EPS impact).
* Guidance does not take into consideration the effect of any future acquisitions,
additional debt and/or share repurchases in excess of the repurchases needed to achieve our 128 million diluted weighted-
average outstanding shares guidance.
15 |
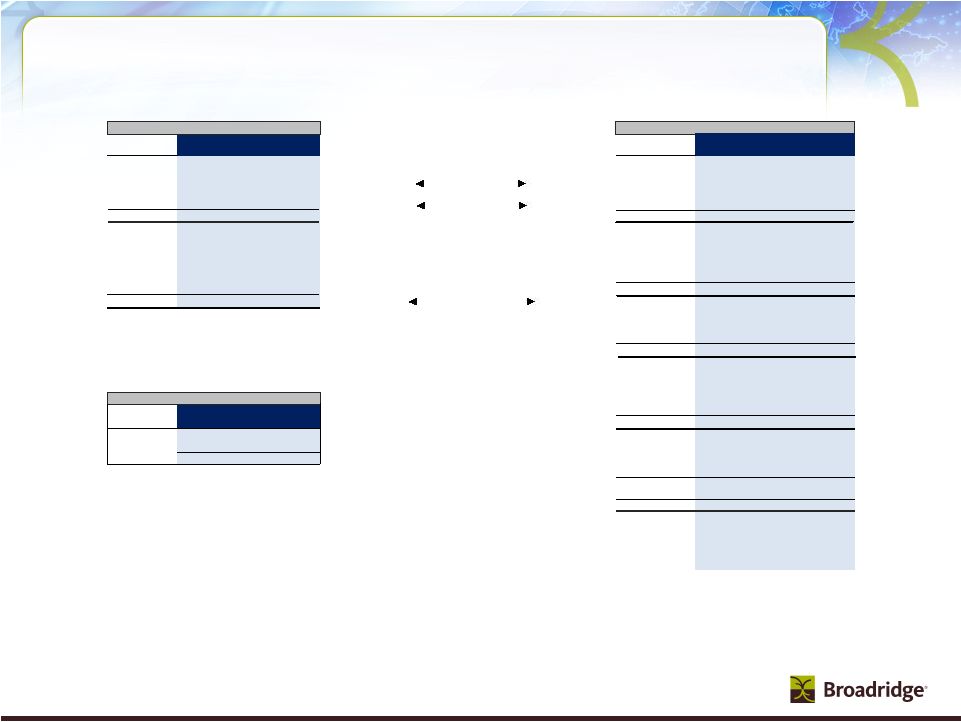 Broadridge FY12
Guidance from Continuing Operations Revenue
FY11
FY12 Range
Actual
Low
High
$1,559
$1,648
$1,655
-7%
6%
6%
$594
$654
$660
11%
10%
11%
$2,153
$2,302
$2,315
-2%
7%
8%
$0
$0
$0
$14
$9
$15
$2,167
$2,311
$2,330
-2%
7%
8%
Recurring Closed Sales
FY12 Range
Segments
Low
High
ICS
$65
$85
SPS
$45
$65
Total
$110
$150
FY11
FY12 Range
Actual
Low
High
$213
$241
$251
13.7%
14.6%
15.2%
$87
$91
$97
14.7%
13.9%
14.7%
$301
$332
$348
14.0%
14.4%
15.0%
($25)
($28)
($32)
$9
$9
$11
$285
$314
$328
13.1%
13.6%
14.1%
($8)
($14)
($14)
$276
$300
$314
12.7%
13.0%
13.5%
($100)
($108)
($110)
36.3%
36.0%
35.0%
$176
$192
$204
8.1%
8.3%
8.8%
($4)
($21)
($21)
-
($21)
($21)
($4)
($42)
($42)
$172
$150
$162
7.9%
6.5%
7.0%
128
128
128
$1.37
$1.50
$1.60
$1.34
$1.18
$1.28
Earnings
($ in millions)
ICS
SPS
Total Segments
Margin %
Margin %
Tax Rate
Margin %
IBM Migration costs
Non-GAAP Items (Net of Taxes)
Total Net Earnings (GAAP)
Margin %
Diluted Shares
Diluted EPS (GAAP)
(a)
(b)
(a)
(c)
(a),(c)
(a),(c)
(a),(c)
(d)
(a),(c)
Other
FX
Interest & Other
Income taxes
Penson Impairment charges
Diluted EPS (Non-GAAP)
Total EBT (Non-GAAP)
Total Net Earnings (Non-GAAP)
(b) Includes impacts of FX P&L and FX Transaction Activity.
(d) Represents
impairment
charges
on
the
Penson
common
stock
and
Penson
note
receivable.
(a) FY11 excludes the IBM Migration costs of $6M, after-tax $4M, or $0.03 EPS
impact. FY12 excludes the IBM Migration costs of $13M (after tax $8M, or
$0.06 EPS impact).
(c) FY12 excludes Penson Impairment charges of $32M (after tax $21M, or $0.16 EPS
impact). * Guidance does not take into consideration the effect of any future
acquisitions, additional debt and/or share repurchases in excess of the repurchases
needed to achieve our 128 million diluted weighted-average outstanding shares
guidance. Growth % / Margin %
Growth % / Margin %
Growth % / Margin %
Total Broadridge (Non-GAAP)
16 |
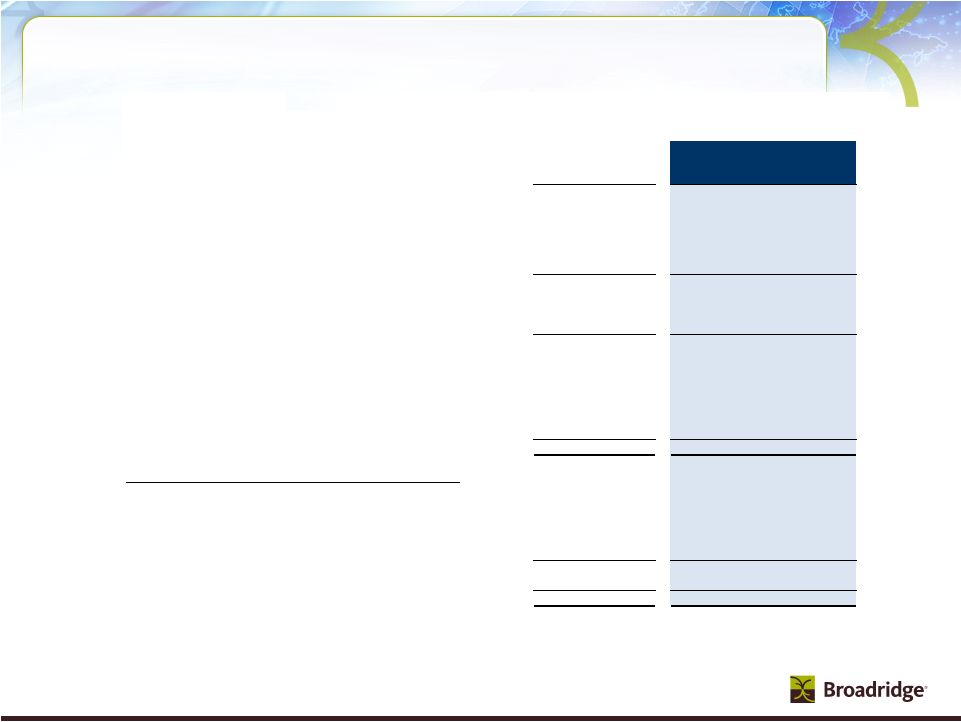 Cash Flow
– YTD FY12 Results and FY12 Forecast
(a)
Guidance
does
not
take
into
consideration
the
effect
of
any
future
acquisitions,
additional
debt
and/or
share
repurchases
in
excess
of
the
repurchases
needed
to
achieve
our
128
million
diluted
weighted-
average shares outstanding guidance.
(b)
Includes IBM Migration costs of $(21)M and ~$(33)M for YTD Q3FY12 actual and FY12
guidance, respectively. (c)
FY12 range presented in this table includes the impact of ~$(73)M due to IBM
Migration costs. When the IBM Migration costs are excluded from the FY12 range, free cash flow would be ~$210M to ~$260M,
with the mid-point of ~$235M.
Nine Months Ended
March 2012
Low
High
Free Cash Flow
(Non-GAAP)
:
Net earnings from continuing operations (GAAP)
42
$
150
$
162
$
Depreciation and amortization (includes other LT assets)
68
95
100
Stock-based compensation expense
22
31
31
Other
11
17
27
Subtotal
143
293
320
Working capital changes
27
(15)
(15)
Long-term assets and liabilities changes
(b)
(59)
(55)
(45)
Net cash flow provided by continuing operating activities
111
223
260
Cash Flows From Investing Activities
IBM / ITO data center investment
(7)
(15)
(10)
(7)
(7)
(7)
Capital expenditures and software purchases
(25)
(65)
(55)
Free cash flow (Non-GAAP)
(c)
72
$
136
$
188
$
Cash
Flows
From
Other
Investing
and
Financing
Activities
Acquisitions
(72)
(73)
(73)
Stock repurchases net of options proceeds
1
1
1
Proceeds from borrowing net of debt repayments
40
-
-
Dividends paid
(58)
(78)
(78)
Other
(5)
(5)
5
Net change in cash and cash equivalents
(23)
(19)
43
Cash and cash equivalents, at the beginning of year
242
242
242
Cash and cash equivalents, at the end of period
219
$
223
$
285
$
(In millions)
Unaudited
Free Cash Flow (Non-GAAP)
FY12 Range
(a)
17 |
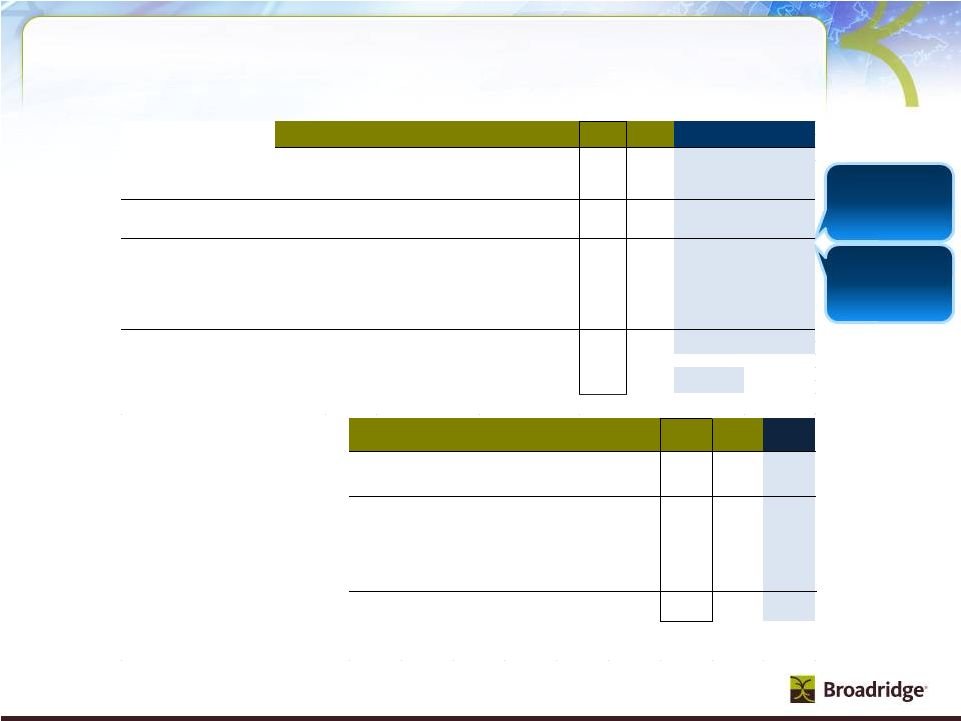
  Closed Sales to
Revenue Contribution Recurring Closed Sales to Revenue
($ in millions)
Closed Sales
Revenue Contribution
(a)
Forecast
Forecast
Backlog
(b)
FY12
FY12
ICS
$65-85
~$45-65
~$40-50
~Contribution to revenue growth
~4%
SPS
$45-65
~$30-35
~$80-100
~Contribution to revenue growth
~5%
Total Recurring Closed Sales
$110-150
~$75-100
~$120-150
~Contribution to revenue growth
~4%
(a)
Revenue from current year and prior year Closed Sales.
(b)
Closed Sales that will convert to revenue in future years.
18 |
 Revenues and
Closed Sales FY05-FY12 ($ in millions)
FY05-10
Forecast
Event-Driven Fee Revenues
(a)
FY05
FY06
FY07
FY08
FY09
FY10
CAGR
FY11
FY12
Mutual
Fund
Proxy
51
$
61
$
79
$
92
$
55
$
150
$
24%
39
$
27
$
Mutual
Fund
Supplemental
39
$
43
$
51
$
49
$
58
$
48
$
4%
44
$
45
$
Contest/
Specials/
Other
Communications
38
$
49
$
73
$
59
$
67
$
59
$
9%
52
$
52
$
Total Event-Driven Fee Revenues
128
$
153
$
203
$
200
$
180
$
257
$
15%
135
$
124
$
Growth
20%
33%
-1%
-10%
43%
-47%
Recurring Distribution Revenues
(b)
496
$
562
$
593
$
580
$
567
$
564
$
3%
573
$
~$615
Growth
13%
6%
-2%
-2%
-1%
2%
ED Distribution Revenues
(b)
153
$
169
$
228
$
228
$
190
$
217
$
7%
131
$
~$110
Growth
10%
35%
0%
-17%
14%
-39%
Total Distribution Revenues
649
$
730
$
821
$
808
$
757
$
781
$
4%
704
$
~$725
Growth
12%
12%
-2%
-6%
3%
-10%
(a) Includes reclassification of Pre-sale Fulfillment from event-driven revenues to
recurring revenues. (b) Includes reclassification of Pre-sale Fulfillment
related distribution revenues and Matrix pass-through administrative services from event-driven revenues to recurring revenues.
($ in millions)
FY05-10
Forecast
FY11-12
Recurring Fee Revenues
FY05
FY06
FY07
FY08
FY09
FY10
CAGR
FY11
FY12
Growth Rates
ICS
444
$
513
$
519
$
558
$
583
$
610
$
7%
650
$
$702-705
8%
Growth
16%
1%
8%
4%
5%
7%
SPS
459
$
458
$
509
$
515
$
537
$
513
$
2%
522
$
$545-552
4-6%
Growth
0%
11%
1%
4%
-4%
2%
Segment Recurring Fee Revenues
903
$
971
$
1,028
$
1,073
$
1,120
$
1,123
$
4%
1,172
$
$1,247-1,257
6-7%
Growth
7%
6%
4%
4%
0%
4%
Acquisitions
0
$
18
$
28
$
28
$
33
$
45
$
NM*
141
$
~$210
~50%
Total Recurring Fee Revenues
903
$
988
$
1,056
$
1,101
$
1,153
$
1,168
$
5%
1,313
$
$1,455-1,465
11-12%
9%
7%
4%
5%
1%
12%
Event-Driven
128
$
153
$
203
$
200
$
180
$
257
$
15%
135
$
$124
(8)%
Growth
20%
33%
-1%
-10%
43%
-47%
Distribution
649
$
730
$
821
$
808
$
757
$
781
$
4%
704
$
~$725
~3%
Growth
12%
12%
-2%
-6%
3%
-10%
Other/FX
(25)
$
(19)
$
(12)
$
22
$
(17)
$
4
$
NM*
14
$
~$12
NM*
Total BR Revenues
1,656
$
1,853
$
2,068
$
2,131
$
2,072
$
2,209
$
6%
2,167
$
$2,311-2,330
7-8%
Growth
12%
12%
3%
-3%
7%
-2%
Recurring Closed Sales
77
$
92
$
63
$
82
$
95
$
119
$
9%
113
$
$110-150
Growth
19%
-32%
30%
16%
25%
-5%
*NM= Not Meaningful
(cumulative)
Acquisitions
~5%
Growth Contribution
Organic
~6%
Growth Contribution
19 |
 Reconciliation
of Non-GAAP to GAAP Measures (a)
Guidance
does
not
take
into
consideration
the
effect
of
any
future
acquisitions,
additional
debt
and/or
share
repurchases
in
excess
of
the
repurchases
needed
to
achieve
our
128
million
diluted
weighted-
average
shares
outstanding
guidance.
(b)
Includes
IBM
Migration
costs
of
$(21)M
and
~$(33)M
for
YTD
Q3FY12
actual
and
FY12
guidance,
respectively.
(c)
FY12
range
presented
in
this
table
includes
the
impact
of
~$(73)M
due
to
IBM
Migration
costs.
When
the
IBM
Migration
costs
are
excluded
from
the
FY12
range,
free
cash
flow
would
be
~$210M
to
~$260M,
with
the
mid-point
of
~$235M.
Nine Months Ended
March 2012
Low
High
Free Cash Flow
(Non-GAAP)
:
Net earnings from continuing operations (GAAP)
42
$
150
$
162
$
Depreciation and amortization (includes other LT assets)
68
95
100
Stock-based compensation expense
22
31
31
Other
11
17
27
Subtotal
143
293
320
Working capital changes
27
(15)
(15)
Long-term assets and liabilities changes
(b)
(59)
(55)
(45)
Net cash flow provided by continuing operating activities
111
223
260
Cash Flows From Investing Activities
IBM / ITO data center investment
(7)
(15)
(10)
Penson
(7)
(7)
(7)
Capital expenditures and software purchases
(25)
(65)
(55)
Free cash flow (Non-GAAP)
(c)
72
$
136
$
188
$
(In millions)
Unaudited
Free Cash Flow (Non-GAAP)
FY12 Range
(a)
EBIT Reconciliation
3Q11
3Q12
YTD11
YTD12
FY11
FY12 Range
($ in millions)
Actual
Actual
Actual
Actual
Actual
Low
High
EBIT from continuing operations (Non-GAAP / excluding IBM Migration costs)
$53
$60
$94
$120
$285
$314
$328
Margin %
10.1%
11.1%
6.8%
8.0%
13.1%
13.6%
14.1%
Interest & Other
($2)
($3)
($6)
($10)
($8)
($14)
($14)
Total EBT from continuing operations (Non-GAAP / excluding IBM Migration costs
and Penson Impairment charges) $51
$57
$88
$110
$276
$300
$314
Margin %
9.7%
10.4%
6.4%
7.3%
12.7%
13.0%
13.5%
IBM Migration costs
$0
($6)
$0
($13)
($6)
($33)
($33)
Penson Impairment charges
$0
($22)
$0
($32)
$0
($32)
($32)
Total EBT (GAAP)
$51
$29
$88
$66
$270
$235
$249
Margin %
9.7%
5.3%
6.4%
4.4%
12.5%
10.2%
10.7%
EPS Reconciliation
Diluted EPS from continuing operations (Non-GAAP)
$0.25
$0.28
$0.44
$0.55
$1.37
$1.50
$1.60
IBM Migration costs
0.00
(0.03)
0.00
(0.06)
(0.03)
(0.16)
(0.16)
Penson Impairment charges
0.00
(0.11)
0.00
(0.16)
0.00
(0.16)
(0.16)
Diluted EPS from continuing operations (GAAP)
$0.25
$0.14
$0.44
$0.33
$1.34
$1.18
$1.28
20 |
 One-time
Items
(For
Informational
Purposes
Only)
One-Time Restructuring and Acquisition Related Costs (a)
3Q11
3Q12
YTD11
YTD12
FY11
FY12 Range
Actual
Actual
Actual
Actual
Actual
Low
High
Deal Costs (b)
($2)
$0
($3)
($2)
($2)
($2)
($2)
Amortization of Intangibles
($5)
($7)
($9)
($18)
($15)
($24)
($24)
Integration Costs
($1)
-
($1)
-
($2)
($3)
($3)
Total One-Time Acquisition Related Costs
($8)
($7)
($13)
($20)
($19)
($29)
($29)
Diluted EPS impact
($0.04)
($0.03)
($0.07)
($0.10)
($0.09)
($0.14)
($0.14)
(a) Although not excluded from our GAAP financial information, management believes these items could be
excluded from the GAAP financials when assessing the overall business performance. (b) Deal Costs
include only costs related to closed transactions. 21
|
 ICS Key Segment
Revenue Stats RC= Recurring
ED= Event-Driven
In millions
Fee Revenues
3Q11
3Q12
YTD FY11
YTD FY12
Type
Proxy
Equities
31.1
$
31.7
$
81.2
$
80.1
$
RC
Stock Record Position Growth
0%
4%
-1%
1%
Pieces
25.6
24.5
69.6
66.1
Mutual Funds
12.8
$
5.5
$
30.1
$
19.3
$
ED
Pieces
16.9
6.6
41.0
29.6
Contests/Specials
2.1
$
3.0
$
10.3
$
9.7
$
ED
Pieces
2.1
3.0
10.9
10.7
Total Proxy
46.0
$
40.2
$
121.6
$
109.1
$
Total Pieces
44.6
34.2
121.5
106.5
Notice and Access Opt-in %
61%
69%
57%
66%
Suppression %
52%
58%
50%
56%
Interims
Mutual Funds (Annual/Semi-Annual Reports/Annual Prospectuses)
30.0
$
33.5
$
76.5
$
84.7
$
RC
Position Growth
8%
7%
9%
9%
Pieces
146.4
168.8
386.1
438.1
Mutual Funds (Supplemental Prospectuses) & Other
14.3
$
15.9
$
34.1
$
34.9
$
ED
Pieces
86.4
86.8
198.1
191.2
Total Interims
44.3
$
49.4
$
110.6
$
119.6
$
Total Pieces
232.8
255.7
584.2
629.3
Transaction
Transaction Reporting/Customer Communications
45.4
$
47.7
$
118.0
$
123.9
$
RC
Reporting
Fulfillment
Fulfillment (a)
28.5
$
31.6
$
85.4
$
94.7
$
RC
Other
Other - Recurring (b)
22.1
$
25.8
$
37.5
$
76.8
$
RC
Communications
Other - Event-Driven (c)
11.3
$
12.1
$
25.6
$
27.7
$
ED
Total Other
33.4
$
37.9
$
63.3
$
104.5
$
Total Fee Revenues
197.6
$
206.8
$
#
499.0
$
551.6
$
Total Distribution Revenues (d)
171.3
$
167.2
$
443.5
$
452.2
$
Total Revenues as reported - GAAP
368.9
$
374.0
$
942.5
$
1,003.8
$
Q3 FY12 Ranges
Low
High
Total RC Fees
157.1
$
170.3
$
398.9
$
460.1
$
801
$
805
$
Total ED Fees
40.5
$
36.5
$
100.1
$
91.5
$
124
$
124
$
Q3 FY12 Ranges
Low
High
Sales
2%
2%
2%
3%
4%
4%
Losses
0%
-1%
0%
-1%
-1%
-1%
Key
Net New Business
2%
1%
2%
2%
3%
3%
Revenue
Internal growth
1%
2%
0%
2%
1%
1%
Drivers
Recurring (Excluding Acquisitions)
3%
3%
2%
4%
4%
4%
Acquisitions
4%
0%
4%
3%
2%
2%
Total Recurring
7%
3%
6%
7%
6%
6%
Event-Driven
-3%
-1%
-9%
-1%
-1%
-1%
Distribution
-1%
-1%
-8%
1%
1%
1%
TOTAL
3%
1%
-11%
7%
6%
6%
(a) Consolidated Pre-sale and Post-sale Fulfillment and reclassified Pre-sale from
event-driven to recurring revenues. (b) Other Recurring Fee Revenue includes Matrix,
NewRiver, StockTrans, Access Data, Forefield and Tax Reporting. (c) Other event-driven
includes 2.4M pieces for 3Q11, 2.0M for 3Q12, 6.9M for FY11 YTD and 5.8M for FY12 YTD, primarily related to corporate actions.
(d) Total Distribution revenues primarily include pass-through revenues related to the physical
mailing of Proxy and Interims, as well as Matrix administrative services. Note: Certain prior
period amounts have been reclassified to conform with current period presentation.
22 |
  SPS and
Outsourcing Key Segment Revenue Stats RC= Recurring
ED= Event-Driven
In millions
3Q11
3Q12
YTD FY11
YTD FY12
Type
Equity
Transaction-Based
Equity Trades (a)
40.7
$
36.4
$
109.3
$
108.1
$
RC
Internal Trade Volume
1,120
996
964
975
Internal Trade Growth
14%
-11%
0%
1%
Trade Volume (Average Trades per Day in '000)
1,142
1,005
986
982
Non-Transaction
Other Equity Services
77.0
$
86.3
$
227.5
$
248.7
$
RC
Total Equity
117.7
$
122.8
$
336.8
$
356.8
$
Fixed Income
Transaction-Based
Fixed Income Trades (a)
12.3
$
13.6
$
35.4
$
40.1
$
RC
Internal Trade Volume
267
276
256
270
Internal Trade Growth
20%
3%
20%
6%
Trade Volume (Average Trades per Day in '000
270
299
257
294
Non-Transaction
Other Fixed Income Services
9.3
$
10.8
$
28.1
$
33.5
$
RC
Total Fixed Income
21.6
$
24.4
$
63.5
$
73.7
$
Outsourcing
Outsourcing
14.6
$
22.1
$
41.3
$
58.4
$
RC
# of Clients
11
13
11
13
Total Net Revenue as reported - GAAP
153.9
$
169.3
$
441.7
$
488.8
$
FY12 Ranges
Low
High
Sales
3%
5%
4%
5%
5%
5%
Losses
-2%
-1%
-4%
-1%
-1%
-1%
Key
Net New Business
1%
4%
0%
4%
4%
4%
Revenue
Transaction & Non-transaction
6%
0%
4%
2%
1%
2%
Drivers
Concessions
-1%
-2%
-2%
-1%
-1%
-1%
Internal growth
5%
-2%
2%
1%
0%
1%
Acquisitions
9%
8%
9%
6%
6%
6%
TOTAL
15%
10%
11%
11%
10%
11%
(a) Equities and Fixed Income trade volumes have been adjusted to exclude additional trades processed
under fixed-price contracts and semi-variable step contracts. The revenue related
to these contracts was re-classified from 'Transaction-Based'.
23 |
 Refers
primarily
to
information
required
to
be
provided
by
mutual
funds
to
supplement
information
previously
provided
in
an
annual
mutual
fund
prospectus
(e.g.,
change
in
portfolio
managers,
closing
funds
or
class
of
shares
to
investors,
or
restating
or
clarifying
items
in
the
original
prospectus).
The
events
could
occur
at
any
time
throughout
the
year.
Refers to the proxy services we provide in connection with stockholder meetings
held outside of the normal annual meeting cycle and are primarily driven by special events (e.g., mergers
and
acquisitions
in
which
the
company
being
acquired
is
a
public
company and needs to solicit the approval of its stockholders).
Refers
to
communications
provided
by
corporate
issuers
and
investment
companies
to
investors
including
newsletters,
notices, tax information, marketing materials and other information not
required to be distributed by regulation.
Mutual
Funds
(Supplemental
Prospectuses)
–
Refers to the services we provide investment companies in connection with
information they are required by regulation to distribute periodically to
their investors. These reports contain pertinent information such as holdings, fund performance, and other required disclosure.
Refers primarily to the printing and distribution of account statements, trade
confirmations and tax reporting documents to account holders, including electronic delivery and
archival services.
Refers
primarily
to
the
distribution
of
prospectuses,
offering
documents,
and
required
regulatory disclosure information to investors in connection with purchases of
securities.
Refers to the distribution of marketing literature, welcome kits, enrollment kits,
and investor information to prospective investors, existing stockholders and other targeted recipients
on behalf of broker-dealers, mutual fund companies and 401(k)
administrators. Refers to the services we provide in connection with the
distribution of communications material not included in the above definitions such as non-objecting beneficial owner (NOBO) lists, and
corporate actions such as mergers, acquisitions, and tender offer
transactions. Refers
to
the
proxy
services
we
provide
when
a
separate
agenda
is
put
forth
by
one
or
more
stockholders
that
is
in opposition to the proposals presented by management of
the company which is separately distributed and tabulated from the company’s
proxy materials. Refers to the proxy services we provide for funds, classes
or trusts of an investment company. Open-ended mutual funds are not required to have annual
meetings. As a result, mutual fund proxy services provided to open-ended mutual
funds are driven by a "triggering event." These triggering events can be a change in
directors, fee structures, investment restrictions, or mergers of funds.
Refers to the proxy services we provide in connection with annual stockholder
meetings for publicly traded corporate issuers. Annual meetings of public companies include
shares held in "street name" (meaning that they are held of record by
brokers or banks, which in turn hold the shares on behalf of their clients, the ultimate beneficial owners) and shares
held in "registered name" (shares registered directly in the names of their
owners). Equities
–
Mutual
Funds
–
Contests
–
Specials –
Mutual
Funds
(Annual/Semi-Annual
Reports/Annual
Prospectuses)
–
Transaction Reporting
–
Post-Sale
Fulfillment
–
Pre-Sale
Fulfillment
–
Other
–
Other –
Proxy
Interims
Transaction Reporting
Fulfillment
Other
Communications
24
Broadridge ICS Definitions |