Attached files
| file | filename |
|---|---|
| 8-K - 8-K - Carbon Energy Corp | a11-31855_38k.htm |
Exhibit 99.1
|
|
March 2012 |
|
|
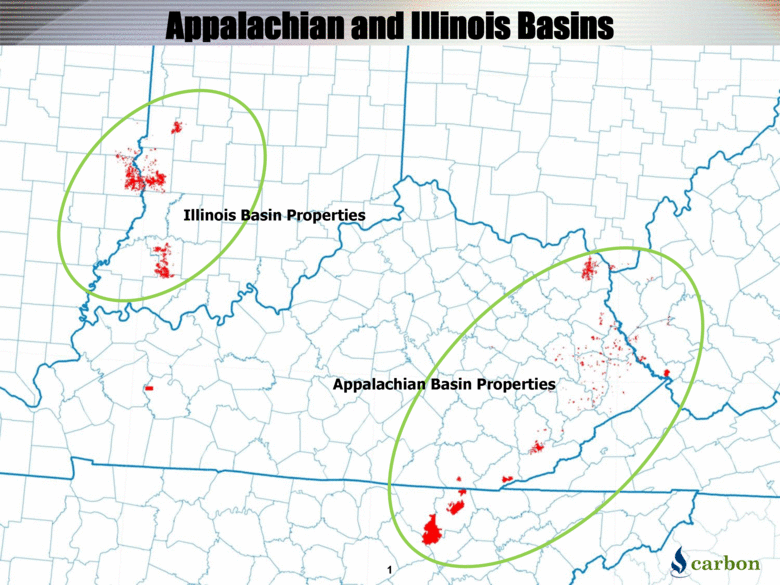
Appalachian and Illinois Basins Illinois Basin Properties Appalachian Basin Properties 1 |
|
|
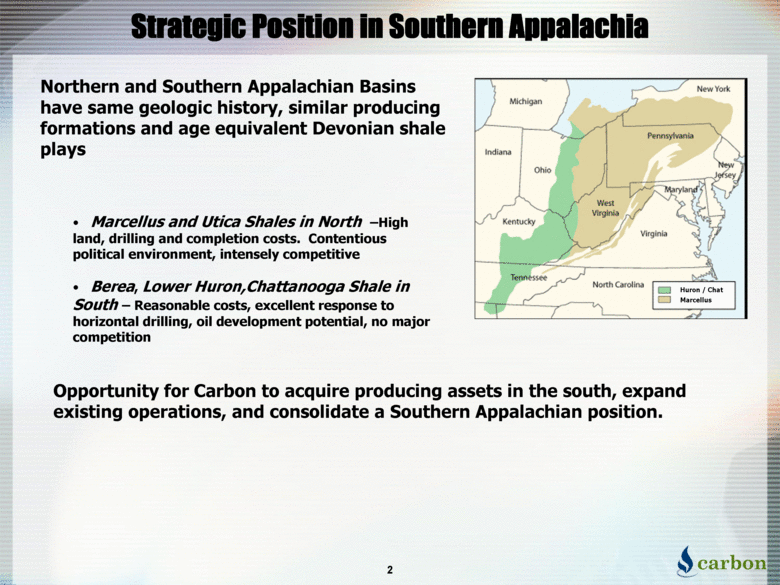
Opportunity for Carbon to acquire producing assets in the south, expand existing operations, and consolidate a Southern Appalachian position. Northern and Southern Appalachian Basins have same geologic history, similar producing formations and age equivalent Devonian shale plays Marcellus and Utica Shales in North –High land, drilling and completion costs. Contentious political environment, intensely competitive Berea, Lower Huron,Chattanooga Shale in South – Reasonable costs, excellent response to horizontal drilling, oil development potential, no major competition Huron / Chat Marcellus Strategic Position in Southern Appalachia 2 |
|
|
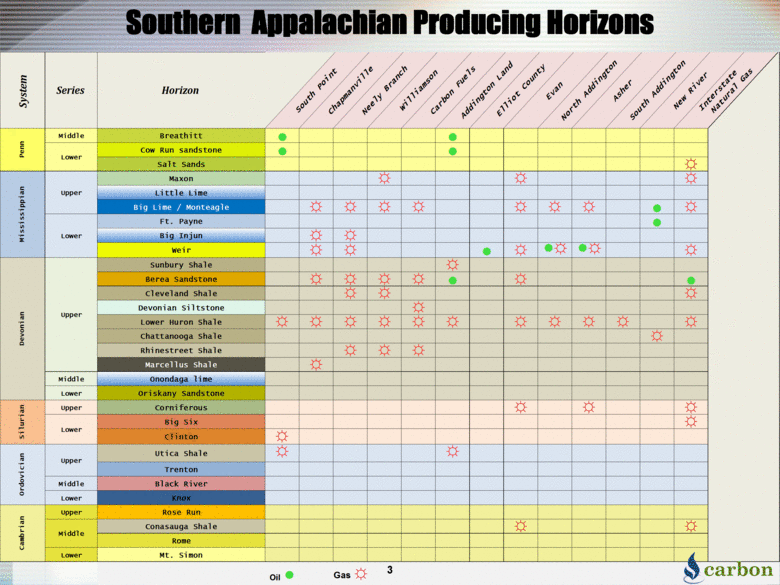
Southern Appalachian Producing Horizons 3 System Series Horizon South Point Chapmanville Neely Branch Williamson Carbon Fuels Addington Land Elliot County Evan North Addington Asher South Addington New River Interstate Natural Gas Penn Middle Breathitt ? ? Cow Run sandstone ? ? Salt Sands ? Maxon ? ? ? Little Lime Big Lime / Monteagle ? ? ? ? ? ? ? ? ? Ft. Payne ? Big Injun ? ? Weir ? ? ? ? ? ? ? ? ? Sunbury Shale ? Berea Sandstone ? ? ? ? ? ? ? Cleveland Shale ? ? ? Devonian Siltstone ? Lower Huron Shale ? ? ? ? ? ? ? ? ? ? ? Chattanooga Shale ? Rhinestreet Shale ? ? ? Marcellus Shale ? Middle Onondaga lime Lower Oriskany Sandstone Upper Corniferous ? ? ? Big Six ? Clinton ? Utica Shale ? ? Trenton Middle Black River Lower Knox Upper Rose Run Conasauga Shale ? ? Rome Lower Mt. Simon Oil ? Gas ? Middle Cambrian Penn Lower Mississippian Upper Lower Upper Ordovician Devonian Upper Silurian Lower |
|
|
Multiple Horizontal Resource Play opportunities Berea Sandstone Oil Seelyville Coal Devonian / Lower Huron Shale Chattanooga Shale Horizontal Berea Oil Development Program 21,000 net acres > 300 potential horizontal oil locations Light Oil, Nymex less $7.00 netback Additional oil development opportunities identified High BTU natural gas in close proximity to market Highlights 4 |
|
|
Significant opportunity for expansion of production, reserves and cash flow at low finding and development and operating costs Over 268,000 net acres of oil and gas and coalbed methane rights > 50% Held by Production > 40% expire greater than 5 years Significant Undeveloped Resource Potential with large inventory of horizontal resource development drilling locations both proved and potential Strong technical team with acquisition, production and drilling expertise Highlights 5 |
|
|
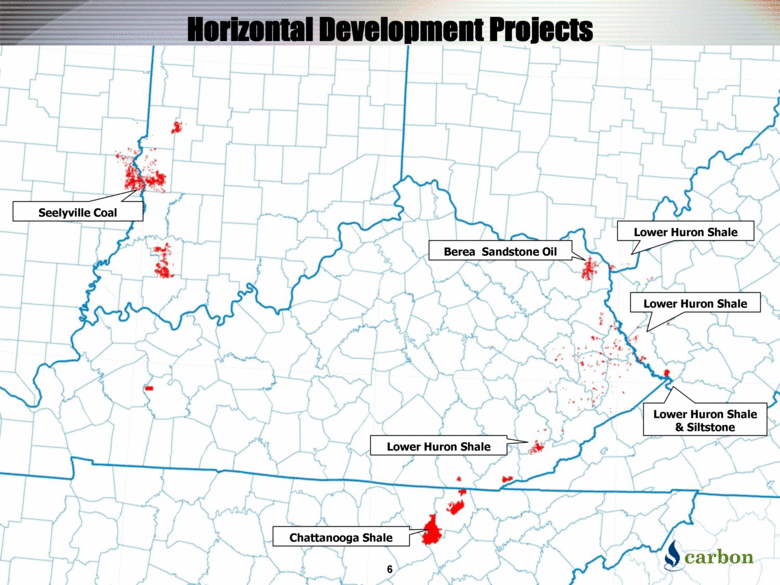
Seelyville Coal Chattanooga Shale Lower Huron Shale Berea Sandstone Oil Horizontal Development Projects Lower Huron Shale Lower Huron Shale & Siltstone Lower Huron Shale 6 |
|
|
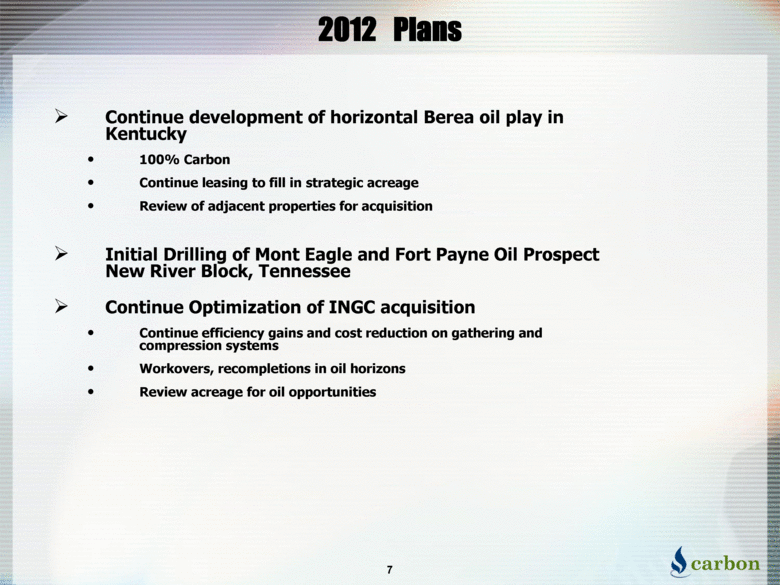
2012 Plans 7 Continue development of horizontal Berea oil play in Kentucky 100% Carbon Continue leasing to fill in strategic acreage Review of adjacent properties for acquisition Initial Drilling of Mont Eagle and Fort Payne Oil Prospect New River Block, Tennessee Continue Optimization of INGC acquisition Continue efficiency gains and cost reduction on gathering and compression systems Workovers, recompletions in oil horizons Review acreage for oil opportunities |
|
|
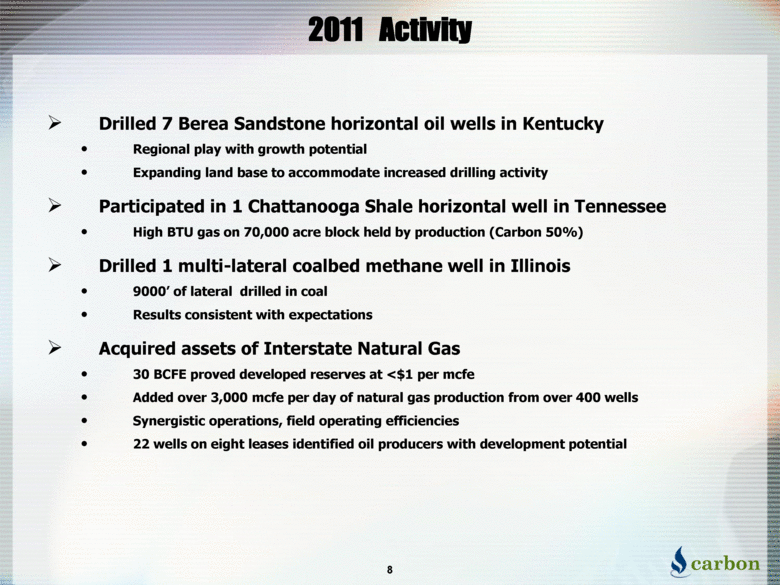
Drilled 7 Berea Sandstone horizontal oil wells in Kentucky Regional play with growth potential Expanding land base to accommodate increased drilling activity Participated in 1 Chattanooga Shale horizontal well in Tennessee High BTU gas on 70,000 acre block held by production (Carbon 50%) Drilled 1 multi-lateral coalbed methane well in Illinois 9000’ of lateral drilled in coal Results consistent with expectations Acquired assets of Interstate Natural Gas 30 BCFE proved developed reserves at <$1 per mcfe Added over 3,000 mcfe per day of natural gas production from over 400 wells Synergistic operations, field operating efficiencies 22 wells on eight leases identified oil producers with development potential 2011 Activity 8 |
|
|
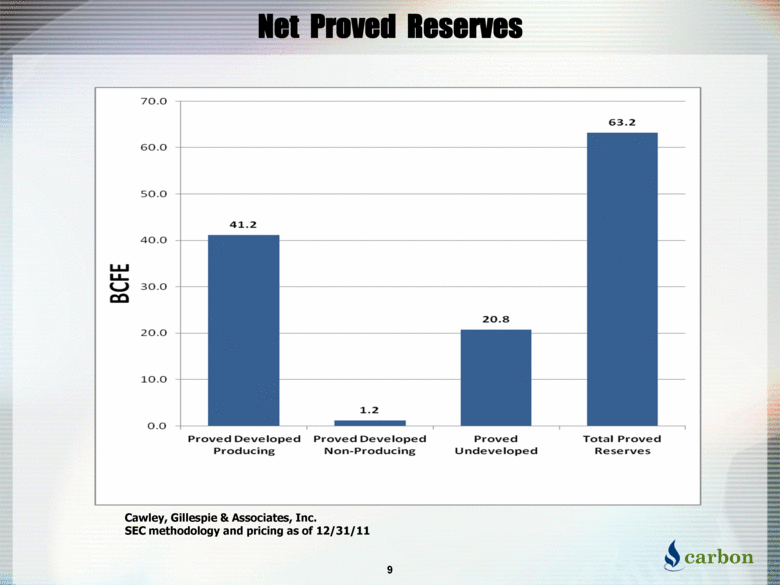
Net Proved Reserves 9 Cawley, Gillespie & Associates, Inc. SEC methodology and pricing as of 12/31/11 |
|
|
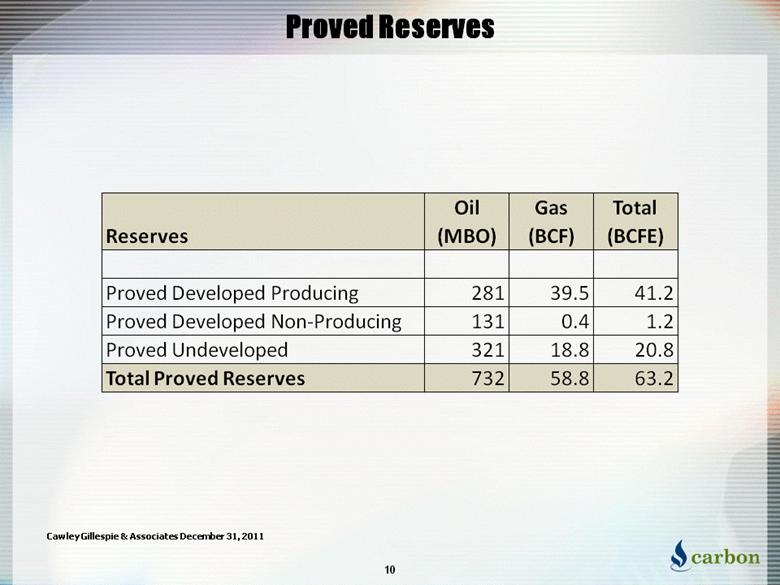
Proved Reserves 10 Cawley Gillespie & Associates December 31, 2011 Reserves Oil (MBO) Gas (BCF) Total (BCFE) Proved Developed Producing 281 39.5 41.2 Proved Developed Non-Producing 131 0.4 1.2 Proved Undeveloped 321 18.8 20.8 Total Proved Reserves 732 58.8 63.2 |
|
|
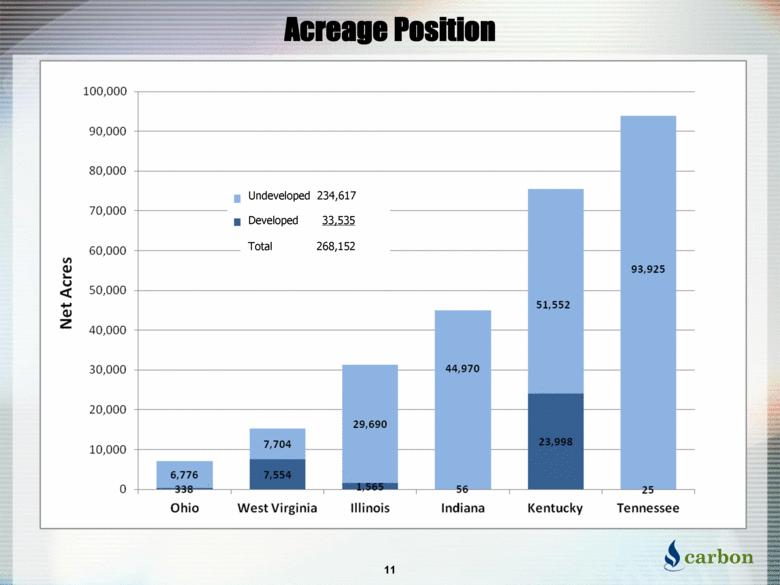
Acreage Position 11 Undeveloped 234,617 Developed 33,535 Total 268,152 |
|
|
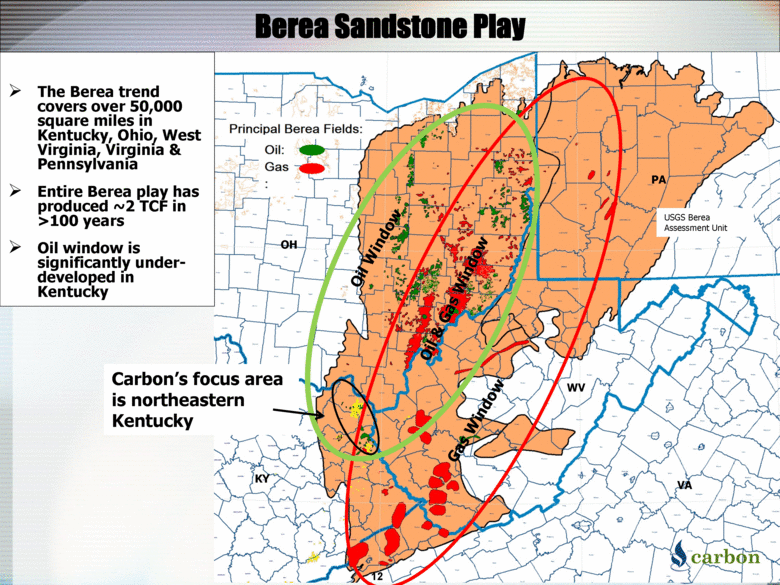
Berea Sandstone Play The Berea trend covers over 50,000 square miles in Kentucky, Ohio, West Virginia, Virginia & Pennsylvania Entire Berea play has produced ~2 TCF in >100 years Oil window is significantly under- developed in Kentucky Oil Window Oil & Gas Window Gas Window Carbon’s focus area is northeastern Kentucky KY OH WV PA VA USGS Berea Assessment Unit 12 Principal Berea Fields: Oil: Gas |
|
|
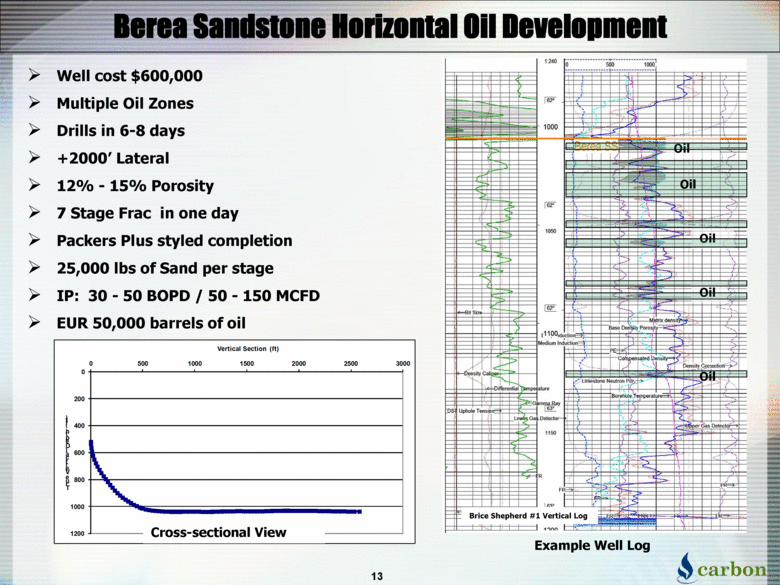
Oil Oil Oil Oil Oil Berea Sandstone Horizontal Oil Development Brice Shepherd #1 Vertical Log Well cost $600,000 Multiple Oil Zones Drills in 6-8 days +2000’ Lateral 12% - 15% Porosity 7 Stage Frac in one day Packers Plus styled completion 25,000 lbs of Sand per stage IP: 30 - 50 BOPD / 50 - 150 MCFD EUR 50,000 barrels of oil Cross-sectional View 13 Example Well Log 0 200 400 600 800 1000 1200 0 500 1000 1500 2000 2500 3000 T r u e V e r t i c a l D e p t h (ft) Vertical Section (ft) |
|
|
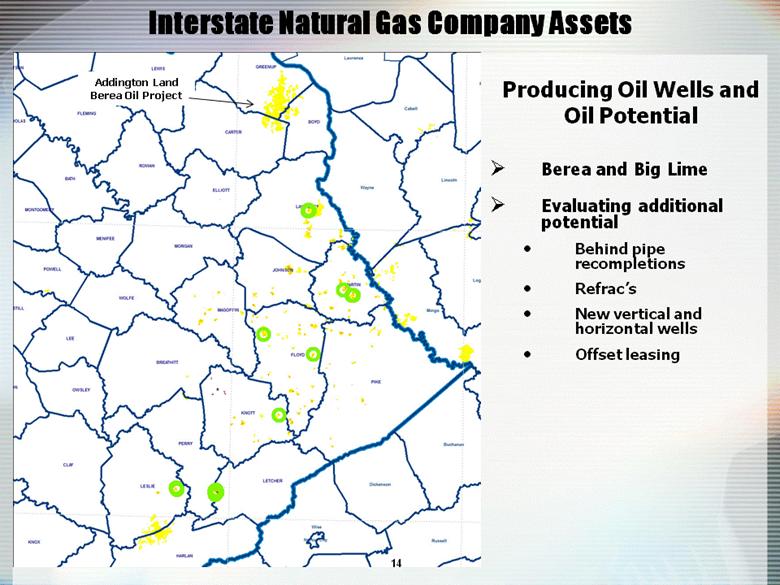
14 Interstate Natural Gas Company Assets Producing Oil Wells and Oil Potential Berea and Big Lime Evaluating additional potential Behind pipe recompletions Refrac’s New vertical and horizontal wells Offset leasing Addington Land Berea Oil Project |
|
|
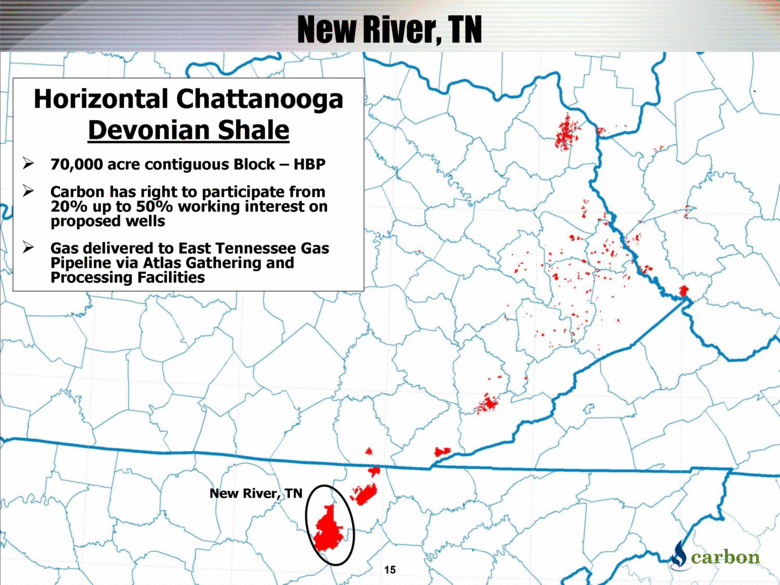
New River, TN Asher Block Horizontal Chattanooga Devonian Shale 70,000 acre contiguous Block – HBP Carbon has right to participate from 20% up to 50% working interest on proposed wells Gas delivered to East Tennessee Gas Pipeline via Atlas Gathering and Processing Facilities New River, TN 15 |
|
|
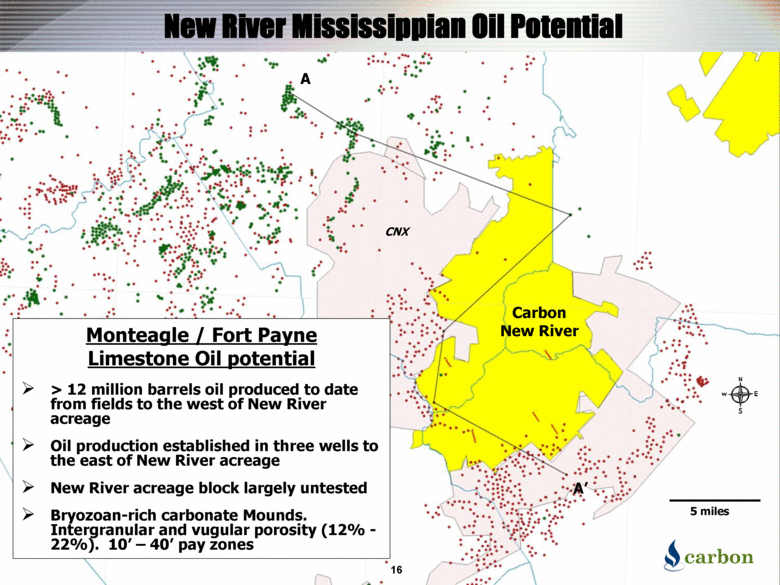
Carbon New River CNX New River Mississippian Oil Potential Monteagle / Fort Payne Limestone Oil potential > 12 million barrels oil produced to date from fields to the west of New River acreage Oil production established in three wells to the east of New River acreage New River acreage block largely untested Bryozoan-rich carbonate Mounds. Intergranular and vugular porosity (12% - 22%). 10’ – 40’ pay zones 5 miles 16 A A’ |
|
|
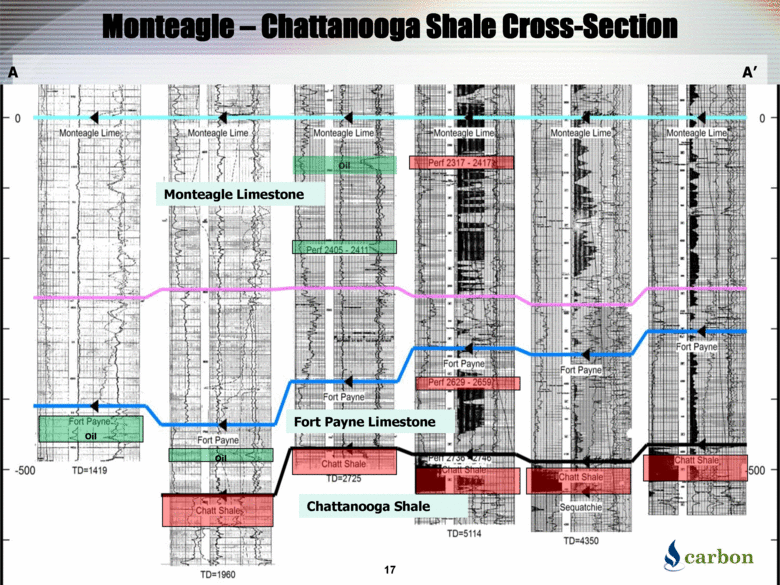
Oil Oil Monteagle Limestone Fort Payne Limestone Chattanooga Shale Monteagle – Chattanooga Shale Cross-Section 17 A A’ |
|
|
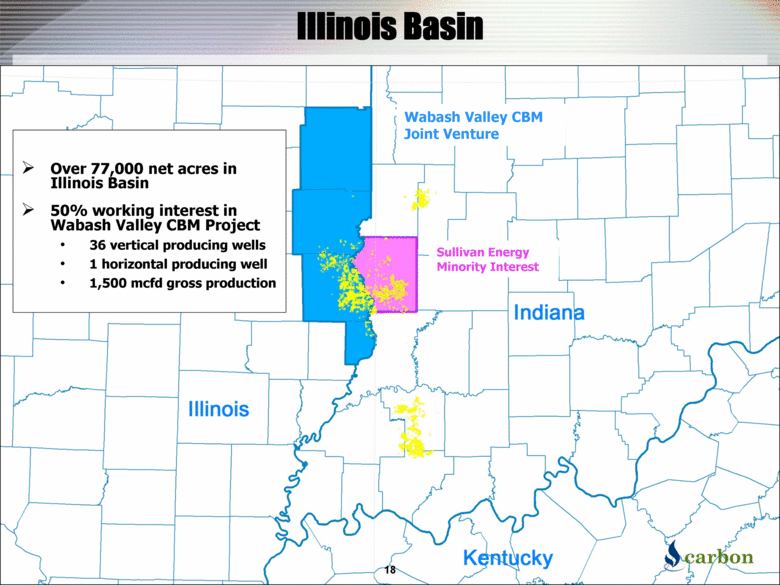
Illinois Basin Over 77,000 net acres in Illinois Basin 50% working interest in Wabash Valley CBM Project 36 vertical producing wells 1 horizontal producing well 1,500 mcfd gross production Wabash Valley CBM Joint Venture 18 Sullivan Energy Minority Interest |
|
|
OTC: CRBO 1700 Broadway Suite 1170 Denver, CO 80290 |