Attached files
| file | filename |
|---|---|
| 8-K - FORM 8-K - XERIUM TECHNOLOGIES INC | d313728d8k.htm |
| EX-99.3 - SUPPLEMENTAL RECONCILIATIONS OF NON-GAAP INFORMATION - XERIUM TECHNOLOGIES INC | d313728dex993.htm |
| EX-99.1 - PRESS RELEASE OF XERIUM TECHNOLOGIES INC - XERIUM TECHNOLOGIES INC | d313728dex991.htm |
 Xerium Technologies, Inc.
Fourth Quarter 2011
Selected Data –
Earnings Call
March 13, 2012
EXHIBIT 99.2
1 |
 Forward Looking Statements
•
This presentation and the remarks we may make today about Xerium’s future
expectations, plans and prospects are forward-looking statements which
reflect our current views with respect to future events and financial
performance. Any forward- looking statements which we make in this
presentation or in our remarks today, represent our views only as of today.
We disclaim any duty to update any of these forward-looking
statements. •
Forward-looking statements involve risks and uncertainties, both known and
unknown. Our actual results may differ materially from these
forward-looking statements due to a number of factors, including those
factors discussed in our earnings press release dated March 13, 2012, and
other factors discussed in our filings with the SEC, including our Form
10-K for the year ended December 31, 2011. Copies of these filings are
available from the SEC and in the investor relations section of our website
at www.xerium.com. •
These slides, the associated remarks and comments made during our fourth quarter
2011 financial results conference call, our earnings release dated March
13, 2012 and the reconciliation of certain non-GAAP financial
information posted in the investor relations section of our website are
integrally related and are intended to be presented and understood
together. 2 |
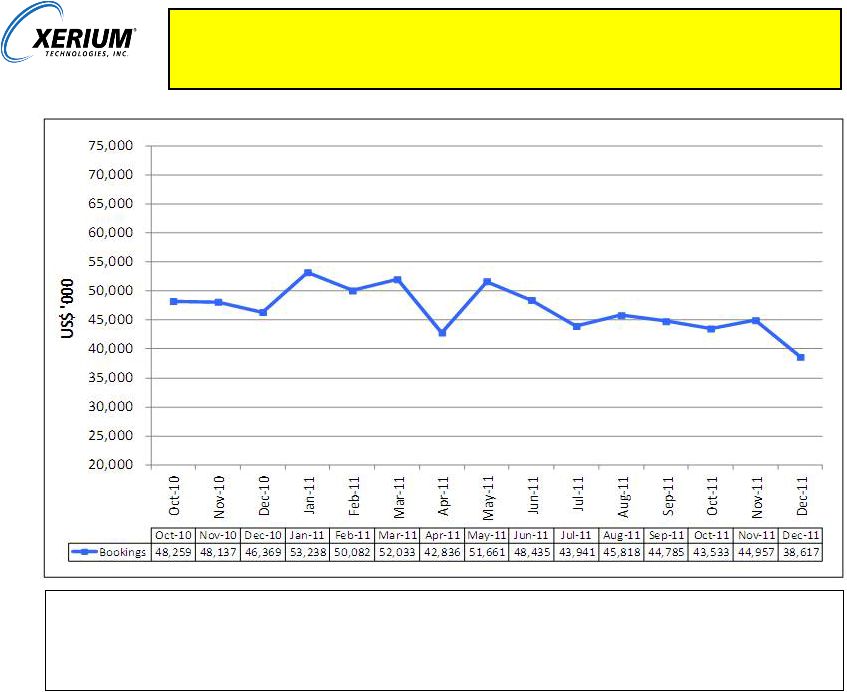 Bookings Analysis –
Total Xerium
Order bookings for Q4 2011 were $127.1M compared to Q4 2010 of $142.8M. Q4 2011
worldwide bookings reflect the impact of reduced paper production primarily
in Europe. Additional impacts include reduced orders in North America
and unfavorable currency movements in Europe and South America.
3 |
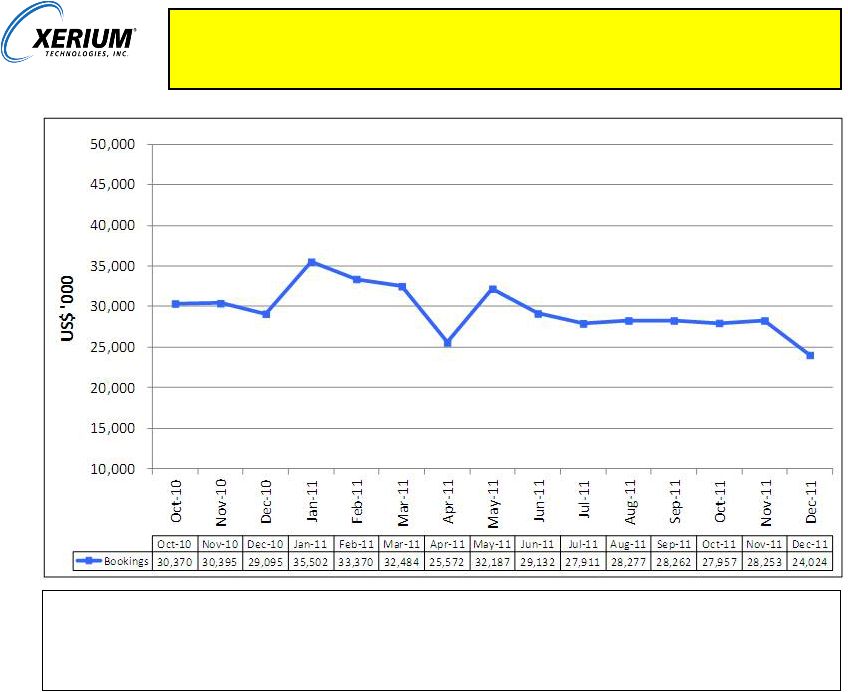 Bookings Analysis –
Paper Machine Clothing
PMC Q4 2011 order bookings of $80.2M are lower than Q4 2010 and Q3 2011 levels of
$89.9M and $84.5M, respectively. Q4 2011 bookings reflect the impact of
reduced paper production in Europe, lower orders in North America and Asia
Pacific, and unfavorable impacts from currency movements in Europe and South
America. 4 |
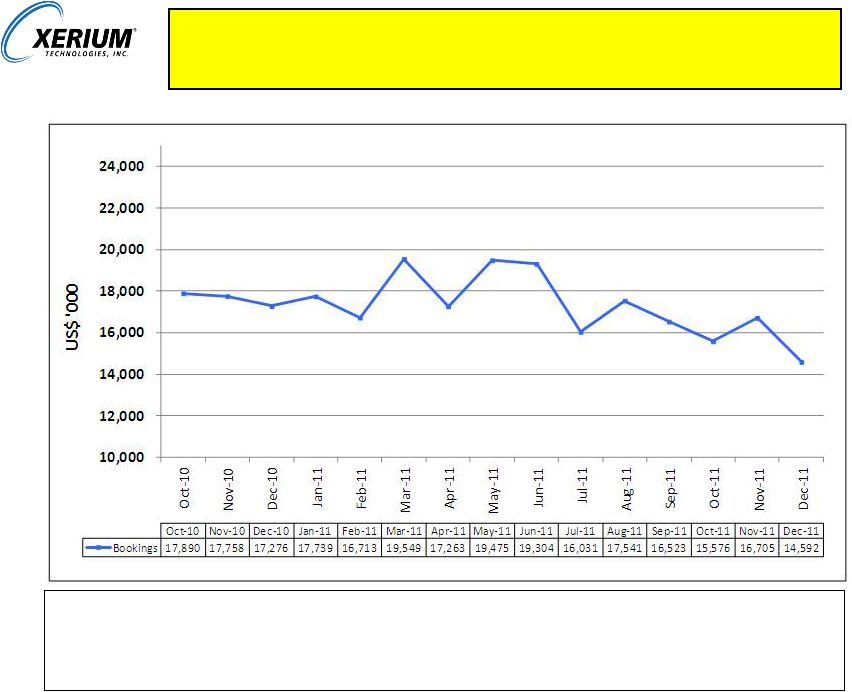 Bookings Analysis –
Roll Coverings
Rolls
Q4
2011
worldwide
order
bookings
of
$46.9M
were
lower
than
Q4
2010
bookings
of
$52.9M.
Q4
2011
worldwide
bookings
reflect
the
impact
of
reduced
paper
production
in
Europe.
Order
volume
was
lower
in
North
America
but
increased
in
the
Asia
Pacific
Region.
In
addition,
currency
movements
in
Europe
and
South
America
were
unfavorable
vs.
Q4
2010.
5 |
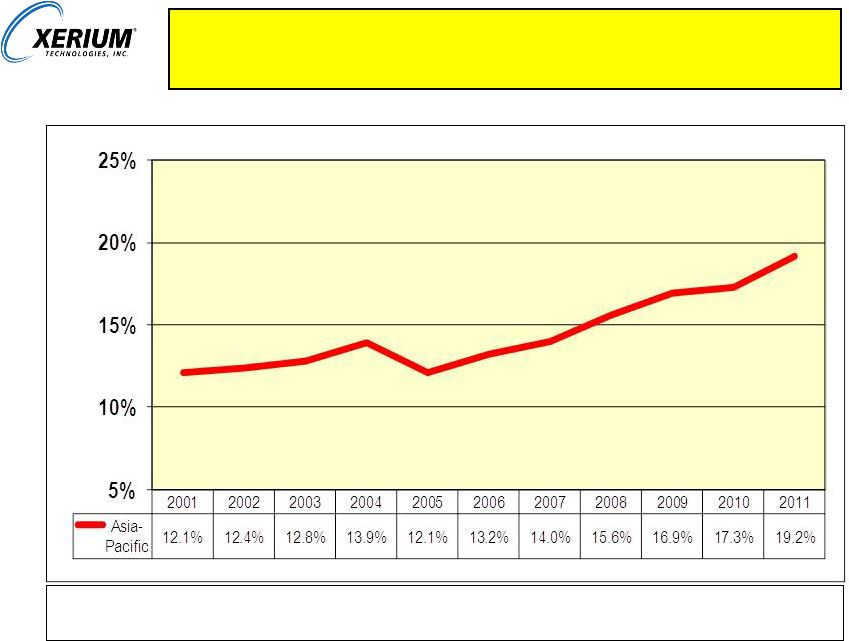 Percent of Revenue from Asia-Pacific Markets
Generally,
over
time,
we
expect
growth
in
paper
production
to
be
greater
in
Asia-
Pacific
than
in the
more
mature
North
American
and
Western
European
regions.
6 |
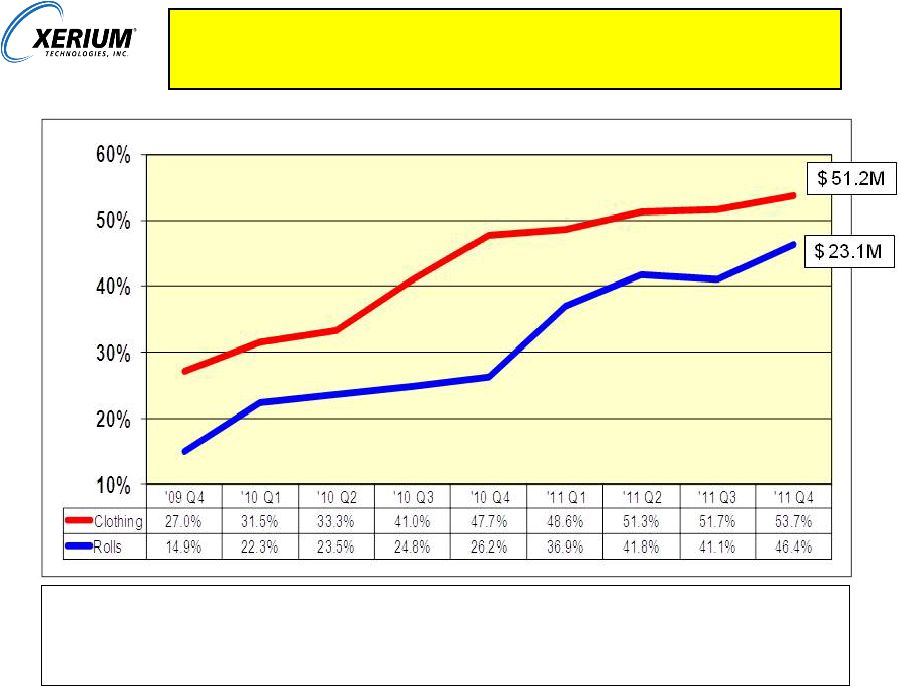 New
Product Sales as a Percent of Revenue Meaningful progress continues on
Xerium’s goal to increase its technological leadership. Our goal
is to derive 60% of XRM’s sales revenue from products developed within the prior five
years that make a measurable improvement in customer performance, are defendable
long term and simultaneously reduce our operating costs.
7 |
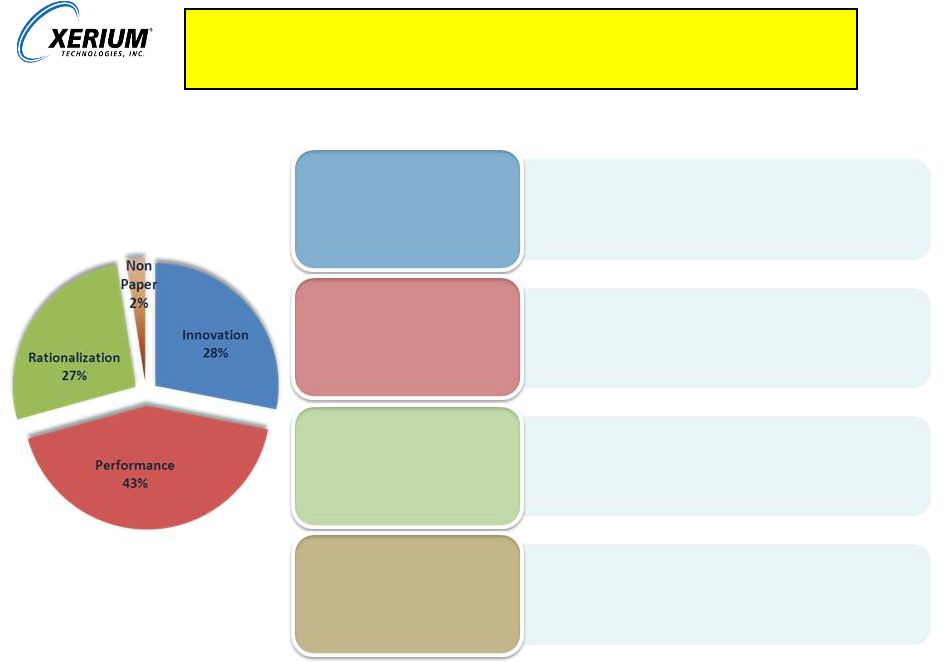 Xerium’s New Product Categorization
New products are categorized by their level of innovation and strategic purpose
8
Innovation
Performance
Rationalization
Non Paper
•
Gain
market
share
through
application
of
unique
performance
features;
capture
premium
pricing
•
Break
through
or
new
technology,
defendable
intellectual
property
that
competitors
can’t
replicate
•
SmartRoll
™,
EDC,
Impact,
EnerSTAR
™
•
Gain
/
Defend
market
share;
recover
lost
pricing
potential
of
mature
products
•
Product
introductions
that
significantly
enhance
contemporary
product
performance
•
New
tissue
products,
new
generation
spreader
rolls
•
Defend
market
share
and
price,
drive
internal
savings
•
Product
launches
that
while
upgrading
product
performance,
are
primarily
intended
to
reduce
manufacturing,
service
and
warranty
costs
•
ProSeam,
Avantexx
•
Provide profitable growth in non-paper markets
•
This
includes
new
products
developed
for
the
nonwoven
textiles
industry,
fiber
cement,
oil
field
development,
and
other
markets |
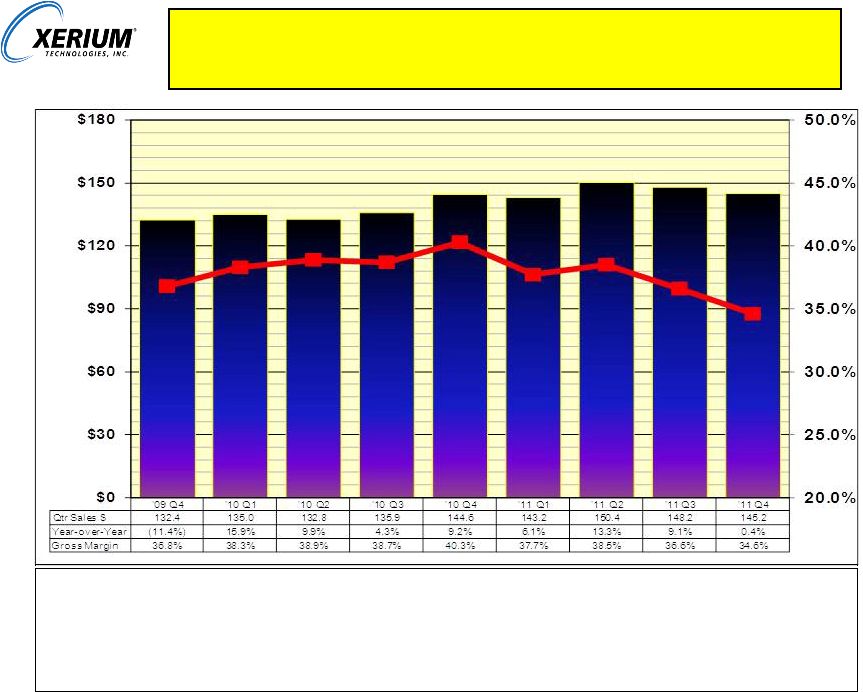 Total
Xerium Quarterly Sales and Gross Margin 000’s
Q4
2011
net
sales
increased
0.4%
from
Q4
2010.
Gross
margins
declined
to
34.6%
for
Q4
2011
as
compared
to
40.3%
for
Q4
2010.
This
decrease
was
primarily
the
result
of
(1)
unfavorable
production
cost
absorption
due
to
concerted
efforts
to
decrease
production
and
reduce
inventories,
(2)
a
favorable
recovery
of
inventory
reserves
in
2010,
(3)
inability
to
offset
increased
raw
material
costs
and
(4)
strong
sales
growth
in
regions
and
products
with
lower
margins.
9 |
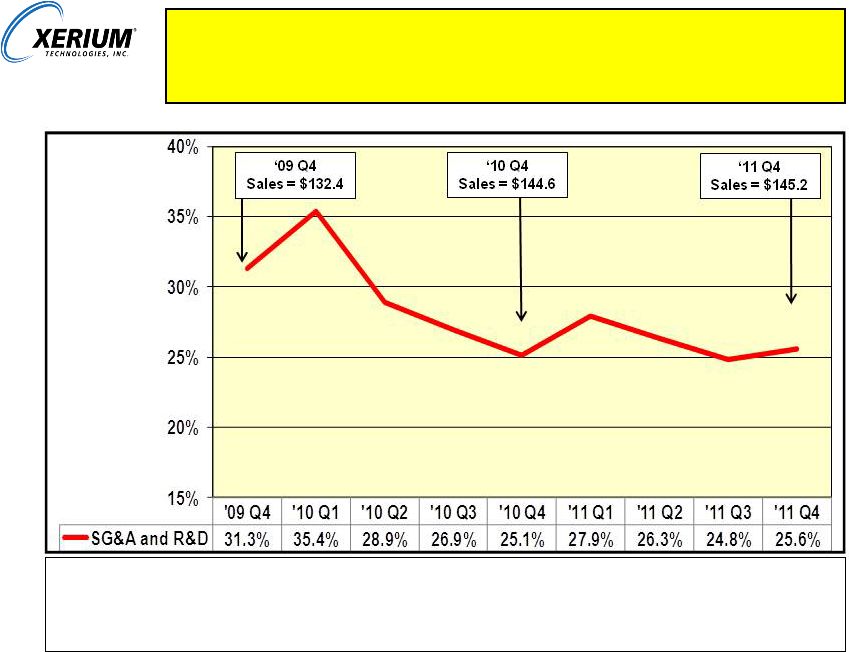 S G
& A and R&D as a Percent of Revenue In
Q4
2011,
SG&A
and
R&D
as
a
percent
of
sales
is
25.6%
as
compared
to
Q4
2010
of
25.1%.
Favorable
impacts
include
a
decrease
in
management
incentive
compensation
and
stock
compensation.
Partially
offsetting
these
items
were
bank
and
legal
fees,
bad
debt
reserves,
a
2010
gain
on
the
sale
of
land
in
Brazil
and
higher
selling
expense
due
to
inflation
and
higher
headcount.
10 |
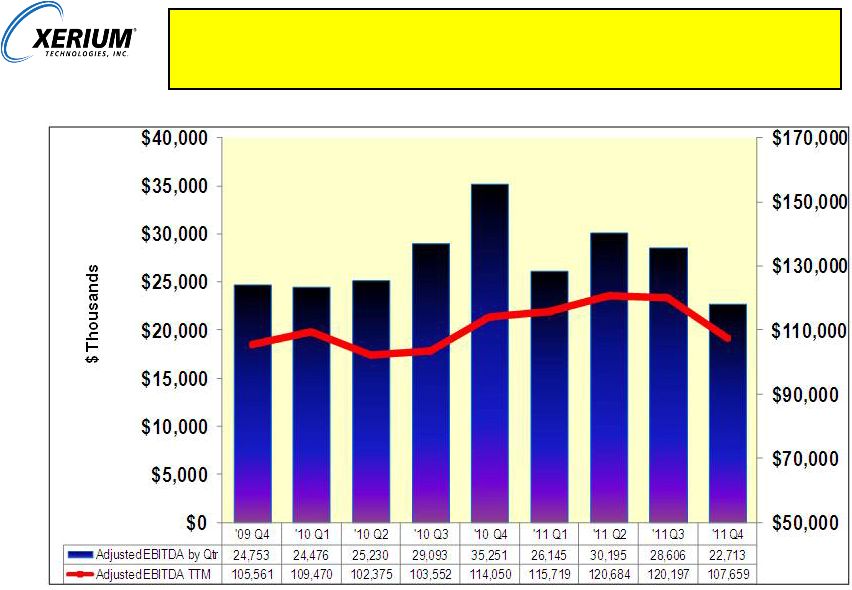 Trailing Twelve Month (“TTM”) Adjusted EBITDA
Note: Adjusted EBITDA at each quarter was the amount as calculated per the
definition in the current credit facility with the exception that we have added back to net
income (loss) per the terms of our prior credit facility financial restructuring
costs of $9.6M, $15.3M, $0.8M and $0.6M incurred as part of the reorganization in Q1
2010, Q2 2010, Q3 2010 and Q4 2010, respectively. A reconciliation of
Trailing Twelve Month Adjusted EBITDA to Net Income (Loss) and operating cash flows is
available in the investor relations section of the Company’s website at
www.xerium.com. 11 |
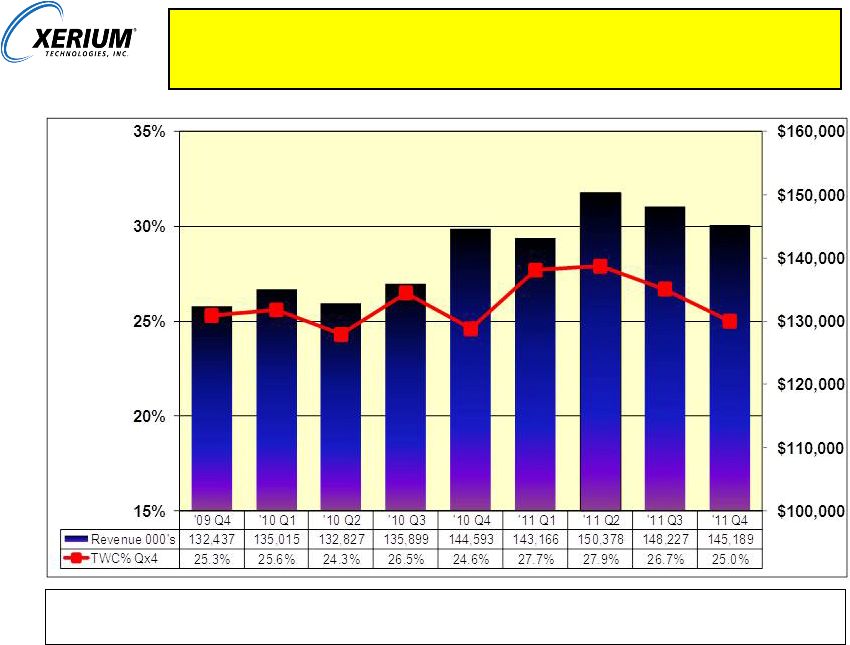 Trade Working Capital (“TWC”) as a Percent of
Revenue
Trade
working
capital
%
improved
170
basis
points
versus
Q3
2011
due
primarily
to
reduced
levels
of
inventories
and
increased
trade
payables.
Note:
a
reconciliation
of
Trade
Working
Capital
to
Revenue
is
available
in
the
investor
relations
section
of
the
Company’s
website
at
www.xerium.com.
12 |
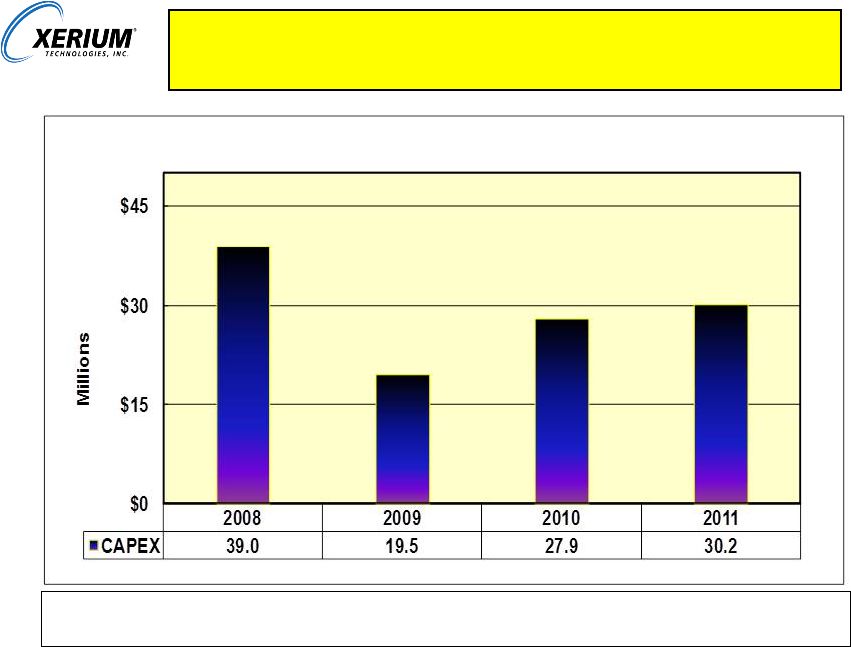 Total Xerium Annual Capital Expenditures
2011 investments focused on PMC capacity, new products and maintenance of existing
equipment capacity.
13 |