Attached files
Table of Contents
UNITED STATES
SECURITIES AND EXCHANGE COMMISSION
Washington, D.C. 20549
FORM 10-K
| x | ANNUAL REPORT PURSUANT TO SECTION 13 OR 15(d) OF THE SECURITIES EXCHANGE ACT OF 1934 |
For the fiscal year ended December 31, 2010
or
| ¨ | TRANSITION REPORT PURSUANT TO SECTION 13 OR 15(d) OF THE SECURITIES EXCHANGE ACT OF 1934 |
For the transition period from to
Commission File Number 001-32498
Xerium Technologies, Inc.
(Exact name of registrant as specified in its charter)
| DELAWARE | 42-1558674 | |
| (State or other jurisdiction of incorporation or organization) | (I.R.S. Employer Identification No.) |
8537 Six Forks Road, Suite 300
Raleigh, North Carolina 27615
(Address of principal executive offices)
(919) 526-1400
Registrant’s telephone number (including area code)
Securities registered pursuant to Section 12(b) of the Act:
| Title of each class |
Name of each exchange on which registered | |
| Common Stock, $0.001 par value per share | New York Stock Exchange | |
| Preferred Stock Purchase Rights | New York Stock Exchange |
Securities registered pursuant to Section 12(g) of the Act: None
Indicate by check mark if the registrant is a well-known seasoned issuer, as defined in Rule 405 of the Securities Act. Yes ¨ No x
Indicate by check mark if the registrant is not required to file reports pursuant to Section 13 or Section 15(d) of the Act. Yes ¨ No x
Indicate by check mark whether the registrant (1) has filed all reports required to be filed by Section 13 or 15(d) of the Securities Exchange Act of 1934 during the preceding 12 months (or for such shorter period that the registrant was required to file such reports), and (2) has been subject to such filing requirements for the past 90 days. Yes x No ¨
Indicate by check mark whether the registrant has submitted electronically and posted on its corporate Web site, if any, every Interactive Data File required to be submitted and posted pursuant to Rule 405 of Regulation S-T (§ 232.405 of this chapter) during the preceding 12 months (or for such shorter period that the registrant was required to submit and post such files). Yes ¨ No ¨
Indicate by check mark if disclosure of delinquent filers pursuant to Item 405 of Regulation S-K (§ 229.405 of this chapter) is not contained herein, and will not be contained, to the best of registrant’s knowledge, in definitive proxy or information statements incorporated by reference in Part III of this Form 10-K or any amendment to this Form 10-K. x
Indicate by check mark whether the registrant is a large accelerated filer, an accelerated filer, a non-accelerated filer, or a smaller reporting company. See the definitions of “large accelerated filer”, “accelerated filer” and “smaller reporting company” in Rule 12b-2 of the Exchange Act. (Check one):
| Large accelerated filer |
¨ |
Accelerated filer | x | |||||
| Non-accelerated filer |
¨ |
(Do not check if a smaller reporting company) | Smaller reporting company | ¨ |
Indicate by check mark whether the registrant is a shell company (as defined in Rule 12b-2 of the Exchange Act). Yes ¨ No x
Indicate by check mark whether the registrant has filed all documents and reports required to be filed by Section 12, 13 or 15(d) of the Securities Exchange Act of 1934 subsequent to the distribution of securities under a plan confirmed by a court. Yes x No ¨
The aggregate market value of the voting common stock held by non-affiliates of the registrant on June 30, 2010 was approximately $159,685,534. There were 14,988,367 shares of the registrant’s common stock, $0.001 par value per share, outstanding as of March 02, 2011.
DOCUMENTS INCORPORATED BY REFERENCE
Proxy Statement for the 2011 Annual Meeting of Shareholders which will be filed pursuant to Regulation 14A, is incorporated by reference in Part III to the extent described therein.
Table of Contents
| PAGE | ||||||
| PART I. |
||||||
| ITEM 1. |
5 | |||||
| ITEM 1A. |
14 | |||||
| ITEM 1B. |
23 | |||||
| ITEM 2. |
23 | |||||
| ITEM 3. |
23 | |||||
| ITEM 4. |
23 | |||||
| PART II. |
||||||
| ITEM 5. |
24 | |||||
| ITEM 6. |
26 | |||||
| ITEM 7. |
Management’s Discussion and Analysis of Financial Condition and Results of Operations |
28 | ||||
| ITEM 7A. |
52 | |||||
| ITEM 8. |
53 | |||||
| ITEM 9. |
Changes in and Disagreements with Accountants on Accounting and Financial Disclosure |
53 | ||||
| ITEM 9A. |
53 | |||||
| ITEM 9B. |
55 | |||||
| PART III. |
||||||
| ITEM 10. |
56 | |||||
| ITEM 11. |
56 | |||||
| ITEM 12. |
Security Ownership of Certain Beneficial Owners and Management and Related Stockholder Matters |
56 | ||||
| ITEM 13. |
Certain Relationships and Related Transactions, and Director Independence |
56 | ||||
| ITEM 14. |
56 | |||||
| PART IV. |
||||||
| ITEM 15. |
57 | |||||
| 58 | ||||||
2
Table of Contents
CAUTIONARY STATEMENT FOR PURPOSES OF THE “SAFE HARBOR” PROVISIONS OF THE PRIVATE SECURITIES LITIGATION REFORM ACT OF 1995
This Annual Report on Form 10-K contains forward-looking statements. These statements relate to future events or to our future financial performance and involve known and unknown risks, uncertainties, and other factors that may cause our actual results, levels of activity, performance, or achievements to be materially different from any future results, levels of activity, performance, or achievements expressed or implied by these forward-looking statements. In some cases, forward-looking statements can be identified by the use of words such as “may,” “could,” “expect,” “intend,” “plan,” “seek,” “anticipate,” “believe,” “estimate,” “predict,” “potential,” or “continue” or the negative of these terms or other comparable terminology. Undue reliance should not be placed on forward-looking statements because they involve known and unknown risks, uncertainties, and other factors that are, in some cases, beyond our control and that could materially affect actual results, levels of activity, performance, or achievements. Factors that could materially affect our actual results, levels of activity, performance or achievements include the following items:
| • | our financial results could be adversely affected by fluctuations in interest rates and currency exchange rates; |
| • | our credit facilities contain restrictive covenants, such as the covenants requiring compliance with minimum interest coverage and maximum leverage ratios, which become more restrictive over time, that may require us to increasingly improve our performance over time to remain in compliance therewith; |
| • | we are subject to the risk of weaker economic conditions in the locations around the world where we conduct business, including the impact of price pressures and cost reduction strategies by our customers in the paper industry; |
| • | our strategies and plans, including, but not limited to, those relating to developing and successfully marketing new products, enhancing our operational efficiencies and reducing costs, may not result in the anticipated benefits; |
| • | variations in demand for our products, including our new products, could negatively affect our net sales and profitability; |
| • | our manufacturing facilities may be required to operate at or near capacity, which could negatively affect our production, customer order lead time, product quality and labor relations; |
| • | we may not be successful in developing and marketing new technologies or in competing against new technologies developed by competitors; |
| • | due to our high degree of leverage and significant debt service obligations, we need to generate substantial operating cash flow to fund growth and unexpected cash needs; |
| • | we may be required to incur significant costs to reorganize our operations in response to market changes in the paper industry; |
| • | we are subject to the risk of terrorist attacks or an outbreak or escalation of any insurrection or armed conflict involving the United States or any other country in which we conduct business, or any other domestic or international calamity, including natural disasters; |
| • | we are subject to any future changes in government regulation; |
| • | we are subject to any changes in U.S. or foreign government policies, laws and practices regarding taxes and the repatriation of earnings; and |
| • | anti-takeover provisions could make it more difficult for a third-party to acquire us. |
Other factors that could materially affect our actual results, levels of activity, performance or achievements can be found in our “Risk Factors” section in this Annual Report on Form 10-K. If any of these risks or
3
Table of Contents
uncertainties materialize, or if our underlying assumptions prove to be incorrect, actual results may vary significantly from what we project. Any forward-looking statement in this Annual Report on Form 10-K reflects our current views with respect to future events and is subject to these and other risks, uncertainties, and assumptions relating to our operations, results of operations, growth strategy, and liquidity. We assume no obligation to publicly update or revise these forward-looking statements for any reason, whether as a result of new information, future events, or otherwise.
All references in this Annual Report to “Xerium”, “we”, “our” and “us” means Xerium Technologies, Inc. and its subsidiaries.
4
Table of Contents
PART I
| ITEM 1. | BUSINESS |
General
We are a leading global manufacturer and supplier of two types of consumable products used primarily in the production of paper—clothing and roll covers. We market our products through the following industry-recognized brands:
| Brand |
Product Category |
Geographic Region | ||
| Huyck Wangner |
Clothing | Worldwide other than North America | ||
| Weavexx |
Clothing | North America | ||
| Stowe Woodward |
Roll Covers & Spreader Rolls | Worldwide | ||
| Mount Hope |
Spreader Rolls | Worldwide | ||
| Robec |
Spreader Rolls | Europe | ||
| Xibe |
Roll Covers | China |
Our products are installed on paper-making machines and play key roles in the process by which raw materials are converted into finished paper. A fundamental characteristic of our products is that they wear down with use in the paper production process and must be regularly replaced. In addition, our products are also installed in other industrial applications such as nonwoven and fiber cement machines. As of December 31, 2010, we have an extensive global footprint of 31 manufacturing facilities in 14 countries, strategically located in the major paper-producing regions of North America, Europe, South America and Asia-Pacific, and have 3,404 employees worldwide. We market our products, primarily using our direct sales force, to the paper industry’s leading producers. In 2010, we generated net sales of $548.3 million.
Company Overview
The consumable nature of our products positions us to make recurring net sales to our customers, and accordingly the number of paper machines in operation throughout the world and the volume of paper, pulp and board produced globally each year are primary drivers of the demand for our product.
Paper-making machines utilize different processes and have different requirements depending on the design of the machine, the raw materials used, the type of paper being made and the preferences of individual production managers. We employ our broad portfolio of patented and proprietary product and manufacturing technologies, as well as our extensive industry experience, to provide our customers with tailored solutions designed to optimize the performance of their equipment and dramatically reduce the costs of their operations. We systematically track and report the impact of these customized solutions to our customers through our ValueResults program which quantifies the optimization process on each machine.
Our clothing products are highly engineered synthetic textile belts that transport paper as it is processed in a paper-making machine. Clothing plays a significant role in the forming, pressing and drying stages of paper production. Our clothing segment represented 66%, 66% and 65% of our net sales for 2010, 2009 and 2008, respectively.
Roll cover products cover the rolls on a paper-making machine, which are the large steel cylinders over which clothing is mounted and between which the paper travels as it is processed. Our roll covers provide a surface with the mechanical properties necessary to process the paper in a cost-effective manner that delivers the sheet qualities desired by the paper producer. We currently use several hundred chemical compounds in our roll cover manufacturing process. Our roll cover segment represented 34%, 34% and 35% of our net sales for 2010, 2009 and 2008, respectively.
Our products are in constant contact with the paper stock during the manufacturing process through which the stock is processed into finished paper. As a result, our products have a significant effect on paper quality and
5
Table of Contents
the ability of a paper producer to differentiate its products, two factors which are increasingly important to paper producers. In addition, while clothing and roll covers represent only approximately 3%, on average, of a paper producer’s production costs, they can help a paper producer improve productivity and reduce overall costs. Our clothing and roll covers facilitate the paper producer’s use of less expensive raw materials (including recycled fiber), ability to run paper-making machines faster and with fewer interruptions, and ability to decrease the amount of energy required in the expensive drying portion of the paper-making process. We have found that, in certain cases, our products and services provide paper producers with cost savings that substantially offset the costs of such products and services.
We estimate that there are approximately 7,000 paper-making machines worldwide, all of which require a regular supply of clothing and roll covers. Clothing and roll covers must be replaced regularly to sustain high quality paper output and operate efficiently. Roll covers also require regular refurbishment, a service that we provide to our customers. Paper producers must typically replace clothing several times per year, replace roll covers every two to five years and refurbish roll covers several times between each replacement.
We have a reputation for technological innovation in the paper-making industry. In our clothing segment, in recent years we have focused our research and development efforts on higher-value-added, technologically advanced products, such as forming fabrics and press felts, which offer paper producers greater potential for differentiating their products through quality improvements and for increasing their operating efficiency. We pioneered a number of technologies that have become industry standards. These include, in our clothing business, synthetic forming fabrics (which replaced bronze wire technology), double-layer forming fabrics, laminated press felts and, most recently, triple-layer forming fabrics.
In our roll covers segment, we have introduced a number of innovations to our roll cover and spreader roll products in recent years, including SmartRoll™, the first continuous pressure sensing paper machine roll that enables the papermaker to maximize performance by knowing the pressure of the paper machine while the machine is running, shoe press belts which utilize our expertise in polyurethane material and manufacturing technologies, composite calender roll covers that use nanoparticle technology to improve roll cover durability and paper gloss, as well as covers that use an improved polyurethane to increase abrasion and moisture resistance as well as responsiveness and stability.
Our portfolio of patented and proprietary product and manufacturing technologies differentiates our product offerings from others in the market and allows us to deliver high value products and services to our customers. We currently have approximately 240 issued patents and approximately 105 pending patent applications. Our patents and patent applications cover approximately 65 different inventions. We currently license certain of our patents and technologies to some of our competitors, which we believe helps further demonstrate our technological leadership in the industry. We believe that the technological sophistication of our products and the capital-intensive nature of our business present significant challenges to any potential new competitors in our field.
Our business was organized in 1999 in connection with the acquisition of the paper technology group of Invensys plc. We completed our initial public offering on May 19, 2005.
Chapter 11 Filing, Emergence and Plan of Reorganization
On March 30, 2010, we and certain of our subsidiaries filed voluntary petitions for relief under chapter 11 of title 11 of the United States Code, 11 U.S.C. §§ 101-1532 (as amended, the “Bankruptcy Code”), in the United States Bankruptcy Court for the District of Delaware (the “Bankruptcy Court”). On May 12, 2010, the Bankruptcy Court held a hearing to consider confirmation of our amended joint prepackaged plan of reorganization (the “Plan”) and entered an order confirming the Plan. On May 25, 2010 (the “Effective Date”), the Plan became effective and we and our subsidiaries emerged from chapter 11. See “Management’s Discussion and Analysis of Financial Condition and Results of Operations—Chapter 11 Filing, Emergence and Plan of Reorganization” for additional information regarding our chapter 11 proceedings.
6
Table of Contents
Recent Developments
Global Economic Environment
Our operations are highly dependent upon the paper production industry and the degree to which the paper industry is affected by global economic conditions and the availability of credit.
Beginning in 2008 and continuing through most of 2009, the global paper industry experienced a sharp reduction in production levels, caused by the general slowdown in economic activity and related paper consumption during the same period and the paper manufacturers’ reducing excessive inventories. The slowdown of production was across most grades of paper production, but most notably in packaging and newsprint grades. For packaging grades, demand is directly related to broad manufacturing and transportation activity reduction, while newsprint demand has been declining over a number of years due to the greater prevalence of electronic media, exacerbated during the recession by a reduction in print advertising. One of the results of this recession driven reduction in demand for paper products was that the paper manufacturers dramatically and quickly reduced production through curtailments of machines and complete mill shutdowns. These curtailments, which began in late 2008, served to reduce inventories and match output with demand. By early 2010, most mills and equipment not permanently shuttered had resumed production.
In 2010, however, global paper and board production began to recover, particularly in developing countries. As international shipments of manufactured goods recovered, containerboard production recovered particularly strongly, contributing over 50% of the total global improvement, though the rate of recovery slowed somewhat during the second half of 2010. Going forward, we expect that global paper and board manufacturers’ operating rates will remain near their current high levels as production keeps pace with demand. While there continues to be price pressure due to our competitors pursuing increased market share in 2010, as compared with 2009, we were successful in increasing our pricing levels in our roll covers segment and maintaining them relatively constant in our clothing segment.
Business Strategy
The primary components of our business strategy are:
Fiscally Responsible Management. We are committed to improving our capital structure and creating sufficient financial flexibility. This will allow us to continue to invest in our operations where we can expect reasonable returns, expand into markets where our products and services will create value for our customers and support the global growth of the paper-making industry. As part of this strategy, our focus on the reduction of working capital, allocation of capital investments and elimination of loss-making businesses, customers and products will drive our activities. We may incur additional operational restructuring expenses in connection with pursuing cost-savings opportunities. We believe that our potential to improve productivity includes the opportunities to enhance our manufacturing efficiency by improving our process yields and cycle times.
New Product Development. We are committed to maximizing our margins and profitability in both our clothing and roll covers segments by focusing our production and marketing efforts on higher value-added, technologically advanced products that will benefit our customers by providing them with the cost savings and quality improvement characteristics they require to be competitive. We intend to continue to offer a full range of product offerings in order to meet our customers’ needs. We believe that the development and successful introduction of new products in a systematic and customer-focused manner will allow us to meet the expected demands of global market growth and our own sales growth and profitability projections. Simultaneous standardization and simplification will help us achieve significant cost reductions and competitiveness.
Workforce Engagement. We are committed to alignment of objectives for our entire workforce. We believe that communication, training, tools and incentives associated with this alignment are essential to meeting our business plans and objectives. Human resource management systems must be in place in support of this strategy, including retention of personnel to maintain and enhance the quality of the performance of our workforce,
7
Table of Contents
visibility to career opportunities to create job growth, and incentive systems that reward the workforce for achievement of critical objectives. Our approach includes the “high-grading” and “right-sizing” of our workforce to make certain those individuals most necessary for our success are in a position to positively contribute to goal achievement.
Products
We operate through two principal business segments, clothing and roll covers. Our clothing segment products include various types of industrial textiles used on paper-making machines and other industrial applications. Through our roll covers segment, we manufacture various types of roll covers, refurbish previously installed roll covers, provide mechanical services for the internal mechanisms of rolls used on paper-making machines and manufacture spreader rolls. For additional financial information about our clothing and roll covers segments, please see “Management’s Discussion and Analysis of Financial Condition and Results of Operations” and Note 15 to the accompanying audited consolidated financial statements.
Clothing Products
Our clothing segment products are large, highly engineered synthetic textile belts that transport paper as it is processed on a paper-making machine from paper stock into finished paper. Clothing products must be tailored to each machine because all paper-making machines have different physical configurations and operating parameters. Clothing generally ranges in size from approximately 3 feet to over 30 feet wide and 24 feet to more than 460 feet long and operates on paper-making machines that run at speeds up to 7,500 feet per minute. We typically sell clothing products for between $13,000 and $45,000 per unit, although we sell some of our more sophisticated forming fabrics for up to $200,000 per unit.
We manufacture the three general types of clothing products used on paper-making machines—forming fabrics, press felts and dryer fabrics—each of which is located in a different section of a machine. Forming fabrics and press felts are typically replaced several times a year, but replacement frequency varies significantly by the grade of paper being produced, the manner in which the paper-making machine is operated and the quality of raw materials used in the paper stock. Dryer fabrics are replaced less frequently, with replacement typically taking place no more than once per year.
Forming fabrics. Forming fabrics are used at the beginning of paper-making machines, where highly diluted paper stock is deposited on the forming fabric while the fabric is traveling at a very high speed. Forming fabrics allow water to drain from the paper stock, creating an initial wet sheet. Forming fabrics must be porous enough to allow water to drain evenly but tight enough to retain and align the fiber and other materials that form the sheet of paper. They must also be strong enough to withstand high mechanical stresses. Forming fabrics are custom-manufactured in single, double, and triple layer designs in a variety of meshes to suit particular machines and paper grades. Customers are increasingly demanding the higher-priced triple layer designs that remove more moisture and produce higher quality paper. In 2010, forming fabrics accounted for approximately 42% of net sales in our clothing segment.
Press felts. Press felts are used to carry the paper sheet through a series of press rolls that mechanically press water from the sheet under high pressure. Press felts are designed to maximize water removal, which reduces the amount of water that must be removed during the expensive energy-intensive drying section of the production process. Press felts must maximize water removal while maintaining the orientation of the fibers and the consistency of the thickness of the paper, without removing chemicals or fillers from the paper.
Press felts differ from forming fabrics and dryer fabrics due to the addition of several layers of staple fiber that are needled into the fabric base. The staple fiber provides a smooth surface to meet the wet sheet of paper and creates a wicking effect to remove water from the paper sheet as it is pressed under high pressure between press rolls. Press felts are manufactured in a variety of designs, including lightweight single layer felts, multi-layer laminated endless felts and seamed felts that allow for reduced installation times. In 2010, press felts accounted for approximately 41% of net sales in our clothing segment.
8
Table of Contents
Dryer fabrics. Dryer fabrics are used to transport the paper sheet through the drying section of paper-making machines, where high temperatures from large, steam-heated dryer cylinders evaporate the remaining moisture from the paper sheet. Dryer fabrics, which are less technically advanced than forming fabrics or press felts, are woven from heat-resistant yarns with a coarser mesh than forming fabrics. In 2010, dryer fabrics accounted for approximately 5% of net sales in our clothing segment.
Industrials and Other. We also manufacture other types of clothing used in other industrial applications, such as steel, plastics, leather and textiles manufacturing. In 2010, net sales for such industrial applications accounted for 11% of net sales in our clothing segment. We also manufacture auto-joining equipment used on paper-making machines. Net sales of auto-joining equipment accounted for less than 1% of net sales in our clothing segment in 2010.
New Clothing Products. In recent years, we have focused our research and development efforts on higher-value-added, technologically advanced products, such as forming fabrics and press felts, which offer paper producers the greatest potential for differentiating their products through quality improvements and for increasing their operating efficiency. Our research and development efforts have resulted in several innovative new forming fabric and press felt products, including a number of high performance products, such as triple layer forming fabrics, for use on high performance paper-making machines. In addition, we have developed new clothing products aimed at segments of the paper-making process that we have not historically served, such as the growing market for shoe press belts and other clothing products designed for use in the technologically-advanced press section of a paper-making machine.
Roll Covers Products and Services
In our roll covers segment, the majority of our sales are generated through the manufacture of roll covers. We also refurbish previously installed roll covers, provide general mechanical maintenance and repair services for the internal mechanisms of rolls and manufacture spreader rolls.
Roll covers. We manufacture, refurbish and replace covers for three kinds of rolls on paper-making machines: working rolls (including vacuum rolls and press rolls), calendar rolls and coater rolls. There can be up to 200 such rolls in a typical paper-making machine. These metal rolls, which can be up to 39 feet long, 6 feet in diameter and weigh 500 to 140,000 pounds, are covered with an exterior layer of rubber, polyurethane, composite or ceramic, each of which is designed for use in a particular phase of the paper-making process. Roll covers operate in temperatures up to 400 degrees Fahrenheit, under pressures up to 1,400 pounds per square inch and at speeds up to 7,500 feet per minute. Roll covers are typically replaced every two to five years.
Roll cover replacement is performed at the manufacturing facility of the supplier, such as Xerium, which necessitates removing the roll from the paper-making machine, transporting it to the supplier’s site and using a spare in the interim. In general, each roll on a paper-making machine is unique due to its dimensions, specific design and cover material, and therefore not interchangeable with other rolls. Because of their large size, paper producers generally maintain only one spare roll for each position on a paper-making machine. It is important that the roll cover replacement be completed quickly, because a malfunction of the spare roll could render the paper-making machine inoperable.
Due to the large size and weight of a roll, the transportation to and from a supplier’s site can be costly and is often subject to regulations on road use that restrict available routes and times of travel, and that may require safety escorts. Round-trip transcontinental travel can take several weeks and intercontinental travel is rare. We offer an extensive network of manufacturing facilities worldwide, often in close proximity to our customers, which we believe is a significant competitive advantage.
We typically sell roll covers for between $1,000 per roll (e.g., for a small installed rubber roll cover) and $300,000 per roll (e.g., for a large installed polyurethane cover). Net sales of roll covers accounted for approximately 57% of our total net sales in our roll covers segment in 2010.
9
Table of Contents
Roll Cover Refurbishment Services and Mechanical Services. Roll covers are typically refurbished several times over the two to five years they are in service before needing to be replaced. Refurbishment typically includes the regrinding of the roll cover to standard specifications and inspecting the bearings and other mechanical components of the roll. As with roll cover replacement, refurbishment is performed at the supplier’s manufacturing facility. Similar to the paper producer’s selection of a roll cover supplier, the selection of a refurbishment provider is influenced by the time and expense of transporting a roll cover. We believe our extensive network of manufacturing facilities worldwide is a significant competitive advantage. Refurbishment services typically cost between $1,000 for minor roll repairs and $50,000 for a complete overhaul on certain press rolls.
We offer a wide range of mechanical maintenance and repair services for the internal mechanisms of rolls. Paper producers are increasingly finding it economical to have the company that refurbishes or replaces a roll cover also perform work on the internal roll mechanisms at the same time, which avoids having multiple suppliers and incurring additional time and transportation charges. We began performing such services to meet the demands of our customers and attempt to gain a competitive advantage. As of December 31, 2010, we provide major mechanical services at ten locations around the world. Roll cover refurbishment services and mechanical services accounted for approximately 18% of our total net sales in our roll covers segment in 2010.
Spreader rolls. We manufacture and repair spreader rolls, which are small-diameter curved rolls used throughout a paper-making machine to stretch, smooth and remove wrinkles from the paper and clothing. There are approximately five to seven spreader rolls in a typical paper-making machine. We typically sell spreader rolls for between $1,000 and $200,000 per roll. We also rebuild and overhaul existing spreader rolls, typically for between $1,000 and $100,000 per roll. Net sales of spreader rolls and related services accounted for approximately 25% of our total net sales in our roll covers segment in 2010.
New Roll Products. We have introduced a number of innovations to our roll cover and spreader roll products in recent years, including shoe press belts which utilize our expertise in polyurethane material and manufacturing technologies, composite calendar roll covers that use nanoparticle technology to improve roll cover durability and paper gloss, as well as covers that use an improved polyurethane to increase abrasion and moisture resistance as well as responsiveness and stability. We are evaluating new products, which will use different materials and utilize different sales channels and provide enhancements to our existing product line. In late 2008, we introduced SmartRoll™, the first continuous pressure sensing paper machine roll. SmartRoll™ enables the paper maker to maximize performance by qualitatively measuring the operating pressures of the paper machine while the machine is running. To date, customers have ordered 90 SmartRoll™ units and approximately 50% of those are already operational, confirming market acceptance.
In 2010, net sales to the paper-making industry accounted for approximately 93% of our total net sales in our roll covers segment. Paper producers accounted for approximately 81% of net sales, and paper-making machine manufacturers accounted for approximately 12% of net sales. Net sales for use in other industrial applications, including steel, plastics, leather and textiles manufacturing, accounted for the remaining 7% of our net sales in our roll covers segment.
Customers
We supply leading paper producers worldwide. Our top ten customers accounted for 22.7% of net sales in 2010 and individually, no customer accounted for more than 4.7% of 2010 net sales. In 2010, 36.1% of our net sales was in North America, 34.4% was in Europe, 10.0% was in South America, 17.3% was in Asia-Pacific and 2.2% was in the rest of the world. See Note 15 to the accompanying audited consolidated financial statements for geographic information related to net sales and long-lived assets.
10
Table of Contents
Competition
Our largest competitors are Albany International Corp. (a publicly-owned U.S. company), which supplies clothing products, Voith AG (a privately-owned German company) and Metso Corporation (a publicly-owned Finnish company), both of which supply both clothing and roll products. Voith and Metso are also the leading manufacturers of paper-making machines. In addition, we also face competition from smaller regional suppliers.
We compete primarily based on the value and price of our products. Competition with respect to both clothing and roll covers, particularly as it relates to our technologically advanced forming fabrics, press felts and roll covers, is based primarily on the value that the products deliver to the paper producer through the ability of such products to reduce production costs and improve paper quality.
Competition in the clothing and roll covers market is also based on a supplier’s ability to deliver engineering and technical services. Many paper producers have been reducing their in-house engineering and technical staff and increasingly expect their suppliers to provide such services. While smaller suppliers often lack the resources necessary to invest in and provide this level of engineering and technical service, we have made investments in order to provide the following services to the paper producers: specialist advice and resident engineers, installation support, on-call “trouble-shooting” and performance monitoring and analysis of paper-making machines.
In the roll covers market, competition is also based on a supplier’s proximity to the paper producer’s facilities, which affects the transportation time and expense associated with refurbishing or replacing a roll cover, and on the supplier’s ability to provide mechanical services to a roll’s internal mechanisms while the roll cover is being refurbished or replaced. We offer an extensive network of facilities throughout the world and provide mechanical services at ten locations.
Research and Development
Our continuing ability to deliver value depends on developing product innovations. As we create new and improved products we often obtain patent protection for our innovations, which is indicative of our technical capabilities and creativity. Although we do not consider any single patent to be material to our business, we believe that, in the aggregate, our patents and other intellectual property provide us with a competitive advantage. We currently have approximately 240 domestic and foreign patents outstanding and approximately 105 pending patent applications. Our patents and patent applications cover approximately 65 different inventions. Some of our competitors license our technology from us in exchange for royalty payments, although such licensing does not represent a material amount of our business.
11
Table of Contents
Production
Clothing Production Process
The following diagram represents the clothing production process.
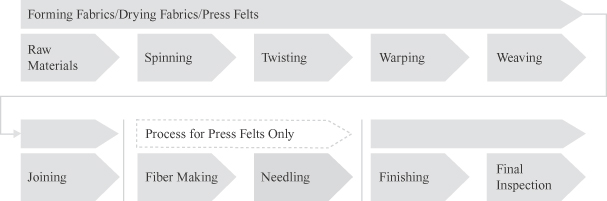
The clothing production process begins with the spinning of synthetic fiber threads to produce yarn, which is then twisted in preparation for the manufacturing of clothing. Yarn, which is sometimes purchased as a raw material, is then wound on large spools prior to installation on the loom. The yarn is drawn through needles in preparation for weaving.
With the yarn prepared for weaving, a weave pattern can be installed in the loom controller. The nature of the weave pattern is critical to how the clothing performs in the paper-making process. The yarn is then woven to the desired length.
Technological advancements have resulted in weaving becoming an almost entirely automated process. Following weaving, the two ends are permanently joined to form a continuous loop of clothing. Although significant automation has occurred in the joining process, it remains the most labor intensive of the clothing production process.
Press felts then undergo a process that is not necessary for forming and dryer fabrics. An additional layer of fibers is added to the outside surface with the use of an advanced needling machine, such that a very smooth felt surface is created.
All clothing then undergoes heat setting and chemical treating. Heat setting tightens the clothing giving it the necessary mechanical properties for the paper-making process. Finally, the clothing is meticulously inspected prior to being shipped to the customer.
12
Table of Contents
Roll Cover Production Process
The following diagram represents the roll covering production process.
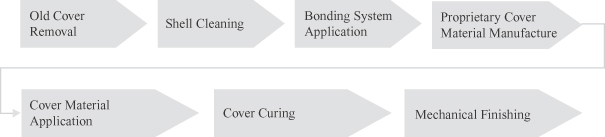
The covering on the rolls used in the paper-making process wear over time and must be periodically replaced for the roll to function properly. Rolls are removed from the paper-making machine and taken to an offsite facility for re-covering. During this time, a spare roll is placed in the machine to enable continuous operations.
The first step of the roll covering process is the removal of the old cover. A lathe and belt grinder are used to remove the old cover, exposing the roll shell. The shell is cleaned with a pressure washer and blasted with solid particles to increase the shell’s surface area for bonding of the new cover. Following the blasting process, the shell is ready to be re-covered.
The shell is then coated with proprietary bonding agents that affix the new roll cover to the shell. Each type of cover material is applied with a different process. Rubber and composite covers are extruded in a slow spinning lathe. Polyurethane covers are typically cast on the core using a mold, and ceramic covering is expelled onto the shell at high pressure.
Following application of the core material, the cover undergoes a curing process. Rubber covers are cured for 12 to 28 hours in vulcanizers under high temperature and pressure, whereas polyurethane and composite materials are cured in a hot air oven. After curing, the roll cover is ground with belts and grinding stones. A proprietary pattern of holes and grooves is then drilled into the cover to aid in water removal. Finally, the roll is balanced for proper spinning motion and meticulously checked for quality before being returned to the customer.
The roll cover production process is capital intensive and requires a variety of equipment, including lathes, belt grinders, polyurethane casting molds (for polyurethane roll covers), extruders, mix stations, vulcanizers, ovens and balancing equipment.
Environmental
Our operations and facilities are subject to a number of national, state and local laws and regulations protecting the environment and human health in the United States and foreign countries that govern, among other things, the handling, storage and disposal of hazardous materials, discharges of pollutants into the air and water and workplace safety. Because of our operations, the history of industrial uses at some of our facilities, the operations of predecessor owners or operators of some of the businesses, and the use and release of hazardous substances at these sites, the liability provisions of environmental laws may affect us.
We believe that any liability in excess of amounts provided in Note 12 to the Consolidated Financial Statements which may result from the resolution of such matters will not have a material adverse effect on the financial condition, liquidity or cash flow of the Company.
13
Table of Contents
Employees
As of December 31, 2010 we had 3,404 employees worldwide, of which 2,577 were manufacturing employees, 416 were sales and marketing employees, 96 were in research and development and 315 were administrative and other employees. As of December 31, 2010, 2,402, or 70.6%, of our employees are subject to protection as members of trade unions or various collective bargaining agreements, primarily outside of the United States. We believe that we have good relations with our employees’ trade unions and labor unions and we have not experienced any material labor disputes.
Our Corporate Information
We are subject to the information requirements of the Securities Exchange Act of 1934 (the “Exchange Act”). Therefore, we file periodic reports, proxy statements, and other information with the SEC. Such reports, proxy statements, and other information may be obtained by visiting the Public Reference Room of the SEC at 100 F Street, NE, Washington, DC 20549 or by calling the SEC at 1-800-SEC-0330. In addition, the SEC maintains an Internet site at http://www.sec.gov that contains reports, proxy and information statements, and other information regarding issuers that file electronically.
We maintain a website at www.xerium.com to provide information to the general public and our shareholders on our products and services, along with general information on Xerium. We make our periodic and current reports available, free of charge, on our web site as soon as reasonably practicable after these reports are filed with, or furnished to, the SEC. Our corporate code of business conduct and ethics, our corporate governance guidelines, and the charters of each of the Audit, Compensation, and Nominating and Corporate Governance Committees of our board of directors are also made available, free of charge, on our website. Our corporate code of business conduct and ethics, which includes our code of ethics, and related waivers (if any) are posted on our website. Copies of these documents may be obtained, free of charge, by writing Investor Relations, Xerium Technologies, Inc., 8537 Six Forks Road, Suite 300, Raleigh, North Carolina 27615, or telephoning us at 919-526-1444.
| ITEM 1A. | RISK FACTORS |
We may occasionally make forward-looking statements and estimates such as forecasts and projections of our future performance or statements of our plans and objectives. These forward-looking statements may be contained in, among other things, filings with the SEC, including this Annual Report on Form 10-K, press releases made by us and in oral statements made by our officers. Actual results could differ materially from those contained in such forward-looking statements. Important factors that could cause our actual results to differ from those contained in such forward-looking statements include, among other things, the risks described below.
Risks Relating to our Business and the Industry
A sustained downturn in the paper industry, compounded by uncertainty in global economic conditions, could adversely affect our net sales and profitability.
Historically, demand for our products has been driven primarily by the volume of paper produced on a worldwide basis. As a result, trends that affect the paper industry will impact our business and financial results.
The profitability of paper producers has historically been highly cyclical due to wide swings in the price of paper, driven to a high degree by the oversupply of paper during periods when paper producers have more aggregate capacity than the market requires. A sustained downturn in the paper industry, either globally or in a particular region, can cause paper manufacturers to reduce production or cease operations, which could adversely affect our net sales and profitability.
In response to significant changes in the sector, particularly in late 2008 and 2009, paper producers have continually sought to structurally improve the balance between the supply of and demand for paper. As part of these efforts, they have permanently shut down many paper-making machines or entire manufacturing facilities.
14
Table of Contents
Should papermakers continue to experience low levels of profitability, we would expect that further consolidation among papermakers, reducing the number of paper producers, and shutdowns of paper-making machines or facilities could occur in Europe and North America, until there is a better balance between supply and demand for paper and the profit levels of paper producers improve. This rebalancing had been accelerated during the most recent global economic recession.
Global paper production growth that does occur could be moderated by the level of industry consolidation and paper-machine shutdown activity that appears to be an underlying trend in North America and Western Europe. We believe that industry consolidation in both North America and Western Europe appears to have bottomed as market-related curtailment has abated. During 2010, global paper demand has increased and machine operating rates have escalated across most paper grades and geographic regions. However, we continue to see the trend that paper producers are focusing on cost reduction strategies and, as a result, are extending the life of roll covers and clothing products through additional maintenance cycles before replacing them. We anticipate that pricing pressure for our products will continue with the consolidation among paper producers and as the shift of paper production growth in Asia-Pacific develops.
We may be required to reorganize our operations in response to changing conditions in the paper industry, which may require significant expenditures and may not be successful.
In the past several years, we have undertaken various operational restructuring measures in response to changing market conditions in the paper industry triggered by the decline in paper prices that began in 2001. For example, between 2002 and 2010, we incurred costs of approximately $86 million in connection with our cost reduction programs including the closure of 14 manufacturing facilities worldwide.
In connection with any future plant closures, delays or failures in the transition of production from a closed facility to our other facilities could also adversely affect our financial performance. We may engage in additional cost reduction programs in the future. We may not recoup the costs of programs we have already initiated, or other programs we may in the future decide to engage in, the costs of which may be significant. In addition, our profitability may decline if our restructuring efforts do not sufficiently reduce our future costs while at the same time positioning us to maintain or increase our sales.
Fluctuations in currency exchange rates could adversely affect our net sales, profitability and compliance with our debt covenants.
Our foreign operations expose us to fluctuations in currency exchange rates and currency devaluations. We report our financial results in U.S. Dollars, but a substantial portion of our sales, expenses and debt are denominated in Euros and other currencies. As a result, changes in the relative values of U.S. Dollars, Euros and other currencies will affect our levels of net sales and profitability. Currency fluctuations, as they pertain to the Euro, generally have a greater effect on the level of our net sales due to the amount of business conducted in Euros. An increase in the U.S. Dollar against the Euro generally results in a decrease to net sales and net income. Increases in the U.S. Dollar against other currencies, such as the Brazilian Real, would not impact consolidated net sales as much, as a significant portion of sales in that country is significantly denominated in or indexed to U.S. Dollars, but generally would increase net income as local currency costs would be translated into lower U.S. Dollar expenses for financial reporting purposes. We would expect a similar but opposite effect in a period in which the value of the U.S. Dollar decreases against these currencies. Although in certain circumstances we attempt to hedge our exposure to fluctuations in currency exchange rates, our hedging strategies may not be effective. In addition, our Amended and Restated Credit Facility and Exit Facility (each defined in “Management’s Discussion and Analysis of Financial Condition and Results of Operations—Chapter 11 Filing, Emergence and Plan of Reorganization”) contain financial covenants that require us to maintain a minimum interest coverage ratio, a maximum leverage ratio and an annual limitation on capital expenditures. See “Management’s Discussion and Analysis of Financial Condition and Results of Operations—Credit Facilities”. Our ability to comply with these covenants will depend in part upon our reported financial results, which as indicated above, are directly affected by currency fluctuations. Since each of the financial ratio covenants in our
15
Table of Contents
credit facilities are calculated by reference to the amount of our Adjusted EBITDA, currency fluctuations alone could lower the amount of our Adjusted EBITDA and therefore affect our ability to remain in compliance with our financial ratio covenants. Our credit facilities provide that for the purposes of computing debt, which is a key component in the calculation of the leverage ratio, indebtedness which is payable in foreign currencies shall be converted into U.S. Dollars using the average exchange rate for the most recently ended four fiscal quarters for which our financial statements are available. For additional information about the risks associated with fluctuations in currency exchange rates, see “Management’s Discussion and Analysis of Financial Condition and Results of Operations—Foreign Exchange”.
Increased price competition in our industry could adversely affect our gross margins and net sales.
Historically, we and our competitors have been able to sell clothing and roll covers products and services at favorable prices that reflect the value they deliver to customers. This favorable pricing has been particularly available for our more technologically advanced products, such as forming fabrics, press felts and roll covers. In recent years, the financial health of our customers and continued pricing pressure from our competitors required us to reduce prices in some cases, and eliminate or decrease the size of proposed price increases in other cases, resulting in price decreases in both of our business segments. Further pricing pressure from our competitors may require further price decreases or make us unable to affect planned price increases and, thereby, adversely affect our profitability.
Our industry is competitive and our future success will depend on our ability to effectively develop and market competitive products.
The paper-making consumables industry is highly competitive. Some of our competitors are larger than us, have greater financial and other resources and are well-established as suppliers to the markets we serve. For example, while we are targeting expansion of our business in China, we face substantial competition from manufacturers already operating there that are more established and familiar with the Chinese marketplace. In addition, some of our competitors also manufacture paper-making machines and have the ability to initially package sales of their clothing and roll cover products with the sale of their machines and/or to tie the warranties on their machines to the use of their clothing and roll cover products. Our products may not be able to compete successfully with the products of our competitors, which could result in a loss of customers and, as a result, decreased net sales and profitability. We compete primarily based on the value our products deliver to our customers. Our value proposition is based on a combination of price and the technology and performance of our products, including the ability of our products to help reduce our customers’ production costs and increase the quality of the paper they produce. Our competitors could develop new technology or products that lead to a reduced demand for our products. In addition, our business depends on our customers regularly needing to replace the clothing and roll covers used on their paper-making machines. Either we or our competitors could develop new technologies that increase the useful life of clothing or roll covers, which could reduce the frequency with which our customers would need to replace their clothing and refurbish or replace their roll covers, and consequently lead to fewer sales.
Because we have substantial operations outside the United States, we are subject to the economic and political conditions of foreign nations.
We have manufacturing facilities in 14 foreign countries. In 2010, we sold products in approximately 67 countries other than the United States, which represented approximately 73.1% of our net sales. We operate in a number of foreign countries and may face challenges unique to those countries such as in hiring employees, our relations with various parties, including suppliers and governmental agencies, and in production. In the second quarter of 2010, we executed a memorandum of understanding with a Chinese paper machine clothing manufacturer which calls for us and the manufacturer to enter into discussions regarding a potential business collaboration, which, if fully implemented, could provide Xerium with in-country manufacturing capabilities within China.
16
Table of Contents
Furthermore, we may decide to do business in countries where we have not previously done business.
In such countries we face the additional uncertainty of entering a new market and its social customs, laws and practices. Should these challenges be realized, our operating results could be adversely impacted and our business or production may be delayed.
Our foreign operations are subject to a number of risks and uncertainties, including risks that:
| • | foreign governments may impose limitations on our ability to repatriate funds; |
| • | foreign governments may impose withholding or other taxes on remittances and other payments to us, or the amount of any such taxes may increase; |
| • | an outbreak or escalation of any insurrection or armed conflict may occur; |
| • | foreign governments may impose or increase investment barriers or other restrictions affecting our business; or |
| • | changes in tax policies of foreign governments may adversely affect our foreign subsidiaries. |
The occurrence of any of these conditions could disrupt our business in particular countries or regions of the world, or prevent us from conducting business in particular countries or regions, which could adversely affect our net sales and profitability. In addition, as a holding company we rely on dividends and other payments or distributions from our subsidiaries to meet our debt obligations. If foreign governments impose limitations on our ability to repatriate funds or impose or increase taxes on remittances or other payments to us, the amount of dividends and other distributions we receive from our subsidiaries could be reduced, which could reduce the amount of cash available to us to meet our debt obligations.
Our manufacturing facilities may be required to operate at or near capacity, which could negatively affect our production, customer order time, product quality and labor relations.
As part of our efforts to reduce our costs, we have attempted to reduce or eliminate excess manufacturing capacity through closure of certain of our manufacturing plants and consolidation of our production. As a result, however, from time to time our ability to meet customer demand for our products may rely on our ability to operate our remaining manufacturing facilities at or near capacity on an uninterrupted basis. Our manufacturing facilities are dependent on critical equipment, and operating such equipment at or near capacity for extended periods may result in increased equipment failures or other reliability problems, which may result in production shutdowns or periods of reduced production. Such disruptions could have an adverse effect on our operations and financial results. In addition, insufficient manufacturing capacity or other delays may cause our customer order times to increase and our product quality to decrease, which may increase warranty costs and negatively affect customer demand for our products and customer relations generally. Operating our facilities at or near capacity may also negatively affect relations with our employees, which could result in higher employee turnover, labor disputes and disruptions in our operations.
We must continue to innovate and improve our products to maintain our competitive advantage.
Our ability to retain our customers and increase our business depends on our ability to continually develop new, technologically superior products. We cannot assure that our investments in technological development will be sufficient, that we will be able to create and market new products, that such new products will be accepted by our customers or that we will be successful in competing against new technologies developed by competitors.
We believe that market recognition of the extended life of our roll cover products and the trend towards new paper-making machine designs which have fewer rolls will continue to negatively impact the demand for our roll cover products.
We have seen a trend that paper producers are placing an increasingly strong emphasis on maintenance cost reduction and, as a result, are extending the life of roll covers through additional maintenance cycles before replacing them. Market recognition of the extended life of our roll covers products negatively impacts the
17
Table of Contents
demand for these products. In addition, we have seen a trend towards new paper-making machine designs which have fewer rolls, also negatively impacting the demand for our roll cover products. If we are not able to offset these negative impacts on the demand for our roll cover products with growth from new roll cover products, the sale of roll cover products in regions which we believe have high growth potential such as China, or from other sources, the volume of our roll cover sales will be adversely affected.
The loss of our major customers could have a material adverse effect on our net sales and profitability.
Our top ten customers generated 22.7% of our net sales during 2010. The loss of one or more of our major customers, financial difficulties faced by our customers or a substantial decrease in such customers’ purchases from us, could have a material adverse effect on our net sales and profitability. Because we do not generally have binding long-term purchasing agreements with our customers, there can be no assurance that our existing customers will continue to purchase products from us.
We may fail to adequately protect our proprietary technology, which would allow competitors or others to take advantage of our research and development efforts.
We rely upon trade secrets, proprietary know-how, and continuing technological innovation to develop new products and remain competitive. If our competitors learn of our proprietary technology, they may use this information to produce products that are equivalent or superior to our products, which could reduce the net sales of our products. Our employees, consultants, and corporate collaborators may breach their obligations not to reveal our confidential information, and any remedies available to us may be insufficient to compensate our damages. Even in the absence of such breaches, our trade secrets and proprietary know-how may otherwise become known to our competitors, or be independently discovered by our competitors, which could adversely affect our competitive position.
Our success and ability to compete in the future may depend upon obtaining sufficient patent protection for proprietary technology.
Our patent applications may not result in issued patents, and even if they result in issued patents, the patents may not have claims of the scope we seek. Even in the event that these patents are not issued, the applications may become publicly available and proprietary information disclosed in the applications will become available to others. In addition, any issued patents may be challenged, invalidated or declared unenforceable. The term of any issued patent in the United States would be 20 years from its filing date, and if our applications are pending for a long time period, we may have a correspondingly shorter term for any patent that may be issued. Our present and future patents may provide only limited protection for our technology and may not be sufficient to provide competitive advantages to us. For example, competitors could be successful in challenging any issued patents or, alternatively, could develop similar or more advantageous technologies on their own or design around our patents. Also, patent protection in certain foreign countries may not be available or may be limited in scope and any patents obtained may not be as readily enforceable as in the United States, making it difficult for us to effectively protect our intellectual property from misuse or infringement by other companies in these countries. Our inability to obtain and enforce our intellectual property rights in some countries may harm our business. In addition, given the costs of obtaining patent protection, we may choose not to protect certain innovations that later turn out to be important.
We may be liable for product defects or other claims relating to our products.
Our products could be defective, fail to perform as designed or otherwise cause harm to our customers, their equipment or their products. If any of our products are defective, we may be required to recall the products and/or repair or replace them, which could result in substantial expenses and affect our profitability. Any problems with the performance of our products could harm our reputation, which could result in a loss of sales to customers and/or potential customers. In addition, if our customers believe that they have suffered harm caused
18
Table of Contents
by our products, they could bring claims against us that could result in significant liability. A failure of our products could cause substantial damage to a paper-making machine. Any claims brought against us by customers may result in:
| • | diversion of management’s time and attention; |
| • | expenditure of large amounts of cash on legal fees, expenses, and payment of damages; |
| • | decreased demand for our products and services; and |
| • | injury to our reputation. |
Our insurance may not sufficiently cover a large judgment against us or a large settlement payment, and is subject to customary deductibles, limits and exclusions.
We may be adversely affected if we fail to attract and retain key personnel.
Our future success depends on the continued contributions of our key senior management personnel, including Stephen R. Light, our President, Chief Executive Officer and Chairman. The loss of services of any of our key personnel might significantly delay or prevent the achievement of our business objectives and could cause us to incur additional costs to recruit replacements. Each member of our executive management team may terminate his or her employment at any time. We do not maintain “key person” life insurance with respect to any of our executives. As of December 31, 2010, Brian J. Fox is serving as our interim Chief Financial Officer and Chief Accounting Officer. While we continue to search for a permanent Chief Financial Officer, we can give no assurances as to when, or if, we will locate a suitable candidate, and we may be adversely affected if we are unable to identify a qualified permanent Chief Financial Officer in a timely manner.
We could incur substantial costs as a result of violations of or liabilities under laws protecting the environment and human health.
Our operations and facilities are subject to a number of national, state and local laws and regulations protecting the environment and human health in the United States and foreign countries that govern, among other things, the handling, storage and disposal of hazardous materials, discharges of pollutants into the air and water and workplace safety. The U.S. Federal Comprehensive Environmental Response, Compensation and Liability Act, as amended (“CERCLA”) provides for responses to, and, in some instances, joint and several liability for releases of hazardous substances into the environment. Environmental laws also hold current owners or operators of land or businesses liable for their own and for previous owners’ or operators’ releases of hazardous or toxic substances, materials or wastes, pollutants or contaminants, including petroleum and petroleum products. Because of our operations, the history of industrial uses at some of our facilities, the operations of predecessor owners or operators of some of the businesses, and the use and release of hazardous substances at these sites, the liability provisions of environmental laws may affect us. Many of our facilities have experienced some level of regulatory scrutiny in the past and are or may be subject to further regulatory inspections, future requests for investigation or liability for regulated materials management practices.
We cannot assure that we have been or will be at all times in complete compliance with all laws and regulations applicable to us which are designed to protect the environment and human health. We could incur substantial costs, including clean-up costs, fines and sanctions and third party property damage or personal injury claims, as a result of violations of or liabilities under environmental laws, relevant common law or the environmental permits required for our operations. While we believe that the current level of reserves is adequate, the adequacy of these reserves may change in the future due to new developments in particular matters.
Adverse labor relations could harm our operations and reduce our profitability.
As of December 31, 2010, we had 3,404 employees, approximately 36% of whom were subject to protection of various collective bargaining agreements and approximately 35% of whom were subject to job protection as members of trade unions, employee associations or workers’ councils. Approximately 55% of the employees
19
Table of Contents
subject to collective bargaining agreements (or approximately 33% of our total employees) were covered by collective bargaining agreements that expire prior to December 31, 2011. We cannot be certain that we will be able to renew such collective bargaining agreements, or enter into new collective bargaining agreements, which do not adversely affect our operating results and that we will be without production interruptions, including labor stoppages. In addition, approximately 77% of the employees subject to job protection as members of trade unions, employee associations or workers’ councils (or approximately 55% of our total employees) were subject to arrangements that expire prior to December 31, 2011. We cannot be certain that the terms of employment applicable to such employees will not change in a manner which adversely affects our operating results. We cannot be certain that we will not experience disruptions in our operations as a result of labor disputes or experience other labor relations issues. If we are unable to maintain good relations with our employees, our ability to produce our products and provide services to our customers could be reduced and/or our production costs could increase, either of which could disrupt our business and reduce our net sales and profitability.
Risks Relating to our Capital Structure
Our credit facilities contain restrictive debt covenants that limit our business flexibility by imposing operating and financial restrictions on our operations.
Our credit facilities impose significant operating and financial restrictions on our operations that may restrict our ability to pursue our business strategies. These restrictions prohibit or limit, among other things:
| • | the incurrence of additional indebtedness, the payment of cash dividends and the issuance of certain redeemable capital stock; |
| • | investments and acquisitions; |
| • | disposition of assets and subsidiary interests; |
| • | transactions with affiliates; |
| • | the creation of liens on our assets; |
| • | consolidations, mergers and transfers of all or substantially all of our assets; and |
| • | our ability to change the nature of our business. |
The objectives of our restructuring efforts may not be achieved.
Our reorganization was designed to improve our consolidated balance sheet and capital structure by decreasing our outstanding consolidated debt and significantly reducing our annual interest expense. However, these efforts may not be sufficient to enable us to improve our operating results. Although we recently reduced our debt obligations under the Plan of Reorganization, we continue to have a significant amount of debt. Our ability to satisfy our ongoing debt service obligations will depend on our ability to achieve our financial forecasts. These forecasts are based on certain assumptions regarding foreign currency exchange rates, demand for paper products, the level of paper production and inventories, the number of mills producing paper and the financial health and access to capital of the paper producers. Should these assumptions prove to be incorrect, our future financial forecasts may vary significantly from what we anticipated during our restructuring, jeopardizing our ability to satisfy our debt service obligations. Accordingly, we cannot assure you that we will be able to achieve our objectives with respect to the business restructuring strategy.
We will remain highly leveraged for the foreseeable future, which could impact our financing options, financial results and liquidity position.
Although we recently reduced our debt obligations under the Plan of Reorganization, we continue to have a significant amount of debt. As of December 31, 2010, our total amount of outstanding debt, on a consolidated basis, was $481.4 million. The degree to which we are leveraged on a consolidated basis could have important
20
Table of Contents
consequences to us, including that we may be more vulnerable to economic downturns, be limited in our flexibility to plan for and react to changes in our business or strategy. In addition, in the event that we seek to refinance our debt or require additional refinancing in the future, we may be unable to do so on attractive terms or at all.
We will continue to require a significant amount of cash, which may not be available to us, to service our debt and to fund our liquidity needs.
Our ability to make payments on, refinance or repay our debt, to fund planned capital expenditures or to expand our business will depend largely upon our future operating performance. Our future operating performance is dependent upon our ability to execute our business strategy successfully. Such performance is also subject to general economic, financial and competitive factors, as well as other factors that are beyond our control. There can be no assurance that our future operating performance will generate sufficient cash to support our cash requirements, or that we will not need to reduce capital expenditures or take other actions designed to conserve our cash in order to make payments required to service our indebtedness.
Required payments with respect to our indebtedness, including additional debt repayments based on fifty percent of our “excess cash”, as defined in the Amended and Restated Credit Facility and Exit Facility, will reduce the amount of funds available for other corporate purposes, which could harm our competitiveness and/or limit opportunities to grow our business.
Fluctuations in interest rates could adversely affect our liquidity, interest expense and financial results.
Our credit facilities have variable interest rates. To the extent that we do not enter into hedging arrangements that effectively fix the interest rate on a portion of our senior debt, the interest rate on all of the debt covered by our credit facilities will fluctuate based on LIBOR and other variable interest rates. To the extent these interest rates increase, our interest expense may increase, in which event, we may have difficulty making interest payments and funding our other costs and our ability to comply with the financial covenants in our credit facilities may be adversely affected. We terminated our outstanding interest rate swaps at December 31, 2009 and have not entered into any new interest rate swap agreements since that time. Consequently, our financial statements could be exposed to the effects of interest rate fluctuations, which could have a material impact on our results of operations. However, under the Amended and Restated Credit Facility, the CDOR Rate, the LIBOR Rate and the Euribor Rate are subject to a minimum base rate of 2.00% per annum, which is currently higher than the respective base rates, which were 1.24%, 0.30281% and 1.021% at December 31, 2010, respectively.
We do not anticipate paying a dividend on our common stock in the foreseeable future, which may adversely affect the market price of our common stock.
Our credit facilities prohibit the payment of dividends on our common stock. Accordingly, we do not anticipate paying dividends on our common stock for the foreseeable future. The lack of dividend payments may adversely affect the market price of our common stock.
The market price of our common stock has been volatile since our initial public offering and may continue to be volatile.
Shares of our common stock may continue to experience substantial price volatility, including significant decreases, in response to a number of events, including:
| • | sales of our common stock by principal stockholders; |
| • | our quarterly operating results; |
| • | issuances of our common stock; |
| • | future announcements concerning our business; |
21
Table of Contents
| • | our dividend policy; |
| • | the failure of securities analysts to cover our common stock and/or changes in financial estimates and recommendations by securities analysts; |
| • | actions of competitors; |
| • | fluctuations in foreign currency exchange rates; |
| • | changes in U.S. and foreign government regulation; |
| • | general market, economic and political conditions; and |
| • | natural disasters, terrorist attacks and acts of war. |
On December 31, 2010 the closing price of our common stock was $15.95 as compared with $15.20 as of December 31, 2009. During the twelve months ended December 31, 2010, the lowest closing price of our common stock was $9.40 and the highest closing price was $28.00. All share prices reflect the effective 20-to-1 reverse stock split that occurred on the Effective Date.
Some companies that have had volatile market prices for their securities have had securities class action lawsuits filed against them. Such lawsuits, should they be filed against us in the future, could result in substantial costs and a diversion of management’s attention and resources. This could have a material adverse effect on our business, results of operations and financial condition.
Certain shareholders have significant influence over our business and significant transactions.
On the Effective Date, by operation of the Plan, all of our common stock then outstanding, par value $0.01 (the “Old Common Stock”), was cancelled and approximately 82.6% of our new common stock, par value $0.001 (the “New Common Stock”) was issued to our lenders. Holders of our Old Common Stock were issued approximately 17.4% of the New Common Stock, along with warrants to purchase up to an additional 10% of the New Common Stock outstanding on the Effective Date on a fully diluted basis. Also pursuant to the Plan, a majority of the directors serving on our reconstituted Board of Directors were nominated by certain of our lenders, including American Securities LLC (together with its affiliates, “American Securities”) and Carl Marks Strategic Investments, L.P. (together with its affiliates, “Carl Marks”). We also entered into the Director Nomination Agreements on the Effective Date with certain of our lenders, including American Securities and Carl Marks, pursuant to which the applicable Nominating Lender(s) may designate one individual for nomination to our Board of Directors, so long as the Nominating Lender(s) continues to own at least 50% of the New Common Stock issued to such lender(s) on the Effective Date.
As of December 31, 2010, the total amount outstanding under our Amended and Restated Credit Facility was approximately $475.6 million, and Carl Marks held approximately 9.6% of the outstanding loans and commitments under our Amended and Restated Credit Facility. In addition, Carl Marks owns 10.0% of the outstanding shares of New Common Stock. Mr. Wilson, who is a general partner of Carl Marks Management Company is also a member of our Board of Directors. In addition, American Securities LLC holds 14.5% of the outstanding shares of New Common Stock and Mr. Saiontz, a member of our Board of Directors, is a managing director of American Securities LLC. As a result, Carl Marks and American Securities have a strong ability to influence our business, policies and affairs, and we cannot be certain that their interests will be consistent with the interests of other holders of common stock.
Anti-takeover provisions could make it more difficult for a third-party to acquire us.
We have adopted a stockholder rights plan and issued a dividend of one Right for each share of our common stock outstanding. Each Right entitles the registered holder to purchase from us one one-thousandth of a Preferred Share, at a price of $60.00 per one one-thousandth of a Preferred Share, subject to adjustment. Subject to limited exceptions, in the event a person (which includes affiliates and associates) acquires beneficial ownership of 15% or more of our common stock without prior approval of our Board of Directors, holders of the common stock, other than the acquirer, may exercise their Rights to purchase our common stock (or, in certain
22
Table of Contents
circumstances, Preferred Shares or other of our similar securities) having a value equal to two times the exercise price of the Right. Because the Rights may substantially dilute the stock ownership of a person or group attempting to take us over without the approval of our Board of Directors, our rights plan could make it more difficult for a third party to acquire us (or a significant percentage of our outstanding capital stock) without first negotiating with our Board of Directors regarding that acquisition.
In addition, our Board of Directors has the authority to issue up to 1 million shares of preferred stock (of which 20,000 shares have been designated as Series A Junior Participating Preferred Stock) and to determine the price, rights, preferences, privileges and restrictions, including voting rights, of those shares without any further vote or action by the stockholders.
The rights of the holders of our common stock may be subject to, and may be adversely affected by, the rights of the holders of any preferred stock that may be issued in the future. The issuance of preferred stock may have the effect of delaying, deterring or preventing a change in control of our company without further action by the stockholders and may adversely affect the voting and other rights of the holders of our common stock. Further, some provisions of our charter documents, including provisions eliminating the ability of stockholders to take action by written consent and limiting the ability of stockholders to raise matters at a meeting of stockholders without giving advance notice, may have the effect of delaying or preventing changes in control or management of our company, which could have an adverse effect on the market price of our stock. In addition, our charter documents do not permit cumulative voting, which may make it more difficult for a third party to gain control of our Board of Directors. Further, we are subject to the anti-takeover provisions of Section 203 of the Delaware General Corporation Law, which will prohibit us from engaging in a “business combination” with an “interested stockholder” for a period of three years after the date of the transaction in which the person became an interested stockholder, even if such combination is favored by a majority of stockholders, unless the business combination is approved in a prescribed manner. The application of Section 203 also could have the effect of delaying or preventing a change in control of our company.
| ITEM 1B. | UNRESOLVED STAFF COMMENTS |
Not applicable.
| ITEM 2. | PROPERTIES |
As of December 31, 2010, we operate 38 facilities, of which 31 are manufacturing facilities in 14 countries located in Argentina, Austria, Australia, Brazil, Canada, China, Finland, France, Germany, Italy, Japan, Mexico, Spain and the United States. Of the 31 manufacturing facilities that we operate, 11 are clothing manufacturing facilities, 18 are rolls manufacturing facilities and 2 are both clothing and rolls facilities. Almost all of our facilities are owned by us, rather than leased.
Excluded from the above property information is (i) one vacant former rolls manufacturing facility in Sherbrooke, Canada which was closed in the first quarter of 2009, and held for sale at December 31, 2010. We sold this property in January of 2011; and (ii) A vacant facility in Vietnam which is held for sale at December 31, 2010.
We also have license agreements with three licensees that manufacture our roll covers products at their facilities in Japan, South Korea and India. We have license agreements with one licensee that manufactures our clothing products in North America, various European countries and certain Pacific Rim countries.
| ITEM 3. | LEGAL PROCEEDINGS |
We are from time to time involved in various legal proceedings that arise in the ordinary course of our business. We believe that none of our pending litigation will, individually or in the aggregate, have a material adverse effect on our financial condition, cash flows or results of operations.
| ITEM 4. | (REMOVED AND RESERVED) |
23
Table of Contents
PART II
| ITEM 5. | MARKET FOR REGISTRANT’S COMMON EQUITY, RELATED STOCKHOLDER MATTERS AND ISSUER PURCHASES OF EQUITY SECURITIES |
Our common stock (the “Common Stock”) is quoted on the New York Stock Exchange under the symbol “XRM”. On March 2, 2011, there were approximately 62 stockholders of record of our Common Stock and the closing price of our Common Stock as reported by the New York Stock Exchange was $21.95 per share. The following table lists the high and low sales prices for our Common Stock within the two most recent fiscal years. All stock prices have been adjusted to reflect the effective 20 to 1 reverse stock split of our common stock on May 25, 2010.
| Period |
High | Low | ||||||
| 2010 |
||||||||
| Fourth quarter |
$ | 16.24 | $ | 12.32 | ||||
| Third quarter |
14.16 | 9.66 | ||||||
| Second quarter |
28.00 | 13.15 | ||||||
| First quarter |
20.00 | 9.40 | ||||||
| 2009 |
||||||||
| Fourth quarter |
$ | 27.20 | $ | 9.60 | ||||
| Third quarter |
35.60 | 16.40 | ||||||
| Second quarter |
44.00 | 11.20 | ||||||
| First quarter |
19.00 | 6.00 | ||||||
24
Table of Contents
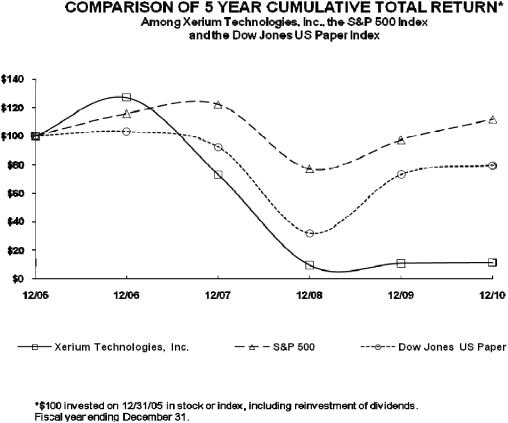
Our credit facility, as amended, prohibits our payment of dividends and accordingly, we made no such payments during the years ended December 31, 2009 and 2010.
25
Table of Contents
| ITEM 6. | SELECTED FINANCIAL DATA |
The following selected financial data should be read in conjunction with our financial statements and the related Notes to Consolidated Financial Statements. All per share amounts have been adjusted to reflect the effective 20-to-1 reverse stock split of our common stock on May 25, 2010
| Year ended December 31, | ||||||||||||||||||||
| 2010 | 2009 | 2008 | 2007 | 2006 | ||||||||||||||||
| (in thousands, except per share data) | ||||||||||||||||||||
| Statement of operations data: |
||||||||||||||||||||
| Net sales |
$ | 548,334 | $ | 500,091 | $ | 638,139 | $ | 615,426 | $ | 601,439 | ||||||||||
| Costs and expenses: |
||||||||||||||||||||
| Cost of products sold |
333,958 | 312,596 | 394,467 | 361,913 | 355,375 | |||||||||||||||
| Selling |
72,883 | 66,808 | 80,175 | 79,157 | 76,313 | |||||||||||||||
| General and administrative |
74,798 | 56,169 | 92,112 | 70,218 | 70,621 | |||||||||||||||
| Restructuring and impairments |
10,004 | 4,080 | 16,968 | 7,733 | 4,736 | |||||||||||||||
| Research and development |
11,427 | 11,309 | 11,740 | 10,189 | 9,878 | |||||||||||||||
| Goodwill impairment |
— | 80,600 | — | 185,300 | — | |||||||||||||||
| Curtailment/settlement gains |
— | — | (39,968 | ) | — | — | ||||||||||||||
| Total operating costs and expenses |
503,070 | 531,562 | 555,494 | 714,510 | 516,923 | |||||||||||||||
| Income (loss) from operations |
45,264 | (31,471 | ) | 82,645 | (99,084 | ) | 84,516 | |||||||||||||
| Other income (expense): |
||||||||||||||||||||
| Interest expense, net |
(56,795 | ) | (67,300 | ) | (58,504 | ) | (53,126 | ) | (40,016 | ) | ||||||||||
| Foreign exchange gain (loss) |
1,668 | (905 | ) | 6,356 | (347 | ) | (105 | ) | ||||||||||||
| Income (loss) before reorganization items and provision for income taxes |
(9,863 | ) | (99,676 | ) | 30,497 | (152,557 | ) | 44,395 | ||||||||||||
| Reorganization items |
(44,957 | ) | — | — | — | — | ||||||||||||||
| Income (loss) before provision for income taxes |
(54,820 | ) | (99,676 | ) | 30,497 | (152,557 | ) | 44,395 | ||||||||||||
| Provision (benefit) for income taxes |
18,266 | 12,317 | 3,901 | (2,345 | ) | 13,107 | ||||||||||||||
| Net income (loss) |
$ | (73,086 | ) | $ | (111,993 | ) | $ | 26,596 | $ | (150,212 | ) | $ | 31,288 | |||||||
| Net income (loss) per common share—basic |
$ | (7.29 | ) | $ | (45.80 | ) | $ | 11.60 | $ | (67.20 | ) | $ | 14.20 | |||||||
| Net income (loss) per common share—diluted |
$ | (7.29 | ) | $ | (45.80 | ) | $ | 11.60 | $ | (67.20 | ) | $ | 14.20 | |||||||
| Cash dividends per common share |
$ | — | $ | — | $ | — | $ | 11.25 | $ | 18.00 | ||||||||||
| Year ended December 31, | ||||||||||||||||||||
| 2010 | 2009 | 2008 | 2007 | 2006 | ||||||||||||||||
| Balance sheet data (at end of period): |
||||||||||||||||||||
| Unrestricted cash and cash equivalents |
$ | 38,701 | $ | 23,039 | $ | 34,733 | $ | 24,218 | $ | 16,816 | ||||||||||
| Total assets |
700,143 | 693,511 | 818,097 | 899,027 | 996,174 | |||||||||||||||
| Senior debt |
475,563 | 583,564 | 606,200 | 657,506 | 628,317 | |||||||||||||||
| Total debt |
481,361 | 640,121 | 616,957 | 666,801 | 639,060 | |||||||||||||||
| Total stockholders’ equity (deficit) |
18,735 | (119,657 | ) | (27,581 | ) | (1,052 | ) | 116,580 | ||||||||||||
| Cash flow data: |
||||||||||||||||||||
| Net cash provided by operating activities |
$ | 20,734 | $ | 16,131 | $ | 77,068 | $ | 89,020 | $ | 69,236 | ||||||||||
| Net cash used in investing activities |
(37,488 | ) | (14,171 | ) | (35,233 | ) | (57,200 | ) | (37,940 | ) | ||||||||||
| Net cash provided by (used in) financing activities |
32,626 | (14,630 | ) | (32,312 | ) | (27,237 | ) | (78,208 | ) | |||||||||||
| Other financial data: |
||||||||||||||||||||
| Depreciation and amortization |
$ | 41,281 | $ | 41,867 | $ | 45,928 | $ | 45,540 | $ | 45,392 | ||||||||||
| Capital expenditures |
27,928 | 19,532 | 39,028 | 47,859 | 32,456 | |||||||||||||||
26
Table of Contents
The following table presents our unaudited consolidated statements of operations data for each quarter in the two years ended December 31, 2010. The information for each of these quarters is unaudited, but has been prepared on the same basis as the audited consolidated financial statements appearing elsewhere in this Annual Report on Form 10-K. Certain prior period balances have been reclassified to conform with the current year presentation. We believe that all necessary adjustments, consisting only of normal recurring adjustments, have been made to present fairly the unaudited quarterly results when read in conjunction with our audited consolidated financial statements and the notes thereto appearing elsewhere in this document. These operating results are not necessarily indicative of the results of operations that may be expected for any future period. All per share amounts have been adjusted to reflect the effective 20-to-1 reverse stock split of our common stock on May 25, 2010
| For the Three Months Ended | ||||||||||||||||||||||||||||||||
| Dec. 31, 2010 |
Sept. 30, 2010 |
June 30, 2010 |
Mar 31, 2010 |
Dec. 31, 2009 |
Sept. 30, 2009 |
June 30, 2009 |
Mar 31, 2009 |
|||||||||||||||||||||||||
| (in thousands, except per share data) | ||||||||||||||||||||||||||||||||
| Statement of operations data: |
||||||||||||||||||||||||||||||||
| Net sales |
$ | 144,593 | $ | 135,899 | $ | 132,827 | $ | 135,015 | $ | 132,437 | $ | 130,308 | $ | 120,843 | $ | 116,503 | ||||||||||||||||
| Costs and expenses: |
||||||||||||||||||||||||||||||||
| Cost of products sold |
86,287 | 83,258 | 81,109 | 83,304 | 83,640 | 81,520 | 75,225 | 72,211 | ||||||||||||||||||||||||
| Selling |
18.897 | 18,043 | 17,901 | 18,042 | 17,234 | 16,991 | 16,075 | 16,508 | ||||||||||||||||||||||||
| General and administrative |
14,701 | 15,652 | 17,595 | 26,850 | 21,069 | 15,428 | 6,464 | 13,208 | ||||||||||||||||||||||||
| Restructuring and impairments |
2,571 | 3,322 | 2,544 | 1,567 | 1,186 | 1,754 | 1,026 | 114 | ||||||||||||||||||||||||
| Research and development |
2,720 | 2,887 | 2,952 | 2,868 | 3,141 | 2,708 | 2,740 | 2,720 | ||||||||||||||||||||||||
| Goodwill impairment |
— | — | — | — | 80,600 | — | — | — | ||||||||||||||||||||||||
| Total operating costs and expenses |
125,176 | 123,162 | 122,101 | 132,631 | 206,870 | 118,401 | 101,530 | 104,761 | ||||||||||||||||||||||||
| Income (loss) from operations |
19,417 | 12,737 | 10,726 | 2,384 | (74,433 | ) | 11,907 | 19,313 | 11,742 | |||||||||||||||||||||||
| Other income (expense): |
||||||||||||||||||||||||||||||||
| Interest expense, net |
(12,266 | ) | (12,020 | ) | (16,865 | ) | (15,644 | ) | (19,348 | ) | (16,425 | ) | (15,570 | ) | (15,957 | ) | ||||||||||||||||
| Foreign exchange gain (loss) |
932 | 744 | 370 | (378 | ) | (680 | ) | 561 | 555 | (1,341 | ) | |||||||||||||||||||||
| Income (loss) before reorganization items and provision for income taxes |
8,083 | 1,461 | (5,769 | ) | (13,638 | ) | (94,461 | ) | (3,957 | ) | 4,298 | (5,556 | ) | |||||||||||||||||||
| Reorganization items |
(583 | ) | (799 | ) | (29,192 | ) | (14,383 | ) | — | — | — | — | ||||||||||||||||||||
| Income (loss) before provision for income taxes |
7,500 | 662 | (34,961 | ) | (28,021 | ) | (94,461 | ) | (3,957 | ) | 4,298 | (5,556 | ) | |||||||||||||||||||
| Provision for income taxes |
6,762 | 4,318 | 5,050 | 2,136 | 2,304 | 3,424 | 2,697 | 3,892 | ||||||||||||||||||||||||
| Net income (loss) |
$ | 738 | $ | (3,656 | ) | $ | (40,011 | ) | $ | (30,157 | ) | $ | (96,765 | ) | $ | (7,381 | ) | $ | 1,601 | $ | (9,448 | ) | ||||||||||
| Net income (loss) per common share—basic |
$ | 0.05 | $ | (0.24 | ) | $ | (5.38 | ) | $ | (12.05 | ) | $ | (39.60 | ) | $ | (3.02 | ) | $ | 0.66 | $ | (3.87 | ) | ||||||||||
| Net income (loss) per common share—diluted |
$ | 0.05 | $ | (0.24 | ) | $ | (5.38 | ) | $ | (12.05 | ) | $ | (39.60 | ) | $ | (3.02 | ) | $ | 0.65 | $ | (3.87 | ) | ||||||||||
27
Table of Contents
| ITEM 7. | MANAGEMENT’S DISCUSSION AND ANALYSIS OF FINANCIAL CONDITION AND RESULTS OF OPERATIONS |
The following discussion should be read in conjunction with the section titled “Risk Factors,” the Consolidated Financial Statements and related Notes and other financial information appearing elsewhere in this Annual Report on Form 10-K.
Recent Developments
Global Economic Environment
Our operations are highly dependent upon the paper production industry and the degree to which the paper industry is affected by global economic conditions and the availability of credit.
Beginning in 2008 and continuing through most of 2009, the global paper industry experienced a sharp reduction in production levels, caused by the general slowdown in economic activity and related paper consumption during the same period and the paper manufacturers’ reducing excessive inventories. The slowdown of production was across most grades of paper production, but most notably in packaging and newsprint grades. For packaging grades, demand is directly related to broad manufacturing and transportation activity reduction, while newsprint demand has been declining over a number of years due to the greater prevalence of electronic media, exacerbated during the recession by a reduction in print advertising. One of the results of this recession driven reduction in demand for paper products was that the paper manufacturers dramatically and quickly reduced production through curtailments of machines and complete mill shutdowns. These curtailments, which began in late 2008, served to reduce inventories and match output with demand. By early 2010, most mills and equipment not permanently shuttered had resumed production.
In 2010, however, global paper and board production began to recover, particularly in developing countries. As international shipments of manufactured goods recovered, containerboard production recovered particularly strongly, contributing over 50% of the total global improvement, though the rate of recovery slowed somewhat during the second half of 2010. Going forward, we expect that global paper and board manufacturers’ operating rates will remain near their current high levels as capacity keeps pace with production, which may have a positive impact on the demand for some of our products. While there continues to be price pressure due to our competitors pursuing increased market share in 2010, as compared with 2009, we were successful in increasing our pricing levels in our roll covers segment and maintaining them relatively constant in our clothing segment.
Overview
We are a leading global manufacturer and supplier of two types of consumable products used primarily in the production of paper—clothing and roll covers. Our operations are strategically located in the major paper-producing regions of North America, Europe, South America and Asia-Pacific.
Our products play key roles in the formation and processing of paper along the length of a paper-making machine. Paper producers rely on our products and services to help improve the quality of their paper, differentiate their paper products, operate their paper-making machines more efficiently and reduce production costs. Our products and services typically represent only a small fraction of a paper producer’s overall production costs, yet they reduce costs by permitting the use of lower-cost raw materials and reducing energy consumption. Paper producers must replace clothing and refurbish or replace roll covers regularly as these products wear down during the paper production process. Our products are designed to withstand extreme temperature, chemical and pressure conditions, and are the result of a substantial investment in research and development and highly sophisticated manufacturing processes. We operate in two principal business segments: clothing and roll covers. In our clothing segment, we manufacture and sell highly engineered synthetic textile belts that transport paper as it is processed on a paper-making machine. Clothing plays a significant role in the forming, pressing and drying stages of paper production. Because paper-making processes and machine specifications vary widely, the clothing size, form, material and function is selected to fit each individual paper-making machine and process. In 2010, our clothing segment represented 66% of our net sales.
28
Table of Contents
Our roll cover products provide a surface with the mechanical properties necessary to process the paper sheet in a cost-effective manner that delivers the sheet qualities desired by the paper producer. Roll covers are tailored to each individual paper-making machine and process, using different materials, treatments and finishings. In addition to manufacturing and selling new roll covers, we also provide refurbishment services for previously installed roll covers and manufacture spreader rolls. Additionally, we provide various related products and services to our customers, both directly and through third party providers, as a growing part of our overall product offering through our roll covers sales channels. In 2010, our roll cover segment represented 34% of our net sales.
In 2010, net sales in other industrial applications outside of the paper industry, such as steel, plastics and textiles, accounted for approximately 11% and 7% of the net sales in our clothing segment and roll covers segment, respectively.
Industry Trends and Outlook
Historically, demand for our products has been driven primarily by the volume of paper produced on a worldwide basis. We expect the growth of global paper production from 2011 to 2014 to be between 3% and 4% per annum. Generally, and over time, we expect growth in paper production to be greater in Asia-Pacific, South America and Eastern Europe than in the more mature North American and Western European regions where demand may potentially decline. Between 2008, especially the latter part of the year, and 2009, the global paper industry experienced a sharp reduction in production levels, caused by the general slowdown in economic activity and related paper consumption during the same period. In 2010, however, global paper and board production began to recover from the economic recession and show growth, particularly in developing countries. We believe that our increase in net sales volume in 2010 as compared with 2009 reflects this ongoing recovery as well as the success of our new products
The profitability of paper producers has historically been highly cyclical due to wide swings in the price of paper, driven to a high degree by the oversupply of paper during periods when paper producers have more aggregate capacity than the market requires. A sustained downturn in the paper industry, either globally or in a particular region, can cause paper manufacturers to reduce production or cease operations, which could adversely affect our net sales and profitability. Since 2000, paper producers have taken actions that seek to structurally improve the balance between the supply of and demand for paper. As part of these efforts, they have permanently shut down many paper-making machines or entire manufacturing facilities. Papermakers continue to experience low levels of profitability, and we believe that further consolidation among papermakers, reducing the number of paper producers, and shutdowns of paper-making machines or facilities will occur in Europe and North America, until there is a better balance between supply and demand for paper and the profit levels of paper producers improve. This rebalancing has been accelerated during the current global economic recession. Over a number of years, consumption growth of paper, particularly in South America and Asia-Pacific, is expected to drive an increase in the global production rates required to maintain balance between supply and demand. It is highly likely, however, that a consumption slow-down and related effect on global paper production will continue in the near term, exacerbated by the recent global economic recession. Also affecting machine curtailments are structural productivity gains from improved products that we and our competitors supply.
Global paper production growth that does occur would be moderated by the level of industry consolidation and paper-machine shutdown activity that is a continuing underlying trend in North America and Western Europe. We also believe that, in addition to industry consolidation and paper machine shutdown activity in North America and Western Europe, the trend towards new paper machine designs which have fewer rolls and market recognition of extended life of our roll cover products has been and will continue to negatively impact demand for these products and that the volume potential for the roll covers business may slowly diminish, offset by our introduction of new products and increasing market share of proprietary products such as our SmartRoll™. Additionally, we are seeing a trend that paper producers are placing an increasing emphasis on maintenance cost reduction and, as a result, are extending the life of roll covers through additional maintenance cycles before replacing them.
29
Table of Contents
We anticipate that pricing pressure for our products will continue with the consolidation among paper producers and as the shift of paper production growth in Asia-Pacific develops. In response to this pricing pressure, we expect to increase our expenditure levels on research and development, and continue to enhance and deploy our value added selling approach as part of our strategy to differentiate our products, while at the same time we remain focused on cost reduction and efficiency programs. The negative paper industry trends described above are likely to continue. Though an economic recovery appears to be underway, we believe that the paper industry will experience increased emphasis on cost reduction, continued paper-machine shutdown activity, and reduced availability of credit than would have been the case in the absence of the economic downturn. These industry dynamics could negatively impact our business, results of operations and financial condition.
Net sales and Expenses
Net sales in both our clothing and roll covers segments are primarily driven by the following factors:
| • | The volume of worldwide paper production; |
| • | Advances in the technology of our products, which can provide value to our customers by improving the efficiency of paper-making machines and reduce our manufacturing costs; |
| • | Our ability to provide products and services which reduce paper-making machine downtime, while at the same time allowing the manufacture of high quality paper products; and |
| • | The impact of currency fluctuations. |
Net sales in our roll covers segment include our mechanical services business. We have expanded this business in response to demand from paper producers that we perform work on the internal mechanisms of a roll while we refurbish or replace a roll cover. In our clothing segment, a small portion of our business has been conducted pursuant to consignment arrangements under which we do not recognize a sale of a product to a customer until the customer places the product into use, which typically occurs some period after the product is shipped to the customer or to a warehouse location near the customer’s facility. We are striving to reduce the number of consignment arrangements and increase the use of standard terms of sale under which we recognize a sale upon product shipment. We expect this effort to be successful over the next several years.
Our operating costs are primarily driven by total sales volume, the impact of inflation, foreign currency fluctuations and the level and impact of cost reduction programs.
The level of our cost of products sold is primarily attributable to labor costs, raw material costs, product shipping costs, plant utilization and depreciation, with labor costs constituting the largest component. We invest in facilities and equipment that enable innovative product development and improve production efficiency and costs. Recent examples of capital spending for such purposes include faster weaving looms and seaming machines with accurate electronic controls, automated compound mixing equipment and computer-controlled lathes and mills.
The level of research and development spending is driven by market demand for technology enhancements, including both specific customer needs and general market requirements, as well as by our own analysis of applied technology opportunities. With the exception of purchases of equipment and similar capital items used in our research and development activities, all research and development is expensed as incurred. Research and development expenses were $11.4 million, $11.3 million and $11.7 million for the years ended December 31, 2010, 2009 and 2008, respectively.
Foreign Exchange
We have a geographically diverse customer base. In 2010, approximately 36% of our net sales was in North America, 34% was in Europe, 10% was in South America, 17% was in Asia-Pacific and 3% was in the rest of the world.
30
Table of Contents
A substantial portion of our net sales is denominated in Euros or other currencies. As a result, changes in the relative values of U.S. Dollars, Euros and other currencies affect our reported levels of net sales and profitability as the results are translated into U.S. Dollars for reporting purposes. In particular, increases in the value of the U.S. Dollar relative to the value of the Euro and these other currencies negatively impact our levels of revenue and profitability because the translation of a certain number of Euros or units of such other currencies into U.S. Dollars for financial reporting purposes will represent fewer U.S. Dollars.
For certain transactions, our net sales are denominated in U.S. Dollars but all or a substantial portion of the associated costs are denominated in a different currency. As a result, changes in the relative values of U.S. Dollars, Euros and other currencies can affect the level of the profitability of these transactions. The largest proportion of such transactions consist of transactions in which the net sales are denominated in or indexed to U.S. Dollars and all or a substantial portion of the associated costs are denominated in Euros, Reals or other currencies.
Currency fluctuations have a greater effect on the level of our net sales than on the level of our income (loss) from operations. For example, in 2010 as compared to 2009, the change in the value of the U.S. Dollar against most of the currencies we conduct our business in resulted in net currency decreases in net sales and income from operations of $2.8 million and $1.3 million, respectively. Although the 2010 results reflect a period in which the value of the U.S. Dollar increased against the Euro as compared to 2009, we would expect an opposite effect in a period in which the value of the U.S. Dollar decreases.
During 2010, we conducted business in 9 foreign currencies. The following table provides the average exchange rate in 2010 and 2009 of the U.S. Dollar against each of the four foreign currencies in which we conduct the largest portion of our operations.
| Currency |
Average exchange rate of the |
Average exchange rate of the | ||
| Euro |
$1.33 = 1 Euro | $1.39 = 1 Euro | ||
| Brazilian Real |
$0.57 = 1 Brazilian Real | $0.51 = 1 Brazilian Real | ||
| Canadian Dollar |
$0.97 = 1 Canadian Dollar | $0.88 = 1 Canadian Dollar | ||
| Australian Dollar |
$0.92 = 1 Australian Dollar | $0.79 = 1 Australian Dollar |
Over the last two years, approximately 40% of our operations have been conducted in Euros, approximately 9% in the Brazilian Real (although a significant portion of Brazil net sales are in US Dollars) and approximately 7% in the Canadian Dollar.
To mitigate the risk of transactions in which a sale is made in one currency and associated costs are denominated in a different currency, we utilize forward currency contracts in certain circumstances to lock in exchange rates with the objective that the gain or loss on the forward contracts will approximate the loss or gain that results from the transaction or transactions being hedged. We determine whether to enter into hedging arrangements based upon the size of the underlying transaction or transactions, an assessment of the risk of adverse movements in the applicable currencies and the availability of a cost effective hedge strategy. To the extent we do not engage in hedging or such hedging is not effective, changes in the relative value of currencies can affect our profitability.
Due to reduced credit limits at some of our banks, we have been entering into fewer foreign currency hedging arrangements than we had historically and may not be able to enter into as many hedging arrangements in the future. As a result, our financial statements are more exposed to the effects of currency fluctuations, both favorable and unfavorable, which could have a material impact on our results of operations.
Chapter 11 Filing, Emergence and Plan of Reorganization
We and certain of our subsidiaries filed voluntary petitions for relief under the Bankruptcy Code on March 30, 2010 in the Bankruptcy Court. On April 1, 2010, following approval by the Bankruptcy Court, we
31
Table of Contents
entered into a debtor-in-possession financing facility (the “DIP Facility”) consisting of a $20 million revolving credit facility and $60 million term loan. On May 12, 2010, the Bankruptcy Court held a hearing to consider confirmation of the Plan and entered the Confirmation Order confirming the Plan.
On the May 25, 2010 (“Effective Date”), the Plan became effective, at which time we emerged from chapter 11. On the Effective Date, the provisions of the Plan became binding on us, certain of our subsidiaries, any entity issuing securities under the Plan, any entity acquiring property under the Plan, and any creditor or equity interest holder of us and certain of our subsidiaries. Also on the Effective Date, except as otherwise provided in the Plan, the Confirmation Order discharged us from any and all debts, claims, and interests that arose before entry of the Confirmation Order and substituted for such debt, claims, and interests the obligations specified under the confirmed Plan. Pursuant to the Plan, all allowed general unsecured claims were unaffected by the chapter 11 case and were satisfied in full.
On May 18, 2010, prior to completing the restructuring, we were notified by the New York Stock Exchange (the “NYSE”) that we had regained compliance with NYSE’s 30-trading-day $1 minimum share price standard for continued listing of our common stock, and on June 29, 2010 we were notified that we had regained full compliance with all NYSE continued listing criteria. There can be no assurance that we will remain in compliance with the NYSE continued listing criteria in the future.
Additionally, as a result of the changes in ownership on the Effective Date, we are no longer considered a “Controlled Company” under Section 303A of the New York Stock Exchange Listed Company Manual.
Pursuant to the Plan, on the Effective Date:
| • | 20 million shares of our New Common Stock were authorized, of which an aggregate of 14,970,050 shares were issued and outstanding, as described below. In addition, 1,000,000 shares of preferred stock, par value $0.001, were authorized, of which 20,000 shares were designated as Series A Junior Participating Preferred Stock; |
| • | All of the shares of our Old Common Stock were cancelled and replaced with 2,566,150 shares of New Common Stock, which was equivalent to a 20 to 1 reverse split of our Old Common Stock; |
| • | The lenders under our pre-petition credit facility and the interest rate swap termination counterparties (collectively, the “Lenders”) received, among other things, their ratable shares of (a) $10 million in cash, (b) $410 million in principal amount of term notes, to be issued pursuant to the Amended and Restated Credit Facility (defined below), and (c) 12,403,900 shares of New Common Stock; |
| • | Holders of our Old Common Stock also received warrants to purchase an aggregate of 1,663,760 shares of New Common Stock (the “Warrants”), representing approximately 0.0324108 Warrants for each share of Old Common Stock. The Warrants are exercisable for a term of four years from the issue date at an exercise price of $19.55 per share of New Common Stock. The exercise price was determined in accordance with a formula based on the final amount of allowed claims of the Lenders; |
In addition, pursuant to the Plan, we entered into a number of material agreements and engaged in a series of transactions on the Effective Date, which are described below.
Amended and Restated Credit Facility and Exit Facility
Pursuant to the Plan, on the Effective Date, our existing senior credit facility was amended and restated as the Second Amended and Restated Credit and Guaranty Agreement (the “Amended and Restated Credit Facility”), dated as of May 25, 2010. Also on the Effective Date, the DIP Facility was converted into an exit facility consisting of a $20 million revolving credit facility and a $60 million term loan (collectively, the “Exit Facility”) that was used to satisfy our obligations under the Plan and for ongoing working capital (including letters of credit) requirements. As of December 31, 2010, costs of approximately $3.2 million related to the Exit
32
Table of Contents
Facility have been deferred to be amortized over the life of the facility. See “—Credit Facilities” for further discussion of these credit facilities.
Rights Agreement
Pursuant to the Plan, on the Effective Date, we issued a dividend of one preferred share purchase right (a “Right”) for each share of New Common Stock outstanding. Each Right entitles the registered holder to purchase from us one one-thousandth of a share of our Series A Junior Participating Preferred Stock, par value $0.001 per share (the “Preferred Shares”), at a price of $60.00 per one one-thousandth of a Preferred Share, subject to adjustment.
Subject to limited exceptions, in the event a person (which includes affiliates and associates) acquires beneficial ownership of 15% or more of New Common Stock without prior approval of our Board of Directors, holders of the New Common Stock, other than the acquirer, may exercise their Rights to purchase New Common Stock (or, in certain circumstances, Preferred Shares or other of our similar securities) having a value equal to two times the exercise price of the Right. Until such time as the Rights become exercisable, are redeemed or expire, the Rights will be attached to shares of New Common Stock and may be transferred with and only with shares of New Common Stock.
Registration Rights Agreement
Pursuant to the Plan, we entered into a Registration Rights Agreement (the “Registration Rights Agreement”) on the Effective Date with Apax WW Nominees Ltd, Apax-Xerium Apia L.P., AS Investors, LLC, Carl Marks Strategic Investments, L.P., and Carl Marks Strategic Opportunities Fund, L.P. (the “RRA Parties”). Pursuant to the Registration Rights Agreement, we agreed that commencing on the 90th day after the Effective Date, any of the RRA Parties or group of RRA Parties may request registration under the Securities Act of 1933, as amended (the “Securities Act”), of all or any portion of the New Common Stock held by such RRA Party on Form S-1 or Form S-3, as applicable. A RRA Party may not demand registration rights unless (A) the total offering price of the shares is reasonably expected to be at least $50 million (in the case of a Form S-1) or $20 million (in the case of a Form S-3) or (B) the shares to be registered represent at least 10% of the outstanding New Common Stock. In addition, the Registration Rights Agreement provides the RRA Parties with certain piggyback registration rights.
Director Nomination Agreements
Pursuant to the Plan, we entered into (i) a Director Nomination Agreement with AS Investors, LLC, and (ii) a Director Nomination Agreement with Carl Marks Strategic Investments, L.P. and Carl Marks Strategic Opportunities Fund, L.P. (both agreements together, the “Director Nomination Agreements,” and the lender parties thereto, the “Nominating Lenders”) on the Effective Date. Each of the Director Nomination Agreements provides that as long as the applicable Nominating Lender(s) is the beneficial owner of a number of shares of New Common Stock that is 50% or more of the number of shares distributed to such Nominating Lender(s) pursuant to the Plan (in such capacity, a “Continuing 50% Holder”), we will nominate for election to membership on our Board of Directors one individual designated by each such Continuing 50% Holder.
Reconstitution of Board of Directors
We reconstituted our Board of Directors pursuant to the Plan, which is now comprised of Stephen R. Light, Ambassador April H. Foley, Jay Gurandiano, John F. McGovern, Edward Paquette, Marc Saiontz and James F. Wilson.
2010 Equity Incentive Plan
Pursuant to the Plan, we adopted the 2010 Equity Incentive Plan (the “2010 Plan”) on the Effective Date. The 2010 Plan provides for the grant of awards consisting of any or a combination of stock options, stock appreciation rights, restricted stock, unrestricted stock or stock unit awards. The maximum number of shares that
33
Table of Contents
may be delivered under or in satisfaction of awards under the 2010 Plan is 463,525 shares of New Common Stock, provided, however, that to the extent that equity incentive awards granted prior to the Effective Date pursuant to our 2005 Equity Incentive Plan, as amended, or employment agreements with our senior management do not vest on or after the Effective Date in accordance with their terms, the number of shares of New Common Stock reserved pursuant to the Plan with respect to such unvested awards shall be added to the number of shares of New Common Stock that may be delivered under the 2010 Plan. The number of shares deliverable under the 2010 Plan is subject to adjustment in the case of stock dividends and other transactions affecting our New Common Stock.
Cost Reduction Programs
An important part of our strategy is to seek to reduce our overall costs and improve our competitiveness. As a part of this effort, we engage in cost reduction programs, which are designed to improve the cost structure of our global operations in response to changing market conditions. These cost reduction programs include headcount reductions throughout the world as well as plant closures that have rationalized production among our facilities to better enable us to meet customer demands.
Our cost reduction efforts between 2002 and 2010 included the closing of 14 manufacturing facilities. During this same period, our headcount was lowered by almost 800 individuals as a result of these actions.
In 2008, we charged a total of $17.0 million to restructuring and impairments expense related to the continual streamlining of our operating structure, the closing of our roll covers manufacturing facilities in Sherbrooke, Canada and Sweden, and our plan to cease production in Australia and to discontinue construction of our Vietnam facility.
In 2009, we charged a total of $4.1 million to restructuring and impairments expense related to the continual streamlining of our operating structure and asset impairments, partially offset by a gain on sale of our rolls manufacturing facility in Sweden.
We incurred restructuring expenses of approximately $10.0 million in the aggregate during 2010, primarily related to the North Bay, Ontario closure, the closure of a rolls plant in Germany, asset impairment charges in Vietnam and to headcount reductions resulting from the integration of the regional management structure in North America and Europe. We expect to continue to review our business to determine if additional actions can be taken to further improve our cost structure. We estimate restructuring expenses of approximately $1.0 to $2.0 million during 2011, primarily related to a continuation of streamlining our operating structure.
34
Table of Contents
Results of Operations
The tables that follow set forth for each of the three years in the period ended December 31, 2010, 2009 and 2008 certain consolidated operating results:
| Year ended December 31, | ||||||||||||
| 2010 | 2009 | 2008 | ||||||||||
| (in millions) | ||||||||||||
| Net sales |
$ | 548.3 | $ | 500.1 | $ | 638.1 | ||||||
| Cost of products sold |
334.0 | 312.6 | 394.4 | |||||||||
| Selling expenses |
72.8 | 66.8 | 80.2 | |||||||||
| General and administrative expenses |
74.8 | 56.2 | 92.1 | |||||||||
| Restructuring and impairments expenses |
10.0 | 4.1 | 17.0 | |||||||||
| Research and development expenses |
11.4 | 11.3 | 11.7 | |||||||||
| Goodwill impairment |
— | 80.6 | — | |||||||||
| Curtailment/settlement gains |
— | — | (40.0 | ) | ||||||||
| Income (loss) from operations |
45.3 | (31.5 | ) | 82.6 | ||||||||
| Interest expense, net |
(56.8 | ) | (67.3 | ) | (58.5 | ) | ||||||
| Foreign exchange gain (loss) |
1.7 | (0.9 | ) | 6.4 | ||||||||
| Income (loss) before reorganization items and provision for income taxes |
(9.8 | ) | (99.7 | ) | 30.5 | |||||||
| Reorganization items |
(45.0 | ) | — | — | ||||||||
| Income (loss) before provision for income taxes |
(54.8 | ) | (99.7 | ) | 30.5 | |||||||
| Provision for income taxes |
18.3 | 12.3 | 3.9 | |||||||||
| Net income (loss) |
$ | (73.1 | ) | $ | (112.0 | ) | $ | 26.6 | ||||
Year Ended December 31, 2010 Compared to Year Ended December 31, 2009.
Net Sales. Net sales for the year ended December 31, 2010 increased by $48.2 million, or 9.6%, to $548.3 million from $500.1 million for the year ended December 31, 2009. For the year ended December 31, 2010, approximately 66% of our net sales were in our clothing segment and approximately 34% were in our roll covers segment.
In our clothing segment, net sales for the year ended December 31, 2010 increased by $28.3 million, or 8.5%, to $359.7 million from $331.4 million for the year ended December 31, 2009 primarily due to higher sales volumes in Europe, North America, South America and Asia-Pacific partially offset by unfavorable currency effects of $0.6 million. Overall pricing levels in our clothing segment remained relatively constant during the years ended December 31, 2010 and 2009.
In our roll covers segment, net sales for the year ended December 31, 2010 increased by $19.9 million, or 11.8%, to $188.6 million from $168.7 million for the year ended December 31, 2009, primarily due to higher sales volumes in Europe, North America, South America and Asia-Pacific and an increase in overall pricing levels of approximately $1.3 million. These increases were partially offset by unfavorable currency effects of $2.1 million.
Cost of Products Sold. Cost of products sold for the year ended December 31, 2010 increased by $21.4 million, or 6.8%, to $334.0 million from $312.6 million for the year ended December 31, 2009.
In our clothing segment, cost of products sold increased by $12.8 million, or 6.3%, to $215.1 million for the year ended December 31, 2010 from $202.3 million for the year ended December 31, 2009 primarily due to approximately $9.1 million in higher sales volumes in Europe, North America, South America and Asia-Pacific during the year ended December 31, 2010 as compared with the year ended December 31, 2009 and to unfavorable currency effects of $2.3 million related to the translation of expenses made in foreign currencies to U.S. Dollars for financial reporting purposes.
35
Table of Contents
In our roll covers segment, cost of products sold increased by $8.6 million, or 7.8%, to $118.9 million for the year ended December 31, 2010 from $110.3 million for the year ended December 31, 2009. primarily due to approximately $10.1 million in higher sales volumes in Europe, North America, South America and Asia-Pacific during the year ended December 31, 2010 as compared with the year ended December 31, 2009 , offset by favorable currency effects of $1.3 million related to the translation of expenses made in foreign currencies to U.S. Dollars for financial reporting purposes.
Selling Expenses. For the year ended December 31, 2010, selling expenses increased by $6.0 million, or 9.0%, to $72.8 million from $66.8 million for the year ended December 31, 2009. The increase was primarily due to an increase of approximately $5.3 million related to increased headcount and salaries and higher sales commissions as a result of higher sales volumes during the year ended December 31, 2010 as compared with the year ended December 31, 2009 and unfavorable currency effects of $0.8 million related to the translation of expenses made in foreign currencies to U.S. Dollars for financial reporting purposes.
General and Administrative Expenses. For the year ended December 31, 2010, general and administrative expenses increased by $18.6 million, or 33.1%, to $74.8 million from $56.2 million for the year ended December 31, 2009. The increase was approximately half due to the result of gains recorded in 2009 that were absent in 2010 such as (i) a $3.4 million reversal that was recorded in 2009 for environmental expense related to remediation costs in Australia, (ii) a $2.3 million decrease that was recorded in 2009 in litigation accruals for Brazilian labor matters and other legal matters, and (iii) a $3.8 million decrease that was recorded in 2009 in provisions for doubtful accounts based on collections and lower reserves required for certain North American customers who had filed for bankruptcy. Additionally contributing to the increased expenses in 2010 as compared with 2009 were (i) increased financial restructuring costs of $1.2 million (These costs related to the amendment of our senior credit facility in effect prior to the Effective Date and were $9.9 million in 2010 and $8.7 million in 2009), (ii) increased stock based and management incentive compensation expenses of $6.7 million primarily related to an amendment to the terms of all performance-based restricted stock units outstanding on December 24, 2009 to vest upon our successful debt restructuring, which occurred on the May 12, 2010, the date our Plan was confirmed by the Bankruptcy Court, and to the management incentive program approved in the third quarter of 2010, and (iii) increased payroll related costs of $1.6 million due to our resumption of the employer match on our 401(k) plan effective the beginning of 2010. Currency translation effects related to the translation of expenses made in currencies other than the U.S. Dollar to U.S. Dollars for financial reporting purposes remained relatively constant from 2009 to 2010.
Restructuring Expenses. For the year ended December 31, 2010, restructuring expenses increased by $5.9 million, or 144.0%, to $10.0 million from $4.1 million for the year ended December 31, 2009, primarily due to the closure of our roll covers facility in North Bay, Ontario, the closure of one rolls plant in Germany, the closure of our Massachusetts office and an asset impairment related to our Vietnam facility. For the most part, restructuring expenses resulted from our long-term strategy to reduce costs and improve long-term competitiveness as described above under “Cost Reduction Programs” by closing and/or transferring production from certain of our manufacturing facilities and through headcount reductions. For the year ended December 31, 2010, restructuring expenses consisted of severance costs, facility costs and asset impairments of $4.7 million, $2.5 million and $2.8 million, respectively.
Goodwill Impairment. There was no goodwill impairment recorded during the year ended December 31, 2010. As of December 31, 2009, we recorded a non-cash charge for goodwill impairment of $80.6 million related to our roll covers segment based on assessments performed at that date. In accordance with ASC Topic 350, Intangibles—Goodwill and other Intangible Assets (“Topic 350”) we are required to test goodwill at least annually for impairment, which we do each year at December 31. Applying the guidance in Topic 350, we determined that as of December 31, 2009, goodwill for the roll covers segment was impaired primarily due to the adverse effect of our credit issues and the effects of the current global economic environment.
Interest Expense, Net. Net interest expense for the year ended December 31, 2010 decreased by $10.5 million, or 15.6%, to $56.8 million from $67.3 million for the year ended December 31, 2009. The decrease is
36
Table of Contents
primarily attributable to the termination of all of our interest rate swaps on December 31, 2009, which carried fixed interest rates that were higher than variable interest rates and to lower interest expense due to lower debt balances under the Amended and Restated Credit Facility. Partially offsetting the decreases is $9.7 million during the year ended December 31, 2010 as compared with $3.8 million during the year ended December 31, 2009 from accumulated other comprehensive income to interest expense. These amounts represent the mark to market changes in the swaps in 2009 and the amortization in 2010 of the balance remaining in other comprehensive income relating to these swaps.
Foreign Exchange Gain/(Loss). For the year ended December 31, 2010, we had a foreign exchange gain of $1.7 million compared to a $(0.9) million loss for the year ended December 31, 2009. Foreign exchange gains and losses were primarily the result of hedging and intercompany activities.
Reorganization Items. Reorganization items are presented separately in our consolidated statements of operations for the year ended December 31, 2010 and represent expenses that we have identified as directly relating to our chapter 11 proceedings which took place in the early part of 2010. Reorganization items of $45.0 million consisted of legal and professional fees of $16.3 million, a loss on the extinguishment of debt of $14.4 million and the write-off of deferred financing costs of $14.3 million related to the pre-petition senior credit facility.
Provision for Income Taxes. For the year ended December 31, 2010 and 2009, the provision for income taxes was $18.3 million and $12.3 million, respectively. Certain of our foreign and U.S. subsidiaries incurred losses during the years ended December 31, 2010 and 2009, for which no benefit was recognized due to established valuation allowances on deferred tax assets. We recorded income tax expense for 2010, even though we had a consolidated pre-tax loss, principally due to (i) losses that were incurred domestically and in certain foreign jurisdictions for which no corresponding tax benefit was recognized as the net operating losses that were created for tax purposes in these jurisdictions were fully reserved for book purposes, (ii) the establishment of uncertain tax reserves for certain of our foreign historical tax positions including the $3.9 million impairment of a German deferred tax asset that we believe to be subject to possible forfeiture, based on a recent tax ruling with respect to a previously available restructuring exemption, and (iii) the disallowance of certain deductions for costs incurred as part of our reorganization. We recorded income tax expense for 2009, even though we had a consolidated pre-tax loss, principally due to (i) losses that were incurred domestically and in certain foreign jurisdictions for which no corresponding tax benefit was recognized as the net operating losses that were created for tax purposes in these jurisdictions were fully reserved for book purposes, (ii) goodwill impairment recorded domestically and in certain foreign jurisdictions for which no corresponding tax benefit was recognized and (iii) the establishment in 2009 of valuation allowances in Canada, China and the United Kingdom.
Year Ended December 31, 2009 Compared to Year Ended December 31, 2008.
Net Sales. Net sales for 2009 decreased by $138.0 million, or 21.7%, to $500.1 million from $638.1 million for 2008. In 2009, 66% of our net sales was in our clothing segment and 34% was in our roll cover segment.
In our clothing segment, net sales for 2009 decreased by $81.8 million, or 19.8%, to $331.4 million from $413.2 million for 2008 primarily due to (i) decreased sales volume primarily in North America and Europe and (ii) unfavorable currency effects on net sales of $18.8 million related to the translation of net sales made in currencies other than the U.S. Dollar to U.S. Dollars for financial reporting purposes. The decrease was partially offset by $6.6 million of favorable currency effects on pricing related to net sales prices indexed in U.S. Dollars by certain non-U.S. operations. Overall pricing levels in our clothing segment decreased 1.6% during 2009 as compared with 2008.
In our roll covers segment, net sales for 2009 decreased by $56.2 million, or 25.0%, to $168.7 million from $224.9 million for 2008 primarily due to (i) decreased sales volumes primarily in North America and Europe, (ii) unfavorable currency effects on net sales of $7.2 million related to the translation of net sales made in currencies other than the U.S. Dollar to U.S. Dollars for financial reporting purposes. Overall pricing levels in our roll covers segment increased slightly less than 1% during 2009 as compared with 2008.
37
Table of Contents
Cost of Products Sold. Cost of products sold for 2009 decreased by $81.8 million, or 20.7%, to $312.6 million from $394.4 million for 2008.
In our clothing segment, cost of products sold for 2009 decreased by $51.4 million, or 20.3%, to $202.3 million from $253.7 million for 2008. The decrease was primarily due to (i) lower sales volumes during 2009 as compared with 2008, (ii) the absence in 2009 of the increased provision for slow-moving and obsolete inventory of $8.5 million that was recorded in 2008, (iii) favorable currency effects of $11.0 million related to the translation of expenses made in currencies other than the U.S. Dollar to U.S. Dollars for financial reporting purposes and (iv) the $6.5 million impact of a lower cost structure, resulting from our cost reduction programs, during 2009 as compared with 2008.
In our roll covers segment, cost of products sold for 2009 decreased by $30.3 million, or 21.5%, to $110.3 million from $140.7 million for 2008 primarily due to (i) lower sales volumes during 2009 as compared with 2008, (ii) favorable currency effects of $4.4 million related to the translation of expenses made in currencies other than the U.S. Dollar to U.S. Dollars for financial reporting purposes, (iii) the absence in 2009 of the increased provision for slow-moving and obsolete inventory of $2.1 million that was recorded in 2008 and (iv) the $3.8 million impact of a lower cost structure, resulting from our cost reduction programs, during 2009 as compared with 2008.
Selling Expenses. For 2009, selling expenses decreased by $13.4 million, or 16.7%, to $66.8 million from $80.2 million for 2008. The decrease was primarily due to the impact of (i) a reduction in salaried sales positions, commissions and travel expenses, (ii) favorable currency effects of $3.6 million related to the translation of expenses made in currencies other than the U.S. Dollar to U.S. Dollars for financial reporting purposes during 2009 as compared with 2008 and (iii) the $1.6 million impact of a lower cost structure, resulting from our cost reduction programs, during 2009 as compared with 2008.
General and Administrative Expenses. For 2009, general and administrative expenses decreased by $35.9 million, or 39.0%, to $56.2 million from $92.1 million for 2008. The decrease was primarily due to (i) decreased provisions for bad debts of approximately $18.5 million, principally due to an $11.8 million increase in 2008 approximately half of which related to two of our customers, who represented approximately 5% of our net sales, having had financial difficulties in 2008, (ii) a decrease in environmental expense of $7.5 million as a result of (a) accruals of $4.1 million related to the environmental matter in Australia recorded in 2008 that were absent in 2009 and (b) a Phase II assessment during the second quarter of 2009 that indicated that remediation costs in Australia would be significantly less than originally estimated, resulting in the reversal of $3.4 million of accruals in the second quarter of 2009, (iii) favorable currency translation effects of $2.2 million (iv) a decrease in litigation accruals of $2.3 million for Brazilian labor matters and other legal matters, (v) a decrease in incentive compensation and stock-based compensation expense of $4.3 million, (vi) decreased salaries, travel and other costs as a result of cost reduction efforts during 2009 as compared with 2008 and (vii) the $0.2 million impact of a lower cost structure, resulting from our cost reduction programs, during 2009 as compared with 2008. Partially offsetting these decreases were increased consulting, legal and bank fees of $3.3 million in 2009 as compared with 2008 that were incurred related to initiatives undertaken to resolve our credit issues, which fees were $8.7 million in 2009 as compared with $5.4 million in 2008 and (ii) decreased gains on sales of property and equipment of $2.3 million during 2009 as compared with 2008.
Restructuring and Impairments Expenses. For 2009, restructuring and impairments expenses decreased by $12.9 million to $4.1 million from $17.0 million for 2008. Restructuring and impairments expenses result from our long-term strategy to reduce costs and improve long-term competitiveness as described above under “Cost Reduction Programs” by closing and/or transferring production from certain of our manufacturing facilities and through headcount reductions. For 2009, restructuring expenses consisted of severance and asset impairment costs of $3.6 million and $1.7 million, respectively, partially offset by the $1.2 million gain on the sale of our Swedish roll covers facility on March 31, 2009. Unfavorable currency translation effects of $1.7 million partially offset the decreased expenses in 2009 as compared with 2008. For 2008 restructuring and impairments expenses
38
Table of Contents
consisted of severance, facility and asset impairment costs of $8.8 million, $4.2 million, and $4.0 million, respectively.
Research and Development Expenses. For 2009, research and development expenses decreased by $0.4 million, or 3.4%, to $11.3 million from $11.7 million for 2008 primarily due to $0.3 million of favorable currency effects during 2009 as compared with 2009.
Goodwill Impairment. As of December 31, 2009, we recorded a non-cash charge for goodwill impairment of $80.6 million related to our roll covers segment based on assessments performed at that date. In accordance with Topic 350, we are required to test goodwill at least annually for impairment, which we do each year at December 31. Applying the guidance in Topic 350, we determined that as of December 31, 2009, goodwill for the roll covers segment was impaired primarily due to the adverse effect of our credit issues and the effects of the current global economic environment. There was no goodwill impairment recorded during the year ended December 31, 2008.
Interest Expense, Net. Net interest expense for 2009 increased by $8.8 million, or 15.0%, to $67.3 million from $58.5 million for 2008. The increase is primarily attributable to (i) increased interest rates during 2009 as compared with 2008 as a result of (a) the amendment of our senior credit facility on May 30, 2008, (b) our entering into the Waiver Agreement on September 29, 2009, and subsequently, into Waiver Agreement No. 2 on December 14, 2009, that required an interest rate that is 1.0% in excess of the non-default rate otherwise payable during the fourth quarter of 2009 and (c) the $5.5 million increase to interest expense in 2009 as compared with 2008 in connection with the change in the fair value of our interest rate swaps. In 2009, the ineffective portion of the mark to market change on two of our interest rate swap hedges has been charged to interest expense and, effective September 1, 2009, we lost hedge accounting for all of our interest rate swaps and recorded the mark to market change in their fair value of $2.8 million as a charge to interest expense. During 2008, the swaps did not qualify for hedge accounting for the first half of the year, which resulted in a credit to interest expense for the change in their fair value for the first six months of 2008. These increases were partially offset by favorable currency effects of $1.3 million.
Foreign Exchange Gain (Loss). For 2009, we had a foreign exchange loss of $0.9 million compared to a foreign exchange gain of $6.4 million for 2008. The gain in 2008 was primarily attributable to mark-to-market gains on fair value hedges, including gains on hedges for which the underlying foreign exchange exposure on certain intercompany debt no longer existed in the first quarter of 2008, and gains on hedges on future purchases of equipment. The net foreign exchange loss during 2009 was primarily the result of hedging and intercompany activity.
Provision for Income Taxes. For 2009 and 2008, the provision for income taxes was $12.3 million and $3.9 million, respectively. The increase in tax was principally due to (i) losses that were incurred domestically and in certain foreign jurisdictions for which no corresponding tax benefit was recognized as the net operating losses that were created for tax purposes in these jurisdictions were fully reserved for book purposes, and (ii) the establishment in 2009 of a deferred tax asset valuation allowance of $2.7 million in Canada, $0.2 million in China and $0.2 million in the United Kingdom and (iii) curtailment/settlement gains recorded in 2008 relating to the U.S. retiree plans of $40.2 million for which no taxes were reflected due to the U.S. deferred tax asset valuation allowance.
Liquidity and Capital Resources
Our principal liquidity requirements are for debt service, working capital and capital expenditures. We plan to use unrestricted cash on hand, cash generated by operations and, should it become necessary, access our revolving credit facility and local credit lines, as primary sources of liquidity. Our operations are highly dependent upon the paper production industry and the degree to which the paper industry is affected by global economic conditions and the availability of credit. Demand for our products could decline if paper manufacturers
39
Table of Contents
are unable to obtain required financing or future market conditions cause additional mill closures or inventory build-up. These factors could impact our liquidity and our ability to satisfy the covenant requirements of our credit facility.
In late 2009 and early 2010, our liquidity and capital resources were constrained by our non-compliance with the terms of our pre-petition credit facility and subsequent prepackaged chapter 11 proceedings. As previously disclosed, prior to the filing of our chapter 11 petitions on March 30, 2010, we were not in compliance with certain of the financial covenants under our pre-petition credit facility for the quarters ended September 30, 2009 and December 31, 2009. From September 29, 2009, waiver fees were paid to the lenders and the outstanding balance under the pre-petition credit facility bore interest at a rate that was 1.0% per year in excess of the non-default rate otherwise payable during that period under the facility. On March 30, 2010, we and certain of our certain of our subsidiaries filed for chapter 11 protection. See “—Chapter 11 Filing, Emergence and Plan of Reorganization” for further information regarding our chapter 11 proceedings. Upon our emergence from chapter 11 on May 25, 2010, our Amended and Restated Credit Facility and Exit Facility replaced our pre-petition credit facility. See “—Credit Facilities” for further discussion of our current credit facilities.
Net cash provided by operating activities was $20.7 million for the year ended December 31, 2010 and $16.1 million for the year ended December 31, 2009. The $4.6 million increase is primarily due to an increase in net income adjusted for non-cash items during the year ended December 31, 2010. The increase in 2010 was after a reduction of cash reorganization items of approximately $16.2 million. Net cash provided by operating activities was $16.1 million for the year ended December 31, 2009 and $77.1 million for the year ended December 31, 2008. The $61.0 million decrease in 2009 as compared with 2008 is principally attributable to a decrease in the volume of business as a result of the global economic recession and an increase in working capital during 2009 as compared with 2008 principally due to the level of payment of payables and accruals during 2009. We typically defer payments to certain vendors at the end of each quarter, which results in an increased cash position at the end of the quarter and increased net cash from operating activities for the period then ended. Such deferrals were significant at December 31, 2008 and the reduction of such deferrals at December 31, 2009 contributed to the increase in working capital for the year. In an effort to improve working capital, in the second quarter of 2009, we initiated a project to accelerate accounts receivable collections and to sell excess inventories. As of December 31, 2009, our efforts under this project contributed approximately $6 million in additional cash and increased Adjusted EBITDA by approximately $7 million.
Net cash used in investing activities was $37.5 million for the year ended December 31, 2010 and $14.2 million for the year ended December 31, 2009. The increase of $23.3 million was primarily due to $13.7 million of restricted cash that we are required to have as collateral for letters of credit under the Amended and Restated Credit Facility in 2010 and a $8.4 million increase in capital equipment expenditures during the year ended December 31, 2010 as compared with the year ended December 31, 2009. Net cash used in investing activities was $14.2 million for the year ended December 31, 2009 and $35.2 million for the year ended December 31, 2008. The decrease of $21.0 million in 2009 as compared with 2008 was primarily due to a decrease in capital equipment spending of $19.5 million in 2009 as compared with 2008.
Net cash provided by financing activities was $32.6 million for the year ended December 31, 2010 and net cash used in financing activities was $14.7 million for the year ended December 31, 2009. The fluctuation of $47.3 million was primarily the result of (i) borrowings under our DIP Facility of $60.0 million during the year ended December 31, 2010 and (ii) lower debt payments of approximately $22.7 million during the year ended December 31, 2010 as compared to the same period in 2009, primarily due to a mandatory principal prepayment of $19.2 million in 2009 based on the excess cash calculation as defined in the pre-petition credit agreement. No such payment was required in 2010. Partially offsetting this increase in cash provided by financing activities was borrowings of $28.0 million under our pre-petition revolver during 2009 and $8.2 million of expenses related to initiatives undertaken to resolve our credit issues during the year ended December 31, 2010. Net cash used in financing activities was $14.7 million for the year ended December 31, 2009 and $32.3 million for the year ended December 31, 2008. The decrease of $17.6 million in 2009 as compared with 2008 was primarily the result of
40
Table of Contents
(i) borrowings under our revolver of $28.0 million during the first quarter of 2009, and (ii) the decrease in other financing activities of $7.3 million in 2009 as compared with 2008 related to expenses associated with initiatives undertaken to resolve our credit issues. These decreases were partially offset by higher net debt payments of approximately $17.6 million during 2009 as compared with 2008. We made mandatory principal repayments of $19.2 million during 2009 (for 2008) as compared with $9.4 million during 2008 (for 2007). The increase in the mandatory payment was due to our prior senior credit facility requiring us to make such excess payments based on the prior year’s Adjusted EBITDA, which was impacted during 2008 by gains of approximately $52 million related to the freezing of one of our U.S. pension plans, the termination of our U.S. retiree medical plan and the mark to market changes in the fair value of our interest rate swaps, partially offset by approximately $30 million related to increased restructuring expenses and increased non-cash reserves. Because none of these events generated any cash but increased Adjusted EBITDA which increased the mandatory principal payment, the effect of these actions reduced our available cash. We also made a voluntary debt repayment of $6.1 million during 2008 and none in 2009 and 2010.
As of December 31, 2010, there was a $475.6 million balance of term loans outstanding under our senior credit facility, after making the first two scheduled quarterly payments of $2.2 million in the third and fourth quarters of 2010. The loans included $59.7 million under our first lien facility and $415.9 million under a second lien facility. In addition, as of December 31, 2010, we had no outstanding borrowings under our current revolving lines of credit, including the revolving credit facility under our senior credit facility and lines of credit in various foreign countries that are used to facilitate local short-term operating needs. An aggregate of $26.0 million is available for additional borrowings under these revolving lines of credit. We had unrestricted cash and cash equivalents of $38.7 million at December 31, 2010 compared to $23.0 million at December 31, 2009. At December 31, 2010 we also had $13.7 million of restricted cash which is classified as a current asset. The restricted cash serves as collateral for letters of credit and no letter of credit has a maturity greater than one year, although certain of them can be renewed for another year. The cash collateral is held in custody by the issuing bank, is restricted as to withdrawal or use and is currently invested in money market funds. Income from these funds is paid to us.
Based on current facts and assumptions, we expect our cash tax payments to be less than income tax expense in 2011, 2012 and 2013 due to the creation of certain deferred tax liabilities and the continued availability of tax loss carry forwards.
Capital Expenditures
We use the term “capital expenditures” to refer to costs incurred to purchase or significantly upgrade property and equipment. The majority of our capital expenditures relate to purchases of machinery and equipment used in the manufacturing of our products. Capital expenditures were funded from net cash provided by operating activities and borrowings under our credit facility.
During 2010, we had capital expenditures of $27.9 million consisting of growth capital expenditures of $7.3 million and maintenance capital expenditures of $20.6 million. Growth capital expenditures consist of items that are intended to increase the manufacturing, production and/or distribution capacity or efficiencies of our operations in conjunction with the execution of our business strategies. Maintenance capital expenditures are designed to sustain the current capacity or efficiency of our operations and include items relating to the renovation of existing manufacturing or service facilities, the purchase of machinery and equipment for safety and environmental needs and information technology.
During 2009, we had capital expenditures of $19.5 million consisting of approximately $8.3 million of growth capital expenditures and approximately $11.2 million of maintenance capital expenditures.
During 2008, we had capital expenditures of $39.0 million consisting of approximately $15.2 million of growth capital expenditures and approximately $23.8 million of maintenance capital expenditures.
41
Table of Contents
In the first quarter of 2008 we began an effort to reduce our planned capital expenditures. As part of this effort, we determined to delay the planned capital expenditures for the Vietnam facility and cancelled or rescheduled certain other previously planned capital expenditures. These cancellations did not result in any substantial penalties for us. In December 2008, we discontinued the construction of the Vietnam facility, and continue to have some contractual obligations with respect to certain equipment which was previously ordered for the facility. We have redeployed this equipment to other locations. We target capital expenditures for 2011 to be approximately $33 million and currently estimate capital expenditure levels for 2012 to be approximately $30 million. We analyze our planned capital expenditures based on investment opportunities available to us and our financial and operating performance, and accordingly, actual capital expenditures may be more or less than these amounts.
See “Credit Facilities” below for a description on limitations on capital expenditures imposed by our credit facility.
Credit Facilities
Amended and Restated Credit Facility
Pursuant to the Plan, on the Effective Date, we entered into the Amended and Restated Credit Facility, dated as of May 25, 2010 by and among us, certain subsidiaries of ours, Citigroup Global Markets Inc. as Lead Arranger and Bookrunner, and other agents and banks party thereto. The Amended and Restated Credit Facility provides for a term loan that has a principal amount of $410 million, and a maturity date that is five years following May 25, 2010, the closing date of the Amended and Restated Credit Facility. The $410 million is denominated in U.S. Dollars, Euros and Canadian Dollars representing approximately 56%, 32% and 12% of this amount, respectively, at the Effective Date. The Amended and Restated Credit Facility is secured by second priority liens against, and security interests in, substantially all of our assets and the assets of most of our subsidiaries, subject to legal and tax considerations and requirements. In addition, most of our U.S. and non-U.S. subsidiaries have guaranteed the obligations of the borrowers under the Amended and Restated Credit Facility, provided that non-U.S. guarantors will only be liable for obligations of non-U.S borrowers and non-U.S. guarantors.
Borrowings under the Amended and Restated Credit Facility term loans bear interest as follows:
| • | in the case of Xerium Canada Inc., at the CDOR (“Canadian dollar”) Rate plus (i) 6.25% if the leverage ratio equals or exceeds 2.75:1.00 or (ii) 5.75% if the leverage ratio is less than 2.75:1.00; |
| • | in the case of Xerium Technologies, Inc. the LIBOR Rate plus (i) 6.25% if the leverage ratio equals or exceeds 2.75:1.00 or (ii) 5.75% if the leverage ratio is less than 2.75:1.00; and |
| • | in the case of XTI LLC, Xerium Italia S.p.A., Huyck Wangner Austria GmbH and Xerium Germany Holding GmbH, at the Euribor Rate plus (i) 6.25% if the leverage ratio equals or exceeds 2.75:1.00 or (ii) 5.75 % if the leverage ratio is less than 2.75:1.00. |
The terms “CDOR Rate,” “LIBOR Rate,” and “Euribor Rate” have the same meanings as set forth in the our pre-petition credit facility except that the CDOR Rate, the LIBOR Rate and the Euribor Rate shall not be less than 2.00% per annum. Interest periods will be 1, 2, 3 or 6 months. If any event of default occurs and is continuing, then interest on the unpaid balance of the outstanding term loans will accrue at a per annum rate of two percent greater than the rate of interest specified above.
The Amended and Restated Credit facility provides that we will make scheduled principal payments totaling approximately $2.0 million each quarter through March 2015.
42
Table of Contents
The Amended and Restated Credit Facility requires us to make mandatory prepayments under the following circumstances, subject to intercreditor sharing arrangements with the lenders under the Exit Facility:
(a) with 100% of the net cash proceeds we receive from any sale of any assets (50% of the net cash proceeds of the sale of assets belonging to our Australian and Vietnamese subsidiaries) for any transaction or series of transactions exceeding $250,000 outside the ordinary course of business (subject to certain exceptions regarding discontinued manufacturing facilities and exempting the first $3 million if invested in other assets, except for the sale of assets belonging to our Australian and Vietnamese subsidiaries);
(b) with 100% of insurance and condemnation award payments, subject to certain exemptions;
(c) with 100% of the cash proceeds from debt issuances, subject to certain exemptions; and
(d) with 50% of our excess cash after the end of each fiscal year, beginning with fiscal year 2011; that is, Adjusted EBITDA plus a working capital adjustment, minus consolidated interest expense, cash income tax expense, consolidated capital expenditures (subject to certain exceptions), consolidated restructuring costs, cash payments of withholding taxes from proceeds of the repurchase, redemption or retention of common stock and the aggregate amount of scheduled and voluntary payments made during the past fiscal year.
The Amended and Restated Credit Facility requires that we observe and perform numerous affirmative and negative covenants, including certain financial covenants. The Amended and Restated Credit Facility also prohibits the payment of dividends on our New Common Stock. The financial covenants per the Amended and Restated Credit Facility are now as follows:
| Minimum Interest Coverage Ratio: |
Four Fiscal Quarters Ending | Ratio | ||
| The ratio of four quarter Adjusted |
September 30, 2010 to March 31, 2011 | 1.75:1.00 | ||
| June 30, 2011 to December 31, 2011 | 2.00:1.00 | |||
| March 31, 2012 to September 30, 2013 | 2.25:1.00 | |||
| December 31, 2013 to December 31, 2015 | 2.50:1.00 | |||
| Maximum Leverage Ratio: |
Four Fiscal Quarters Ending | Ratio | ||
| The ratio of outstanding debt to four quarter Adjusted EBITDA. |
September 30, 2010 and December 31, 2010 | 5.50:1.00 | ||
| March 31, 2011 and June 30, 2011 | 5.25:1.00 | |||
| September 30, 2011 | 5.00:1.00 | |||
| December 31, 2011 and March 31, 2012 | 4.75:1.00 | |||
| June 30, 2012 and September 30, 2012 | 4.50:1.00 | |||
| December 31, 2012 to June 30, 2013 | 4.25:1.00 | |||
| September 30, 2013 and December 31, 2013 | 4.00:1.00 | |||
| March 31, 2014 to September 30, 2014 | 3.75:1.00 | |||
| December 31, 2014 to December 31, 2015 | 3.50:1.00 | |||
For the four fiscal quarters ended December 31, 2010 our interest coverage ratio was 2.96:1 and our leverage ratio was 4.21:1. Each of these covenants is calculated at the end of each quarter, beginning with the quarter ended September 30, 2010, and is based on a rolling twelve month period. The interest coverage ratio is calculated by dividing Adjusted EBITDA by interest expense, net of mark-to-market movements on hedging instruments and amortization of deferred financing costs. The leverage ratio is calculated by dividing our total gross debt, at average currency exchange rates for the last twelve months, by Adjusted EBITDA.
The Amended and Restated Credit Facility defines consolidated capital expenditures for a particular fiscal year as all expenditures required under GAAP to be included in “purchase of property and equipment” or similar items included in our cash flow. The Amended and Restated Credit Facility limits our consolidated capital expenditures in a particular fiscal year to an amount not exceeding $37.3 million, $33.4 million and $33.8 million for fiscal year 2010, 2011 and 2012, respectively and $33.1 million for each of fiscal years 2013, 2014 and 2015, exclusive of capital expenditures paid with net insurance and condemnation proceeds; provided that the maximum amount of
43
Table of Contents
consolidated capital expenditures permitted in each fiscal year shall be increased by 50% of the amount below the maximum not spent in the prior fiscal year (determined without reference to any carryover amount).
Exit Facility
On the Effective Date, the DIP Facility was converted into the Exit Facility consisting of a $20 million revolving credit facility and a $60 million term loan that was used to satisfy our obligations under the Plan and for ongoing working capital (including letters of credit) requirements. The revolving credit facility matures May 25, 2013, the closing date of the Exit Facility, and the term loans mature November 25, 2014. The Exit Facility is secured by first priority liens against, and security interests in, substantially all of our assets and the assets of most of our subsidiaries, subject to legal and tax considerations and requirements. All loans under the Exit Facility are senior to the amounts owing under the Amended and Restated Credit Facility. In addition, most of our U.S. and non-U.S. subsidiaries guarantee the obligations of the borrowers under the Exit Facility, provided that non-U.S. guarantors will only be liable for obligations of non-U.S borrowers and non-U.S. guarantors.
The loans under the Exit Facility are “LIBOR Loans” and bear interest at the annual rate equal to LIBOR plus the applicable margin, 4.5% per year, with a LIBOR floor of 2% per annum. Interest periods will be 1, 2, 3 or 6 months. If any event of default occurs and is continuing, then interest on the unpaid balance of the outstanding Exit Facility loans will accrue at a per annum rate of two percent greater than the rate of interest specified above. If any event of default occurs and is continuing under the Exit Facility, each LIBOR Loan will convert to an ABR Loan at the end of the interest period then in effect for such LIBOR Loan.
The Exit Facility provides that we will make scheduled principal payments totaling approximately $0.15 million each quarter through September 2014.
The Exit Facility requires us to make mandatory prepayments under the same circumstances as with respect to the Amended and Restated Credit Facility, which are described above. In addition, with limited exceptions, the Exit Facility requires that we observe and perform the same affirmative and negative covenants, including financial covenants, as required by the Amended and Restated Credit Facility.
Contractual Obligations and Commercial Commitments
The following table provides aggregated information about our contractual obligations as of December 31, 2010.
| Payments Due by Period | ||||||||||||||||||||||||
| Contractual Obligations (in millions) |
Total | Less than 1 year |
1-3 years | 3-5 years | More than 5 years |
Other | ||||||||||||||||||
| (in millions) | ||||||||||||||||||||||||
| Long-term debt obligations |
$ | 481.2 | $ | 12.8 | $ | 19.6 | $ | 448.8 | $ | — | $ | — | ||||||||||||
| Interest expense on long-term debt (1) |
159.2 | 38.5 | 74.5 | 46.2 | — | — | ||||||||||||||||||
| Operating leases |
22.1 | 4.8 | 7.5 | 4.2 | 5.6 | — | ||||||||||||||||||
| Purchase obligations (2) |
29.0 | 18.5 | 8.5 | 2.0 | — | — | ||||||||||||||||||
| Pension and other postretirement obligations |
73.0 | 7.2 | 13.6 | 15.2 | 37.0 | — | ||||||||||||||||||
| Net unrecognized tax benefit obligation |
9.3 | 1.2 | 0.2 | — | — | 7.9 | ||||||||||||||||||
| Total contractual cash obligations |
$ | 773.8 | $ | 83.0 | $ | 123.9 | $ | 516.4 | $ | 42.6 | $ | 7.9 | ||||||||||||
| (1) | Interest expense shown above is based on the effective interest rate as of December 31, 2010. |
| (2) | Includes obligations with respect to raw materials purchases, repair and maintenance services, utilities and capital expenditures. |
| (3) | Amounts in “other” represent future cash outlays for which we are unable to reasonably estimate the period of cash settlement. |
44
Table of Contents
Off-Balance Sheet Financing
During the year ended December 31, 2010, we have did not engage in material off-balance sheet activities, including the use of structured finance or special purpose entities.
Critical Accounting Policies and Estimates
The preparation of financial statements in conformity with GAAP requires management to make estimates and assumptions that affect the reported amounts of assets and liabilities, the disclosure of contingent assets and liabilities at the date of the financial statements, and the reported amounts of net sales and expenses. Actual results could differ from those estimates. We have formal accounting policies in place including those that address critical and complex accounting areas. Note 2 to the consolidated financial statements included elsewhere in this Annual Report identifies the significant accounting policies used in preparation of the consolidated financial statements. The most significant areas involving management judgments and estimates are described below.
Derivatives and Hedging. Effective January 1, 2009, we adopted ASC Topic 815-10-65-1, Transition and Effective Date Related to FASB Statement No. 161, Disclosures about Derivative Instruments and Hedging Activities—an amendment of FASB Statement No. 133 (“Topic 815-10-65-1”) for disclosure related to derivatives and hedging. Topic 815-10-65-1 amends and expands the disclosure requirements to provide users of financial statements with an enhanced understanding of: (a) how and why an entity uses derivative instruments, (b) how derivative instruments and related hedged items are accounted for and (c) how derivative instruments and related hedged items affect an entity’s financial position, financial performance, and cash flows. Topic 815-10-65-1 requires qualitative disclosures about objectives and strategies for using derivatives, quantitative disclosures about the fair value of and gains and losses on derivative instruments and disclosures about credit-risk-related contingent features in derivative instruments.
As required by ASC Topic 815-10-65-1, we record all derivatives on the balance sheet at fair value. The accounting for changes in the fair value of derivatives depends on the intended use of the derivative, whether we have elected to designate a derivative in a hedging relationship and apply hedge accounting and whether the hedging relationship has satisfied the criteria necessary to apply hedge accounting. Derivatives designated and qualifying as a hedge of the exposure to changes in the fair value of an asset, liability or firm commitment attributable to a particular risk are considered fair value hedges. Derivatives designated and qualifying as a hedge of the exposure to variability in expected future cash flows, or other types of forecasted transactions, are considered cash flow hedges. Derivatives may also be designated as hedges of the foreign currency exposure of a net investment in a foreign operation. Hedge accounting generally provides for the matching of the timing of gain or loss recognition on the hedging instrument with the recognition of the changes in the fair value of the hedged asset or liability that are attributable to the hedged risk in a fair value hedge or the earnings effect of the hedged forecasted transactions in a cash flow hedge. We may enter into derivative contracts that are intended to economically hedge certain of our risks, even though hedge accounting does not apply or if we elect not to apply hedge accounting under Topic 815.
There are two types of hedges into which we enter: hedges of fair value exposure and hedges of cash flow exposure. Hedges of fair value exposure are entered into in order to hedge the fair value of a recognized asset or liability, or a firm commitment. Hedges of cash flow exposure are entered into in order to hedge a forecasted transaction or the variability of cash flows to be paid related to a recognized liability. Changes in derivative fair values are recognized in earnings as offsets to the changes in fair value of the related hedged assets and liabilities. Changes in the derivative fair values that are designated as cash flow hedges which meet the criteria for hedge accounting are recorded in other comprehensive income (loss).
Prior to September 1, 2009, the effective portion of changes in the fair value of derivatives designated and that qualified as cash flow hedges were recorded in accumulated other comprehensive income (loss) and subsequently reclassified into earnings in the period that the hedged forecasted transaction affected earnings. The ineffective portion of the change in fair value of the derivatives was recognized directly in earnings. The balance
45
Table of Contents
in accumulated other comprehensive loss as of August 31, 2009 related to the interest rate swaps for which hedge accounting was discontinued was subsequently reclassified into the statement of operations (interest expense) over the remaining original term of the derivative as the hedged forecasted transactions are also recorded to interest expense, in accordance with Topic 815. In addition, as of March 31, 2010, we determined that it was probable that future interest payments on the debt that was in excess of the $410 million (discussed in Note 1 of the Notes to Consolidated Financial Statements) would not occur. As a result, we reclassified an additional $0.7 million from accumulated other comprehensive income to interest expense, which represented the balance in accumulated other comprehensive income relating to interest payments on the debt that was in excess of $410 million. As of March 31, 2010, after this reclassification, the remaining balance in accumulated other comprehensive loss related to interest rate swaps was amortized to interest expense through December 31, 2010, the original term of the swaps. Accordingly, during 2010, we amortized approximately $9.7 million from accumulated other comprehensive income to interest expense.
On December 31, 2009, we terminated with the counterparties all of our outstanding interest rate swap liabilities of $20.0 million and converted them into notes payable to such counterparties. Although these interest rate swaps were subject to mark to market accounting through earnings effective September 1, 2009, prior to their termination with the counterparties, they effectively fixed, from a cash flow hedge perspective through December 31, 2009, the interest rate at 10.75% on approximately 79% of the term loan portion of our pre-petition credit facility. As a result of the termination of the interest rate swaps, the interest rate on the term loan portion of the credit facility was no longer effectively fixed through December 31, 2010, the original term of the swaps.
We have measured our derivative assets and liabilities under ASC Topic 820, Fair Value Measurements and Disclosures (“Topic 820”), and have classified our interest rate swaps in Level 2 of the Topic 820 fair value hierarchy, as the significant inputs to the overall valuations are based on market-observable data or information derived from or corroborated by market-observable data, including market-based inputs to models, model calibration to market-clearing transactions, broker or dealer quotations, or alternative pricing sources with reasonable levels of price transparency. Where models are used, the selection of a particular model to value a derivative depends upon the contractual terms of, and specific risks inherent in, the instrument as well as the availability of pricing information in the market. We use similar models to value similar instruments. Valuation models require a variety of inputs, including contractual terms, market prices, yield curves, credit curves, measures of volatility, and correlations of such inputs. For our derivatives, all of which traded in liquid markets, model inputs can generally be verified and model selection does not involve significant management judgment.
To comply with the provisions of Topic 820, we incorporated credit valuation adjustments to appropriately reflect both our own nonperformance risk and the respective counterparty’s nonperformance risk in the fair value measurements of our derivatives. The credit valuation adjustments are calculated by determining the total expected exposure of the derivatives (which incorporates both the current and potential future exposure) and then applying each counterparty’s credit spread to the applicable exposure. For derivatives with two-way exposure, such as interest rate swaps, the counterparty’s credit spread is applied to our exposure to the counterparty, and our own credit spread is applied to the counterparty’s exposure to us, and the net credit valuation adjustment is reflected in our derivative valuations. The total expected exposure of a derivative is derived using market-observable inputs, such as yield curves and volatilities. The inputs utilized for our own credit spread are based on implied spreads from its publicly-traded debt. For counterparties with publicly available credit information, the credit spreads over LIBOR used in the calculations represent implied credit default swap spreads obtained from a third party credit data provider. In adjusting the fair value of our derivative contracts for the effect of nonperformance risk, we have considered the impact of netting and any applicable credit enhancements, such as collateral postings, thresholds, mutual puts, and guarantees. Additionally, we actively monitor counterparty credit ratings for any significant changes.
Although we have determined that the majority of the inputs used to value our derivatives fall within Level 2 of the fair value hierarchy, the credit valuation adjustments associated with our derivatives utilize Level 3
46
Table of Contents
inputs, such as estimates of current credit spreads to evaluate the likelihood of default by us and our counterparties. As a result, we have determined that our derivative valuations in their entirety are classified in Level 2 of the fair value hierarchy. We do not have any fair value measurements using significant unobservable inputs (Level 3) as of December 31, 2010.
However, as of December 31, 2010, the credit valuation adjustments have had no impact on the overall valuation of our derivative positions as we terminated all of our outstanding interest rate swaps with the counterparties on December 31, 2009. Various factors which impact changes in the credit are not significant to the overall valuation adjustments over time, including changes in the credit spreads of the parties to the contracts, as well as changes in market rates and volatilities, which affect the total expected exposure of the derivative instruments.
Goodwill. We account for acquired goodwill and intangible assets in accordance with ASC Topic 805, Business Combinations (“Topic 805”). Purchase accounting required by Topic 805 involves judgment with respect to the valuation of the acquired assets and liabilities in order to determine the amount of goodwill. We have recorded our acquisitions in accordance with Topic 805.
Impairment of Goodwill and Indefinite-Lived Intangible Assets. We account for acquired goodwill and goodwill impairment in accordance with Topic 350, which requires considerable judgment in the valuation of acquired goodwill and the ongoing evaluation of goodwill impairment. Topic 350 requires that goodwill and intangible assets that have indefinite lives not be amortized but, instead, must be tested at least annually for impairment or whenever events or business conditions warrant.
We perform annual tests for goodwill impairment at the reporting unit level, which are clothing and roll covers. When our business was acquired in 1999, more than 80% of the goodwill was assigned to the roll covers reporting unit based on relative fair values at the date of acquisition.
Goodwill impairment testing is a two-step process. Step 1 involves comparing the fair value of our reporting unit to its carrying amount. If the fair value of the reporting unit is greater than its carrying amount, there is no impairment. If the reporting unit carrying amount is greater than the fair value then the second step must be completed to measure the amount of impairment, if any. Step 2 calculates the implied fair value of goodwill by deducting the fair value of the net assets of the reporting unit from the fair value of the reporting unit as determined in Step 1. The implied fair value of goodwill determined in this step is compared to the carrying value of goodwill. If the implied fair value of goodwill is less than the carrying value of goodwill, an impairment loss is recognized equal to the difference.
For the purpose of performing the annual impairment test, we allocate all shared assets and liabilities to the reporting units based upon the percentage of each reporting unit’s revenue to total revenue. Shared expenses are allocated to each reporting unit to the extent necessary to allow them to operate as independent businesses. Fair value was determined by using a weighted combination of both a market multiple approach and an income approach. The market multiple approach utilizes our and our competitors’ information to determine measures that are used to value our reporting units. The income approach is a present value technique used to measure the fair value of future cash flows produced by each reporting unit. Determining the fair value of a reporting unit or an indefinite-lived purchased intangible asset is judgmental in nature and requires the use of significant estimates and assumptions, including revenue growth rates and operating margins, discount rates and future market conditions, among others. We believe that the assumptions and rates used in our annual impairment test under Topic 350 are reasonable, but inherently uncertain.
Based on the assessments performed as of December 31, 2010, we determined that no impairment of goodwill exists. The excess of the fair value over carrying value for our clothing and roll covers segment as of December 31, 2010, the annual test date, was approximately $247 million and $161 million, respectively. In order to evaluate the sensitivity of the analysis performed, we applied a hypothetical 5% decrease to the fair value of the business segments, which resulted in a fair value in excess of carrying value of approximately $217 million and $145 million for the clothing segment and the roll covers segment, respectively.
47
Table of Contents
As of December 31, 2009, we recorded a non-cash charge for goodwill impairment of $80.6 million related to our roll covers reporting unit based on assessments performed as of that date. Applying the guidance of Topic 350, we determined that as of December 31, 2009, goodwill for the roll covers reporting unit was impaired primarily due to the adverse effect of our credit issues and the effects of the global economic environment at that time. Step 1 of the process indicated that the fair value of the net assets of the roll covers reporting unit was $3.7 million less than their carrying value as of December 31, 2009. Based on the Step 1 result, we proceeded with Step 2. Based on the increase in fair value of tangible and intangible assets over book value of $77 million as determined in Step 2, an aggregate impairment of $80.6 million was recorded in the roll covers reporting unit. To date, there have been no indicators of impairment or recorded goodwill impairment for our clothing reporting unit. The excess of the fair value over the carrying value for our clothing reporting unit as of December 31, 2009 was approximately $142 million.
Contingencies. We are subject to various claims and contingencies associated with lawsuits, insurance, tax, environmental and other issues arising out of the normal course of business. Our consolidated financial statements reflect the treatment of claims and contingencies based on management’s view of the expected outcome. We consult with legal counsel on those issues related to litigation with respect to matters in the ordinary course of business. If the likelihood of an adverse outcome is probable and the amount is estimable, we accrue a liability in accordance with ASC Topic 450, Contingencies. While we believe that the current level of reserves is adequate, the adequacy of these reserves may change in the future due to new developments in particular matters. For example, during the third quarter of 2008, while evaluating our facility in Australia, we discovered the possibility of contamination at the facility. Subsequently we had a preliminary evaluation performed, which confirmed the existence of contamination and estimated preliminary costs to remediate this facility. Based upon this evaluation, we accrued $4.1 million in 2008 as our best estimate of the remediation costs we expected to incur. A Phase II assessment of the groundwater contamination performed for us during the second quarter of 2009 indicated the costs to remediate the contamination would be significantly less than originally estimated and accordingly, we reduced the accrual by $3.4 million during the second quarter of 2009 based on this assessment. At the end of the second quarter of 2010, we entered into a contingent purchase and sale agreement with a third party whereby the third party could purchase the Australian facility after two years from the date of the purchase and sale agreement. Under the terms of the purchase and sale agreement, the environmental liability would transfer to the third party at the time of such purchase.
Income Taxes. We utilize the asset and liability method for accounting for income taxes in accordance with ASC Topic 740, Income Taxes (“Topic 740”). Under this method, deferred tax assets and liabilities are determined based on differences between financial reporting and tax bases of assets and liabilities. Deferred tax assets and liabilities are measured using the enacted tax rates and statutes that will be in effect when the differences are expected to reverse.
We record net deferred tax assets to the extent we believe that it is more likely than not that these assets will be realized. In making such determination, we consider all available positive and negative evidence, including scheduled reversals of deferred tax liabilities, projected future taxable income, tax planning strategies and recent results of operations. We reduce our deferred tax assets by a valuation allowance if, based upon the weight of available evidence, it is more likely than not that some portion or all of the deferred tax assets will not be realized. In light of our accumulated loss position in certain tax jurisdictions, and the uncertainty of taxability in future periods, we recorded a valuation allowance against all U. S. deferred tax assets and against certain of our foreign deferred tax assets primarily related to net operating loss carry-forwards in Australia, Canada, Germany, Sweden, the United Kingdom and France.
In addition, we operate within multiple taxing jurisdictions and could be subject to audit in these jurisdictions. These audits can involve complex issues and rely on estimates and assumptions. These audits may require an extended period of time to resolve and may cover multiple years. Although we believe that the estimates and assumptions are reasonable, the final determination of tax audits and any related litigation could be different than that which is reflected in historical income tax provisions and recorded assets and liabilities. With
48
Table of Contents
respect to all jurisdictions, we believe we have made adequate provision for all income tax uncertainties and that no unresolved issues or claims are likely to be material to our results of operations, financial position or cash flows.
We adopted the uncertain tax provisions of Topic 740 on January 1, 2007. ASC Topic 740-10-25 relates to uncertain tax positions and prescribes a two-step process to determine the amount of tax benefit to be recognized as it relates to uncertain tax positions. First, the tax position must be evaluated to determine the likelihood that it will be sustained upon external examination. If the tax position is deemed “more-likely-than-not” to be sustained, the tax position is then assessed to determine the amount of benefit to recognize in the financial statements. The amount of the benefit that may be recognized is the largest amount that has a greater than 50% likelihood of being realized upon ultimate settlement with the taxing authority that has full knowledge of all relevant information.
We have a net deferred tax liability of $7.6 million at December 31, 2010 and $3.9 million at December 31, 2009. The net deferred tax liability relates principally to pension and post-retirement benefits, intangible assets and differences between the book and tax bases of property and equipment.
Our balance sheet as of December 2010 reflects a deferred tax asset related to our German federal and trade loss carry-forwards of approximately $2.7 million. As a general rule, federal and trade tax loss carry forwards are subject to forfeiture if more than 50% of the shares in the corporation are directly or indirectly transferred to a new shareholder. There is a restructuring exception to this general rule; however, effective December 2010, this exception has been suspended with retroactive effect. As of December 2010, we have impaired the portion of the deferred tax asset we believe to be subject to possible forfeiture.
Undistributed earnings of our foreign subsidiaries amounted to approximately $148 million at December 31, 2010. These earnings are considered to be indefinitely reinvested for continued use in foreign operations except for Argentina, Brazil and Mexico. To the extent earnings are considered to be indefinitely reinvested, no provision for income taxes or withholding taxes has been provided thereon. Upon distribution of those earnings in the form of dividends or otherwise we may be subject to both income taxes (subject to an adjustment for foreign tax credits) and withholding taxes payable to the various jurisdictions. Determination of the amount of unrecognized deferred U.S. income tax liability or withholding taxes is not practicable because of the complexities associated with its hypothetical calculation; however, unrecognized foreign tax credit carry-forwards and net operating loss carry-forwards would be available to reduce some portion of the liability. Federal income taxes are provided on the portion of the income of foreign subsidiaries that is expected to be remitted to the United States and be taxable.
Non-GAAP Liquidity Measures
We use EBITDA and Adjusted EBITDA (as defined in the Amended and Restated Credit Facility) as supplementary non-GAAP liquidity measures to assist us in evaluating our liquidity and financial performance, specifically our ability to service indebtedness and to fund ongoing capital expenditures. The Amended and Restated Credit Facility includes covenants based on Adjusted EBITDA. If our Adjusted EBITDA declines below certain levels, we may violate the covenants resulting in a default condition under the credit facility or be required to prepay the credit facility. Neither EBITDA nor Adjusted EBITDA should be considered in isolation or as a substitute for income (loss) from operations (as determined in accordance with GAAP).
EBITDA is defined as net income (loss) before interest expense, income tax provision (benefit) and depreciation (including non-cash impairment charges) and amortization.
Adjusted EBITDA is defined in the Amended and Restated Credit Facility as the total of (A) Consolidated Net Income, as defined below, plus (B), without duplication, to the extent that any of the following were deducted in computing consolidated net income: (i) provision for taxes based on income or profits,
49
Table of Contents
(ii) consolidated interest expense, (iii) consolidated depreciation and amortization expense, (iv) reserves for inventory in connection with plant closures, (v) consolidated operational restructuring costs, not to exceed $15 million in fiscal year 2010, $6 million in fiscal year 2011, and $5 million in any of the 2012, 2013, 2014 or 2015 fiscal years, (vi) consolidated financial restructuring costs, not to exceed $30 million for fiscal year 2010, (vii) non-cash charges or gains resulting from the application of purchase accounting, including push-down accounting, (viii) non-cash expenses resulting from the granting of common stock, stock options, restricted stock or restricted stock unit awards under equity compensation programs solely with respect to common stock, and cash expenses for compensation mandatorily applied to purchase common stock, (ix) non-cash items related to a change in or adoption of accounting policies, (x) expenses incurred as a result of the repurchase, redemption or retention by us of common stock earned under equity compensation programs solely in order to make withholding tax payments, and (xi) amortization or write-offs of deferred financing costs, minus (C) without duplication, to the extent any of the following were included in computing consolidated net income for such period, (i) non-cash gains with respect to the items described in clauses (vii), (viii) and (ix) of clause (B) above and (ii) provisions for tax benefits based on income or profits. Notwithstanding the foregoing, Adjusted EBITDA for the fourth quarter of 2009 was fixed in the Amended and Restated Credit Agreement at $24.6 million. Adjusted EBITDA, as defined in the credit facility and calculated below, may not be comparable to similarly titled measurements used by other companies.
Consolidated Net Income is defined as net income (loss) determined on a consolidated basis in accordance with GAAP; provided, however, that the following, without duplication, shall be excluded in determining Consolidated Net Income: (i) any net after-tax extraordinary or non-recurring gains, losses or expenses (less all fees and expenses relating thereto), (ii) the cumulative effect of changes in accounting principles, (iii) any fees and expenses incurred during such period in connection with the issuance or repayment of indebtedness, any refinancing transaction or amendment or modification of any debt instrument, in each case, as permitted under the Amended and Restated Credit Facility and (iv) any gains resulting from the returned surplus assets of any pension plan.
The following table provides reconciliation from net income (loss), which is the most directly comparable GAAP financial measure, to EBITDA and Adjusted EBITDA. The year ended December 31, 2010 is presented based on the Adjusted EBITDA definitions in the Amended and Restated Credit Facility. The years ended December 31, 2009 and 2008 are presented based on the Adjusted EBITDA definitions in effect under the credit agreement at that time. Had the definitions in the Amended and Restated Credit Facility been in place for 2009 and 2008, Adjusted EBITDA for 2009 and 2008 would have increased by $12.4 million and decreased by $8.3 million, respectively, as per discussion in (A) through (E) below.
50
Table of Contents
The following table provides reconciliation from net income (loss), which is the most directly comparable GAAP financial measure, to EBITDA and Adjusted EBITDA.
| Year Ended December 31, | ||||||||||||
| 2010 | 2009 | 2008 | ||||||||||
| (in thousands) | ||||||||||||
| Net income (loss) |
$ | (73,086 | ) | $ | (111,993 | ) | $ | 26,596 | ||||
| Income tax provision |
18,266 | 12,317 | 3,901 | |||||||||
| Interest expense, net |
56,795 | 67,300 | 58,504 | |||||||||
| Depreciation and amortization |
41,281 | 41,867 | 45,928 | |||||||||
| EBITDA |
43,256 | 9,491 | 134,929 | |||||||||
| Financial restructuring costs (A) |
26,197 | — | — | |||||||||
| Write-off of deferred financing costs as “reorganization item” |
14,283 | — | — | |||||||||
| Expenses incurred in connection with indebtedness or refinancing transaction |
14,400 | — | — | |||||||||
| Non-cash compensation and related expenses (B) |
7,310 | 2,305 | 2,009 | |||||||||
| Operational restructuring expenses |
7,114 | 2,411 | 5,000 | |||||||||
| Non-cash impairment charges (C) |
2,890 | 82,269 | 3,989 | |||||||||
| Non-cash change in accounting method |
(1,400 | ) | — | — | ||||||||
| Inventory write-offs under restructuring programs |
— | 349 | 455 | |||||||||
| Amendment/termination costs |
— | — | 6,766 | |||||||||
| Change in fair value of interest rate swaps (D) |
— | (3,818 | ) | 13,686 | ||||||||
| Unrealized foreign exchange (gain) loss on indebtedness, net (D) |
— | — | (1,985 | ) | ||||||||
| Change in fair value of other derivatives (D) |
— | — | (2,126 | ) | ||||||||
| Growth program costs (D) |
— | — | 1,764 | |||||||||
| Adjusted EBITDA (E) |
$ | 114,050 | $ | 93,007 | $ | 164,487 | ||||||
| (A) | Financial restructuring costs that have been expensed to the statement of operations are added back to EBITDA to arrive at Adjusted EBITDA for periods beginning after the quarter ended December 31, 2009. For the year ended December 31, 2009, such items were not added back to EBITDA based upon the terms of the pre-petition credit facility. Had the amended definition been in place for all periods presented, Adjusted EBITDA for the year ended December 31, 2009 would have been increased by $8.7 million. |
| (B) | Under the Amended and Restated Credit Facility, non-cash expenses resulting from the granting of common stock, stock options, restricted stock or restricted stock units are added back to Adjusted EBITDA. In 2009 and 2008, the granting of Common Stock was not included under the credit agreement at that time. Had the amended definition been in place for all periods presented, Adjusted EBITDA for the year ended December 31, 2008 would have been increased by $3.0 million. |
| (C) | In accordance with the definition of Adjusted EBITDA in the Amended and Restated Credit Facility, non-cash impairment charges resulting from the application of Topic 350 and ASC Topic 360, Property, Plant and Equipment, have been added back to Adjusted EBITDA. |
| (D) | The changes in the fair value of interest rate swaps, unrealized foreign exchange (gain)/loss on indebtedness, net, change in fair value of derivatives and growth program costs are not adjustments under the definition of Adjusted EBITDA in the Amended and Restated Credit Facility to arrive at Adjusted EBITDA for periods beginning after the quarter ended December 31, 2009. For the years ended December 31, 2009 and 2008, as applicable, such items were added back to (deducted from) Adjusted EBITDA based upon the terms of the pre-petition credit facility. Had these adjustments not been in place in 2009 and 2008, Adjusted EBITDA would have increased by $3.8 million in 2009 and decreased by $11.3 million in 2008. |
| (E) | Adjusted EBITDA for the fourth quarter ended December 31, 2009 was fixed in the Amended and Restated Credit Facility at $24.6 million which is $.1 million below the fourth quarter 2009 Adjusted EBITDA as would be calculated under the Amended and Restated Credit Facility. The calculation above reflects the Adjusted EBITDA as defined in the credit agreement in effect in 2009, which includes $16.1 million for the fourth quarter of 2009. |
51
Table of Contents
| ITEM 7A. | QUANTITATIVE AND QUALITATIVE DISCLOSURES ABOUT MARKET RISK |
Foreign Currency Hedging. We have foreign currency cash flow and earnings exposure with respect to specific sale and intercompany debt transactions denominated in currencies other than the functional currency of the unit incurring the costs associated with such transactions. To mitigate the risks related to these exposures, we utilize forward currency contracts in certain circumstances, to lock in exchange rates with the objective that the gain or loss on the forward contracts will approximate the loss or gain on the transaction or transactions being hedged. We determine whether to enter into hedging arrangements based upon the size of the underlying transaction or transactions, an assessment of the risk of adverse movements in the applicable currencies and the availability of a cost-effective hedging strategy. In South America, substantially all of our net sales are indexed to U.S. Dollars, but the associated costs are recorded in the local currencies of the operating units. Generally, we do not hedge this U.S. Dollar exposure as it would not be cost effective due to the relatively inefficient foreign exchange markets for local currencies in that region. To the extent we do not engage in hedging or such hedging is not effective, changes in the relative value of currencies can affect our profitability.
The value of these contracts is recognized at fair value based on market exchange forward rates and amounted to a net liability position of $222,000 at December 31, 2010. These contracts mature at various dates through May 2011.
As of December 31, 2010, we had open foreign currency exchange contracts maturing through May 2011 with total net notional amounts of approximately $20.0 million. At December 31, 2010, we prepared an analysis to determine the sensitivity of our forward foreign exchange contracts to changes in exchange rates. A hypothetical adverse exchange rate movement of 10% against our forward foreign exchange contracts would have resulted in a potential net loss in fair value of these contracts of approximately $2.0 million. The calculation assumes that each exchange rate would change in the same direction relative to the U.S. Dollar. Any gain or loss recognized on a foreign exchange contract would generally be offset by the gain or loss on the underlying hedge transaction. In addition to the direct effects of changes in exchange rates, such changes may affect the volume of sales or the foreign currency sales price as competitors’products become more or less attractive. Our sensitivity analysis of the effects of changes in foreign currency exchange rates does not factor in a potential change in sales levels or local currency selling prices.
For additional information about the risks associated with fluctuations in currency exchange rates, see “Management’s Discussion and Analysis of Financial Condition and Results of Operations—Foreign Exchange.”
Interest Rate Hedging. Our current and pre-petition credit facilities have variable interest rates. In connection with our pre-petition credit facility, we previously entered into interest rate swap arrangements pursuant to which we paid fixed rates on notional amounts while receiving the applicable floating LIBOR, Euribor or CDOR rates. On December 31, 2009, we terminated with the counterparties all of our outstanding interest rate swap liabilities of $20.0 million and converted them into notes payable to such counterparties. Prior to their termination with the counterparties, the interest rate swaps effectively fixed, from a cash flow hedge perspective, the interest rate on approximately 79% of the term loan portion of our pre-petition credit facility through December 31, 2010 at 10.75%. As a result of the termination of the interest rate swaps, the interest rate on the term loan portion of the pre-petition credit facility was no longer effectively fixed through December 31, 2010, the original term of the swaps. Under our Amended and Restated Credit Facility, the applicable margin for our LIBOR term loans, Euribor loans and CDOR loans is 6.25% for the $410 million term loans and 4.50% for the $60 million term loan and LIBOR revolving loans under the Exit Facility, both with a LIBOR floor of 2.00%.
As previously discussed, we terminated our outstanding interest rate swaps at December 31, 2009 and have not entered into any new interest rate swap agreements since that time. Consequently, our financial statements are exposed to the effects of interest rate fluctuations, which could have a material impact on our results of operations. However, under the Amended and Restated Credit Facility, the CDOR Rate, the LIBOR Rate and the Euribor Rate are subject to a minimum base rate of 2.00% per annum, which is currently higher than the respective base rates of 1.24%, 0.30281% and 1.021%, respectively. We do not believe that reasonably possible near-term changes in these base rates would affect our interest expense.
52
Table of Contents
| ITEM 8. | FINANCIAL STATEMENTS AND SUPPLEMENTARY DATA |
All financial statements required to be filed under this Item 8, other than selected quarterly financial data, are filed as Appendix A hereto, are listed under Item 15(a) and are incorporated herein by this reference.
Selected quarterly financial data are included under Item 6 and are incorporated herein by reference.
| ITEM 9. | CHANGES IN AND DISAGREEMENTS WITH ACCOUNTANTS ON ACCOUNTING AND FINANCIAL DISCLOSURE |
Not applicable.
| ITEM 9A. | CONTROLS AND PROCEDURES |
Disclosure Controls and Procedures
As of December 31, 2010, under the supervision of our principal executive officer and principal financial officer, and with the participation of our management, we have evaluated the effectiveness of the design and operation of our disclosure controls and procedures, as defined in Rules 13a–15(e) and 15d–15(e) under the Exchange Act. Based upon that evaluation, our principal executive officer and principal financial officer concluded that our disclosure controls and procedures were effective to provide reasonable assurance that information required to be disclosed by us in the reports that we file or submit under the Exchange Act is (i) recorded, processed, summarized and reported, within the time periods specified in the SEC’s rules and forms; and (ii) accumulated and communicated to our management, including our principal executive and principal financial officers, as appropriate to allow timely decisions regarding required disclosures. No evaluation of disclosure controls and procedures can provide absolute assurance that these controls and procedures will operate effectively under all circumstances. However, our disclosure controls and procedures are designed to provide reasonable assurance of achieving their objectives, and our principal executive officer and principal financial officer have concluded that our disclosure controls and procedures are effective at the reasonable assurance level as set forth above.
Management’s Annual Report on Internal Control Over Financial Reporting
Our management is responsible for establishing and maintaining adequate internal control over financial reporting. Internal control over financial reporting is a process designed to provide reasonable assurance regarding the reliability of financial reporting and the preparation of financial statements for external reporting purposes in accordance with accounting principles generally accepted in the United States of America. Because of its inherent limitations, internal control over financial reporting may not prevent or detect misstatements. Our management has assessed the effectiveness of our internal control over financial reporting as of December 31, 2010. In making its assessment, management has utilized the criteria set forth by the Committee of Sponsoring Organizations (COSO) of the Treadway Commission in Internal Control—Integrated Framework. Our management concluded that based on its assessment, our internal control over financial reporting was effective as of December 31, 2010. Ernst & Young LLP, our independent registered public accounting firm, has issued its report on the effectiveness of internal control over financial reporting as of December 31, 2010, which appears in this 2010 Annual Report.
There has been no change in our internal control over financial reporting during the quarter ended December 31, 2010 that has materially affected, or is reasonably likely to materially affect, our internal control over financial reporting.
53
Table of Contents
Report of Independent Registered Public Accounting Firm
Board of Directors and Shareholders
Xerium Technologies, Inc.
We have audited Xerium Technologies, Inc.’s internal control over financial reporting as of December 31, 2010, based on criteria established in Internal Control—Integrated Framework issued by the Committee of Sponsoring Organizations of the Treadway Commission (the COSO Criteria). Xerium Technologies, Inc.’s management is responsible for maintaining effective internal control over financial reporting, and for its assessment of the effectiveness of internal control over financial reporting included in the accompanying Management’s Annual Report on Internal Control Over Financial Reporting. Our responsibility is to express an opinion on the Company’s internal control over financial reporting based on our audit.
We conducted our audit in accordance with the standards of the Public Company Accounting Oversight Board (United States). Those standards require that we plan and perform the audit to obtain reasonable assurance about whether effective internal control over financial reporting was maintained in all material respects. Our audit included obtaining an understanding of internal control over financial reporting, assessing the risk that a material weakness exists, testing and evaluating the design and operating effectiveness of internal control based on the assessed risk, and performing such other procedures as we considered necessary in the circumstances. We believe that our audit provides a reasonable basis for our opinion.
A company’s internal control over financial reporting is a process designed to provide reasonable assurance regarding the reliability of financial reporting and the preparation of financial statements for external purposes in accordance with generally accepted accounting principles. A company’s internal control over financial reporting includes those policies and procedures that (1) pertain to the maintenance of records that, in reasonable detail, accurately and fairly reflect the transactions and dispositions of the assets of the company; (2) provide reasonable assurance that transactions are recorded as necessary to permit preparation of financial statements in accordance with generally accepted accounting principles, and that receipts and expenditures of the company are being made only in accordance with authorizations of management and directors of the company; and (3) provide reasonable assurance regarding prevention or timely detection of unauthorized acquisition, use, or disposition of the company’s assets that could have a material effect on the financial statements.
Because of its inherent limitations, internal control over financial reporting may not prevent or detect misstatements. Also, projections of any evaluation of effectiveness to future periods are subject to the risk that controls may become inadequate because of changes in conditions, or that the degree of compliance with the policies or procedures may deteriorate.
In our opinion, Xerium Technologies, Inc. maintained, in all material respects, effective internal control over financial reporting as of December 31, 2010, based on the COSO criteria.
We also have audited, in accordance with the standards of the Public Company Accounting Oversight Board (United States), the consolidated balance sheets of Xerium Technologies, Inc. as of December 31, 2010 and 2009, and the related consolidated statements of operations, stockholders’ equity (deficit), and cash flows for each of the three years in the period ended December 31, 2010, and our report dated March 11, 2011 expressed an unqualified opinion thereon.
/s/ Ernst & Young LLP
Raleigh, North Carolina
March 11, 2011
54
Table of Contents
| ITEM 9B. | OTHER INFORMATION |
Our Board of Directors has set June 17, 2011 as the date for our 2011 Annual Meeting of Stockholders (“2011 Annual Meeting”), which is more than 30 days before the anniversary of our 2010 Annual Meeting of Stockholders. As a result, stockholders who wish to present proposals of business and nominations for directors for inclusion in our proxy materials for the 2011 Annual Meeting may do so by following the procedures prescribed in Rule 14a-8 under the Exchange Act and our By-laws. To be eligible, the stockholder proposals must be received by our Secretary on or before March 21, 2011, which is a reasonable time before we begin to print and mail our proxy statement for the 2011 Annual Meeting.
Under our By-laws, proposals of business and nominations for directors other than those to be included in our proxy materials following the procedures described in Rule 14a-8 may be made by stockholders entitled to vote at the meeting if notice in writing that contains the information required by our By-laws is timely delivered to our Secretary, Xerium Technologies, Inc., 8537 Six Forks Road, Suite 300, Raleigh, NC 27615. To be timely, a notice with respect to our 2011 Annual Meeting must be received by our Secretary by March 21, 2011.
On January 28, 2011, we entered into a Separation Agreement with Peter Williamson, our former President—Xerium Europe, under which we made payments to or on behalf of Mr.Williamson aggregating approximately 417,945 Euros ($568,639 based on the exchange rate of $1.36056 per Euro on January 28, 2011) and Mr. Williamson agreed to settle pending legal claims. Our payment obligations under the Separation Agreement will be funded by a third party.
55
Table of Contents
PART III
| ITEM 10. | DIRECTORS, EXECUTIVE OFFICERS AND CORPORATE GOVERNANCE |
The information required by this item is incorporated by reference to our Proxy Statement for the 2011 Annual Meeting of Shareholders.
In November of 2010 we filed with the NYSE the Annual CEO Certification regarding our compliance with the NYSE’s Corporate Governance listing standards as required by Section 303A-12(a) of the NYSE Listed Company Manual. In addition, we filed as exhibits to this annual report on Form 10-K the applicable certifications of our Chief Executive Officer and Chief Financial Officer required under Section 302 of the Sarbanes-Oxley Act of 2002, regarding the quality of our public disclosures.
| ITEM 11. | EXECUTIVE COMPENSATION |
The information required by this item is incorporated by reference to our Proxy Statement for the 2011 Annual Meeting of Shareholders.
| ITEM 12. | SECURITY OWNERSHIP OF CERTAIN BENEFICIAL OWNERS AND MANAGEMENT AND RELATED STOCKHOLDER MATTERS |
The information required by this item is incorporated by reference to our Proxy Statement for the 2011 Annual Meeting of Shareholders.
| ITEM 13. | CERTAIN RELATIONSHIPS AND RELATED TRANSACTIONS, AND DIRECTOR INDEPENDENCE |
The information required by this item is incorporated by reference to our Proxy Statement for the 2011 Annual Meeting of Shareholders.
| ITEM 14. | PRINCIPAL ACCOUNTING FEES AND SERVICES |
The information required by this item is incorporated by reference to our Proxy Statement for the 2011 Annual Meeting of Shareholders.
56
Table of Contents
PART IV
| ITEM 15. | EXHIBITS, FINANCIAL STATEMENT SCHEDULES |
(a) (1) Financial Statements. The following documents are filed as Appendix A hereto and are included as part of this Annual Report on Form 10-K:
Financial Statements of Xerium Technologies, Inc.:
Report of Independent Registered Public Accounting Firm on the Consolidated Financial Statements and Schedule
Consolidated Balance Sheets as of December 31, 2010 and 2009
Consolidated Statements of Operations for the years ended December 31, 2010, 2009 and 2008
Consolidated Statements of Stockholders’ Equity (Deficit) for the years ended December 31, 2010, 2009 and 2008
Consolidated Statements of Cash Flows for the years ended December 31, 2010, 2009 and 2008
Notes to Consolidated Financial Statements
(a) (2) Financial Statement Schedules. The following financial statement schedule is included as part of this Annual Report on Form 10-K:
Schedule II, Valuation and Qualifying Accounts
Certain schedules are omitted because they are not applicable, or not required, or because the required information is included in the financial statements or notes thereto.
(a) (3) Exhibits. The exhibits filed as part of this Annual Report on Form 10-K are listed in the Exhibit Index immediately preceding such exhibits, and are incorporated herein by this reference. We have identified with plus symbols in the Exhibit Index each management contract and compensation plan filed as an exhibit to this Annual Report on Form 10-K.
57
Table of Contents
Pursuant to the requirements of Section 13 or 15(d) of the Securities Exchange Act of 1934, as amended, the registrant has duly caused this report to be signed on its behalf by the undersigned, thereunto duly authorized, in Raleigh, North Carolina, on March 11, 2011.
| XERIUM TECHNOLOGIES, INC. | ||
| By: | /s/ STEPHEN R. LIGHT | |
| Stephen R. Light Chairman, President and Chief Executive Officer | ||
Pursuant to the requirements of the Securities Exchange Act of 1934, as amended, this report has been signed below by the following persons in the capacities indicated on March 11, 2011.
| Signature |
Title | |
| /s/ STEPHEN R. LIGHT Stephen R. Light |
Chairman, President, Chief Executive Officer and Director (Principal Executive Officer) | |
| /s/ BRIAN J. FOX Brian J. Fox |
Interim Chief Financial Officer and Chief Accounting Officer (Principal Financial and Accounting Officer) | |
| /s/ AMBASSADOR APRIL H. FOLEY Ambassador April H. Foley |
Director | |
| /s/ JAY GURANDIANO Jay Gurandiano |
Director | |
| /s/ JOHN F. MCGOVERN John F. McGovern |
Director | |
| /s/ EDWARD PAQUETTE Edward Paquette |
Director | |
| /s/ MARC SAIONTZ Marc Saiontz |
Director | |
| /s/ JAMES F. WILSON James F. Wilson |
Director | |
58
Table of Contents
Appendix A
Index to Consolidated Financial Statements
XERIUM TECHNOLOGIES, INC.
CONSOLIDATED FINANCIAL STATEMENTS
Contents
| F-2 | ||||
| Audited Consolidated Financial Statements: |
||||
| Consolidated Balance Sheets as of December 31, 2010 and 2009 |
F-3 | |||
| Consolidated Statements of Operations for the years ended December 31, 2010, 2009 and 2008 |
F-4 | |||
| F-5 | ||||
| Consolidated Statements of Cash Flows for the years ended December 31, 2010, 2009 and 2008 |
F-6 | |||
| F-7 | ||||
F-1
Table of Contents
Report of Independent Registered Public Accounting Firm
Board of Directors and Shareholders
Xerium Technologies, Inc.
We have audited the accompanying consolidated balance sheets of Xerium Technologies, Inc. as of December 31, 2010 and 2009, and the related consolidated statements of operations, stockholders’ equity (deficit), and cash flows for each of the three years in the period ended December 31, 2010. Our audits also included the financial statement schedule listed in the Index at Item 15(a). These financial statements and schedule are the responsibility of the Company’s management. Our responsibility is to express an opinion on these financial statements and schedule based on our audits.
We conducted our audits in accordance with the standards of the Public Company Accounting Oversight Board (United States). Those standards require that we plan and perform the audit to obtain reasonable assurance about whether the financial statements are free of material misstatement. An audit includes examining, on a test basis, evidence supporting the amounts and disclosures in the financial statements. An audit also includes assessing the accounting principles used and significant estimates made by management, as well as evaluating the overall financial statement presentation. We believe that our audits provide a reasonable basis for our opinion.
In our opinion, the financial statements referred to above present fairly, in all material respects, the consolidated financial position of Xerium Technologies, Inc. at December 31, 2010 and 2009, and the consolidated results of its operations and its cash flows for each of the three years in the period ended December 31, 2010, in conformity with U.S. generally accepted accounting principles. Also, in our opinion, the related financial statement schedule, when considered in relation to the basic financial statements taken as a whole, presents fairly in all material respects the information set forth therein.
We also have audited, in accordance with the standards of the Public Company Accounting Oversight Board (United States), Xerium Technologies, Inc.’s internal control over financial reporting as of December 31, 2010, based on criteria established in Internal Control-Integrated Framework issued by the Committee of Sponsoring Organizations of the Treadway Commission and our report dated March 11, 2011 expressed an unqualified opinion thereon.
/s/ Ernst & Young LLP
Raleigh, North Carolina
March 11, 2011
F-2
Table of Contents
CONSOLIDATED BALANCE SHEETS
| December 31 | ||||||||
| 2010 | 2009 | |||||||
| (dollars in thousands) | ||||||||
| ASSETS | ||||||||
| Current assets: |
||||||||
| Cash and cash equivalents |
$ | 38,701 | $ | 23,039 | ||||
| Restricted cash |
13,701 | — | ||||||
| Accounts receivable (net of allowance for doubtful accounts of $4,755 in 2010 and $7,370 in 2009) |
93,332 | 83,602 | ||||||
| Inventories |
81,927 | 78,174 | ||||||
| Prepaid expenses |
5,108 | 5,771 | ||||||
| Other current assets |
15,192 | 25,828 | ||||||
| Total current assets |
247,961 | 216,414 | ||||||
| Property and equipment, net |
361,270 | 385,549 | ||||||
| Goodwill |
60,958 | 72,304 | ||||||
| Intangible assets |
12,958 | 12,091 | ||||||
| Other assets |
16,996 | 7,153 | ||||||
| Total assets |
$ | 700,143 | $ | 693,511 | ||||
| LIABILITIES AND STOCKHOLDERS’ EQUITY (DEFICIT) | ||||||||
| Current liabilities: |
||||||||
| Notes payable |
$ | 184 | $ | 49,801 | ||||
| Accounts payable |
41,686 | 32,124 | ||||||
| Accrued expenses |
47,677 | 46,264 | ||||||
| Current maturities of long-term debt |
12,794 | 1,826 | ||||||
| Long-term debt classified as current |
— | 583,564 | ||||||
| Total current liabilities |
102,341 | 713,579 | ||||||
| Long-term debt, net of current maturities and long-term debt classified as current |
468,383 | 4,930 | ||||||
| Deferred and long-term taxes |
28,506 | 16,147 | ||||||
| Pension, other postretirement and postemployment obligations |
69,646 | 70,652 | ||||||
| Other long-term liabilities |
12,532 | 7,860 | ||||||
| Commitments and contingencies (Note 12) |
||||||||
| Stockholders’ equity (deficit): |
||||||||
| Preferred stock, $0.001 par value, 1,000,000 shares authorized; no shares outstanding as of December 31, 2010 and 2009 |
— | — | ||||||
| Common stock, $0.001 par value, 20,000,000 shares authorized; 14,970,095 and 2,446,786 shares outstanding as of December 31, 2010 and 2009, respectively (1) |
15 | 2 | ||||||
| Stock warrants |
13,560 | — | ||||||
| Paid-in capital |
411,531 | 222,366 | ||||||
| Accumulated deficit |
(403,994 | ) | (330,908 | ) | ||||
| Accumulated other comprehensive loss |
(2,377 | ) | (11,117 | ) | ||||
| Total stockholders’ equity (deficit) |
18,735 | (119,657 | ) | |||||
| Total liabilities and stockholders’ equity (deficit) |
$ | 700,143 | $ | 693,511 | ||||
| (1) | Retroactively adjusted for the effective 20-to-1 reverse stock split and change in par value from $.01 to $.001 on May 25, 2010 |
See accompanying notes.
F-3
Table of Contents
CONSOLIDATED STATEMENTS OF OPERATIONS
| Year ended December 31, | ||||||||||||
| 2010 | 2009 | 2008 | ||||||||||
| (dollars in thousands except per share data) |
||||||||||||
| Net sales |
$ | 548,334 | $ | 500,091 | $ | 638,139 | ||||||
| Costs and expenses: |
||||||||||||
| Cost of products sold |
333,958 | 312,596 | 394,467 | |||||||||
| Selling |
72,883 | 66,808 | 80,175 | |||||||||
| General and administrative |
74,798 | 56,169 | 92,112 | |||||||||
| Restructuring and impairments |
10,004 | 4,080 | 16,968 | |||||||||
| Research and development |
11,427 | 11,309 | 11,740 | |||||||||
| Goodwill impairment |
— | 80,600 | — | |||||||||
| Curtailment/settlement gains |
— | — | (39,968 | ) | ||||||||
| 503,070 | 531,562 | 555,494 | ||||||||||
| Income (loss) from operations |
45,264 | (31,471 | ) | 82,645 | ||||||||
| Interest expense |
(57,912 | ) | (68,480 | ) | (60,328 | ) | ||||||
| Interest income |
1,117 | 1,180 | 1,824 | |||||||||
| Foreign exchange gain (loss) |
1,668 | (905 | ) | 6,356 | ||||||||
| Income (loss) before reorganization items and provision for income taxes |
(9,863 | ) | (99,676 | ) | 30,497 | |||||||
| Reorganization items |
(44,957 | ) | — | — | ||||||||
| Income (loss) before provision for income taxes |
(54,820 | ) | (99,676 | ) | 30,497 | |||||||
| Provision for income taxes |
(18,266 | ) | (12,317 | ) | (3,901 | ) | ||||||
| Net income (loss) |
$ | (73,086 | ) | $ | (111,993 | ) | $ | 26,596 | ||||
| Net income (loss) per share: |
||||||||||||
| Basic (1) |
$ | (7.29 | ) | $ | (45.80 | ) | $ | 11.60 | ||||
| Diluted (1) |
$ | (7.29 | ) | $ | (45.80 | ) | $ | 11.60 | ||||
| Shares used in computing net income (loss) per share: |
||||||||||||
| Basic (1) |
10,019,098 | 2,445,381 | 2,306,692 | |||||||||
| Diluted (1) |
10,019,098 | 2,445,381 | 2,309,823 | |||||||||
| Cash dividends per common share |
$ | — | $ | — | $ | — | ||||||
| (1) | Retroactively adjusted for the effective 20 to 1 reverse stock split and change in par value from $.01 to $.001 on May 25, 2010 |
See accompanying notes.
F-4
Table of Contents
CONSOLIDATED STATEMENTS OF STOCKHOLDERS’ EQUITY (DEFICIT)
| Common Stock | Warrants | Paid-in Capital |
Accumulated Deficit |
Accumulated Other Comprehensive Income (Loss) |
Total Stockholders’ Equity (Deficit) |
|||||||||||||||||||||||
| Shares | Amount | |||||||||||||||||||||||||||
| (dollars in thousands) | ||||||||||||||||||||||||||||
| Balance at December 31, 2007 |
2,301,400 | $ | 2 | $ | — | $ | 216,818 | $ | (245,511 | ) | $ | 27,639 | $ | (1,052 | ) | |||||||||||||
| Components of comprehensive income (loss): |
||||||||||||||||||||||||||||
| Net income |
— | — | — | — | 26,596 | — | 26,596 | |||||||||||||||||||||
| Foreign currency translation adjustments |
— | — | — | — | — | (23,772 | ) | (23,772 | ) | |||||||||||||||||||
| Change in funded status under Topic 715, net of income taxes of $(5) |
— | — | — | — | — | (19,507 | ) | (19,507 | ) | |||||||||||||||||||
| Change in value of derivative instruments, net of income taxes of ($534) |
— | — | — | — | — | (13,859 | ) | (13,859 | ) | |||||||||||||||||||
| Total other comprehensive loss |
— | — | — | — | — | — | (30,542 | ) | ||||||||||||||||||||
| Issuance of common stock underlying restricted stock units |
11,489 | — | — | (262 | ) | — | — | (262 | ) | |||||||||||||||||||
| Compensation expense |
— | — | — | 4,275 | — | — | 4,275 | |||||||||||||||||||||
| Balance at December 31, 2008 |
2,312,889 | 2 | — | 220,831 | (218,915 | ) | (29,499 | ) | (27,581 | ) | ||||||||||||||||||
| Components of comprehensive income (loss): |
— | |||||||||||||||||||||||||||
| Net loss |
— | — | — | — | (111,993 | ) | — | (111,993 | ) | |||||||||||||||||||
| Foreign currency translation adjustments |
— | — | — | — | — | 16,488 | 16,488 | |||||||||||||||||||||
| Change in funded status under Topic 715, net of income taxes of $(2,086) |
— | — | — | — | — | (2,244 | ) | (2,244 | ) | |||||||||||||||||||
| Change in value of derivative instruments, net of income taxes of $211 |
— | — | — | — | — | 4,138 | 4,138 | |||||||||||||||||||||
| Total other comprehensive loss |
— | — | — | — | — | — | (93,611 | ) | ||||||||||||||||||||
| Issuance of common stock |
113,897 | — | — | (770 | ) | — | — | (770 | ) | |||||||||||||||||||
| Compensation expense |
— | — | — | 2,305 | — | — | 2,305 | |||||||||||||||||||||
| Balance at December 31, 2009 |
2,446,786 | 2 | — | 222,366 | (330,908 | ) | (11,117 | ) | (119,657 | ) | ||||||||||||||||||
| Components of comprehensive income (loss): |
||||||||||||||||||||||||||||
| Net loss |
— | — | — | — | (73,086 | ) | — | (73,086 | ) | |||||||||||||||||||
| Foreign currency translation adjustments |
— | — | — | — | — | 2,628 | 2.628 | |||||||||||||||||||||
| Change in funded status under Topic 715, net of income taxes of $(25) |
— | — | — | — | — | (3,609 | ) | (3,609 | ) | |||||||||||||||||||
| Change in value of derivative instruments, net of income taxes of $323 |
— | — | — | — | — | 9,721 | 9,721 | |||||||||||||||||||||
| Total other comprehensive loss |
— | — | — | — | — | — | (64,346 | ) | ||||||||||||||||||||
| Issuance of common stock |
119,364 | — | — | (326 | ) | — | — | (326 | ) | |||||||||||||||||||
| Cancellation of shares in connection with the reorganization |
(2,566,150 | ) | (2 | ) | — | (865 | ) | — | — | (867 | ) | |||||||||||||||||
| Issuance of common stock in connection with the reorganization |
14,970,050 | 15 | — | 196,606 | — | — | 196,621 | |||||||||||||||||||||
| Reclassification of warrants |
— | — | 13,560 | (13,560 | ) | — | — | — | ||||||||||||||||||||
| Issuance of common stock |
45 | — | — | — | — | — | — | |||||||||||||||||||||
| Compensation expense |
— | — | — | 7,310 | — | — | 7,310 | |||||||||||||||||||||
| Balance at December 31, 2010 |
14,970,095 | $ | 15 | $ | 13,560 | $ | 411,531 | $ | (403,994 | ) | $ | (2,377 | ) | $ | 18,735 | |||||||||||||
See accompanying notes.
| (1) | Retroactively adjusted for the effective 20 to 1 reverse stock split and change in par value from $.01 to $.001 on May 25, 2010 |
F-5
Table of Contents
CONSOLIDATED STATEMENTS OF CASH FLOWS
| Year ended December 31 | ||||||||||||
| 2010 | 2009 | 2008 | ||||||||||
| (dollars in thousands) | ||||||||||||
| Operating activities |
||||||||||||
| Net income (loss) |
$ | (73,086 | ) | $ | (111,993 | ) | $ | 26,596 | ||||
| Adjustments to reconcile net income (loss) to net cash provided by operating activities: |
||||||||||||
| Goodwill impairment |
— | 80,600 | — | |||||||||
| Stock-based compensation |
7,310 | 2,305 | 4,275 | |||||||||
| Depreciation |
38,963 | 39,539 | 42,963 | |||||||||
| Amortization of other intangibles |
2,318 | 2,328 | 2,965 | |||||||||
| Deferred financing cost amortization |
5,953 | 5,417 | 4,670 | |||||||||
| Unrealized foreign exchange gain on revaluation of debt |
(1,621 | ) | (1,626 | ) | (10,272 | ) | ||||||
| Deferred taxes |
8,614 | 7,586 | (12,948 | ) | ||||||||
| Asset impairments |
2,890 | 1,669 | 3,989 | |||||||||
| Gain on disposition of property and equipment |
(2,105 | ) | (1,979 | ) | (3,080 | ) | ||||||
| Non-cash reorganization items |
28,683 | — | — | |||||||||
| Reorganization items accrued |
115 | — | — | |||||||||
| Change in the fair value of interest rate swaps |
9,721 | 3,818 | (1,668 | ) | ||||||||
| Curtailment/settlement gain |
— | — | (39,968 | ) | ||||||||
| Provision for bad debt expense |
(1,180 | ) | (4,964 | ) | 11,397 | |||||||
| Change in assets and liabilities which provided (used) cash: |
||||||||||||
| Accounts receivable |
(9,648 | ) | 26,874 | 541 | ||||||||
| Inventories |
(4,811 | ) | 12,726 | 20,664 | ||||||||
| Prepaid expenses |
700 | (682 | ) | 1,190 | ||||||||
| Other current assets |
(2,074 | ) | 3,896 | 1,389 | ||||||||
| Accounts payable and accrued expenses |
11,602 | (48,986 | ) | 24,120 | ||||||||
| Deferred and other long term liabilities |
(1,610 | ) | (397 | ) | 245 | |||||||
| Net cash provided by operating activities |
20,734 | 16,131 | 77,068 | |||||||||
| Investing activities |
||||||||||||
| Capital expenditures |
(27,928 | ) | (19,532 | ) | (39,028 | ) | ||||||
| Proceeds from disposals of property and equipment |
4,170 | 4,261 | 4,672 | |||||||||
| Restricted cash |
(13,701 | ) | — | — | ||||||||
| Other |
(29 | ) | 1,100 | (877 | ) | |||||||
| Net cash used in investing activities |
(37,488 | ) | (14,171 | ) | (35,233 | ) | ||||||
| Financing activities |
||||||||||||
| Net increase (decrease) in borrowings (maturities of 90 days or less) |
(1,025 | ) | 28,000 | (1,776 | ) | |||||||
| Proceeds from borrowings (maturities longer than 90 days) |
402 | 163 | 2,687 | |||||||||
| Proceeds from Debtor in Possession Facility in connection with the Reorganization |
60,000 | — | — | |||||||||
| Principal payments on debt |
(18,579 | ) | (41,303 | ) | (24,429 | ) | ||||||
| Other |
(8,172 | ) | (1,490 | ) | (8,794 | ) | ||||||
| Net cash provided by/(used) in financing activities |
32,626 | (14,630 | ) | (32,312 | ) | |||||||
| Effect of exchange rate changes on cash flows |
(210 | ) | 976 | 992 | ||||||||
| Net increase (decrease) in cash |
15,662 | (11,694 | ) | 10,515 | ||||||||
| Cash and cash equivalents at beginning of year |
23,039 | 34,733 | 24,218 | |||||||||
| Cash and cash equivalents at end of year |
$ | 38,701 | $ | 23,039 | $ | 34,733 | ||||||
| Interest payments |
$ | 41,419 | $ | 59,246 | $ | 57,328 | ||||||
| Income tax payments |
$ | 8,554 | $ | 10,436 | $ | 12,530 | ||||||
| Supplemental schedule of noncash activities: |
||||||||||||
| Issuance of common stock to extinguish debt |
$ | 182,213 | $ | — | $ | — | ||||||
| Conversion of debtor-in-possession financing facility to term loan |
$ | 60,000 | $ | — | $ | — | ||||||
| Cash reorganization items |
$ | 16,159 | $ | — | $ | — | ||||||
| Conversion of interest rate swaps into notes payable (Note 6) |
$ | — | $ | 20,036 | $ | — | ||||||
| Accrued capital expenditures |
$ | — | $ | — | $ | 3,672 | ||||||
See accompanying notes.
F-6
Table of Contents
NOTES TO CONSOLIDATED FINANCIAL STATEMENTS
(dollars in thousands except per share data)
December 31, 2010
1. Company Description
Xerium Technologies, Inc. (the “Company”), is a leading global manufacturer and supplier of two types of consumable products used primarily in the production of paper—clothing and roll covers. Operations are strategically located in the major paper-making regions of the world, including North America, Europe, South America and Asia-Pacific.
Chapter 11 Filing, Emergence and Plan of Reorganization—
On March 30, 2010 (the “Commencement Date”), the Company and certain of its subsidiaries (the “Debtor Subsidiaries”) filed voluntary petitions for relief under chapter 11 of title 11 of the United States Code, 11 U.S.C. §§ 101-1532 (as amended, the “Bankruptcy Code”), in the United States Bankruptcy Court for the District of Delaware (the “Bankruptcy Court”). On April 1, 2010, following approval by the Bankruptcy Court, the Company entered into a debtor-in-possession financing facility consisting of a $20,000 revolving credit facility and $60,000 term loan (the “DIP Facility”). On May 12, 2010, the Bankruptcy Court held a hearing to consider confirmation of the Company’s amended joint prepackaged plan of reorganization (the “Plan”) and entered an order (the “Confirmation Order”) confirming the Plan.
On May 25, 2010 (the “Effective Date”), the Plan became effective and the Company and the Debtor Subsidiaries emerged from chapter 11. On the Effective Date, the provisions of the Plan became binding on the Company, the Debtor Subsidiaries, any entity issuing securities under the Plan, any entity acquiring property under the Plan, and any creditor or equity interest holder of the Company or the Debtor Subsidiaries. Also on the Effective Date, except as otherwise provided in the Plan, the Confirmation Order discharged the Company and the Debtor Subsidiaries from any and all debts, claims, and interests that arose before entry of the Confirmation Order and substituted for such debt, claims, and interests the obligations specified under the confirmed Plan. Pursuant to the Plan, all allowed general unsecured claims were unaffected by the chapter 11 case and were satisfied in full.
Pursuant to the Plan, on the Effective Date:
| • | 20 million shares of new common stock of the Company, par value $0.001 (the “New Common Stock”) were authorized, of which an aggregate of 14,970,050 shares were issued and outstanding, as described below. In addition, 1,000,000 shares of preferred stock of the Company, par value $0.001, were authorized, of which 20,000 shares are designated as Series A Junior Participating Preferred Stock; |
| • | All of the shares of the Company’s common stock outstanding (the “Old Common Stock”), par value $0.01, were cancelled and replaced with 2,566,150 shares of New Common Stock, which was equivalent to a 20 to 1 reverse split of the Old Common Stock; |
| • | The Company’s lenders under its pre-petition credit facility and the interest rate swap termination counterparties (collectively, the “Lenders”) received, among other things, their ratable shares of (a) $10,000 in cash, (b) $410,000 in principal amount of term notes, to be issued pursuant to the Amended and Restated Credit Facility (defined below), and (c) 12,403,900 shares of New Common Stock; and |
| • | Holders of the Company’s Old Common Stock also received warrants to purchase an aggregate of 1,663,760 shares of New Common Stock (the “Warrants”), representing approximately 0.0324108 Warrants for each share of Old Common Stock. The Warrants are exercisable for a term of four years |
F-7
Table of Contents
XERIUM TECHNOLOGIES, INC.
NOTES TO CONSOLIDATED FINANCIAL STATEMENTS—(Continued)
(dollars in thousands except per share data)
December 31, 2010
| from the issue date at an exercise price of $19.55 per share of New Common Stock. The exercise price was determined in accordance with a formula based on the final amount of allowed claims of the Lenders. |
In addition, pursuant to the Plan, the Company entered into a number of material agreements and engaged in a series of transactions on the Effective Date, which are described below.
Amended and Restated Credit Facility
Pursuant to the Plan, on the Effective Date, the Company’s existing senior credit facility was amended and restated as the Second Amended and Restated Credit and Guaranty Agreement (the “Amended and Restated Credit Facility”), dated as of May 25, 2010, by and among the Company, certain subsidiaries of the Company, Citigroup Global Markets Inc. as Lead Arranger and Bookrunner, and other agents and banks party thereto. The Amended and Restated Credit Facility provides for a term loan that has a principal amount of $410,000, and a maturity date that is five years following May 25, 2010, the closing date of the Amended and Restated Credit Facility. The $410,000 is denominated in U.S. Dollars, Euros and Canadian Dollars representing approximately 56%, 32% and 12% of this amount, respectively, at the Effective Date. The Amended and Restated Credit Facility is secured by second priority liens against, and security interests in, substantially all of the Company’s assets and the assets of most of its subsidiaries, subject to legal and tax considerations and requirements. In addition, most of the Company’s U.S. and non-U.S. subsidiaries guaranteed the obligations of the borrowers under the Amended and Restated Credit Facility, provided that non-U.S. guarantors will only be liable for obligations of non-U.S borrowers and non-U.S. guarantors.
Borrowings under the Amended and Restated Credit Facility term loans bear interest as follows:
| • | in the case of Xerium Canada Inc., at the CDOR (“Canada Dollar”) Rate plus (i) 6.25% if the leverage ratio equals or exceeds 2.75:1.00 or (ii) 5.75% if the leverage ratio is less than 2.75:1.00; |
| • | in the case of Xerium Technologies, Inc. the LIBOR Rate plus (i) 6.25% if the leverage ratio equals or exceeds 2.75:1.00 or (ii) 5.75% if the leverage ratio is less than 2.75:1.00; and |
| • | in the case of XTI LLC, Xerium Italia S.p.A., Huyck Wangner Austria GmbH and Xerium Germany Holding GmbH, at the Euribor Rate plus (i) 6.25% if the leverage ratio equals or exceeds 2.75:1.00 or (ii) 5.75 % if the leverage ratio is less than 2.75:1.00. |
The terms “CDOR Rate,” “LIBOR Rate,” and “Euribor Rate” have the same meanings as set forth in the Company’s pre-petition credit facility except that the CDOR Rate, the LIBOR Rate and the Euribor Rate shall not be less than 2.00% per annum. Interest periods will be 1, 2, 3 or 6 months. If any event of default occurs and is continuing, then interest on the unpaid balance of the outstanding term loans will accrue at a per annum rate of two percent greater than the rate of interest specified above.
The Amended and Restated Credit Facility requires the Company to make mandatory prepayments under the following circumstances, subject to inter-creditor sharing arrangements with the lenders under the Exit Facility (as defined below) and on a pro rata basis with the Exit Facility:
(a) with 100% of the net cash proceeds received by the Company from any sale of any assets (50% of the net cash proceeds of the sale of assets belonging to our Australian and Vietnamese subsidiaries) for any
F-8
Table of Contents
XERIUM TECHNOLOGIES, INC.
NOTES TO CONSOLIDATED FINANCIAL STATEMENTS—(Continued)
(dollars in thousands except per share data)
December 31, 2010
transaction or series of transactions exceeding $250 outside the ordinary course of business (subject to certain exceptions regarding discontinued manufacturing facilities and exempting the first $3,000 if invested in other assets, except for the sale of assets belonging to the Company’s Australian and Vietnamese subsidiaries);
(b) with 100% of insurance and condemnation award payments, subject to certain exemptions;
(c) with 100% of the cash proceeds from debt issuances, subject to certain exemptions; and
(d) with 50% of its excess cash after the end of each fiscal year, beginning with fiscal year 2011; that is, Adjusted EBITDA plus a working capital adjustment, minus consolidated interest expense, cash income tax expense, consolidated capital expenditures (subject to certain exceptions), consolidated restructuring costs, cash payments of withholding taxes from proceeds of the repurchase, redemption or retention of common stock and the aggregate amount of scheduled and voluntary payments made during the past fiscal year.
The Amended and Restated Credit Facility requires that the Company observe and perform numerous affirmative and negative covenants, including certain financial covenants. The Amended and Restated Credit Facility also prohibits the payment of dividends on the New Common Stock.
Exit Facility
On the Effective Date, the DIP Facility was converted into an exit facility consisting of a $20,000 revolving credit facility and a $60,000 term loan (collectively, the “Exit Facility”) that was used to satisfy the Company’s and Debtor Subsidiaries’ obligations under the Plan and for ongoing working capital (including letters of credit) requirements. The revolving credit facility matures on a date that is three years following May 25, 2010, the closing date of the Exit Facility, and the term loan will mature on a date that is four and one-half years following May 25, 2010. The Exit Facility is secured by first priority liens against, and security interests in, substantially all of the Company’s assets and the assets of most of its subsidiaries, subject to legal and tax considerations and requirements. All loans under the Exit Facility are senior to the amounts owing under the Amended and Restated Credit Facility. In addition, most of the Company’s U.S. and non-U.S. subsidiaries guarantee the obligations of the borrowers under the Exit Facility, provided that non-U.S. guarantors will only be liable for obligations of non-U.S borrowers and non-U.S. guarantors. The Company deferred costs of $3,645 related to the Exit Facility to be amortized over the life of the facility.
The loans under the Exit Facility are “LIBOR Loans” and bear interest at the annual rate equal to LIBOR plus the applicable margin, 4.5% per year, with a LIBOR floor of 2.00% per annum. Interest periods will be 1, 2, 3 or 6 months. If any event of default occurs and is continuing, then interest on the unpaid balance of the outstanding Exit Facility loans will accrue at a per annum rate of two percent greater than the rate of interest specified above. If any event of default occurs and is continuing under the Exit Facility, each LIBOR Loan will convert to an ABR Loan at the end of the interest period then in effect for such LIBOR Loan.
The Exit Facility requires the Company to make mandatory prepayments under the same circumstances as with respect to the Amended and Restated Credit Facility on a pro rata basis, which are described above. In addition, with limited exceptions, the Exit Facility requires that the Company observe and perform the same affirmative and negative covenants, including financial covenants, as required by the Amended and Restated Credit Facility.
F-9
Table of Contents
XERIUM TECHNOLOGIES, INC.
NOTES TO CONSOLIDATED FINANCIAL STATEMENTS—(Continued)
(dollars in thousands except per share data)
December 31, 2010
Rights Agreement
Pursuant to the Plan, on the Effective Date, the Company issued a dividend of one preferred share purchase right (a “Right”) for each share of New Common Stock outstanding. Each Right entitles the registered holder to purchase from the Company one one-thousandth of a share of Series A Junior Participating Preferred Stock of the Company, par value $0.001 per share (the “Preferred Shares”), at a price of $60.00 per one one-thousandth of a Preferred Share, subject to adjustment.
Subject to limited exceptions, in the event a person (which includes affiliates and associates) acquires beneficial ownership of 15% or more of New Common Stock without prior approval of the Company’s Board of Directors, holders of the New Common Stock, other than the acquirer, may exercise their Rights to purchase New Common Stock (or, in certain circumstances, Preferred Shares or other similar securities of the Company) having a value equal to two times the exercise price of the Right. Until such time as the Rights become exercisable, are redeemed, or expire, the Rights will be attached to shares of New Common Stock and may be transferred with and only with shares of New Common Stock.
Registration Rights Agreement
Pursuant to the Plan, the Company entered into a Registration Rights Agreement (the “Registration Rights Agreement”) on the Effective Date with Apax WW Nominees Ltd, Apax-Xerium Apia L.P., AS Investors, LLC, Carl Marks Strategic Investments, L.P., and Carl Marks Strategic Opportunities Fund, L.P. (the “RRA Parties”). Pursuant to the Registration Rights Agreement, the Company agreed that commencing on the 90th day after the Effective Date, any of the RRA Parties or group of RRA Parties may request registration under the Securities Act of 1933, as amended, of all or any portion of the New Common Stock held by such RRA Party on Form S-1 or Form S-3, as applicable. A RRA Party may not demand registration rights unless (A) the total offering price of the shares is reasonably expected to be at least $50,000 (in the case of a Form S-1) or $20,000 (in the case of a Form S-3) or (B) the shares to be registered represent at least 10% of the outstanding New Common Stock of the Company. In addition, the Registration Rights Agreement provides the RRA Parties with certain piggyback registration rights.
Director Nomination Agreements
Pursuant to the Plan, the Company entered into (i) a Director Nomination Agreement with AS Investors, LLC, and (ii) a Director Nomination Agreement with Carl Marks Strategic Investments, L.P. and Carl Marks Strategic Opportunities Fund, L.P. (both agreements together, the “Director Nomination Agreements,” and the lender parties thereto, the “Nominating Lenders”) on the Effective Date. Each of the Director Nomination Agreements provides that as long as the applicable Nominating Lender(s) is the beneficial owner of a number of shares of New Common Stock that is 50% or more of the number of shares distributed to such Nominating Lender(s) pursuant to the Plan (in such capacity, a “Continuing 50% Holder”), the Company will nominate for election to membership on its Board of Directors one individual designated by each such Continuing 50% Holder.
Reconstitution of Board of Directors
The Company reconstituted its Board of Directors (the “Board”) on the Effective Date pursuant to the Plan, to be comprised of Stephen R. Light, Ambassador April H. Foley, Jay Gurandiano, John F. McGovern, Edward Paquette, Marc Saiontz and James F. Wilson.
F-10
Table of Contents
XERIUM TECHNOLOGIES, INC.
NOTES TO CONSOLIDATED FINANCIAL STATEMENTS—(Continued)
(dollars in thousands except per share data)
December 31, 2010
2010 Equity Incentive Plan
Pursuant to the Plan, the Company adopted the 2010 Equity Incentive Plan on the Effective Date. See Note 13 for further discussion.
Accounting for Reorganization
Subsequent to the Commencement Date and through the Effective Date, the Company’s financial statements were prepared in accordance with the Accounting Standards Codification (“ASC”) Topic 852, Reorganizations (“Topic 852”). Topic 852 does not change the application of U.S. generally accepted accounting principles (“GAAP”) in the preparation of the Company’s financial statements. However, for periods including and subsequent to the filing of a chapter 11 petition, Topic 852 does require that the financial statements distinguish transactions and events that are directly associated with the reorganization from those that are associated with the ongoing operations of the business. Because the reorganization value of the Company’s assets was greater than the sum of its post-petition liabilities and allowed claims, the Company did not adopt the fresh-start reporting principles of Topic 852.
In accordance with Topic 852, the Company (i) separated liabilities that are subject to compromise from liabilities that are not subject to compromise, during the period subsequent to the Commencement Date and prior to the Effective Date; and (ii) distinguished transactions and events that were directly associated with the reorganization from those that are associated with the ongoing operations of the business.
Reorganization items are presented separately in the accompanying consolidated statement of operations and represent expenses that the Company identified as directly relating to the reorganization. These items for the year ended December 31, 2010 are summarized as follows:
| Year Ended December 31, 2010 |
||||
| Legal and professional fees |
$ | 16,274 | ||
| Loss on extinguishment of debt |
14,400 | |||
| Write-off of deferred financing costs on pre-petition credit facility |
14,283 | |||
| $ | 44,957 | |||
The accompanying balance sheet as of December 31, 2009 included a reclassification of $583,564 to reflect as current the long-term debt under the Company’s pre-petition senior credit facility that would otherwise be in default absent the waivers. Additionally, related deferred financing costs of $15,187 were reclassified to other current assets from other assets as of December 31, 2009, the balance of which was $14,283 at the Commencement Date when it was written off.
Restricted Cash
At December 31, 2010 the Company had $13.7 million of restricted cash, which was classified as a current asset. The restricted cash serves as collateral for letters of credit and no letter of credit has a maturity greater than one year, although certain of them can be renewed for another year. The cash is held in custody by the issuing bank, is restricted as to withdrawal or use and is currently invested in money market funds. Income from these funds is paid to the Company.
F-11
Table of Contents
XERIUM TECHNOLOGIES, INC.
NOTES TO CONSOLIDATED FINANCIAL STATEMENTS—(Continued)
(dollars in thousands except per share data)
December 31, 2010
2. Accounting Policies
Basis of Presentation
The consolidated financial statements have been prepared on the basis of GAAP. The consolidated financial statements include the accounts of Xerium Technologies, Inc. and its wholly-owned subsidiaries. Intercompany accounts and transactions have been eliminated.
Revenue Recognition
Revenue on product sales is recognized when persuasive evidence of an arrangement exists, the price is fixed and determinable, delivery including transfer of title has occurred, and there is a reasonable assurance of collection of the sales proceeds. The Company generally obtains written purchase authorizations from customers for a specific product at a specified price and considers delivery and transfer of title to have occurred primarily at the time of shipment. Revenue is recorded net of applicable allowances, including estimated allowances for returns, rebates, and other discounts. The Company sells to certain customers on a consignment basis. As part of the consignment agreement the Company delivers the goods to a location designated by the customer. In addition, the customer and the Company agree to a “sunset” date, which represents the date by which the customer must accept all risks and rewards of ownership of the product and payment terms begin. For consignment sales, revenue is recognized on the earlier of actual product installation or the “sunset” date.
Classification of Costs and Expenses
Cost of products sold includes raw materials, manufacturing labor, direct and indirect overhead costs, product freight, and depreciation of manufacturing plant and equipment. Warehousing costs incurred as a result of customer-specific delivery terms are also included in cost of products sold.
Selling expenses include direct sales force salaries, commissions and expenses as well as agents’ commissions and fees, other warehousing costs, advertising costs and marketing costs.
General and administrative expenses include costs relating to management and administrative staff such as employee compensation and benefits, travel and entertainment, non-manufacturing facility occupancy costs including rent expense and professional fees, as well as depreciation on non-manufacturing equipment and office supplies and expenses.
Research and development expenses are comprised of engineering staff wages and associated fringe benefits, as well as the cost of prototypes, testing materials and non-capitalizable testing equipment.
Advertising Costs
Selling expenses include advertising expenses of $1,108, $898 and $1,501 in 2010, 2009 and 2008, respectively. The Company expenses all advertising costs as incurred.
Translation of Financial Statements
The reporting currency of the Company is U.S. Dollars. Assets and liabilities of non-U.S. operations are translated at year-end rates of exchange, and the consolidated statements of operations and cash flows are
F-12
Table of Contents
XERIUM TECHNOLOGIES, INC.
NOTES TO CONSOLIDATED FINANCIAL STATEMENTS—(Continued)
(dollars in thousands except per share data)
December 31, 2010
translated at the average rates of exchange during the year. Gains and losses resulting from translating non-U.S. Dollar denominated financial statements are recorded in accumulated other comprehensive income (loss) as a component of stockholders’ equity (deficit).
Foreign Exchange
Foreign exchange gains and losses arising out of transactions denominated in currencies other than a subsidiary’s functional currency are recorded in the consolidated statements of operations. Net exchange gains and losses are recorded in “Foreign exchange gain (loss)” and amounted to a gain of $1,668 for the year ended December 31, 2010, a loss of $905 for the year ended December 31, 2009 and a gain of $6,356 for the year ended December 31, 2008. Certain intercompany loans have been determined to be permanent, and accordingly, foreign exchange gains or losses related to such loans are recorded in accumulated other comprehensive income (loss).
Derivatives and Hedging
Effective January 1, 2009, the Company adopted Accounting Standards Codification (“ASC”) Topic 815-10-65-1, Transition and Effective Date Related to FASB Statement No. 161, Disclosures about Derivative Instruments and Hedging Activities—an amendment of FASB Statement No. 133 (“Topic 815-10-65-1”) for disclosure related to derivatives and hedging. Topic 815-10-65-1 amends and expands the disclosure requirements to provide users of financial statements with an enhanced understanding of: (a) how and why an entity uses derivative instruments, (b) how derivative instruments and related hedged items are accounted for and (c) how derivative instruments and related hedged items affect an entity’s financial position, financial performance, and cash flows. Topic 815-10-65-1 requires qualitative disclosures about objectives and strategies for using derivatives, quantitative disclosures about the fair value of and gains and losses on derivative instruments and disclosures about credit-risk-related contingent features in derivative instruments.
As required by ASC Topic 815 Derivatives and Hedging (“Topic 815”), the Company records all derivatives on the balance sheet at fair value. The accounting for changes in the fair value of derivatives depends on the intended use of the derivative, whether the Company has elected to designate a derivative in a hedging relationship and apply hedge accounting and whether the hedging relationship has satisfied the criteria necessary to apply hedge accounting. Derivatives designated and qualifying as a hedge of the exposure to changes in the fair value of an asset, liability or firm commitment attributable to a particular risk are considered fair value hedges. Derivatives designated and qualifying as a hedge of the exposure to variability in expected future cash flows, or other types of forecasted transactions, are considered cash flow hedges. Derivatives may also be designated as hedges of the foreign currency exposure of a net investment in a foreign operation. Hedge accounting generally provides for the matching of the timing of gain or loss recognition on the hedging instrument with the recognition of the changes in the fair value of the hedged asset or liability that are attributable to the hedged risk in a fair value hedge or the earnings effect of the hedged forecasted transactions in a cash flow hedge.
The Company may enter into derivative contracts that are intended to economically hedge certain of its risks, even though hedge accounting does not apply or the Company elects not to apply hedge accounting under Topic 815.
F-13
Table of Contents
XERIUM TECHNOLOGIES, INC.
NOTES TO CONSOLIDATED FINANCIAL STATEMENTS—(Continued)
(dollars in thousands except per share data)
December 31, 2010
Estimates
The preparation of financial statements in conformity with U.S. GAAP requires management to make estimates and assumptions that affect the reported amounts of assets and liabilities and disclosure of contingent assets and liabilities at the date of the financial statements and the reported amounts of net sales and expenses during the reporting period. Actual results could differ from those estimates.
Cash and Cash Equivalents
Cash and cash equivalents consist of cash and highly liquid short-term investments with maturities of three months or less when acquired. Short-term investments consist of time deposits or money market accounts at investment-grade banks. As of December 31, 2010, certain of the Company’s deposits in U.S. bank accounts exceeded the FDIC guarantee of $250 per depositor.
Accounts Receivable and Allowance for Doubtful Accounts
Accounts Receivable are recorded cost, and do not bear interest. Bad debt provisions are included in general and administrative expense. The amounts recorded are derived based upon the general aging of receivables, specific customer credit history and payment trends, and any new business conditions.
Inventories
Inventories are valued at the lower of cost or market using the first-in, first-out (FIFO) method. Raw materials are valued principally on a weighted average cost basis. The Company’s work in process and finished goods are specifically identified and valued based on actual inputs to production. Provisions are recorded as appropriate to write-down obsolete and excess inventory to estimated net realizable value. The process for evaluating obsolete and excess inventory often requires management to make subjective judgments and estimates concerning future sales levels, quantities and prices at which such inventory will be able to be sold in the normal course of business, while considering the general aging of inventory and factoring in any new business conditions. Expenses for inventory write downs were not material in 2010 and $3,882 and $13,351 during the years ended December 31, 2009 and 2008, respectively.
Financial Instruments
The carrying value of cash and cash equivalents, trade receivables, other current assets, accounts payable, notes payable and amounts included in accruals meeting the definition of a financial instrument approximate fair value due to their short-term nature. The carrying value of long-term debt is greater than its fair value (see Note 8). The Company determines estimated fair values based upon quoted market values where applicable or management estimates.
F-14
Table of Contents
XERIUM TECHNOLOGIES, INC.
NOTES TO CONSOLIDATED FINANCIAL STATEMENTS—(Continued)
(dollars in thousands except per share data)
December 31, 2010
Long-lived Assets
Property and equipment
Property and equipment are recorded at cost. Property and equipment acquired in connection with acquisitions are recorded at fair value as of the date of the acquisition, and subsequent additions are recorded at cost. Depreciation is computed using the straight-line method over the following estimated useful lives:
| Asset |
Years | |||||
| Buildings and improvements |
3-50 | |||||
| Machinery and equipment |
— Heavy |
16-25 | ||||
| — General |
13-15 | |||||
| — Light |
6-12 | |||||
| — Molds, tools, office and computers |
2-5 | |||||
Impairment
The Company reviews its long-lived assets that have finite lives for impairment in accordance with ASC Topic 360, Property, Plant, and Equipment (“Topic 360”). This topic requires that companies evaluate the fair value of long-lived assets based on the anticipated undiscounted future cash flows to be generated by the assets when indicators of impairment exist to determine if there is impairment to the carrying value. Any change in the carrying amount of an asset as a result of the Company’s evaluation has been recorded in restructuring and impairments expense in the consolidated statements of operations. Impairment charges are discussed in Note 14.
Intangible assets
Intangible assets consist of patents, licenses, trademarks and deferred financing costs. As of December 31, 2009, deferred financing costs were reclassified to other current assets as a result of the Company’s credit issues.
Patents, licenses and trademarks are amortized on a straight-line basis over their remaining lives, which range from three to fifteen years. Deferred financing costs are amortized using the effective interest method as a component of interest expense over the life of the related debt.
Goodwill
The Company accounts for goodwill and other intangible assets in accordance with ASC Topic 350, Intangibles—Goodwill and Other Intangible Assets (“Topic 350”). Topic 350 requires that goodwill and intangible assets that have indefinite lives not be amortized but, instead, must be tested at least annually for impairment or whenever events or business conditions warrant. Goodwill impairment testing is a two-step process. Step 1 involves comparing the fair value of the Company’s reporting unit to its carrying amount. If the fair value of the reporting unit is greater than its carrying amount, there is no impairment. If the reporting unit carrying amount is greater than the fair value then the second step must be completed to measure the amount of impairment, if any. Step 2 calculates the implied fair value of goodwill by deducting the fair value of the net assets of the reporting unit from the fair value of the reporting unit as determined in Step 1. The implied fair value of goodwill determined in this step is compared to the carrying value of goodwill. If the implied fair value of goodwill is less than the carrying value of goodwill, an impairment loss is recognized equal to the difference.
F-15
Table of Contents
XERIUM TECHNOLOGIES, INC.
NOTES TO CONSOLIDATED FINANCIAL STATEMENTS—(Continued)
(dollars in thousands except per share data)
December 31, 2010
The Company performs an annual test for goodwill impairment as of December 31st at the reporting unit level. The Company has two reporting units: clothing and roll covers. For the purpose of performing the annual impairment test, the Company allocates all shared assets and liabilities to the reporting units based on the percentage of each reporting unit’s revenue to total revenue. Shared operating expenses are allocated to the reporting unit to the extent necessary to allow them to operate as independent businesses. To determine if impairment exists, the fair value of each reporting unit is compared to its carrying value. The fair value of the Company’s reporting unit is determined by using a weighted combination of both a market multiple approach and an income approach. The market multiple approach utilizes the Company’s and its competitors’ proprietary information that is used to value its reporting units. The income approach is a present value technique used to measure the fair value of future cash flows produced by each reporting unit. As a result of the annual test for goodwill impairment performed as of December 31, 2010, the Company determined that no goodwill impairment exists.
As of December 31, 2009, the Company recorded a non-cash charge for goodwill impairment of $80,600 related to its roll covers reporting unit based on assessments performed as of that date. Applying the guidance of Topic 350, the Company determined that as of December 31, 2009, goodwill for the roll covers segment was impaired primarily due to the adverse effect of the Company’s credit issues and the effects of the current global economic environment. Step 1 of the process indicated that the fair value of the net assets of the roll covers segment was $3,600 less than their carrying value as of December 31, 2009. Based on the Step 1 result, the Company proceeded with Step 2. Based on the increase in fair value of tangible and intangible assets over book value of $77,000 as determined in Step 2, an aggregate impairment of $80,600 was recorded.
To date, there have been no indicators of impairment or recorded goodwill impairment for the Company’s clothing segment.
Stock-Based Compensation
The Company records stock-based compensation expense in accordance with ASC Topic 718, Compensation—Stock Compensation (“Topic 718”) which generally requires that such transactions be recognized in the statement of operations based on their fair values at the date of grant. See Note 13 for further discussion.
Net Income (Loss) Per Common Share
Net income (loss) per common share has been computed and presented pursuant to the provisions of ASC Topic 260, Earnings per Share (“Topic 260”). Net income (loss) per share is based on the weighted-average number of shares outstanding during the period.
As of December 31, 2010, 2009 and 2008, the Company had outstanding restricted stock units (“RSUs”) (See Note 13). Diluted average shares outstanding were computed using (i) the average market price for time-based RSUs and (ii) the actual grant date market price for non-employee director RSUs. The calculation of diluted earnings per share excludes the Company’s performance-based RSUs that are based on shareholder return targets because the performance criteria had not been contingently achieved and therefore the RSUs were not contingently issuable. For the years ended December 31, 2010 and 2009, the dilutive effect of potential future issuances of common stock underlying the Company’s RSUs was excluded from the calculation of diluted
F-16
Table of Contents
XERIUM TECHNOLOGIES, INC.
NOTES TO CONSOLIDATED FINANCIAL STATEMENTS—(Continued)
(dollars in thousands except per share data)
December 31, 2010
average shares outstanding because their effect would have been anti-dilutive as the Company incurred a net loss during those years. For the year ended December 31, 2008, the dilutive effect of potential future issuances of common stock underlying certain of the Company’s RSUs was excluded from the calculation of diluted average shares outstanding because their effect would have been anti-dilutive.
| 2010 | 2009 | 2008 | ||||||||||
| Weighted-average common shares outstanding—basic |
10,019,098 | 2,445,381 | 2,306,692 | |||||||||
| Dilutive effect of stock-based compensation awards outstanding |
— | — | 3,131 | |||||||||
| Weighted-average common shares outstanding—diluted |
10,019,098 | 2,445,381 | 2,309,823 | |||||||||
RSU’s aggregating approximately 0.5 million, 0.4 million and 1.0 million shares were outstanding during the years ended December 31, 2010, 2009 and 2008, respectively, but were not included in the computation of diluted earnings per share because the impact of including such shares would be anti-dilutive to the earnings per share calculation.
Income Taxes
The Company accounts for income taxes in accordance with ASC Topic 740, Income Taxes (“Topic 740”), which requires the recognition of deferred tax assets and liabilities for the expected future consequences attributable to differences between the financial statement carrying amounts of existing assets and liabilities and their respective tax bases. Deferred tax assets, representing future tax benefits, are reduced by a valuation allowance when the determination can be made that it is “more likely than not” that all or a portion of the related tax asset will not be realized. The deferred tax provision or benefit represents the change in deferred tax assets and liabilities, excluding any amounts accounted for as components of goodwill or accumulated other comprehensive loss, from the prior year, including the effect of foreign currency translation thereon. While the Company believes it has adequately provided for its income tax receivable or liabilities and its deferred tax assets or liabilities in accordance with FASB income tax guidance, adverse determination by taxing authorities or changes in tax laws and regulations could have a material adverse effect on the Company’s consolidated financial condition, results of operations or cash flows. Income taxes are further discussed in Note 9.
Warranties
The Company offers warranties on certain products that it sells. The specific terms and conditions of these warranties vary depending on the product sold, the country in which the product is sold and arrangements with the customer. The Company estimates the costs that may be incurred under its warranties and records a liability for such costs. Factors that affect the Company’s warranty liability include the number of units sold, historical and anticipated rates of warranty claims, cost per claim and new product introduction. The Company periodically assesses the adequacy of its recorded warranty claims and adjusts the amounts as necessary. Below represents the changes in the Company’s warranty liability for 2010 and 2009:
| Balance at Beginning of Year |
Charged to Revenue or Cost of Sales |
Effect of
Foreign Currency Translation |
Deduction from Reserves |
Balance at End of Year |
||||||||||||||||
| For the year-ended December 31, 2010 |
$ | 1,973 | $ | 1,472 | $ | (95 | ) | $ | (1,662 | ) | $ | 1,688 | ||||||||
| For the year-ended December 31, 2009 |
$ | 2,424 | $ | 2,018 | $ | 80 | $ | (2,549 | ) | $ | 1,973 | |||||||||
F-17
Table of Contents
XERIUM TECHNOLOGIES, INC.
NOTES TO CONSOLIDATED FINANCIAL STATEMENTS—(Continued)
(dollars in thousands except per share data)
December 31, 2010
Commitments and Contingencies
The Company provides accruals for all direct costs associated with the estimated resolution of contingencies at the earliest date at which it is deemed probable that a liability has been incurred and the amount of such liability can be reasonably estimated. Costs accrued have been estimated based on consultation with legal counsel and are based upon an analysis of potential results, assuming a combination of litigation and settlement strategies and outcomes.
Reclassifications
Certain prior year balances have been reclassified to conform to the current year presentation.
New Accounting Standards
In December 2010, the FASB issued ASU 2010-28, Intangibles—Goodwill and Other (Topic 350): When to Perform Step 2 of the Goodwill Impairment Test for Reporting Units with Zero or Negative Carrying Amounts (“ASU No. 2010-28”). The amendments in ASU-2010-28 specify that if a public entity presents comparative financial statements, the entity should disclose revenue and earnings of the combined entity as though the business combination(s) that occurred during the current year had occurred as of the beginning of the comparable prior annual reporting period only. The amendments also expand the supplemental pro forma disclosures to include a description of the nature and amount of material, nonrecurring pro forma adjustments directly attributable to the business combination included in the reported pro forma revenue and earnings. The amendments are effective prospectively for business combinations for which the acquisition date is on or after the beginning of the first annual reporting period beginning on or after December 15, 2010. Early adoption is permitted. The Company believes the adoption of ASU No. 2010-28 will not have a material impact on its financial statements for the period.
In April 2010, the FASB issued ASU No. 2010-13, Compensation—Stock Compensation (Topic 718): Effect of Denominating the Exercise Price of a Share-Based Payment Award in the Currency of the Market in Which the Underlying Equity Security Trades—a consensus of the FASB Emerging Issues Task Force (“ASU No. 2010-13”). ASU No. 2010-13 provides amendments to ASC Topic 718, Compensation—Stock Compensation (“Topic 718”) to clarify that an employee share-based payment award with an exercise price denominated in the currency of a market in which a substantial portion of the entity’s equity securities trades should not be considered to contain a condition that is not a market, performance or service condition. Therefore, an entity would not classify such an award as a liability if it otherwise qualifies as equity. ASU No. 2010-13 is effective for fiscal years beginning on or after December 15, 2010. The Company believes the adoption of ASU No. 2010-13 will have no impact on its financial statements for the period.
In March 2010, the Financial Accounting Standards Board (“FASB”) issued Accounting Standards Update (“ASU”) No. 2010-11, Derivatives and Hedging (Topic 815): Scope Exception Related to Embedded Credit Derivatives (“ASU No. 2010-11”). ASU No. 2010-11 clarifies that the scope exception in Topic 815 paragraphs 15-15-8 through 15-9 only applies to the transfer of credit risk in the form of subordination of one financial instrument to another. ASU No. 2010-11 is effective for fiscal quarters beginning after June 15, 2010. The adoption of ASU No. 2010-11 had no impact on the Company’s financial statements.
On February 24, 2010, the Financial Accounting Standards Board (“FASB”) issued Accounting Standard Update (“ASU”) No. 2010-09, Subsequent Events (Topic 855): Amendments to Certain Recognition and
F-18
Table of Contents
XERIUM TECHNOLOGIES, INC.
NOTES TO CONSOLIDATED FINANCIAL STATEMENTS—(Continued)
(dollars in thousands except per share data)
December 31, 2010
Disclosure Requirements (“ASU 2010-09”). The amendments in ASU 2010-09 remove the requirement for a Securities and Exchange Commission (“SEC”) filer to disclose a date through which subsequent events have been evaluated in both issued and revised financial statements. The amendments of ASU 2010-09 were effective upon issuance and had no impact on the Company’s consolidated financial statements.
In August 2009, FASB issued ASU No. 2009-05—Measuring Liabilities at Fair Value (“ASU 2009-05”), which is an update of ASC Topic 820, Fair Value Measurements. ASU 2009-05 was issued to reduce potential ambiguity in financial reporting related to the fair value of liabilities by providing clarification on measuring liabilities at fair value when a quoted price in an active market is not available. ASU 2009-05 is effective for the fourth quarter of 2009. The adoption of ASU 2009-05 had no impact on the Company’s consolidated financial statements.
In June 2009, the FASB issued ASU No. 2009-01, Topic 105—Generally Accepted Accounting Principles, amendments based on Statement of Financial Accounting Standards (“SFAS”) No. 168—The FASB Accounting Standards Codification™ and the Hierarchy of Generally Accepted Accounting Principles (“ASU No. 2009-01”). ASU No. 2009-01 is effective for interim periods ending after September 15, 2009 and identifies the sources of accounting principles and the framework for selecting the principles used in the preparation of financial statements of nongovernmental entities that are presented in conformity with generally accepted accounting principles in the United States (“GAAP”). The objective of this statement is to establish the FASB Accounting Standards Codification™ (Codification) as the source of authoritative accounting principles recognized by the FASB to be applied by nongovernmental entities in the preparation of financial statements in conformity with GAAP. Rules and interpretive releases of the Securities and Exchange Commission (“SEC”) under authority of federal securities laws are also sources of authoritative GAAP for SEC registrants. The adoption of ASU No. 2009-01 had no material impact on the Company’s consolidated financial statements.
In June 2009, the FASB issued ASC Topic 810, Amendments to FASB Interpretation No. 46(R) (“Topic 810”), which amends the consolidation guidance applicable to variable interest entities. The amendments will significantly affect the overall consolidation analysis under FASB Interpretation No. 46(R). Topic 810 was effective as of the beginning of the first fiscal year that begins after November 15, 2009 and the adoption of Topic 810 had no impact on the Company’s consolidated financial statements.
In June 2009, the FASB issued ASC Topic 860, Accounting for Transfers of Financial Assets—an amendment of FASB Statement No. 140 (“Topic 860”). Topic 860 is intended to improve the relevance, representational faithfulness and comparability of the information that a reporting entity provides in its financial statements about a transfer of financial assets; the effects of a transfer on its financial position, financial performance, and cash flows; and a transferor’s continuing involvement, if any, in transferred financial assets. Topic 860 was applied in the reporting period ended December 31, 2009, in accordance with the effective date of Topic 860 and the adoption had no impact on the Company’s consolidated financial statements.
In April 2009, the FASB issued, in ASC Topic 825-10-65, Transition Related to FSP FAS 107-1 and APB 28-1, Interim Disclosures about Fair Value of Financial Instruments (“Topic 825-10-65”), requirements for disclosure about fair value of financial instruments for interim reporting periods of publicly traded companies as well as in annual financial statements. Topic 825-10-65 is effective for interim reporting periods ending after June 15, 2009. The adoption of Topic 825-10-65 had no material impact on the Company’s consolidated financial statements. See Note 8 for further discussion of fair value as it relates to the Company’s derivatives and senior debt.
F-19
Table of Contents
XERIUM TECHNOLOGIES, INC.
NOTES TO CONSOLIDATED FINANCIAL STATEMENTS—(Continued)
(dollars in thousands except per share data)
December 31, 2010
Effective January 1, 2009, the Company adopted ASC Topic 815-10-65-1 for disclosure related to derivatives and hedging. See “Derivatives and Hedging” above. The Company’s adoption of Topic 815-10-65-1 had no material effect on its consolidated financial statements.
In December 2008, the FASB issued ASC Topic 715, Employers’ Disclosures about Postretirement Benefit Plan Assets (“Topic 715”), which is effective for fiscal years ending after December 15, 2009. Upon initial application, the provisions of Topic 715 are not required for earlier periods that are presented for comparative purposes. This ASC Topic amends FASB Statement No. 132 (revised 2003), Employers’ Disclosures about Pensions and Other Postretirement Benefits, to provide guidance on an employer’s disclosures about plan assets of defined benefit pension or other postretirement plan. The objectives of the disclosures about plan assets in an employer’s defined benefit pension or other postretirement plan are to provide users of financial statements with an understanding of how investment allocation decisions are made, the major categories of plan assets, the inputs and valuation techniques used to measure the fair value of plan assets, the effect of fair value measurements using significant unobservable inputs (Level 3) on changes in plan assets for the period and significant concentrations of risk within plan assets. See Note 10 for the Company’s disclosures in accordance with Topic 715.
In May 2008, the FASB issued ASC Topic 260-10-65-2, Transition Related to FSP EITF 03-6-1 (“Topic 260”), which addresses whether instruments granted in share-based payment transactions are participating securities prior to vesting and, therefore, need to be included in the allocation in computing earnings per share under the two-class method. The FASB concluded that all outstanding unvested share-based payment awards that contain rights to nonforfeitable dividends participate in undistributed earnings with common shareholders. If awards are considered participating securities, the Company is required to apply the two-class method of computing basic and diluted earnings per share. These provisions of Topic 260 are effective for fiscal years beginning after December 15, 2008 and interim periods within those fiscal years. Early adoption is prohibited. The implementation of the provisions of Topic 260 did not impact the Company’s consolidated financial statements. effective January 1, 2008, the Company partially adopted provisions of ASC Topic 820, Fair Value Measurements and Disclosures, for measuring its derivative assets and liabilities. See further discussion at Note 8 “Derivatives and Hedging”. ASC Topic 820-10-65-1, Transition related to FASB Staff Position FAS157-2, Effective Date of FASB Statement No. 157 permits the Company to defer the recognition and measurement of its nonfinancial assets and nonfinancial liabilities until January 1, 2009. At January 1, 2009, the Company did not have any nonfinancial assets or nonfinancial liabilities that are recognized or disclosed at fair value.
3. Inventories
The components of inventories are as follows at:
| December 31 | ||||||||
| 2010 | 2009 | |||||||
| Raw materials |
$ | 19,144 | $ | 17,466 | ||||
| Work in process |
27,065 | 26,811 | ||||||
| Finished goods (includes consigned inventory of $11,784 in 2010 and $10,701 in 2009) |
35,718 | 33,897 | ||||||
| $ | 81,927 | $ | 78,174 | |||||
F-20
Table of Contents
XERIUM TECHNOLOGIES, INC.
NOTES TO CONSOLIDATED FINANCIAL STATEMENTS—(Continued)
(dollars in thousands except per share data)
December 31, 2010
4. Property and Equipment
Property and equipment consist of the following at:
| December 31 | ||||||||
| 2010 | 2009 | |||||||
| Land |
$ | 23,915 | $ | 24,874 | ||||
| Buildings and improvements |
152,867 | 161,019 | ||||||
| Machinery and equipment |
614,585 | 605,107 | ||||||
| Construction in progress |
16,923 | 17,954 | ||||||
| Total |
808,290 | 808,954 | ||||||
| Less accumulated depreciation |
(447,020 | ) | (423,405 | ) | ||||
| $ | 361,270 | $ | 385,549 | |||||
The Company recorded $39.0 million and $39.5 million in depreciation expense in 2010 and 2009, respectively.
5. Goodwill, Intangible Assets and Deferred Financing Costs
The following table provides changes in the carrying amount of goodwill by segment for the years ended December 31, 2010 and 2009:
| Clothing | Roll Covers |
Total | ||||||||||
| Balance at December 31, 2008 |
$ | 57,102 | $ | 98,103 | $ | 155,205 | ||||||
| Goodwill Impairment |
— | (80,600 | ) | (80,600 | ) | |||||||
| Foreign currency translations |
(4,633 | ) | 2,332 | (2,301 | ) | |||||||
| Balance at December 31, 2009 |
52,469 | 19,835 | 72,304 | |||||||||
| Goodwill impairment |
— | — | — | |||||||||
| Foreign currency translations |
(10,905 | ) | (441 | ) | (11,346 | ) | ||||||
| Balance at December 31, 2010 |
$ | 41,564 | $ | 19,394 | $ | 60,958 | ||||||
F-21
Table of Contents
XERIUM TECHNOLOGIES, INC.
NOTES TO CONSOLIDATED FINANCIAL STATEMENTS—(Continued)
(dollars in thousands except per share data)
December 31, 2010
The components of intangible assets and deferred financing costs are summarized as follows at:
| December 31 | ||||||||
| 2010 | 2009 | |||||||
| Patents and licenses |
$ | 31,920 | $ | 31,920 | ||||
| Less accumulated amortization |
(27,655 | ) | (26,703 | ) | ||||
| Net patents and licenses |
4,265 | 5,217 | ||||||
| Trademarks |
18,920 | 18,920 | ||||||
| Less accumulated amortization |
(13,985 | ) | (12,726 | ) | ||||
| Net trademarks |
4,935 | 6,194 | ||||||
| Other intangibles |
952 | 952 | ||||||
| Less accumulated amortization |
(379 | ) | (272 | ) | ||||
| Net other intangibles |
573 | 680 | ||||||
| Deferred financing costs |
3,716 | 35,754 | ||||||
| Less accumulated amortization |
(531 | ) | (20,567 | ) | ||||
| Net deferred financing costs (1) |
3,185 | 15,187 | ||||||
| Net amortizable intangible assets and deferred financing costs |
12,958 | 27,278 | ||||||
| Less net deferred financing costs reclassified to other current assets (1) |
— | (15,187 | ) | |||||
| $ | 12,958 | $ | 12,091 | |||||
| (1) | In connection with the senior credit facility matters discussed in Note 1, the accompanying consolidated balance sheet as of December 31, 2009 includes a reclassification of $15,187 from “Intangible assets and deferred financing costs, net” to “Other current assets” to reflect the classification of net deferred financing costs related to the debt under the senior credit facility as a current asset. |
Amortization expense for patents, licenses, trademarks and other intangibles amounted to $2,318, $2,328 and $2,965 for the years ended December 31, 2010, 2009 and 2008, respectively.
As of December 31, 2010, the estimated annual amortization expense for patents, licenses and trademarks and other intangibles for each of the succeeding five years total $8,230 as follows:
| 2011 |
$ | 2,296 | ||
| 2012 |
2,296 | |||
| 2013 |
1,765 | |||
| 2014 |
1,514 | |||
| 2015 |
359 |
F-22
Table of Contents
XERIUM TECHNOLOGIES, INC.
NOTES TO CONSOLIDATED FINANCIAL STATEMENTS—(Continued)
(dollars in thousands except per share data)
December 31, 2010
6. Notes Payable
At December 31, 2010 and 2009, notes payable consisted of the following:
| December 31 | ||||||||
| 2010 | 2009 | |||||||
| Unsecured notes (1) |
$ | 184 | $ | 1,665 | ||||
| Secured notes (2) |
— | 48,136 | ||||||
| Total |
$ | 184 | $ | 49,801 | ||||
| (1) | In 2010 and 2009, unsecured notes payable consisted primarily of committed lines of credit at banks to fund short-term working capital needs. The weighted-average interest rate on outstanding notes payable borrowings in 2010 and 2009 was 3.48% and 7.03%. |
| (2) | During 2009, the Company had borrowings under its revolver of $28,100, essentially all of which was borrowed in the first quarter of 2009. These borrowings were settled on the Effective Date in accordance with the Plan. The unused portion of these lines of credit totaled $6,638 at December 31, 2009. The secured portion of the debt is collateralized by letters of credit available under a multi-currency revolving credit facility of $50,000 which was a part of the Company’s credit agreement. Interest rates were variable and were based upon local market rates. Annual commitment and similar fees charged by the banks approximate 0.75% of the unused facilities. The weighted-average interest rate on the total of all facilities available was 6.52% in 2009. Additionally, on December 31, 2009 the Company terminated with the counterparties all of its outstanding interest rate swap liabilities of $20,036 and converted them into notes payable to such counterparties. These borrowings were settled on the Effective Date in accordance with the Plan. The swap termination counterparties have rights similar to the lenders under the credit facility. See Note 8 for further discussion of derivatives. |
7. Debt
In connection with the Company’s initial public offering in 2005, the Company entered into a $700,000 senior secured credit facility that provided for a term loan with a total principal amount of $650,000 and a $50,000 senior secured revolving credit facility. (Collectively, the “Senior Credit Facility”). In 2010, as discussed in Note 1, the Company and certain of its subsidiaries filed voluntary petitions for relief under chapter 11 of the Bankruptcy Code on the Commencement Date, and the Company and the Debtor Subsidiaries emerged from chapter 11 on the Effective Date. On the Effective Date, the Company entered into an amendment and restatement of its Senior Credit Facility pursuant to which, among other things, the total outstanding debt obligations under the senior credit facility, which at May 25, 2010 were $603,590 (including waiver fees of $1,380) were reduced to $410,000 (“Second Lien Debt”). Also on the Effective Date, pursuant to the Plan, the DIP Facility was converted into an Exit Facility consisting of a $20,000 revolving credit facility and a $60,000 term loan (“First Lien Debt”) used to fund the Company’s emergence from chapter 11 and ongoing working capital requirements. As of December 31, 2010, no borrowings have been made under the revolving credit facility. See Note 1 for additional information related to the terms of the Amended and Restated Credit Facility and the Exit Facility.
The credit facility provides for quarterly scheduled principal payments on the term loans and approximately $57,500 and $382,000 due at maturity in November 2013 and May 2014, respectively. This facility contains covenants based on certain measures of debt levels and interest coverage, all calculated in relation to Adjusted
F-23
Table of Contents
XERIUM TECHNOLOGIES, INC.
NOTES TO CONSOLIDATED FINANCIAL STATEMENTS—(Continued)
(dollars in thousands except per share data)
December 31, 2010
EBITDA as defined in the credit agreement, and restrictions on capital expenditures. At December 31, 2010, management believes the Company was in compliance with these covenants. In addition, substantially all of the Company’s assets are pledged as collateral under the credit facility.
At December 31, 2010 and 2009, Long-term debt consisted of the following:
| December 31 | ||||||||
| 2010 | 2009 | |||||||
| Senior Bank Debt (Secured): |
||||||||
| First lien debt, payable quarterly, U.S. Dollar denominated—LIBOR (minimum 2.00%) plus 4.50% (6.5%) as of December 31, 2010 |
$ | 59,701 | $ | — | ||||
| Second lien Debt, payable quarterly, US Dollar denominated—LIBOR (minimum 2.00%) plus 6.25% (8.25%) as of December 31, 2010; First lien debt, payable quarterly, LIBOR of 0.25% plus 6.50% (6.75%) as of December 31, 2009 |
228,248 | 299,494 | ||||||
| Second lien debt, payable quarterly Euro denominated —EURIBOR (minimum 2.00%) plus 6.25% (8.25%) as of December 31, 2010; First lien debt, payable quarterly, EURIBOR plus 6.50% (7.15%) as of December 31, 2009 |
137,814 | 216,064 | ||||||
| Second lien debt, payable quarterly, Canadian Dollar denominated—CDOR (minimum 2.00%) plus 6.25% (8.25%) as of December 31, 2010; First lien debt, payable quarterly, CDOR plus 6.50% (6.94%) as of December 31, 2009 |
49,800 | 68,006 | ||||||
| 475,563 | 583,564 | |||||||
| Other Long-Term Debt: |
||||||||
| Unsecured, interest fixed at 2.00% to 2.50%, Euro denominated |
2,035 | 1,789 | ||||||
| Unsecured, interest fixed at 2.85% to 3.90%, Yen denominated |
3.579 | 4,967 | ||||||
| 481,177 | 590,320 | |||||||
| Less current maturities |
12,794 | 1,826 | ||||||
| Less long-term debt classified as current (1) |
— | 583,564 | ||||||
| Total |
$ | 468,383 | $ | 4,930 | ||||
| (1) | In connection with the senior credit facility matters discussed in Note 1, the accompanying consolidated balance sheet as of December 31, 2009 includes a reclassification of $583,564 from “Long term debt, net of current maturities” to current debt as “Long-term debt classified as current”. As of December 31, 2010, the long term debt under the senior credit facility was classified as “Long term debt, net of current maturities”. |
During 2010, 2009 and 2008 the Company recorded $57.9 million, $68.5 million, and $60.3 million in interest expense.
During 2010, the Company made aggregate scheduled debt payments of approximately $4,500 under the Amended and Restated Credit Facility and Exit Facility. In 2009, the Company made scheduled repayments of approximately $19,600 under the Senior Credit Facility. The Company may be required to make debt repayments in addition to the required amortization, subsequent to the 2011 fiscal year, based on its “excess cash” generated in 2011, as defined in its credit agreement. The Company was required to make additional debt repayments of
F-24
Table of Contents
XERIUM TECHNOLOGIES, INC.
NOTES TO CONSOLIDATED FINANCIAL STATEMENTS—(Continued)
(dollars in thousands except per share data)
December 31, 2010
approximately $19,200 during 2009 for “excess cash” based on 2008 calculations. No additional payments were required in 2010 based on 2009 “excess cash” nor are any additional payments required in 2011. Because the amounts of any such future repayments are not currently determinable, they are excluded from the long-term debt maturities schedule below. In addition, substantially all of the Company’s assets are pledged as collateral under the Amended and Restated Credit Facility. At December 31, 2010, the Company had $26,032 available under the senior credit facilities.
The aggregate maturities of long-term debt for each of the following five years and thereafter are as follows:
| 2011 |
$ | 12,794 | ||
| 2012 |
10,105 | |||
| 2013 |
9,493 | |||
| 2014 |
66,526 | |||
| 2015 |
382,259 | |||
| Thereafter |
— | |||
| $ | 481,177 | |||
Additionally, as of December 31, 2010, the carrying value of the term debt under the Company’s Amended and Restated Credit Facility was $475,563, and exceeded its fair value of $464,563. At December 31, 2009, the carrying value of the term debt under the Company’s senior credit facility was $583,564 and exceeded its fair value of approximately $485,000. The Company determined the fair value of its debt utilizing quoted prices in active markets for its own debt (Level 1 of the fair value hierarchy).
8. Derivatives and Hedging
Risk Management Objective of Using Derivatives
The Company is exposed to certain risks arising from both its business operations and economic conditions. The Company principally manages its exposures to a wide variety of business and operational risks through management of its core business activities. The Company enters into derivative financial instruments to manage exposures that arise from business activities that result in the receipt or payment of future known cash amounts, the value of which are determined by interest rates or foreign exchange rates. Specifically, the Company had entered into interest rate swaps to hedge variable interest related to its senior debt and foreign exchange contracts to protect the U.S. dollar value of certain assets and obligations. On December 31, 2009, the Company terminated with the counterparties all of its outstanding interest rate swap liabilities of $20,036 and converted them into notes payable to such counterparties. No new interest rate swaps have been entered into by the Company.
Cash Flow Hedges of Interest Rate Risk
The Company’s objectives in using interest rate derivatives were to add stability to interest expense and to manage its exposure to interest rate movements. To accomplish this objective, the Company primarily used interest rate swaps as part of its interest rate risk management strategy. Interest rate swaps designated as cash flow hedges involved the receipt of variable-rate amounts from a counterparty in exchange for the Company making fixed-rate payments over the life of the agreements without exchange of the underlying notional amount.
F-25
Table of Contents
XERIUM TECHNOLOGIES, INC.
NOTES TO CONSOLIDATED FINANCIAL STATEMENTS—(Continued)
(dollars in thousands except per share data)
December 31, 2010
As previously discussed, the Company terminated its outstanding interest rate swaps at December 31, 2009 and has not entered into any new interest rate swap agreements since that time. Consequently, the Company’s financial statements are exposed to the effects of interest rate fluctuations which could have a material impact on its results of operations. However, under the Amended and Restated Credit Facility, the CDOR Rate, the LIBOR Rate and the Euribor Rate are subject to a minimum base rate of 2.00% per annum, which is currently higher than the respective base rates.
As disclosed in previous filings, the Company anticipated that it would not be in compliance with certain financial covenants under its senior credit facility for the period ending September 30, 2009 and thus, on September 29, 2009, the Company entered into Waiver and Amendment No. 1 (the “Waiver Agreement”) to the Company’s senior credit facility in effect at that time. As of September 30, 2009 (and as of December 31, 2009), the Company was not in compliance with those covenants. As it was uncertain that the Company would be able to complete any alternative, long-term solutions to its credit issues or to obtain a further waiver prior to expiration of the Waiver Agreement, the Company was no longer able to support that the variable-rate interest payments (hedged transactions) under its senior credit facility were probable of occurring. Therefore, effective September 1, 2009, the Company was required to discontinue cash flow hedge accounting prospectively for its interest rate swaps so that the mark to market changes in their fair value are charged or credited to interest expense. Prior to September 1, 2009, the effective portion of changes in the fair value of derivatives designated and that qualified as cash flow hedges were recorded in accumulated other comprehensive income (loss) and subsequently amortized into earnings in the period that the hedged forecasted transaction affected earnings. The ineffective portion of the change in fair value of the derivatives was recognized directly in earnings. The balance in accumulated other comprehensive loss as of August 31, 2009 related to the interest rate swaps for which hedge accounting was to be subsequently amortized into the statement of operations (interest expense) over the remaining original term of the derivative as the hedged forecasted transactions are also recorded to interest expense, in accordance with Topic 815. In addition, as of March 31, 2010, the Company determined that it was probable that future interest payments on the debt that was in excess of the $410,000 (discussed in Note 1) would not occur. As a result in March 2010, the Company amortized an additional $735 from accumulated other comprehensive income to interest expense, which represented the balance in accumulated other comprehensive income relating to interest payments on the debt that was in excess of $410,000. The remaining balance of $8,986 in accumulated other comprehensive loss related to interest rate swaps was amortized to interest expense through December 31, 2010, the original term of the swaps.
Although these interest rate swaps were subject to mark to market accounting through earnings effective September 1, 2009, prior to their termination with the counterparties as discussed above, they effectively fixed, from a cash flow hedge perspective through December 31, 2009, the interest rate at 10.75% on approximately 79% of the term loan portion of the Company’s pre-petition credit facility. As a result of the termination of the interest rate swaps, the interest rate on the term loan portion of the credit facility was no longer effectively fixed through December 31, 2010, the original term of the swaps.
The tables below present the effect of the Company’s derivative financial instruments on the consolidated statements of operations for the year ended December 31, 2010 and for the year ended December 31, 2009. As of December 31, 2009, the Company had no outstanding interest rate derivatives as a result of the termination of interest rate swaps and their conversion to notes payable, as discussed above, and have not entered into any since that date.
F-26
Table of Contents
XERIUM TECHNOLOGIES, INC.
NOTES TO CONSOLIDATED FINANCIAL STATEMENTS—(Continued)
(dollars in thousands except per share data)
December 31, 2010
Tabular Disclosure of the Effect of Derivative Instruments on the Consolidated Statement of
Operations For the Year Ended December 31, 2010
| Derivatives in Topic 815 Cash Flow Hedging Relationships |
Amount of Gain or (Loss) Recognized in OCI on Derivative (Effective Portion), net of tax |
Location of Gain or (Loss) Reclassified from Accumulated OCI into Income (Effective Portion) |
Amount of
Gain or (Loss) Reclassified from Accumulated OCI into Income (Effective Portion), net of tax |
Location of Gain or (Loss) Recognized in Income on Derivative (Ineffective Portion and Amount Excluded from Effectiveness Testing) |
Amount of Gain or (Loss) Recognized in Income on Derivative (Ineffective Portion and Amount Excluded from Effectiveness Testing) |
|||||||||||||||
| Interest Rate Swaps (1) |
$ | — | Interest expense | $ | — | Interest expense | $ | — | ||||||||||||
| Derivatives Not Designated as Hedging Instruments Under Topic 815 |
Location of Gain or (Loss) Recognized in Income on Derivative |
Amount of Gain or (Loss) Recognized in Income on Derivative |
||||||
| Interest Rate Swaps (1) |
Interest Expense | $ | (9,721 | ) | ||||
| Foreign Currency Hedges |
Foreign exchange loss | (261 | ) | |||||
| $ | (9,982 | ) | ||||||
| (1) | The Company’s interest rate swaps were considered designated hedging instruments through August 31, 2009. As discussed above, effective September 1, 2009, the interest rate swaps were no longer designated hedging instruments. |
F-27
Table of Contents
XERIUM TECHNOLOGIES, INC.
NOTES TO CONSOLIDATED FINANCIAL STATEMENTS—(Continued)
(dollars in thousands except per share data)
December 31, 2010
Tabular Disclosure of the Effect of Derivative Instruments on the Consolidated Statement of Operations
for the Year Ended December 31, 2009
| Derivatives in Topic 815 Cash Flow |
Amount of Gain or (Loss) Recognized in OCI on Derivative (Effective Portion), net of tax |
Location of Gain or (Loss) Reclassified from Accumulated OCI into Income (Effective Portion) |
Amount of
Gain or (Loss) Reclassified from Accumulated OCI into Income (Effective Portion), net of tax |
Location of Gain or (Loss) Recognized in Income on Derivative (Ineffective Portion and Amount Excluded from Effectiveness Testing) |
Amount of Gain or (Loss) Recognized in Income on Derivative (Ineffective Portion and Amount Excluded from Effectiveness Testing) |
|||||||||||||||
| Interest Rate Swaps (1) |
$ | (8,001 | ) | Interest expense | $ | 9,454 | Interest expense | $ | (1,061 | ) | ||||||||||
| Derivatives Not Designated as Hedging Instruments Under Topic 815 |
Location of Gain or (Loss) Recognized in Income on Derivative |
Amount of Gain or (Loss) Recognized in Income on Derivative |
||||||
| Interest Rate Swaps (1) |
Interest Expense | $ | (2,757 | ) | ||||
| Foreign Currency Hedges |
Foreign exchange gain | (422 | ) | |||||
| $ | (3,179 | ) | ||||||
| (1) | The Company’s interest rate swaps were considered designated hedging instruments through August 31, 2009. As discussed above, effective September 1, 2009, the interest rate swaps were no longer designated hedging instruments. |
Non-designated Hedges of Foreign Exchange Risk
Derivatives not designated as hedges are not speculative and are used to manage the Company’s exposure to foreign exchange rates but do not meet the strict hedge accounting requirements of Topic 815. Changes in the fair value of derivatives not designated in hedging relationships are recorded directly to earnings.
The Company, from time to time, enters into foreign exchange forward contracts to fix currencies at specified rates based on expected future cash flows to protect against the fluctuations in cash flows resulting from sales denominated in foreign currency (cash flow hedges). Additionally, to manage its exposure to fluctuations in foreign currency on intercompany balances and certain purchase commitments, the Company uses foreign exchange forward contracts (fair value hedges).
As of December 31, 2010 and December 31, 2009, the Company had the following outstanding derivatives that were not designated as hedges in qualifying hedging relationships. The value of these contracts is recognized at fair value based on market exchange forward rates. The change in fair value of these contracts is included in foreign exchange gain/(loss) in the statement of operations.
| Foreign Currency Derivative (as of December 31, 2010) |
Notional Sold | Notional Purchased | ||||||
| Cash flow hedges |
$ | (1,683 | ) | $ | — | |||
| Fair value hedges |
$ | (23,964 | ) | $ | 5,623 | |||
F-28
Table of Contents
XERIUM TECHNOLOGIES, INC.
NOTES TO CONSOLIDATED FINANCIAL STATEMENTS—(Continued)
(dollars in thousands except per share data)
December 31, 2010
| Foreign Currency Derivative (as of December 31, 2009) |
Notional Sold | Notional Purchased | ||||||
| Cash flow hedges |
$ | — | $ | 692 | ||||
| Fair value hedges |
$ | (835 | ) | $ | — | |||
Credit-risk-related Contingent Features
The Company had agreements with certain of its derivative counterparties that contained a provision where if the Company either defaults in payment obligations under its credit facility or if such obligations are accelerated by the lenders, then the Company could also be declared in default on its derivative obligations. Although the Company was not declared in default of such obligations, as discussed above, on December 31, 2009 the Company terminated with the counterparties all of its outstanding interest rate swap liabilities of $20,036 and converted them into notes payable to such counterparties.
As of December 31, 2010 and December 31, 2009, the fair value of derivatives in a net liability position, which includes accrued interest but excludes any adjustment for nonperformance risk, related to these agreements was $222 and $42, respectively. The Company has not posted any collateral related to these derivative agreements.
The table below presents the fair value of the Company’s derivative financial instruments as well as their classification on the consolidated balance sheet as of December 31, 2010 and December 31, 2009, respectively.
Tabular Disclosure of Fair Values of Derivative Instruments
| Asset Derivatives As of December 31, 2010 |
Liability Derivatives As of December 31, 2010 |
|||||||||||||||
| Balance Sheet Location |
Fair Value | Balance Sheet Location |
Fair Value | |||||||||||||
| Derivatives designated as hedging instruments under Topic 815 |
||||||||||||||||
| Interest Rate Swaps |
|
Other current assets |
|
$ | — | |
Accrued expenses |
|
$ | — | ||||||
| Total derivatives designated as hedging instruments under Topic 815 |
$ | — | $ | — | ||||||||||||
| Derivatives not designated as hedging instruments under Topic 815 |
||||||||||||||||
| Interest Rate Swaps |
|
Other current assets |
|
$ | — | |
Accrued expenses |
|
$ | — | ||||||
| Foreign Currency Hedges |
|
Other current assets |
|
35 | |
Accrued expenses |
|
(257 | ) | |||||||
| Total derivatives not designated as hedging instruments under Topic 815 |
$ | 35 | $ | (257 | ) | |||||||||||
F-29
Table of Contents
XERIUM TECHNOLOGIES, INC.
NOTES TO CONSOLIDATED FINANCIAL STATEMENTS—(Continued)
(dollars in thousands except per share data)
December 31, 2010
Tabular Disclosure of Fair Values of Derivative Instruments
| Asset Derivatives As of December 31, 2009 |
Liability Derivatives As of December 31, 2009 |
|||||||||||||||
| Balance Sheet Location |
Fair Value | Balance Sheet Location |
Fair Value | |||||||||||||
| Derivatives designated as hedging instruments under Topic 815 |
||||||||||||||||
| Interest Rate Swaps |
|
Other current assets |
|
$ | — | |
Accrued expenses |
|
$ | — | ||||||
| Total derivatives designated as hedging instruments under Topic 815 |
$ | — | $ | — | ||||||||||||
| Derivatives not designated as hedging instruments under Topic 815 |
||||||||||||||||
| Interest Rate Swaps |
|
Other current assets |
|
$ | — | |
Accrued expenses |
|
$ | — | ||||||
| Foreign Currency Hedges |
|
Other current assets |
|
5 | |
Accrued expenses |
|
(47 | ) | |||||||
| Total derivatives not designated as hedging instruments under Topic 815 |
$ | 5 | $ | (47 | ) | |||||||||||
Fair Value of Derivatives Under ASC Topic 820
ASC Topic 820, Fair Value Measurements and Disclosures (“Topic 820”), emphasizes that fair value is a market-based measurement, not an entity-specific measurement. Therefore, a fair value measurement should be determined based on the assumptions that market participants would use in pricing the asset or liability. As a basis for considering market participant assumptions in fair value measurements, Topic 820 establishes a fair value hierarchy that distinguishes between market participant assumptions based on market data obtained from sources independent of the reporting entity (observable inputs that are classified within Levels 1 and 2 of the hierarchy) and the reporting entity’s own assumptions about market participant assumptions (unobservable inputs classified within Level 3 of the hierarchy).
Level 1 inputs utilize quoted prices (unadjusted) in active markets for identical assets or liabilities that the Company has the ability to access. Level 2 inputs are inputs other than quoted prices included in Level 1 that are observable for the asset or liability, either directly or indirectly. Level 2 inputs may include quoted prices for similar assets and liabilities in active markets, as well as inputs that are observable for the asset or liability (other than quoted prices), such as interest rates, foreign exchange rates, and yield curves that are observable at commonly quoted intervals. Level 3 inputs are unobservable inputs for the asset or liability which are typically based on an entity’s own assumptions, as there is little, if any, related market activity. In instances where the determination of the fair value measurement is based on inputs from different levels of the fair value hierarchy, the level in the fair value hierarchy within which the entire fair value measurement falls is based on the lowest level input that is significant to the fair value measurement in its entirety. The Company’s assessment of the significance of a particular input to the fair value measurement in its entirety requires judgment, and the Company considers factors specific to the asset or liability.
F-30
Table of Contents
XERIUM TECHNOLOGIES, INC.
NOTES TO CONSOLIDATED FINANCIAL STATEMENTS—(Continued)
(dollars in thousands except per share data)
December 31, 2010
To comply with Topic 820, the Company incorporates credit valuation adjustments to appropriately reflect both its own nonperformance risk and the respective counterparty’s nonperformance risk in the fair value measurements. Although the Company has determined that the majority of the inputs used to value its derivatives fall within Level 2 of the fair value hierarchy, the credit valuation adjustments associated with its derivatives utilized Level 3 inputs, such as estimates of current credit spreads to evaluate the likelihood of default by itself and its counterparties. However, as of December 31, 2010 and December 31, 2009, respectively, the Company assessed the significance of the impact of the credit valuation adjustments on the overall valuation of its derivative positions and has determined that the credit valuation adjustments were not significant to the overall valuation of its derivatives. As a result, the Company determined that its derivative valuations in their entirety were classified in Level 2 of the fair value hierarchy. The Company does not have any fair value measurements using significant unobservable inputs (Level 3) as of December 31, 2010 or December 31, 2009. The table below presents the Company’s assets and liabilities measured at fair value on a recurring basis as of December 31, 2010 and December 31, 2009, aggregated by the level in the fair value hierarchy within which those measurements fall.
As of December 31, 2010
| Assets |
Total | Quoted Prices in Active Markets for Identical Assets (Level 1) |
Significant
Other Observables Inputs (Level 2) |
Significant Unobservable Inputs (Level 3) |
||||||||||||
| Derivatives |
$ | 35 | $ | — | $ | 35 | $ | — | ||||||||
| Total |
$ | 35 | $ | — | $ | 35 | $ | — | ||||||||
| Liabilities |
||||||||||||||||
| Derivatives |
$ | (257 | ) | $ | — | $ | (257 | ) | $ | — | ||||||
| Total |
$ | (257 | ) | $ | — | $ | (257 | ) | $ | — | ||||||
As of December 31, 2009
| Assets |
Total | Quoted Prices in Active Markets for Identical Assets (Level 1) |
Significant
Other Observables Inputs (Level 2) |
Significant Unobservable Inputs (Level 3) |
||||||||||||
| Derivatives |
$ | 5 | $ | — | $ | 5 | $ | — | ||||||||
| Total |
$ | 5 | $ | — | $ | 5 | $ | — | ||||||||
| Liabilities |
||||||||||||||||
| Derivatives |
$ | (47 | ) | $ | — | $ | (47 | ) | $ | — | ||||||
| Total |
$ | (47 | ) | $ | — | $ | (47 | ) | $ | — | ||||||
F-31
Table of Contents
XERIUM TECHNOLOGIES, INC.
NOTES TO CONSOLIDATED FINANCIAL STATEMENTS—(Continued)
(dollars in thousands except per share data)
December 31, 2010
9. Income Taxes
The components of domestic and foreign income (loss) before the provision for income taxes are as follows:
| Year Ended December 31 | ||||||||||||
| 2010 | 2009 | 2008 | ||||||||||
| U.S. |
$ | (75,616 | ) | $ | (92,453 | ) | $ | 29,538 | ||||
| Foreign |
20,796 | (7,223 | ) | 959 | ||||||||
| Total |
$ | (54,820 | ) | $ | (99,676 | ) | $ | 30,497 | ||||
The components of the income tax provision (benefit) are as follows:
| Year Ended December 31 | ||||||||||||
| 2010 | 2009 | 2008 | ||||||||||
| Current: |
||||||||||||
| U.S. |
$ | 1,088 | $ | 222 | $ | 1,286 | ||||||
| Foreign |
8,564 | 4,509 | 15,563 | |||||||||
| Total current |
9,652 | 4,731 | 16,849 | |||||||||
| Deferred: |
||||||||||||
| U.S. |
— | — | — | |||||||||
| Foreign |
8,614 | 7,586 | (12,948 | ) | ||||||||
| Total deferred |
8,614 | 7,586 | (12,948 | ) | ||||||||
| Total provision (benefit) |
$ | 18,266 | $ | 12,317 | $ | 3,901 | ||||||
F-32
Table of Contents
XERIUM TECHNOLOGIES, INC.
NOTES TO CONSOLIDATED FINANCIAL STATEMENTS—(Continued)
(dollars in thousands except per share data)
December 31, 2010
The tax effect of temporary differences which give rise to deferred income tax assets and liabilities are as follows:
| 2010 | 2009 | |||||||
| Deferred tax assets arising from: |
||||||||
| Net operating loss carryforwards |
$ | 100,974 | $ | 72,143 | ||||
| Intangible assets, net |
12,293 | 15,830 | ||||||
| Pension and other benefit accruals |
10,994 | 10,725 | ||||||
| Tax credits |
1,711 | 1,581 | ||||||
| Investments |
9,572 | 31,358 | ||||||
| Other allowances and accruals, net |
16,329 | 30,520 | ||||||
| Total |
151,873 | 162,157 | ||||||
| Deferred tax liabilities arising from: |
||||||||
| Property and equipment, net |
(37,139 | ) | (38,729 | ) | ||||
| Intangible assets, net |
(2,628 | ) | (2,839 | ) | ||||
| Foreign Income Inclusions |
(22,372 | ) | (18,398 | ) | ||||
| Other allowances and accruals, net |
(1,311 | ) | — | |||||
| Total |
(63,450 | ) | (59,966 | ) | ||||
| Valuation allowance |
(96,042 | ) | (106,100 | ) | ||||
| Net deferred tax liability |
$ | (7,619 | ) | $ | (3,909 | ) | ||
Deferred taxes are recorded as follows in the consolidated balance sheets (in millions):
| 2010 | 2009 | |||||||
| Current Deferred Tax Asset, Net. |
$ | 6,138 | $ | 7,690 | ||||
| Current Deferred Tax Liability, Net |
(149 | ) | (499 | ) | ||||
| Noncurrent Deferred Tax Asset, Net |
14,898 | 5,047 | ||||||
| Noncurrent Deferred Tax Liability, Net |
(28,506 | ) | (16,147 | ) | ||||
| Net Deferred Tax Liability |
$ | (7,619 | ) | $ | (3,909 | ) | ||
Compliance with Topic 740 requires the Company to periodically evaluate the necessity of establishing or adjusting a valuation allowance for deferred tax assets depending on whether it is more likely than not that a related tax benefit will be recognized in future periods. In making such determination, the Company considers all available positive and negative evidence, including scheduled reversals of deferred tax liabilities, projected future taxable income, tax planning strategies and recent results of operations. Because of the accumulated loss position in certain tax jurisdictions at December 31, 2010 and December 31, 2009 and the uncertainty of profitability in future periods, the Company has recorded valuation allowances as shown above for all U. S. deferred tax assets and for certain foreign deferred tax assets primarily related to net operating loss carry-forwards in Australia, Canada, Germany, Sweden, the United Kingdom and France.
We emerged from chapter 11 bankruptcy protection on May 25, 2010. Our review of the potential impact of the overall plan of reorganization resulted in no material change in our tax position. Our balance sheet as of December 2010 reflected a deferred tax asset related to our German federal and trade loss carry-forwards of
F-33
Table of Contents
XERIUM TECHNOLOGIES, INC.
NOTES TO CONSOLIDATED FINANCIAL STATEMENTS—(Continued)
(dollars in thousands except per share data)
December 31, 2010
approximately $2.7 million. As a general rule, federal and trade tax loss carry forwards are subject to forfeiture if more than 50% of the shares in the corporation are directly or indirectly transferred to a new shareholder. There is a restructuring exception to this general rule; however, effective December 2010, this exception has been suspended with retroactive effect. As of December 2010, we have impaired the portion of the deferred tax asset we believe to be subject to possible forfeiture.
For 2010, the Company recognized a provision for income taxes of $18,266 as compared with $12,317 for 2009. The Company recorded income tax expense for 2010, even though it had a consolidated pre-tax loss, principally due to (i) losses that were incurred domestically and in certain foreign jurisdictions for which no corresponding tax benefit was recognized as the net operating losses that were created for tax purposes in these jurisdictions were fully reserved for book purposes, (ii) the establishment of uncertain tax reserves for certain of our foreign historical tax positions including the $3.9 million impairment of a German deferred tax asset that we believe to be subject to possible forfeiture, based on a recent tax ruling with respect to available restructuring exemption and (iii) the disallowance of certain deductions for costs incurred as part of our reorganization. The Company recorded income tax expense for 2009, even though it had a consolidated pre-tax loss, principally due to (i) losses that were incurred domestically and in certain foreign jurisdictions for which no corresponding tax benefit was recognized as the net operating losses that were created for tax purposes in these jurisdictions were fully reserved for book purposes, (ii) goodwill impairment recorded domestically and in certain foreign jurisdictions for which no corresponding tax benefit was recognized and (iii) the establishment in 2009 of valuation allowances in Canada, China and the United Kingdom.
As of December 31, 2010, the Company has pre-tax net operating loss carry-forwards for U.S. federal income tax purposes of approximately $146,066 that expire on various dates from 2026 through 2030 and federal tax credits of approximately $193 that either expire on various dates or can be carried forward indefinitely. As of December 31, 2010, there was a valuation allowance recorded with respect to these balances in the amounts of $146,066 and $193, respectively. The Company has foreign federal net operating loss carry-forwards of approximately $132,204, the majority of which can be carried forward indefinitely, and federal and provincial tax credits of approximately $1,518 that begin to expire primarily in 2015 or are carried forward indefinitely. As of December 31, 2010, there were valuation allowances recorded with respect to these balances in the amounts of $105,119 and $1,518 respectively.
Undistributed earnings of the Company’s foreign subsidiaries amounted to approximately $148,259 at December 31, 2010. Those earnings are considered to be indefinitely reinvested for continued use in foreign operations except for Argentina, Brazil and Mexico. Upon distribution of those earnings in the form of dividends or otherwise, the Company may be subject to both income taxes (subject to an adjustment for foreign tax credits) and withholding taxes payable to the various jurisdictions. Determination of the amount of unrecognized deferred income tax liability or withholding taxes is not practicable because of the complexities associated with its hypothetical calculation; however, unrecognized foreign tax credit carry-forwards and net operating loss carry-forwards would be available to reduce some portion of the liability. Federal income taxes are provided on the portion of the income of foreign subsidiaries that is expected to be remitted to the United States and be taxable.
The Company adopted the uncertain tax provisions of Topic 740 on January 1, 2007 and, accordingly, recorded a cumulative effect increase of $3,323 to accumulated deficit, an increase of $627 to income taxes payable and an increase of $2,696 to other long-term liabilities for uncertain tax positions. On January 1, 2007, the Company had $4,126 in unrecognized tax benefits. As of the December 31, 2010, the gross amount of unrecognized tax benefits was approximately $9,287, exclusive of interest and penalties. Of this balance, if we were to prevail on all unrecognized tax benefits recorded, approximately $8,947 would benefit the effective tax
F-34
Table of Contents
XERIUM TECHNOLOGIES, INC.
NOTES TO CONSOLIDATED FINANCIAL STATEMENTS—(Continued)
(dollars in thousands except per share data)
December 31, 2010
rate. As of December 31, 2009, the gross amount of unrecognized tax benefits was approximately $5,023, exclusive of interest and penalties. Of this balance, if we were to prevail on all unrecognized tax benefits recorded, approximately $4,737 would benefit the effective tax rate. The Company’s unrecognized tax benefits increased approximately $4,264 and $200 during the years ended December 31, 2010 and 2009, respectively. During the next twelve months, we estimate $0.4 million of our gross unrecognized tax benefit will reverse due to expiration of statutes. Of this balance, approximately $0.4 million would benefit the effective tax rate. We regularly evaluate, assess and adjust the related liabilities in light of changing facts and circumstances, which could cause the effective tax rate to fluctuate from period to period.
The tax years 1999 through 2010 remain open to examination by the major taxing jurisdictions to which the Company and its subsidiaries are subject. There are currently no U.S. Federal or state audits or examinations underway. In May 2009, we concluded an audit relating to our German subsidiaries for tax years 1999 through 2002. No further adjustments not previously recorded were required in the year ended December 31, 2009 as a result of this settlement. In 2010, the German tax authorities initiated an audit of our German entities for the tax years 2004 through 2007. For certain of our German entities under audit, we reached an agreement with the tax authorities for issues identified as a result of this audit, and in September 2010, we accrued for any taxes due as a result of this agreement. For the remaining German entities being audited, the audit is still in the initial information gathering stages. In November 2010, we concluded an audit relating to our Canadian subsidiary for tax years 2005 through 2007, and established a reserve in December 2010 to account for the resolution of this audit. The Company believes that there are no jurisdictions in which the outcome of unresolved issues or claims is likely to be material to its results of operations, financial position or cash flows. The Company further believes that it has made adequate provision for all income tax uncertainties.
A reconciliation of the balances of the unrecognized tax benefits is as follows:
| 2010 | 2009 | |||||||
| Balance as of January 1 |
$ | 5,023 | $ | 4,831 | ||||
| Gross decreases—tax positions in prior period due to settlements |
(215 | ) | (642 | ) | ||||
| Gross increases—tax positions in prior period -other |
524 | — | ||||||
| Gross decreases—related to lapse in statute of limitations |
(565 | ) | (206 | ) | ||||
| Gross increases—tax positions in current period |
4,520 | 953 | ||||||
| Currency effects |
— | 87 | ||||||
| Balance at December 31 |
$ | 9,287 | $ | 5,023 | ||||
The Company’s policy is to recognize interest and penalties related to income tax matters as income tax expense and accordingly, the Company recorded approximately $328 and $500 for interest and penalties during the years ended December 31, 2010 and 2009, respectively. As of December 31, 2010 and 2009, the Company recorded accrued interest and penalties related to uncertain tax positions of approximately $2,733 and $2,300, respectively.
F-35
Table of Contents
XERIUM TECHNOLOGIES, INC.
NOTES TO CONSOLIDATED FINANCIAL STATEMENTS—(Continued)
(dollars in thousands except per share data)
December 31, 2010
The provision for income taxes differs from the amount computed by applying the U.S. statutory tax rate (35%) to income before income taxes, due to the following:
| Year Ended December 31 | ||||||||||||
| 2010 | 2009 | 2008 | ||||||||||
| Book income (loss) at U.S. 35% statutory rate |
$ | (19,187 | ) | $ | (34,874 | ) | $ | 10,674 | ||||
| State income and other taxes due, net of federal benefit |
1,710 | 955 | 465 | |||||||||
| Foreign tax rate differential |
374 | (7,137 | ) | (336 | ) | |||||||
| Dividends and other foreign income, net of foreign tax credits |
7,975 | 721 | 3,813 | |||||||||
| Change in valuation allowance |
(10,272 | ) | 24,418 | (19,543 | ) | |||||||
| Deferred gain on intercompany transaction |
— | — | 5,570 | |||||||||
| Tax rate changes |
124 | 41 | 3,625 | |||||||||
| Tax credits and refunds |
(424 | ) | (714 | ) | (451 | ) | ||||||
| Goodwill |
(2,825 | ) | 25,985 | (2,778 | ) | |||||||
| Change in tax reserves |
4,606 | 1,125 | (24 | ) | ||||||||
| Provision to return adjustments |
29,408 | (124 | ) | — | ||||||||
| Other, net |
400 | 1,921 | 2,886 | |||||||||
| Financing costs |
6,377 | — | — | |||||||||
| Total |
$ | 18,266 | $ | 12,317 | $ | 3,901 | ||||||
10. Pensions, Other Postretirement and Postemployment Obligations
Pension Plans
The Company has defined benefit pension plans covering substantially all of its U.S. and Canadian employees, and employees of certain subsidiaries in other countries. Benefits are generally based on the employees’ years of service and compensation. These plans are funded in conformity with the funding requirements of applicable government regulations.
The Company also provides additional unfunded supplemental retirement benefits to two of its officers and certain other former employees, which have been included in the benefit costs below.
Postretirement Plans
In addition to defined benefit pension plans, the Company sponsors various unfunded defined contribution plans that provide for retirement benefits to employees, some in accordance with local government requirements.
Also, the Company had sponsored an unfunded plan that offered the opportunity to obtain health insurance benefits to a certain group of retired U.S. employees and their covered dependents and beneficiaries. A portion of this plan was contributory, with retiree contributions adjusted periodically, as well as other cost-sharing features, such as deductibles and coinsurance. Eligibility varied according to date of hire, age and length of service. Certain retirees also have a life insurance benefit provided at no cost.
F-36
Table of Contents
XERIUM TECHNOLOGIES, INC.
NOTES TO CONSOLIDATED FINANCIAL STATEMENTS—(Continued)
(dollars in thousands except per share data)
December 31, 2010
During the third quarter of 2008, the Company made and communicated the following decisions related to certain of its U.S. pension plans, postretirement benefit plans and 401(k) plans:
| a) | Freezing benefit pension accruals under its Pension Plan for U.S. Salaried and Non-Union Hourly Employees (the “Pension Plan”) effective December 31, 2008 so that future service beyond December 31, 2008 is not to be credited under the Pension Plan. Employees who were vested as of December 31, 2008 are entitled to their benefit earned as of December 31, 2008. Current employees who were not vested as of December 31, 2008 are entitled to their benefit earned as of December 31, 2008 upon five years of continuous employment from date of hire. |
| b) | No longer sponsoring or funding, as of December 31, 2008, its U.S. retiree health insurance program under which the Company offered health insurance benefits to a certain group of retired U.S. employees and their covered dependents and beneficiaries. |
| c) | Increasing its 401(k) plan match in the United States from 4% of eligible compensation to 6% as of January 1, 2009. Subsequently, in February, 2009 the Company announced that it will not implement this increase and instead will suspend the employer match until further notice. In January 2010, the Company announced that the increase will be implemented for 2010. |
As a result of the decision to freeze benefits under the Pension Plan and to terminate the sponsorship of its U.S. retiree health insurance program, the Company recorded the following, in accordance with the applicable accounting literature: (i) pre-tax curtailment/settlement gains of $39,968 in its income statement during the quarter ended September 30, 2008, (ii) a decrease in its pension and postretirement liability of $31,951 as of September 30, 2008 and (iii) a charge to Other Comprehensive Income of $8,017. The above amounts also include a loss of $201 as a result of the settlement of one of the Company’s Canadian pension plans.
In accordance with the provisions of ASC Topic 715-20-50, Compensation—Retirement Benefits (“Topic 715”), the measurement date for defined benefit plans outside the U.S. is December 31 for the years ended December 31, 2010, 2009 and 2008.
Postemployment Obligations
The Company has postemployment plans in various countries and accounts for these plans in accordance with Topic 715. The Company’s postemployment obligations consist primarily of payments to be made to employees upon termination of employment, as defined, and are accrued according to local statutory laws in the respective countries. The Company’s obligation for postemployment benefits amounted to $1,992 and $2,534 as of December 31, 2010 and 2009, respectively.
F-37
Table of Contents
XERIUM TECHNOLOGIES, INC.
NOTES TO CONSOLIDATED FINANCIAL STATEMENTS—(Continued)
(dollars in thousands except per share data)
December 31, 2010
Benefit Obligations and Plan Assets
A summary of the changes in benefit obligations and plan assets as of December 31, 2010 and 2009 is presented below.
| Defined Benefit Plans | Other Postretirement Benefit Plans |
|||||||||||||||
| 2010 | 2009 | 2010 | 2009 | |||||||||||||
| Change in benefit obligation |
||||||||||||||||
| Benefit obligation at beginning of year |
$ | 133,097 | $ | 114,410 | $ | 558 | $ | 883 | ||||||||
| Service cost |
3,570 | 2,986 | — | — | ||||||||||||
| Interest cost |
6,843 | 6,718 | 62 | 84 | ||||||||||||
| Plan participants’ contributions |
109 | 111 | — | — | ||||||||||||
| Actuarial (gain) loss |
7,783 | 11,938 | (2 | ) | (6 | ) | ||||||||||
| Currency translation impact |
(2,844 | ) | 6,325 | — | — | |||||||||||
| Curtailment/settlement gain |
(32 | ) | (1,250 | ) | — | — | ||||||||||
| Administrative expenses paid |
(215 | ) | (379 | ) | — | — | ||||||||||
| Benefits paid |
(7,814 | ) | (7,762 | ) | (20 | ) | (403 | ) | ||||||||
| Benefit obligation at end of year |
$ | 140,497 | $ | 133,097 | $ | 598 | $ | 558 | ||||||||
| Change in plan assets |
||||||||||||||||
| Fair value of plan assets at beginning of year |
$ | 61,312 | $ | 47,141 | $ | — | $ | — | ||||||||
| Actual return on plan assets |
7,063 | 9,975 | — | — | ||||||||||||
| Employer contributions |
9,899 | 8,276 | — | — | ||||||||||||
| Plan participants’ contributions |
109 | 111 | — | — | ||||||||||||
| Administrative expenses paid |
(215 | ) | (379 | ) | — | — | ||||||||||
| Currency translation impact |
(270 | ) | 3,950 | — | — | |||||||||||
| Benefits paid |
(7,814 | ) | (7,762 | ) | — | — | ||||||||||
| Fair value of plan assets at end of year |
$ | 70,084 | $ | 61,312 | $ | — | $ | — | ||||||||
| Funded status (1) |
$ | (70,413 | ) | $ | (71,785 | ) | $ | (598 | ) | $ | (558 | ) | ||||
| (1) | In accordance with Topic 715, $3,591 and $4,225 of this amount is recorded in accrued expenses as of December 31, 2010 and 2009, respectively. |
All of the Company’s pension plans that comprise the pension obligation amounts above, have a projected benefit obligation equal to or in excess of plan assets as of the years ended December 31, 2010 and 2009. The accumulated benefit obligation was $131,884 and $125,591 as of the years ended December 31, 2010 and 2009, respectively.
Information for pension plans with an accumulated benefit obligation in excess of plan assets is as follows:
| December 31 | ||||||||
| 2010 | 2009 | |||||||
| Projected benefit obligation |
$ | 140,497 | $ | 133,097 | ||||
| Accumulated benefit obligation |
131,884 | 125,591 | ||||||
| Fair value of plan assets |
70,084 | 61,312 | ||||||
F-38
Table of Contents
XERIUM TECHNOLOGIES, INC.
NOTES TO CONSOLIDATED FINANCIAL STATEMENTS—(Continued)
(dollars in thousands except per share data)
December 31, 2010
Components of Net Periodic Benefit Cost
| Defined Benefit Plans | Other Postretirement Benefit Plans |
|||||||||||||||||||||||
| 2010 | 2009 | 2008 | 2010 | 2009 | 2008 | |||||||||||||||||||
| Service cost |
$ | 3,570 | $ | 2,986 | $ | 5,601 | $ | — | $ | — | $ | 489 | ||||||||||||
| Interest cost |
6,843 | 6,718 | 6,985 | 26 | 84 | 1,364 | ||||||||||||||||||
| Expected return on plan assets |
(4,409 | ) | (3,792 | ) | (5,138 | ) | — | — | — | |||||||||||||||
| Amortization of prior service cost |
15 | 38 | 106 | — | — | (418 | ) | |||||||||||||||||
| Amortization of net (gain) loss |
982 | 1,230 | 666 | (7 | ) | (4 | ) | (62 | ) | |||||||||||||||
| Curtailment (gain) loss |
126 | 282 | (3,451 | ) | — | — | (36,517 | ) | ||||||||||||||||
| Net periodic benefit cost |
$ | 7,127 | $ | 7,462 | $ | 4,769 | $ | 19 | $ | 80 | $ | (35,144 | ) | |||||||||||
For defined benefit plans, the estimated net loss and prior service cost to be amortized from accumulated other comprehensive loss during 2011 is expected to be $1,268 and $14 respectively.
| Defined Benefit Plans | Other Postretirement Benefit Plans |
|||||||||||||||
| 2010 | 2009 | 2010 | 2009 | |||||||||||||
| Additional Information |
||||||||||||||||
| Change in funded status included in accumulated other comprehensive loss, net of tax |
$ | (3,609 | ) | $ | (2,244 | ) | N/A | N/A | ||||||||
Assumptions
Weighted-average assumptions used to determine benefit obligations at December 31 are as follows:
| Defined Benefit Plans | Other Postretirement Benefit Plans |
|||||||||||||||
| 2010 | 2009 | 2010 | 2009 | |||||||||||||
| Discount rate |
5.16 | % | 5.57 | % | 4.50 | % | 5.00 | % | ||||||||
| Rate of compensation increase |
3.78 | 3.81 | — | — | ||||||||||||
Weighted-average assumptions used to determine net periodic benefit cost for years ended December 31 are as follows:
| Defined Benefit Plans | Other Postretirement Benefit Plans |
|||||||||||||||
| 2010 | 2009 | 2010 | 2009 | |||||||||||||
| Discount rate |
5.57 | % | 5.99 | % | 5.00 | % | 6.00 | % | ||||||||
| Expected long-term return on plan assets |
7.16 | 7.50 | — | — | ||||||||||||
| Rate of compensation increase |
3.81 | 3.82 | — | — | ||||||||||||
F-39
Table of Contents
XERIUM TECHNOLOGIES, INC.
NOTES TO CONSOLIDATED FINANCIAL STATEMENTS—(Continued)
(dollars in thousands except per share data)
December 31, 2010
Plan Assets
The percentage of fair value of total plan assets for funded plans are invested as follows:
| Plan Assets at December 31 |
||||||||
| Asset Category |
2010 | 2009 | ||||||
| Marketable equities |
65 | % | 61 | % | ||||
| Fixed income securities |
35 | 39 | ||||||
| Total |
100 | % | 100 | % | ||||
The Company’s plan assets are invested in the U.S., the United Kingdom (“UK”) and Canada. Plan asset investments are accounted for at cost on the trade date and are reported at fair value. Canadian plan assets totaling $19,009 are classified as Level 2 within the fair value hierarchy. All other plan assets totaling $51,075 are classified as Level 1. In general, plan assets are exposed to various risks, such as interest rate risk, credit risk, and overall market volatility. Due to the level of risk associated with certain investments, it is reasonably possible that changes in the values of investments will occur in the near term and that such changes could materially affect the amounts reported in the plan assets. The investment objective of the plans is to maximize the return on plan assets over a long time horizon, while meeting the plan obligations. Investment risk is substantially reduced by diversification of investments within particular asset classes. The expected future rate of return on plan assets is based on historic performance of bonds and equities and the higher returns expected by equity-based capital relative to debt capital. The agreements with the fund managers include a number of restrictions which are designed to ensure that only suitable investments are held. Generally, investment performance is provided to and reviewed by the Company on a quarterly basis. If any changes take place in the legal, regulatory or tax environment which impact the investment of the portfolios or the investment returns, the fund manager is expected to notify the Company immediately and to advise on their anticipated impact.
Details relating to the Company’s plan assets are as follows:
U.S. Plan Assets: Approximately 86% of the Company’s plan assets are invested in the U.S., of which 56% are invested in marketable equity securities and 44% are invested in fixed income securities managed by the fund manager. This allocation is in accordance with the strategic allocation adopted by the Company’s pension committee comprising of approximately 60% equity investment and 40% bond investment.
UK Plan Assets: Approximately 62% of the Company’s plan assets are invested in the UK, of which 40% are invested in marketable equity securities and 60% are invested in fixed income securities managed by the fund manager. The trustees of the UK pension plan have adopted a strategic allocation comprising of 60% equity investment and 40% bond investment. The allocation of equity investments between UK domestic and UK foreign equities is 40% and 60%, respectively and the fixed income bond investment is allocated equally between government and corporate bonds in the UK. Investment risk is substantially reduced by diversification of investments and accordingly, assets are invested 60% in the fund manager’s Global Equity Index Fund, 20% in the Over 15 Year Gilts Index Fund (20%) and 20% in the AAA-AA-A Bonds Over 15 Year Index Fund . The majority of the Plan liabilities are linked to price and salary inflation. The policy is therefore to invest the majority of the assets in investments which are expected to exceed price inflation and general salary growth over long periods.
F-40
Table of Contents
XERIUM TECHNOLOGIES, INC.
NOTES TO CONSOLIDATED FINANCIAL STATEMENTS—(Continued)
(dollars in thousands except per share data)
December 31, 2010
Canadian Plan Assets: Approximately 25% of the Company’s plan assets are invested in Canada, of which 68% are invested in marketable equity securities and 32% are invested in fixed income securities managed by the fund manager. The Company’s pension committee has adopted a strategic allocation comprising of approximately 65% equity investment and 35% bond investment. The target allocation of equity investments between Canadian domestic and Canadian foreign equities is approximately 50% each. As of December 31, 2010, assets were invested 86% in the fund manager’s Balanced Pension Trust Series O and 14% in the U.S. Pooled Pension Fund Series O. Investments are made with due consideration for the overall funds’ risk and expected return.
Contributions
The Company expects to make contributions and direct benefit payments of approximately $7,722 (unaudited) under its defined benefit plans in 2011.
Estimated Future Benefit Payments
The following benefit payments, which reflect expected future service, as appropriate, are expected to be paid:
| Defined Benefit Plans |
Other Postretirement Benefit Plans |
|||||||
| 2011 |
$ | 6,945 | $ | 58 | ||||
| 2012 |
6,422 | 57 | ||||||
| 2013 |
6,696 | 55 | ||||||
| 2014 |
7,237 | 54 | ||||||
| 2015 |
7,442 | 51 | ||||||
| Years 2016–2019 |
37,397 | 219 | ||||||
The Company also maintains a funded retirement savings plan for U.S. employees which is qualified under Section 401(k) of the U.S. Internal Revenue Code. During 2008, the plan allowed eligible employees to contribute up to 15% of their compensation (plus catch-up contributions for participants over age 50), with the Company matching 100% of up to the first 4% of employee compensation. The Company suspended the matching contribution in February 2009 but for 2010 removed the suspension and enhanced the match to 200% of the first 1% of employee compensation and 100% of the next 4% of employee compensation. Costs associated with the Plan are charged to the consolidated statements of operations and amounted to $1,656, $256 and $1,169 for the years ended December 31, 2010, 2009 and 2008, respectively.
F-41
Table of Contents
XERIUM TECHNOLOGIES, INC.
NOTES TO CONSOLIDATED FINANCIAL STATEMENTS—(Continued)
(dollars in thousands except per share data)
December 31, 2010
11. Accumulated Other Comprehensive Income (Loss)
The components of accumulated other comprehensive income (loss) were as follows:
| Foreign Currency Translation Adjustment |
Pension Liability Changes Under Topic 715 |
Change in Value of Derivative Instruments |
Accumulated Other Comprehensive Income (Loss) |
|||||||||||||
| Balance at December 31, 2007 |
$ | 29,663 | $ | (2,024 | ) | $ | — | $ | 27,639 | |||||||
| Current year change |
(23,772 | ) | (19,507 | ) | (13,859 | ) | (57,138 | ) | ||||||||
| Balance at December 31, 2008 |
5,891 | (21,531 | ) | (13,859 | ) | (29,499 | ) | |||||||||
| Current year change |
16,488 | (2,244 | ) | 4,138 | 18,382 | |||||||||||
| Balance at December 31, 2009 |
22,379 | (23,775 | ) | (9,721 | ) | (11,117 | ) | |||||||||
| Current year change |
2,628 | (3,609 | ) | 9,721 | 8,740 | |||||||||||
| Balance at December 31, 2010 |
$ | 25,007 | $ | (27,384 | ) | $ | — | $ | (2,377 | ) | ||||||
Comprehensive loss for years ended December 31, 2010, 2009 and 2008 is as follows:
| 2010 | 2009 | 2008 | ||||||||||
| Net income (loss) |
$ | (73,086 | ) | $ | (111,993 | ) | $ | 26,596 | ||||
| Foreign currency translation adjustments |
2,628 | 16,488 | (23,772 | ) | ||||||||
| Pension liability changes under Topic 715 |
(3,609 | ) | (2,244 | ) | (19,507 | ) | ||||||
| Change in value of derivative instruments |
9,721 | 4,138 | (13,859 | ) | ||||||||
| Comprehensive loss |
$ | (64,346 | ) | $ | (93,611 | ) | $ | (30,542 | ) | |||
12. Commitments and Contingencies
Leases
The Company leases office buildings, vehicles, and computer equipment for its worldwide operations. Minimum rent is expensed on a straight-line basis over the term of the leases. These leases expire at various dates through 2052. The Company’s largest single lease commitment is a facility lease in Austria that expires in 2023 with aggregate future minimum rental payments due of approximately $5,000 at December 31, 2010. At December 31, 2010, future minimum rental payments due under non-cancelable leases were as follows:
| 2011 |
$ | 4,832 | ||
| 2012 |
4,119 | |||
| 2013 |
3,431 | |||
| 2014 |
2,447 | |||
| 2015 |
1,765 | |||
| Thereafter |
5,490 | |||
| Total minimum operating lease payments |
$ | 22,084 | ||
F-42
Table of Contents
XERIUM TECHNOLOGIES, INC.
NOTES TO CONSOLIDATED FINANCIAL STATEMENTS—(Continued)
(dollars in thousands except per share data)
December 31, 2010
Operating lease rental expense was $5,122, $6,053 and $6,363 during the years ended December 31, 2010, 2009 and 2008, respectively. In November 2008, the Company entered into an agreement to buy out a portion of its remaining facility lease in Youngsville, North Carolina for $616 which was included in restructuring and impairments expense for the year ended December 31, 2008.
Collective Bargaining and Union Agreements
Approximately 71% of the Company’s employees are subject to various collective bargaining agreements or are members of trade unions, predominantly outside of the United States. Approximately 33% of these employees are covered by agreements that expire during 2011.
Legal Proceedings
The Company is involved in various legal matters, which have arisen in the ordinary course of business. The Company does not believe that the ultimate resolution of these matters will have a material adverse effect on its financial position, results of operations or cash flow.
Environmental Matters
The Company’s operations and facilities are subject to a number of national, state and local laws and regulations protecting the environment and human health in the United States and foreign countries that govern, among other things, the handling, storage and disposal of hazardous materials, discharges of pollutants into the air and water and workplace safety. Because of our operations, the history of industrial uses at some of our facilities, the operations of predecessor owners or operators of some of the businesses, and the use and release of hazardous substances at these sites, the liability provisions of environmental laws may affect us. Except as stated below, the Company is not aware of any material unasserted claims and any potential material liability from those claims.
During the third quarter of 2008, the Company, while evaluating its facility in Australia, discovered the possibility of contamination at the facility. Subsequently the Company had a preliminary evaluation performed, which confirmed the existence of contamination and estimated preliminary costs to remediate this facility. Based upon this evaluation, the Company accrued $4,100 in 2008 as its best estimate of the remediation costs it expected to incur. This amount was included in accrued expenses on the December 31, 2008 Consolidated Balance Sheet. Phase II assessment of the groundwater contamination performed for the Company during the second quarter of 2009 indicated the costs to remediate the contamination would be significantly less than originally estimated and accordingly, the Company reduced the accrual by $3,400 during the second quarter of 2009 based on this assessment. At the end of the second quarter of 2010, the Company entered into a contingent purchase and sale agreement with a third party whereby the third party could purchase the Australian facility after two years from the date of the purchase and sale agreement. Under the terms of the purchase and sale agreement, the environmental liability would transfer to the third party at the time of such purchase.
The Company believes that any additional liability in excess of amounts provided which may result from the resolution of such matters will not have a material adverse effect on the financial condition, liquidity or cash flow of the Company.
F-43
Table of Contents
XERIUM TECHNOLOGIES, INC.
NOTES TO CONSOLIDATED FINANCIAL STATEMENTS—(Continued)
(dollars in thousands except per share data)
December 31, 2010
13. Stock-Based Compensation and Stockholders’ Equity (Deficit)
As discussed in Note 1, the Company had an effective 20 to 1 reverse split of its Old Common Stock; accordingly the effect of the split has been reflected retroactively for all periods presented.
The Company records stock-based compensation expense in accordance with Topic 718 and has used the straight-line attribution method to recognize expense for time-based RSUs granted after December 31, 2005. The Company recorded stock-based compensation expense during the three years ended December 31, 2010, 2009 and 2008 as follows:
| For the Years ended December 31, |
||||||||||||
| 2010 | 2009 | 2008 | ||||||||||
| RSU and Stock Option Awards (1) |
$ | 4,018 | $ | 2,305 | $ | 1,289 | ||||||
| Management Incentive/Performance Award Programs (2) |
2,467 | — | 2,986 | |||||||||
| Stock Awards (3) |
825 | 94 | — | |||||||||
| Total |
$ | 7,310 | $ | 2,399 | $ | 4,275 | ||||||
| (1) | Related to restricted stock units awarded in and prior to 2010 and stock options awarded to certain non-employee directors on the Effective Date. See further discussion below. |
| (2) | For 2010, the amount represents the estimated value of stock awards to be made under the 2010 Management Incentive Compensation Program (the “2010 MIC”), which was approved by the Company’s Board of Directors on September 22, 2010. See further discussion below. For 2009, no amounts were expensed related to the 2009 Performance Award Program, which was approved by the Company’s Board of Directors on March 10, 2009, as the underlying targets for 2009 were not achieved. For 2008, amount represents the approval by the Company’s Board of Directors on March 10, 2009 of the issuance of 201,741 shares of common stock to eligible participants under the Company’s performance award program for 2008. After withholding shares of common stock to satisfy minimum tax withholding requirements, a net number of 128,206 shares was issued to the eligible participants on March 11, 2009. |
| (3) | For 2010, amount represents a total of 39,764 shares of common stock that were sold to Mr. Stephen Light, the Company’s Chairman, President and Chief Executive Officer on January 5, 2010. See further discussion below. For 2009, represents the value of 3,000 shares of the Company’s common stock awarded to Mr. David Maffucci on June 8, 2009 in connection with his appointment as the Company’s Executive Vice President and Chief Financial Officer. |
The related tax impact on stock-based compensation was a tax benefit of $232, $118 and $411 for the years ended December 31, 2010, 2009 and 2008.
2010 Equity Incentive Plan
Pursuant to the plan of reorganization as discussed in Note 1, the Company adopted the 2010 Equity Incentive Plan (the “2010 Plan”) on the Effective Date. The 2010 Plan provides for the grant of awards consisting of any or a combination of stock options, stock appreciation rights, restricted stock, unrestricted stock or stock unit awards.
F-44
Table of Contents
XERIUM TECHNOLOGIES, INC.
NOTES TO CONSOLIDATED FINANCIAL STATEMENTS—(Continued)
(dollars in thousands except per share data)
December 31, 2010
Shares Reserved for Awards
The maximum number of shares that may be delivered under or in satisfaction of awards under the 2010 Plan is 463,525 shares of New Common Stock, provided, however, that to the extent that equity incentive awards granted prior to the Effective Date pursuant to the Company’s 2005 Equity Incentive Plan, as amended, or employment agreements with the Company’s senior management do not vest on or after the Effective Date in accordance with their terms, the number of shares of New Common Stock reserved pursuant to the Plan with respect to such unvested awards shall be added to the number of shares of New Common Stock that may be delivered under the 2010 Plan. The number of shares deliverable under the 2010 Plan is subject to adjustment in the case of stock dividends and other transactions affecting the New Common Stock.
2005 Equity Incentive Plan
Effective May 19, 2005, the Company adopted the 2005 Equity Incentive Plan (the “2005 Plan”), under which the Board of Directors authorized 125,000 shares for grant (subsequently increased to 375,000 at the Company’s Annual Meeting of Stockholders on August 6, 2008).
Summary of Activity Under the 2010 Plan and the 2005 Plan
Long-Term Incentive Program
On September 22, 2010, the Board approved the Company’s 2010-2012 Long Term Incentive Plan (the “LTIP”) under the 2010 Plan. Awards under the LTIP are both time-based and performance-based. Awards will be paid in the form of restricted stock units or shares of common stock of the Company, as described below.
Time-based awards under the LTIP were approved in the form of 126,980 time-based restricted stock units and granted on September 22, 2010 under the Company’s 2010 Plan. These time-based restricted stock units will vest in equal installments on March 31, 2011, March 31, 2012, and March 10, 2013, and will be converted into shares of common stock as they vest.
Performance-based awards under the LTIP under the LTIP were approved in the form of 235,820 performance-based restricted stock units and granted on September 22, 2010 under the Company’s 2010 Plan. These performance-based restricted stock units will vest at December 31, 2012, if (a) if the participant remains continuously employed with the Company through December 31, 2012 and (b) on a sliding scale ranging from 0% to 110% if the Company’s results fall between 80.1% and 110% of the specified three-year cumulative Adjusted EBITDA target as adjusted to reflect currency exchange rate fluctuations relative to the U.S. Dollar. Vested stock units will be converted into shares of the Company’s common stock after the close of the three-year performance period. At December 31, 2010, management determined that it was probable that the specified three-year cumulative Adjusted EBITDA target as adjusted to reflect currency exchange rate fluctuations relative to the U.S. Dollar would be achieved, and accordingly recorded approximately $294 in compensation expense. As all shares do not vest until December 31, 2012, no shares were issued as of December 31, 2010.
2010 MIC
On September 22, 2010 the Board approved an amendment and restatement of the Company’s Performance Award Program for 2010 (“2010 MIC”). Under the amended plan, payouts are determined by the Company’s performance against a specified Adjusted EBITDA metric for the 2010 fiscal year. Fifty percent (50%) of any
F-45
Table of Contents
XERIUM TECHNOLOGIES, INC.
NOTES TO CONSOLIDATED FINANCIAL STATEMENTS—(Continued)
(dollars in thousands except per share data)
December 31, 2010
2010 MIC award earned will be paid in cash and 50% is expected to be paid in the form of RSUs under the Company’s 2010 Plan based on an average per-share price within a collar. 2010 MIC awards will be paid out based on a sliding scale ranging from 35% if the metric is achieved at 95% of target up to 200% if the metric is achieved at 125% of target. The Adjusted EBITDA metric will be adjusted to reflect currency fluctuations relative to the U.S. Dollar. The awards will be fully vested at the grant date and are payable in Common Stock 90 days later. At December 31, 2010, management determined that the performance against the specified Adjusted EBITDA target as adjusted to reflect currency exchange rate fluctuations relative to the U.S. Dollar was met, and recorded approximately $5.0 million compensation expense, of which $2.5 million is included in accrued liabilities and $2.5 million is included in additional paid in capital in the Consolidated Balance Sheet at December 31, 2010. In accordance with the 2010 MIC agreement, the Company anticipates issuing approximately 164,000 shares of common stock prior to any withholdings for taxes in the second quarter of 2011.
Directors’ Deferred Stock Unit Plan
On September 22, 2010, the Board approved a new compensation plan for non-management directors (the “DSU Plan”). Under this plan, each director will receive an annual retainer of $95, to be paid on a quarterly basis in arrears beginning with the quarter ended September 30, 2010. Half of the annual retainer is payable in deferred stock units (“DSUs”), with the remaining half payable in cash, unless the director irrevocably elects to receive the remaining half in DSUs. The non-management directors were awarded an aggregate of 9,873 DSUs under the DSU Plan for service during the year ended December 31, 2010.
Non-employee Director RSU Awards
Awards to non-employee directors vest immediately under the 2005 Plan and the underlying shares will be issued to the director upon termination of service as a member of the Board or a change in control, as defined in the 2005 Plan. Annually during 2005, 2006 and 2007, the non-employee directors were granted 625 RSUs in the aggregate. In July 2008, they also were granted 2,441 RSUs in the aggregate. On June 9, 2009 the non-employee directors were granted 11,236 RSUs in the aggregate. These RSUs were fully vested on the grant date, provided however, that if a director ceases to serve as a member of the Board for any reason other than as a result of a change in control (as defined in the 2005 Plan) prior to the 2010 Annual Meeting of stockholders, the director will forfeit a pro rata portion of the award. This forfeiture provision was subsequently modified in connection with the Company’s chapter 11 reorganization (see Note 1) so that the directors departing from the Board as a consequence of the chapter 11 reorganization would not forfeit restricted stock units as a result. On August 4, 2009, Board members who served as non-employee directors during the year prior to the 2009 Annual Meeting of Stockholders were awarded 11,097 RSUs in the aggregate that vested immediately.
Additionally, as of the Effective Date, the two continuing non-employee members of the Board were granted an aggregate of 5,977 stock options with an exercise price of $20.80. These stock options vested immediately and have a four-year term.
Warrants
In connection with reorganization, the holders of the Company’s Old Common Stock also received warrants to purchase an aggregate of 1,663,760 shares of New Common Stock (the “Warrants”), representing approximately 0.0324108 Warrants for each share of Old Common Stock. The Warrants are exercisable for a
F-46
Table of Contents
XERIUM TECHNOLOGIES, INC.
NOTES TO CONSOLIDATED FINANCIAL STATEMENTS—(Continued)
(dollars in thousands except per share data)
December 31, 2010
term of four years from the issue date at an exercise price of $19.55 per share of New Common Stock. The exercise price was determined in accordance with a formula based on the final amount of allowed claims of the Lenders.
Performance-based RSU Awards
On May 16, 2007, the Company granted 37,144 performance-based RSUs to certain officers and employees of the Company. Generally, to earn common stock under these performance-based RSUs, defined shareholder return targets must be met over the four years following the grant date and the grantee must be employed by the Company through May 16, 2011. On August 6, 2008, the Company granted 21,650 performance-based RSU awards (based on shareholder return targets) and at various dates during 2009, the Company granted 51,173 performance-based RSU awards to certain employees, specifically 47,348 and 1,875 RSU awards to its chief executive officer and chief financial officer, respectively. Generally, to earn common stock under the performance-based RSUs granted in 2008 and 2009, defined shareholder return targets must be met over the three years following January 3, 2008 and the grantee must be employed by the Company through January 3, 2011.
On December 24, 2009, the Compensation Committee of the Company’s Board of Directors approved an amendment to the terms of all performance-based restricted stock units of the Company outstanding on December 24, 2009. The amendment provides that upon completion of a successful debt restructuring of the Company, as defined, which shall constitute a new performance criterion, such performance-based restricted stock units shall vest and settle in full. The Compensation Committee determined that this new performance criterion would be met and vesting would occur on the date the Plan is confirmed by the Bankruptcy Court (the “Confirmation Date”). The Confirmation Date occurred on May 12, 2010 and 43,854 shares of common stock underlying 71,571 performance-based RSUs were issued on that date; the remaining 27,717 shares underlying such RSUs were withheld from issuance in connection with minimum tax withholding requirements related to the issuance of such shares to the recipients. This modification had no material impact on the Company’s stock based compensation expense for 2009. In 2010, however, the Company recorded stock based compensation of approximately $1,741 related to this modification.
On December 31, 2009, the Company entered into an amendment to the employment agreement with Mr. Light as the per-participant, per-year limitations under the Company’s 2005 Plan prevented the Company from fulfilling its contractual obligation and granting to Mr. Light stock units under the Company’s equity incentive plan with an aggregate value of $1,250 on January 1, 2010. The amendment to Mr. Light’s employment agreement provides that in lieu of granting him such restricted stock units, the Company instead would (i) grant to Mr. Light 25,000 performance-based restricted stock units on January 1, 2010, which are to vest annually over a three-year period if the price of the Company’s common stock meets or exceeds certain price targets approved by the Compensation Committee of the Company’s Board of Directors; and (ii) make a cash payment to Mr. Light of $825 which Mr. Light was obligated to use the total amount of such cash payment, less the amount necessary to satisfy tax obligations with respect to the cash payment, to purchase shares of common stock from the Company at its agreed fair value, based on the average per share closing price on the New York Stock Exchange of the Company’s shares of common stock for the 20 trading days prior to January 1, 2010. Accordingly, a total of 39,764 shares of common stock were sold to Mr. Light on January 5, 2010 for approximately $531 in reliance upon the exemption from registration provided by Section 4(2) of the Securities Act of 1933, as amended. On September 22, 2010, the Board approved an amendment to the terms of 25,000
F-47
Table of Contents
XERIUM TECHNOLOGIES, INC.
NOTES TO CONSOLIDATED FINANCIAL STATEMENTS—(Continued)
(dollars in thousands except per share data)
December 31, 2010
restricted stock units previously granted to Mr. Light under the 2005 Equity Incentive Plan on January 1, 2010. The terms of the amended award align with those of the LTIP awards described above, including that 35% of such award is a time-based award (8,750 RSUs) and the remainder is a performance-based award with the exception that no scale for performance above 100% is provided.
Time-based RSU Awards
On August 6, 2008, the Company’s granted 21,650 time-based RSU awards to certain of the Company’s officers under the 2005 Plan, The time-based restricted stock unit awards are scheduled to vest completely, in nearly equal installments on the first, second, and third anniversaries of January 3, 2008 provided that the named officer continues to be employed by the Company on such dates. Additionally, on various dates during 2008, the Company granted 11,384 time-based RSU awards to certain employees, specifically 5,625 RSUs to its chief executive officer. Generally, such awards vest in nearly equal installments on the first, second and third anniversaries of the grant date. The time-based restricted stock units may also vest, in whole or in part, in connection with a change of control (as defined in the awards) and/or termination of employment under the circumstances set forth in the restricted stock unit awards. Dividends, if any, on such time based restricted stock units will be paid at the same rate as dividends on the Company’s common stock, but only in the form of additional restricted stock units.
At various dates in 2009, the Company granted 55,674 time-based RSU awards to certain employees, specifically 47,348 and 5,625 RSUs to its chief executive officer and chief financial officer, respectively. Such awards vest in nearly equal installments on certain dates as described in the table below. The time based restricted stock units may also vest, in whole or in part, in connection with a change of control (as defined in the awards) and/or termination of employment under the circumstances set forth in the restricted stock unit awards.
Certain time-based RSUs and all non-employee director RSUs automatically adjust to reflect awards of additional RSUs upon payment of dividends by the Company. Outstanding RSUs that were awarded in connection with the payment of dividends are included in the table below. No RSUs were awarded in connection with the payment of dividends since 2007 as no dividends were paid by the Company after 2007 because the Company’s senior credit facility in effect at that time precluded the payment of dividends. The Amended and Restated Credit Facility continues to prohibit the payment of dividends.
During the first quarter of 2010, 18,707 shares of common stock underlying 28,808 time-based RSUs were issued; the remaining 10,101 shares underlying the RSUs were withheld from issuance in connection with minimum tax withholding requirements related to the issuance of such shares to the recipients.
In March 2010, the Board approved the contingent acceleration of all outstanding time-based awards and non-employee director awards (for departing directors) scheduled to vest on or prior to September 30, 2010 so that they will be vested and settled immediately prior to the record date under the Plan, which was the day before the Effective Date. Accordingly, on May 24, 2010, 16,880 shares of common stock underlying 18,732 RSUs were issued; the remaining 1,852 shares underlying the RSUs were withheld from issuance in connection with minimum tax withholding requirements related to the issuance of such shares to the recipients.
F-48
Table of Contents
XERIUM TECHNOLOGIES, INC.
NOTES TO CONSOLIDATED FINANCIAL STATEMENTS—(Continued)
(dollars in thousands except per share data)
December 31, 2010
A summary of RSUs outstanding as of December 31, 2010 and their vesting dates is as follows.
| Vesting Dates |
Number of RSUs | |||||
| Time-based RSUs granted during various dates in 2008 |
Various dates through November 2011. | 5,743 | ||||
| Time-based RSUs granted during various dates in 2009 |
With respect to 24,649 RSUs—January 2011; with respect to 500 RSUs—annually in equal installments on April 30, 2011 and 2012. | 25,149 | ||||
| Time-based RSUs granted during 2010 |
Annually in equal installments on March 31, 2011, March 31, 2012 and March 10, 2013. | 131,167 | ||||
| Performance-based RSUs granted during 2010 |
December 31, 2012 | 227,583 | ||||
| Non-employee directors’ RSUs |
Immediately vested on grant dates with underlying shares to be awarded upon director’s departure from the Board of Directors | 19,118 | ||||
| Total RSUs outstanding |
408,760 | |||||
F-49
Table of Contents
XERIUM TECHNOLOGIES, INC.
NOTES TO CONSOLIDATED FINANCIAL STATEMENTS—(Continued)
(dollars in thousands except per share data)
December 31, 2010
RSU activity during years ended December 31, 2008, 2009 and 2010, are presented below.
| Number of RSUs |
Price Range of
Grant-Date Fair Value Per RSU |
Weighted Average Grant-Date Fair Value Price Per RSU |
||||||||||
| Outstanding, December 31, 2007 |
98,758 | $ | 91.80 – 240.20 | $ | 191.60 | |||||||
| Granted |
58,452 | 23.80 – 108.00 | 103.00 | |||||||||
| Forfeited |
(74,441 | ) | 108.00 – 233.20 | 161.80 | ||||||||
| Issued or withheld for tax withholding purposes |
(14,840 | ) | 23.80 – 233.20 | 182.20 | ||||||||
| Outstanding, December 31, 2008 |
67,929 | 75.40 – 240.20 | 150.00 | |||||||||
| Granted |
129,180 | 10.80 – 33.00 | 26.40 | |||||||||
| Forfeited |
(23,603 | ) | 102.40 – 233.20 | 193.00 | ||||||||
| Issued or withheld for tax withholding purposes |
(6,035 | ) | 77.80 – 108.00 | 104.20 | ||||||||
| Outstanding, December 31, 2009 |
167,471 | 10.80 – 240.20 | 50.20 | |||||||||
| Granted |
393,623 | 12.60 – 15.95 | 12.97 | |||||||||
| Forfeited |
(33,158 | ) | 12.60 – 163.00 | 29.40 | ||||||||
| Issued or withheld for tax withholding purposes |
(119,176 | ) | 10.40 – 240.20 | 50.54 | ||||||||
| Outstanding, December 31, 2010 |
408,760 | $ | 10.40 – 240.20 | $ | 15.74 | |||||||
| Vested, December 31, 2010 (1) |
19,118 | $ | 13.18 – 240.20 | $ | 26.89 | |||||||
| (1) | Vested RSUs at December 31, 2010 consisted of non-employee director RSUs. The total grant-date fair value of such non-employee director RSUs that vested during the year ended December 31, 2010 was $514. Excluded from this table is an aggregate of 5,977 stock options with an exercise price of $20.80 that were granted on the Effective Date to the two continuing members of the Board of Directors. The total grant date fair value of such non-employee director stock options that vested during the year ended December 31, 2010 was $41. |
F-50
Table of Contents
XERIUM TECHNOLOGIES, INC.
NOTES TO CONSOLIDATED FINANCIAL STATEMENTS—(Continued)
(dollars in thousands except per share data)
December 31, 2010
Assumptions
In accordance with Topic 718, the Company uses the following assumptions in determining compensation expense:
Grant-Date Fair Value
The Company calculates the grant-date fair value of time-based RSUs, performance-based RSUs and non-employee directors’ RSUs based on the closing price of the Company’s common stock on the date of grant.
For performance-based RSUs granted on January 1, 2010, which were amended on September 22, 2010 and the time-based RSU’s granted on September 22, 2010, as previously discussed, the Company calculated the grant-date fair value of the original RSUs granted on January 1, 2010 by using a Monte Carlo pricing model and the following assumptions:
| Expected term (i) |
3 years | |||
| Expected volatility (ii) |
120 | % | ||
| Expected dividends (iii) |
None | |||
| Risk-free interest rate (iv) |
1.75 | % |
| (i) | Expected term. Performance-based RSUs expire three years after the grant date. |
| (ii) | Expected volatility. The Company is responsible for estimating the volatility of the price of its common stock and has considered a number of factors, including third party estimates, to determine its expected volatility. For these awards, after being a public company for more than four years, the Company determined to use its own historical volatility rather than a peer group analysis. The volatility for the 2010 award was 120%. |
| (iii) | Expected dividends. No dividends were declared by the Company after 2007 because the Company’s senior credit facility at that time precluded the payment of dividends. The Amended and Restated Credit Facility continues to prohibit the payment of dividends. |
| (iv) | Risk-free interest rate. The yield on zero-coupon U.S. Treasury securities for the period that is commensurate with the expected term assumptions. |
For stock options awarded to the two continuing non-employee members of the Board on the Effective Date, the Company calculated the grant-date fair value by using a Black-Scholes option pricing model and the following assumptions:
| Expected term (i) |
3 years | |||
| Expected volatility (ii) |
75 | % | ||
| Expected dividends (iii) |
None | |||
| Risk-free interest rate (iv) |
1.19 | % |
| (i) | Expected term. The options are immediately vested at the date of grant but have a four-year contractual term. Therefore a three-year expected term was determined to be reasonable. |
| (ii) | Expected volatility. The Company is responsible for estimating the volatility of the price of its common stock and has considered a number of factors, including third party estimates, to determine its expected volatility. For these awards, after being a public company for five years, the Company determined to use a blend of its own five-year historical volatility and that of its peer group, which resulted in volatility of 75%. |
F-51
Table of Contents
XERIUM TECHNOLOGIES, INC.
NOTES TO CONSOLIDATED FINANCIAL STATEMENTS—(Continued)
(dollars in thousands except per share data)
December 31, 2010
| (iii) | Expected dividends. No dividends were declared by the Company after 2007 because the Company’s senior credit facility at that time precluded the payment of dividends. The Amended and Restated Credit Facility continues to prohibit the payment of dividends. |
| (iv) | Risk-free interest rate. The yield on zero-coupon U.S. Treasury securities for the period that is commensurate with the expected term assumptions. |
For the Warrants issued on the Effective Date, the Company calculated the grant-date fair value by using a Black-Scholes option pricing model and the following assumptions. The Warrants are not considered stock-based compensation and their issuance has been recorded as a memorandum entry only.
| Expected term (i) |
4 years | |||
| Expected volatility (ii) |
75 | % | ||
| Expected dividends (iii) |
None | |||
| Risk-free interest rate (iv) |
1.65 | % |
| (i) | Expected term. Warrants expire four years after the grant date. |
| (ii) | Expected volatility. The Company is responsible for estimating the volatility of the price of its common stock and has considered a number of factors, including third party estimates, to determine its expected volatility. For these awards, after being a public company for five years, the Company determined to use a blend of its own five-year historical volatility and that of its peer group, which resulted in volatility of 75%. |
| (iii) | Expected dividends. No dividends were declared by the Company after 2007 because the Company’s senior credit facility at that time precluded the payment of dividends. The Amended and Restated Credit Facility continues to prohibit the payment of dividends. |
| (iv) | Risk-free interest rate. The yield on zero-coupon U.S. Treasury securities for the period that is commensurate with the expected term assumptions. |
Forfeitures
As the time-based and performance-based RSUs require continued employment up to the time of vesting, the amount of stock-based compensation recognized during a period is required to include an estimate of forfeitures. No estimate of forfeitures has been made for RSUs and stock options awarded to non-employee directors because they vest immediately upon grant. Topic 718 requires forfeitures to be estimated at the time of grant and revised, if necessary, in subsequent periods if actual forfeitures differ from those estimates. The term “forfeitures” is related to employee attrition and based on a historical analysis of its employee turnover. This analysis is re-evaluated quarterly and the forfeiture rate will be adjusted as necessary. Ultimately, the actual expense recognized over the vesting period will be only for those shares that meet the requirements of continued employment up to the time of vesting. As of December 31, 2010 the following forfeiture rates are estimated:
| Description of Award |
Forfeiture Rates | |
| Time-based RSUs granted on various dates in 2008 and 2009 (0% 5%, 13%, 52%, 67% and 71% forfeiture rates with respect to 49,299, 2,950, 4,875, 25,400, 5,625 and 558 original grants of RSUs, respectively) |
0%-71% | |
| Time-based RSUs granted in 2010 (5% and 10% forfeiture rates with respect to 8,750 and 122,417 original grants of RSUs, respectively) |
5%-10% | |
| Performance-based RSUs granted in 2010 (5% and 10% forfeiture rates with respect to 227,253 original grants of RSUs, respectively) |
5%-10% | |
F-52
Table of Contents
XERIUM TECHNOLOGIES, INC.
NOTES TO CONSOLIDATED FINANCIAL STATEMENTS—(Continued)
(dollars in thousands except per share data)
December 31, 2010
In accordance with Topic 718, the cumulative effect of applying the change in estimate retrospectively is recognized in the period of change. During 2010, the Company recorded an aggregate amount of $201 as a result of changes to it’s forfeiture rates during the year ended December 31, 2010.
As of December 31, 2010, there was approximately $4.3 million of total unrecognized compensation expense related to unvested share-based awards which is expected to be recognized over a weighted average period of $2.06 years.
Our credit facility, as amended, prohibits our payment of dividends and accordingly, we made no such payments during the years ended December 31, 2009 and 2010.
14. Restructuring and Impairments Expense
Restructuring and impairments expense included in the Company’s statements of operations are the result of its long-term strategy to reduce production costs and improve long-term competitiveness. Restructuring and impairments expense consists principally of severance costs related to reductions in work force and of facility costs and impairments of assets principally related to closing facilities and/or shifting production from one facility to another. Impairment amounts for assets held for sale reflect estimated selling prices less costs to sell and are considered to be a Level 1 within the fair value hierarchy. Facility costs are principally comprised of costs to relocate assets to the Company’s other facilities, operating lease termination costs and other associated costs.
During 2010, the Company incurred $10,004 for restructuring and impairment related expense in the Clothing, Rolls and Corporate segments of $4,351, $4,109 and $1,543, respectively. This amount included approximately $2,400 related to the Company’s Vietnam clothing facility including $2,100 as an impairment, approximately $1,800 related to the Company’s closure of its Stowe Woodward roll covers facility in North Bay, Ontario including approximately $700 as an impairment, approximately $1,500 related to the closure of the Company’s Massachusetts corporate operations, the closure of a rolls plant in Germany and approximately $4,700 related to our continuation of the streamlining of the Company’s operations.
During 2009, the Company incurred $4,080 for restructuring and impairments-related expense in the Clothing, Rolls and Corporate segments of $1,233, $1,662 and $1,185, respectively. During 2009, the Company continued its program of streamlining its operating structure and incurred restructuring expenses of approximately $3,600 in connection therewith, which was partially reduced by a gain on the sale of its rolls manufacturing facility in Sweden (closed in 2008) of approximately $1,200. The Company also impaired $1,669 of long-term assets at various locations around the world.
During 2008, the Company incurred a total of $16,968 for restructuring and impairment-related expense in the Clothing, Rolls and Corporate segments of $9,373, $4,541 and $3,054, respectively. During 2008, the Company continued its program of streamlining its operating structure and recorded restructuring expenses of approximately $6,100 in connection therewith.
In addition in 2008, the Company closed its rolls manufacturing facility in Sweden and transferred production to certain of the Company’s other rolls manufacturing facilities in Europe. Certain assets at the Sweden facility were redeployed to the Company’s roll covering plants in China. The Company also announced in 2008 that it would be closing its rolls facility in Sherbrooke, Canada in early 2009. During 2008, the Company recorded restructuring expenses of approximately $2,800 related to these closures.
F-53
Table of Contents
XERIUM TECHNOLOGIES, INC.
NOTES TO CONSOLIDATED FINANCIAL STATEMENTS—(Continued)
(dollars in thousands except per share data)
December 31, 2010
In December, 2008, the Company committed to a plan to cease production at its Huyck Wangner clothing facility in Geelong, Australia, which occurred at the end of the first quarter 2009. The Company retains a sales and distribution operation in Australia to service customers. In December 2008, the Company also discontinued construction of its new Vietnam clothing facility. As a result of these actions, the Company recorded restructuring expenses in the fourth quarter of 2008 of approximately $4,100 and an impairment loss of approximately $3,000 based upon the Company’s evaluation under Topic 360. The Company has temporarily partially reopened the Australia facility in mid-2010 and plans to continue operations during 2011.
During 2008, the Company also recorded additional asset impairments in the U.S. of approximately $1,000 based upon the Company’s evaluation under Topic 360.
The Company estimates restructuring expenses of approximately $1.0 million to $2.0 million during 2011, primarily related to a continuation of streamlining its operating structure.
The table below sets forth the significant components and activity in the restructuring program and asset impairments during 2010:
| Balance at December 31 2009 |
Charges | Write- offs |
Currency Effects |
Cash Payments |
Balance at December 31 2010 |
|||||||||||||||||||
| Severance |
$ | 536 | 4,663 | — | (49 | ) | $ | (2,895 | ) | $ | 2,255 | |||||||||||||
| Facility |
1,478 | 2,451 | — | (57 | ) | (3,401 | ) | 471 | ||||||||||||||||
| Asset impairments |
— | 2,890 | (2,890 | ) | — | — | — | |||||||||||||||||
| Total |
$ | 2,014 | $ | 10,004 | $ | (2,890 | ) | $ | (106 | ) | $ | (6,296 | ) | $ | 2,726 | |||||||||
The table below sets forth the significant components and activity in the restructuring program and asset impairments during 2009:
| Balance at December 31 2008 |
Charges | Write- offs |
Currency Effects |
Cash Payments |
Balance at December 31 2009 |
|||||||||||||||||||
| Severance |
$ | 5,422 | $ | 3,129 | $ | — | $ | 143 | $ | (8,158 | ) | $ | 536 | |||||||||||
| Facility costs |
2,455 | (718 | ) | — | 117 | (376 | ) | 1,478 | ||||||||||||||||
| Asset impairments |
— | 1,669 | (1,669 | ) | — | — | — | |||||||||||||||||
| Total |
$ | 7,877 | $ | 4,080 | $ | (1,669 | ) | $ | 260 | $ | (8,534 | ) | $ | 2,014 | ||||||||||
The table below sets forth the significant components and activity in the restructuring program and asset impairments during 2008:
| Balance at December 31 2007 |
Charges | Write- offs |
Currency Effects |
Cash Payments |
Balance at December 31 2008 |
|||||||||||||||||||
| Severance |
$ | 2,046 | $ | 8,804 | $ | — | $ | (476 | ) | $ | (4,952 | ) | $ | 5,422 | ||||||||||
| Facility costs |
— | 4,175 | — | 50 | (1,770 | ) | 2,455 | |||||||||||||||||
| Asset impairments |
— | 3,989 | (3,989 | ) | — | — | — | |||||||||||||||||
| Total |
$ | 2,046 | $ | 16,968 | $ | (3,989 | ) | $ | (426 | ) | $ | (6,722 | ) | $ | 7,877 | |||||||||
F-54
Table of Contents
XERIUM TECHNOLOGIES, INC.
NOTES TO CONSOLIDATED FINANCIAL STATEMENTS—(Continued)
(dollars in thousands except per share data)
December 31, 2010
15. Business Segment and Geographic Region Information
The Company is a global manufacturer and supplier of consumable products primarily used in the production of paper, and is organized into two reportable segments: Clothing and Roll Covers. The Clothing segment represents the manufacture and sale of synthetic textile belts used to transport paper along the length of papermaking machines. The Roll Covers segment primarily represents the manufacture and refurbishment of covers used on the steel rolls of a papermaking machine. The Company manages each of these operating segments separately.
Management evaluates segment performance based on earnings before interest, taxes, depreciation and amortization before allocation of corporate charges. Such measure is then adjusted to exclude items that are of an unusual nature and are not used in measuring segment performance or are not segment specific (“Segment Earnings (Loss)”). The accounting policies of these segments are the same as those described in Accounting Policies in Note 2. Inter-segment net sales and inter-segment eliminations are not material for any of the periods presented.
The “Corporate” column consists of the Company’s headquarters, related assets and expenses that are not allocable to reportable segments. Significant Corporate assets include cash, investments in subsidiaries and deferred financing costs. Corporate depreciation and amortization consists primarily of deferred financing costs. Corporate segment earnings (loss) consists of general and administrative expenses. The “Eliminations” column represents eliminations of investments in subsidiaries.
Summarized financial information for the Company’s reportable segments is presented in the tables that follow for each of the three years in the period ended December 31, 2010.
| Clothing | Roll Covers |
Corporate | Eliminations | Total | ||||||||||||||||
| 2010: |
||||||||||||||||||||
| Net sales |
$ | 359,686 | $ | 188,648 | $ | — | $ | — | $ | 548,334 | ||||||||||
| Depreciation and amortization (1) |
30,188 | 10,771 | 322 | — | 41,281 | |||||||||||||||
| Segment Earnings (Loss) |
83,235 | 42,881 | (10,666 | ) | — | |||||||||||||||
| Total assets |
523,769 | 234,222 | 706,503 | (764,351 | ) | 700,143 | ||||||||||||||
| Capital expenditures |
21,919 | 5,756 | 253 | — | 27,928 | |||||||||||||||
| 2009: |
||||||||||||||||||||
| Net sales |
$ | 331,398 | $ | 168,693 | $ | — | $ | — | $ | 500,091 | ||||||||||
| Depreciation and amortization (1) |
29,432 | 12,137 | 298 | — | 41,867 | |||||||||||||||
| Segment Earnings (Loss) |
80,305 | 36,677 | (20,506 | ) | — | |||||||||||||||
| Total assets |
542,616 | 240,863 | 696,464 | (786,432 | ) | 693,511 | ||||||||||||||
| Capital expenditures |
16,321 | 2,557 | 654 | — | 19,532 | |||||||||||||||
| 2008: |
||||||||||||||||||||
| Net sales |
$ | 413,236 | $ | 224,903 | $ | — | $ | — | $ | 638,139 | ||||||||||
| Depreciation and amortization (1) |
32,155 | 13,501 | 272 | — | 45,928 | |||||||||||||||
| Segment Earnings (Loss) |
114,129 | 55,617 | (11,859 | ) | — | |||||||||||||||
| Total assets |
548,851 | 337,555 | 809,445 | (877,754 | ) | 818,097 | ||||||||||||||
| Capital expenditures |
28,492 | 10,143 | 393 | — | 39,028 | |||||||||||||||
| (1) | Depreciation and amortization excludes amortization of financing costs of $5,950, $5,417, and $4,670 for 2010, 2009 and 2008, respectively. |
F-55
Table of Contents
XERIUM TECHNOLOGIES, INC.
NOTES TO CONSOLIDATED FINANCIAL STATEMENTS—(Continued)
(dollars in thousands except per share data)
December 31, 2010
Provided below is a reconciliation of Segment Earnings (Loss) to income before provision for income taxes for each of the three years in the period ended December 31, 2010:
| 2010 | 2009 | 2008 | ||||||||||
| Segment Earnings (Loss): |
||||||||||||
| Clothing |
$ | 83,235 | $ | 80,305 | $ | 114,129 | ||||||
| Roll Covers |
42,881 | 36,677 | 55,617 | |||||||||
| Corporate |
(10,666 | ) | (20,506 | ) | (11,859 | ) | ||||||
| Non-cash compensation and related expenses |
(7, 310 | ) | (2,305 | ) | (2,009 | ) | ||||||
| Net interest expense |
(56,795 | ) | (67,300 | ) | (58,504 | ) | ||||||
| Depreciation and amortization (2) |
(41,281 | ) | (41,867 | ) | (45,928 | ) | ||||||
| Restructuring and impairments expenses |
(10,004 | ) | (4,080 | ) | (16,968 | ) | ||||||
| Financial restructuring costs included in general and administrative expense |
(9,923 | ) | — | — | ||||||||
| Unrealized foreign exchange gain (loss) on revaluation of debt |
— | — | 1,985 | |||||||||
| Expenses related to debt or equity financing |
— | — | (5,966 | ) | ||||||||
| Goodwill impairment |
— | (80,600 | ) | — | ||||||||
| Income (loss) before reorganization items and provision (benefit) for income taxes |
$ | (9,863 | ) | $ | (99,676 | ) | $ | 30,497 | ||||
| (2) | Excludes amortization of deferred finance costs that are charged to interest expense. |
Information concerning principal geographic areas is set forth below. Net sales amounts are by geographic area of product destination. Net sales amounts are for the years ended December 31 and property, plant and equipment amounts are as of December 31.
| North America |
Europe | Asia- Pacific |
Other | Total | ||||||||||||||||
| 2010: |
||||||||||||||||||||
| Net sales (3) |
$ | 197,805 | $ | 188,723 | $ | 95,056 | $ | 66,750 | $ | 548,334 | ||||||||||
| Property, plant and equipment (4) |
108,322 | 148,051 | 38,961 | 65,936 | 361,270 | |||||||||||||||
| 2009: |
||||||||||||||||||||
| Net sales (3) |
$ | 175,457 | $ | 206,969 | $ | 67,752 | $ | 49,913 | $ | 500,091 | ||||||||||
| Property, plant and equipment (4) |
112,137 | 167,251 | 46,033 | 60,128 | 385,549 | |||||||||||||||
| 2008: |
||||||||||||||||||||
| Net sales (3) |
$ | 227,337 | $ | 237,054 | $ | 99,456 | $ | 74,292 | $ | 638,139 | ||||||||||
| Property, plant and equipment (4) |
115,117 | 176,738 | 46,264 | 46,471 | 384,590 | |||||||||||||||
| (3) | Included in North America are net sales in the United States of $147,427, $135,449 and $168,999 for 2010, 2009 and 2008, respectively. |
| (4) | Included in North America are property, plant and equipment in the United States of $72,090, $76,161 and $82,025 as of December 31, 2010, 2009 and 2008, respectively. Included in Europe is property, plant and equipment in Germany of $69,568, $76,070 and $79,630 as of December 31, 2010, 2009 and 2008, respectively. |
F-56
Table of Contents
XERIUM TECHNOLOGIES, INC.
SCHEDULE II
VALUATION AND QUALIFYING ACCOUNTS
(dollars in thousands)
ALLOWANCE FOR DOUBTFUL ACCOUNTS
| Classification |
Balance at Beginning of Year |
Charged (credited) to Cost and Expense |
Effect of
Foreign Currency Translation |
Deduction from Reserves |
Balance at End of Year |
|||||||||||||||
| For the year-ended December 31, 2010: |
||||||||||||||||||||
| Allowance for doubtful accounts |
$ | 7,370 | $ | (1,180 | ) | $ | (177 | ) | $ | (1,258 | ) | $ | 4,755 | |||||||
| For the year-ended December 31, 2009: |
||||||||||||||||||||
| Allowance for doubtful accounts |
$ | 14,937 | $ | (4,963 | ) | $ | 951 | $ | (3,555 | ) | $ | 7,370 | ||||||||
| For the year-ended December 31, 2008: |
||||||||||||||||||||
| Allowance for doubtful accounts |
$ | 5,367 | $ | 11,397 | $ | (441 | ) | $ | (1,386 | ) | $ | 14,937 | ||||||||
ALLOWANCE FOR SALES RETURNS
| Classification |
Balance at Beginning of Year |
Charged to Revenue |
Effect of
Foreign Currency Translation |
Deduction from Reserves |
Balance at End of Year |
|||||||||||||||
| For the year-ended December 31, 2010: |
||||||||||||||||||||
| Allowance for sales returns |
$ | 6,422 | $ | 4,176 | $ | 227 | $ | (5,157 | ) | $ | 5,668 | |||||||||
| For the year-ended December 31, 2009: |
||||||||||||||||||||
| Allowance for sales returns |
$ | 6,525 | $ | 5,497 | $ | 850 | $ | (6,450 | ) | $ | 6,422 | |||||||||
| For the year-ended December 31, 2008: |
||||||||||||||||||||
| Allowance for sales returns |
$ | 7,586 | $ | 7,782 | $ | (805 | ) | $ | (8,038 | ) | $ | 6,525 | ||||||||
ALLOWANCE FOR CUSTOMER REBATES
| Classification |
Balance at Beginning of Year |
Charged to Revenue |
Effect of
Foreign Currency Translation |
Deduction from Reserves |
Balance at End of Year |
|||||||||||||||
| For the year-ended December 31, 2010: |
||||||||||||||||||||
| Allowance for customer rebates |
$ | 1,432 | $ | 602 | $ | (50 | ) | $ | (767 | ) | $ | 1,217 | ||||||||
| For the year-ended December 31, 2009: |
||||||||||||||||||||
| Allowance for customer rebates |
$ | 1,620 | $ | 1,008 | $ | 82 | $ | (1,278 | ) | $ | 1,432 | |||||||||
| For the year-ended December 31, 2008: |
||||||||||||||||||||
| Allowance for customer rebates |
$ | 2,002 | $ | 1,133 | $ | (118 | ) | $ | (1,397 | ) | $ | 1,620 | ||||||||
WARRANTY LIABILITY
| Classification |
Balance at Beginning of Year |
Charged to Revenue or Cost of Sales |
Effect of
Foreign Currency Translation |
Deduction from Reserves |
Balance at End of Year |
|||||||||||||||
| For the year-ended December 31, 2010: |
||||||||||||||||||||
| Warranty liability |
$ | 1,973 | $ | 1,472 | $ | (95 | ) | $ | (1,662 | ) | $ | 1,688 | ||||||||
| For the year-ended December 31, 2009: |
||||||||||||||||||||
| Warranty liability |
$ | 2,424 | $ | 2,018 | $ | 80 | $ | (2,549 | ) | $ | 1,973 | |||||||||
| For the year-ended December 31, 2008: |
||||||||||||||||||||
| Warranty liability |
$ | 2,857 | $ | 1,979 | $ | (136 | ) | $ | (2,276 | ) | $ | 2,424 | ||||||||
Table of Contents
| Exhibit Number |
Description of Exhibit | |
| 2.1(1)* | Joint Prepackaged Plan of Reorganization, as confirmed by the bankruptcy court on May 12, 2010. | |
| 2.2(2) | Confirmation Order, dated May 12, 2010. | |
| 3.1(3) | Second Amended and Restated Certificate of Incorporation of Xerium Technologies, Inc. | |
| 3.2(4) | Amended and Restated By-Laws of Xerium Technologies, Inc. | |
| 4.1(5) | Registration Rights Agreement by and among Xerium Technologies, Inc. and certain of its investors. | |
| 4.2(6) | Rights Agreement between the Company and American Stock Transfer & Trust Company, LLC, as Rights Agent, dated May 25, 2010. | |
| 4.3(7) | Registration Rights Agreement entered into by and among the Company and the RRA Parties, dated May 25, 2010. | |
| 4.4(8) | Form of Stock Certificate. | |
| 4.5(9) | Form of Warrant. | |
| 4.6(10) | Dividend Reinvestment Plan. | |
| 10.1(11) | Amended and Restated Credit and Guaranty Agreement, dated as of May 30, 2008, among Xerium Technologies, Inc. and certain financial institutions as the Lenders. | |
| 10.2(12) | Waiver and Amendment No. 1 to Credit Agreement, dated as of September 29, 2009, by and among Xerium Technologies, Inc., certain subsidiaries of Xerium Technologies, Inc. and certain financial institutions as the Lenders. | |
| 10.3(13) | Waiver and Amendment No. 2 to Credit Agreement, dated as of December 14, 2009, by and among Xerium Technologies, Inc., certain subsidiaries of Xerium Technologies, Inc. and certain financial institutions as the Lenders. | |
| 10.4(14) | Waiver and Amendment No. 3 to Credit Agreement, dated as of January 29, 2010, among Xerium Technologies, Inc. and certain financial institutions as the Lenders. | |
| 10.5(15) | Waiver and Amendment No. 4 to Credit Agreement, dated as of February 26, 2010, among Xerium Technologies, Inc. and certain financial institutions as the Lenders. | |
| 10.6(16) | DIP Credit Agreement, dated April 1, 2010. | |
| 10.7(17) | Amended and Restated Credit Agreement among the Company and certain financial institutions as the Lenders, dated May 25, 2010. | |
| 10.8(18) | Exit Facility Credit Agreement among the Company and certain financial institutions as the Lenders, dated May 25, 2010. | |
| 10.9(19) | Director Nomination Agreement entered into by and among the Company and AS Investors, LLC, dated May 25, 2010. | |
| 10.10(20) | Director Nomination Agreement entered into by and among the Company, Carl Marks Strategic Investments, L.P., and Carl Marks Strategic Opportunities Fund, L.P., dated May 25, 2010. | |
| 10.11(21)+ | 2005 Equity Incentive Plan. | |
| 10.12(22)+ | Amendment No. 1 to the 2005 Equity Incentive Plan. | |
| 10.13(23)+ | Amendment No. 2 to the 2005 Equity Incentive Plan. | |
| 10.14(24)+ | Amendment No. 3 to the 2005 Equity Incentive Plan. | |
Table of Contents
| Exhibit Number |
Description of Exhibit | |
| 10.15(25)+ | Performance Criteria Terms for Performance-Based Awards Under the 2005 Equity Incentive Plan. | |
| 10.16(26)+ | Form of 2008 Shareholder Return Based Restricted Stock Units Agreement under the 2005 Equity Incentive Plan. | |
| 10.17(27)+ | Form of 2008 Time-Based Restricted Stock Units Agreement under the 2005 Equity Incentive Plan. | |
| 10.18(28)+ | Form of 2005 Performance-Based Restricted Stock Units Agreement for Executive Officers. | |
| 10.19(29)+ | Form of 2005 Time-Based Restricted Stock Units Agreement for Executive Officers. | |
| 10.20(30)+ | Form of Restricted Stock Units Agreement for Directors. | |
| 10.21(31)+ | Xerium Technologies, Inc. Performance Award Program for 2009. | |
| 10.22(32)+ | 2009 Director Restricted Stock Units Agreement dated as of June 9, 2009. | |
| 10.23(33)+ | 2009 Director Restricted stock Units Agreement dated as of August 4, 2009. | |
| 10.24(34)+ | 2010 Equity Incentive Plan of Xerium Technologies, Inc. | |
| 10.25(35)+ | Performance Award Program for 2010. | |
| 10.26(36)+ | Management Incentive Compensation Program for 2010. | |
| 10.27(37)+ | Long Term Incentive Plan. | |
| 10.28(38)+ | Form of Time-Based Restricted Stock Units Agreement under the Long Term Incentive Plan. | |
| 10.29(39)+ | Form of Independent Director Indemnification Agreement entered into between the Registrant and certain independent directors. | |
| 10.30(40)+ | Form of 2010 Director Option Agreement. | |
| 10.31(41)+ | Description of Compensation for Non-Management Directors. | |
| 10.32(42)+ | Directors’ Deferred Stock Unit Plan. | |
| 10.33(43)+ | Amended and Restated Service Contract with John Badrinas. | |
| 10.34(44)+ | Employment Agreement with Stephen R. Light. | |
| 10.35(45)+ | Amendment No. 1 to Employment Agreement with Stephen R. Light. | |
| 10.36(46)+ | Amendment No. 2 to Employment Agreement with Stephen R. Light. | |
| 10.37(47)+ | 2010 Performance-Based Restricted Stock Units Agreement with Stephen R. Light. | |
| 10.38(48)+ | Stock Purchase Agreement with Stephen R. Light. | |
| 10.39(49)+ | 2008 Time-Based Restricted Stock Units Agreement with Stephen R. Light. | |
| 10.40(50)+ | Amended and Restated Time-Based Restricted Stock Units and Performance-Based Restricted Stock Units Agreement with Stephen R. Light. | |
| 10.41(51)+ | Amended and Restated Employment Agreement with David Pretty. | |
| 10.42(52)+ | Employment Agreement with Thomas C. Johnson. | |
| 10.43(53)+ | Employment Agreement with David Maffucci. | |
| 10.44(54)+ | Amendment to Employment Agreement with David G. Maffucci. | |
| 10.45(55)+ | Employment Agreement with Eduardo Fracasso. | |
| 10.46(56)+ | Employment Agreement with Kevin McDougall. | |
Table of Contents
| Exhibit Number |
Description of Exhibit | |
| 10.47(57)+ | Agreement dated July 15, 2010 between Xerium Technologies, Inc. and AlixPartners, LLP. | |
| 21.1(58) | Subsidiaries of the Registrant. | |
| 23.1(58) | Consent of Ernst & Young LLP. | |
| 31.1(58) | Certification Statement of Chief Executive Officer pursuant to Section 302 of the Sarbanes-Oxley Act of 2002. | |
| 31.2(58) | Certification Statement of Chief Financial Officer pursuant to Section 302 of the Sarbanes-Oxley Act of 2002. | |
| 32.1(58) | Certification Statement of Chief Executive Officer pursuant to Section 906 of the Sarbanes-Oxley Act of 2002. | |
| 32.2(58) | Certification Statement of Chief Financial Officer pursuant to Section 906 of the Sarbanes-Oxley Act of 2002. | |
| (1) | Filed as Exhibit 2.1 to the Registrant’s Quarterly Report on Form 10-Q filed on May 14, 2010, and incorporated herein by reference. |
| (2) | Filed as Exhibit 2.2 to the Registrant’s Quarterly Report on Form 10-Q filed on May 14, 2010, and incorporated herein by reference. |
| (3) | Filed as Exhibit 3.1 to the Registrant’s Current Report on Form 8-K filed on May 28, 2010, and incorporated herein by reference. |
| (4) | Filed as Exhibit 3.2 to the Registrant’s Current Report on Form 8-K filed on May 28, 2010, and incorporated herein by reference. |
| (5) | Filed as Exhibit 4.1 to the Registrant’s Quarterly Report on Form 10-Q filed on June 23, 2005, and incorporated herein by reference. |
| (6) | Filed as Exhibit 10.3 to the Registrant’s Current Report on Form 8-K filed on May 28, 2010, and incorporated herein by reference. |
| (7) | Filed as Exhibit 10.4 to the Registrant’s Current Report on Form 8-K filed on May 28, 2010, and incorporated herein by reference. |
| (8) | Filed as Exhibit 4.1 to the Registrant’s Current Report on Form 8-K filed on May 28, 2010, and incorporated herein by reference. |
| (9) | Filed as Exhibit 4.2 to the Registrant’s Current Report on Form 8-K filed on May 28, 2010, and incorporated herein by reference. |
| (10) | Filed as Exhibit 99.2 to the Registrant’s Current Report on Form 8-K filed on February 20, 2007, and incorporated herein by reference. |
| (11) | Filed as Exhibit 10.1 to the Registrant’s Quarterly Report on Form 10-Q filed on August 7, 2008, and incorporated herein by reference. |
| (12) | Filed as Exhibit 10.1 to the Registrant’s Current Report on Form 8-K filed on September 30, 2009, and incorporated herein by reference. |
| (13) | Filed as Exhibit 10.1 to the Registrant’s Current Report on Form 8-K filed on December 14, 2009, and incorporated herein by reference. |
| (14) | Filed as Exhibit 10.1 to the Registrant’s Current Report on Form 8-K filed on February 1, 2010 and incorporated herein by reference. |
| (15) | Filed as Exhibit 10.1 to the Registrant’s Current Report on Form 8-K filed on February 26, 2010 and incorporated herein by reference. |
| (16) | Filed as Exhibit 10.1 to the Registrant’s Current Report on Form 8-K filed on April 2, 2010, and incorporated herein by reference. |
| (17) | Filed as Exhibit 10.1 to the Registrant’s Current Report on Form 8-K filed on May 28, 2010, and incorporated herein by reference. |
| (18) | Filed as Exhibit 10.2 to the Registrant’s Current Report on Form 8-K filed on May 28, 2010, and incorporated herein by reference. |
| (19) | Filed as Exhibit 10.5 to the Registrant’s Current Report on Form 8-K filed on May 28, 2010, and incorporated herein by reference. |
Table of Contents
| (20) | Filed as Exhibit 10.6 to the Registrant’s Current Report on Form 8-K filed on May 28, 2010, and incorporated herein by reference. |
| (21) | Filed as Exhibit 10.7 to the Registrant’s Quarterly Report on Form 10-Q filed on June 23, 2005, and incorporated herein by reference. |
| (22) | Filed as Exhibit 10.1 to the Registrant’s Current Report on Form 8-K filed on August 11, 2008, and incorporated herein by reference. |
| (23) | Filed as Exhibit 10.2 to the Registrant’s Current Report on Form 8-K filed on August 11, 2008, and incorporated herein by reference. |
| (24) | Filed as Exhibit 10.1 to the Registrant’s Current Report on Form 8-K filed on June 11, 2009, and incorporated herein by reference. |
| (25) | Filed as Exhibit 10.3 to the Registrant’s Current Report on Form 8-K filed on August 11, 2008, and incorporated herein by reference. |
| (26) | Filed as Exhibit 10.1 to the Registrant’s Current Report on Form 8-K filed on January 7, 2008, and incorporated herein by reference. |
| (27) | Filed as Exhibit 10.2 to the Registrant’s Current Report on Form 8-K filed on January 7, 2008, and incorporated herein by reference. |
| (28) | Filed as Exhibit 10.9 to the Registrant’s Registration Statement on Form S-1/A filed on May 3, 2005, Registration Number 333-114703, and incorporated herein by reference. |
| (29) | Filed as Exhibit 10.10 to the Registrant’s Registration Statement on Form S-1/A filed on May 3, 2005, Registration Number 333-114703, and incorporated herein by reference. |
| (30) | Filed as Exhibit 10.11 to the Registrant’s Registration Statement on Form S-1/A filed on May 3, 2005, Registration Number 333-114703, and incorporated herein by reference. |
| (31) | Filed as Exhibit 10.2 to the Registrant’s Current Report on Form 10-Q filed on August 6, 2009, and incorporated herein by reference. |
| (32) | Filed as Exhibit 10.3 to the Registrant’s Quarterly Report on Form 10-Q filed on November 6, 2009, and incorporated herein by reference. |
| (33) | Filed as Exhibit 10.4 to the Registrant’s Quarterly Report on Form 10-Q filed on November 6, 2009, and incorporated herein by reference. |
| (34) | Filed as Exhibit 10.7 to the Registrant’s Current Report on Form 8-K filed on May 28, 2010, and incorporated herein by reference. |
| (35) | Filed as Exhibit 10.8 to the Registrant’s Current Report on Form 8-K filed on May 28, 2010, and incorporated herein by reference. |
| (36) | Filed as Exhibit 10.2 to the Registrant’s Quarterly Report on Form 10-Q filed on November 5, 2010 and incorporated herein by reference. |
| (37) | Filed as Exhibit 10.3 to the Registrant’s Quarterly Report on Form 10-Q filed on November 5, 2010 and incorporated herein by reference. |
| (38) | Filed as Exhibit 10.4 to the Registrant’s Quarterly Report on Form 10-Q filed on November 5, 2010 and incorporated herein by reference. |
| (39) | Filed as Exhibit 10.5 to the Registrant’s Quarterly Report on Form 10-Q filed on November 10, 2008, and incorporated herein by reference. |
| (40) | Filed as Exhibit 10.11 to the Registrant’s Quarterly Report on Form 10-Q filed on August 13, 2010, and incorporated herein by reference. |
| (41) | Filed as Exhibit 10.6 to the Registrant’s Quarterly Report on Form 10-Q filed on November 5, 2010 and incorporated herein by reference. |
| (42) | Filed as Exhibit 10.7 to the Registrant’s Quarterly Report on Form 10-Q filed on November 5, 2010 and incorporated herein by reference. |
| (43) | Filed as Exhibit 10.1 to the Registrant’s Quarterly Report on Form 10-Q filed on November 9, 2007, and incorporated herein by reference. |
| (44) | Filed as Exhibit 10.1 to the Registrant’s Current Report on Form 8-K filed on February 12, 2008, and incorporated herein by reference. |
| (45) | Filed as Exhibit 10.26 to the Registrant’s Annual Report on Form 10-K filed on April 8, 2008, and incorporated herein by reference. |
| (46) | Filed as Exhibit 10.47 to the Registrant’s Annual Report on Form 10-K filed on March 26, 2010, and incorporated herein by reference. |
Table of Contents
| (47) | Filed as Exhibit 10.48 to the Registrant’s Annual Report on Form 10-K filed on March 26, 2010, and incorporated herein by reference. |
| (48) | Filed as Exhibit 10.49 to the Registrant’s Annual Report on Form 10-K filed on March 26, 2010, and incorporated herein by reference. |
| (49) | Filed as Exhibit 10.27 to the Registrant’s Annual Report on Form 10-K filed on April 8, 2008, and incorporated herein by reference. |
| (50) | Filed as Exhibit 10.5 to the Registrant’s Quarterly Report on Form 10-Q filed on November 5, 2010 and incorporated herein by reference. |
| (51) | Filed as Exhibit 10.36 to the Registrant’s Annual Report on Form 10-K filed on March 12, 2009, and incorporated herein by reference. |
| (52) | Filed as Exhibit 10.37 to the Registrant’s Annual Report on Form 10-K filed on March 12, 2009, and incorporated herein by reference. |
| (53) | Filed as Exhibit 10.3 to the Registrant’s Quarterly Report on Form 10-Q filed on August 6, 2009, and incorporated herein by reference. |
| (54) | Filed as Exhibit 10.1 to the Registrant’s Quarterly Report on Form 10-Q filed on November 6, 2009, and incorporated herein by reference. |
| (55) | Filed as Exhibit 10.46 to the Registrant’s Annual Report on Form 10-K filed on March 26, 2010, and incorporated herein by reference. |
| (56) | Filed as Exhibit 10.10 to the Registrant’s Quarterly Report on Form 10-Q filed on August 13, 2010, and incorporated herein by reference. |
| (57) | Filed as Exhibit 10.1 to the Registrant’s Current Report on Form 8-K filed on July 20, 2010 and incorporated herein by reference. |
| (58) | Filed herewith. |
| + | Management contract or compensatory arrangement or plan. |
| * | The following exhibits to the Joint Prepackaged Plan of Reorganization were filed with the bankruptcy court, which, as permitted by Item 601(b)(2) of Regulation S-K, have been omitted from this Annual Report on Form 10-K. We will furnish supplementally a copy of any exhibit to the Joint Prepackaged Plan of Reorganization to the Securities and Exchange Commission upon request. |
| Exhibit A | Amended and Restated Credit Facility | |
| Exhibit B | Commitment Letter | |
| Exhibit C | New Management Incentive Plan | |
| Exhibit D | New Warrants | |
| Exhibit E | Executory Contracts and Unexpired Leases to be Rejected | |
| Exhibit F | Amended and Restated Pledge and Security Agreement | |
| Exhibit G | Austria Contribution Agreement | |
| Exhibit H | Austria Note | |
| Exhibit I | Austria Purchase Agreement | |
| Exhibit J | Canada Direction Letter Agreement | |
| Exhibit K | Exit Facility Credit Agreement | |
| Exhibit L | Exit Facility Pledge and Security Agreement | |
| Exhibit M | Germany Assumption Agreement | |
| Exhibit N | Intercreditor Agreement | |
| Exhibit O | Nominating Agreement | |
| Exhibit P | Registration Rights Agreement | |
| Exhibit Q | Restated Bylaws of each Reorganized Debtor | |
| Exhibit R | Restated Charters of each Reorganized Debtor | |
| Exhibit S | Shareholder Rights Plan | |
| Exhibit T | U.S. Direction Letter Agreement | |
| Exhibit U | Initial Directors and Initial Officers of the Reorganized Debtors | |
| Exhibit V | Retained Actions | |
| Exhibit W | Additional Intercompany Transactions |