Attached files
| file | filename |
|---|---|
| 8-K - FORM 8-K - E TRADE FINANCIAL CORP | d309105d8k.htm |
 E*TRADE
Financial Corporation Raymond
James
33
Annual
Institutional
Investors
Conference
Matthew Audette
Chief Financial Officer
March 6, 2012
©
2012 E*TRADE Financial Corporation. All rights reserved.
This presentation contains confidential information and may not be disclosed
without E*TRADE Financial Corporation’s written permission.
Exhibit 99.1
rd |
 ©
2012 E*TRADE FINANCIAL Corp. All rights reserved.
This presentation contains confidential information and may not be disclosed
without E*TRADE FINANCIAL Corporation’s written permission.
2
Notice to investors
Safe Harbor Statement
This presentation contains certain projections or other forward-looking statements
regarding future events or the future performance of the Company. Various factors,
including risks and uncertainties referred to in the 10Ks, 10Qs and other reports
E*TRADE Financial Corporation periodically files with the SEC, could cause our actual
results to differ materially from those indicated by our projections or other
forward- looking statements. This presentation also contains disclosure of
non-GAAP financial measures. A reconciliation of these financial measures to the
most directly comparable GAAP financial measures can be found on the investor relations
site at https://investor.etrade.com. Forward-Looking
Statements The statements contained in this presentation that are forward looking are
based on current expectations that are subject to a number of uncertainties and risks,
and actual results may differ materially. Further information about these risks and
uncertainties can be found in the Company’s annual, quarterly and current reports
on Form 10-K, Form 10- Q and Form 8-K previously filed by E*TRADE Financial
Corporation with the SEC (including information under the caption “Risk
Factors”). Any forward-looking statement included in this release speaks only
as of the date of this communication; the Company disclaims any obligation to update
any information. |
 ©
2012 E*TRADE FINANCIAL Corp. All rights reserved.
This presentation contains confidential information and may not be disclosed
without E*TRADE FINANCIAL Corporation’s written permission.
3
•
Strategic partnerships
Strategic focus
Strengthen overall financial and franchise position
•
Strengthen balance sheet and income statement
•
Mitigate credit losses on legacy loan portfolio & enhance risk profile
•
Focus on increasing shareholder value through efficient distribution of capital
Improve market position in retail brokerage
•
Accelerate growth of our customer franchise
•
Continue to enhance the customer experience, improve satisfaction and retention
Enhance position in investing & retirement
•
Expand brand position for awareness and preference
•
Grow customer share of wallet
Continue to evolve bank franchise
•
Continue to maximize value of customer deposits
•
Develop strategy to more fully serve the financial needs of our 2.8M brokerage
customers Accelerate growth of complementary brokerage businesses
•
Corporate services group
•
Market making operations |
 ©
2012 E*TRADE FINANCIAL Corp. All rights reserved.
This presentation contains confidential information and may not be disclosed
without E*TRADE FINANCIAL Corporation’s written permission.
4
(1)
Strengthen overall financial position
Ongoing improvement in net income
$627
($1,442)
($809)
($525)
($28)
$157
($1,500)
($1,000)
($500)
$0
$500
$1,000
FY 2006
FY 2007
FY 2008
FY 2009
FY 2010
FY 2011 |
 ©
2012 E*TRADE FINANCIAL Corp. All rights reserved.
This presentation contains confidential information and may not be disclosed
without E*TRADE FINANCIAL Corporation’s written permission.
5
Strengthen overall financial position
Pre-tax income:
Defined path to improved earnings through current strategy
Long-term
impact to
current
strategy
(1)
Spread should improve to 300bps
with normalized rate environment
Should reduce to $0 as legacy portfolio runs off
Servicing costs should reduce to $0 as legacy portfolio runs off
FDIC should reduce by 50% as risk profile improves
Should reduce to $0 as capital is efficiently deployed
($ M)
2011
Net interest income
Commissions
Other
Net revenues
Provision
Expenses
Operating income
Interest & other
Pre-tax income
$1,220
$436
$380
$2,037
($441)
($1,235)
$361
($176)
$185
$1,309
Long-term impact
to current strategy
$436
$380
$2,126
$0
($1,110)
$1,016
$0
$1,016
$0.9B
$(2.2)B
$(1.3)B
$(0.9)B
$0.0B
$0.2B
$1.0B
$1.0
$0.8
$0.6
$1.0
$0.9
$0.8
$1.0
($3.5)
($2.5)
($1.5)
($0.5)
$0.5
$1.5
2006
2007
2008
2009
2010
2011
Earnings before interest, taxes and credit costs
Provision / credit costs
Interest & other expense |
 6
Earnings
Earnings
Provision
Provision
Loan portfolio
runoff
Loan portfolio
runoff
DTA
DTA
other
Margin
Margin
Uses
Sources
Uses
Sources
Strengthen overall financial position
Improve capital structure
as of 12/31/11
Bank
Parent
Well-
capitalized
threshold
Total capital to
risk-weighted
assets
(2)
17.3%
12.7%
10.0%
Tier 1 capital to
risk-weighted
assets
(2)
16.0%
11.4%
6.0%
Tier 1 leverage
(2)
7.8%
5.7%
5.0%
Tier 1 common
(3)
16.0%
9.4%
7.0%
Tier 1
Risk-based
$0.41B generated
$0.23B
generated
$-
$0.5
$1.0
$1.5
$2.0
$2.5
$3.0
$3.5
2008
2009
2010
2011
($B)
Tier 1 capital
Risk-based capital
Parent debt
Bank excess capital / Parent debt
Bank capital generation in 2011
On average, each $1B of loan portfolio run-off generates:
$100M of risk-based capital
$60M of Tier 1 capital
Capital ratios at the Bank have improved significantly:
Tier 1 capital ratio: 7.8% vs 6.3% in 4Q08
Risk-based ratio: 17.3% vs 13.0% in 4Q08
Company is focused on increasing franchise value and risk
profile through efficient distribution of capital as soon as
feasible
©
2012 E*TRADE FINANCIAL Corp. All rights reserved.
This presentation contains confidential information and may not be disclosed
without E*TRADE FINANCIAL Corporation’s written permission.
|
 ©
2012 E*TRADE FINANCIAL Corp. All rights reserved.
This presentation contains confidential information and may not be disclosed
without E*TRADE FINANCIAL Corporation’s written permission.
7
0.0
1.0
2.0
3.0
4.0
DTA
Pre-tax income shielded
Parent company
Bank
$1.6B
$4.2B
Strengthen overall financial position
Deferred tax asset
Consolidated DTA of $1.6B
($0.5B at parent; $1.1B at Bank)
Potential source of corporate cash in future periods as
subsidiaries reimburse the parent for use of its DTA
Ability to include more in regulatory capital with ongoing
profitability
Approximately 16 years to use; expect to utilize the full
amount
Consolidated DTA = $1.6B; only 16%
is
included in our regulatory capital
excluded from
regulatory
capital
included in
regulatory
capital
excluded from
regulatory
capital
included in
regulatory
capital
$0.25
$1.3
$0.3
$0.8
$ B
$ B
Bank DTA = $1.1B; 24% is included in our
regulatory capital |
 ©
2012 E*TRADE FINANCIAL Corp. All rights reserved.
This presentation contains confidential information and may not be disclosed
without E*TRADE FINANCIAL Corporation’s written permission.
8
Strengthen overall financial position
Mitigate credit losses on legacy loan portfolio
($ B)
Loan balance
12/31/07
(4)
Paydowns
(5)
Charge-offs
Loan balance
12/31/11
(4)
(4)
Average age
1-4 Family loans
$16
($8)
($1)
$7
5.2 yrs
Home equity
$12
($4)
($3)
$5
5.5 yrs
Consumer
$3
($2)
($0)
$1
7.6 yrs
TOTAL
$31
($14)
($4)
$13
Delinquencies
30-89 days delinquent
Provision for loan losses
Down over
50% from
peak in
Q4 08
Down over
75% from
peak in
3Q 08
$0
$200
$400
$600
$800
$1,000
$1,200
$0
$100
$200
$300
$400
$500
$600
Provision
Qualitative reserve
58%
decline |
 Strengthen overall
financial position Mitigate credit losses on legacy loan portfolio
1-4 Family TDR portfolio
Home equity TDR portfolio
Loan modifications (TDRs)
Other loss mitigation
Leveraging
servicers that specialize in troubled
assets:
$3B, or ~23% of portfolio with higher quality servicers,
completing the majority of planned transfers
Accelerating the liquidation of properties in
foreclosure through short sales
$335M of recoveries from originators to date
targeting 50% reduction in
borrower payments
Allowance increases to life of
loan from 12 mo loss assumption for loans that are
modified
Improvement to performance as program evolved:
avg re-delinquency at 12mo:
Payment reduction:
Incremental reserving:
0%
20%
40%
60%
80%
0.0
0.2
0.4
0.6
0.8
1.0
1.2
Q1 10
Q2 10
Q3 10
Q4 10
Q1 11
Q2 11
Q3 11
Q4 11
TDRs outstanding
Total expected losses
0%
20%
40%
60%
80%
0.0
0.2
0.4
0.6
0.8
Q1 10
Q2 10
Q3 10
Q4 10
Q1 11
Q2 11
Q3 11
Q4 11
TDRs outstanding
Total expected losses
©
2012 E*TRADE FINANCIAL Corp. All rights reserved.
This presentation contains confidential information and may not be disclosed
without E*TRADE FINANCIAL Corporation’s written permission.
9
•
1-4 Family: 29%
•
Home equity: 42% |
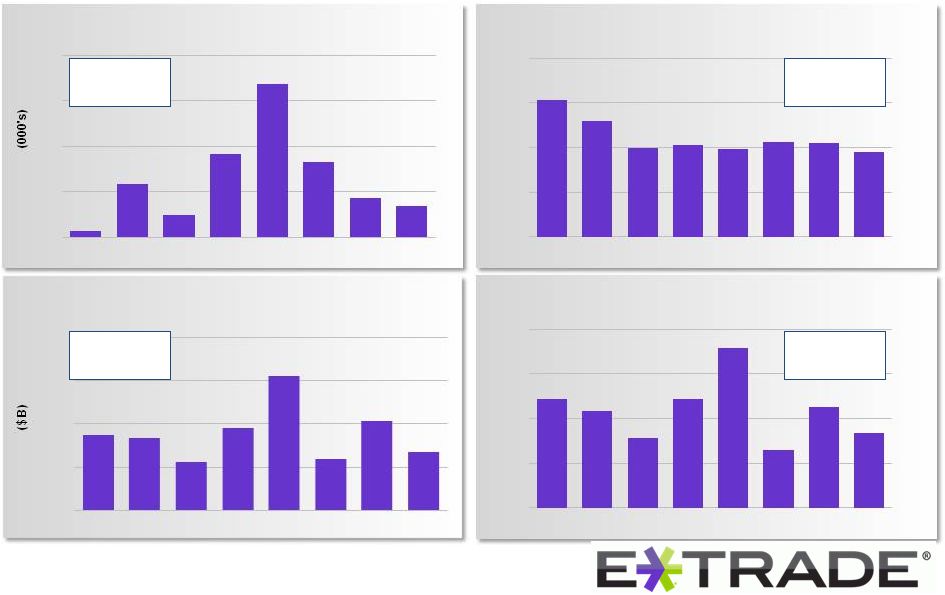 Improve market
position in retail brokerage Net new brokerage accounts
Net new brokerage assets
(7)
27%
Accelerate growth of our customer base
Annualized brokerage
account attrition
(6)
2010: 54k
2011: 99k
2010: $8.1B
2011: $9.7B
2010: 6.8%
2011: 6.7 %
2
18
7
28
51
25
13
10
0
15
30
45
60
Q1 10
Q2 10
Q3 10
Q4 10
Q1 11
Q2 11
Q3 11
Q4 11
15.3%
13.0%
10.0%
10.3%
9.9%
10.7%
10.5%
9.5%
0%
5%
10%
15%
20%
Q1 10
Q2 10
Q3 10
Q4 10
Q1 11
Q2 11
Q3 11
Q4 11
$2.2
$2.1
$1.4
$2.4
$3.9
$1.5
$2.6
$1.7
$0.0
$1.3
$2.5
$3.8
$5.0
Q1 10
Q2 10
Q3 10
Q4 10
Q1 11
Q2 11
Q3 11
Q4 11
7.3%
6.5%
4.7%
7.3%
10.7%
3.8%
6.8%
5.0%
0%
3%
6%
9%
12%
Q1 10
Q2 10
Q3 10
Q4 10
Q1 11
Q2 11
Q3 11
Q4 11
Annualized net new
brokerage asset growth
(8)
©
2012 E*TRADE FINANCIAL Corp. All rights reserved.
This presentation contains confidential information and may not be disclosed
without E*TRADE FINANCIAL Corporation’s written permission.
10
2010: 12.2%
2011: 10.3% |
 ©
2012 E*TRADE FINANCIAL Corp. All rights reserved.
This presentation contains confidential information and may not be disclosed
without E*TRADE FINANCIAL Corporation’s written permission.
11
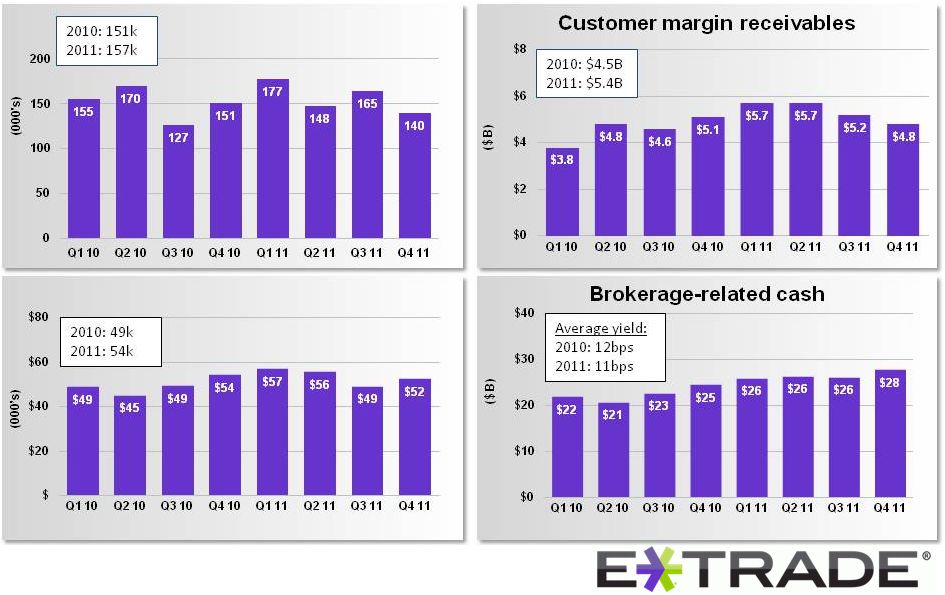
DARTs
Improve market position in retail brokerage
Accelerate growth of our customer base
Avg brokerage assets per account
(9) |
 ©
2012 E*TRADE FINANCIAL Corp. All rights reserved.
This presentation contains confidential information and may not be disclosed
without E*TRADE FINANCIAL Corporation’s written permission.
12
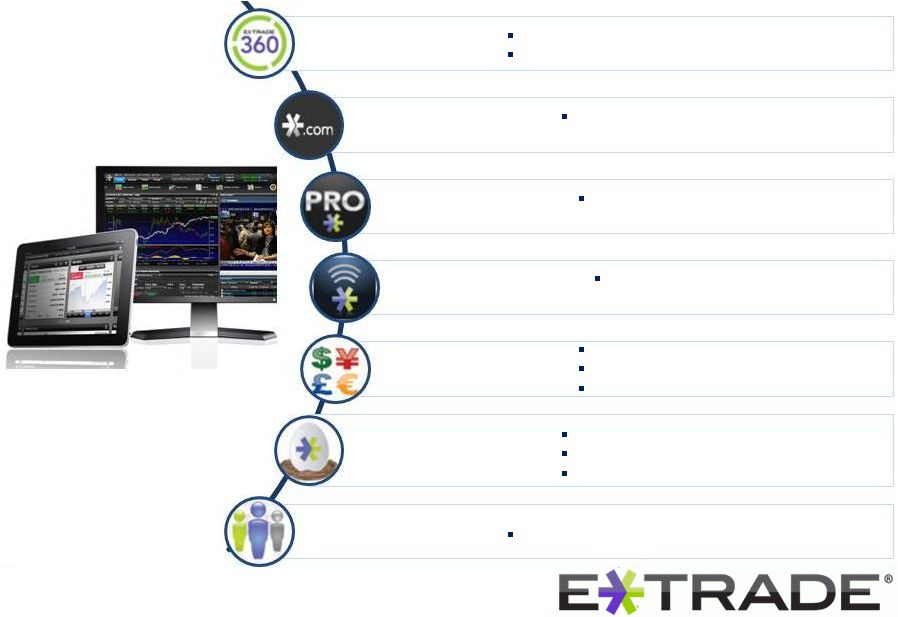
Unique, customizable website experience
One-page investing dashboard
Dynamic content, streamlined experience,
better segmentation
Premiere, fully customizable active trader
platform
Powerful platform for account and market
access anytime, anywhere
Sophisticated options tools and analytics
E*TRADE FX forex platform
Integrated futures (Q2 12)
Upgraded Bond Resource Center
New educational resources –
video, live, web
Expanded Retirement Planning Center
Evolving products & platform
Connecting customers for education, investing ideas
Improve market position in retail brokerage
New Customer Site
New Public Site
E*TRADE Pro
E*TRADE Mobile
Options,
Futures & FX
Investing & planning
resources
E*TRADE
Community |
 ©
2012 E*TRADE FINANCIAL Corp. All rights reserved.
This presentation contains confidential information and may not be disclosed
without E*TRADE FINANCIAL Corporation’s written permission.
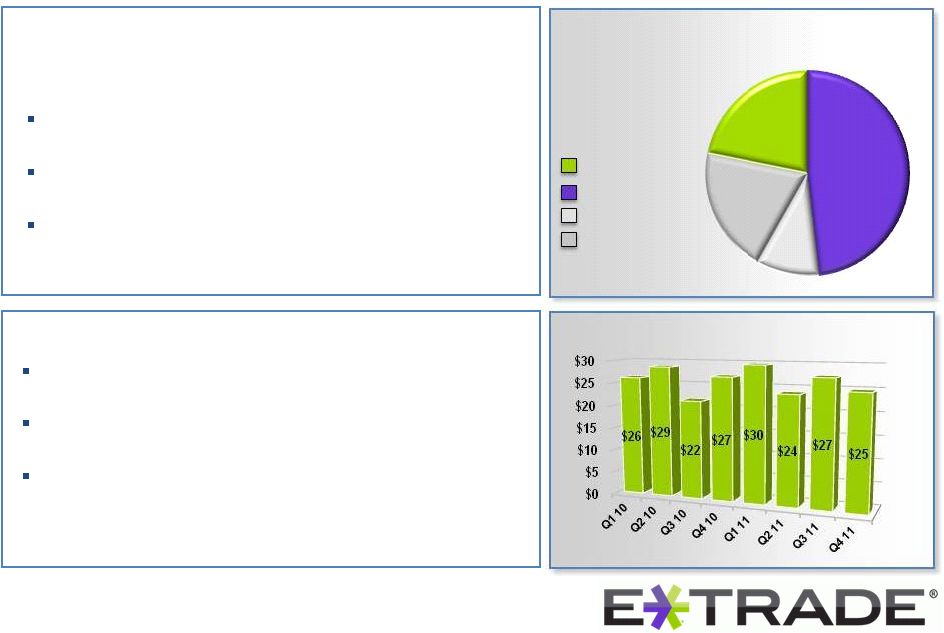
13
Market making business
Leveraging world class technologies and superior execution
capabilities
Leading market share in ADRs; growing market share in
National Market Securities
Growing base of external customers, comprising 37+ external
clients
(30%+ y/y growth), and accounting for ~ 50% of market
making revenue
Corporate services group
Build on market leadership with 1,400+ corporate clients,
representing +20% of S&P 500
Foster strategically important channel for new brokerage
accounts, accounting for 25-30% of gross new accounts
1.1 million accounts; $19B in vested and $38B in unvested
options
proceeds retention of 35%+ 3 months post exercise, and 15%+
12 months post exercise
Accelerate growth of complementary brokerage businesses
E*TRADE
#2 Player
#3 Player
6+ other providers
Stock plan administration for public
companies
10%
48%
20%
22%
Principal transactions revenue ($MM) |
 ©
2012 E*TRADE FINANCIAL Corp. All rights reserved.
This presentation contains confidential information and may not be disclosed
without E*TRADE FINANCIAL Corporation’s written permission.
14
Enhance position in investing & retirement
NEW
Public Site
NEW
TV Commercials
NEW
Print & Online
Retooled
marketing
focused
on
investing
&
retirement
to
evolve
the
brand
Financial consultant network
highlights
Grew Financial Consultant headcount by 42% during 2011 and remain committed to this
effort We
estimate
we
have
a
12%
share
of
our
customers’
wallet
(36%
for
active
traders;
10%
for
investors)
(10)
Have identified segments best served by proactive engagement with FCs
—
One year post assignment seeing significant improvement in engagement and retention
|
 ©
2012 E*TRADE FINANCIAL Corp. All rights reserved.
This presentation contains confidential information and may not be disclosed
without E*TRADE FINANCIAL Corporation’s written permission.
15
Chartered Retirement Planning
Counselors
Kiplinger’s 2011 “Best Of”
Retirement Calculator
Retirement education
8,100+ mutual funds
4,600 no-load/6,900 no
transaction fee
80+ commission -free
70,000+ bonds
Unified Managed Accounts
Managed Investment
Portfolios
Integrated into advertising
Grew headcount by 42%
Increased asset penetration
1year post assignment
Enhance position in investing & retirement
Integrated investing & retirement offering to drive accounts & assets
Services
Products
Financial Consultants
Accounts
& assets
assets
773k retirement account
investment accounts
17% of $172 billion of customer assets
28% of brokerage accounts
(2 years post inception)
SM
$29.5 billion in retirement
$0.7 billion in managed
Every ETF
sold
|
 16
©
2012 E*TRADE FINANCIAL Corp. All rights reserved.
This presentation contains confidential information and may not be disclosed
without E*TRADE FINANCIAL Corporation’s written permission.
Favorable mix shift in assets from legacy loans into high quality margin loans and securities
(i.e., government-backed agencies)
Continue to evolve bank franchise
$18B
$24B
$40B
$19B
Average loans and
margin receivables
Average agency securities
and cash & other
$31.9
$13.6
$7.7
$4.9
$15.5
$20.5
$2.2
$3.6
$0
$5
$10
$15
$20
$25
$30
$35
$40
$45
Q4 07
Q4 11
Q4 07
Q4 11
Loans, net
Margin
receivables
Securities
Cash and other |
 ©
2012 E*TRADE FINANCIAL Corp. All rights reserved.
This presentation contains confidential information and may not be disclosed
without E*TRADE FINANCIAL Corporation’s written permission.
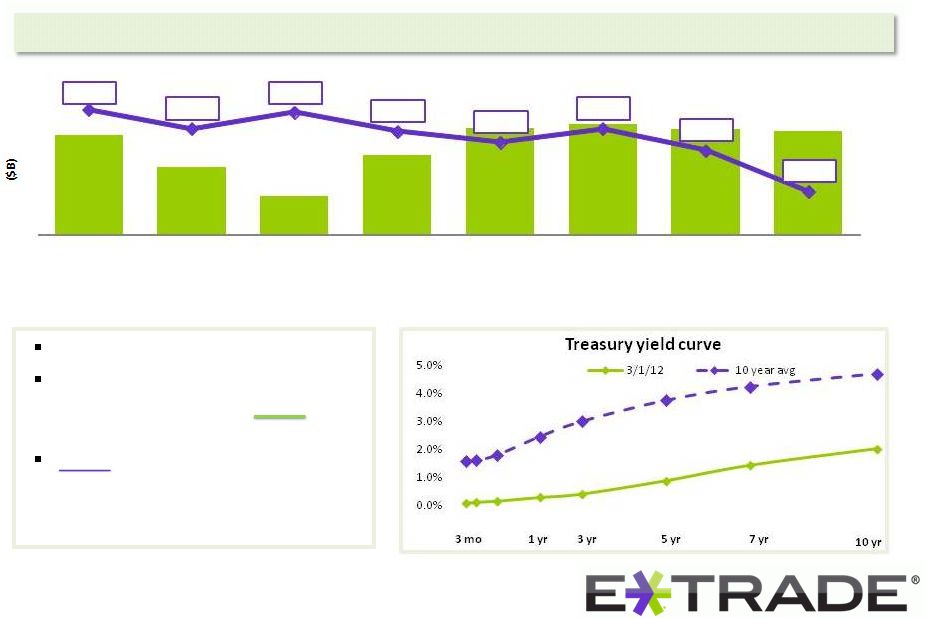
17
Interest rates are at historic lows
In current rate environment: spread
could average less than 2.50% in
2012
3.00% continues to be more
indicative of long-term spread
Challenging rate environment & impact on spread
Continue to evolve bank franchise
Maximize value of customer deposits
$42.4
$41.0
$39.7
$41.5
$42.7
$42.9
$42.7
$42.6
2.96%
2.89%
2.95%
2.88%
2.84%
2.89%
2.81%
2.66%
1Q 10
2Q 10
3Q 10
4Q 10
1Q 11
2Q 11
3Q 11
4Q 11
Average interest earning assets & net interest spread |
 ©
2012 E*TRADE FINANCIAL Corp. All rights reserved.
This presentation contains confidential information and may not be disclosed without
E*TRADE FINANCIAL Corporation’s written permission.
18
Continue to evolve bank franchise
Visibility into future drivers of net interest spread
and prior
Home equity lines of credit
1-4 family mortgages
•Avg loan size: $66K
•Avg estimated increase at
conversion: $150 -$200
/mo. payment
Average
cost
3-4%
Wholesale
funding obligations will expire
over the next ten years
payment resets by year
I/O to amortizing conversions
0.0
1.0
2.0
3.0
4.0
5.0
6.0
7.0
8.0
•83%
of
non-TDR portfolio
is
adjustable for
rate
or
amortization
•$2.2B
has
previously
reset
Loan portfolio continues to run off at
approximately 20% per year
Nearly 70% of 1-4 family loans resetting in 2012
are expected to reset to a lower payment
Hedges on wholesale funding channels require us
to continue issuing short-term debt for next
several years |
 ©
2012 E*TRADE FINANCIAL Corp. All rights reserved.
This presentation contains confidential information and may not be disclosed
without E*TRADE FINANCIAL Corporation’s written permission.
19
Challenges
Environment
Business model
Prolonged low interest rate
environment
Further deterioration in home prices
Consumer confidence
Regulatory transition
Sustain accelerated growth in
brokerage
Success in investing & retirement
Reposition and capitalize on our
bank franchise
Efficient use of capital |
 20
|
 ©
2012 E*TRADE FINANCIAL Corp. All rights reserved.
This presentation contains confidential information and may not be disclosed
without E*TRADE FINANCIAL Corporation’s written permission.
21
Appendix |