Attached files
| file | filename |
|---|---|
| 8-K - FORM 8-K - LegacyTexas Financial Group, Inc. | c23782e8vk.htm |
| EX-99.1 - EXHIBIT 99.1 - LegacyTexas Financial Group, Inc. | c23782exv99w1.htm |
Exhibit 99.2

| 1 NASDAQ: VPFG Third Quarter 2011 Results Gary Base - President and Chief Executive Officer Patti McKee - Executive Vice President and Chief Financial Officer Mark Hord - Executive Vice President and General Counsel |

| 2 Safe Harbor Statement When used in filings by the Company with the Securities and Exchange Commission (the "SEC") in the Company's press releases or other public or shareholder communications, and in oral statements made with the approval of an authorized executive officer, the words or phrases "will likely result," "are expected to," "will continue," "is anticipated," "estimate," "project," "intends" or similar expressions are intended to identify "forward-looking statements" within the meaning of the Private Securities Litigation Reform Act of 1995. Such statements are subject to certain risks and uncertainties, including, among other things, changes in economic conditions, legislative changes, changes in policies by regulatory agencies, fluctuations in interest rates, the risks of lending and investing activities, including changes in the level and direction of loan delinquencies and write-offs and changes in estimates of the adequacy of the allowance for loan losses, the Company's ability to access cost-effective funding, fluctuations in real estate values and both residential and commercial real estate market conditions, demand for loans and deposits in the Company's market area, the industry-wide decline in mortgage production, competition, changes in management's business strategies and other factors set forth under Risk Factors in the Company's Form 10-K, that could cause actual results to differ materially from historical earnings and those presently anticipated or projected. The Company wishes to advise readers that the factors listed above could materially affect the Company's financial performance and could cause the Company's actual results for future periods to differ materially from any opinions or statements expressed with respect to future periods in any current statements. The Company does not undertake - and specifically declines any obligation - to publicly release the result of any revisions which may be made to any forward-looking statements to reflect events or circumstances after the date of such statements or to reflect the occurrence of anticipated or unanticipated events. |

| 3 Opening Remarks Loan balances increased $290.0 million during the quarter, or 18.5%, with growth primarily in Warehouse Purchase Program and Commercial Real Estate Net interest margin up 6 basis points YOY, up 4 basis points linked quarter Q3 net income of $5.1 million, or $0.16 per share, up 5.9% linked quarter Q3 results driven by higher net interest income and lower provision expense |

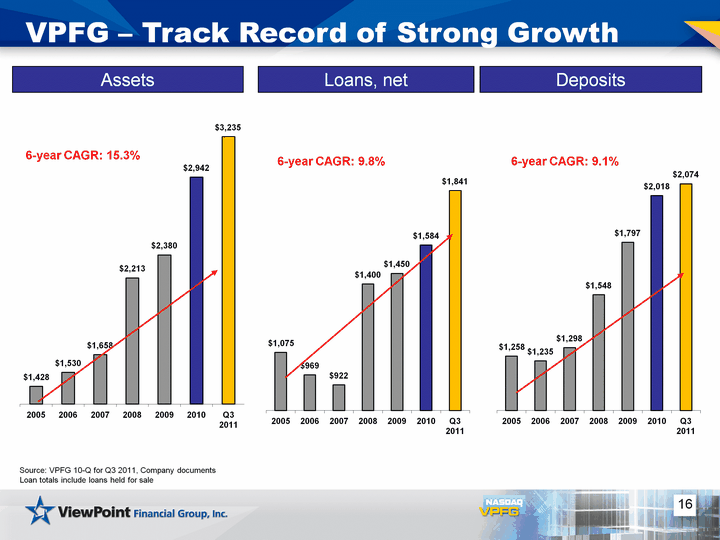
| 4 Corporate & Geographic Overview Total Assets: $3.24 billion Total Net Loans: $1.84 billion Total Deposits: $2.07 billion Number of Locations: 25 Community Bank Branches 10 Loan Production Offices1 59 years in Texas market #1 in deposit market share of those banks based in Collin County, one of the most demographically attractive counties in Texas2 Ranked #5 in deposit market share among Texas-based community banks in DFW Metroplex2 81% of our commercial real estate loans are in 4 of the top 5 best cities for jobs in the U.S.3 Texas listed as Site Selection Magazine's top state for new and expanded corporate facilities in 2010. 4 Source: VPFG 10-Q for Q3 2011, Company documents 1 Excludes Warehouse Purchase Program office in Littleton, CO 2 FDIC market share data as of June 2011 3 Forbes.com: "The Best Cities for Jobs" (May 11, 2011) 4 The Dallas Morning News: Trade Magazine Rankings 2010 (March 2, 2011) |

| 5 New Locations Two new bank branches opened in Q3 2011 in Flower Mound and in Carrollton Relocation of grocery store banking center to full-service community bank branch in the Lake Highlands neighborhood in Dallas planned for Q4 2011 1,482 existing VPFG households with deposits of $20.8 million at 9/30 2010 Estimated Average Household Income: $69,683 Source: Nielsen Claritas, Company Documents, household information based on 5 mile radius |

| 6 Capitalize on a position of balance sheet strength Continue to grow organically in our economically stable and growing Texas market Remain focused on our community banking approach and enhance the profitability of existing relationships Continue to develop existing lines of business, diversify the loan portfolio and develop Commercial and Industrial lending Evaluate other opportunities to deploy capital: New locations Potential acquisitions Dividends Business Strategy |

| 7 ViewPoint's Loan Portfolio Strategy Commercial Real Estate Warehouse Purchase Program Residential Mortgage Commercial and Industrial September 30, 2011 Loan Composition Source: VPFG 10-Q for Q3 2011 Includes loans held for sale (CHART) In order to improve our profitability, while maintaining a strong capital position and asset quality, we will continue to focus on our four primary engines: |

| 8 Commercial RE Portfolio Source: VPFG 10-Q for Q3 2011 Company Documents YTD production of $179.0 million at Q3 2011 compared to $54.0 million for same period in 2010 (CHART) Commercial RE Production ($ in thousands) (CHART) Commercial RE Portfolio Maturity Schedule ($ in thousands) |

| 9 Commercial RE Portfolio Source: VPFG 10-Q for Q3 2011, Company Documents *Other states include Arizona, Georgia, Kansas, Missouri, Nevada, New Mexico, Oregon and Washington (CHART) (CHART) |

| 10 Comm. RE: Diverse & Well-Underwritten Total Commercial RE - $546.9M Total LTV - 59% Source: Company Documents As of September 30, 2011 (CHART) |

| 11 Warehouse Purchase Program Outstanding balance increased $258.8 million from Q2 2011 to $663.8 million at Q3 2011, average balance increased $113.4 million for the same time period Increase due to rate environment and refinance activity Portfolio experiences seasonal fluctuations Gross Average Yield - 4.36% for Q3 2011 vs. 4.61% for Q2 2011 Source: Company Documents at September 30, 2011 |

| (CHART) 12 Warehouse Purchase Program Source: Company Documents at September 30, 2011 Nationwide portfolio production covering 46 states 31 clients as of September 30, 2011 99% conforming and government loans Approved maximum borrowing amounts ranging from $10.0 million to $38.5 million High quality underwriting standards Minimum tangible net worth Personal guarantees of repurchase obligations Historical profitability |

| 13 Residential Mortgage Source: VPFG 10-Q for Q3 2011; Company Documents Focused on conforming residential mortgage loans originated through our wholly owned subsidiary, ViewPoint Mortgage ("VPM") (CHART) (CHART) |

| 14 Residential Mortgage: Total Production VPM originated $95.2 million during Q3 2011, down 30% YOY Gain on sale of 2.7% for Q3 2011 (CHART) Total Mortgage Loans Originated (Dollars in Millions) Source: VPFG 10-Q for Q3 2011 |

| 15 Financial Summary - 3rd Quarter 2011 Loan Production: Gross loans grew $290.0 million, or 18.5%, from Q2 2011 Fueled by $258.8 million increase in Warehouse Purchase Program and $19.1 million increase in Commercial RE Net Interest Margin: NIM increased 6 bps YOY, from 2.81% for Q3 2010 to 2.87% for Q3 2011, due to lower deposit and borrowing rates NIM increased 4 bps compared to Q2 2011 due to increased WPP volume and lower deposit costs Earnings: Quarterly net income increased by $286,000, or 5.9%, from Q2 2011; EPS up $0.01 to $0.16 Driven by higher net interest income and lower provision for loan losses Stable Credit Trends: Net charge-offs declined by $275,000 for Q3 2011 compared to Q3 2010 NPL/ Loan Ratio is 1.50%, outperforming Texas peers Source: VPFG 10-Q for Q3 2011, Company Documents |

| 16 (CHART) (CHART) (CHART) VPFG - Track Record of Strong Growth Assets Loans, net Deposits 6-year CAGR: 9.8% 6-year CAGR: 9.1% 6-year CAGR: 15.3% Source: VPFG 10-Q for Q3 2011, Company documents Loan totals include loans held for sale |

| 17 Improving Net Interest Margin Net interest margin increased 4 basis points from Q2 2011 Higher WPP volume Lower deposit costs Net interest margin increased 6 basis points from Q3 2010 Lower deposit costs FHLB restructure in Nov. 2010 (CHART) Source: VPFG 10-Q for Q3 2011; Company Documents |

| 18 Earnings Per Share Growth YTD EPS up $0.13 YOY Higher net interest income Lower provision for loan losses YTD 2011 income includes $2.2 million net of tax gain on sale of AFS securities *Excludes non-cash after-tax impairment charge of $9.1 million related to collateralized debt obligations. **Excludes non-cash after-tax impairment charge of $8.1 million related to collateralized debt obligations. Source: VPFG 10-Q for Q3 2011; Company Documents Share and per share information for periods prior to July 6, 2010, have been revised to reflect the 1.4:1 conversion ratio on publicly traded shares (CHART) |

| 19 Financial Comparisons for Quarter-End 2011 Q3 2011 Q2 Equity to Total Assets 12.57% 13.73% Deposit Growth* 0.13% 1.86% Loan Growth(1)* 18.51% 10.30% Asset Growth* 9.16% 6.00% Net Interest Margin 2.87% 2.83% EPS $0.16 $0.15 Return on Assets 0.69% 0.69% Return on Equity 5.02% 4.69% Efficiency Ratio (2) 68.22% 67.97% Operating Exp / Avg Assets 2.49% 2.59% Source: VPFG Q3 2011 10-Q, Q3 2011 Earnings Release * Growth rates calculated based on ending balances linked quarter Including loans held for sale Calculated by dividing total noninterest expense by net interest income plus noninterest income, excluding gain (loss) on sale of foreclosed assets, impairment of goodwill, gains from securities transactions and other nonrecurring items |

| 20 Credit Quality Trends (CHART) (CHART) (CHART) NPAs / Assets NPLs / Loans 1 Texas Peers include: EBTX, FFIN, MCBI, NODB, OABC, PRSP, SBSI, TCBI (peer data as of June 30, 2011) 2 Nationwide Peers include public U.S. depositories with assets between $2B and $5B (peer data as of June 30, 2011) Source: Q3 Earnings Release 2011, SNL Financial Reserves / Gross Loans |

| 21 Net Charge-Off Trends 2011 Charge-Offs at 9/30/11 by Loan Type (as % of Total Charge Offs) (as % of Total Charge Offs) (as % of Total Charge Offs) Net Charge-Offs / Avg. Loans 2011 YTD Charge-Offs: $1,414,000 1 Texas Peers include: EBTX, FFIN, MCBI, NODB, OABC, PRSP, SBSI, TCBI (peer data as of June 30, 2011) 2 Nationwide Peers include public U.S. depositories with assets between $2B and $5B (peer data as of June 30, 2011) Source: Company Documents at September 30, 2011, SNL Financial (CHART) |

| (CHART) 22 Deposit Composition Source: VPFG 10-Q for Q3 2011 (CHART) Continued improvement in deposit cost Non-interest bearing deposits increased from $195 million to $208 million linked quarter |

| 23 Low Risk Investment Portfolio Mix Source: VPFG 10-Q for Q3 2011; Company Documents Investment Strategy: Liquidity Average cash flow from investments of $22.0 million per month 55% of portfolio is AFS 52% fixed, 36% variable, 12% Ascending Rate Asset Liability Tool Duration of 1.23 |

| 24 Schedule of Borrowings (CHART) $676,242 @ WAR 1.32% 61% of borrowings mature in less than 1 year Borrowed $372.0 million in short-term advances at WAR of 0.09% to match WPP growth Source: VPFG 10-Q for Q3 2011; Company documents 0.11% |

| 25 Capital Management Plan Source: Company Documents as of September 30, 2011 (CHART) Share Repurchase Repurchased 577,000 shares in Sept. 2011 at average price of $11.70 Dividends Paid out 29% of earnings to shareholders to date in 2011 Organic Growth & Market Expansion FHLB Matching (Arbitrage) Remain Well-Capitalized |

| 26 Strong Stock Performance Source: SNL Financial as of 10/19/2011 |

| 27 Closing Remarks One of the largest independent community banking franchises in Texas Economically and demographically one of the strongest market areas in the country Improving profitability due to transition to full service community bank More diversified revenue stream from full complement of commercial and retail products Strong credit metrics reflecting disciplined underwriting standards Well-capitalized and able to deploy capital Price to TBV of 98.4% at September 30, compared to 135.1% for Texas peers based on most recent data available* TCE per share of $11.83 at September 30 Positive asset quality comparisons to Texas peers *Source: SNL Financial as of 10/27/2011 |

| 28 Questions? |

| 29 Appendix The subsequent tables present non-GAAP reconciliations of the following calculations: TCE (Tangible Common Equity) to TCA (Tangible Common Assets) ratio TCE per share Price to TBV Non-GAAP net income and earnings per share |

| 30 Appendix TCE to TA, TCE per Share and Price to TBV at September 30, 2011 (Dollar amounts in thousands) Total GAAP equity $406,686 Less: goodwill (818) Less: mortgage servicing rights (466) Total tangible equity $405,402 Total GAAP assets $3,235,278 Less: goodwill (818) Less: mortgage servicing rights (466) Total tangible assets $3,233,994 GAAP Equity to Total Assets 12.57% TCE to TA 12.54% Shares outstanding at September 30, 2011 34,262,491 TCE per Share $11.83 Average VPFG stock price for September 2011 $11.64 Price to TBV 98.38% |

| 31 Appendix Reconciliation of Non-GAAP to GAAP Net Income and EPS (Dollar amounts in thousands except per share data) 09-2011 YTD 09-2010 YTD 2009 2008 2007 GAAP net income (loss) $16,554 $11,309 $2,670 $(3,315) $5,067 Impairment of collateralized debt obligations (all credit), net of tax - - 8,082 9,114 - Non-GAAP net income $16,554 $11,309 $10,752 $5,799 $5,067 Non-GAAP basic and diluted earnings per share $0.51 $0.38 $0.39 $0.21 $0.18 |
