Attached files
| file | filename |
|---|---|
| 8-K - FORM 8-K - BROADRIDGE FINANCIAL SOLUTIONS, INC. | d8k.htm |
| EX-99.1 - PRESS RELEASE DATED AUGUST 11, 2011 - BROADRIDGE FINANCIAL SOLUTIONS, INC. | dex991.htm |
 ©
2011 Broadridge Financial Solutions, Inc.
Broadridge and the Broadridge logo are registered trademarks of Broadridge
Financial Solutions, Inc. August 11, 2011
Earnings Webcast & Conference Call
Fourth Quarter and Fiscal Year 2011
Broadridge Financial Solutions, Inc.
Exhibit 99.2 |
 1
Forward-Looking Statements and Non-GAAP Measures
This
presentation
and
other
written
or
oral
statements
made
from
time
to
time
by
representatives
of
Broadridge
may
contain
“forward-looking
statements”
within
the
meaning
of
the
Private
Securities
Litigation
Reform
Act
of
1995. Statements that are not historical in nature, and which may be
identified by the use of words like “expects,”
“assumes,”
“projects,”
“anticipates,”
“estimates,”
“we believe,”
“could be”
and other words of similar meaning, are
forward-looking
statements.
In
particular,
information
appearing
in
the
“Fiscal
Year
2012
Financial
Guidance”
section and statements about our fiscal years 2012 and 2013 performance are
forward-looking statements. These statements are based on
management’s expectations and assumptions and are subject to risks and uncertainties
that may cause actual results to differ materially from those expressed.
These risks and uncertainties include those
risk
factors
discussed
in
Part
I,
“Item
1A.
Risk
Factors”
of
our
Annual
Report
on
Form
10-K
for
the
fiscal
year
ended June
30, 2011 (the “2011 Annual Report”), as they may be updated in any
future reports filed with the Securities and Exchange Commission. All
forward-looking statements speak only as of the date of this
presentation and are expressly qualified in their entirety by reference to the
factors discussed in the 2011 Annual Report.
These
risks
include:
the
success
of
Broadridge
in
retaining
and
selling
additional
services
to
its
existing
clients
and
in
obtaining
new
clients;
Broadridge’s reliance on a relatively small number of clients, the continued
financial
health
of
those
clients,
and
the
continued
use
by
such
clients
of
Broadridge’s
services
with
favorable
pricing
terms;
changes
in
laws
and
regulations
affecting
the
investor
communication
services
provided
by
Broadridge; declines in participation and activity in the securities markets;
overall market and economic conditions and
their
impact
on
the
securities
markets;
any
material
breach
of
Broadridge
security
affecting
its
clients’
customer
information;
the
failure
of Broadridge’s outsourced data center services provider to provide the
anticipated levels of service; any significant slowdown or failure of
Broadridge’s systems or error in the performance of Broadridge’s
services;
Broadridge’s
failure
to
keep
pace
with
changes
in
technology
and
demands
of
its
clients;
Broadridge’s
ability to
attract
and
retain key personnel; the impact of new acquisitions and divestitures; and
competitive conditions.
Broadridge
disclaims any obligation to update or revise forward-looking statements that
may be made to reflect events or circumstances that arise after the date
made or to reflect the occurrence of unanticipated events, other than as
required by law. This presentation may include certain Non-GAAP
(generally accepted accounting principles) financial measures in
describing
Broadridge’s
performance.
Management
believes
that
such
Non-GAAP
measures,
when
presented
in
conjunction with comparable GAAP measures provide investors a more complete
understanding of Broadridge’s underlying operational results.
These Non-GAAP measures are indicators that management uses to provide
additional meaningful comparisons between current results and prior reported
results, and as a basis for planning and forecasting for future periods.
These measures should be considered in addition to and not a substitute for the
measures of financial performance prepared in accordance with GAAP. The
reconciliations of such measures to the comparable GAAP figures are included
in this presentation. |
 2
Today’s Agenda
Opening Remarks and Key Topics
Rich Daly, CEO
Fourth Quarter and Fiscal Year 2011
Dan Sheldon, CFO
Results and Fiscal Year 2012 Guidance
Summary
Rich Daly, CEO
Q&A
Rich Daly, CEO
Dan Sheldon, CFO
Rick Rodick, VP Investor Relations
Closing Remarks
Rich Daly, CEO |
 3
Opening Remarks
Key Topics:
Financial Highlights
Fiscal Year 2012 Guidance
Closed Sales Performance
Acquisition Update |
 4
Fiscal Year 2011 Financial Highlights
Financial performance for the quarter in line with expectations
Revenues for the year declined 2%
However
recurring
revenues
were
up
12%
($143M)
Full year Non-GAAP $1.37 and GAAP $1.34 diluted earnings per
share from continuing operations
Down
from
prior
year
primarily
due
to
the
decline
in
event-driven
revenues
from
last
year’s
unprecedented
high
levels
to
historical
low
levels
in
fiscal
year
2011
Repurchased 8.7M shares under its stock repurchase plans
during the fiscal year
Approximately
7.6M
shares
remain
available
under
the
Company’s
current
stock
repurchase
plan |
 5
Fiscal Year 2012 Guidance
Fiscal year 2012 guidance
Revenue growth 8-10%
Non-GAAP fully diluted earnings per share from continuing
operations of $1.50-1.60, excluding IBM migration costs,
representing 9-17% growth
Free cash flow of $225M (mid-point of range), excluding IBM
migration costs
Increasing dividend by 7% to $0.64/share annualized
•
Increased the dividend amount 7% in FY11
•
Doubled the dividend amount in FY10
•
Increased the dividend amount 17% in FY09 |
 6
Closed Sales Performance
Total closed sales for the year were $134M
Recurring revenue closed sales were $113M for the year
SPS full year closed sales of $50M were up 25% as
compared with the prior year primarily due to >$5M deals
ICS full year recurring revenue closed sales of $63M were
down ~$15M or 19%; however, last year’s results included
Morgan Stanley Smith Barney (MSSB) contract at ~$40M
While recurring revenue closed sales results are down from the
prior year, we are confident about our sales opportunities
especially in deals >$5M in both segments
Fiscal year 2012 recurring revenue closed sales guidance of
$110 -
$150M |
 7
Acquisition Update
During
the
last
three
years
we
have
made
five
$15M+
acquisitions
in
which we spent approximately $370M
Three of the acquisitions occurred this year at a cost of approximately
$295M
The acquisitions contributed approximately $109M to revenue, $17M to
EBITDA and $3M to EBT in fiscal year 2011
We anticipate that the acquisitions will contribute approximately $182M to
revenue, $43M to EBITDA and $22M to EBT in fiscal year 2012
Our
recent
acquisitions
of
Matrix,
NewRiver
and
Forefield
are
exceeding their business cases, while Access Data and City Networks
are slightly behind
Our acquisition strategy
Accretive
to
growth,
margin
and
earnings
>20% IRR
Focused on “tuck-in”
sized businesses
Execution capacity |
 8
IBM Data Center Migration –
Q4 FY11, FY12 & Beyond
Are in the final stages of planning with IBM
Still expecting ~$25M in average annual savings over the contract
service life which includes the impact of deferred cost amortization
Total BR migration costs currently estimated at ~$95M
BR cost of ~$30M being expensed in FY12
IBM Data Center Build-out costs of ~$55M being deferred and amortized
over 10-year service life of contract starting in FY13
IBM transition costs of ~$10M being “pulled forward”
and expensed in FY11
and FY12 instead of deferring and amortizing over 10-year service life of
contract
due
to
change
in
expected
accounting
treatment
–
no
impact
on
cash flow estimates
We expect to finalize the migration timing and cost estimates with IBM
sometime in Q1 FY12 |
 9
Revenue Growth Drivers
Revenue from closed sales 60% carryover from FY10 and FY11. Conversions in process
Client revenue retention rate of 99% (no known large client losses)
Internal
growth
(Trades/Stock
Records)
–
Trade
volumes
primary
focus
–
flat
to
mid-high
single
digit
growth
Acquisitions represents base carryover only (new sales included in closed sales)
Slow recovery in event-driven. Although expecting growth, it’s not reflected in
guidance Distribution now includes pass-through 12b-1 fees from Matrix acquisition
Margin excluding IBM migration costs (Non-GAAP) higher due to operating scale
Historical CAGR
Actual
Forecast
(FY05-FY10)
FY11
FY12
6%
Total Revenue Growth
(2)%
8-10%
4%
Closed Sales
(Recurring)
3%
4-5%
(2)%
Client
Losses
(1)%
(1)%
2%
Net New Business
2%
3-4%
3%
Internal Growth
(a)
1%
0-1%
0%
Acquisitions
4%
~2%
5%
Total Recurring
7%
5-7%
1%
Event-Driven
(b)
(6)%
0%
0%
Distribution
(c)
(4)%
~3%
0%
FX/Other
1%
0%
EBIT Margin
(Non-GAAP IBM)
13.1%
13.8-14.4%
(a) Internal Growth includes SPS Equity & Fixed Income Trades, ICS Equity & Mutual Fund Stock
Record Growth, Transaction Reporting and Time & Materials (b) Event-Driven includes ICS
Proxy Contest/Specials, Mutual Fund Proxy and Marketing Communications Fulfillment (c)
Distribution include pass-through fees from Matrix |
 10
Segment Results & Forecast –
Investor Communication Solutions
FY11 revenue and margins in line with prior guidance
FY12 revenue approaches double digit growth despite dormant event-driven
activity environment Recurring
revenue
sales
of
$65-85M
and
the
carryover
effect
of
FY11
closed
sales
expected
to
contribute 2 to 3 points (50% carryover)
Matrix and other acquisitions projected to contribute 2 points
Exceptional client retention levels of 99%
Stock record growth driving 1 point
•
Mutual fund interim position growth planned at 9% consistent with FY11
•
Equity position growth flat to 1%
Event-Driven revenues -
virtually flat to FY11 and any upside or downside not in guidance. Expect
same experience as in FY02-04 where year after the significant downturn
almost no growth and then picked up significantly for years
thereafter Distribution revenues contribute 4 points due to recurring
interim growth and Matrix 12b-1 mutual fund shareholder services
fees Margins: Expect 120-160 bps of margin expansion from higher
fee revenue and cost containment efforts Revenue/Growth
EBIT/Growth
(Non-GAAP)
Margin/Growth
(Non-GAAP)
FY11:
$1,559M/ (7)%
$213M/ (22)%
13.7%/ (260) bps
FY12:
$1,707 to 1,718M / 9 to 10%
$254 to 263M / 19 to 23%
14.9
to
15.3%
/
120
to
160
bps |
 11
11
Segment
Results
&
Forecast
–
Securities
Processing
Solutions
FY11 growth primarily due to on-boarding acquisition of City Networks and
Penson City Networks added $22M in revenues and hit its anniversary date in
Q4 Penson added $27M in revenues and conversion is running slower than
expected Sales contributed 4 points to growth but were offset by client
losses of 3 points (Bank of America Merrill Lynch client loss of $8M)
Margins
without
Penson
and
City
Networks
improved
to
20%,
up
from
19%
in
FY10
on
a
comparable
basis
FY12 growth primarily due to:
New sales adding approximately 6 points of growth (4-5 points
technology) Client
revenue
retention
rate
remaining
around
98%
-
no
known
large
client
losses
Penson
US
conversion
now
expected
to
be
completed
in
Q2
with
the
Outsourcing
business
expected
to be profitable as we exit FY12
Trade volume growth driving high and low end of revenue and margin guidance
Margins improving to an expected Q4 exit rate of around 21% including acquisitions
Revenue/Growth
EBIT/Growth
(Non-GAAP)
Margin/Growth
(Non-GAAP)
FY11:
$594M / +11%
$87M / (12)%
14.7% / (380) bps
FY12:
$631 to 647M / +6 to +9%
$99 to 115M / +13 to +31%
15.7 to 17.7% / +100 to +300 bps
Entered into non-binding letter of intent with Penson seeking to expand the
business relationship |
 12
Broadridge -
FY12 Continuing Operations Financial Guidance Summary
Revenue growth in the range of 8-10%
Recurring closed sales forecast for the year at $110-150M
Earnings before interest and taxes (excluding IBM migration costs) growth of
13- 20% (Non-GAAP) and margin of 13.8-14.4% (Non-GAAP)
Diluted Earnings Per Share (excluding IBM migration costs) in the range of
$1.50- 1.60 (Non-GAAP). Diluted Earnings Per Share in the range of
$1.34-1.44 (GAAP) Diluted weighted-average outstanding shares of
~128M Free cash flow (Non-GAAP) mid-point excluding IBM migration
costs of approximately $225M
Revolving credit facility and term loan mature on March 29, 2012
and are
expected to be renewed in the first quarter of FY12
Dividend increased ~7% from $0.60 to $0.64 per share on annual basis
Guidance does not take into consideration the effect of any future acquisitions,
additional debt and/or share repurchases in excess of the repurchases needed
to be at our 128M diluted weighted-average outstanding shares
guidance |
 13
Broadridge
–
Exiting FY12 and moving into FY13
FY12 Non-GAAP Diluted EPS guidance $1.50-1.60
Key initiatives expected to deliver on annualized basis:
IBM -
~$0.12
MSSB/Restructuring -
~$0.06
Assuming event-driven revenues begin to return to “historic normalized
levels”
-
Fee revenues FY12-13 increase by $30-60M delivering
~$0.10-0.20
Recurring revenues expected to continue to grow at mid-high single
digits (Recurring revenue closed sales > $110M per year, retention rate
of 99%, benefit from market driven trade volumes and stock record
growth as well as acquisitions) |
 14
Transfer Agency
Volly
Global & Emerging products
Outsourcing for BPO
Matrix
Fixed Income
Access Data
SPS Large Global Deals
Summary
Fiscal year 2011 results are not reflective of the value-creation foundation
that has been grown and expanded during the year
Due to the decline in event-driven revenues
However recurring revenues continued to grow
Strong recurring revenue closed sales, second highest in our history
Strong client revenue retention rate of 99%
We have never had better recognition by NYSE and SEC of the value we
provide
We made three very successful acquisitions
Matrix, NewRiver and Forefield
We made excellent progress on our key strategic initiatives
Tangible opportunities make us confident about the future
|
 15
Q&A
There are no slides during this portion of the
presentation |
 16
Closing Comments
There are no slides during this portion of the
presentation |
 17
Appendix
Appendix |
  18
Segment Results & Forecast –
Other & Foreign Exchange (FX)
Mmx
FY12 Range
4Q11
FY11
Low
High
Other Fees Revenue
$0M
$0M
$0M
$0M
Other Fees Margin
$0M
$0M
$0M
$0M
Interest Expense, net
$(2)M
$(8)M
$(17)M
$(17)M
Corp. Expenses & Investments including IBM
$(14)M
$(31)M
$(69)M
$(76)M
FX
- P&L
- Revenue
$7M
$14M
$9M
$12M
- EBIT
$4M
$10M
$7M
$9M
- Transaction Activity
$(1)M
$(2)M
$(1)M
$(1)M
Full year run rate in the
$15-20M range, consisting of corporate expenses, excluding M&A activity, IBM migration costs,
and associate related one-time charges
Interest, net: FY11 reflects lower average debt balance, FY12
reflects higher average debt balance and
refinancing of our credit facilities Forward Rates remain consistent through FY12 FX:
Corporate Expenses and Investments excluding IBM migration costs:
FY11 IBM migration expenses “pulled forward” were $6M.
FY12 IBM migration expenses are expected to be ~$33M (includes the remaining ~$4M of
IBM transition costs “pulled forward”)
|
 19
Broadridge 4Q and FY11 from Continuing Operations
(a)
FY11 excludes the IBM migration costs of $6M, after-tax $4M, or $0.03 EPS impact.
(b)
Includes impacts of FX P&L Margins and FX Transaction Activity
(c)
FY10 excludes the release of a valuation allowance on a deferred tax asset relating to tax loss
carryforwards of approximately $8M. Including the 1-Time Tax Credit, the FY10 effective tax rate was 34.2%.
(d)
FY10 Full Year Diluted EPS Before 1-Times (Non-GAAP) excludes the release of a valuation
allowance on a deferred tax asset relating to tax loss carryforwards of approximately $8M (gain reflected in Income Taxes) $0.06 impact to EPS. |
 20
Broadridge FY12 Guidance from Continuing Operations
(a)
FY11 excludes the IBM migration costs of $6M, after-tax $4M, or $0.03 EPS impact. FY12 Range
Low & High excludes the estimated IBM migration costs of $33M, after-tax $21M, or $0.16 EPS impact.
(b)
Includes impact of FX P&L Margin and FX Transaction Activity |
 21
Cash Flow –
FY11 Results and FY12 Forecast
(In millions)
Year Ended
June 2011
Low
High
Free Cash Flow
(Non-GAAP)
:
Net earnings from continuing operations per GAAP
172
$
172
$
184
$
Depreciation and amortization (includes other LT assets)
72
95
100
Stock-based compensation expense
30
31
31
Other
5
(5)
5
Subtotal
279
293
320
Working capital changes
(51)
(30)
-
Long-term assets & liabilities changes
Includes IBM Migration costs of $(6) and ~$(33) for FY11 and FY12,
respectively (38)
(55)
(45)
Net cash flow (used in) provided by continuing operating activities
190
208
275
Cash Flows From Investing Activities
IBM / ITO data center investment
(7)
(15)
(10)
Penson
-
(20)
(15)
Capital expenditures & software purchases
(40)
(65)
(55)
Free cash flow
(b)
143
$
108
$
195
$
Cash Flows From Other Investing and Financing Activities
Acquisitions
(294)
-
-
Stock repurchases net of options proceeds
(174)
-
-
Proceeds from Short-term borrowing, net
200
-
-
Dividends paid
(75)
(78)
(78)
Other (includes Disc Ops)
28
(5)
5
Net change in cash and cash equivalents
(172)
25
122
Cash and cash equivalents, at the beginning of year
413
242
242
Cash and cash equivalents, at the end of period
241
$
267
$
364
$
FY12 Range
(a)
(a)
Guidance does not take into consideration the effect of any future
acquisitions, additional debt and/or share repurchases in excess of the
repurchases needed to achieve our 128 million diluted weighted-average
outstanding shares guidance. (b)
FY12 ranges includes an impact of ~$(73) million due to IBM migration
costs. When added back to the FY12 ranges, free cash flow would
be ~$225 million at the mid-point of its expected range.
Unaudited |
 22
Closed Sales to Revenue Contribution
Recurring Closed Sales to Revenue
(A)
($ in millions)
Forecast
Recurring
FY09
(C)
FY10
FY11
(D)
FY12
ICS
$55
$80
$65
$65-85
~ Revenue Contribution Year 1-3
55%
35%
10%
50%
50%
0%
45%
45%
10%
40%
35%
25%
SPS
(B)
$30
$40
$50
$45-65
~ Revenue Contribution Year 1-3
30%
70%
0%
15%
25%
40%
10%
20%
55%
15%
35%
35%
Total RC Closed Sales
(B)
$85
$120
$115
$110-150
~ Revenue Contribution Year 1-3
45%
45%
10%
40%
40%
15%
30%
35%
30%
30%
35%
30%
(B)
SPS Recurring Closed Sales are expected to contribute revenue over a four year
period. (C)
Recurring
Closed
Sales
were
adjusted
down
to
$85M
from
$95M.
The
$10M
difference
relates
to
the
Penson
Canada
deal
that
is
now being reflected as an acquisition.
(D)
ICS Recurring Closed Sales includes approximately $11M related to acquisitions and
$15M classified as internal growth/other. (A)
For
presentation
purposes,
certain
amounts
have
been
rounded
up
to
the
nearest
whole
number. |
 23
Revenues and Closed Sales FY05-FY12
(1) Includes reclassification of Pre-sale Fulfillment from
event-driven revenues to recurring revenues. (2)
Includes reclassification of Pre-sale Fulfillment related distribution revenues and Matrix pass-through administrative services from event-driven revenues to recurring revenues.
($ in millions)
FY05-10
Forecast
FY11-12
Recurring Fee Revenues
FY05
FY06
FY07
FY08
FY09
FY10
CAGR
FY11
FY12
Growth Rates
ICS
444
$
513
$
519
$
558
$
583
$
610
$
7%
650
$
$706-715
9-10%
Growth
16%
1%
8%
4%
5%
7%
SPS
459
$
458
$
509
$
515
$
537
$
513
$
2%
522
$
$543-556
4-6%
Growth
0%
11%
1%
4%
-4%
2%
Segment Recurring Fee Revenues
903
$
971
$
1,028
$
1,073
$
1,120
$
1,123
$
4%
1,172
$
$1,249-1,271
7-8%
Growth
7%
6%
4%
4%
0%
4%
Acquisitions
0
$
18
$
28
$
28
$
33
$
45
$
NM*
141
$
~$188
~33%
Total Recurring Fee Revenues
903
$
988
$
1,056
$
1,101
$
1,153
$
1,168
$
5%
1,313
$
$1,435-1,461
9-11%
9%
7%
4%
5%
1%
12%
Event-Driven
128
$
153
$
203
$
200
$
180
$
257
$
15%
135
$
~$140
~4%
Growth
20%
33%
-1%
-10%
43%
-47%
Distribution
649
$
730
$
821
$
808
$
757
$
781
$
4%
704
$
~$765
~9%
Growth
12%
12%
-2%
-6%
3%
-10%
Other/FX
(25)
$
(19)
$
(12)
$
22
$
(17)
$
4
$
NM*
14
$
~$10
NM*
Total BR Revenues
1,656
$
1,853
$
2,068
$
2,131
$
2,072
$
2,209
$
6%
2,166
$
$2,347-2,377
8-10%
Growth
12%
12%
3%
-3%
7%
-2%
Recurring Closed Sales
77
$
92
$
63
$
82
$
95
$
119
$
9%
113
$
$110-150
Growth
19%
-32%
30%
16%
25%
-4%
*NM= Not Meaningful
($ in millions)
FY05-10
Forecast
Event-Driven Fee Revenues
(1)
FY05
FY06
FY07
FY08
FY09
FY10
CAGR
FY11
FY12
Mutual Fund Proxy
51
$
61
$
79
$
92
$
55
$
150
$
24%
39
$
42
$
Mutual Fund Supplemental
39
$
43
$
51
$
49
$
58
$
48
$
4%
44
$
47
$
Contest/ Specials/ Other Communications
38
$
49
$
73
$
59
$
67
$
59
$
9%
52
$
51
$
Total Event-Driven Fee Revenues
128
$
153
$
203
$
200
$
180
$
257
$
15%
135
$
140
$
Growth
20%
33%
-1%
-10%
43%
-47%
Recurring Distribution Revenues
(2)
496
$
562
$
593
$
580
$
567
$
564
$
3%
573
$
~$615
Growth
13%
6%
-2%
-2%
-1%
2%
ED Distribution Revenues
(2)
153
$
169
$
228
$
228
$
190
$
217
$
7%
131
$
~$150
Growth
10%
35%
0%
-17%
14%
-39%
Total Distribution Revenues
649
$
730
$
821
$
808
$
757
$
781
$
4%
704
$
~$765
Growth
12%
12%
-2%
-6%
3%
-10% |
 24
Reconciliation of Non-GAAP to GAAP Measures
(a)
Includes impact of FX Transaction Activity
(b)
4Q11 & FY11 excludes the IBM migration costs of $6M, after-tax $4M, or $0.03 EPS impact.
FY12 Range Low & High excludes the IBM migration costs of ~$33M, after-tax ~$21M, or ~$0.16 EPS impact.
(c)
FY10 excludes the 1-Time Tax Credit of $8M, or $0.06 EPS impact.
(a)
Guidance does not take into consideration the effect of any future acquisitions, additional debt
and/or share repurchases in excess of the repurchases needed to achieve our 128 million diluted
weighted-average outstanding shares guidance. (b)
FY12 ranges includes an impact of ~$(73) million due to IBM migration costs. When added
back to the FY12 guidance ranges, free cash flow would be ~$225 million at the mid-point of
its expected range. Unaudited
(In millions)
Free Cash Flow Reconciliation
Year Ended
June 2011
Low
High
Free Cash Flow (Non-GAAP)
:
Net earnings from continuing operations (GAAP)
172
$
172
$
184
$
Depreciation and amortization (includes other LT assets)
72
95
100
Stock-based compensation expense
30
31
31
Other
5
(5)
5
Subtotal
279
293
320
Working capital changes
(51)
(30)
-
Long-term assets & liabilities changes
Includes IBM Migration costs of $(6) and ~$(33) for FY11 and FY12,
respectively (38)
(55)
(45)
Net cash flow (used in) provided by continuing operating activities
190
208
275
Cash Flows From Investing Activities
IBM / ITO data center investment
(7)
(15)
(10)
Penson
-
(20)
(15)
Capital expenditures & software purchases
(40)
(65)
(55)
Free cash flow (b)
143
$
108
$
195
$
FY12 Range
(a)
EBIT Reconciliation
4Q10
4Q11
FY10
FY11
FY12 Range
($ in millions)
Actual
Actual
Actual
Actual
Low
High
EBIT (Non-GAAP / excluding IBM migration costs)
(a) & (b)
$185
$190
$352
$285
$323
$343
Margin %
24.6%
24.4%
15.9%
13.1%
13.8%
14.4%
Interest & Other
($2)
($2)
($10)
($8)
($17)
($17)
Total EBT (Non-GAAP / excluding IBM migration costs)
$183
$188
$342
$276
$306
$326
Margin %
24.3%
24.2%
15.5%
12.7%
13.0%
13.7%
IBM migration costs
-
($6)
-
($6)
($33)
($33)
Total EBT (GAAP)
$183
$181
$342
$270
$273
$293
Margin %
24.3%
23.3%
15.5%
12.4%
11.6%
12.3%
EPS Reconciliation
4Q10
4Q11
FY10
FY11
FY12 Range
Actual
Actual
Actual
Actual
Low
High
Diluted EPS from continuing operations (GAAP)
$0.84
$0.91
$1.62
$1.34
$1.34
$1.44
One-time
recognition
of
a
deferred
tax
asset
-
FY10
-
-
($0.06)
-
IBM migration costs -
FY11 and FY12
-
$0.03
-
$0.03
$0.16
$0.16
Diluted EPS before One-Times (Non-GAAP)
$0.84
$0.94
$1.56
$1.37
$1.50
$1.60
(a)
(b)
(c) |
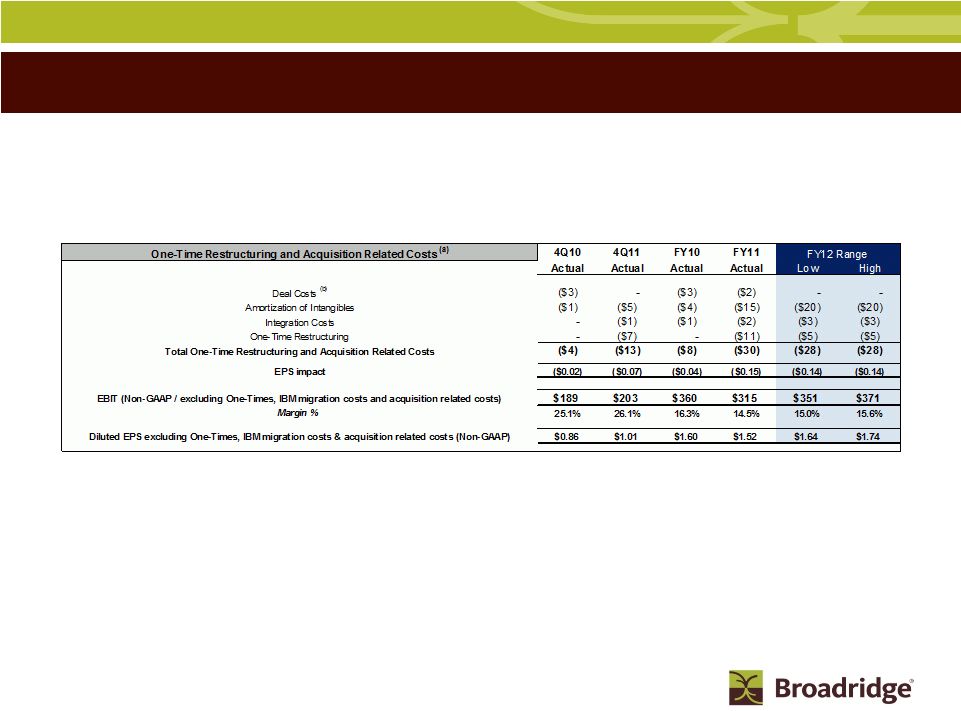 25
One-time
Items
(For
Informational
Purposes
Only)
(a)
(b)
Estimated for Informational Purposes Only. Included are other items that management believes
should be excluded from the GAAP financials when assessing the overall business performance.
Deal Costs include only costs related to closed transactions. |
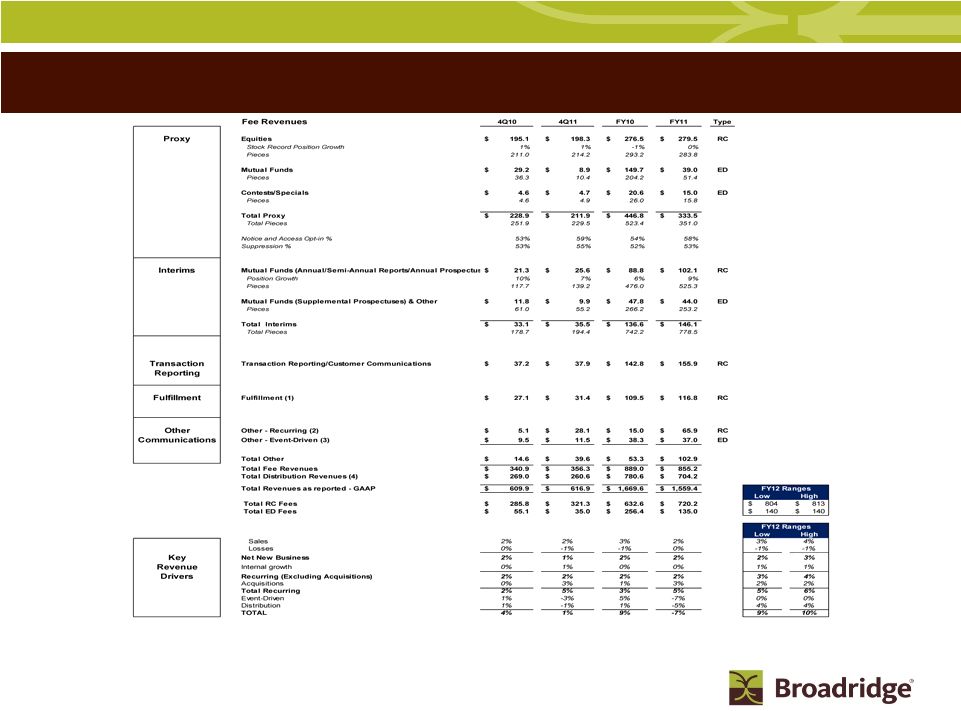 26
(1) Consolidated Pre-sale and Post-sale Fulfillment and reclassified Pre-sale from
event-driven to recurring revenues. (2) Other Recurring Fee Revenue includes Matrix,
NewRiver, StockTrans, Access Data, Forefield and Tax Reporting. (3) Other
event-driven includes 1.8M pieces for 4Q10 and 1.5M for 4Q11, primarily related to corporate actions. Total other pieces for FY10 were 10.5M and for FY11 were 8.3M.
(4) Total Distribution revenues primarily include pass-through revenues related to the
physical mailing of Proxy and Interims, as well as Matrix administrative services. Note:
Certain prior period amounts have been reclassified to conform with current period presentation
$ in millions
RC= Recurring
ED= Event-Driven
ICS Key Segment Revenue Stats |
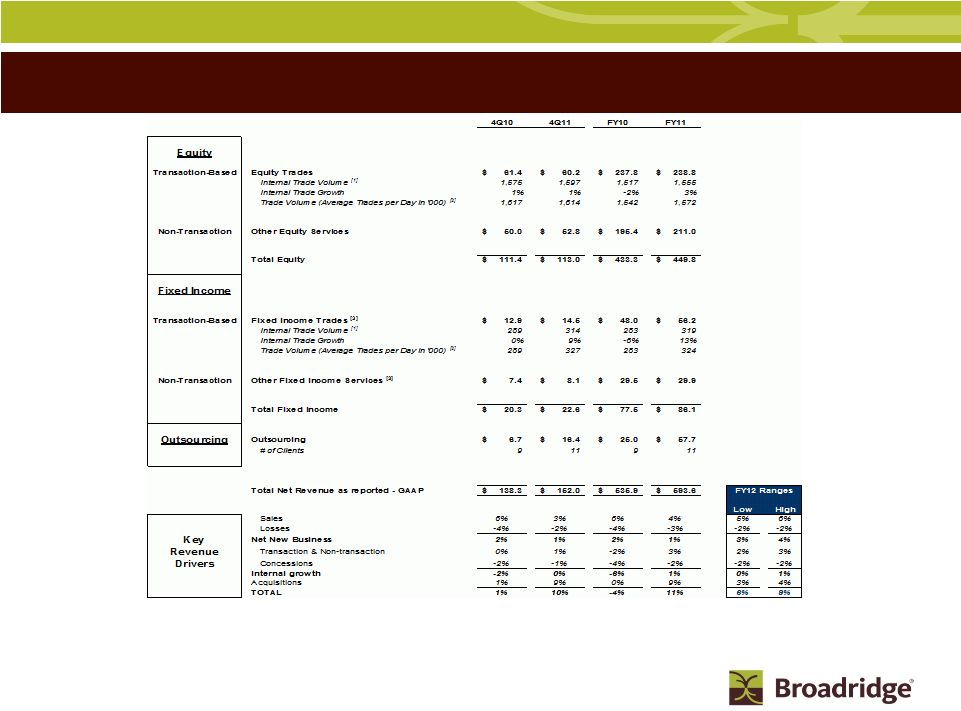 27
SPS and Outsourcing Key Segment Revenue Stats
All Revenues are Recurring
$ in millions
[1] 4Q10 Internal Trade Volume was previously reported as 1,581 and 287 for Equities and Fixed Income,
respectively. FY10 Internal Trade Volume was previously reported as 1,507 and 269 for
Equities and Fixed Income, respectively. These numbers were adjusted to reflect Losses and
Sales in order to present consistent business for the purpose of calculating internal trade growth.
[2] Equity trade volume adjusted to exclude trades processed under fixed priced contracts.
Management believes excluding this trade volume presents a stronger correlation between trade
volume and Equity trade revenue. [3] Fixed Income FY10 trade revenue reclassified $0.6M
mortgage product revenue to other fixed income services, $1.8M full year. |
 28
Broadridge ICS Definitions |
 29
Use of Material Contained Herein
The information contained in this presentation is being provided
for your convenience and
information only. This information is accurate as of the date of its initial
presentation. If you plan to use this information for any purpose,
verification of its continued accuracy is your responsibility.
Broadridge assumes no duty to update or revise the information
contained in this presentation. You may reproduce information contained in
this presentation provided you do not alter, edit, or delete any of the
content and provided you identify the source of the information as
Broadridge Financial Solutions, Inc., which owns the copyright.
Financial information presented for periods prior to the March 30, 2007
spin-off of Broadridge from Automatic Data Processing, Inc.
(“ADP”) represents the operations of the brokerage services
business which were operated as part of ADP. Broadridge’s
financial results for periods before the spin-off from ADP may not be
indicative of our future performance and do not necessarily reflect what our
results would have been had Broadridge operated as a separate,
stand-alone entity during the periods presented, including changes in
our operations and capitalization as a result of the spin-off from
ADP.
Broadridge and the Broadridge logo are registered trademarks of Broadridge
Financial Solutions, Inc. |