Attached files
| file | filename |
|---|---|
| 8-K - FORM 8-K - FURMANITE CORP | d84090e8vk.htm |
| EX-99.1 - EX-99.1 - FURMANITE CORP | d84090exv99w1.htm |
Exhibit 99.2

| Furmanite Corporation QUARTER ENDED JUNE 30, 2011 Charles R. Cox, Chairman & CEO Joseph E. Milliron, President & COO Robert S. Muff, Principal Financial Officer |

| Certain of the Company's statements in this presentation are not purely historical, and as such are "forward-looking statements" within the meaning of the Private Securities Litigation Reform Act of 1995. These include statements regarding management's plans, beliefs, expectations, intentions or projections of the future. Forward-looking statements involve risks and uncertainties, including without limitation, the various risks inherent in the Company's business, and other risks and uncertainties detailed most recently in this presentation and the Company's Form 10-K as of December 31, 2010 filed with the Securities and Exchange Commission. One or more of these factors could affect the Company's business and financial results in future periods, and could cause actual results to differ materially from plans and projections. There can be no assurance that the forward-looking statements made in this document will prove to be accurate, and issuance of such forward-looking statements should not be regarded as a representation by the Company, or any other person, that the objectives and plans of the Company will be achieved. All forward-looking statements made in this presentation are based on information presently available to management, and the Company assumes no obligation to update any forward-looking statements. Company assumes no obligation to update any forward-looking statements. Company assumes no obligation to update any forward-looking statements. Company assumes no obligation to update any forward-looking statements. Company assumes no obligation to update any forward-looking statements. Company assumes no obligation to update any forward-looking statements. Company assumes no obligation to update any forward-looking statements. Company assumes no obligation to update any forward-looking statements. Company assumes no obligation to update any forward-looking statements. Company assumes no obligation to update any forward-looking statements. Company assumes no obligation to update any forward-looking statements. Company assumes no obligation to update any forward-looking statements. Company assumes no obligation to update any forward-looking statements. Company assumes no obligation to update any forward-looking statements. Company assumes no obligation to update any forward-looking statements. Company assumes no obligation to update any forward-looking statements. Company assumes no obligation to update any forward-looking statements. Company assumes no obligation to update any forward-looking statements. 2 |

| Furmanite Corporation QUARTER ENDED JUNE 30, 2011 Charles R. Cox, Chairman & CEO 3 |

| Furmanite Corporation QUARTER ENDED JUNE 30, 2011 Financial Review Robert S. Muff, Principal Financial Officer 4 |

| Consolidated Income Statements ($ in 000s except percentages and per share amounts) (Unaudited) 5 For the Three Months Ended For the Three Months Ended For the Three Months Ended For the Three Months Ended For the Three Months Ended For the Three Months Ended For the Three Months Ended June 30, June 30, June 30, June 30, June 30, June 30, June 30, 2011 % of Rev 2010 % of Rev Change Revenues $ 83,009 100.0% $ 77,513 100.0% $ 5,496 Operating costs 56,323 67.9% 51,922 67.0% 4,401 Depreciation and amortization expense 2,198 2.6% 1,572 2.0% 626 Selling, general and administrative expense 17,724 21.4% 17,623 22.7% 101 Operating income, excluding restructuring costs 6,764 8.1% 6,396 8.3% 368 Restructuring costs 157 0.2% 870 1.1% (713) Operating income 6,607 8.0% 5,526 7.1% 1,081 Interest and other income (expense), net (135) (487) 352 Income before income taxes 6,472 5,039 1,433 Income tax expense (1,326) (1,479) 153 Net income $ 5,146 $ 3,560 $ 1,586 Diluted EPS $ 0.14 $ 0.10 $ 0.04 Diluted EPS, excluding restructuring, net of tax $ 0.14 $ 0.12 $ 0.02 |

| Consolidated Income Statements ($ in 000s except percentages and per share amounts) (Unaudited) 6 For the Six Months Ended For the Six Months Ended For the Six Months Ended For the Six Months Ended For the Six Months Ended For the Six Months Ended For the Six Months Ended June 30, June 30, June 30, June 30, June 30, June 30, June 30, 2011 % of Rev 2010 % of Rev Change Revenues $ 156,063 100.0% $ 143,948 100.0% $ 12,115 Operating costs 106,725 68.4% 96,884 67.3% 9,841 Depreciation and amortization expense 4,073 2.6% 3,121 2.2% 952 Selling, general and administrative expense 34,588 22.2% 35,232 24.5% (644) Operating income, excluding restructuring costs 10,677 6.8% 8,711 6.1% 1,966 Restructuring costs 245 0.2% 2,724 1.9% (2,479) Operating income 10,432 6.7% 5,987 4.2% 4,445 Interest and other income (expense), net (253) (386) 133 Income before income taxes 10,179 5,601 4,578 Income tax expense (1,007) (1,650) 643 Net income $ 9,172 $ 3,951 $ 5,221 Diluted EPS $ 0.25 $ 0.11 $ 0.14 Diluted EPS, excluding restructuring, net of tax $ 0.25 $ 0.17 $ 0.08 |

| Revenues Adjusted for Currency Rates ($ in 000s except percentages) (Unaudited) 7 For the Three Months Ended For the Three Months Ended For the Three Months Ended For the Three Months Ended For the Three Months Ended For the Three Months Ended For the Three Months Ended For the Six Months Ended For the Six Months Ended For the Six Months Ended For the Six Months Ended For the Six Months Ended For the Six Months Ended For the Six Months Ended June 30, June 30, June 30, June 30, June 30, June 30, June 30, June 30, June 30, June 30, June 30, June 30, June 30, June 30, 2011 2010 Change Change Change 2011 2010 Change Change Change Revenues Americas $ 40,943 $ 37,550 $ 3,393 9% $ 81,170 $ 69,117 $ 12,053 17% EMEA 32,266 27,846 4,420 16% 56,939 54,107 2,832 5% Asia-Pacific 9,800 12,117 (2,317) -19% 17,954 20,724 (2,770) -13% Total revenues $ 83,009 $ 77,513 $ 5,496 7% $ 156,063 $ 143,948 $ 12,115 8% Currency adjusted revenues: Americas $ 40,764 $ 37,550 $ 3,214 9% $ 80,840 $ 69,117 $ 11,723 17% EMEA 28,742 27,846 896 3% 52,814 54,107 (1,293) -2% Asia-Pacific 8,152 12,117 (3,965) -33% 15,404 20,724 (5,320) -26% Total currency adjusted revenues $ 77,658 $ 77,513 $ 145 0% $ 149,058 $ 143,948 $ 5,110 4% |

| Adjustments for Currency Rates ($ in 000s) (Unaudited) 8 For the Three Months Ended For the Three Months Ended For the Three Months Ended For the Three Months Ended For the Three Months Ended For the Six Months Ended For the Six Months Ended For the Six Months Ended For the Six Months Ended For the Six Months Ended June 30, June 30, June 30, June 30, June 30, June 30, June 30, June 30, June 30, June 30, 2011 2010 Change 2011 2010 Change Operating income (loss)*: Americas $ 4,379 $ 2,702 $ 1,677 $ 8,412 $ 4,148 $ 4,264 EMEA 1,717 33 1,684 1,383 (2,213) 3,596 Asia-Pacific 511 2,791 (2,280) 637 4,052 (3,415) Total operating income* $ 6,607 $ 5,526 $ 1,081 $ 10,432 $ 5,987 $ 4,445 Currency adjusted operating income*: Americas $ 4,335 $ 2,702 $ 1,633 $ 8,314 $ 4,148 $ 4,166 EMEA 1,456 33 1,423 1,050 (2,213) 3,263 Asia-Pacific 309 2,791 (2,482) 385 4,052 (3,667) Total currency adjusted operating income* $ 6,100 $ 5,526 $ 574 $ 9,749 $ 5,987 $ 3,762 Net income $ 5,146 $ 3,560 $ 1,586 $ 9,172 $ 3,951 $ 5,221 Currency adjusted net income $ 5,052 $ 3,560 $ 1,492 $ 9,010 $ 3,951 $ 5,059 * After allocation of headquarter costs * After allocation of headquarter costs * After allocation of headquarter costs * After allocation of headquarter costs * After allocation of headquarter costs * After allocation of headquarter costs * After allocation of headquarter costs * After allocation of headquarter costs * After allocation of headquarter costs * After allocation of headquarter costs * After allocation of headquarter costs * After allocation of headquarter costs * After allocation of headquarter costs |

| Condensed Consolidated Balance Sheets ($ in 000s) (Unaudited) 9 June 30, December 31, 2011 2010 Change Cash $ 30,855 $ 37,170 $ (6,315) Trade receivables, net 74,014 63,630 10,384 Inventories 26,168 24,366 1,802 Other current assets 5,769 5,951 (182) Total current assets 136,806 131,117 5,689 Property and equipment, net 35,189 30,720 4,469 Other assets 25,456 20,264 5,192 Total assets $ 197,451 $ 182,101 $ 15,350 Total current liabilities $ 43,113 $ 42,936 $ 177 Total long-term debt 32,855 30,085 2,770 Other liabilities 11,189 10,992 197 Total stockholders' equity 110,294 98,088 12,206 Total liabilities and stockholders' equity $ 197,451 $ 182,101 $ 15,350 |

| Condensed Consolidated Cash Flows ($ in 000s) (Unaudited) 10 For the Six Months Ended For the Six Months Ended For the Six Months Ended For the Six Months Ended For the Six Months Ended June 30, June 30, June 30, June 30, June 30, 2011 2010 Change Net income $ 9,172 $ 3,951 $ 5,221 Depreciation, amortization and other non-cash items 3,672 4,297 (625) Working capital changes (14,807) (7,729) (7,078) Net cash (used in) provide by operating activities (1,963) 519 (2,482) Capital expenditures (1,579) (3,451) 1,872 Acquisition of assets and business (4,029) (350) (3,679) Payments on debt (69) (99) 30 Other, net 231 195 36 Effect of exchange rate changes on cash 1,094 (1,094) 2,188 Decrease in cash and cash equivalents (6,315) (4,280) (2,035) Cash and cash equivalents at beginning of period 37,170 36,117 1,053 Cash and cash equivalents at end of period $ 30,855 $ 31,837 $ (982) |

| Furmanite Corporation Q2 2011 Operations Review Joseph E. Milliron, President and Chief Operating Officer 11 |

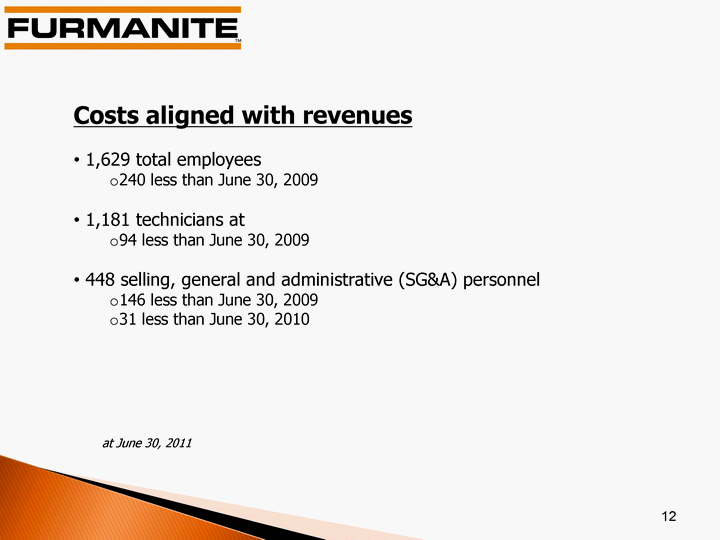
| 12 at June 30, 2011 1,629 total employees 240 less than June 30, 2009 1,181 technicians at 94 less than June 30, 2009 448 selling, general and administrative (SG&A) personnel 146 less than June 30, 2009 31 less than June 30, 2010 Costs aligned with revenues |

| As of June 30, 2011 13 |

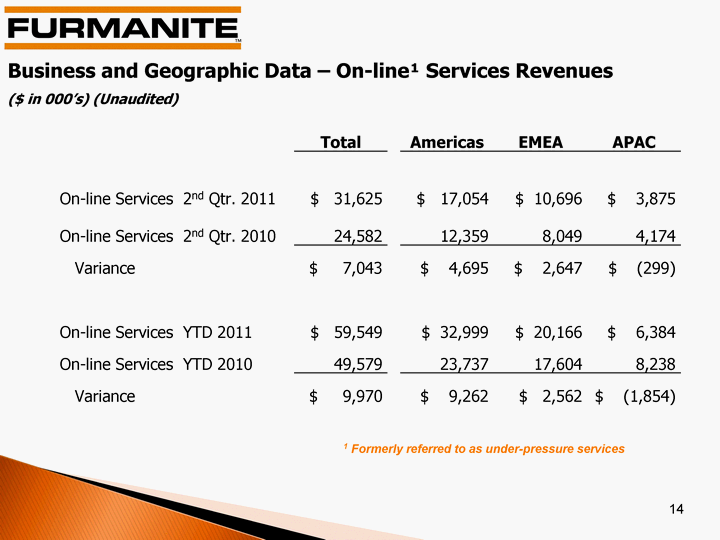
| 14 Total Americas EMEA APAC On-line Services 2nd Qtr. 2011 $ 31,625 $ 17,054 $ 10,696 $ 3,875 On-line Services 2nd Qtr. 2010 24,582 12,359 8,049 4,174 Variance $ 7,043 $ 4,695 $ 2,647 $ (299) On-line Services YTD 2011 $ 59,549 $ 32,999 $ 20,166 $ 6,384 On-line Services YTD 2010 49,579 23,737 17,604 8,238 Variance $ 9,970 $ 9,262 $ 2,562 $ (1,854) Business and Geographic Data - On-line1 Services Revenues ($ in 000's) (Unaudited) 1 Formerly referred to as under-pressure services |

| Business and Geographic Data - Off-line1 Services Revenues ($ in 000's) (Unaudited) 15 1 Formerly referred to as turnaround services Total Americas EMEA APAC Off-line Services 2nd Qtr. 2011 $ 37,678 $ 17,401 $ 15,593 $ 4,684 Off-line Services 2nd Qtr 2010 37,195 15,678 14,654 6,863 Variance $ 483 $ 1,723 $ 939 $ (2,179) Off-line Services YTD 2011 $ 70,178 $ 35,765 $ 25,689 $ 8,724 Off-line Services YTD 2010 66,912 31,041 25,290 10,581 Variance $ 3,266 $ 4,724 $ 399 $ (1,857) |

| Furmanite Corporation Review of 2Q 2011 August 9, 2011 www.furmanite.com 16 |
