Attached files
| file | filename |
|---|---|
| 10-K - FORM 10-K - BENIHANA INC | t70897_10k.htm |
| EX-23.1 - EXHIBIT 23.1 - BENIHANA INC | ex23-01.htm |
| EX-32.2 - EXHIBIT 32.2 - BENIHANA INC | ex32-02.htm |
| EX-31.2 - EXHIBIT 31.2 - BENIHANA INC | ex31-02.htm |
| EX-32.1 - EXHIBIT 32.1 - BENIHANA INC | ex32-01.htm |
| EX-31.1 - EXHIBIT 31.1 - BENIHANA INC | ex31-01.htm |
| EX-21.1 - EXHIBIT 21.1 - BENIHANA INC | ex21-01.htm |
| Exhibit 13.01 |
BENIHANA INC. AND SUBSIDIARIES
SELECTED FINANCIAL DATA
The following table sets forth, for the periods indicated, selected consolidated financial data that has been derived from our audited consolidated financial statements. The following selected consolidated financial data should be read in conjunction with our consolidated financial statements and related notes thereto and “Management’s Discussion and Analysis of Financial Condition and Results of Operations.”
We have a 52/53-week fiscal year. Our fiscal year ends on the Sunday within the dates of March 26 through April 1. Fiscal year 2007 consisted of 53 weeks and all other fiscal years presented consisted of 52 weeks.
|
Fiscal Year Ended
|
||||||||||||||||||||
|
March 27,
|
March 28,
|
March 29,
|
March 30,
|
April 1,
|
||||||||||||||||
|
(in thousands except per share data)
|
2011
|
2010
|
2009
|
2008
|
2007
|
|||||||||||||||
|
(53 week year)
|
||||||||||||||||||||
|
CONSOLIDATED STATEMENTS OF EARNINGS DATA:
|
||||||||||||||||||||
|
Revenues
|
$ | 327,640 | $ | 313,524 | $ | 305,607 | $ | 296,946 | $ | 272,649 | ||||||||||
|
Cost of food and beverage sales
|
79,810 | 74,759 | 72,646 | 69,727 | 66,051 | |||||||||||||||
|
Restaurant operating expenses*
|
209,416 | 208,486 | 196,469 | 185,583 | 165,990 | |||||||||||||||
|
Restaurant opening costs
|
8 | 1,045 | 2,165 | 3,440 | 1,535 | |||||||||||||||
|
General and administrative expenses*
|
36,373 | 24,625 | 22,742 | 20,608 | 17,277 | |||||||||||||||
|
Impairment charges
|
- | 12,347 | 21,505 | - | - | |||||||||||||||
|
Interest (expense) income, net
|
(1,368 | ) | (2,020 | ) | (848 | ) | 270 | 465 | ||||||||||||
|
Income (loss) before income taxes
|
665 | (9,758 | ) | (10,768 | ) | 17,858 | 22,261 | |||||||||||||
|
Income tax (benefit) provision
|
(670 | ) | (815 | ) | (5,703 | ) | 5,065 | 7,766 | ||||||||||||
|
Net income (loss)
|
1,335 | (8,943 | ) | (5,065 | ) | 12,793 | 14,495 | |||||||||||||
|
Basic earnings (loss) per share
|
$ | 0.02 | $ | (0.65 | ) | $ | (0.40 | ) | $ | 0.77 | $ | 0.90 | ||||||||
|
Diluted earnings (loss) per share
|
$ | 0.02 | $ | (0.65 | ) | $ | (0.40 | ) | $ | 0.75 | $ | 0.84 | ||||||||
|
CONSOLIDATED BALANCE SHEETS DATA:
|
||||||||||||||||||||
|
Total assets
|
$ | 220,882 | $ | 234,090 | $ | 257,127 | $ | 241,654 | $ | 204,289 | ||||||||||
|
Long-term debt including current maturities
|
5,689 | 22,410 | 33,351 | 17,422 | - | |||||||||||||||
|
Convertible preferred stock
|
19,710 | 19,623 | 19,536 | 19,449 | 19,361 | |||||||||||||||
|
Stockholders’ equity
|
146,723 | 143,716 | 152,437 | 157,616 | 142,482 | |||||||||||||||
|
OTHER FINANCIAL DATA:
|
||||||||||||||||||||
|
Capital expenditures, net of insurance proceeds
|
$ | 8,053 | $ | 17,000 | $ | 46,809 | $ | 55,136 | $ | 37,543 | ||||||||||
*Certain marketing costs were reclassified from General and administrative expenses to Restaruant operating expenses (see Note 1, Summary of Significant Accounting Policies, of the consolidated financial statements). We believe that this new presentation provides better comparison to our competitors. We reclassified $6.6 million, $7.5 million, $7.5 million and $6.5 million for fiscal years 2010, 2009, 2008 and 2007, respectively.
1
BENIHANA INC. AND SUBSIDIARIES
MANAGEMENT’S DISCUSSION AND ANALYSIS
Financial Condition and Results of Operations
Management’s discussion and analysis below should be read in conjunction with our consolidated financial statements and related financial statement notes found elsewhere in this report.
Overview
Our Business
We have operated “Benihana” teppanyaki-style Japanese restaurants in the United States for more than 45 years, and we believe we are one of the largest operators of teppanyaki-style restaurants in the country. We also operate two other Asian restaurant concepts: RA Sushi and Haru.
Our core concept, the Benihana teppanyaki restaurant, offers teppanyaki-style Japanese cuisine in which fresh steak, chicken and seafood are prepared by a chef on a steel teppan grill at the center of the guests’ table. We believe that the Benihana style of presentation makes us a unique choice for guests, and guests who are seeking greater value for their dining budget appreciate the added entertainment provided by the chef cooking directly at their table. In addition to our Benihana teppanyaki restaurants, we also operate two other restaurant concepts offering Asian, predominately sushi, entrees.
During fiscal year 2010, we launched our Benihana Teppanyaki Renewal Program (“Renewal Program”). The Renewal Program focuses on improving guest experiences as they relate to value, image, quality, consistency and Japanese culture. We have elevated the quality of food and beverages in our Benihana teppanyaki restaurants. These improvements were designed to restore the quality of products to those historically offered and included upgrading the quality of tenderloin, chicken, scallops and shrimp. We have been able to implement these changes without increasing entree prices through fiscal 2011 as a result of our comprehensive purchasing effort. Service standards were improved through extensive staff training and re-engineering the roles and responsibilities of both the restaurant general manager and regional manager. Incentive compensation plans were put in place to insure successful execution of these strategies, enhance staff productivity and improve guest satisfaction. In addition, the concept’s marketing and public relations activities have been substantially improved. These combined efforts are focused on increasing guest frequency, creating greater mindshare and ultimately bolstering restaurant sales at our flagship brand. As part of the Renewal Program, we launched a new menu in an effort to improve the food quality and variety. Additionally, cooking methods have been modified to enhance the flavor of our entrees. Other enhancements to the dining experience include table top presentation, steps of service, red linen napkins, an enhanced focus on beverage offerings, including temperature controlled wine storage and standardized dress attire for all Benihana teppanyaki chefs and restaurant staff. We have worked at select restaurants to maximize visibility with signage, including lighting the blue roofs where appropriate, and have identified opportunities for additional seating. The Renewal Program also addressed deferred maintenance at our restaurants as well as improvements to and retraining on our health and sanitation procedures. We made changes to the dining experience so that we will not only continue to honor one of the world’s oldest cultures, but also solidify the concept’s reputation as being a celebration of Japanese heritage. We hired an Executive Culinary Advisor, Hiroyuki Sakai, who is working with our Executive Chef and seven regional chefs.
These operational improvements continued through fiscal year 2011 as we continued the implementation of the Renewal Program by completing the fulfillment of the general manager position at every restaurant, implementing a labor scheduling module to improve labor management at the restaurants, distributing managed order guides, which result in better managed inventory and purchasing procedures, and strengthening inventory management controls.
Additionally, we launched several initiatives which are designed to create greater awareness for the concept and strengthen guest connectivity. In April 2009, we initiated the Chef’s Table marketing program, an email database which is being utilized for value-based promotions and building brand loyalty, which entitles the guest to a $30 certificate to be used at our restaurant during the month of the guest’s birthday. The database is currently comprised of approximately 1.8 million addresses. The Children’s Club program, launched in September 2009, now called Kabuki Kids with approximately 0.2 million participants, addresses this very important guest constituency, as children are often the prime drivers in bringing families to Benihana. Kabuki Kids members are entitled to a birthday mug when they visit a restaurant during the month of their birthday.
In light of prevailing economic conditions and costs incurred to implement the Renewal Program, during fiscal year 2011, we have focused on conserving cash and increasing operating efficiencies. However, as the overall economy is beginning to stabilize and the results of the Renewal Program are realized, we plan to resume restaurant expansion and may seek to selectively make acquisitions within our Benihana concept. In this connection, we undertook an in depth reevaluation and analysis of our site selection and other development guidelines to ensure future acquisitions are in line with our overall growth strategy.
The RA Sushi concept offers sushi and a full menu of Pacific-Rim dishes in a fun-filled, high-energy environment. RA Sushi caters to a younger demographic, and we believe that it is highly suitable for a variety of real estate options, including “life-style” centers, shopping centers and malls, as well as areas with a nightlife component. RA Sushi’s beverage sales represent approximately 31% of restaurant sales. The RA Sushi restaurants are less expensive to build than our other two concepts and offer us an additional growth vehicle that we believe can succeed in various types of markets. In December 2010, we implemented a price increase across all RA Sushi restaurants in response to cost pressures. The result was an increase in certain menu items of 3.3% and a reduction to the happy hour discounts of 2.8%. In March 2011, RA Sushi launched “The Hook Up,” a guest program that emails a complimentary $20 gift certificate on the guest’s half-birthday.
2
BENIHANA INC. AND SUBSIDIARIES
MANAGEMENT’S DISCUSSION AND ANALYSIS
Financial Condition and Results of Operations
Our Haru concept features an extensive menu of traditional Japanese and Japanese fusion dishes in a modern, urban atmosphere. We believe that the Haru concept is well suited for densely populated cities with nearby shopping, office and tourist areas. The Haru concept generates significant sales volumes from take-out and delivery. Approximately 33% of our Haru New York, NY locations’ revenues are derived from delivery and takeout sales. In March 2011, we increased menu prices. As a result, our food prices increased 1.1% and beverage prices increased 3.0%. Also in March 2011, Haru launched a guest program, “Access,” which provides members with exclusive monthly offers.
The following table reflects changes in restaurant count by concept during the fiscal years ended March 28, 2010 and March 27, 2011:
|
Teppanyaki
|
RA Sushi
|
Haru
|
Total
|
|||||||||||||
|
Restaurant count, March 29, 2009
|
64 | 22 | 9 | 95 | ||||||||||||
|
Openings
|
1 | 3 | - | 4 | ||||||||||||
|
Closings
|
(2 | ) | - | - | (2 | ) | ||||||||||
|
Restaurant count, March 28, 2010
|
63 | 25 | 9 | 97 | ||||||||||||
|
Openings
|
- | - | - | - | ||||||||||||
|
Restaurant count, March 27, 2011
|
63 | 25 | 9 | 97 | ||||||||||||
Summary of results
Summary highlights of our fiscal year 2011 as compared to the previous fiscal year are as follows:
|
●
|
nineteenth consecutive year with total sales increases;
|
|
●
|
closed our second franchised Benihana teppanyaki restaurant located in Santiago, Chile; and
|
|
●
|
amended and restated our credit agreement.
|
Total revenues increased 4.5%, or $14.1 million, to $327.6 million from $313.5 million during fiscal year 2011 as compared to the same period last year. Net income increased by $10.2 million during fiscal year 2011 to a net income of $1.3 million from a net loss of $8.9 million generated during fiscal year 2010. Basic and diluted earnings per common share is $0.02 for fiscal year 2011 compared to a basic and diluted loss per share of $0.65 for fiscal year 2010. Basic weighted average shares outstanding were 15.6 million and 15.4 million as of March 27, 2011 and March 28, 2010, respectively.
Results for the fiscal year ended March 27, 2011 showed an increase in traffic in response to both a stabilizing economy and our continued marketing and promotional efforts to drive brand awareness. In response to the ongoing macroeconomic and industry challenges, we successfully managed restaurant-level controllable expenses helping to bring the revenue increases to the bottom line. Additionally, we opted to reduce capital expenditures in fiscal year 2011.
As previously announced, in July 2010, our board of directors commenced a review of strategic alternatives available to us, including a possible sale of the Company, in order to maximize stockholder value. On May 13, 2011 our board of directors terminated the possible sale process and approved the following strategic alternatives. First, we will submit to our stockholders for their approval a proposal to reclassify each share of Class A Common Stock of the Company into one share of Common Stock, thereby eliminating the Company’s dual-class common stock structure. Second, our board of directors has amended our shareholder rights plan to expire automatically when and if the reclassification of the Class A Common Stock becomes effective. There can be no assurance that the proposed reclassification will be consummated or, if consummated, the timing thereof.
Outlook
As we continue to realize the benefits derived from our Renewal Program as well as improvements in the overall economy, we have begun to focus again on the growth of our business and are developing plans for resumed growth both through new store development and potential acquisitions. When we resume the expansion of our restaurant concepts, our financial results will be impacted by the ratio of newer restaurants to more established restaurants since sales at newly opened restaurants generally do not make a significant contribution to profitability in their initial months of operation due to operating inefficiencies.
We are also focusing our efforts on continued brand awareness at all three of our concepts. The efforts of the Renewal Program will continue at Benihana teppanyaki. At RA Sushi and Haru, we have introduced guest programs, “The Hook up” and “Access,” respectively, to increase brand awareness at these concepts. We are focusing our marketing efforts on these concepts to grow and sustain traffic to the stores.
3
BENIHANA INC. AND SUBSIDIARIES
MANAGEMENT’S DISCUSSION AND ANALYSIS
Financial Condition and Results of Operations
There are significant risks and challenges that could impact our financial results and ability to increase sales and earnings. The restaurant industry is a highly competitive business, which is sensitive to changes in economic conditions, trends in lifestyles and fluctuating costs. Operating margins for the restaurant industry are susceptible to fluctuations in prices of commodities, which include beef and seafood as well as other items necessary to operate such as electricity or other energy supplies, and the ability to pass along increased costs to guests through price increases. Additionally, the restaurant industry is characterized by a significant initial capital investment coupled with high labor costs. Other risks and uncertainties are discussed in “Forward looking statements” found elsewhere in this report. We are focused on monitoring costs and increasing comparable restaurant sales to raise restaurant operating profit in existing restaurants as well as new restaurants. Our expansion plans will take into account these and other operational factors and investment costs and seek to generate sustainable operating results and to achieve acceptable returns on investment from each of our restaurant concepts.
Operating results
Revenues consist of the sales of food and beverages at our restaurants and royalties and licensing fees from franchised restaurants. Revenues are dependent upon the number of restaurants in operation, the number of patrons that visit our restaurants and franchisees’ restaurants and the average per person guest check amounts.
Cost of restaurant food and beverages sold represents the direct cost of the ingredients for the prepared food and beverages sold.
Restaurant operating expenses consist of direct and indirect labor, occupancy costs, advertising and other costs that are directly attributed to each restaurant location. Operating costs and expenses are largely dependent on the number of guests that visit our restaurants and the cost of commodities, the number of employees that are necessary to provide a high quality of service to our guests, rents we pay for our restaurant properties, utilities and other necessary operating costs. Expenses are additionally dependent upon average wage rates, marketing costs and the costs of administering restaurant operations.
Restaurant opening costs include rent during the development period as well as labor, training expenses and certain other pre-opening charges which are expensed as incurred. Restaurant opening costs will vary from location to location depending on a number of factors, including the proximity to our existing restaurants, the size and physical layout of each location, the cost of travel and lodging for different metropolitan areas and the extent of unexpected delays, if any, in obtaining final licenses and permits to open the restaurants, which may also be dependent upon our landlords obtaining their licenses and permits as well as completing their construction activities.
Fiscal Year 2011 compared to Fiscal Year 2010
The following tables show our operating results as well as our operating results as a percentage of restaurant sales for the fiscal years ended March 27, 2011 and March 28, 2010 (dollar amounts in thousands). The tables reflect certain reclassifications as discussed in Note 1, Summary of Significant Accounting Policies, of the consolidated financial statements.
|
Fiscal Year Ended March 27, 2011:
|
||||||||||||||||||||||||||||||||||||||||
|
Teppanyaki
|
RA Sushi
|
Haru
|
Corporate
|
Consolidated
|
||||||||||||||||||||||||||||||||||||
|
Revenues:
|
||||||||||||||||||||||||||||||||||||||||
|
Restaurant sales
|
$ | 216,819 | 100.0 | % | $ | 76,544 | 100.0 | % | $ | 32,558 | 100.0 | % | $ | - | - | $ | 325,921 | 100.0 | % | |||||||||||||||||||||
|
Franchise fees and royalties
|
- | - | - | 1,719 | 1,719 | |||||||||||||||||||||||||||||||||||
|
Total revenues
|
216,819 | 76,544 | 32,558 | 1,719 | 327,640 | |||||||||||||||||||||||||||||||||||
|
Restaurant expenses:
|
||||||||||||||||||||||||||||||||||||||||
|
Cost of food and beverage sales
|
52,861 | 24.4 | % | 19,259 | 25.2 | % | 7,690 | 23.6 | % | - | - | 79,810 | 24.5 | % | ||||||||||||||||||||||||||
|
Restaurant operating expenses*
|
140,562 | 64.8 | % | 48,054 | 62.8 | % | 20,800 | 63.9 | % | - | - | 209,416 | 64.3 | % | ||||||||||||||||||||||||||
|
Restaurant opening costs
|
- | 0.0 | % | 8 | 0.0 | % | - | - | - | - | 8 | 0.0 | % | |||||||||||||||||||||||||||
|
General and administrative expenses*
|
2,021 | 0.9 | % | 2,642 | 3.5 | % | 862 | 2.6 | % | 30,848 | n/m | 36,373 | 11.2 | % | ||||||||||||||||||||||||||
|
Total operating expenses
|
195,444 | 90.1 | % | 69,963 | 91.4 | % | 29,352 | 90.2 | % | 30,848 | - | 325,607 | 99.9 | % | ||||||||||||||||||||||||||
|
Income (loss) from operations
|
$ | 21,375 | 9.9 | % | $ | 6,581 | 8.6 | % | $ | 3,206 | 9.8 | % | $ | (29,129 | ) | - | $ | 2,033 | 0.6 | % | ||||||||||||||||||||
4
BENIHANA INC. AND SUBSIDIARIES
MANAGEMENT’S DISCUSSION AND ANALYSIS
Financial Condition and Results of Operations
|
Fiscal Year Ended March 28, 2010:
|
||||||||||||||||||||||||||||||||||||||||
|
Teppanyaki
|
RA Sushi
|
Haru
|
Corporate
|
Consolidated
|
||||||||||||||||||||||||||||||||||||
|
Revenues:
|
||||||||||||||||||||||||||||||||||||||||
|
Restaurant sales
|
$ | 205,638 | 100.0 | % | $ | 73,484 | 100.0 | % | $ | 32,675 | 100.0 | % | $ | - | - | $ | 311,797 | 100.0 | % | |||||||||||||||||||||
|
Franchise fees and royalties
|
- | - | - | 1,727 | 1,727 | |||||||||||||||||||||||||||||||||||
|
Total revenues
|
205,638 | 73,484 | 32,675 | 1,727 | 313,524 | |||||||||||||||||||||||||||||||||||
|
Restaurant expenses:
|
||||||||||||||||||||||||||||||||||||||||
|
Cost of food and beverage sales
|
48,645 | 23.7 | % | 18,824 | 25.6 | % | 7,290 | 22.3 | % | - | - | 74,759 | 24.0 | % | ||||||||||||||||||||||||||
|
Restaurant operating expenses*
|
140,830 | 68.5 | % | 47,153 | 64.2 | % | 20,503 | 62.7 | % | - | - | 208,486 | 66.9 | % | ||||||||||||||||||||||||||
|
Restaurant opening costs
|
185 | 0.1 | % | 860 | 1.2 | % | - | 0.0 | % | - | - | 1,045 | 0.3 | % | ||||||||||||||||||||||||||
|
General and administrative expenses*
|
2,975 | 1.4 | % | 2,715 | 3.7 | % | 923 | 2.8 | % | 18,012 | n/m | 24,625 | 7.9 | % | ||||||||||||||||||||||||||
|
Impairment charges
|
11,796 | 5.7 | % | 256 | 0.3 | % | 295 | 0.9 | % | - | - | 12,347 | 4.0 | % | ||||||||||||||||||||||||||
|
Total operating expenses
|
204,431 | 99.4 | % | 69,808 | 95.0 | % | 29,011 | 88.8 | % | 18,012 | - | 321,262 | 103.0 | % | ||||||||||||||||||||||||||
|
Income (loss) from operations
|
$ | 1,207 | 0.6 | % | $ | 3,676 | 5.0 | % | $ | 3,664 | 11.2 | % | $ | (16,285 | ) | - | $ | (7,738 | ) | -2.5 | % | |||||||||||||||||||
*Includes depreciation and amortization expense as follows:
|
Fiscal Year Ended March 27, 2011:
|
||||||||||||||||||||||||||||||||||||||||
|
Teppanyaki
|
RA Sushi
|
Haru
|
Corporate
|
Consolidated
|
||||||||||||||||||||||||||||||||||||
|
Restaurant operating expenses
|
$ | 14,004 | 6.5 | % | $ | 3,658 | 4.8 | % | $ | 1,970 | 6.1 | % | $ | - | $ | 19,632 | ||||||||||||||||||||||||
|
General and administrative expenses
|
- | 0.0 | % | - | 0.0 | % | - | 0.0 | % | 1,970 | n/m | 1,970 | ||||||||||||||||||||||||||||
|
Depreciation and amortization expense
|
$ | 14,004 | $ | 3,658 | $ | 1,970 | $ | 1,970 | 21,602 | 6.9 | % | |||||||||||||||||||||||||||||
| Fiscal Year Ended March 28, 2010: | ||||||||||||||||||||||||||||||||||||||||
|
Teppanyaki
|
RA Sushi
|
Haru
|
Corporate
|
Consolidated
|
||||||||||||||||||||||||||||||||||||
|
Restaurant operating expenses
|
$ | 13,600 | 6.6 | % | $ | 3,444 | 4.7 | % | $ | 2,079 | 6.4 | % | $ | - | - | $ | 19,123 | |||||||||||||||||||||||
|
General and administrative expenses
|
- | 0.0 | % | - | 0.0 | % | - | 0.0 | % | 962 | n/m | 962 | ||||||||||||||||||||||||||||
|
Depreciation and amortization expense
|
$ | 13,600 | $ | 3,444 | $ | 2,079 | $ | 962 | 20,085 | 6.4 | % | |||||||||||||||||||||||||||||
In the aggregate, loss from operations decreased $9.7 million, resulting in income from operations of $2.0 million for the fiscal year ended March 27, 2011 when compared to the prior fiscal year. By concept, income from operations increased $20.2 million at Benihana teppanyaki, increased $2.9 million at RA Sushi and decreased $0.5 million at Haru. These changes in income (loss) from operations when compared to the prior fiscal year are due to changes in revenues and operating expenses as further discussed under the headings “Revenues” and “Operating costs and expenses” below.
Revenues
The following table summarizes the changes in restaurant sales between the fiscal years ended March 28, 2010 and March 27, 2011 (in thousands):
|
Teppanyaki
|
RA Sushi
|
Haru
|
Total
|
|||||||||||||
|
Restaurant sales during fiscal year ended March 28, 2010
|
$ | 205,638 | $ | 73,484 | $ | 32,675 | $ | 311,797 | ||||||||
|
Increase (decrease) in comparable sales
|
12,840 | 191 | (117 | ) | 12,914 | |||||||||||
|
Increase from new restaurants
|
884 | 2,869 | - | 3,753 | ||||||||||||
|
Decrease from closed restaurants
|
(2,123 | ) | - | - | (2,123 | ) | ||||||||||
|
Decrease from temporary closures, net
|
(420 | ) | - | - | (420 | ) | ||||||||||
|
Restaurant sales during fiscal year ended March 27, 2011
|
$ | 216,819 | $ | 76,544 | $ | 32,558 | $ | 325,921 | ||||||||
Total revenues increased 4.5% in fiscal year 2011 when compared to fiscal year 2010, and restaurant sales increased $14.1 million in fiscal year 2011 when compared to fiscal year 2010. The increase in restaurant sales was mainly attributable to an increase in sales from restaurants opened longer than one year of $12.9 million and sales from new restaurants of $3.8 million, offset by a decrease in sales of $2.1 million for permanently closed restaurants. Although we have experienced a decrease in certain concepts’ comparable guest counts as discussed below, we have experienced an overall increase in guest counts from the prior year. This is reflective in recent periods’ revenues as compared to prior year, and we anticipate these positive trends to continue.
The following table summarizes comparable restaurant sales by concept and the percentage changes between fiscal years 2011 and 2010 (dollar amounts in thousands). Restaurants are considered comparable when they are open during the same periods in the two years being compared. New restaurants enter the comparable restaurant base when they have been open for more than one year. Restaurants may leave and enter the comparable restaurant base, as they are closed for renovation and subsequently re-open.
5
BENIHANA INC. AND SUBSIDIARIES
MANAGEMENT’S DISCUSSION AND ANALYSIS
Financial Condition and Results of Operations
|
Fiscal Year Ended
|
||||||||||||
|
Comparable restaurant sales by concept:
|
2011
|
2010
|
Percentage
change from
2010
|
|||||||||
|
Teppanyaki
|
$ | 215,922 | $ | 203,082 | 6.3 | % | ||||||
|
RA Sushi
|
73,675 | 73,484 | 0.3 | % | ||||||||
|
Haru
|
32,558 | 32,675 | -0.4 | % | ||||||||
|
Total comparable restaurant sales
|
$ | 322,155 | $ | 309,241 | 4.2 | % | ||||||
Benihana - Sales for the Benihana teppanyaki restaurants increased $11.2 million, or 5.4%, in fiscal year 2011 compared to fiscal year 2010. The increase is attributable to an increase in sales from restaurants opened longer than one year of $12.8 million and an increase in sales from new restaurants of $0.9 million, offset by lost sales attributable to permanent restaurant closures totaling $2.1 million. Sales from new restaurants were mainly attributable to the Orlando, FL restaurant that contributed operating weeks in the current fiscal year before entering the comparable restaurant base. Total comparable restaurant sales for Benihana teppanyaki restaurants opened longer than one year increased 6.3% due primarily to an increase of 7.8% in dine-in guest counts, offset by a 1.5% decrease in the average per person dine-in guest check. The average comparable per person dine-in guest check amount was $27.28 in fiscal year 2011 compared to $27.70 in fiscal year 2010.
RA Sushi - Sales for the RA Sushi restaurants increased $3.1 million, or 4.2%, in fiscal year 2011 compared to fiscal year 2010. The increase is attributable to sales from new restaurants of $2.9 million and an increase in sales from restaurants opened longer than one year of $0.2 million. Sales from new restaurants were mainly attributable to the Leawood, KS, Houston, TX, and Atlanta, GA, restaurants that contributed operating weeks in the current fiscal year before entering the comparable restaurant base. Total comparable restaurant sales for RA Sushi restaurants opened longer than one year increased 0.3% due primarily to an increase of 1.3% in the average per person dine-in guest check, offset by a decrease of 1.1% in guest counts. The average comparable per person dine-in guest check amount was $21.02 in fiscal year 2011 compared to $20.75 in fiscal year 2010.
Haru - Sales for the Haru restaurants were relatively flat in fiscal year 2011 compared to fiscal year 2010. Sales from restaurants opened longer than one year decreased $0.1 million from the prior year. Total comparable restaurant sales for Haru restaurants opened longer than one year decreased 0.4%. Dine-in sales, which comprised 66.6% percent of restaurant sales, decreased 0.7% primarily due to a 4.0% decrease in average per person dine-in guest check, offset by a 3.5% increase in dine-in guest counts. Take-out sales, which comprised 33.4% of restaurant sales, decreased 0.3%. The average comparable per person dine-in guest check amount was $30.99 in fiscal year 2011 compared to $32.29 in fiscal year 2010.
Franchise fees and royalties - Franchise fees and royalties were flat during fiscal year 2011 as compared to fiscal year 2010.
Operating costs and expenses
Cost of food and beverage sales - The consolidated cost of food and beverage sales for the current fiscal year increased $5.1 million and 0.5% when expressed as a percentage of restaurant sales during fiscal year 2011, as compared to the prior fiscal year. The net increase in absolute dollars is reflective of the fact that cost of food and beverage sales is generally variable with sales and is further impacted by rising commodity prices.
Restaurant operating expenses - In the aggregate, consolidated restaurant operating expenses increased $0.9 million but decreased 2.6% when expressed as a percentage of restaurant sales during fiscal year 2011 as compared to fiscal year 2010. At Benihana teppanyaki, restaurant operating expenses remained relatively flat as compared to the prior year but decreased 3.7% as a percent of revenue. The decrease is primarily the result of enhanced labor management, improving expenses by 2.4% of sales.
At RA Sushi, restaurant operating expenses increased $0.9 million but decreased 1.4% when expressed as a percent of restaurant sales when compared to the prior year. The dollar increase is primarily attributable to increased cost of labor of $0.5 million, however, because of our effective labor management, labor decreased 0.7% as a percent of sales.
At Haru, restaurant operating expenses remained relatively flat when compared to prior year, but increased 1.2% as a percent of restaurant sales. The percentage increase is the result of an increase in utilities costs in the New York area.
Restaurant opening costs - Restaurant opening costs were not significant in either fiscal year 2011 or 2010.
General and administrative costs - General and administrative costs increased $11.7 million and 3.3% when expressed as a percentage of sales in fiscal year 2011 as compared to the prior fiscal year. The dollar increase was due to increased corporate salaries totaling $0.9 million as a result of changes in our Benihana teppanyaki corporate operations and changes in our regional manager and regional chef structure with related changes in roles and responsibilities as well as additional expense recorded for our general claims liability of approximately $0.3 million. We have realized a $0.1 million savings on the outsourcing of our accounting and payroll function. We also incurred an additional $1.2 million in legal fees with respect to various legal items (see Note 9, Commitments and Contingencies, of the consolidated financial statements).
6
BENIHANA INC. AND SUBSIDIARIES
MANAGEMENT’S DISCUSSION AND ANALYSIS
Financial Condition and Results of Operations
During the year ended March 27, 2011, we incurred certain non-recurring costs in our Corporate general and administrative expenses of approximately $10.8 million. These costs include costs associated with various financial, operational and strategic growth consulting agreements (including payments made in consideration for services provided by our interim Chief Financial Officer) of approximately $3.3 million, severance costs incurred related to the resignation of Jose I. Ortega, our former Chief Financial Officer, of $0.2 million, fees paid to the Special Committee, formed to explore financial alternatives for the Company, totaling approximately $0.4 million, costs incurred in conjunction with the execution of our accounting and payroll function outsourcing agreement, including the related severance costs, of approximately $2.0 million (includes $1.4 million of accelerated deprecation expense and final contract settlement of the ERP system), the write-off of abandoned projects of approximately $0.2 million, expenses incurred to respond to and ultimately settle the proxy contest in connection with our Annual Shareholders’ Meeting of $0.9 million, an additional $2.3 million related to stock based compensation in connection with the directors’ stock option grants and restricted share awards granted to certain executives pursuant to their employment agreements and costs incurred in connection with the Board’s assessment of strategic alternatives, including a possible sale of the Company, of $1.5 million.
During the year ended March 28, 2010, we incurred approximately $1.1 million in certain non-recurring costs associated with various consulting agreements, including the services provided by our interim Chief Financial Officer, as well as a charge in connection with the resignations of Taka Yoshimoto, Juan C. Garcia and Jose I. Ortega totaling $0.5 million (see Note 15, Resignation of Former Directors and Executives, of the consolidated financial statements).
Impairment charges – During fiscal year 2010, we recorded impairment charges of $12.3 million, comprised of $11.1 million associated with goodwill and $1.2 million ($0.7 million after-tax) to write-down certain restaurants’ property and equipment to estimated fair value (see Note 11, Impairment Charges, of the consolidated financial statements). No such charges were recorded during the year ended March 27, 2011.
Interest (expense) income, net - Interest expense decreased $0.7 million in fiscal year 2011 when compared to fiscal year 2010. This decrease is a result of a lower outstanding borrowings balance during fiscal year 2011 compared to fiscal year 2010 as well as the reversal of interest previously accrued in connection with the minority stockholder litigation (see Note 16, Commitments and Contingencies, of the consolidated financial statements) for which the Court determined we were not responsible.
Income tax provision - Our effective tax rate was (100.8%) for fiscal year 2011 compared to 8.4% for fiscal year 2010. The effective tax rate for fiscal year 2011 was impacted primarily by increasing tax credits and a change in the effective state tax rate.
Fiscal Year 2010 compared to Fiscal Year 2009
The following tables show our operating results as well as our operating results as a percentage of restaurant sales for the fiscal years ended March 28, 2010 and March 29, 2009 (dollar amounts in thousands). The tables reflect certain reclassifications as discussed in Note 1, Summary of Significant Accounting Policies, of the consolidated financial statements.
|
Fiscal Year Ended March 28, 2010:
|
||||||||||||||||||||||||||||||||||||||||
|
Teppanyaki
|
RA Sushi
|
Haru
|
Corporate
|
Consolidated
|
||||||||||||||||||||||||||||||||||||
|
Revenues:
|
||||||||||||||||||||||||||||||||||||||||
|
Restaurant sales
|
$ | 205,638 | 100.0 | % | $ | 73,484 | 100.0 | % | $ | 32,675 | 100.0 | % | $ | - | - | $ | 311,797 | 100.0 | % | |||||||||||||||||||||
|
Franchise fees and royalties
|
- | - | - | 1,727 | 1,727 | |||||||||||||||||||||||||||||||||||
|
Total revenues
|
205,638 | 73,484 | 32,675 | 1,727 | 313,524 | |||||||||||||||||||||||||||||||||||
|
Restaurant expenses:
|
||||||||||||||||||||||||||||||||||||||||
|
Cost of food and beverage sales
|
48,645 | 23.7 | % | 18,824 | 25.6 | % | 7,290 | 22.3 | % | - | - | 74,759 | 24.0 | % | ||||||||||||||||||||||||||
|
Restaurant operating expenses*
|
140,830 | 68.5 | % | 47,153 | 64.2 | % | 20,503 | 62.7 | % | - | - | 208,486 | 66.9 | % | ||||||||||||||||||||||||||
|
Restaurant opening costs
|
185 | 0.1 | % | 860 | 1.2 | % | - | 0.0 | % | - | - | 1,045 | 0.3 | % | ||||||||||||||||||||||||||
|
General and administrative expenses*
|
2,975 | 1.4 | % | 2,715 | 3.7 | % | 923 | 2.8 | % | 18,012 | n/m | 24,625 | 7.9 | % | ||||||||||||||||||||||||||
|
Impairment charges
|
11,796 | 5.7 | % | 256 | 0.3 | % | 295 | 0.9 | % | - | - | 12,347 | 4.0 | % | ||||||||||||||||||||||||||
|
Total operating expenses
|
204,431 | 99.4 | % | 69,808 | 95.0 | % | 29,011 | 88.8 | % | 18,012 | - | 321,262 | 103.0 | % | ||||||||||||||||||||||||||
|
Income (loss) from operations
|
$ | 1,207 | 0.6 | % | $ | 3,676 | 5.0 | % | $ | 3,664 | 11.2 | % | $ | (16,285 | ) | - | $ | (7,738 | ) | -2.5 | % | |||||||||||||||||||
7
BENIHANA INC. AND SUBSIDIARIES
MANAGEMENT’S DISCUSSION AND ANALYSIS
Financial Condition and Results of Operations
|
Fiscal Year Ended March 29, 2009:
|
||||||||||||||||||||||||||||||||||||||||
|
Teppanyaki
|
RA Sushi
|
Haru
|
Corporate
|
Consolidated
|
||||||||||||||||||||||||||||||||||||
|
Revenues:
|
||||||||||||||||||||||||||||||||||||||||
|
Restaurant sales
|
$ | 206,970 | 100.0 | % | $ | 61,270 | 100.0 | % | $ | 35,628 | 100.0 | % | $ | - | - | $ | 303,868 | 100.0 | % | |||||||||||||||||||||
|
Franchise fees and royalties
|
- | - | - | 1,739 | 1,739 | |||||||||||||||||||||||||||||||||||
|
Total revenues
|
206,970 | 61,270 | 35,628 | 1,739 | 305,607 | |||||||||||||||||||||||||||||||||||
|
Restaurant expenses:
|
||||||||||||||||||||||||||||||||||||||||
|
Cost of food and beverage sales
|
48,879 | 23.6 | % | 15,660 | 25.6 | % | 8,107 | 22.8 | % | - | - | 72,646 | 23.9 | % | ||||||||||||||||||||||||||
|
Restaurant operating expenses*
|
133,383 | 64.4 | % | 40,189 | 65.6 | % | 22,897 | 64.3 | % | - | - | 196,469 | 64.7 | % | ||||||||||||||||||||||||||
|
Restaurant opening costs
|
726 | 0.4 | % | 1,439 | 2.3 | % | - | 0.0 | % | - | - | 2,165 | 0.7 | % | ||||||||||||||||||||||||||
|
General and administrative expenses*
|
2,704 | 1.3 | % | 2,518 | 4.1 | % | 1,284 | 3.6 | % | 16,236 | n/m | 22,742 | 7.5 | % | ||||||||||||||||||||||||||
|
Impairment charges
|
1,370 | 0.7 | % | 16,555 | 27.0 | % | 3,580 | 10.0 | % | - | - | 21,505 | 7.1 | % | ||||||||||||||||||||||||||
|
Total operating expenses
|
187,062 | 90.4 | % | 76,361 | 124.6 | % | 35,868 | 100.7 | % | 16,236 | - | 315,527 | 103.8 | % | ||||||||||||||||||||||||||
|
Income (loss) from operations
|
$ | 19,908 | 9.6 | % | $ | (15,091 | ) | -24.6 | % | $ | (240 | ) | -0.7 | % | $ | (14,497 | ) | - | $ | (9,920 | ) | -3.3 | % | |||||||||||||||||
*Includes depreciation and amortization expense as follows:
| Fiscal Year Ended March 28, 2010: | ||||||||||||||||||||||||||||||||||||||||
|
Teppanyaki
|
RA Sushi
|
Haru
|
Corporate
|
Consolidated
|
||||||||||||||||||||||||||||||||||||
|
Restaurant operating expenses
|
$ | 13,600 | 6.6 | % | $ | 3,444 | 4.7 | % | $ | 2,079 | 6.4 | % | $ | - | - | $ | 19,123 | |||||||||||||||||||||||
|
General and administrative expenses
|
- | 0.0 | % | - | 0.0 | % | - | 0.0 | % | 962 | n/m | 962 | ||||||||||||||||||||||||||||
|
Depreciation and amortization expense
|
$ | 13,600 | $ | 3,444 | $ | 2,079 | $ | 962 | 20,085 | 6.4 | % | |||||||||||||||||||||||||||||
| Fiscal Year Ended March 29, 2009: | ||||||||||||||||||||||||||||||||||||||||
|
Teppanyaki
|
RA Sushi
|
Haru
|
Corporate
|
Consolidated
|
||||||||||||||||||||||||||||||||||||
|
Restaurant operating expenses
|
$ | 12,271 | 6.0 | % | $ | 3,242 | 4.4 | % | $ | 2,649 | 8.1 | % | $ | - | - | $ | 18,162 | |||||||||||||||||||||||
|
General and administrative expenses
|
- | 0.0 | % | - | 0.0 | % | - | 0.0 | % | 488 | n/m | 488 | ||||||||||||||||||||||||||||
|
Depreciation and amortization expense
|
$ | 12,271 | $ | 3,242 | $ | 2,649 | $ | 488 | 18,650 | 6.0 | % | |||||||||||||||||||||||||||||
In the aggregate, loss from operations decreased $2.2 million, or 22.0%, for the fiscal year ended March 28, 2010 when compared to the prior fiscal year. By concept, income from operations decreased $18.7 million at Benihana teppanyaki, increased $18.8 million at RA Sushi and increased $3.9 million at Haru. These changes in income (loss) from operations when compared to the prior fiscal year are due to changes in revenues and operating expenses as further discussed under the headings “Revenues” and “Operating costs and expenses” below.
Revenues
The following table summarizes the changes in restaurant sales between the fiscal years ended March 29, 2009 and March 28, 2010 (in thousands):
|
Teppanyaki
|
RA Sushi
|
Haru
|
Total
|
|||||||||||||
|
Restaurant sales during fiscal year ended March 29, 2009
|
$ | 206,970 | $ | 61,270 | $ | 35,628 | $ | 303,868 | ||||||||
|
(Decrease) increase in comparable sales
|
(16,215 | ) | 1,582 | (2,953 | ) | (17,586 | ) | |||||||||
|
Increase from new restaurants
|
8,593 | 10,553 | - | 19,146 | ||||||||||||
|
Decrease from closed restaurants
|
(1,330 | ) | - | - | (1,330 | ) | ||||||||||
|
Increase from temporary closures, net
|
7,620 | 79 | - | 7,699 | ||||||||||||
|
Restaurant sales during fiscal year ended March 28, 2010
|
$ | 205,638 | $ | 73,484 | $ | 32,675 | $ | 311,797 | ||||||||
Total revenues increased 2.6% in fiscal year 2010 when compared to fiscal year 2009, and restaurant sales increased $7.9 million in fiscal year 2010 when compared to fiscal year 2009. The increase in restaurant sales was mainly attributable to sales from new restaurants of $19.1 million and an increase in sales of $7.7 million due to a fewer number of lost weeks from temporary closures in the current fiscal year, offset by a decrease in sales from restaurants opened longer than one year of $17.5 million and a decrease of $1.3 million for permanently closed restaurants. Although we have experienced a decrease in certain concept’s comparable guest counts as discussed below, we have experienced an overall increase in guest counts from the prior year.
The following table summarizes comparable restaurant sales by concept and the percentage changes between fiscal years 2010 and 2009 (dollar amounts in thousands). Restaurants are considered comparable when they are open during the same periods in the two years being compared. New restaurants enter the comparable restaurant base when they have been open for more than one year. Restaurants may leave and enter the comparable restaurant base, as they are closed for renovation and subsequently re-open.
8
BENIHANA INC. AND SUBSIDIARIES
MANAGEMENT’S DISCUSSION AND ANALYSIS
Financial Condition and Results of Operations
|
Fiscal Year Ended
|
||||||||||||
|
Comparable restaurant sales by concept:
|
2010
|
2009
|
Percentage
change from2009 |
|||||||||
|
Teppanyaki
|
$ | 189,783 | $ | 205,998 | -7.9 | % | ||||||
|
RA Sushi
|
62,852 | 61,270 | 2.6 | % | ||||||||
|
Haru
|
32,675 | 35,628 | -8.3 | % | ||||||||
|
Total comparable restaurant sales
|
$ | 285,310 | $ | 302,896 | -5.8 | % | ||||||
Benihana - Sales for the Benihana teppanyaki restaurants decreased $1.3 million in fiscal year 2010 compared to fiscal year 2009. The decrease is attributable to decreases in sales from restaurants opened longer than one year of $16.2 million and lost sales attributable to permanent restaurant closures totaling $1.3 million, offset by in an increase in sales from new restaurants of $8.6 million and an increase in sales of $7.6 million due to a fewer number of lost weeks from temporary closures in fiscal year 2010. Sales from new restaurants were mainly attributable to the Orlando, FL restaurant that opened during fiscal year 2010, as well as the Coral Springs, FL, Columbus, OH, Plymouth Meeting, PA and Plano, TX locations that contributed operating weeks in fiscal year 2010 before entering the comparable restaurant base. Total comparable restaurant sales for Benihana teppanyaki restaurants opened longer than one year decreased 7.9% due primarily to a decrease of 4.2% in dine-in guest counts and a 2.7% decrease in the average per person dine-in guest check. The average comparable per person dine-in guest check amount was $27.70 in fiscal year 2010 compared to $28.46 in fiscal year 2009.
RA Sushi - Sales for the RA Sushi restaurants increased $12.2 million, or 19.9%, in fiscal year 2010 compared to fiscal year 2009. The increase is attributable to sales from new restaurants of $10.6 million and an increase in sales from restaurants opened longer than one year of $1.6 million. Sales from new restaurants were mainly attributable to the Leawood, KS, Houston, TX, and Atlanta, GA, restaurants that opened during fiscal year 2010, as well as the Chino Hills, CA, Huntington Beach, CA, Pembroke Pines, FL and South Miami, FL locations that contributed operating weeks in fiscal year 2010 before entering the comparable restaurant base. Total comparable restaurant sales for RA Sushi restaurants opened longer than one year increased 2.6% due primarily to an increase of 9.4% in dine-in guest counts, offset by a decrease of 5.0% in the average per person dine-in guest check. The average comparable per person dine-in guest check amount was $20.48 in fiscal year 2010 compared to $21.55 in fiscal year 2009.
Haru - Sales for the Haru restaurants decreased $3.0 million in fiscal year 2010 compared to fiscal year 2009. The decrease is attributable to a reduction in sales from restaurants opened longer than one year. Total comparable restaurant sales for Haru restaurants opened longer than one year decreased 8.3%. Dine-in sales, which comprised 66.8% percent of restaurant sales, decreased 8.4% primarily due to a 9.6% decrease in dine-in guest counts, offset by a 4.9% increase in the average per person dine-in guest check. Take-out sales, which comprised 33.2% of restaurant sales, decreased 8.4%. The average comparable per person dine-in guest check amount was $32.29 in fiscal year 2010 compared to $30.79 in fiscal year 2009.
Franchise fees and royalties - Franchise fees and royalties were flat during fiscal year 2010 as compared to fiscal year 2009.
Operating costs and expenses
Cost of food and beverage sales - The consolidated cost of food and beverage sales for the current fiscal year increased in dollar amount and remained relatively flat across all three concepts when expressed as a percentage of restaurant sales during fiscal year 2010 as compared to the prior fiscal year. The net increase in absolute dollars is reflective of the fact that cost of food and beverage sales is generally variable with sales and resulted from the net increase in restaurant sales experienced during fiscal year 2010, specifically the increase in sales at RA Sushi.
Restaurant operating expenses - In the aggregate, consolidated restaurant operating expenses increased by $12.0 million and 2.2% when expressed as a percentage of restaurant sales during fiscal year 2010 as compared to fiscal year 2009. At Benihana teppanyaki, the increase is primarily due to the reopening of stores temporarily closed during the prior year and the opening of one new store, partially offset by the closing of two stores which contributed approximately $8.7 million in increased operating costs. Additionally, during fiscal year 2010 Benihana teppanyaki recognized increased restaurant labor costs of approximately $1.2 million resulting from higher restaurant sales and approximately $1.7 million in incremental supplies and repair and maintenance expenses.
During fiscal year 2009, we received and recognized business interruption insurance proceeds of $0.5 million related to the Benihana teppanyaki restaurant located in Memphis, TN that was damaged by fire during fiscal 2008. An additional $0.2 million in similar proceeds were recognized during fiscal 2010. During fiscal 2009, we also recognized additional depreciation expense totaling $0.4 million, which resulted from reevaluating the remaining useful lives of assets at Benihana teppanyaki restaurants to be renovated as part of our 2005 Renovation Program and incurred $1.0 million in ongoing expenses at Benihana teppanyaki restaurants temporarily closed for remodeling. The 2005 Renovation Program was completed in fiscal year 2009, and no similar charges were recognized during fiscal year 2010.
9
BENIHANA INC. AND SUBSIDIARIES
MANAGEMENT’S DISCUSSION AND ANALYSIS
Financial Condition and Results of Operations
At RA Sushi, the overall increase in restaurant operating expenses is primarily attributable to the increase in the number of restaurants when comparing periods. RA Sushi’s restaurant operating expenses increased by $7.0 million, or approximately 17.3%, however, the percentage increase in the number of stores was 13.6% which reflects higher costs for newer restaurants.
At Haru, the overall decrease in restaurant operating expenses of $2.4 million is primarily attributable to a $1.3 million reduction in labor costs resulting from an overall decrease in restaurant sales and a $0.6 million decrease in depreciation expense primarily attributable to a reduction in the net book value of store assets associated with an impairment charge recognized at our Haru Philadelphia location.
The consolidated increase of 2.2% in operating expenses when expressed as a percentage of sales is the result of costs incurred with the Renewal Program, decreasing comparable sales at mature restaurants, specifically as it relates to labor and fixed costs, including occupancy and depreciation expense as well as underperformance associated with the opening of new restaurants. RA Sushi, however, was able to expand its operating margins given the 2.6% increase in comparable sales during the current period. As a result of operating efficiencies, specifically as it relates to labor costs, Haru was also able to expand its operating margins.
Restaurant opening costs - Restaurant opening costs in fiscal year 2010 decreased in dollar amount and as a percentage of sales as compared to the prior fiscal year. The decrease in the current fiscal year when compared to fiscal year 2009 is due to a reduction in the number of stores opened and timing of restaurant openings.
General and administrative costs - General and administrative costs increased $1.9 million and 0.4% expressed as a percentage of sales in fiscal year 2010 as compared to the prior fiscal year. The dollar increase was due to the write-off of costs totaling $0.2 million associated with development projects that were terminated during the year, increased corporate depreciation expense totaling $0.5 million due to depreciation expense on the ERP system that was implemented during fiscal year 2009, increased corporate salaries totaling $0.6 million as a result of changes in our Benihana teppanyaki corporate operations and changes in our regional manager structure with related changes in roles and responsibilities, an increase in compensation expense associated with changes in the valuation of investments in our deferred compensation plan totaling $0.2 million, as well as certain non-recurring costs associated with various consulting agreements, including the services provided by our interim Chief Financial Officer, for approximately $1.1 million and the resignations of Taka Yoshimoto, Juan C. Garcia and Jose I. Ortega totaling $0.5 million.
During the third quarter 2009, we recovered approximately $0.4 million related to a promissory note due from one of our franchisees, which was previously deemed uncollectible. No similar recoveries were experienced during the current fiscal year. During the fourth quarter 2009, we recorded costs associated with the resignation of Joel A. Schwartz totaling $3.2 million.
Impairment charges - During fiscal year ended March 28, 2010, as a result of continued under-performance of Benihana Tucson, RA Sushi Palm Beach Gardens and Haru Philadelphia and its resulting impact on our expectation of future cash flows, we determined that a change in circumstances had occurred and the carrying value of these stores’ property and equipment may not be recoverable. As a result, we performed an analysis of the carrying value of our property and equipment. As further discussed in Note 11, Impairment Charges, of the consolidated financial statements, during fiscal year 2010, we recorded impairment charges of $1.2 million ($0.7 million net of tax) related to the full write-down of property and equipment at these three restaurants.
As further discussed in Note 11, Impairment Charges, of the consolidated financial statements, we evaluated goodwill for Benihana teppanyaki and Haru as of the end of the third quarter of fiscal year 2010 at the reporting unit level. RA Sushi reporting unit’s goodwill was impaired in fiscal year 2009. Based on the results of step one of the impairment test, the Haru reporting unit’s estimated fair value exceeded its carrying value, and accordingly, no impairment charge to goodwill for the Haru reporting unit has been recognized. Based on the results of step one of the impairment test, the Benihana teppanyaki reporting unit’s estimated fair value did not exceed its carrying value, which required us to perform the second step of the goodwill impairment test. We completed the second step of the goodwill impairment test for the Benihana teppanyaki reporting unit, which resulted in an impairment charge of $11.1 million ($7.3 million net of tax) related to the Benihana teppanyaki reporting unit’s goodwill.
During the fiscal year ended March 29, 2009, we recorded impairment charges of $21.5 million, comprised of $11.9 million ($7.0 million net of tax) associated with goodwill and $9.6 million ($5.7 million net of tax) to write-down certain restaurants’ property and equipment to estimated fair value.
Interest (expense) income, net - Interest expense increased $1.2 million in fiscal year 2010 when compared to fiscal year 2009. This increase is primarily due to higher interest charges on our line of credit and a reduction in capitalized interest costs due to a decrease in new construction projects.
Income tax provision - Our effective tax rate was 8.4% for fiscal year 2010 compared to 53.0% for fiscal year 2009. The effective tax rate for fiscal year 2010 was impacted primarily by the recognition of an impairment loss for the Benihana teppanyaki reporting unit’s goodwill for which there was no income tax benefit due to a zero tax basis, increasing tax credits with decreasing taxable income as well as the resolution of uncertain tax positions totaling $0.1 million, which were previously recognized upon the adoption of accounting for uncertainty in income taxes.
10
BENIHANA INC. AND SUBSIDIARIES
MANAGEMENT’S DISCUSSION AND ANALYSIS
Financial Condition and Results of Operations
Our financial resources
Cash flow from operations has historically been the primary source to fund our capital expenditures; however, as a result of our expansion and renovation programs, we relied more upon financing obtained from financial institutions in fiscal years 2010 and 2009.
Since restaurant businesses do not have large amounts of inventory and accounts receivable, there is generally no need to finance these items. As a result, many restaurant businesses, including our own, operate with negative working capital. During the current fiscal year ended March 27, 2011, the working capital deficit has decreased by $21.4 million. This decrease is primarily due to the reduction of our outstanding line of credit by $16.7 million and the reclassification of outstanding borrowings of $5.7 million from current liabilities to long term debt as of the end of fiscal year 2011.
Line of Credit
We entered into an Amended and Restated Credit Agreement with Wells Fargo (as successor by merger to Wachovia Bank, National Association) on February 10, 2011. The credit facility provides us a borrowing capacity of $30.0 million, with an option to increase the principal amount of the credit facility by $5.0 million to $35.0 million, subject to certain conditions. The credit facility is scheduled to mature on February 10, 2014. The credit facility is secured by the assets of the Company (including first mortgages on the thirteen restaurant properties owned by the Company which had an appraised value of approximately $44.4 million as of December 2009). There are no scheduled principal payments prior to maturity. The Company may, however, prepay outstanding borrowings prior to that date without penalty. The line of credit provides for an initial commitment fee of 0.5% on the unused portion of the loan commitment and a variable interest rate. Both the commitment fee and the interest rate adjust based on a leverage ratio, as defined by the amended and restated agreement. While providing for working capital, capital expenditures and general corporate purposes, the amended and restated agreement requires that the Company maintains certain financial ratios and profitability amounts and restricts the amount of cash dividends paid and stock repurchases of the Company, as well as acquisitions and other investments.
At March 27, 2011, we had $5.7 million of borrowings outstanding under the line of credit at an interest rate of 6.5%. Our borrowing capacity under the line of credit is also reduced on a dollar-for-dollar basis by the cumulative amount of any outstanding letters of credit, which totaled $1.2 million at March 27, 2011, resulting in an available borrowing balance of $23.1 million. As of March 27, 2011, we were in compliance with the financial covenants of the amended and restated agreement governing the line of credit.
Series B Preferred Stock
The 800,000 shares of Series B Convertible Preferred Stock (“Series B preferred stock”) outstanding at March 27, 2011 are convertible into an aggregate 1.6 million shares of common stock. The Series B preferred stock has a liquidation preference of $20.0 million, or $25.00 per share, (subject to anti-dilution provisions) plus accrued and unpaid dividends. The Series B preferred stock is convertible into our common stock at a conversion price of approximately $12.67 per share (as adjusted to reflect the three-for-two stock split) that equates to 1.97 shares of common stock for each share of Series B preferred stock (subject to anti-dilution provisions). The Series B preferred stock carries a dividend at the annual rate of $1.25 per share (or 5% of the purchase price) payable in cash or additional Series B preferred stock and votes on an “as if converted” basis together with our common stock on all matters put to a vote of the common stock holders. We pay quarterly dividends on the Series B preferred stock, and at March 27, 2011, accrued but unpaid dividends on the Series B preferred stock totaled $0.2 million.
We are obligated to redeem the Series B preferred stock at its original issue price on July 2, 2014, which date may be extended by the holders of a majority of the then-outstanding shares of Series B preferred stock to a date no later than July 2, 2024. We may pay the redemption in cash or, at our option, in shares of common stock valued at then-current market prices unless the aggregate market value of our common stock and any other common equity is below $75.0 million. In addition, the Series B preferred stock may, at our option, be redeemed in cash at any time beginning three years from the date of issue if the volume-weighted average price of the common stock exceeds approximately $25.33 per share (as adjusted to reflect the three-for-two stock split) for sixty consecutive trading days.
Pursuant to the agreement under which BFC Financial Corporation (“BFC”) purchased the Series B preferred stock, BFC is entitled to elect one individual to our board of directors but has waived such right so long as either John E. Abdo or Alan B. Levan have been otherwise elected to our board. Additionally, in the event that dividends are not paid for two consecutive quarters, BFC is entitled to elect one additional director but has waived such right so long as both John E. Abdo and Alan B. Levan have been otherwise elected to our board.
On May 20, 2011, BFC exercised the right to convert 200,000 of its 800,000 shares of Series B preferred stock. These 200,000 shares of Series B preferred stock plus the accrued but unpaid dividends were converted into 397,328 shares of common stock.
11
BENIHANA INC. AND SUBSIDIARIES
MANAGEMENT’S DISCUSSION AND ANALYSIS
Financial Condition and Results of Operations
Increase in Authorized Shares
On February 22, 2010, we held a special meeting of shareholders to consider and act upon a proposed Agreement and Plan of Merger by and between Benihana Inc. and its wholly-owned subsidiary BHI Mergersub, Inc., pursuant to which such subsidiary would merge with and into the Company. The sole purpose of this transaction was to effect an amendment to our certificate of incorporation to increase the number of shares of Class A common stock which we are authorized to issue by 12,500,000. Our stockholders approved the transaction and our certificate of incorporation was amended on February 23, 2010 to reflect the share increase. The increase in shares will allow us to use the net proceeds from any sale of the securities offered by the prospectus for general corporate purposes, including but not limited to restaurant operations, the repayment of debt and acquisition or investment in other companies, businesses or assets. At the present time, no determination has been made to offer any securities nor has any determination been made as to the specific uses of proceeds if such securities were to be offered and sold.
Expansion Program
In response to the current economic environment prevailing in fiscal year 2011, we opted to reduce capital expenditures. Based upon the availability of debt and equity financing, continued improvement in same store sales trends, the positive results of the Renewal Program, the availability of real estate at reasonable prices and the ability to make strategic acquisitions on attractive terms, we anticipate that we will resume restaurant expansion.
The development and opening process generally ranges from 12 to 18 months after lease signing and depends largely upon the availability of the leased space we intend to occupy and is often subject to matters that result in delays outside of our control, usually the permitting process, turnover of the premises from the landlord and mandates of local governmental building authorities. The number and timing of new restaurants actually opened during any given period, and their associated contribution, will depend on a number of factors, including but not limited to, the identification and availability of suitable locations and leases, the timing of the delivery of the leased premises to us from our landlords so that we can commence our build-out construction activities, the ability of our landlords and us to timely obtain all necessary governmental licenses and permits to construct and operate our restaurants, disputes experienced by our landlords or our outside contractors, any unforeseen engineering or environmental problems with the leased premises, weather conditions that interfere with the construction process, our ability to successfully manage the design, construction and preopening processes for each restaurant, the availability of suitable restaurant management and hourly employees and general economic conditions. While we manage those factors within our control, we have experienced unforeseen delays in restaurant openings from time to time in the past and will likely experience delays in the future.
Minority Stockholders Liability
As further discussed in Note 16, Commitments and Contingencies, of the consolidated financial statements, we will also use our capital resources to settle the outstanding liability incurred when the holders of the balance of Haru’s equity (the “minority stockholders”) exercised their put option in Haru Holding Corp. On July 1, 2005, the former minority stockholders exercised the put option to sell their respective shares to us. On August 25, 2006, the former minority stockholders sued us. The suit (which was filed in the Supreme Court of the State of New York, County of New York, but has been removed to the United States District Court for the Southern District of New York) sought an award of $10.7 million, based on the former minority stockholders’ own calculation of the put option price formula and actions allegedly taken by us to reduce the value of the put option. On December, 19, 2007, the Court dismissed all of the claims against us, except for the breach of fiduciary duty and breach of contract claims. On March 5, 2010, the Court issued a decision stating that the price required to be paid by us to the former minority stockholders would be approximately $3.7 million, our original calculation of the put option price. On April 2, 2010, the plaintiff appealed the Court’s decision. On October 13, 2010, the Court entered an Order requiring a closing within 30 days, upon which we were ordered to pay the put option price as determined by the Court. On November 10, 2010, we paid the amount owed and relieved any related outstanding liability. The outcome of the April 2010 appeal is still pending.
Cash Obligation to Former Directors and Executives
As further discussed in Note 15, Resignation of Former Directors and Executives, of the consolidated financial statements, we will use our capital resources to fund the remaining $1.2 million cash obligation in connection with the resignation of various former directors and executives in fiscal year 2010.
Supply Agreements
We have entered into non-cancellable national supply agreements for the purchase of certain beef and seafood items, as well as produce, oils and other items used in the normal course of business, at fixed prices for up to twelve-month terms. These supply agreements will eliminate volatility in the cost of the commodities over the terms of the agreements. These supply agreements are not considered derivative contracts.
12
BENIHANA INC. AND SUBSIDIARIES
MANAGEMENT’S DISCUSSION AND ANALYSIS
Financial Condition and Results of Operations
Future capital requirements
Our capital requirements, including development costs related to the opening of new restaurants, have historically been significant. In fiscal year 2011, however, we limited our near-term expansion activities. During fiscal year 2012, we are refocusing on our plans to grow the business and hope to expand the number of new restaurants that will open in fiscal year 2013 and beyond. Any significant increase in the number of new restaurants we may open will require us to raise additional capital and no assurance can be given that we will be able to do so on terms favorable to us. Our future capital requirements and the adequacy of available funds will depend on many factors, including market acceptance of products, the operating performance of our restaurants, the fluctuations of the national economy, the cost and availability of credit, the availability of acquisitions and the timing and rate of restaurant expansion.
For fiscal year 2012, we anticipate that our cash flow from operations and line of credit will be sufficient to provide for our projected capital requirements. However, if we increase our expansion and acquisition programs, cash flow from operations may not be sufficient to fund our capital requirements, and we may seek additional financing through either debt or equity issuance.
Cash Flows
We believe that our cash from operations and the funds available under the line of credit will provide sufficient capital to fund operations, commitments and contingencies and committed restaurant expansion for at least the next twelve months. However, we believe that we will require additional capital if we are to resume a more aggressive growth strategy. The following table summarizes the sources and uses of cash and cash equivalents (in thousands):
|
Fiscal Year Ended
|
||||||||||||
|
2011
|
2010
|
2009
|
||||||||||
|
Net cash provided by operating activities
|
$ | 27,511 | $ | 27,608 | $ | 33,850 | ||||||
|
Net cash used in investing activities
|
(7,921 | ) | (16,662 | ) | (46,530 | ) | ||||||
|
Net cash (used in) provided by financing activities
|
(18,110 | ) | (12,279 | ) | 14,853 | |||||||
|
Net increase (decrease) in cash and cash equivalents
|
$ | 1,480 | $ | (1,333 | ) | $ | 2,173 | |||||
Operating activities
Net cash provided by operating activities totaled $27.5 million, $27.6 million and $33.9 million in fiscal years 2011, 2010 and 2009, respectively. Cash provided by operations in fiscal year 2011 remained flat when compared to fiscal year 2010.
Investing activities
Capital expenditures were $8.1 million, $17.2 million and $48.8 million during fiscal years 2011, 2010 and 2009, respectively. Capital expenditures during fiscal year 2012 are expected to total approximately $16.1 million but will be substantially increased if we accelerate our expansion and acquisition program.
During fiscal years 2010 and 2009, we received $0.2 million and $2.0 million in insurance proceeds, respectively, related to the Benihana teppanyaki restaurant located in Memphis, TN that was damaged by fire, which proceeds were used to rebuild the restaurant. The Memphis, TN location re-opened in January 2009.
During fiscal year 2010, in connection with the resignation of Joel Schwartz, our former Director, Chairman and Chief Executive Officer, approximately $0.3 million was withdrawn from the deferred compensation plan, and we realized a loss of less than $0.1 million.
During the fiscal year ended March 29, 2009, we entered into a franchise agreement with a third-party for the operation of the Benihana Monterey location and, concurrently, entered into an agreement for the sale of the Benihana Monterey location’s assets, which had collateralized a promissory note due from the previous franchisee. The proceeds from the sale of assets resulted in a partial recovery of approximately $0.4 million of the promissory note, accrued interests and costs owed by the previous franchisee.
Financing activities
We began drawing on our line of credit with Wachovia in fiscal year 2008 to fund the expansion and renovation programs. In fiscal year 2011, we amended and restated the line of credit with Wells Fargo. Though we expect to continue to draw on the line of credit in the near future as needed for our development plan, it is anticipated that we will continue to use cash from operations to pay down outstanding borrowings during fiscal year 2012. Refer to “Financial Resources” above for a discussion of the amended terms of our line of credit agreement. During the fiscal year ended March 27, 2011, we borrowed $104.8 million under the line of credit and made $121.5 million in payments. During the fiscal year ended March 28, 2010, we borrowed $99.9 million and made $110.9 million in payments. During the fiscal year ended March 29, 2009, we borrowed $112.5 million and made $96.6 million in payments.
13
BENIHANA INC. AND SUBSIDIARIES
MANAGEMENT’S DISCUSSION AND ANALYSIS
Financial Condition and Results of Operations
During the fiscal year ended March 27, 2011, we entered into an amended and restated line of credit agreement with Wells Fargo and incurred $0.8 million in debt issuance costs. During the fiscal year ended March 28, 2010, we entered into fourth and fifth amendments to the line of credit and incurred $0.8 million in debt issuance costs in connection with the amendments. During the fiscal year ended March 29, 2009, we entered into second and third amendments to the line of credit and incurred $0.2 million in debt issuance costs in connection with the amendments.
We paid approximately $1.0 million in dividends on the Series B preferred stock during each of fiscal years 2011, 2010 and 2009.
During fiscal years 2011, 2010 and 2009, cash proceeds from stock option exercises were $0.3 million, $0.6 million and less than $0.1 million, respectively.
Contractual obligations and commitments
The following table summarizes contractual obligations and commitments at March 27, 2011 (in thousands):
|
|
Total
|
2012
|
2013
|
2014
|
2015
|
2016
|
Thereafter
|
|||||||||||||||||||||
|
Operating lease obligations (1)
(Note 12)
|
$ | 186,176 | $ | 15,570 | $ | 15,253 | $ | 15,149 | $ | 14,253 | $ | 13,674 | $ | 112,277 | ||||||||||||||
|
Long-term debt(2) (Note 7)
|
5,689 | - | - | 5,689 | - | - | - | |||||||||||||||||||||
|
Purchase commitments
|
36,448 | 30,197 | 6,153 | 98 | - | - | - | |||||||||||||||||||||
|
Retirement, severance and consulting cash obligations (3) (Note 15)
|
1,200 | 412 | 412 | 376 | - | - | - | |||||||||||||||||||||
|
Unrecognized tax benefits (4)
(Note 14)
|
202 | - | - | - | - | - | 202 | |||||||||||||||||||||
|
Outsource agreement (5)
|
7,389 | 1,673 | 1,673 | 1,673 | 1,673 | 697 | - | |||||||||||||||||||||
|
Total
|
$ | 237,104 | $ | 47,852 | $ | 23,491 | $ | 22,985 | $ | 15,926 | $ | 14,371 | $ | 112,479 | ||||||||||||||
|
(1)
|
Operating lease obligations do not include certain operating expenses such as contingent rent obligations and common area maintenance. In fiscal year 2011, these charges totaled approximately $5.2 million.
|
|
(2)
|
Borrowings under the line of credit facility as of March 27, 2011. The line of credit facility allows us to borrow up to $30.0 million through February 2014. There are no scheduled payments prior to maturity; however, we may prepay outstanding borrowings prior to that date. Estimates of future interest payments for our variable rate debt are excluded; however, using the borrowings outstanding and the corresponding 6.5% interest rate as of March 27, 2011, an estimate of annual interest payments for fiscal year 2012 would be approximately $0.3 million. Based on the amounts outstanding as of March 27, 2011, a 100 basis point change in interest rates would result in an approximate change to these estimated interest rate payments of less than $0.1 million.
|
|
|
|
(3)
|
On February 9, 2009, Joel A. Schwartz resigned from his positions as Director, Chairman and Chief Executive Officer, effective February 9, 2009. In connection with his resignation, Mr. Schwartz’s employment agreement with us was terminated on a without cause basis, and we entered into an agreement with Mr. Schwartz which provides for, among other things, Mr. Schwartz to provide consulting services to us for a period of five years in exchange for annual payments from us of $17,200. In accordance with his employment agreement with us, Mr. Schwartz was paid a severance payment of $0.9 million and a retirement benefit of $2.0 million beginning in fiscal year 2010. The severance payment was paid in a lump sum six months after Mr. Schwartz’s resignation and the retirement benefit is to be paid in sixty equal monthly installments.
|
|
(4)
|
We have $0.2 million of unrecognized tax benefits (including related interest) related to uncertain tax positions recorded as liabilities. As we are uncertain as to if or when these amounts may be settled, the related balance has been reflected in the caption “Thereafter.”
|
|
(5)
|
On June 10, 2010, we executed an Outsourcing Services Agreement (the “Agreement”) with InfoSync Services, LLC (“Vendor”) pursuant to which Vendor will provide to us accounting and information services described in the Agreement. The original term of the agreement is for 36 months following the start of processing date with subsequent 2 year renewal options available to us, and we have agreed that Vendor will be the exclusive provider of the services which are the subject of the Agreement.
|
14
BENIHANA INC. AND SUBSIDIARIES
MANAGEMENT’S DISCUSSION AND ANALYSIS
Financial Condition and Results of Operations
Off-balance sheet arrangements
As of March 27, 2011, we did not have any “off-balance sheet arrangements” as that term is defined in Regulation S-K Item 303(a)(4).
The impact of inflation
The primary inflationary factors affecting our operations are labor and commodity costs. Our profitability is dependent, among other things, on our ability to anticipate and react to changes in the costs of operating resources, including food and other raw materials, labor and other supplies and services. Other than labor costs, we do not believe that inflation has had a material effect on sales or expenses during the last three fiscal years. Our restaurant operations are subject to federal and state minimum wage laws governing matters such as working conditions, overtime and tip credits. Significant numbers of our food service and preparation personnel are paid at rates related to the federal minimum wage and, accordingly, increases in the minimum wage have increased our labor costs in recent years. To the extent permitted by competition, we have mitigated increased costs by increasing menu prices and may continue to do so if deemed necessary in future years. To the extent that price increases cannot be passed along to our guests, those cost increases could negatively impact our financial results.
Quantitative and qualitative disclosures about market risk
We are exposed to certain risks of increasing interest rates and commodity prices. The interest on our indebtedness is largely variable and is benchmarked to the prime rate in the United States or to the London interbank offering rate. We may protect ourselves from interest rate increases from time-to-time by entering into derivative agreements that fix the interest rate at predetermined levels. We have a policy not to use derivative agreements for trading purposes. We have no derivative agreements as of March 27, 2011.
We had $5.7 million of borrowings outstanding under our line of credit at March 27, 2011. Based on the amounts outstanding as of March 27, 2011, a 100 basis point change in interest rates would result in an approximate change to interest expense of less than $0.1 million.
We purchase commodities such as chicken, beef and seafood for our restaurants. The prices of these commodities may be volatile depending upon market conditions. We do not purchase forward commodity contracts because the changes in prices for them have historically been short-term in nature and, in our view, the cost of the contracts exceeds the benefits.
We have, however, entered into non-cancellable national supply agreements for the purchase of certain beef and seafood items, as well as produce, oils and other items used in the normal course of business, at fixed prices for up to twelve-month terms. These supply agreements will eliminate volatility in the cost of the commodities over the terms of the agreements. These supply agreements are not considered derivative contracts.
Seasonality of our business
We have a 52/53-week fiscal year. Our fiscal year ends on the Sunday within the dates of March 26 through April 1. We divide the fiscal year into 13 four-week periods. Because of the odd number of periods, our first fiscal quarter consists of 4 periods totaling 16 weeks and each of the remaining three quarters consists of 3 periods totaling 12 weeks each. In the event of a 53-week year, the additional week is included in the fourth quarter of the fiscal year. This operating calendar provides us a consistent number of operating days within each period as well as ensures that certain holidays significant to our operations occur consistently within the same fiscal quarters. Because of the differences in length of fiscal quarters, however, results of operations between the first quarter and the later quarters of a fiscal year are not comparable.
Our business is not highly seasonal although we do have more diners coming to our restaurants for special holidays such as Mother’s Day, Valentine’s Day and New Year’s Eve. Mother’s Day falls in our first fiscal quarter, New Year’s Eve in the third fiscal quarter and Valentine’s Day in the fourth fiscal quarter of each year.
Fiscal years 2011, 2010 and 2009 consisted of 52 weeks.
Critical accounting policies and estimates
Our discussion and analysis of our financial condition and results of operations are based upon our consolidated financial statements, which have been prepared in accordance with accounting principles generally accepted in the United States of America. The preparation of these financial statements requires us to make estimates and judgments that affect the reported amounts of assets, liabilities, revenues and expenses and related disclosure of contingent assets and liabilities during the reported period. Actual amounts could differ from those estimates (see Note 1, Summary of Significant Accounting Policies, of the consolidated financial statements). Critical accounting policies and estimates are those that we believe are most important to portraying our financial condition and results of operations and also require the greatest amount of subjective or complex judgments. Judgments made in the application of these policies or uncertainties at the time of application may result in materially different amounts being reported under different conditions or using different assumptions. We consider the following policies to be the most critical in understanding the judgments that are involved in preparing our consolidated financial statements based on the high degree of judgment or complexity in their application.
15
BENIHANA INC. AND SUBSIDIARIES
MANAGEMENT’S DISCUSSION AND ANALYSIS
Financial Condition and Results of Operations
Long-Lived Assets - We record all property and equipment at cost. Improvements are capitalized while repairs and maintenance costs are expensed as incurred. Depreciation and amortization of long-lived assets are calculated using the straight-line method over the estimated useful life of the assets or the expected lease term used for lease accounting purposes, whichever is shorter. The useful life of property and equipment and the determination as to what constitutes a capitalized cost versus a repair and maintenance expense involves judgments made by us. These judgments may produce materially different amounts of depreciation and amortization expense and repairs and maintenance expense if different assumptions were used. As discussed further below, these judgments may also impact our need to recognize an impairment charge on the carrying amount of these assets as the cash flows associated with the assets are realized, or as our expectations of estimated future cash flows change.
We periodically assess the potential impairment of long-lived assets whenever events or changes in circumstances indicate that the carrying value may not be recoverable. We consider a history of consistent and significant negative comparable restaurant sales, declining operating profit, or operating losses to be primary indicators of potential asset impairment. Assets are grouped and evaluated for impairment at the lowest level for which there is identifiable cash flows, primarily at the individual restaurant level. When indicators of potential impairment are present, the carrying values of the assets are evaluated in relation to the operating performance and estimated future undiscounted cash flows of the underlying restaurant. If a forecast of undiscounted future operating cash flows directly related to the restaurant is less than the carrying amount of the restaurant’s long-lived assets, the carrying amount is compared to fair value. An impairment loss is measured as the amount by which the carrying amount of the restaurant’s long-lived assets exceeds its fair value, and the charge is taken against results of operations. Fair value is an estimate based on a net present value model, which discounts projected free cash flows at a computed weighted average cost of capital as the discount rate. The projected free cash flows used in calculating estimated fair value involve a significant amount of judgment and include our best estimates of expected future comparable sales and operating performance for each restaurant.
The judgments we make related to the expected useful lives of long-lived assets and our ability to realize undiscounted cash flows in excess of their carrying amounts are affected by factors such as the ongoing maintenance of and improvements to the assets, changes in economic conditions, changes in operating performance of the restaurant sites and other factors. As we assess the ongoing expected cash flows and carrying amounts of our long-lived assets, significant adverse changes in these factors may cause us to realize a material impairment charge.
Valuation and Recoverability of Goodwill and Other Intangible Assets - We review the recoverability of goodwill and other long-lived intangible assets annually or more frequently if indicators of impairment exist. The goodwill impairment test involves a two-step process. The first step is a comparison of each reporting unit’s fair value to its carrying value. If the carrying value of the reporting unit is greater than its fair value, there is an indication that impairment may exist and the second step must be performed to measure the amount of impairment loss. The purpose of the second step is only to determine the amount of goodwill that should be recorded on the balance sheet. Goodwill is evaluated at the reporting unit level using an estimation of fair value based upon (1) an analysis of discounted cash flow projections (income approach) and (2) an analysis of cash flows of the reporting unit using market-derived earnings multiples of similar restaurant businesses that were bought and sold within a reasonable time frame to our own evaluation (market approach). The second step, if required, involves an analysis reflecting the allocation of the fair value determined in the first step (as if it was the purchase price in a business combination). If the calculated fair value of the goodwill resulting from this allocation is lower than the carrying value of the goodwill in the reporting unit, the difference is reflected as a non-cash impairment loss. The recorded amounts of other items on the balance sheet are not adjusted.
The accounting estimates related to our goodwill and other indefinite lived intangible assets require us to make significant assumptions about fair values. Our assumptions regarding fair values require significant judgment about economic factors, industry factors, as well as our outlook regarding the prospects of the reporting units. Changes in these judgments may have a material effect on the estimated fair values, and, among other things, may cause us to realize a material impairment charge.
Leases - We are obligated under various lease agreements for certain restaurant facilities, classified as operating leases. Under the provisions of certain of our leases, there are rent holidays and/or escalations in payments over the base lease term, percentage rent, as well as options for renewal for additional periods. The effects of the rent holidays and escalations have been reflected in rent expense on a straight-line basis over the expected lease term, which includes option periods we are reasonably assured to exercise due to the fact that we would incur an economic penalty for not doing so. Generally, the lease term commences on the date when we become legally obligated for the rent payments or as specified in the lease agreement. Recognition of rent expense begins when we have the right to control the use of the leased property, which is typically before rent payments are due under the terms of most of our leases. Percentage rent expense is generally based upon sales levels and is accrued at the point in time we determine that it is probable that the sales levels will be achieved.
16
BENIHANA INC. AND SUBSIDIARIES
MANAGEMENT’S DISCUSSION AND ANALYSIS
Financial Condition and Results of Operations
Leasehold improvements are amortized on the straight-line method over the shorter of the estimated life of the asset or the same expected lease term used for lease accounting purposes. Leasehold improvements paid for by the lessor are recorded as leasehold improvements and deferred rent.
Judgments made by us related to the probable term for each restaurant’s lease affect the classification and accounting for a lease as capital or operating, the rent holidays and/or escalations in payments that are taken into consideration when calculating straight-line rent and the term over which leasehold improvements for each restaurant facility are amortized. These judgments may produce materially different amounts of depreciation, amortization and rent expense than would be reported if different lease term assumptions were used.
Self-Insurance - We are self-insured for certain losses, principally related to health and workers’ compensation, and we maintain stop loss coverage with third party insurers to limit our total exposure. The self-insurance liability represents an estimate of the ultimate cost of claims incurred and unpaid, both reported and unreported, as of the balance sheet date. We utilize estimates of expected losses, based on statistical analyses, to validate our self-insurance liability on a quarterly basis. Actual trends, including the severity or frequency of claims, may differ from our estimates, and may produce materially different amounts of reported expense.
Income Taxes - Accounting for our income taxes requires significant judgment in the calculation of our provision for income taxes and in the evaluation of our uncertain tax positions. We estimate certain components of our provision for income taxes, including, but not limited to, effective state and local income tax amounts, allowable tax credits for items such as FICA taxes paid on reported tip income and estimates related to depreciation expense allowable for tax purposes. Our estimates are made based on the best available information at the time that we prepare the provision. We use the asset and liability method, which requires the recognition of deferred tax assets and liabilities for the expected future tax consequences of events that have been included in the consolidated financial statements. Recognition of deferred tax assets is limited to amounts considered by us to be more likely than not of realization in future periods. Realization is dependent on generating sufficient taxable income. Although realization is not assured, we believe it is more likely than not that all of the deferred tax asset will be realized.
We usually file our income tax returns many months after our fiscal year-end. All tax returns are subject to audit by federal and state governments, usually years after the returns are filed, and could be subject to differing interpretations of the tax laws or our application of the laws to our business (see Note 14, Income Taxes, of the consolidated financial statements).
Although we believe we have adequately reserved for our uncertain tax positions, the ultimate outcome of these tax matters may differ from our expectations. To the extent that the final tax outcome of these matters is different than the amounts recorded, the differences will impact the provision for income taxes in the period in which the determination is made.
Stock-Based Compensation – Compensation costs related to share-based payments to employees, including grants of employee and director stock options, to be recognized in the financial statements based on their fair values. The amount of compensation cost will be measured based on the fair market value on the grant date. Compensation cost is recognized over the period that an employee provides service for that award, resulting in charges to earnings. We use the Black-Scholes option pricing model in measuring fair value, which requires the input of subjective assumptions. These assumptions include the risk-free interest rate, an expectation of the dividend yield, estimating the length of time employees will retain their vested stock options before exercising them (expected term), the volatility of our stock price over the expected term and the number of options that will ultimately not complete their vesting requirements (forfeitures). The use of different assumptions could produce a materially different estimate of stock-based compensation fair value and, consequently, the related amount of compensation expense recognized each period.
New Accounting Standards
For a description of the new accounting standards that may affect us, see Note 1, Summary of Significant Accounting Policies, of the consolidated financial statements.
17
BENIHANA INC. AND SUBSIDIARIES
MANAGEMENT’S DISCUSSION AND ANALYSIS
Financial Condition and Results of Operations
Forward looking statements
This annual report contains various “forward-looking statements” within the meaning of Section 27A of the Securities Act of 1933, as amended, and Section 21E of the Securities Exchange Act of 1934, as amended, that involve substantial risks and uncertainties. When used in this quarterly report and any documents incorporated by reference herein, the words “anticipate,” “believe,” “estimate,” “may,” “intend,” “expect” and similar expressions identify certain of such forward-looking statements. These forward-looking statements represent our expectations or beliefs concerning future events. Actual results, performance, or achievements could differ materially from those contemplated, expressed, or implied by the forward-looking statements contained herein as a result of a number of factors, either individually or in combination, including general economic conditions and disruptions in the global credit and equity markets, competition in the restaurant industry, ability to achieve expected results, changes in food and supply costs, increases in minimum wage, rising insurance costs, fluctuations in operating results, challenges to continued growth, access to sources of capital and the ability to raise capital, issuances of additional equity securities, ability to construct new restaurants within projected budgets and time periods, ability to renew existing leases on favorable terms, further deterioration in general economic conditions and high unemployment, availability of qualified employees, ability to implement our growth strategies, ability to retain key personnel, litigation, ability to comply with governmental regulations, changes in financial accounting standards, ability to establish, maintain and apply adequate internal control over financial reporting, effect of market forces on the price of our stock and other factors that we cannot presently foresee.
18
BENIHANA INC. AND SUBSIDIARIES
CONSOLIDATED FINANCIAL STATEMENTS
CONSOLIDATED BALANCE SHEETS
(In thousands, except share and per share information)
|
March 27,
|
March 28,
|
|||||||
|
2011
|
2010
|
|||||||
|
Assets
|
||||||||
|
Current Assets:
|
||||||||
|
Cash and cash equivalents
|
$ | 4,038 | $ | 2,558 | ||||
|
Receivables, net
|
2,207 | 1,929 | ||||||
|
Inventories
|
5,668 | 6,902 | ||||||
|
Income tax receivable
|
515 | 1,327 | ||||||
|
Prepaid expenses and other current assets
|
1,802 | 2,043 | ||||||
|
Investment securities, available for sale - restricted
|
619 | 608 | ||||||
|
Deferred income tax asset, net
|
322 | 340 | ||||||
|
Total current assets
|
15,171 | 15,707 | ||||||
|
Property and equipment, net
|
182,992 | 194,261 | ||||||
|
Goodwill
|
6,896 | 6,896 | ||||||
|
Deferred income tax asset, net
|
10,053 | 9,286 | ||||||
|
Other assets, net
|
5,770 | 7,940 | ||||||
|
Total assets
|
$ | 220,882 | $ | 234,090 | ||||
|
Liabilities, Convertible Preferred Stock and Stockholders’ Equity
|
||||||||
|
Current Liabilities:
|
||||||||
|
Accounts payable
|
$ | 8,121 | $ | 5,262 | ||||
|
Accrued expenses
|
25,346 | 23,617 | ||||||
|
Accrued put option liability
|
- | 4,100 | ||||||
|
Borrowings under line of credit
|
- | 22,410 | ||||||
|
Total current liabilities
|
33,467 | 55,389 | ||||||
|
Deferred obligations under operating leases
|
14,268 | 13,802 | ||||||
|
Borrowings under line of credit
|
5,689 | - | ||||||
|
Other long-term liabilities
|
1,025 | 1,560 | ||||||
|
Total liabilities
|
54,449 | 70,751 | ||||||
|
Commitments and Contingencies (Notes 7, 12 and 16)
|
||||||||
|
Convertible Preferred Stock - $1.00 par value; authorized - 5,000,000 shares;
|
||||||||
|
Series B mandatory redeemable convertible preferred stock – authorized –
|
||||||||
|
800,000 shares; issued and outstanding – 800,000 shares in 2011 and 2010,
|
||||||||
|
respectively, with a liquidation preference of $20 million plus accrued and
|
||||||||
|
unpaid dividends as of March 27, 2011 (Note 8)
|
19,710 | 19,623 | ||||||
|
Stockholders’ Equity:
|
||||||||
|
Common stock - $.10 par value; convertible into Class A common stock;
|
||||||||
|
authorized – 12,000,000 shares; issued and outstanding – 5,552,747
|
||||||||
|
and 5,647,780 shares, respectively
|
555 | 564 | ||||||
|
Class A common stock - $.10 par value; authorized – 32,500,000 shares;
|
||||||||
|
issued and outstanding – 10,552,378 and 9,768,611 shares, respectively
|
1,055 | 977 | ||||||
|
Additional paid-in capital
|
73,601 | 70,589 | ||||||
|
Retained earnings
|
71,849 | 71,598 | ||||||
|
Treasury stock, at cost - 46,667 and 0 shares, respectively
|
(383 | ) | - | |||||
|
Accumulated other comprehensive income (loss), net of tax
|
46 | (12 | ) | |||||
|
Total stockholders’ equity
|
146,723 | 143,716 | ||||||
|
Total liabilities, convertible preferred stock and stockholders’ equity
|
$ | 220,882 | $ | 234,090 | ||||
|
See accompanying notes to the consolidated financial statements.
|
||||||||
19
BENIHANA INC. AND SUBSIDIARIES
CONSOLIDATED FINANCIAL STATEMENTS
CONSOLIDATED STATEMENTS OF EARNINGS
(In thousands, except per share information)
|
Fiscal Year Ended
|
||||||||||||
|
|
March 27,
|
March 28,
|
March 29,
|
|||||||||
|
2011
|
2010
|
2009
|
||||||||||
|
Revenues
|
||||||||||||
|
Restaurant sales
|
$ | 325,921 | $ | 311,797 | $ | 303,868 | ||||||
|
Franchise fees and royalties
|
1,719 | 1,727 | 1,739 | |||||||||
|
Total revenues
|
327,640 | 313,524 | 305,607 | |||||||||
|
Costs and Expenses
|
||||||||||||
|
Cost of food and beverage sales
|
79,810 | 74,759 | 72,646 | |||||||||
|
Restaurant operating expenses
|
209,416 | 208,486 | 196,469 | |||||||||
|
Restaurant opening costs
|
8 | 1,045 | 2,165 | |||||||||
|
General and administrative expenses
|
36,373 | 24,625 | 22,742 | |||||||||
|
Impairment charges
|
- | 12,347 | 21,505 | |||||||||
|
Total operating expenses
|
325,607 | 321,262 | 315,527 | |||||||||
|
Income (loss) from operations
|
2,033 | (7,738 | ) | (9,920 | ) | |||||||
|
Interest expense, net
|
(1,368 | ) | (2,020 | ) | (848 | ) | ||||||
|
Income (loss) before income taxes
|
665 | (9,758 | ) | (10,768 | ) | |||||||
|
Income tax benefit
|
(670 | ) | (815 | ) | (5,703 | ) | ||||||
|
Net Income (Loss)
|
1,335 | (8,943 | ) | (5,065 | ) | |||||||
|
Less: accretion of preferred stock issuance costs and preferred
|
||||||||||||
|
stock dividends
|
1,084 | 1,085 | 1,087 | |||||||||
|
Net income (loss) attributable to common stockholders
|
$ | 251 | $ | (10,028 | ) | $ | (6,152 | ) | ||||
|
Earnings (Loss) Per Share
|
||||||||||||
|
Basic earnings (loss) per common share
|
$ | 0.02 | $ | (0.65 | ) | $ | (0.40 | ) | ||||
|
Diluted earnings (loss) per common share
|
$ | 0.02 | $ | (0.65 | ) | $ | (0.40 | ) | ||||
|
See accompanying notes to the consolidated financial statements.
|
||||||||||||
20
BENIHANA INC. AND SUBSIDIARIES
CONSOLIDATED FINANCIAL STATEMENTS
CONSOLIDATED STATEMENTS OF STOCKHOLDERS’ EQUITY
(In thousands, except share information)
|
Common
Stock |
Class A
Common Stock |
Additional
Paid-in Capital |
Retained
Earnings |
Treasury
Stock |
Accumulated
Other Comprehensive (Loss) Income, net of tax |
Total
Stockholders’ Equity |
||||||||||||||||||||||
|
Balance, March 30, 2008
|
$ | 623 | $ | 905 | $ | 68,342 | $ | 87,777 | $ | - | $ | (31 | ) | $ | 157,616 | |||||||||||||
|
Comprehensive loss:
|
||||||||||||||||||||||||||||
|
Net loss
|
(5,065 | ) | (5,065 | ) | ||||||||||||||||||||||||
|
Net increase in unrealized loss on investment securities available for sale, net of tax
|
(166 | ) | (166 | ) | ||||||||||||||||||||||||
|
Total comprehensive loss
|
(5,231 | ) | ||||||||||||||||||||||||||
|
Issuance of 5,750 shares of common stock and 11,500 shares of Class A common stock from exercise of options
|
1 | 1 | 76 | 78 | ||||||||||||||||||||||||
|
Conversion of 637,575 shares of common stock into 637,575 shares of Class A common stock
|
(64 | ) | 64 | - | ||||||||||||||||||||||||
|
Dividends declared on Series B preferred stock
|
(1,000 | ) | (1,000 | ) | ||||||||||||||||||||||||
|
Accretion of issuance costs on Series B preferred stock
|
(87 | ) | (87 | ) | ||||||||||||||||||||||||
|
Stock based compensation
|
1,043 | 1,043 | ||||||||||||||||||||||||||
|
Tax benefit from stock option exercises
|
18 | 18 | ||||||||||||||||||||||||||
|
Balance, March 29, 2009
|
560 | 970 | 69,479 | 81,625 | - | (197 | ) | 152,437 | ||||||||||||||||||||
|
Comprehensive loss:
|
||||||||||||||||||||||||||||
|
Net loss
|
(8,943 | ) | (8,943 | ) | ||||||||||||||||||||||||
|
Net decrease in unrealized loss on investment securities available for sale, net of tax
|
185 | 185 | ||||||||||||||||||||||||||
|
Total comprehensive loss
|
(8,758 | ) | ||||||||||||||||||||||||||
|
Issuance of 44,641 shares of common stock and 78,500 shares of Class A common stock from exercise of options
|
4 | 7 | 628 | 639 | ||||||||||||||||||||||||
|
Forfeiture of 3,400 shares of restricted Class A common stock
|
- | - | - | |||||||||||||||||||||||||
|
Dividends declared on Series B preferred stock
|
(997 | ) | (997 | ) | ||||||||||||||||||||||||
|
Accretion of issuance costs on Series B preferred stock
|
(87 | ) | (87 | ) | ||||||||||||||||||||||||
|
Stock based compensation
|
450 | 450 | ||||||||||||||||||||||||||
|
Tax benefit from stock option exercises
|
32 | 32 | ||||||||||||||||||||||||||
|
Balance, March 28, 2010
|
564 | 977 | 70,589 | 71,598 | - | (12 | ) | 143,716 | ||||||||||||||||||||
|
Comprehensive income:
|
||||||||||||||||||||||||||||
|
Net income
|
1,335 | 1,335 | ||||||||||||||||||||||||||
|
Net decrease in unrealized loss on investment securities available for sale, net of tax
|
58 | 58 | ||||||||||||||||||||||||||
|
Total comprehensive income
|
1,393 | |||||||||||||||||||||||||||
|
Issuance of 9,984 shares of common stock and 53,750 shares of Class A common stock from exercise of options
|
1 | 5 | 331 | 337 | ||||||||||||||||||||||||
|
Issuance of 625,000 shares of restricted Class A common stock
|
63 | (63 | ) | - | ||||||||||||||||||||||||
|
Conversion of 105,017 shares of common stock into 105,017 shares of Class A common stock
|
(10 | ) | 10 | - | ||||||||||||||||||||||||
|
Repurchase treasury stock - 46,667 shares Class A common stock
|
(383 | ) | (383 | ) | ||||||||||||||||||||||||
|
Dividends declared on Series B preferred stock
|
(997 | ) | (997 | ) | ||||||||||||||||||||||||
|
Accretion of issuance costs on Series B preferred stock
|
(87 | ) | (87 | ) | ||||||||||||||||||||||||
|
Stock based compensation
|
2,701 | 2,701 | ||||||||||||||||||||||||||
|
Tax benefit from stock option exercises
|
43 | 43 | ||||||||||||||||||||||||||
|
Balance, March 27, 2011
|
$ | 555 | $ | 1,055 | $ | 73,601 | $ | 71,849 | $ | (383 | ) | $ | 46 | $ | 146,723 | |||||||||||||
See accompanying notes to the consolidated financial statements.
21
BENIHANA INC. AND SUBSIDIARIES
CONSOLIDATED FINANCIAL STATEMENTS
CONSOLIDATED STATEMENTS OF CASH FLOWS
(In thousands)
|
Fiscal Year Ended
|
||||||||||||
|
March 27,
|
March 28,
|
March 29,
|
||||||||||
|
2011
|
2010
|
2009
|
||||||||||
|
Operating Activities:
|
||||||||||||
|
Net income (loss)
|
$ | 1,335 | $ | (8,943 | ) | $ | (5,065 | ) | ||||
|
Adjustments to reconcile net income (loss) to net cash provided by operating activities:
|
||||||||||||
|
Depreciation and amortization
|
21,602 | 20,085 | 18,650 | |||||||||
|
Amortization of deferred debt issuance costs
|
749 | 318 | 111 | |||||||||
|
Non-cash impairment charges
|
- | 12,347 | 21,505 | |||||||||
|
Deferred income taxes
|
(791 | ) | 865 | (9,423 | ) | |||||||
|
Stock-based compensation
|
2,701 | 450 | 1,043 | |||||||||
|
Tax benefit from stock option exercises
|
(43 | ) | (32 | ) | (18 | ) | ||||||
|
(Gain) loss on disposal of assets
|
(30 | ) | 30 | 24 | ||||||||
|
Write-off of abandoned projects
|
159 | - | - | |||||||||
|
Change in operating assets and liabilities that provided (used) cash:
|
||||||||||||
|
Receivables
|
(661 | ) | (270 | ) | 931 | |||||||
|
Inventories
|
1,234 | (373 | ) | (52 | ) | |||||||
|
Prepaid expenses and other current assets
|
241 | 560 | (567 | ) | ||||||||
|
Income taxes and other long-term liabilities
|
759 | (71 | ) | 2,086 | ||||||||
|
Other assets
|
199 | 506 | (190 | ) | ||||||||
|
Accounts payable
|
2,355 | 123 | 237 | |||||||||
|
Other long-term liabilities
|
(27 | ) | - | 1,614 | ||||||||
|
Accrued expenses and deferred obligations under operating leases
|
(2,271 | ) | 2,013 | 2,964 | ||||||||
|
Net cash provided by operating activities
|
27,511 | 27,608 | 33,850 | |||||||||
|
Investing Activities:
|
||||||||||||
|
Expenditures for property and equipment and computer software
|
(8,053 | ) | (17,174 | ) | (48,821 | ) | ||||||
|
Collection of insurance proceeds
|
- | 174 | 2,012 | |||||||||
|
Proceeds on sale of collateral underlying Monterey promissory note
|
- | - | 373 | |||||||||
|
Proceeds from sales (purchases) of investment securities, available for sale, net
|
89 | 338 | (94 | ) | ||||||||
|
Cash proceeds from disposal of property and equipment
|
43 | - | - | |||||||||
|
Net cash used in investing activities
|
(7,921 | ) | (16,662 | ) | (46,530 | ) | ||||||
|
Financing Activities:
|
||||||||||||
|
Borrowings on line of credit
|
104,817 | 99,946 | 112,535 | |||||||||
|
Repayments on line of credit
|
(121,531 | ) | (110,894 | ) | (96,606 | ) | ||||||
|
Debt issuance costs
|
(777 | ) | (757 | ) | (168 | ) | ||||||
|
Stock registration costs
|
- | (245 | ) | - | ||||||||
|
Dividends paid on Series B preferred stock
|
(999 | ) | (1,000 | ) | (1,004 | ) | ||||||
|
Proceeds from issuance of common and Class A common stock upon exercise of options
|
337 | 639 | 78 | |||||||||
|
Excess tax benefit from stock option exercises
|
43 | 32 | 18 | |||||||||
|
Net cash (used in) provided by financing activities
|
(18,110 | ) | (12,279 | ) | 14,853 | |||||||
|
Net increase (decrease) in cash and cash equivalents
|
1,480 | (1,333 | ) | 2,173 | ||||||||
|
Cash and cash equivalents, beginning of year
|
2,558 | 3,891 | 1,718 | |||||||||
|
Cash and cash equivalents, end of year
|
$ | 4,038 | $ | 2,558 | $ | 3,891 | ||||||
|
Supplemental Cash Flow Information
|
||||||||||||
|
Cash paid during the fiscal year for:
|
||||||||||||
|
Interest
|
$ | 958 | $ | 1,405 | $ | 801 | ||||||
|
Income taxes
|
527 | 875 | 1,304 | |||||||||
|
Noncash investing and financing activities
|
||||||||||||
|
Acquired property and equipment for which cash payments had not yet been made
|
$ | 783 | $ | 330 | $ | 5,867 | ||||||
|
Accrued but unpaid dividends on the Series B preferred stock
|
236 | 238 | 241 | |||||||||
|
Net decrease (increase) in unrealized loss on investment securities available for sale, net of tax
|
58 | 185 | (166 | ) | ||||||||
|
See accompanying notes to the consolidated financial statements.
|
||||||||||||
22
BENIHANA INC. AND SUBSIDIARIES
NOTES TO CONSOLIDATED FINANCIAL STATEMENTS (CONTINUED)
|
1.
|
SUMMARY OF SIGNIFICANT ACCOUNTING POLICIES
|
Operations - As of March 27, 2011, Benihana Inc., including our wholly-owned subsidiaries (“we,” “our” or “us”), owned and operated 63 Benihana teppanyaki restaurants, 25 RA Sushi restaurants and 9 Haru restaurants. We also had 20 franchised Benihana teppanyaki restaurants as of March 27, 2011. Benihana National Corp., our subsidiary, owns the right to operate, license and develop restaurants using the Benihana name and trademarks in the United States, Central and South America and the Caribbean islands. We also own the United States trademarks and worldwide development rights to the names “Haru” and “RA” and related trademarks.
Basis of Presentation - The consolidated financial statements include the assets, liabilities and results of operations of our wholly-owned subsidiaries. All intercompany accounts and transactions have been eliminated in consolidation.
Fiscal year - We have a 52/53-week fiscal year. Our fiscal year ends on the Sunday within the dates of March 26 through April 1. The fiscal year is divided into 13 four-week periods. Because of the odd number of periods, our first fiscal quarter consists of 4 periods totaling 16 weeks and each of the remaining three quarters consists of 3 periods totaling 12 weeks each. In the event of a 53-week year, the additional week is included in the fourth quarter of the fiscal year. This operating calendar provides us with a consistent number of operating days within each period as well as ensures that certain significant holidays occur consistently within the same fiscal quarters. Because of the differences in length of fiscal quarters, however, results of operations between the first quarter and the later quarters of a fiscal year are not comparable. Fiscal years 2011, 2010 and 2009 each consisted of 52 weeks.
Use of Estimates - The preparation of financial statements in conformity with accounting principles generally accepted in the United States of America (“generally accepted accounting principles”) requires that we make estimates and assumptions that affect the reported amounts of assets and liabilities at the date of the financial statements and the reported amounts of revenue and expenses during the reporting period. Actual amounts could differ from those estimates.
Cash and Cash Equivalents - We consider all highly liquid investment instruments purchased with an initial maturity of three months or less to be cash equivalents. Amounts receivable from third-party credit card processors of $4.5 million and $4.4 million as of March 27, 2011 and March 28, 2010, respectively, are also considered cash equivalents because they are both short-term and highly liquid in nature and are typically converted to cash within three days of the sales transaction.
Inventories - Inventories, which consist principally of restaurant operating supplies and food and beverage, are stated at the lower of cost (first-in, first-out method) or market.
Investment securities, available for sale - We maintain investments in certain publicly traded mutual funds that invest in debt and equity securities. We invest in these mutual funds to mirror and track the performance of the elections made by employees that participate in our deferred compensation plan. These investments are held in trust in accordance with the deferred compensation plan and are restricted for payment of plan expenses and benefits to the participants. These mutual fund investments are classified as available for sale and are carried at fair value with unrealized gains and losses reflected as a separate component of stockholders’ equity. These investments have no stated maturities.
Accounting for Long-Lived Assets - Property and equipment are stated at cost. We capitalize all direct costs incurred to construct restaurants. Upon opening, these costs are depreciated and charged to expense based upon their useful life classification. Rent expense incurred during the construction period is not capitalized but is charged to restaurant opening costs. The amount of interest capitalized in connection with restaurant construction was less than $0.1 million in each of fiscal years 2011 and 2010 and approximately $0.2 million in fiscal year 2009.
We periodically assess the potential impairment of long-lived assets whenever events or changes in circumstances indicate that the carrying value may not be recoverable. We consider a history of consistent and significant negative comparable restaurant sales, declining operating profit or operating losses to be primary indicators of potential asset impairment. Assets are grouped and evaluated for impairment at the lowest level for which there is identifiable cash flows, primarily at the individual restaurant level. When indicators of potential impairment are present, the carrying values of the assets are evaluated in relation to the operating performance and estimated future undiscounted cash flows of the underlying restaurant. If a forecast of undiscounted future operating cash flows directly related to the restaurant is less than the carrying amount of the restaurant’s long-lived assets, the carrying amount is compared to fair value. An impairment loss is measured as the amount by which the carrying amount of the restaurant’s long-lived assets exceeds its fair value, and the charge is taken against results of operations. Fair value is an estimate based on a net present value model, which discounts projected free cash flows at a computed weighted average cost of capital as the discount rate. The projected free cash flows used in calculating estimated fair value involve a significant amount of judgment and include our best estimates of expected future comparable sales and operating performance for each restaurant.
As further discussed in Note 11, Impairment Charges, of the consolidated financial statements, we recorded an impairment charge of $1.2 million ($0.7 million after-tax) and $9.6 million ($5.7 million after-tax) during fiscal years 2010 and 2009, respectively, related to the write-down of property and equipment to estimated fair value at certain of our restaurants.
23
BENIHANA INC. AND SUBSIDIARIES
NOTES TO CONSOLIDATED FINANCIAL STATEMENTS (CONTINUED)
Accounting for Goodwill and Intangibles - Goodwill consists of the cost of an acquired business in excess of the fair value of net assets acquired, using the purchase method of accounting. Goodwill and other intangible assets deemed to have indefinite lives are not amortized and are subject to annual impairment tests. Intangible assets deemed to have definite lives are amortized over their estimated useful lives.
We review goodwill and other indefinite-lived intangible assets annually for impairment or more frequently if indicators of impairment exist. The goodwill impairment test involves a two-step process. The first step is a comparison of each reporting unit’s fair value to its carrying value. If the carrying value of the reporting unit is greater than its fair value, there is an indication that impairment may exist, and the second step must be performed to measure the amount of impairment loss. The purpose of the second step is only to determine the amount of goodwill that should be recorded on the balance sheet. We evaluate goodwill at the reporting unit level using an estimation of fair value based upon (1) an analysis of discounted cash flow projections (income approach) and (2) an analysis of cash flows of the reporting unit using market-derived earnings multiples of similar restaurant businesses that were bought and sold within a reasonable time frame to our own evaluation (market approach). The second step, if required, involves an analysis reflecting the allocation of fair value determined in the first step (as if it was the purchase price in a business combination). If the calculated fair value of the goodwill resulting from this allocation is lower than the carrying value of the goodwill in the reporting unit, the difference is reflected as a non-cash impairment loss. The recorded amounts of other items on the balance sheet are not adjusted.
As further discussed in Note 11, Impairment Charges, of the consolidated financial statements, during fiscal years 2010 and 2009, we recorded impairment charges of $11.1 million ($7.3 million after-tax) and $11.9 million ($7.0 million after-tax), respectively, related to the write-down of goodwill allocated to the Benihana and RA Sushi reporting units to their implied fair value as determined by step two of the goodwill impairment test.
The costs of purchasing transferable liquor licenses through open markets in jurisdictions with a limited number of authorized liquor licenses are capitalized as indefinite lived intangible assets and included in other assets in the accompanying consolidated balance sheets. We review premiums on liquor licenses for impairment annually or more frequently if impairment indicators exist. We performed our assessment for possible impairment during fiscal years 2011, 2010 and 2009 and no impairment charges resulted from the impairment tests.
Other intangible assets include lease acquisition costs, computer software costs obtained for internal use and reacquired franchise rights. These intangible assets are classified as other assets, net in the accompanying consolidated balance sheets. Lease acquisition costs are amortized over the remaining life of the acquired lease. Capitalized computer software costs were amortized over three years. Reacquired franchise rights are amortized over the remaining term of purchased rights. Amortization of intangibles totaled $2.7 million, $1.3 million and $0.6 million during fiscal years 2011, 2010 and 2009, respectively.
Estimated amortization expense over the estimated remaining life of intangible assets is as follows (in thousands):
|
Fiscal year:
|
||||
|
2012
|
$ | 548 | ||
|
2013
|
535 | |||
|
2014
|
498 | |||
|
2015
|
116 | |||
|
2016
|
79 | |||
|
Thereafter
|
109 | |||
|
Total
|
$ | 1,885 | ||
Self-Insurance - We are self-insured for certain losses, principally related to health and workers’ compensation, and we maintain stop loss coverage with third party insurers to limit our total exposure. The self-insurance liability represents an estimate of the ultimate cost of claims incurred and unpaid, both reported and unreported, as of the balance sheet date. We utilize estimates of expected losses, based on statistical analyses, to validate our self-insurance liability on a quarterly basis.
Revenue Recognition - Revenues from food and beverage sales are recognized as products are sold. We sell gift cards to guests in our restaurants and through our websites. Proceeds from the sale of gift cards are deferred until the revenue recognition criteria have been met, generally upon redemption. Gift card breakage is recorded when the likelihood of the redemption of the gift cards becomes remote, which is based on historical redemption patterns. Initial franchise fees are recorded as income when substantially all of our material obligations under the franchise agreement are satisfied, which generally coincides with the opening of the franchised restaurants. Continuing royalties, which are based upon a percentage of each franchised restaurant’s gross revenues, are recognized as income when earned. Sales taxes collected from guests and remitted to governmental authorities are presented on a net basis within sales in our consolidated statements of earnings.
24
BENIHANA INC. AND SUBSIDIARIES
NOTES TO CONSOLIDATED FINANCIAL STATEMENTS (CONTINUED)
Accounting for Leases - Rent expense for our operating leases, which generally have escalating rentals over the term of the lease, is recorded on a straight-line basis over the lease term. Generally, the lease term commences on the date when we become legally obligated for the rent payments or as specified in the lease agreement. Recognition of rent expense begins when we have the right to control the use of the leased property, which is typically before rent payments are due under the terms of most of our leases. The difference between rent expense and rent paid is recorded as a deferred rent obligation and is included in the accompanying consolidated balance sheets. Percentage rent expense is generally based upon sales levels and is accrued at the point in time we determine that it is probable that the sales levels will be achieved. Leasehold improvements are amortized on the straight-line method over the shorter of the estimated life of the asset or the same expected lease term used for lease accounting purposes. Leasehold improvements paid for by the lessor are recorded as leasehold improvements and deferred rent.
Depreciation and Amortization - Depreciation and amortization are computed by the straight-line method over the estimated useful life (buildings - 30 years; restaurant furniture, fixtures and equipment - 8 years; office equipment - 8 years; personal computers, software and related equipment - 3 years; and leasehold improvements - lesser of the expected lease term used for lease accounting purposes or their useful lives). Depreciation expense associated with property and equipment totaled $19.6 million, $19.1 million and $18.1 million for fiscal years 2011, 2010 and 2009, respectively. During fiscal year 2009, we recognized incremental depreciation expense of $0.4 million related to our review of the estimated useful lives of assets for Benihana teppanyaki restaurants scheduled to be remodeled as part of our renovation program. No such additional expense was incurred in either of fiscal years 2011 or 2010.
Restaurant Opening Costs - Restaurant opening costs include costs to recruit and train hourly restaurant employees, wages, travel and lodging costs for our opening training team and other support employees, costs for practice service activities and straight-line minimum base rent during the restaurant preopening period for accounting purposes. We expense restaurant opening costs as incurred.
Advertising - Advertising costs are expensed as incurred. Advertising costs were $6.8 million, $6.9 million and $7.8 million in fiscal years 2011, 2010 and 2009, respectively, and are included in restaurant operating expenses in the accompanying consolidated statements of earnings.
Stock-Based Compensation - Compensation costs related to share-based payments to employees, including grants of employee and director stock options, are recognized in the financial statements based on their fair values. The amount of compensation cost will be measured based on the fair market value on the grant date. Compensation cost is recognized over the period that an employee provides service for that award, resulting in charges to earnings. We use the Black-Scholes option pricing model in measuring fair value, which requires the input of subjective assumptions. These assumptions include the risk-free interest rate, an expectation of the dividend yield, estimating the length of time employees will retain their vested stock options before exercising them (expected term), the volatility of our stock price over the expected term and the number of options that will ultimately not complete their vesting requirements (forfeitures). The following summarizes assumptions used in estimating the fair value of option grants:
|
Fiscal Year
|
||||||||||||
|
2011
|
2010
|
2009
|
||||||||||
|
Risk free interest rate
|
2.7 | % | 3.9 | % | 3.4% - 3.7 | % | ||||||
|
Expected dividend yield
|
- | - | - | |||||||||
|
Expected term
|
3 years
|
3 years
|
3 years
|
|||||||||
|
Expected volatility
|
78.6 | % | 74.6 | % | 51.0% - 65.4 | % | ||||||
The risk-free interest rate is based on the U.S. Treasury yield curve in effect at the time of grant for the expected term of the option. The expected dividend yield is based on our history and expectation of dividend payments. The expected term is based on the period of time the options are expected to be outstanding. The volatility factor is based on historical monthly price observations of the underlying shares over the expected term of the option as we have no reason to believe that future volatility over the expected term is likely to differ from historical volatility. Forfeitures are expected not to be significant.
Tax benefits related to equity award grants that are in excess of the tax benefits recorded on our consolidated statements of earnings are classified as a cash inflow in the financing section of the accompanying consolidated statements of cash flows.
25
BENIHANA INC. AND SUBSIDIARIES
NOTES TO CONSOLIDATED FINANCIAL STATEMENTS (CONTINUED)
Earnings (Loss) Per Share – Basic earnings (loss) per common share is computed by dividing net income (loss) attributable to common stockholders by the weighted average number of common shares outstanding during each period. The diluted earnings (loss) per common share computation includes dilutive common share equivalents issued under our various stock option plans and conversion rights of Series B preferred stock. The components used in the computation of basic earnings (loss) per share and diluted earnings (loss) per share for each fiscal year are shown below (in thousands):
|
March 27,
|
March 28,
|
March 29,
|
||||||||||
|
2011
|
2010
|
2009
|
||||||||||
|
Net income (loss)
|
$ | 1,335 | $ | (8,943 | ) | $ | (5,065 | ) | ||||
|
Less: Accretion of preferred stock issuance costs and preferred stock dividends
|
(1,084 | ) | (1,085 | ) | (1,087 | ) | ||||||
|
Income (loss) for computation of basic earnings (loss) per share
|
251 | (10,028 | ) | (6,152 | ) | |||||||
|
Add: Accretion of preferred stock issuance costs and preferred stock dividends (Note 8)
|
- | - | - | |||||||||
|
Earnings (loss) for computation of diluted earnings (loss) per share
|
$ | 251 | $ | (10,028 | ) | $ | (6,152 | ) | ||||
|
Weighted average number of common shares in basic earnings (loss) per share
|
15,581 | 15,388 | 15,289 | |||||||||
|
Effect of dilutive securities:
|
||||||||||||
|
Stock options and warrants
|
31 | - | - | |||||||||
|
Convertible preferred shares
|
- | - | - | |||||||||
|
Weighted average number of common shares and dilutive potential common shares used in diluted earnings (loss) per share
|
15,612 | 15,388 | 15,289 | |||||||||
Due to the net loss attributable to common stockholders for fiscal years 2010 and 2009, all potentially dilutive shares were excluded from the denominator of the earnings per share calculation as including such shares would have been anti-dilutive. Similarly, the numerator was not adjusted to add back any preferred stock issuance costs or preferred stock dividends as including such amounts would have been anti-dilutive. During fiscal years 2011, 2010 and 2009, stock options to purchase 0.7 million, 1.0 million and 1.6 million shares of common stock, respectively, were excluded from the calculation of diluted earnings per share due to their anti-dilutive effect.
Convertible preferred stock shall be assumed to have been converted at the beginning of the period and the resulting common shares shall be included in the denominator of diluted EPS. In applying the if-converted method, conversion shall not be assumed for purposes of computing diluted EPS if the effect would be anti-dilutive. Convertible preferred stock is anti-dilutive whenever the amount of the dividend declared in or accumulated for the current period per common share obtainable upon conversion exceeds basic EPS. For fiscal years 2011 and 2010, conversion of the Series B preferred stock of 2.5 million and 3.2 million shares, respectively, was excluded from the calculations of diluted earnings per share due to its anti-dilutive effect.
Income Taxes - We provide for federal and state income taxes currently payable as well as for those deferred because of temporary differences between reporting income and expenses for financial statement purposes versus tax purposes. We use the asset and liability method, which requires the recognition of deferred tax assets and liabilities for the expected future tax consequences of events that have been included in the consolidated financial statements. Deferred tax assets and liabilities are measured using enacted tax rates expected to apply in the years in which those temporary differences are expected to be recovered or settled. Recognition of deferred tax assets is limited to amounts considered by us to be more likely than not of realization in future periods.
A tax benefit claimed or expected to be claimed on a tax return is recorded from an uncertain tax position only if it is more likely than not that the tax position will be sustained on examination by the taxing authorities, based on the technical merits of the position. The tax benefits recognized in the financial statements from such a position are measured based on the largest amount of benefit that is greater than 50% likely of being realized upon ultimate settlement with a taxing authority.
Other Comprehensive Income (Loss) - For fiscal years 2011, 2010 and 2009, the only component of other comprehensive income (loss) is the net unrealized gains (losses) on our investments classified as available for sale.
Segment Reporting - Operating segments, as defined, are components of an enterprise about which separate financial information is available that is evaluated regularly by the chief operating decision maker in deciding how to allocate resources and in assessing performance. We have determined that our reportable segments are those that are based on our methods of internal reporting and management structure, which is based upon our restaurant concepts. Accordingly, our reportable segments are based on restaurant concept.
There were no material amounts of revenues or transfers between reportable segments. Revenues from external guests are derived principally from food and beverage sales. We do not rely on any major guests as a source of revenue. For each of fiscal years 2011, 2010 and 2009, franchise revenues attributed to foreign countries totaled approximately $0.4 million.
Reclassification - Certain amounts in the years ended March 28, 2010 and March 29, 2009 have been reclassified to allocate certain marketing expenses as restaurant operating expenses. These marketing expenses were previously reflected as general and administrative expenses. Management believes that this new presentation provides better comparison to our competitors. We reclassified $6.6 million and $7.5 million for the years ended March 28, 2010 and March 29, 2009, respectively.
26
BENIHANA INC. AND SUBSIDIARIES
NOTES TO CONSOLIDATED FINANCIAL STATEMENTS (CONTINUED)
Recently Issued Accounting Standards - In December 2010, the Financial Accounting Standards Board (“FASB”) issued authoritative guidance which modifies the requirements of Step 1 of the goodwill impairment test for reporting units with zero or negative carrying amounts. This guidance is effective for fiscal years beginning after December 15, 2010, and we anticipate that it will not have a material impact on our consolidated financial position or results of operations.
In January 2010, the FASB issued Accounting Standards Update (“ASU”) 2010-06 (“ASU 2010-06”) which requires new disclosures regarding recurring or nonrecurring fair value measurements. Under the ASU, entities will be required to separately disclose significant transfers into and out of Level 1 and Level 2 measurements in the fair value hierarchy and describe the reasons for the transfers. Entities will also be required to provide information on purchases, sales, issuances and settlements on a gross basis in the reconciliation of Level 3 fair value measurements. In addition, entities must provide fair value measurement disclosures for each class of assets and liabilities. Entities must also provide disclosures about the valuation techniques used in determining fair value for Level 2 or Level 3 measurements. Our adoption of this ASU on March 29, 2010 did not have a material impact on our consolidated financial statements.
In June 2009, the FASB updated Accounting Standards Codification (“ASC”) Topic 810 (“ASC 810”), “Consolidation” (previously Statement of Financial Accounting Standards (“SFAS”) No. 167) which amended certain guidance contained in FASB Interpretation No. 46(R) “Consolidation of Variable Interest Entities” for determining whether an entity is a variable interest entity and modified the methods allowed for determining the primary beneficiary of a variable interest entity. The amendments include: (1) the elimination of the exemption for qualifying special purpose entities, (2) a new approach for determining when an entity should consolidate a variable interest entity, and (3) changes relating to the required timing for reassessing when an entity should consolidate a variable interest entity. Our adoption of the provisions of ASC 810 on March 29, 2010 did not have a material impact on our consolidated financial statements.
|
2.
|
INVENTORIES
|
Inventories consist of (in thousands):
|
March 27,
|
March 28,
|
|||||||
|
2011
|
2010
|
|||||||
|
Food and beverage
|
$ | 2,889 | $ | 2,794 | ||||
|
Supplies
|
2,779 | 4,108 | ||||||
| $ | 5,668 | $ | 6,902 | |||||
|
3.
|
FAIR VALUE OF FINANCIAL INSTRUMENTS
|
The carrying amounts of cash and cash equivalents, receivables, accounts payable and accrued liabilities approximate fair value due to the short-term nature of the items as of March 27, 2011 and March 28, 2010. We believe the carrying amount of our debt at March 27, 2011 and March 28, 2010 approximate fair value due to the variable rates associated with the debt instrument and the recent amendments to our line of credit agreement (refer to Note 7, Long-term Debt).
As of March 27, 2011 and March 28, 2010, we had certain publicly traded mutual funds that invest in debt and equity securities that are required to be measured at fair value on a recurring basis. We invest in these mutual funds to mirror and track the performance of the elections made by employees that participate in our deferred compensation plan. These mutual fund investments are classified as available for sale and are carried at fair value with unrealized gains and losses reflected as a separate component of stockholders’ equity. We determined the fair value of our investment securities available for sale using quoted market prices (Level 1 in the fair value hierarchy).
The following table discloses, as of March 27, 2011 and March 28, 2010, our available for sale investment securities at both the cost basis and fair value by investment type. None of our available for sale investment securities was at a net loss position as of March 27, 2011 or March 28, 2010.
27
BENIHANA INC. AND SUBSIDIARIES
NOTES TO CONSOLIDATED FINANCIAL STATEMENTS (CONTINUED)
|
March 27, 2011
|
March 28, 2010
|
|||||||||||||||
|
Cost
|
Fair value
|
Cost
|
Fair value
|
|||||||||||||
|
Equity securities
|
$ | 360 | $ | 439 | $ | 382 | $ | 402 | ||||||||
|
Fixed income securities
|
65 | 67 | 86 | 86 | ||||||||||||
|
Money market fund deposits
|
113 | 113 | 120 | 120 | ||||||||||||
| $ | 538 | $ | 619 | $ | 588 | $ | 608 | |||||||||
We periodically evaluate unrealized losses in our available for sale investment securities for other-than-temporary impairment using both qualitative and quantitative criteria and, as of March 27, 2011 and March 28, 2010, determined that there was no other-than-temporary impairment.
Fair value measurements of nonfinancial assets and nonfinancial liabilities are primarily used in the valuation of our reporting units for the purpose of assessing goodwill impairment and the valuation of property and equipment when assessing long-lived asset impairment. None of our nonfinancial assets or nonfinancial liabilities was measured at fair value as of March 27, 2011 or March 28, 2010.
During the year ended March 28, 2010, in connection with the valuation of our reporting units for the purpose of assessing goodwill impairment and the valuation of property and equipment when assessing long-lived asset impairment, we recorded impairment charges totaling $12.3 million to write down the Benihana teppanyaki reporting unit’s goodwill and certain restaurants’ property and equipment to fair value using unobservable inputs (level 3 measurements). Refer to Note 11, Impairment Charges, for the reasons for the measurements, description of the inputs and information used to develop the inputs.
|
4.
|
PROPERTY AND EQUIPMENT
|
Property and equipment, net consists of (in thousands):
|
March 27,
|
March 28,
|
|||||||
|
2011
|
2010
|
|||||||
|
Land
|
$ | 14,414 | $ | 14,414 | ||||
|
Buildings
|
43,813 | 41,487 | ||||||
|
Leasehold improvements
|
190,066 | 188,432 | ||||||
|
Restaurant furniture, fixtures and equipment
|
52,612 | 51,836 | ||||||
| 300,905 | 296,169 | |||||||
|
Less: Accumulated depreciation and amortization
|
118,784 | 102,836 | ||||||
| 182,121 | 193,333 | |||||||
|
Construction in progress
|
871 | 928 | ||||||
| $ | 182,992 | $ | 194,261 | |||||
In fiscal year 2011, we wrote off of $3.7 million of fully depreciated assets.
28
BENIHANA INC. AND SUBSIDIARIES
NOTES TO CONSOLIDATED FINANCIAL STATEMENTS (CONTINUED)
|
5.
|
OTHER ASSETS
|
Other assets, net consist of (in thousands):
|
March 27,
|
March 28,
|
|||||||
|
2011
|
2010
|
|||||||
|
Security deposits
|
$ | 1,874 | $ | 2,444 | ||||
|
Premium on liquor licenses
|
1,860 | 1,983 | ||||||
|
Capitalized computer software, net of accumulated amortization of $838 as of March 28, 2010
|
- | 1,222 | ||||||
|
Lease acquisition costs, net of accumulated amortization of $1,798 and $1,619, respectively
|
583 | 762 | ||||||
|
Reacquired franchise rights, net of accumulated amortization of $340 and $265, respectively
|
483 | 558 | ||||||
|
Other, net of accumulated amortization of $1,998 and $2,354, respectively
|
970 | 971 | ||||||
| $ | 5,770 | $ | 7,940 | |||||
|
6.
|
ACCRUED EXPENSES
|
Accrued expenses consist of (in thousands):
|
March 27,
|
March 28,
|
|||||||
|
2011
|
2010
|
|||||||
|
Accrued payroll, incentive compensation and related taxes
|
$ | 7,131 | $ | 6,395 | ||||
|
Unredeemed gift cards and certificates
|
2,942 | 3,359 | ||||||
|
Accrued workers compensation claims
|
2,998 | 3,193 | ||||||
|
Sales taxes payable
|
2,017 | 1,767 | ||||||
|
Accrued retirement and severance obligation
|
384 | 820 | ||||||
|
Accrued percentage rent
|
1,350 | 1,590 | ||||||
|
Other accrued liabilities
|
8,524 | 6,493 | ||||||
| $ | 25,346 | $ | 23,617 | |||||
|
7.
|
LONG-TERM DEBT
|
We entered into an Amended and Restated Credit Agreement with Wells Fargo (as successor by merger to Wachovia Bank, National Association) on February 10, 2011. The credit facility provides us a borrowing capacity of $30.0 million, with an option to increase the principal amount of the credit facility by $5.0 million to $35.0 million, subject to certain conditions. The credit facility is scheduled to mature on February 10, 2014. The credit facility is secured by the assets of the Company. There are no scheduled principal payments prior to maturity. The Company may, however, prepay outstanding borrowings prior to that date without penalty. The line of credit provides for an initial commitment fee of 0.5% on the unused portion of the loan commitment and a variable interest rate. Both the commitment fee and the interest rate adjust based on a leverage ratio, as defined by the amended and restated agreement. While providing for working capital, capital expenditures and general corporate purposes, the amended and restated agreement requires that the Company maintains certain financial ratios and profitability amounts and restricts the amount of cash dividends paid and stock repurchases of the Company, as well as acquisitions and other investments.
At March 27, 2011, we had $5.7 million of borrowings outstanding under the line of credit at an interest rate of 6.5%. Our borrowing capacity under the line of credit is also reduced on a dollar-for-dollar basis by the cumulative amount of any outstanding letters of credit, which totaled $1.2 million at March 27, 2011, resulting in an available borrowing balance of $23.1 million. As of March 27, 2011, we were in compliance with the financial covenants of the amended and restated agreement governing the line of credit.
|
8.
|
CONVERTIBLE PREFERRED STOCK
|
On July 1, 2004, we received net proceeds of $9.3 million, after transaction costs, representing the funding of the first $10.0 million tranche of the sale of $20.0 million aggregate principal amount of Series B Convertible Preferred Stock (“Series B preferred stock”) to BFC Financial Corporation (“BFC”). In connection with the first tranche, we issued and sold 0.4 million shares of our Series B preferred stock. On August 4, 2005, we completed the second and final tranche consisting of $10.0 million aggregate principal amount of our Series B preferred stock sold to BFC. In connection with the second tranche, we issued and sold 0.4 million shares of our Series B preferred stock. We received net proceeds of $9.9 million, after transaction costs, from the sale. John E. Abdo, a director, is also a director and Vice Chairman of the Board of BFC and is a significant shareholder of BFC. Alan B. Levan, who became a director after the end of fiscal year 2009, is Chairman, Chief Executive Officer and President, as well as a significant shareholder, of BFC.
29
BENIHANA INC. AND SUBSIDIARIES
NOTES TO CONSOLIDATED FINANCIAL STATEMENTS (CONTINUED)
The 800,000 shares of Series B preferred stock outstanding at March 28, 2010 are convertible into an aggregate 1.6 million shares of common stock and has a liquidation preference of $20.0 million, or $25.00 per share, (subject to anti-dilution provisions) plus accrued and unpaid dividends. The Series B preferred stock is convertible into our common stock at a conversion price of approximately $12.67 per share (as adjusted, to reflect the three-for-two stock split) that equates to 1.97 shares of common stock for each share of Series B preferred stock (subject to anti-dilution provisions). The Series B preferred stock carries a dividend at the annual rate of $1.25 per share (or 5% of the purchase price) payable in cash or additional Series B preferred stock, and votes on an “as if converted” basis together with the common stockholders on all matters put to a vote of the holders of common stock. In addition, under certain circumstances, the approval of a majority of the Series B preferred stock is required for certain events outside the ordinary course of business, principally acquisitions or disposition of assets having a value in excess of 25% of our total consolidated assets.
We pay quarterly dividends on the Series B preferred stock, and at March 27, 2011, accrued but unpaid dividends totaled $0.2 million, or $0.30 per share, of the Series B preferred stock.
Since the Series B preferred stock is convertible into common stock at a conversion price of approximately $12.67 per share (as adjusted to reflect the three-for-two stock split) and the common stock was trading at approximately $13.33 per share (as adjusted to reflect the three-for-two stock split) on August 4, 2005 when the second tranche was completed, a deemed dividend was recognized on the beneficial conversion feature, in connection with the second tranche, totaling $0.5 million. The deemed dividend will not result in any cash payments to the holders of the Series B preferred stock.
We are obligated to redeem the Series B preferred stock at its original issue price on July 2, 2014, which date may be extended by the holders of a majority of the then-outstanding shares of Series B preferred stock to a date no later than July 2, 2024. We may pay the redemption in cash or, at our option, in shares of common stock valued at then-current market prices unless the aggregate market value of our common stock and any other common equity is below $75.0 million. In addition, the Series B preferred stock may, at our option, be redeemed in cash at any time beginning three years from the date of issue if the volume-weighted average price of the common stock exceeds approximately $25.33 per share (as adjusted to reflect the three-for-two stock split) for sixty consecutive trading days.
Pursuant to the agreement under which BFC purchased the Series B preferred stock, BFC is entitled to elect one individual to our board of directors but has waived such right so long as either John E. Abdo or Alan B. Levan have been otherwise elected to our board. Additionally, in the event that dividends are not paid for two consecutive quarters, BFC is entitled to elect one additional director but has waived such right so long as both John E. Abdo and Alan B. Levan have been otherwise elected to our board.
The conversion option of the Series B preferred stock is not a derivative liability that must be fair valued.
On May 20, 2011, BFC exercised the right to convert 200,000 of its 800,000 shares of Series B preferred stock. These 200,000 shares of Series B preferred stock plus the accrued but unpaid dividends were converted into 397,328 shares of common stock.
|
9.
|
STOCKHOLDERS’ EQUITY
|
Common and Class A Common Stock – Our common stock is convertible into Class A common stock on a one-for-one basis. The Class A common stock is identical to the common stock except that it gives the holder one-tenth (1/10) vote per share, voting together with our common stock as a single class on all matters except the election of directors. For election of directors, the Class A common stockholders vote as a class to elect 25% of the members of the board of directors.
On November 24, 2009, we filed a Registration Statement on Form S-3 under the Securities Act of 1933. The Registration Statement on Form S-3 covers the sale of an indeterminate amount of our Class A common stock, common stock, preferred stock, debt securities and subscription rights for an aggregate initial offering price totaling approximately $30.0 million.
On February 23, 2010, our shareholders approved Agreement and Plan of Merger by and between Benihana Inc. and its wholly-owned subsidiary BHI Mergersub, Inc., pursuant to which such subsidiary would merge with and into the Company. The sole purpose of this transaction was to effect an amendment to our certificate of incorporation to increase the number of shares of Class A common stock which we are authorized to issue by 12,500,000. Our certificate of incorporation was amended to reflect the share increase. No determination has been made to offer any securities nor has any determination been made as to the specific uses of proceeds if such securities were to be offered and sold.
Stock Rights – We have a shareholder rights plan, as amended on January 31, 2007 and May 18, 2007, under which a preferred share purchase right is represented by outstanding shares of our common stock and Class A common stock. The preferred share purchase rights operate to create substantial dilution to a potential acquirer who seeks to make an acquisition, the terms of which our board of directors believes is inadequate or structured in a coercive manner.
30
BENIHANA INC. AND SUBSIDIARIES
NOTES TO CONSOLIDATED FINANCIAL STATEMENTS (CONTINUED)
The preferred share purchase rights become exercisable on the tenth day (or a later date as the board of directors may determine) after public announcement that a person or a group (subject to certain exceptions) has acquired 20% or more of the outstanding common stock or an announcement of a tender offer that would result in beneficial ownership by a person or a group of 20% or more of the common stock.
The shareholder rights plan was further amended on January 24, 2011 to, among other things, extend the final expiration date from February 2, 2011 to February 2, 2015, and to adjust the purchase price payable for each preferred share purchase right. The shareholder rights plan was again amended on May 13, 2011 to expire automatically when and if a reclassification of the Class A Common Stock becomes effective (see Note 21, Other Matters).
|
10.
|
RESTAURANT OPERATING EXPENSES
|
Restaurant operating expenses are those costs that are directly attributed to the operation of individual restaurant locations and consist of (in thousands):
|
Fiscal Year Ended
|
||||||||||||
|
March 27,
|
March 28,
|
March 29,
|
||||||||||
|
2011
|
2010
|
2009
|
||||||||||
|
Labor and related costs
|
$ | 107,096 | $ | 107,798 | $ | 104,174 | ||||||
|
Occupancy costs
|
21,451 | 20,944 | 19,727 | |||||||||
|
Depreciation and amortization
|
19,600 | 19,088 | 18,121 | |||||||||
|
Utilities and telephone
|
10,666 | 10,264 | 10,017 | |||||||||
|
Restaurant supplies
|
8,291 | 8,549 | 7,339 | |||||||||
|
Advertising and promotional costs
|
12,199 | 10,853 | 10,611 | |||||||||
|
Credit card discounts
|
6,445 | 6,001 | 5,787 | |||||||||
|
Other restaurant operating expenses
|
23,668 | 24,989 | 20,693 | |||||||||
|
Total restaurant operating expenses
|
$ | 209,416 | $ | 208,486 | $ | 196,469 | ||||||
|
11.
|
IMPAIRMENT CHARGES
|
As discussed in Note 1, Summary of Significant Accounting Policies, we periodically assess the potential impairment of long-lived assets whenever events or changes in circumstances indicate that the carrying value may not be recoverable. As a result of a prolonged economic downturn and its resulting impact on our expectation of future cash flows, we determined that a change in circumstances had occurred and the carrying value of certain of our property and equipment may not be recoverable. During fiscal year 2009, the results of our analysis indicated that the property and equipment were impaired at five restaurants: Benihana Tucson, RA Sushi Corona, RA Sushi Glenview, RA Sushi Palm Beach Gardens and Haru Philadelphia. Accordingly, we recognized an impairment charge of $9.6 million ($5.7 million after-tax) to write-down the restaurants’ property and equipment to estimated fair value. During fiscal year 2010, our analysis resulted in an additional write-down of property and equipment of $1.2 million ($0.7 million after tax) at our Benihana Tucson, RA Sushi Palm Beach Gardens and Haru Philadelphia locations, all of which is classified as impairment charges in the accompanying consolidated statement of earnings. No such impairment charges were recorded during fiscal year 2011.
Additionally, as discussed in Note 1, Summary of Significant Accounting Policies, we review goodwill and other indefinite-lived intangible assets annually for impairment, or more frequently if indicators of impairment exist. Based on the results of step one of the fiscal year 2010 impairment test, the Haru reporting unit’s estimated fair value exceeded its carrying value; therefore, no impairment charges to goodwill for this reporting unit was recognized. Based on the results of step one of the impairment test, the Benihana reporting unit’s estimated fair value did not exceed its carrying value, which required us to perform the second step of the goodwill impairment test. The second step of the goodwill impairment test indicated that all of the goodwill allocated to the Benihana reporting unit was impaired primarily due to depressed economic and industry factors at the valuation date and the step two purchase price allocations where a considerable amount of the Benihana reporting unit’s fair value was allocated to the Benihana trade name. Therefore, during fiscal year 2010, we recorded a non-cash goodwill impairment charge of $11.1 million ($7.3 million after-tax) to fully impair our Benihana reporting unit. During fiscal year 2009 and based upon the results of our analysis, our RA Sushi reporting unit was fully-impaired resulting in the recognition of a non-cash goodwill impairment charge of $11.9 million ($7.0 million after-tax), all of which is classified as impairment charges in the accompanying consolidated statement of earnings. No impairment charge was recorded in fiscal year 2011.
31
BENIHANA INC. AND SUBSIDIARIES
NOTES TO CONSOLIDATED FINANCIAL STATEMENTS (CONTINUED)
The following table reflects the changes in the carrying amount of goodwill by concept for fiscal years 2009, 2010 and 2011:
|
Teppanyaki
|
RA Sushi
|
Haru
|
Total
|
|||||||||||||
|
Balance as of March 29, 2009:
|
||||||||||||||||
|
Goodwill
|
11,124 | 11,880 | 6,896 | 29,900 | ||||||||||||
|
Accumulated impairment charges
|
- | (11,880 | ) | - | (11,880 | ) | ||||||||||
|
Goodwill
|
11,124 | - | 6,896 | 18,020 | ||||||||||||
|
Fiscal year 2010 changes:
|
||||||||||||||||
|
Impairment charge
|
(11,124 | ) | - | - | (11,124 | ) | ||||||||||
|
Balance as of March 28, 2010:
|
||||||||||||||||
|
Goodwill
|
11,124 | 11,880 | 6,896 | 29,900 | ||||||||||||
|
Accumulated impairment charges
|
(11,124 | ) | (11,880 | ) | - | (23,004 | ) | |||||||||
|
Goodwill
|
- | - | 6,896 | 6,896 | ||||||||||||
|
Balance as of March 27, 2011:
|
||||||||||||||||
|
Goodwill
|
11,124 | 11,880 | 6,896 | 29,900 | ||||||||||||
|
Accumulated impairment charges
|
(11,124 | ) | (11,880 | ) | - | (23,004 | ) | |||||||||
|
Goodwill
|
$ | - | $ | - | $ | 6,896 | $ | 6,896 | ||||||||
We will continue to monitor events in future periods to determine if additional impairment testing is warranted.
|
12.
|
LEASES
|
We generally operate our restaurants in leased premises. We are obligated under various lease agreements for certain restaurant facilities and our corporate office, which are classified as operating leases. The typical restaurant premises lease is for a term of between 10 to 25 years with renewal options ranging from 5 to 20 years. The leases generally provide for the obligation to pay property taxes, utilities and various other use and occupancy costs. We are also obligated under two leases for office space.
Under the provisions of certain of our leases, there are rent holidays and/or escalations in payments over the base lease term, percentage rent, as well as options for renewal for additional periods. The effects of the rent holidays and escalations have been reflected in rent expense on a straight-line basis over the expected lease term, which includes option periods we are reasonably assured to exercise due to the fact that we would incur an economic penalty for not doing so. Generally, the lease term commences on the date when we become legally obligated for the rent payments or as specified in the lease agreement. Recognition of rent expense begins when we have the right to control the use of the leased property, which is typically before rent payments are due under the terms of most of our leases. Percentage rent expense is generally based upon sales levels and is accrued at the point in time we determine that it is probable that the sales levels will be achieved.
Minimum payments under lease commitments are as follows (in thousands):
|
Operating
|
||||
|
Leases
|
||||
|
Fiscal year:
|
||||
|
2012
|
$ | 15,570 | ||
|
2013
|
15,253 | |||
|
2014
|
15,149 | |||
|
2015
|
14,253 | |||
|
2016
|
13,674 | |||
|
Thereafter
|
112,277 | |||
|
Total minimum lease payments
|
$ | 186,176 | ||
Rent expense consists of (in thousands):
|
Fiscal Year Ended
|
||||||||||||
|
March 27,
|
March 28,
|
March 29,
|
||||||||||
|
2011
|
2010
|
2009
|
||||||||||
|
Minimum rentals
|
$ | 16,690 | $ | 16,411 | $ | 15,404 | ||||||
|
Contingent rentals
|
3,446 | 3,267 | 3,211 | |||||||||
| $ | 20,136 | $ | 19,678 | $ | 18,615 | |||||||
32
BENIHANA INC. AND SUBSIDIARIES
NOTES TO CONSOLIDATED FINANCIAL STATEMENTS (CONTINUED)
|
13.
|
STOCK-BASED COMPENSATION
|
On November 2, 2007, our shareholders approved the 2007 Equity Incentive Plan. As of that date, all future awards are granted under the 2007 Equity Incentive Plan. Therefore, we no longer grant options under any of our previously approved plans, including: the 2003 Directors’ Stock Option Plan, 2000 Employees Class A Stock Option Plan, 1997 Employees Class A Stock Option Plan and Amended and Restated Directors’ Stock Option Plan (together, the “prior option plans”). All outstanding options issued under the prior option plans will not be affected and will continue to be outstanding in accordance with their terms and the terms of the prior option plans pursuant to which they were issued. On August 20, 2009, our shareholders approved an amendment to the 2007 Equity Incentive Plan, which (i) increased the number of authorized shares of our Class A common stock available for issuance under the equity plan by 2,000,000 shares to an aggregate of 2,750,000 shares, (ii) increased the number of shares which may be issued under the equity plan upon the exercise of incentive stock options by 1,450,000 shares to an aggregate of 2,000,000 shares and (iii) increased the maximum number of shares for which an employee of the Company may be granted equity awards under the equity plan during any calendar year by 550,000 shares to 750,000 shares. As of March 27, 2011, of these amounts, we have granted 645,233 shares of restricted Class A common stock, net of forfeitures, and options to purchase 343,287 shares of Class A common stock, net of cancellations, leaving 1,761,480 shares available for future grants.
The purpose of the 2007 Equity Incentive Plan is to enable us to attract, retain and motivate key employees and non-employee directors by providing them equity participation. The plan provides for incentive stock options (“ISO’s”) under Section 422 of the Internal Revenue Code of 1986, as amended, and for options which are not ISO’s, stock appreciation rights (“SARs”), stock grants and stock equivalent units. Options, SARs and stock equivalent units granted under the employee plans may not have terms exceeding ten years (in the case of optionees holding 10% or more of the combined voting rights of our securities, ISO’s may not have terms exceeding five years) and may not provide for an option exercise price of less than 100% of the fair market value of the our Class A common stock on the day of the grant (110% of the fair market value in the case of optionees holding 10% or more of the combined voting rights of our securities). With regard to each option grant, the option first vests with respect to one-third on the first anniversary of the grant of the option, one-third on the second anniversary of the grant of the option and as to the balance of the shares on the third anniversary of the option. With regard to each restricted stock grant, the grant is subject to a risk of forfeiture which first lapses with respect to approximately one-third on the first anniversary of the grant, approximately one-third on the second anniversary of the grant and the balance of the shares on the third anniversary of the grant.
Under the 2007 Equity Incentive Plan, options to purchase 10,000 shares of Class A common stock are automatically granted to each of our non-employee directors on the date of our annual meeting of stockholders and are exercisable ratably as to one-third of the shares on the date which is six months after the date of grant, one-third of the shares on the first anniversary of the grant of the option and as to the balance of the shares on the second anniversary of grant of the option.
We recorded $2.7 million ($1.8 million after-tax), $0.5 million ($0.3 million after-tax) and $1.0 million ($0.6 million after-tax) in stock compensation expense, included in general and administrative expenses in the accompanying consolidated statement of earnings, during fiscal years 2011, 2010 and 2009, respectively. As further discussed in Note 15, Resignation of Former Directors and Executives, Joel A. Schwartz resigned from his positions as Director, Chairman and Chief Executive Officer, effective February 9, 2009. In connection with Mr. Schwartz’s resignation, all stock options and restricted stock granted to Mr. Schwartz under the 2007 Equity Incentive Plan were modified to accelerate vesting as of February 9, 2009. Included in the tables below are 69,600 stock options and 11,600 restricted stock awards where vesting was accelerated in connection with Mr. Schwartz’s resignation. The total incremental compensation cost recognized during fiscal year 2009 resulting from this modification was $0.3 million.
33
BENIHANA INC. AND SUBSIDIARIES
NOTES TO CONSOLIDATED FINANCIAL STATEMENTS (CONTINUED)
Stock Options - Stock option transactions under the above plans for fiscal years 2009, 2010 and 2011 are as follows:
|
Weighted
|
||||||||||||||||
|
Weighted
|
Average
|
|||||||||||||||
|
Average
|
Remaining
|
Aggregate
|
||||||||||||||
|
Exercise
|
Contractual
|
Intrinsic
|
||||||||||||||
|
Shares
|
Price
|
Term
|
Value
|
|||||||||||||
|
(per share)
|
(in years)
|
(in thousands)
|
||||||||||||||
|
Outstanding at March 30, 2008
|
1,529,338 | $ | 9.90 | |||||||||||||
|
Granted
|
100,000 | 4.36 | ||||||||||||||
|
Canceled/Expired
|
(1,725 | ) | 7.84 | |||||||||||||
|
Exercised
|
(17,250 | ) | 4.43 | |||||||||||||
|
Outstanding at March 29, 2009
|
1,610,363 | 9.61 | ||||||||||||||
|
Granted
|
60,000 | 6.33 | ||||||||||||||
|
Canceled/Expired
|
(593,509 | ) | 9.42 | |||||||||||||
|
Exercised
|
(123,141 | ) | 5.20 | |||||||||||||
|
Outstanding at March 28, 2010
|
953,713 | 10.10 | ||||||||||||||
|
Granted
|
90,000 | 7.95 | ||||||||||||||
|
Canceled/Expired
|
(178,179 | ) | 9.66 | |||||||||||||
|
Exercised
|
(63,734 | ) | 5.28 | |||||||||||||
|
Outstanding at March 27, 2011
|
801,800 | $ | 10.34 | 5.42 | $ | 514 | ||||||||||
|
Exercisable at March 27, 2011
|
681,800 | $ | 10.80 | 4.66 | $ | 431 | ||||||||||
During fiscal years 2011, 2010 and 2009, options to purchase 90,000, 60,000 and 100,000 of Class A common stock were granted, respectively. Refer to Note 1, Summary of Significant Accounting Policies, for assumptions used in estimating the fair value of these option grants. We expect options to purchase 90,000 shares to vest during fiscal year 2012. The weighted average grant date fair value of options granted during fiscal years 2011, 2010 and 2009 was $3.96, $3.48 and $1.79, respectively.
|
Options Outstanding
|
Options Exercisable
|
|||||||||||||||||||
|
Weighted-
|
||||||||||||||||||||
|
Average
|
Weighted
|
Weighted
|
||||||||||||||||||
|
Remaining
|
Average
|
Average
|
||||||||||||||||||
|
Contractual
|
Exercise
|
Exercise
|
||||||||||||||||||
|
Ranges of exercise prices:
|
Number
|
Life (in years)
|
Price
|
Number
|
Price
|
|||||||||||||||
|
$0.00 - $2.61
|
47,000 | 7.7 | $ | 2.61 | 47,000 | $ | 2.61 | |||||||||||||
|
4.96 - 6.33
|
60,000 | 0.4 | 6.33 | 40,000 | 6.33 | |||||||||||||||
|
7.36 - 8.56
|
327,000 | 6.5 | 8.07 | 227,000 | 8.11 | |||||||||||||||
|
10.00 - 11.22
|
157,800 | 4.0 | 10.35 | 157,800 | 10.35 | |||||||||||||||
|
14.91 - 16.36
|
135,000 | 5.6 | 15.56 | 135,000 | 15.56 | |||||||||||||||
|
18.81 - 18.84
|
75,000 | 5.8 | 18.82 | 75,000 | 18.82 | |||||||||||||||
| 801,800 | 5.42 | $ | 10.34 | 681,800 | $ | 10.80 | ||||||||||||||
The intrinsic value of a stock option is the amount by which the fair value of the underlying stock exceeds the exercise price of the option. For fiscal years 2011, 2010 and 2009, the total intrinsic value of stock options exercised was $0.1 million, $0.1 million and less than $0.1 million, respectively. Upon the exercise of stock options, shares are issued from new issuances of stock. The tax benefit realized for tax deductions from stock options during each of fiscal years 2011, 2010 and 2009 totaled less than $0.1 million. As of March 27, 2011, total unrecognized compensation cost related to nonvested stock options totaled $0.3 million and is expected to be recognized over approximately 0.9 years. The total fair value of shares vested during fiscal year 2011 was $0.2 million.
34
BENIHANA INC. AND SUBSIDIARIES
NOTES TO CONSOLIDATED FINANCIAL STATEMENTS (CONTINUED)
Restricted Stock - Restricted stock transactions under the 2007 Equity Incentive Plan are as follows:
|
Weighted
|
||||||||
|
Average
|
||||||||
|
Grant Date
|
||||||||
|
Shares
|
Fair Value
|
|||||||
|
(per share)
|
||||||||
|
Nonvested at March 30, 2008
|
25,900 | $ | 10.35 | |||||
|
Vested
|
(16,367 | ) | 10.35 | |||||
|
Nonvested at March 29, 2009
|
9,533 | 10.35 | ||||||
|
Granted
|
- | - | ||||||
|
Forfeited
|
(3,400 | ) | 10.35 | |||||
|
Vested
|
(3,065 | ) | 10.35 | |||||
|
Nonvested at March 28, 2010
|
3,068 | 10.35 | ||||||
|
Granted
|
625,000 | 8.14 | ||||||
|
Forfeited
|
(2,267 | ) | 10.35 | |||||
|
Vested
|
(152,884 | ) | 8.21 | |||||
|
Nonvested at March 27, 2011
|
472,917 | $ | 8.12 | |||||
No restricted stock was granted prior to March 2008 or under any of our prior option plans. The aggregate intrinsic value of vested restricted stock awards as of March 27, 2011 and March 28, 2010 was $1.3 million and $0.1 million. As of March 27, 2011, there was $2.8 million of unrecognized compensation cost related to restricted stock grants, which is expected to be recognized over approximately 2.3 years.
|
14.
|
INCOME TAXES
|
Deferred tax assets and liabilities reflect the tax effect of temporary differences between amounts of assets and liabilities for financial reporting purposes and the amounts of these assets and liabilities as measured by income tax law. The income tax effects of temporary differences that give rise to deferred tax assets and liabilities are as follows (in thousands):
|
March 27,
|
March 28,
|
|||||||
|
2011
|
2010
|
|||||||
|
Deferred tax assets:
|
||||||||
|
Straight-line rent expense
|
$ | 5,747 | $ | 5,426 | ||||
|
Goodwill
|
2,270 | 1,904 | ||||||
|
Gift certificate liability
|
1,136 | 1,344 | ||||||
|
Amortization of gain
|
556 | 614 | ||||||
|
Employee benefit accruals
|
6,364 | 4,259 | ||||||
|
Workers compensation
|
1,157 | 1,073 | ||||||
|
State net operating loss carryforwards
|
2,355 | - | ||||||
|
Other
|
160 | 22 | ||||||
| 19,745 | 14,642 | |||||||
|
Valuation Allowance
|
(2,355 | ) | - | |||||
|
Deferred tax liabilities:
|
||||||||
|
Property and equipment
|
6,168 | 3,940 | ||||||
|
Inventories
|
812 | 1,083 | ||||||
| 6,980 | 5,023 | |||||||
| 10,410 | 9,619 | |||||||
|
Available for sale investment securities
|
(35 | ) | 7 | |||||
|
Net deferred tax asset
|
$ | 10,375 | $ | 9,626 | ||||
We have certain state net operating loss carryforwards of $56.3 million, with an estimated tax effect of $2.4 million. These state net operating loss carryforwards expire at various dates through 2031. We believe that it is more likely than not that the benefit from certain state net operating loss carryforwards will not be realized. Accordingly, as of March 27, 2011, we have provided a valuation allowance of $2.4 million for these state net operating loss carryforwards.
35
BENIHANA INC. AND SUBSIDIARIES
NOTES TO CONSOLIDATED FINANCIAL STATEMENTS (CONTINUED)
Net deferred tax asset consists of (in thousands):
|
March 27,
|
March 28,
|
|||||||
|
2011
|
2010
|
|||||||
|
Current asset
|
$ | 322 | $ | 340 | ||||
|
Long-term asset
|
10,053 | 9,286 | ||||||
| $ | 10,375 | $ | 9,626 | |||||
The income tax provision (benefit) consists of (in thousands):
|
Fiscal Year Ended
|
||||||||||||
|
March 27,
|
March 28,
|
March 29,
|
||||||||||
|
2011
|
2010
|
2009
|
||||||||||
|
Current tax (benefit) expense:
|
||||||||||||
|
Federal
|
$ | (1,147 | ) | $ | (1,774 | ) | $ | 2,382 | ||||
|
State
|
1,268 | 94 | 1,338 | |||||||||
|
Deferred tax (benefit) expense:
|
||||||||||||
|
Federal and State
|
(791 | ) | 865 | (9,423 | ) | |||||||
|
Income tax benefit
|
$ | (670 | ) | $ | (815 | ) | $ | (5,703 | ) | |||
The income tax provision differed from the amount computed at the statutory rate as follows (in thousands):
|
Fiscal Year Ended
|
||||||||||||
|
March 27,
|
March 28,
|
March 29,
|
||||||||||
|
2011
|
2010
|
2009
|
||||||||||
|
Federal income tax provision at statutory rate of 34% in fiscal
|
||||||||||||
|
years 2011 and 2010 and 35% in fiscal year 2009
|
$ | 226 | $ | (3,318 | ) | $ | (3,769 | ) | ||||
|
State income taxes, net of federal benefit
|
44 | 216 | (492 | ) | ||||||||
|
Tax credits, net
|
(1,735 | ) | (1,635 | ) | (1,477 | ) | ||||||
|
Permanent book/tax differences
|
263 | - | - | |||||||||
|
Tax benefit recognized for uncertain tax positions
|
(106 | ) | (96 | ) | (321 | ) | ||||||
|
Goodwill impairment
|
- | 3,782 | - | |||||||||
|
Change in valuation allowance
|
315 | - | - | |||||||||
|
Change in tax rate
|
323 | 233 | - | |||||||||
|
Other
|
- | 3 | 356 | |||||||||
|
Income tax provision (benefit)
|
$ | (670 | ) | $ | (815 | ) | $ | (5,703 | ) | |||
|
Effective income tax rate
|
(100.8 | %) | 8.4 | % | 53.0 | % | ||||||
|
|
We file income tax returns that are periodically audited by various federal and state jurisdictions. With few exceptions, we are no longer subject to federal and state income tax examinations for years prior to fiscal year 2007.
|
As of March 27, 2011, we had $0.2 million of unrecognized tax benefits related to uncertain tax positions, all of which would impact the tax rate, if recognized. Of the total unrecognized tax benefits at March 27, 2011, we believe it is reasonably possible that this amount could be reduced by $0.1 million in the next twelve months due the expiration of statute of limitations. As of March 28, 2010, we had $0.3 million of unrecognized tax benefits.
36
BENIHANA INC. AND SUBSIDIARIES
NOTES TO CONSOLIDATED FINANCIAL STATEMENTS (CONTINUED)
The unrecognized tax benefits and related interest and penalties are generally classified as other long term liabilities in the accompanying consolidated balance sheets. A reconciliation of beginning and ending unrecognized tax benefits, exclusive of related interest and penalties, is as follows (in thousands):
|
Unrecognized tax benefits, March 29, 2009
|
$ | 372 | ||
|
Gross decreases - prior period tax positions
|
(112 | ) | ||
|
Gross increases - prior period tax positions
|
40 | |||
|
Unrecognized tax benefits, March 28, 2010
|
300 | |||
|
Gross decreases - prior period tax positions
|
(119 | ) | ||
|
Gross increases - prior period tax positions
|
21 | |||
|
Unrecognized tax benefits, March 27, 2011
|
$ | 202 |
We recognize interest and penalties related to unrecognized tax benefits within income tax expense in the accompanying consolidated statements of earnings. As of March 27, 2011 and March 28, 2010, the amount accrued for the payment of interest was not significant, and we did not incur any penalties related to unrecognized tax benefits. During fiscal year 2010, we reduced the related interest associated with unrecognized tax benefits by less than $0.1 million.
|
15.
|
RESIGNATION OF FORMER DIRECTORS AND EXECUTIVES
|
During the fourth quarter of fiscal year 2009, Joel A. Schwartz resigned from his positions as Director, Chairman and Chief Executive Officer, effective February 9, 2009.
In connection with Mr. Schwartz’s resignation, we entered into an agreement with Mr. Schwartz to provide consulting services for a period of five years for annual payments of $17,200. The agreement also provides for the accelerated vesting of all stock options and restricted stock granted to Mr. Schwartz under our 2007 Equity Incentive Plan.
Mr. Schwartz’s employment agreement with us, dated March 17, 2008, was terminated on a without cause basis on February 9, 2009. As a result, during fiscal year 2009, we recognized a $3.2 million charge comprised primarily of severance and retirement cash obligations totaling $2.9 million as well as additional compensation expense related to the acceleration of Mr. Schwartz’s stock options and restricted stock grants under the 2007 Equity Incentive Plan totaling $0.3 million. In accordance with Mr. Schwartz’s employment agreement, he was paid a lump sum severance payment of $0.9 million six months after his resignation and a retirement benefit of $2.0 million to be paid in sixty equal monthly installments where the first six installments shall not be paid until six months after his resignation. Of the amount due to Mr. Schwartz as of March 27, 2011, $0.4 million is classified as short-term within accrued expenses and the remaining $0.8 million is classified as long-term within other long-term liabilities in the accompanying consolidated balance sheet. Additionally, as provided under his employment agreement, for a period of three years following his resignation, we will provide Mr. Schwartz with continued group medical and dental insurance coverage or payments in lieu thereof.
On February 9, 2009, our board of directors approved the election of Richard C. Stockinger to Chief Executive Officer. Mr. Stockinger has served as a member of our board since November 2007. On September 28, 2010, our board of directors elected Mr. Stockinger to serve as Chairman of the Board.
Effective as of December 18, 2009, Taka Yoshimoto resigned from his positions as Director and Executive Vice President – Operations. In connection with Mr. Yoshimoto’s resignation, on December 22, 2009, we entered into an agreement with Mr. Yoshimoto which provides for, among other things, payment to Mr. Yoshimoto of $19,340 per month for twelve months commencing on January 15, 2010, and payment, on Mr. Yoshimoto’s behalf, of any premiums under the Consolidated Omnibus Budget Reconciliation Act of 1986 (“COBRA”) applicable to Mr. Yoshimoto’s health insurance coverage until December 15, 2010. In consideration for such payments, Mr. Yoshimoto agreed, among other things, to release us and our affiliates from any and all claims which Mr. Yoshimoto may otherwise have against us or our affiliates. Accordingly, during fiscal year 2010, we recognized a charge of $0.2 million in connection with the resignation of Taka Yoshimoto, included in general and administrative expenses in the accompanying consolidated statements of earnings.
Effective as of January 13, 2010, Juan C. Garcia resigned from his positions as President and Chief Administrative Officer. In connection with Mr. Garcia’s resignation, on January 28, 2010, we entered into an agreement with Mr. Garcia which provides for, among other things, continuation of Mr. Garcia’s basic compensation and car allowance through March 31, 2010 under the terms of his Amended and Restated Employment Agreement dated March 31, 2008, semi-monthly payments to Mr. Garcia of $11,461 beginning on the first regular pay day following March 31, 2010 and continuing through January 20, 2011, and payment, on Mr. Garcia’s behalf, of any premiums under COBRA applicable to Mr. Garcia’s health insurance coverage until the first regularly scheduled pay day following January 13, 2011. In consideration for such payments, Mr. Garcia agreed, among other things, to release us and our affiliates from any and all claims which Mr. Garcia may otherwise have against us or our affiliates. Accordingly, we recognized a charge of approximately $0.3 million during fiscal year 2010, included in general and administrative expenses in the accompanying consolidated statements of earnings.
37
BENIHANA INC. AND SUBSIDIARIES
NOTES TO CONSOLIDATED FINANCIAL STATEMENTS (CONTINUED)
Effective as of January 13, 2010, Richard C. Stockinger, our Chief Executive Officer, was appointed President of the Company. On January 7, 2010, our Board of Directors approved an increase to Mr. Stockinger’s annual base salary from $350,000 to $500,000 retroactive to the commencement of his employment on February 9, 2009. Accordingly, we recognized a charge of approximately $0.1 million during the year ended March 28, 2010. In addition, our Board approved immediate termination of Mr. Stockinger’s $7,500 monthly relocation allowance.
Effective as of January 13, 2010, Jose I. Ortega resigned from his positions as Vice President – Finance, Chief Financial Officer and Treasurer. In connection with Mr. Ortega’s resignation, on January 14, 2010, we entered into an agreement with Mr. Ortega pursuant to which Mr. Ortega agreed to provide consulting services to us with regard to accounting, SEC filings and other financial matters for ninety days. During the consulting period, we paid Mr. Ortega the base compensation payable to him at the time of his resignation, and we have agreed to pay Mr. Ortega $200,000 over the twelve-month period following the end of the consulting period. In addition, we made payments, on behalf of Mr. Ortega, of any premiums under COBRA applicable to the health insurance coverage of Mr. Ortega and his qualified dependents until we made our final payment under the agreement. In consideration for the payments to be made under the agreement, Mr. Ortega agreed, among other things, to release us and our affiliates from any and all claims which he might otherwise have against us or our affiliates. Consulting fees will be recognized as incurred over the consulting period. As such, during the year ended March 27, 2011, we recognized a charge of approximately $0.2 million.
Effective as of January 13, 2010, our Board of Directors appointed Gene R. Baldwin as our interim Chief Financial Officer. Mr. Baldwin has served as a partner of CRG Partners Group, LLC and its predecessors (“CRG”), a provider of financial advisory, corporate improvement and related services, since 2002. During the performance of his duties as interim Chief Financial Officer, Mr. Baldwin will continue as a partner of CRG, and we will compensate Mr. Baldwin through CRG. The Board of Directors has commenced a search for a permanent Chief Financial Officer.
|
16.
|
COMMITMENTS AND CONTINGENCIES
|
Acquisitions – Haru Holding Corp - In December 1999, we completed the acquisition of 80% of the equity of Haru Holding Corp. (“Haru”). The acquisition was accounted for using the purchase method of accounting. Pursuant to the purchase agreement, at any time during the period from July 1, 2005 through September 30, 2005, the holders of the balance of Haru’s equity (the “minority stockholders”) had a one-time option to sell their remaining shares to us (the “put option”). On July 1, 2005, the minority stockholders exercised the put option, and we acquired the remaining 20% of the equity of Haru.
On August 25, 2006, the former minority stockholders sued us over, among other things, the calculation of the put option price. The suit (which was filed in the Supreme Court of the State of New York, County of New York, but was removed to the United States District Court for the Southern District of New York) sought an award of $10.7 million, based on the former minority stockholders’ own calculation of the put option price formula and actions allegedly taken by us to reduce the value of the put option.
On December, 19, 2007, the Court dismissed all of the claims against us, except for the breach of fiduciary duty and breach of contract claims.
On March 5, 2010, the Court issued a decision stating that the price required to be paid by us to the former minority stockholders would be approximately $3.7 million, our original calculation of the put option price. On April 2, 2010, the plaintiff appealed the Court’s decision. On October 13, 2010, the Court entered an Order requiring a closing within 30 days, upon which we were ordered to pay the put option price as determined by the Court. On November 10, 2010, we paid the amount owed and relieved any related outstanding liability. The outcome of the April 2010 appeal is still pending.
Other Litigation and Proceedings - During May 2010, the California Department of Alcoholic Beverage Control (the “Department”) notified us of proceedings against the Company based upon allegations that alcohol was served to underage guests in a RA Sushi location. In one incident, on which a claim has been filed against us, a guest was subsequently involved in a fatal automobile accident. We have general liability insurance plans for such claims. We cannot predict the outcome of the pending litigation. The Department issued a decision imposing a 30 day suspension of the alcoholic beverage license. We will vigorously contest the suspension of the alcoholic beverage license for this location and the claim against us. While under appeal by us, the suspension is stayed, and we are permitted to continue operating under our alcoholic beverage license.
We are not subject to any other significant pending legal proceedings, other than ordinary routine claims incidental to our business or those otherwise covered by our insurance policies.
We do not believe that the ultimate resolution of these matters will have a material adverse effect on our results of operations, financial condition or cash flows. However, the results of these matters cannot be predicted with certainty, and an unfavorable resolution of one or more of these matters could have a material adverse effect on our financial condition, results of operations or cash flows.
38
BENIHANA INC. AND SUBSIDIARIES
NOTES TO CONSOLIDATED FINANCIAL STATEMENTS (CONTINUED)
Supply Agreements - We have entered into non-cancellable national supply agreements for the purchase of certain beef and seafood items, as well as produce, oils and other items used in the normal course of business, at fixed prices for up to twelve-month terms. These supply agreements will eliminate volatility in the cost of the commodities over the terms of the agreements. These supply agreements are not considered derivative contracts.
Other – Refer to Note 15, Resignation of Former Directors and Executives, for cash obligations incurred in connection with the resignation of Joel Schwartz from his positions as Director, Chairman and Chief Executive Officer.
|
17.
|
SEGMENT REPORTING
|
Our reportable segments are those that are based on our methods of internal reporting and management structure. We manage operations by restaurant concept.
Revenues for each of the segments consist of restaurant sales. Franchise revenues, while generated from Benihana franchises, have not been allocated to the Benihana teppanyaki segment. Franchise revenues are reflected as corporate revenues.
The table below presents information about reportable segments for fiscal years 2011, 2010 and 2009 (in thousands):
|
Fiscal Year Ended
|
||||||||||||||||||||
|
March 27, 2011
|
||||||||||||||||||||
|
Teppanyaki
|
RA Sushi
|
Haru
|
Corporate
|
Consolidated
|
||||||||||||||||
|
Revenues
|
$ | 216,819 | $ | 76,544 | $ | 32,558 | $ | 1,719 | $ | 327,640 | ||||||||||
|
Depreciation and amortization
|
14,004 | 3,658 | 1,970 | 1,970 | 21,602 | |||||||||||||||
|
Income (loss) from operations
|
21,375 | 6,581 | 3,206 | (29,129 | ) | 2,033 | ||||||||||||||
|
Capital expenditures
|
5,620 | 1,432 | 724 | 277 | 8,053 | |||||||||||||||
|
Goodwill
|
- | - | 6,896 | - | 6,896 | |||||||||||||||
|
Total assets
|
131,135 | 30,101 | 21,545 | 38,101 | 220,882 | |||||||||||||||
|
Fiscal Year Ended
|
||||||||||||||||||||
|
March 28, 2010
|
||||||||||||||||||||
|
Teppanyaki
|
RA Sushi
|
Haru
|
Corporate
|
Consolidated
|
||||||||||||||||
|
Revenues
|
$ | 205,638 | $ | 73,484 | $ | 32,675 | $ | 1,727 | $ | 313,524 | ||||||||||
|
Depreciation and amortization
|
13,600 | 3,444 | 2,079 | 962 | 20,085 | |||||||||||||||
|
Impairment charges
|
11,796 | 256 | 295 | - | 12,347 | |||||||||||||||
|
Income (loss) from operations
|
1,207 | 3,676 | 3,664 | (16,285 | ) | (7,738 | ) | |||||||||||||
|
Capital expenditures, net of insurance proceeds
|
12,033 | 332 | 4,635 | - | 17,000 | |||||||||||||||
|
Goodwill
|
- | - | 6,896 | - | 6,896 | |||||||||||||||
|
Total assets
|
157,522 | 32,249 | 22,782 | 21,537 | 234,090 | |||||||||||||||
|
Fiscal Year Ended
|
||||||||||||||||||||
|
March 29, 2009
|
||||||||||||||||||||
|
Teppanyaki
|
RA Sushi
|
Haru
|
Corporate
|
Consolidated
|
||||||||||||||||
|
Revenues
|
$ | 206,970 | $ | 61,270 | $ | 35,628 | $ | 1,739 | $ | 305,607 | ||||||||||
|
Depreciation and amortization
|
12,271 | 3,242 | 2,649 | 488 | 18,650 | |||||||||||||||
|
Impairment charges
|
1,370 | 16,555 | 3,580 | - | 21,505 | |||||||||||||||
|
Income (loss) from operations
|
19,908 | (15,091 | ) | (240 | ) | (14,497 | ) | (9,920 | ) | |||||||||||
|
Capital expenditures, net of insurance proceeds
|
33,089 | 11,905 | 362 | 1,453 | 46,809 | |||||||||||||||
|
Goodwill
|
11,124 | - | 6,896 | - | 18,020 | |||||||||||||||
|
Total assets
|
163,625 | 32,991 | 24,853 | 35,658 | 257,127 | |||||||||||||||
39
BENIHANA INC. AND SUBSIDIARIES
NOTES TO CONSOLIDATED FINANCIAL STATEMENTS (CONTINUED)
|
18.
|
RELATED PARTY TRANSACTIONS
|
Darwin C. Dornbush, the former Chairman of our board of directors, is a retired partner in Dornbush Schaeffer Strongin & Venaglia, LLP, a law firm. In fiscal years 2011, 2010 and 2009, we incurred approximately $0.9 million, $1.3 million and $0.9 million, respectively, in legal fees and expenses to Dornbush Schaeffer Strongin & Venaglia, LLP. We have also paid Mr. Dornbush, as an employee, for certain management advisory services approximately less than $0.1 million, $0.2 million and $0.1 million in fiscal years 2011, 2010 and 2009, respectively. As of September 28, 2010, Mr. Dornbush is no longer compensated as an employee of the Company.
During fiscal year 2008, we entered into a lease for a Benihana teppanyaki restaurant to be located in Orlando, FL, with an annual rent of $0.1 million and a base term of 20 years. The landlord is Bluegreen Vacations Unlimited, Inc., a subsidiary of Bluegreen Corporation. Three of our directors are also directors of Bluegreen Corporation.
J. Ronald Castell, a director of ours, provided certain marketing consulting services and earned less than $0.1 million in consulting fees during each of fiscal years 2010 and 2009. No such services were provided in fiscal year 2011.
As discussed in Note 8, Convertible Preferred Stock, we sold an aggregate 800,000 shares of our Series B preferred stock to BFC for $20.0 million. The sale of Series B preferred stock resulted in net aggregate proceeds of $19.2 million ($9.3 million in fiscal year 2005 and $9.9 million in fiscal year 2006). The sale of Series B preferred stock was completed in two tranches during fiscal years 2005 and 2006. John E. Abdo, a Director, is also a Director and Vice Chairman of the Board of BFC and is a significant shareholder of BFC. Alan B. Levan, who became a Director after the end of fiscal year 2009, is Chairman, Chief Executive Officer and President, as well as a significant shareholder, of BFC.
During fiscal year 2010, we engaged BFC through its wholly-owned subsidiary, Snapper Creek Equity Management, LLC (“Snapper Creek”), to provide management, financial advisory and other consulting services. We incurred approximately $0.5 million and $0.2 million in consulting fees in fiscal years 2011 and 2010, respectively. Effective November 30, 2010, we are no longer engaging Snapper Creek to provide any services.
During fiscal year 2010, we engaged Risk Management Services (“RMS”), an affiliate of BFC, to provide insurance and risk management services. Fees incurred by RMS in fiscal year 2010 were not significant. As of September 21, 2010, we are no longer engaging RMS to provide any services.
Benihana of Tokyo, Inc. (“BOT”) owns a Benihana restaurant in Honolulu, Hawaii (the “Honolulu Restaurant”). We have granted to BOT a perpetual license to operate the Honolulu Restaurant and an exclusive license to own and operate Benihana restaurants in Hawaii. This license is royalty free with respect to any Hawaiian restaurant beneficially owned by BOT or its affiliates and bears a royalty of 6% of gross revenues in the event the restaurants are transferred to an unaffiliated third party.
|
19.
|
INCENTIVE AND DEFERRED COMPENSATION PLANS
|
Incentive Plan - We have an incentive compensation plan whereby bonus awards are made if we attain certain financial targets or at the discretion of the Compensation Committee of the Board of Directors (the “Compensation Committee”). Our annual incentive compensation plan ties key employees’ bonus earning potential to individually-designed performance objectives. Under the plan, each plan participant is provided a range of potential annual cash incentive awards based on his or her individually-designed performance objectives. Actual awards paid under the plan are based on exceeding goals tied to certain budgeted results. A portion of awards is also determined by achieving other performance and management goals. Target rates are approved annually by the Compensation Committee.
We recorded $2.5 million and $1.2 million of corporate incentive compensation expense in fiscal years 2011 and 2010. We did not incur any corporate incentive compensation expense in fiscal year 2009 in connection with the incentive compensation plan.
Deferred Compensation Plan - We have an executive retirement plan whereby certain key employees may elect to defer up to 20% of their salary and 100% of their bonus until retirement or age 55, whichever is later, or due to disability or death. Employees may select from various investment options for their available account balances. We have elected to invest the deferrals in mutual funds that track the election made by the participants and to monitor the selected investment’s performance. Investment earnings are credited to their accounts, and we increase or decrease our obligations under the deferred compensation plan.
|
20.
|
QUARTERLY FINANCIAL DATA (UNAUDITED)
|
Fiscal quarter ended (in thousands except for per share information)
40
BENIHANA INC. AND SUBSIDIARIES
NOTES TO CONSOLIDATED FINANCIAL STATEMENTS (CONTINUED)
|
March 27, 2011
|
March 28, 2010
|
|||||||||||||||||||||||||||||||
|
Fourth
|
Third
|
Second
|
First
|
Fourth
|
Third
|
Second
|
First
|
|||||||||||||||||||||||||
|
Revenues
|
$ | 81,786 | $ | 72,895 | $ | 72,190 | $ | 100,769 | $ | 77,826 | $ | 70,378 | $ | 69,348 | $ | 95,972 | ||||||||||||||||
|
Income (loss) from operations
|
2,198 | 1,312 | (4,008 | ) | 2,531 | 2,919 | (10,704 | ) | (1,933 | ) | 1,980 | |||||||||||||||||||||
|
Net income (loss)
|
549 | 2,179 | (3,002 | ) | 1,609 | 1,691 | (10,887 | ) | (839 | ) | 1,092 | |||||||||||||||||||||
|
Basic earnings (loss) per share
|
$ | 0.02 | $ | 0.12 | $ | (0.21 | ) | $ | 0.08 | $ | 0.09 | $ | (0.72 | ) | $ | (0.07 | ) | $ | 0.05 | |||||||||||||
|
Diluted earnings (loss) per share
|
$ | 0.02 | $ | 0.12 | $ | (0.21 | ) | $ | 0.08 | $ | 0.09 | $ | (0.72 | ) | $ | (0.07 | ) | $ | 0.05 | |||||||||||||
The net loss recognized in the third quarter of fiscal year 2010 is due to the non-cash impairment charges further discussed in Note 11, Impairment Charges, of the consolidated financial statements.
|
21.
|
OTHER MATTERS
|
As previously announced, in July 2010, our board of directors commenced a review of strategic alternatives available to us, including a possible sale of the Company, in order to maximize stockholder value. On May 13, 2011 our board of directors terminated the possible sale process and approved the following strategic alternatives. First, we will submit to our stockholders for their approval a proposal to reclassify each share of Class A Common Stock of the Company into one share of Common Stock, thereby eliminating the Company’s dual-class common stock structure. Second, our board of directors has amended our shareholder rights plan to expire automatically when and if the reclassification of the Class A Common Stock becomes effective. There can be no assurance that the proposed reclassification will be consummated or, if consummated, the timing thereof.
|
22.
|
SUBSEQUENT EVENTS
|
On May 1, 2011, we closed our Haru Philadelphia location. Haru Philadelphia sustained a loss from operations of $0.2 million for the year ended March 27, 2011 and was fully impaired during fiscal year 2010.
41
REPORT OF INDEPENDENT REGISTERED PUBLIC ACCOUNTING FIRM
To the Board of Directors and Stockholders of
Benihana Inc.
Miami, Florida
We have audited the accompanying consolidated balance sheets of Benihana Inc. and subsidiaries (the “Company”) as of March 27, 2011 and March 28, 2010, and the related consolidated statements of earnings, stockholders’ equity, and cash flows for each of the three years in the period ended March 27, 2011. These financial statements are the responsibility of the Company’s management. Our responsibility is to express an opinion on these financial statements based on our audits.
We conducted our audits in accordance with the standards of the Public Company Accounting Oversight Board (United States). Those standards require that we plan and perform the audit to obtain reasonable assurance about whether the financial statements are free of material misstatement. An audit includes examining, on a test basis, evidence supporting the amounts and disclosures in the financial statements. An audit also includes assessing the accounting principles used and significant estimates made by management, as well as evaluating the overall financial statement presentation. We believe that our audits provide a reasonable basis for our opinion.
In our opinion, such consolidated financial statements present fairly, in all material respects, the financial position of the Company as of March 27, 2011, and March 28, 2010, and the results of its operations and its cash flows for each of the three years in the period ended March 27, 2011, in conformity with accounting principles generally accepted in the United States of America.
We have also audited, in accordance with the standards of the Public Company Accounting Oversight Board (United States), the Company’s internal control over financial reporting as of March 27, 2011, based on the criteria established in Internal Control—Integrated Framework issued by the Committee of Sponsoring Organizations of the Treadway Commission and our report dated June 9, 2011, expressed an unqualified opinion on the Company’s internal control over financial reporting.
|
Deloitte & Touche LLP
|
|
Certified Public Accountants
|
|
Miami, Florida
|
|
June 9, 2011
|
42
REPORT OF INDEPENDENT REGISTERED PUBLIC ACCOUNTING FIRM
To the Board of Directors and Stockholders of
Benihana Inc.
Miami, Florida
We have audited the internal control over financial reporting of Benihana Inc. and subsidiaries (the “Company”) as of March 27, 2011, based on criteria established in Internal Control — Integrated Framework issued by the Committee of Sponsoring Organizations of the Treadway Commission. The Company’s management is responsible for maintaining effective internal control over financial reporting and for its assessment of the effectiveness of internal control over financial reporting, included in the accompanying Management’s Report on Internal Control over Financial Reporting. Our responsibility is to express an opinion on the Company’s internal control over financial reporting based on our audit.
We conducted our audit in accordance with the standards of the Public Company Accounting Oversight Board (United States). Those standards require that we plan and perform the audit to obtain reasonable assurance about whether effective internal control over financial reporting was maintained in all material respects. Our audit included obtaining an understanding of internal control over financial reporting, assessing the risk that a material weakness exists, testing and evaluating the design and operating effectiveness of internal control based on the assessed risk, and performing such other procedures as we considered necessary in the circumstances. We believe that our audit provides a reasonable basis for our opinion.
A company’s internal control over financial reporting is a process designed by, or under the supervision of, the company’s principal executive and principal financial officers, or persons performing similar functions, and effected by the company’s board of directors, management, and other personnel to provide reasonable assurance regarding the reliability of financial reporting and the preparation of financial statements for external purposes in accordance with generally accepted accounting principles. A company’s internal control over financial reporting includes those policies and procedures that (1) pertain to the maintenance of records that, in reasonable detail, accurately and fairly reflect the transactions and dispositions of the assets of the company; (2) provide reasonable assurance that transactions are recorded as necessary to permit preparation of financial statements in accordance with generally accepted accounting principles, and that receipts and expenditures of the company are being made only in accordance with authorizations of management and directors of the company; and (3) provide reasonable assurance regarding prevention or timely detection of unauthorized acquisition, use, or disposition of the company’s assets that could have a material effect on the financial statements.
Because of the inherent limitations of internal control over financial reporting, including the possibility of collusion or improper management override of controls, material misstatements due to error or fraud may not be prevented or detected on a timely basis. Also, projections of any evaluation of the effectiveness of the internal control over financial reporting to future periods are subject to the risk that the controls may become inadequate because of changes in conditions, or that the degree of compliance with the policies or procedures may deteriorate.
In our opinion, the Company maintained, in all material respects, effective internal control over financial reporting as of March 27, 2011, based on the criteria established in Internal Control — Integrated Framework issued by the Committee of Sponsoring Organizations of the Treadway Commission.
We have also audited, in accordance with the standards of the Public Company Accounting Oversight Board (United States), the consolidated financial statements as of and for the year ended March 27, 2011 of the Company and our report dated June 9, 2011, expressed an unqualified opinion on those financial statements.
|
Deloitte & Touche LLP
|
|
Certified Public Accountants
|
|
Miami, Florida
|
|
June 9, 2011
|
43
EVALUATION DISCLOSURE CONTROLS AND PROCEDURES
We have established and maintain disclosure controls and procedures (as such term is defined in Rules 13a-15(e) and 15d-15(e) under the Securities Exchange Act of 1934, as amended (the “Exchange Act”)) that are designed to ensure that material information relating to Benihana Inc. and our subsidiaries (“the Company”) required to be disclosed by us in the reports that we file or submit to the SEC under the Exchange Act is recorded, processed, summarized and reported within the time periods specified in the SEC’s rules and forms, and that this information is accumulated and communicated to our management, including our Chief Executive Officer and Interim Chief Financial Officer, as appropriate to allow timely decisions regarding required disclosure. In designing and evaluating the disclosure controls and procedures, management recognized that any controls and procedures, no matter how well designed and operated, can provide only a reasonable assurance of achieving the desired control objectives, and management was necessarily required to apply its judgment in evaluating the cost-benefit relationship of possible controls and procedures.
We carried out an evaluation under the supervision and with the participation of our management, including our Chief Executive Officer and Interim Chief Financial Officer, of the effectiveness of the design and operation of our disclosure controls and procedures as of the end of the period covered by this report. Based upon that evaluation, our Chief Executive Officer and Interim Chief Financial Officer concluded that, as of the end of the period covered by this report, our disclosure controls and procedures were effective to provide reasonable assurance that information required to be disclosed in our reports filed or submitted under the Exchange Act is recorded, processed, summarized and reported within the time periods specified in the SEC’s rules and forms.
44
MANAGEMENT’S REPORT ON INTERNAL CONTROL OVER FINANCIAL REPORTING
Our management is responsible for establishing and maintaining adequate internal control over financial reporting. As defined in Exchange Act Rule 13a-15(f) and 15d-15(f), internal control over financial reporting is a process designed by, or under the supervision of, our principal executive and principal financial officer and effected by our board of directors, management and other personnel, to provide reasonable assurance regarding the reliability of financial reporting and the preparation of financial statements for external purposes in accordance with generally accepted accounting principles and includes those policies and procedures that (i) pertain to the maintenance of records that in reasonable detail accurately and fairly reflect the transactions and dispositions of the assets of the Company; (ii) provide reasonable assurance that transactions are recorded as necessary to permit preparation of financial statements in accordance with generally accepted accounting principles, and that receipts and expenditures of the Company are being made only in accordance with authorizations of management and directors of the Company; and (iii) provide reasonable assurance regarding prevention or timely detection of unauthorized acquisition, use or disposition of the Company’s assets that could have a material effect on the financial statements. Because of its inherent limitations, internal control over financial reporting may not prevent or detect misstatements. Projections of any evaluation of effectiveness to future periods are subject to the risk that controls may become inadequate because of changes in conditions or that the degree of compliance with the policies or procedures may deteriorate.
Under the supervision and with the participation of our management, including our Chief Executive Officer and Interim Chief Financial Officer, we carried out an evaluation of the effectiveness of our internal control over financial reporting as of March 27, 2011 based on the criteria in “Internal Control – Integrated Framework” issued by the Committee of Sponsoring Organizations of the Treadway Commission (“COSO”). Based upon this evaluation, our management concluded that the Company’s internal control structure and consequently, the Company’s internal control over financial reporting were effective as of March 27, 2011.
Deloitte & Touche LLP, the independent registered public accounting firm that audited our consolidated financial statements included in this Annual Report on Form 10-K, has also audited the effectiveness of the Company’s internal control over financial reporting as of March 27, 2011. Deloitte & Touche LLP expressed an unqualified opinion on our internal control over financial reporting as of March 27, 2011 as stated in their report included herein.
|
|
|
/s/ Richard C. Stockinger
|
|
|
Richard C. Stockinger
|
|||
|
Chief Executive Officer
|
|
|
|
/s/ Gene R. Baldwin
|
|
|
Gene R. Baldwin
|
|||
|
Interim Chief Financial Officer
|
|||
|
June 9, 2011
|
45
OFFICERS AND DIRECTORS
CORPORATE OFFICERS
Richard C. Stockinger – Chairman of the Board, Chief Executive Officer and President
Gene R. Baldwin – Interim Chief Financial Officer
Christopher Ames – Chief Operating Officer
Cristina Mendoza – General Counsel and Secretary
DIRECTORS
John E. Abdo – Vice Chairman of the Board of Directors and Chairman of the Executive Committee, BFC Financial Corporation; Vice Chairman of the Board and Chairman of the Executive Committee, BankAtlantic Bancorp., Inc.; and Vice Chairman of the Board, Bluegreen Corporation.
Norman Becker – Independent Consultant, Certified Public Accountant
J. Ronald Castell – ReelRon LLC
Darwin C. Dornbush – Partner, Dornbush Schaeffer Strongin & Venaglia, LLP
Adam Gray - Managing Director and Co-Founder, Coliseum Capital Management, LLC
Lewis Jaffe – Independent Consultant, Certified Public Company Director, Advanced Certification
Michael Kata - Vice President and Chief Operating Officer, Benihana of Tokyo, Inc
Alan B. Levan – Chairman of the Board of Directors, Chief Executive Officer and President, BFC Financial Corporation; Chairman of the Board of Directors and Chief Executive Officer, BankAtlantic Bancorp.; and Chairman of the Board, Bluegreen Corporation.
Richard C. Stockinger
Joseph J. West, Ph.D. – Vice President and Director of Operations, Brooklyn Water Enterprises and Professor, School of Hospitality and Tourism Management, Florida International University
46
CORPORATE INFORMATION
COMMON STOCK
NASDAQ Symbols
Common Stock BNHN
Class A Common Stock BNHNA
INDEPENDENT REGISTERED PUBLIC ACCOUNTING FIRM
Deloitte & Touche LLP
333 SE 2nd Avenue
Suite 3600
Miami, Florida 33131
10-K REPORT AVAILABILITY
A copy of the Benihana Inc. Form 10-K, filed with the U.S. Securities and Exchange Commission, is available on our corporate website at www.benihana.com or can be obtained by writing us at:
8685 NW 53rd Terrace
Miami, Florida 33166
TRANSFER AGENT AND REGISTRAR
American Stock Transfer & Trust Company
Shareholder Services Group
10150 Mallard Creek Drive, Suite 307
Charlotte, North Carolina 28262
(800) 937-5449
CORPORATE HEADQUARTERS
8685 Northwest 53rd Terrace
Miami, Florida 33166
(305) 593-0770
47
COMMON STOCK INFORMATION
Our common stock and Class A common stock are traded on the NASDAQ Global Select Market. There were 380 holders of record of our common stock and 389 holders of record of the Class A common stock at March 27, 2011.
The table below sets forth high and low prices for our common stock and Class A common stock for the periods indicated. The high and low prices have been adjusted as if the stock dividend had been in existence for the fiscal periods presented.
|
Fiscal Year Ended
|
||||||||||||||||
|
March 27, 2011
|
March 28, 2010
|
|||||||||||||||
|
COMMON STOCK
|
High
|
Low
|
High
|
Low
|
||||||||||||
|
1st Quarter
|
$ | 7.02 | $ | 5.58 | $ | 7.77 | $ | 2.44 | ||||||||
|
2nd Quarter
|
8.12 | 6.42 | 9.00 | 6.09 | ||||||||||||
|
3rd Quarter
|
8.47 | 7.57 | 6.91 | 3.50 | ||||||||||||
|
4th Quarter
|
9.30 | 7.97 | 6.59 | 4.04 | ||||||||||||
|
Fiscal Year Ended
|
||||||||||||||||
|
March 27, 2011
|
March 28, 2010
|
|||||||||||||||
|
CLASS A COMMON STOCK
|
High
|
Low
|
High
|
Low
|
||||||||||||
|
1st Quarter
|
$ | 6.86 | $ | 5.02 | $ | 7.50 | $ | 2.51 | ||||||||
|
2nd Quarter
|
8.15 | 6.17 | 8.25 | 5.40 | ||||||||||||
|
3rd Quarter
|
8.43 | 7.67 | 5.81 | 3.08 | ||||||||||||
|
4th Quarter
|
9.39 | 8.00 | 6.19 | 3.76 | ||||||||||||
The Class A common stock is identical to the common stock except that it gives the holder one-tenth (1/10) vote per share, voting together with our common stock as a single class on all matters except the election of directors. For election of directors, the Class A common stockholders vote as a class to elect 25% of the members of the board of directors.
We have not declared or paid a cash dividend on common equity since our organization and have no present intention of paying any dividends in the foreseeable future. We intend to retain all available cash for the operation and expansion of our business. In addition, our present credit agreement restricts the payment of cash dividends on all classes of common stock.
48
COMMON STOCK INFORMATION
Set forth below is a comparison of the five-year cumulative total return among our common stock, the NASDAQ Composite Index and the SIC Code Index for SIC Code 5812 (Retail – Eating Places), in each case assuming that $100 was invested on the last day of the fiscal year ended March 26, 2006. Stockholder returns over the indicated period should not be considered indicative of future stockholder returns.
COMPARISON OF 5-YEAR CUMULATIVE TOTAL RETURN AMONG
BENIHANA INC. COMMON STOCK, NASDAQ COMPOSIT INDEX AND SIC
CODE INDEX
BENIHANA INC. COMMON STOCK, NASDAQ COMPOSIT INDEX AND SIC
CODE INDEX
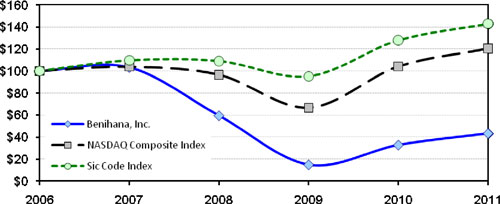
|
2006
|
2007
|
2008
|
2009
|
2010
|
2011
|
|||||||||||||||||||
|
Benihana, Inc.
|
$ | 100.00 | $ | 103.32 | $ | 59.50 | $ | 14.90 | $ | 32.85 | $ | 43.35 | ||||||||||||
|
NASDAQ Composite Index
|
$ | 100.00 | $ | 103.72 | $ | 96.45 | $ | 66.54 | $ | 104.09 | $ | 120.31 | ||||||||||||
|
Sic Code Index
|
$ | 100.00 | $ | 109.78 | $ | 109.13 | $ | 95.10 | $ | 128.11 | $ | 142.99 | ||||||||||||
49
CLASS A COMMON STOCK INFORMATION
Set forth below is a comparison of the five-year cumulative total return among our Class A common stock, the NASDAQ Composite Index and the SIC Code Index for SIC Code 5812, in each case assuming that $100 was invested on the last day of the fiscal year ended March 26, 2006. Stockholder returns over the indicated period should not be considered indicative of future stockholder returns.
COMPARISON OF 5-YEAR CUMULATIVE TOTAL RETURN AMONG
BENIHANA INC. CLASS A COMMON STOCK, NASDAQ COMPOSIT INDEX
AND SIC CODE INDEX
BENIHANA INC. CLASS A COMMON STOCK, NASDAQ COMPOSIT INDEX
AND SIC CODE INDEX
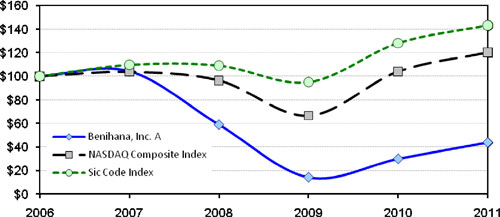
|
2006
|
2007
|
2008
|
2009
|
2010
|
2011
|
|||||||||||||||||||
|
Benihana, Inc. A
|
$ | 100.00 | $ | 104.28 | $ | 59.02 | $ | 14.29 | $ | 29.98 | $ | 43.85 | ||||||||||||
|
NASDAQ Composite Index
|
$ | 100.00 | $ | 103.72 | $ | 96.45 | $ | 66.54 | $ | 104.09 | $ | 120.31 | ||||||||||||
|
Sic Code Index
|
$ | 100.00 | $ | 109.78 | $ | 109.13 | $ | 95.10 | $ | 128.11 | $ | 142.99 | ||||||||||||
50