Attached files
| file | filename |
|---|---|
| 8-K - CURRENT REPORT - BROADRIDGE FINANCIAL SOLUTIONS, INC. | d8k.htm |
| EX-99.1 - PRESS RELEASE DATED MAY 10, 2011. - BROADRIDGE FINANCIAL SOLUTIONS, INC. | dex991.htm |
 ©
2011 Broadridge Financial Solutions, Inc.
Broadridge and the Broadridge logo are registered trademarks of Broadridge
Financial Solutions, Inc. May 10, 2011
Earnings Webcast & Conference Call
Third Quarter Fiscal Year 2011
Broadridge Financial Solutions, Inc.
Exhibit 99.2 |
 1
Forward-Looking Statements
This presentation and other written or oral statements made from time to time by representatives of
Broadridge may contain “forward-looking statements” within the meaning of the
Private Securities Litigation Reform Act of 1995. Statements that are not historical in
nature, such as our fiscal year 2011 financial guidance, and which may be identified by the use
of words like “expects,” “assumes,” “projects,”
“anticipates,” “estimates,” “we believe,” “could be” and other
words of similar meaning, are forward-looking statements. These statements are based
on management’s expectations and assumptions and are subject to risks and uncertainties
that may cause actual results to differ materially from those expressed. These risks and
uncertainties include those risk factors discussed in Part I, “Item 1A. Risk Factors” of our Annual
Report on Form 10-K for the fiscal year ended June 30, 2010 (the “2010 Annual Report”),
as they may be updated in any future reports filed with the Securities and Exchange
Commission. Any forward-looking statements are qualified in their entirety by
reference to the factors discussed in the 2010 Annual Report. These risks include: the
success of Broadridge in retaining and selling additional services to its existing clients and
in obtaining new clients; the pricing of Broadridge’s products and services; changes in laws and
regulations affecting the investor communication services provided by Broadridge; declines in
participation and activity in the securities markets; overall market and economic conditions
and their impact on the securities markets; any material breach of Broadridge security
affecting its clients’ customer information; the failure of Broadridge’s outsourced
data center services provider to provide the anticipated levels of service; any significant
slowdown or failure of Broadridge’s systems or error in the performance of Broadridge’s
services; Broadridge’s failure to keep pace with changes in technology and demands of its
clients; Broadridge’s ability to attract and retain key personnel; the impact of new
acquisitions and divestitures; and competitive conditions. Broadridge disclaims any
obligation to update any forward-looking statements, whether as a result of new
information, future events or otherwise.
This presentation may include certain Non-GAAP (generally accepted accounting principles)
financial measures in describing Broadridge’s performance. Management believes that such
Non-GAAP measures, when presented in conjunction with comparable GAAP measures provide
investors a more complete understanding of Broadridge’s underlying operational
results. These Non-GAAP measures are indicators that management uses to provide
additional meaningful comparisons between current results and prior reported results, and as a
basis for planning and forecasting for future periods. These measures should be considered in
addition to and not a substitute for the measures of financial performance prepared in
accordance with GAAP. The reconciliations of such measures to the comparable GAAP figures are
included in this presentation. |
 2
Today’s Agenda
Opening Remarks and Key Topics
Rich Daly, CEO
Third Quarter Fiscal Year 2011
Dan Sheldon, CFO
Results and Full Year Guidance
Summary
Rich Daly, CEO
Q&A
Rich Daly, CEO
Dan Sheldon, CFO
Rick Rodick, VP Investor Relations
Closing Remarks
Rich Daly, CEO |
 3
Opening Remarks
Key Topics:
Financial Highlights
Closed Sales and Revenue Growth Opportunities |
 4
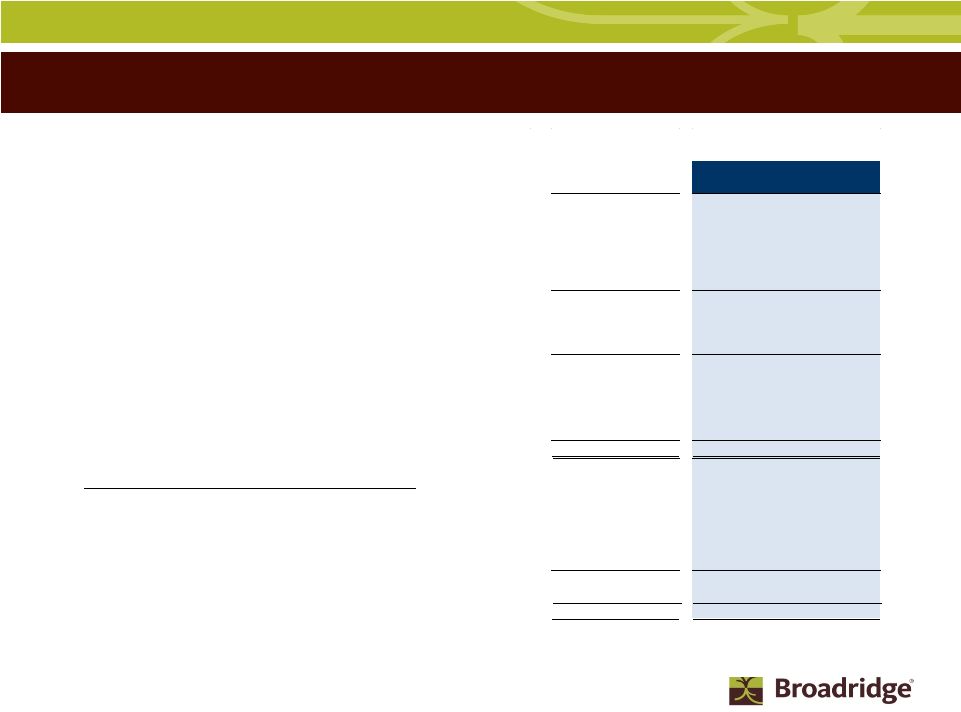
Financial Highlights
Revenues for the quarter were up 7% and in line with
expectations
Driven primarily by acquisitions, the Penson outsourcing services
agreement, higher volumes and revenues from net new business (defined as
closed sales less client losses), offset by lower event-driven (ED) revenues
(as anticipated)
Diluted earnings per share from continuing operations were up
$0.03 from last year to $0.25
Primarily due to the revenue increase and lower weighted-average shares
outstanding
Opportunistically repurchased about 3.6M Broadridge shares
during the quarter at an average price of approximately $22.82
per share
Fiscal year-to-date, we have repurchased about 8.3M Broadridge shares at
an average price of approximately $21.78 per share
|
 5
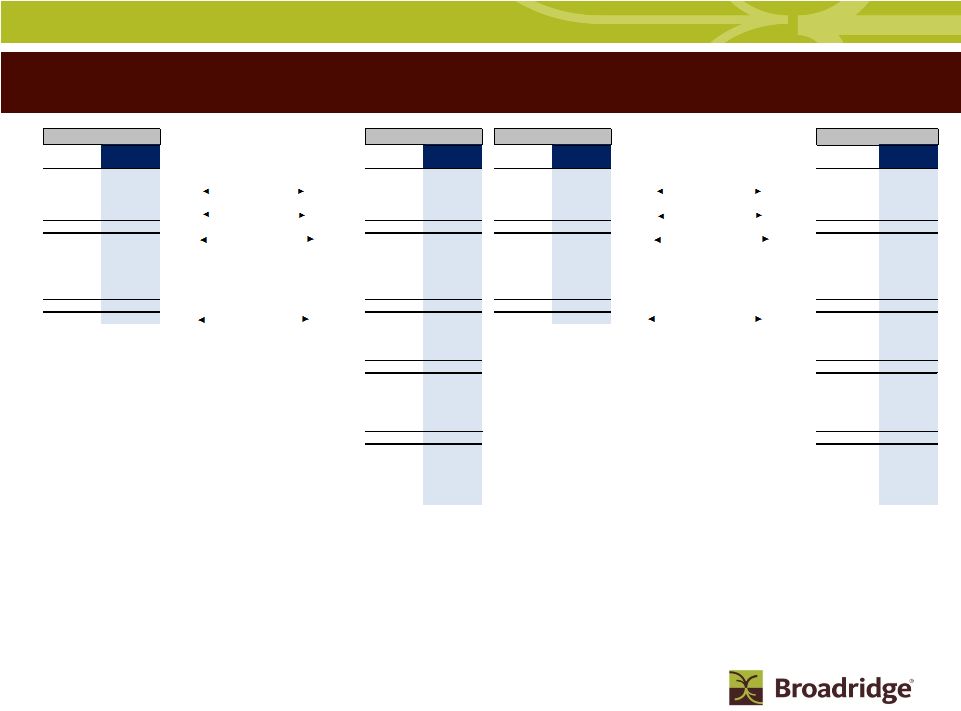
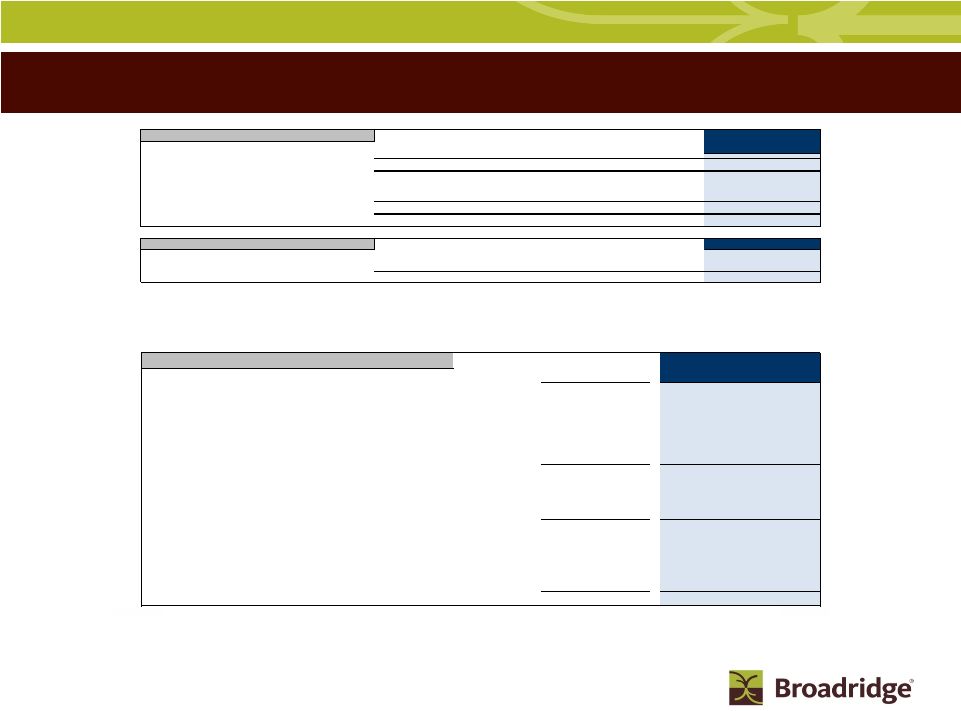
Closed Sales & Revenue Growth Opportunities
Closed sales for the quarter were $20M
Year-to-date closed sales of $92M
Year-to-date recurring revenue closed sales have been solid at $72M
Full year closed sales guidance is $135-180M and recurring revenue closed sales
guidance remains at $110-150M
Recurring revenue closed sales should translate into 5-7 percentage points of
future revenue growth
The marketplace reaction has been very positive to our recent acquisitions of
Matrix, Access Data, NewRiver, City Networks and Forefield
We have added more sales resources to support these acquired businesses
We recently entered into an agreement with Charles Schwab to expand the sales
reporting and data delivery capabilities now provided to Schwab’s
mutual fund partners As a central industry data hub, Broadridge is greatly
simplifying the exchange of information between manufacturers and
intermediaries |
 Access
Data Business Opportunity SCHWAB
Broker 2
Broker 3
Broker 4
Broker 5
Broker 6
Broker 7
Broker 8
Broker >
Fund 1
Fund 2
Fund 3
Fund 4
Fund 5
Fund 6
Fund 7
Fund 8
Fund >
Total Market Size Opportunity
$400 -
500 Million
Broker 1
Broker 2
Broker 3
Broker >
Fund 1
Fund 2
Fund 3
Fund >
Old Process
BR Process
BROADRIDGE
12
Solution
Modules
more in
development
Solution
Module
Solution
Module
Solution
Module
6 |
 7
Revenue Growth Drivers
Net
New
Business
Q3
+2%
with
sales
contributing
3%
and
retention
rates
at
99%
(loss
rate
1%)
Internal
growth
Q3
at
1%
and
saw
improvements
in
trades per day
and
Mutual Fund interims
Acquisitions in last 12 months performing at plan or better (revenue and EBITDA)
ED and Distribution still feeling impact from lower Mutual Fund Proxies and Corporate Actions
As expected, margins impacted by revenue mix, acquisitions and key initiatives
Historical CAGR
3Q
3Q YTD
Forecast
(FY05-FY10)
FY11
FY11
FY11
6%
Total Revenue Growth
7%
(5)%
(3)-(2)%
4%
Closed Sales
(Recurring)
3%
2%
2%
(2)%
Client Losses
(1)%
(1)%
(1)%
2%
Net New Business
2%
1%
1%
3%
Internal Growth
(a)
1%
1%
0-1%
0%
Acq/FX/Other
9%
5%
5%
5%
Total Recurring
12%
7%
6-7%
1%
Event-Driven
(b)
& Distribution
(5)%
(12)%
(9)%
EBIT Margin
10.1%
6.8%
12.7-13.4%
(a) Internal Growth includes SPS Equity & Fixed Income Trades, ICS Equity & Mutual Fund Stock
Record Growth, Transaction Reporting and Time & Materials (b) Event-Driven includes ICS
Proxy Contest/Specials, Mutual Fund Proxy and Marketing Communications Fulfillment |
 8
Segment Results & Forecast –
Investor Communication Solutions
Full-year revenue expected to be down slightly as compared to the previous
forecast due to lower distribution revenues. Full-year fee range
is on track Including
acquisitions,
YTD
recurring
fee
revenue
is
up
over
15%
with full year growth expected to be the
same
Revenue from closed sales is on track to contribute 5 points
Client revenue retention rate maintained at greater than 99%
Matrix and other acquisitions projected to contribute 11 points
Minimal impact expected from internal growth as quarter and YTD trends remain
flat. Mutual fund interim position growth of 9% offset lower volumes
in Transaction Reporting and Fulfillment. Equity position growth
expected to be flat As expected, ED activity remains low and full-year
ED guidance remains unchanged at ~$175M Third quarter margins benefited from
higher revenue, however, full-year continues to be impacted by lower ED
activity Revenue/Growth
EBIT/Growth
(Non-GAAP)
Margin/Growth
(Non-GAAP)
Q3:
$369M/ 3%
$30M/ 8%
8.2%/ 40 bps
YTD:
$942M/ (11)%
$39M/ (62)%
4.1%/ (560) bps
FY11:
$1,549 to 1,558M / (7)%
$210 to 219M / (23) to (20)%
13.5 to 14.1% / (280) to (220) bps |
 9
Revenue/Growth
EBIT/Growth
Margin/Growth
Q3 :
$154M / +15%
$27M / +11%
17.6% / (70) bps
YTD:
$442M / +11%
$67M / (8)%
15.2% / (330) bps
FY11:
$593 to 599M / +11 to 12%
$85 to 90M / (14) to (9)%
14.3 to 15.1% / (420) to (330) bps
9
Segment
Results
&
Forecast
–
Securities Processing Solutions
Q3 and YTD growth driven by contributions from closed sales, internal revenue
growth and acquisitions (Penson
and
City
Networks)
offset
by
carryover
loss
from
Bank
of
America/Merrill Lynch (BAML).
Acquisitions added 10% growth for the quarter and 9% YTD/FY. Penson will
also add an additional 2-3% revenue growth next year given timing of
conversions YTD closed sales of $43M versus $24M for the same period last
year. YTD includes previously disclosed closed sale to a large global
institutional client accounting for >$20M with no significant
revenue
contribution
expected
until
Q4
FY12.
Full
year
forecast
of $45-50M
Strong internal revenue growth in Q3 driven by continued improvement in both Equity
and Fixed Income trade volumes
Q3 and YTD margin decline driven by the impact of the lower Outsourcing margin due
to the on-going Penson conversion and the slight dilutive impact of City
Networks in the first year Excluding
the
Penson
outsourcing
services
agreement
and
the
City
Networks
acquisition,
revenue
grew
6% and margin improved to 21%
(Non-GAAP)
(Non-GAAP) |
 10
Revenue growth in the range of (3)-(2)%
Closed sales forecast for the year at $135-180M (Recurring $110-150M)
Non-GAAP Earnings before interest and taxes margin of 12.7-13.4%
Diluted Earnings Per Share:
GAAP EPS (continuing operations) in the range of $1.30-1.40
Diluted weighted-average outstanding shares of ~128M
Free cash flow (Non-GAAP) in the range of approximately $140-200M,
includes:
Increase in investment implementation cost of ~$35M (Penson and IBM)
Reversal
of
FY10
$30M
additional
contribution
to
working
capital
in FY11
Guidance does not take into consideration the effect of any future
acquisitions,
additional
debt
and/or
share
repurchases
in
excess
of the
repurchases needed to achieve our 128M weighted-average outstanding
shares guidance
Revolving
credit
facility
and
term
loan
mature
on
March
29,
2012
and are
expected to be renewed prior to maturity
Broadridge - FY11 Continuing Operations Financial Guidance Summary |
 11
Summary
We are staying the course
Third quarter results were solid
Core recurring revenue is strong and performed as expected
Event-driven revenues remain weak
We continue to make good progress on our three strategic initiatives
IBM, Penson and MSSB
Strong client revenue retention rate of 99%
Closed sales are solid and more profitable than in the past
Many large deals in progress
Acquisitions are adding significant value and performing above or near plan
New strategic initiatives, acquisitions and related sales providing meaningful
opportunities
No significant change in the regulatory environment
First annual Investor Day scheduled for June 22, 2011
Associates are focused and engaged |
 12
Q&A
There are no slides during this portion of the
presentation |
 13
Closing Comments
There are no slides during this portion of the
presentation |
 14
Appendix
Appendix |
 15
FY11 Financial Guidance
Figures in millions, except EPS
Revenues
EPS
Revenues
EPS
Revenues
EPS
Revenues
EPS
Revenues
EPS
FY10 (GAAP)
968
$
0.56
$
1,241
$
1.06
$
2,209
$
1.62
$
Core Business
Recurring
-
-
27
0.11
27
0.11
Sales (without MSSB)
16
0.07
30
0.11
46
0.18
Losses
(13)
(0.06)
(11)
(0.04)
(24)
(0.10)
Internal Growth
(3)
(0.01)
8
0.04
5
0.03
Event-Driven Fees
(84)
(0.25)
(32)
(0.09)
(116)
(0.34)
Distribution
(64)
(0.03)
(42)
(0.01)
(106)
(0.04)
Acquisitions
21
-
69
0.01
90
0.01
Key Initiatives
Penson
11
(0.04)
19
(0.04)
30
(0.08)
20
0.08
-
-
MSSB
12
-
7
0.02
19
0.02
5
0.03
-
0.03
IBM
-
(0.01)
(0.01)
(0.12)
0.24
Key Initiatives
23
(0.04)
26
(0.03)
49
(0.07)
25
(0.01)
-
0.27
Other
Restructuring
-
(0.05)
(0.05)
0.11
0.03
Expense Savings / FX / Other
(0.02)
7
0.08
7
0.06
Share Repurchases
0.02
0.09
0.11
Tax Rate
(0.06)
-
(0.06)
Interest Refinanced Debt
Total Change
(104)
(0.38)
55
0.11
(49)
(0.27)
FY11
(GAAP)
864
$
0.18
$
1,296
$
1.17
$
2,160
$
1.35
$
Note:
(A)
Shows only directional view for key initiatives discussed. Does not include forward
looking guidance for core business, acquistions, taxes or share repurchases.
2Q11 YTD
2H11
FY11
FY12
FY13
Actual
Mid-Point Guidance
Mid-Point Guidance
Key Initiatives
(A)
Key Initiatives
(A)
Circled numbers represent change from prior quarter which relates to postage
revenues (primarily related to mix of mailings). No EPS impact. |
  16
Segment Results & Forecast –
Other & Foreign Exchange (FX)
FY11:
Corporate
Expenses
and
Investments:
Full
year
run
rate
in
the
$20M
range,
consisting
of
corporate
expenses, excluding M&A activity, IBM ITO/ one-time charge
FX:
Full
year
low
and
high
ranges
assume
current
rates
and
forward
rates,
respectively
FY11 Range
3Q11
3Q11 YTD
Low
High
Other Fees Revenue
$0M
$0M
$1M
$1M
Other Fees Margin
$0M
$0M
$1M
$1M
Interest Expense
$(2)M
$(6)M
$(10)M
$(10)M
Corp. Expenses & Investments
$(7)M
$(17)M
$(28)M
$(31)M
FX
- P&L
- Revenue
$4M
$7M
$7M
$14M
- EBIT
$3M
$7M
$6M
$11M
- Transaction Activity
$0M
$(1)M
$0M
$0M |
 17
Broadridge 3Q and YTD from Continuing Operations
Revenue
($ in millions)
Earnings
Revenue
($ in millions)
Earnings
FY10
FY11
FY10
FY11
FY10
FY11
FY10
FY11
Q3
Q3
Q3
Q3
Q3 YTD
Q3 YTD
Q3 YTD
Q3 YTD
$356
$369
ICS
$28
$30
$1,060
$942
ICS
$102
$39
6%
3%
Growth % / Margin %
7.8%
8.2%
12%
-11%
Growth % / Margin %
9.7%
4.1%
$134
$154
SPS
$25
$27
$398
$442
SPS
$73
$67
-2%
15%
Growth % / Margin %
18.3%
17.6%
-6%
11%
Growth % / Margin %
18.5%
15.2%
$490
$523
Total Segments
$52
$57
$1,457
$1,384
Total Segments
$176
$106
4%
7%
Growth %
/
Margin %
10.7%
10.9%
7%
-5%
Growth %
/
Margin %
12.1%
7.7%
$0
$0
Other
($3)
($7)
$2
$0
Other
($10)
($17)
$1
$4
FX
*
$2
$3
($1)
$7
FX
*
$2
$6
$491
$527
Total Broadridge
$51
$53
$1,459
$1,391
Total Broadridge
$167
$95
6%
7%
Growth %
/
Margin %
10.4%
10.1%
8%
-5%
Growth %
/
Margin %
11.5%
6.8%
Interest & Other
($3)
($2)
Interest & Other
($8)
($6)
Total EBT
$48
$51
Total EBT
$159
$88
Margin %
9.9%
9.7%
Margin %
10.9%
6.4%
Income Taxes
($18)
($18)
Income Taxes
($50)
($32)
Tax Rate (a)
36.3%
36.2%
Tax Rate (a)
31.7%
36.2%
Total Net Earnings
$31
$33
Total Net Earnings
$109
$56
Margin %
6.3%
6.2%
Margin %
7.5%
4.1%
Diluted Shares
139
128
Diluted Shares
140
129
Diluted EPS (GAAP)
$0.22
$0.25
Diluted EPS (GAAP)
$0.78
$0.44
Diluted EPS Before 1-Times (Non-GAAP)
$0.22
$0.25
Diluted EPS Before 1-Times (Non-GAAP)
(b)
$0.72
$0.44
*
Includes impacts of FX P&L Margin and FX Transaction Activity
*
Includes impacts of FX P&L Margin and FX Transaction Activity
(a) FY10 Q3YTD Tax Rate of 31.7% is attributable to the release of a valuation
allowance on a deferred tax asset relating to tax loss carryforwards of
approximately $8M. Excluding the year-to-date benefit the FY10 Q3
YTD tax rate would be 36.7% (b) FY10 Q3 YTD Diluted EPS Before 1-Times
(Non-GAAP) excludes the release of a valuation allowance on a deferred tax
asset relating to tax loss carryforwards of approximately $8M (gain reflected in
Income Taxes) $0.06 impact to EPS. |
 18
Broadridge FY11 Guidance from Continuing Operations
($ in millions)
FY10
FY11 Range
FY10
FY11 Range
Actual
Low
High
Actual
Low
High
$1,670
$1,549
$1,558
ICS
$273
$210
$219
9%
-7%
-7%
Growth % / Margin %
16.3%
13.5%
14.1%
$536
$593
$599
SPS
$99
$85
$90
-4%
11%
12%
Growth % / Margin %
18.5%
14.3%
15.1%
$2,205
$2,142
$2,157
Total Segments
$372
$294
$310
6%
-3%
-2%
Growth %
/
Margin %
16.9%
13.7%
14.4%
$2
$1
$1
Other
($25)
($27)
($30)
$1
$7
$14
FX
*
$5
$6
$11
$2,209
$2,150
$2,171
Total Broadridge
$352
$274
$291
7%
-3%
-2%
Growth % / Margin %
15.9%
12.7%
13.4%
Interest & Other
($10)
($10)
($10)
Total EBT
$342
$264
$281
FY11 Range
Margin %
15.5%
12.3%
12.9%
Segments
Low
High
ICS
$90
$130
Income Taxes
($117)
($98)
($102)
SPS
$45
$50
Tax Rate (a)
34.2%
37.0%
36.2%
Total
$135
$180
Total Net Earnings
$225
$166
$179
Margin %
10.2%
7.7%
8.2%
Diluted Shares
139
128
128
Diluted EPS (GAAP)
$1.62
$1.30
$1.40
$1.56
$1.30
$1.40
* Includes impact of FX P&L Margin and FX Transaction Activity
(a) FY10 Full
Year
Tax
Rate
of
34.2%
is
attributable
to
the
release
of
a
valuation
allowance
on
a
deferred
tax
asset
relating
to
tax
loss
carryforwards
of
approximately
$8M.
Excluding the year-to-date benefit the FY10 Full Year tax rate would be
36.5% (b) FY10 Full Year Diluted EPS Before 1-Times (Non-GAAP)
excludes the release of a valuation allowance on a deferred tax asset relating to tax loss carryforwards
of
approximately
$8M
(gain
reflected
in
Income
Taxes).
$0.06
impact
to
EPS.
Guidance does not take into consideration the effect of any future acquisitions,
additional debt and/or share repurchases in excess of the repurchases needed
to be within our 128 million weighted-average outstanding shares guidance.
Closed Sales
Revenue
Earnings
Diluted EPS Before 1-Times (Non-GAAP)
(b) |
 19
Cash Flow –
3Q11 Results and FY11 Forecast
(a)
Guidance
does
not
take
into
consideration
the
effect
of
any
future
acquisitions,
additional
debt
and/or
share
repurchases
in
excess
of
the
repurchases needed to achieve our 128 million weighted-average outstanding
shares guidance. Unaudited
(In millions)
Nine Months Ended
March 2011
Low
High
Net earnings from continuing operations (GAAP)
57
$
166
$
179
$
Depreciation and amortization (includes other LT assets)
51
65
75
Stock-based compensation expense
23
30
30
Other
(7)
(5)
5
Subtotal
124
256
289
Working capital changes
(68)
(30)
(25)
Long-term assets & liabilities changes
(18)
(30)
(20)
Net cash flow provided by continuing operating activities
38
196
244
Cash Flows From Investing Activities
IBM / ITO data center investment
(6)
(10)
(5)
Capital expenditures & software purchases
(24)
(45)
(40)
Free cash flow (Non-GAAP)
8
$
141
$
199
$
Cash Flows From Other Investing and Financing Activities
Acquisitions
(293)
(293)
(293)
Stock repurchases net of options proceeds
(176)
(176)
(176)
Proceeds from Short-term borrowing
240
200
200
Dividends paid
(56)
(76)
(76)
Other (includes Disc Ops)
15
10
12
Net change in cash and cash equivalents
(262)
(194)
(134)
Cash and cash equivalents, at the beginning of year
413
413
413
Cash and cash equivalents, at the end of period
151
$
219
$
279
$
FY11 Range
(a)
Free Cash Flow
(Non-GAAP)
: |
 20
Closed Sales to Revenue Contribution
($ in millions)
Forecast
Recurring
(B)
FY09
(A)
FY10
FY11
ICS
(C)
$55
$80
$65-100
~ Revenue Contribution Year
1-3 55%
35%
10%
50%
40%
10%
20%
50%
15%
SPS
$30
$40
$45-50
~ Revenue Contribution Year
1-3 33%
67%
0%
10%
40%
50%
10%
20%
60%
Event-Driven
$45
$55
$25-30
~ Revenue Contribution Year
1-3 70%
10%
20%
80%
10%
10%
50%
50%
0%
Total Closed Sales
(B)
$130
$175
$135-180
~ Revenue Contribution Year
1-3 50%
30%
20%
50%
30%
20%
25%
35%
30%
(A)
FY09 Closed Sales were adjusted down to $130M from $140M. The $10M difference
relates to the Penson Canada deal that is now being reflected as an
acquisition. (B)
FY11 Recurring Revenue Closed Sales are expected to contribute revenue over a four
year period. (C)
FY11 Closed Sales include approximately $9M related to acquisitions.
|
 21
Revenues and Closed Sales FY05-FY11
($ in millions)
FY05-10
Forecast
FY10-11
Recurring Fee Revenues
FY05
FY06
FY07
FY08
FY09
FY10
CAGR
FY11
Growth Rates
ICS
414
$
480
$
481
$
521
$
547
$
575
$
7%
$607-612
~6%
Growth
16%
0%
8%
5%
5%
SPS
459
$
458
$
509
$
515
$
537
$
513
$
2%
$521-527
2-3%
Growth
0%
11%
1%
4%
-4%
Segment Recurring Fee Revenues
873
$
937
$
990
$
1,036
$
1,084
$
1,088
$
5%
$1,127-1,138
4-5%
Growth
7%
6%
5%
5%
0%
Acquisitions
0
$
18
$
28
$
28
$
33
$
45
$
NM*
$162
NM*
Total Recurring Fee Revenues
873
$
955
$
1,018
$
1,064
$
1,117
$
1,133
$
5%
$1,289-1,300
14-15%
9%
7%
5%
5%
1%
Event-Driven
158
$
186
$
241
$
237
$
216
$
292
$
13%
$175
~(40)%
Growth
18%
30%
-2%
-9%
35%
Distribution
649
$
730
$
821
$
808
$
757
$
781
$
4%
$680-682
~(13)%
Growth
12%
12%
-2%
-6%
3%
Other/FX
(25)
$
(19)
$
(12)
$
22
$
(17)
$
4
$
NM*
$8-14
NM*
Total BR Revenues
1,656
$
1,853
$
2,067
$
2,131
$
2,073
$
2,209
$
6%
$2,150-2,171
(3)-(2)%
Growth
12%
12%
3%
-3%
7%
Recurring Closed Sales
77
$
92
$
63
$
82
$
95
$
119
$
9%
$110-150
Growth
19%
-32%
30%
16%
25%
ED Closed Sales
24
$
33
$
49
$
63
$
44
$
56
$
18%
$25-30
Growth
38%
48%
29%
-30%
27%
Total Closed Sales
101
$
125
$
112
$
145
$
139
$
175
$
12%
$135-180
Growth
24%
-10%
29%
-4%
26%
*NM= Not Meaningful
($ in millions)
FY05-10
Forecast
Event-Driven Fee Revenues
FY05
FY06
FY07
FY08
FY09
FY10
CAGR
FY11
Mutual Fund Proxy
51
$
61
$
79
$
92
$
55
$
150
$
24%
35
$
Mutual Fund Supplemental/ Pre-sale
70
$
76
$
88
$
86
$
95
$
83
$
3%
85
$
Contest/ Specials/ Other Communications
38
$
49
$
73
$
59
$
67
$
59
$
9%
55
$
Total Event-Driven Fee Revenues
158
$
186
$
241
$
237
$
216
$
292
$
13%
175
$
Growth
18%
30%
-2%
-9%
35%
Recurring Distribution Revenues
487
$
552
$
579
$
566
$
556
$
554
$
3%
~$540
Growth
13%
5%
-2%
-2%
0%
ED Distribution Revenues
162
$
178
$
242
$
242
$
201
$
227
$
7%
~$160
Growth
10%
36%
0%
-17%
13%
Total Distribution Revenues
649
$
730
$
821
$
808
$
757
$
781
$
4%
~$700
Growth
12%
12%
-2%
-6%
3% |
 22
Reconciliation of Non-GAAP to GAAP Measures
(a) Guidance
does
not
take
into
consideration
the
effect
of
any
future
acquisitions,
additional
debt
and/or
share
repurchases
in
excess
of
the
repurchases
needed
to achieve our 128 million weighted-average outstanding shares guidance.
(a) FY10 Full Year Diluted EPS Before 1-Times (Non-GAAP) excludes the
release of a valuation allowance on a deferred tax asset relating to tax loss carryforwards of approximately $8M (gain reflected in Income Taxes). $0.06
impact to EPS.
EBIT Reconciliation
3Q10
3Q11
YTD10
YTD11
FY10
FY11 Range (a)
($ in millions)
Actual
Actual
Actual
Actual
Actual
Low
High
EBIT (Non-GAAP)*
$51
$53
$167
$95
$352
$274
$291
Margin %
10.4%
10.1%
11.5%
6.8%
15.9%
12.7%
13.4%
Interest & Other
($3)
($2)
($8)
($6)
($10)
($10)
($10)
Total EBT (GAAP)
$48
$51
$159
$88
$342
$264
$281
Margin %
9.9%
9.7%
10.9%
6.4%
15.5%
12.3%
12.9%
EPS Reconciliation
Low
High
Diluted EPS from continuing operations (GAAP)
$0.22
$0.25
$0.78
$0.44
$1.62
$1.30
$1.40
One-time recognition of a deferred tax asset
-
-
($0.06)
-
($0.06)
-
-
Diluted EPS before One-Times (Non-GAAP) (a) $0.22
$0.25
$0.72
$0.44
$1.56
$1.30
$1.40
* Includes impact of FX Transaction Activity
Free Cash Flow Reconciliation
Nine Months Ended
($ in millions)
March 2011
Low
High
Net earnings from continuing operations (GAAP)
57
$
166
$
179
$
Depreciation and amortization (includes other LT assets)
51
65
75
Stock-based compensation expense
23
30
30
Other
(7)
(5)
5
Subtotal
124
256
289
Working capital changes
(68)
(30)
(25)
Long-term assets & liabilities changes
(18)
(30)
(20)
Net cash flow provided by continuing operating activities
38
196
244
Cash Flows From Investing Activities
IBM / ITO data center investment
(6)
(10)
(5)
Capital expenditures & software purchases
(24)
(45)
(40)
Free cash flow (Non-GAAP)
8
$
141
$
199
$
FY11 Range
(a)
Free Cash Flow
(Non-GAAP)
: |
 23
ICS Key Segment Revenue Stats
$ in millions
RC= Recurring
ED= Event-Driven
Fee Revenues
3Q10
3Q11
FY10 YTD
FY11 YTD
Type
Proxy
Equities
28.3
$
31.1
$
81.4
$
81.2
$
RC
Stock Record Position Growth
-4%
0%
-4%
-1%
Pieces
27.2
25.6
82.2
69.6
Mutual Funds
21.7
$
12.8
$
120.5
$
30.1
$
ED
Pieces
28.2
16.9
167.9
41.0
(11.667)
10
Contests/Specials
4.4
$
2.1
$
16.0
$
10.3
$
ED
Pieces
6.4
2.1
21.4
10.9
(3.333)
5
Total Proxy
54.4
$
46.0
$
217.9
$
121.6
$
Total Pieces
61.8
44.6
271.5
121.5
Notice and Access Opt-in %
61%
61%
57%
57%
Suppression %
46%
52%
52%
50%
Interims
Mutual Funds (Annual/Semi-Annual Reports/Annual Prospectuses)
26.2
$
30.0
$
67.5
$
76.5
$
RC
Position Growth
9%
8%
5%
9%
Pieces
135.6
146.4
358.3
386.1
Mutual Funds (Supplemental Prospectuses) & Other
16.0
$
14.3
$
36.0
$
34.1
$
ED
Pieces
96.4
86.4
205.2
198.1
-20
13.33333
Total Interims
42.2
$
44.3
$
103.5
$
110.6
$
Total Pieces
232.0
232.8
563.5
584.2
Transaction
Transaction Reporting/Customer Communications
42.3
$
45.4
$
105.6
$
118.0
$
RC
Reporting
Fulfillment
Post-Sale Fulfillment
18.6
$
17.7
$
56.6
$
53.8
$
RC
Pre-Sale Fulfillment
9.0
$
10.8
$
25.8
$
31.6
$
ED
Total Fulfillment
27.6
$
28.5
$
82.4
$
85.4
$
Other
Other -Recurring
(1)
3.8
$
33.6
$
10.1
$
49.2
$
RC
Communications
Other -
Event-Driven
(2)
11.2
$
11.3
$
28.7
$
25.6
$
ED
Total Other
15.0
$
44.9
$
38.8
$
74.8
$
Total Fee Revenues
181.5
$
209.1
$
548.2
$
510.4
$
Total Distribution Revenues
175.0
$
159.8
$
511.6
$
432.1
$
Total Revenues as reported -GAAP
356.5
$
368.9
$
1,059.7
$
942.5
$
FY11 Ranges
Low
High
Total RC Fees
119.2
$
157.8
$
321.2
$
378.7
$
~$700
Total ED Fees
62.3
$
51.3
$
227.0
$
131.7
$
~$175
FY11 Ranges
Low
High
Sales
4%
2%
3%
2%
2%
2%
Losses
-1%
0%
-2%
0%
0%
0%
Key
Net New Business
3%
2%
1%
2%
2%
2%
Revenue
Internal growth
0%
1%
0%
0%
0%
0%
Drivers
Recurring (Excluding Acquisitions)
3%
3%
1%
2%
2%
2%
Acquisitions
1%
8%
1%
4%
4%
4%
Total Recurring
4%
10%
2%
6%
6%
6%
Event-Driven
2%
-3%
8%
-9%
-7%
-7%
Distribution
1%
-4%
2%
-8%
-6%
-6%
TOTAL
7%
3%
12%
-11%
-7%
-7%
(1) Other Recurring Fee Revenues include Matrix, NewRiver, StockTrans, Access Data,
Forefield and Tax Reporting. (2) Other Event-Driven includes 3.3M pieces
for 3Q10 and 2.5M for 3Q11, primarily related to corporate actions. Note:
Certain prior period amounts have been reclassified to conform with current period presentation |
 24
SPS and Outsourcing Key Segment Revenue Stats
$ in millions
RC= Recurring
ED= Event-Driven
3Q10
3Q11
YTD10
YTD11
Type
Equity
Transaction-Based
Equity Trades
57.6
$
64.4
$
176.5
$
178.6
$
RC
Internal Trade Volume
(1)
1,532
1,725
1,497
1,541
Internal Trade Growth
0%
13%
-3%
3%
Trade Volume (Average Trades per Day in '000)
(2) (3)
1,556
1,746
1,516
1,559
Non-Transaction
Other Equity Services
51.5
$
53.3
$
145.4
$
158.2
$
RC
Total Equity
109.1
$
117.7
$
321.9
$
336.8
$
Fixed Income
Transaction-Based
Fixed Income Trades
[4]
11.3
$
14.4
$
35.1
$
41.7
$
RC
Internal Trade Volume
(1)
279
332
280
321
Internal Trade Growth
-7%
19%
-8%
15%
Trade Volume (Average Trades per Day in '000)
(3)
279
336
280
323
Non-Transaction
Other Fixed Income Services
[4]
7.0
$
7.2
$
22.1
$
21.8
$
RC
Total Fixed Income
18.3
$
21.6
$
57.2
$
63.5
$
Outsourcing
Outsourcing
6.2
$
14.6
$
18.4
$
41.3
$
# of Clients
7
11
7
11
Total
Net
Revenue
as
reported
-
GAAP
133.6
$
153.9
$
397.5
$
441.7
$
FY11 Ranges
Q2
Low
High
Sales
6%
3%
5%
4%
4%
4%
Losses
-4%
-2%
-4%
-4%
-3%
-3%
Key
Net New Business
2%
1%
1%
0%
1%
1%
Revenue
Transaction & Non-transaction
-2%
6%
-3%
4%
3%
4%
Drivers
Concessions
-2%
-1%
-4%
-2%
-2%
-2%
Internal growth
-4%
5%
-7%
2%
1%
2%
Acquisitions
0%
9%
0%
9%
9%
9%
TOTAL
-2%
15%
-6%
11%
11%
12%
(3) Prior Year's trade volume adjusted for comparability.
(4) Fixed
Income
FY10
Trade
revenue
adjusted
to
reclassify
$0.5M
mortgage
product
revenue
to
other
fixed
income
services,
$1.2M
YTD.
(2) Equity Trade volume adjusted to excludes trades processed under fixed priced
contracts. Management believes excluding this trade volume presents a
stronger correlation between trade volume and Equity Trade revenue.
(1) 3Q10 Internal Trade Volume previously was reported as 1,516 and 277 for
Equities and Fixed Income, respectively. YTD10 Internal Trade Volume
previously was reported as 1,482 and 263 for Equities and Fixed Income,
respectively. These numbers were adjusted to reflect Losses and Sales in order to
present consistent business for the purpose of calculating internal trade
growth. |
 25
Refers
primarily
to
information
required
to
be
provided
by
mutual
funds
to
supplement
information
previously
provided
in
an
annual
mutual
fund
prospectus
(e.g.,
change
in
portfolio
managers,
closing
funds
or
class
of
shares
to
investors,
or
restating
or
clarifying
items
in
the
original
prospectus).
The
events
could
occur
at
any
time
throughout
the
year.
Refers to the proxy services we provide in connection with stockholder meetings
held outside of the normal annual meeting cycle and are primarily driven by special events (e.g., mergers
and
acquisitions
in
which
the
company
being
acquired
is
a
public
company and needs to solicit the approval of its stockholders).
Refers
to
communications
provided
by
corporate
issuers
and
investment
companies
to
investors
including
newsletters,
notices, tax information, marketing materials and other information not
required to be distributed by regulation.
Mutual
Funds
(Supplemental
Prospectuses)
–
Refers to the services we provide investment companies in connection with
information they are required by regulation to distribute periodically to
their investors. These reports contain pertinent information such as holdings, fund performance, and other required disclosure.
Refers primarily to the printing and distribution of account statements, trade
confirmations and tax reporting documents to account holders, including electronic delivery and
archival services.
Refers
primarily
to
the
distribution
of
prospectuses,
offering
documents,
and
required
regulatory disclosure information to investors in connection with purchases of
securities.
Refers to the distribution of marketing literature, welcome kits, enrollment kits,
and investor information to prospective investors, existing stockholders and other targeted recipients
on behalf of broker-dealers, mutual fund companies and 401(k)
administrators. Refers to the services we provide in connection with the
distribution of communications material not included in the above definitions such as non-objecting beneficial owner (NOBO) lists, and
corporate actions such as mergers, acquisitions, and tender offer
transactions Refers
to
the
proxy
services
we
provide
when
a
separate
agenda
is
put
forth
by
one
or
more
stockholders
that
is
in opposition to the proposals presented by management of
the company which is separately distributed and tabulated from the company’s
proxy materials. Refers to the proxy services we provide for funds, classes
or trusts of an investment company. Open-ended mutual funds are not required to have annual
meetings. As a result, mutual fund proxy services provided to open-ended mutual
funds are driven by a "triggering event." These triggering events can be a change in
directors, fee structures, investment restrictions, or mergers of funds.
Refers to the proxy services we provide in connection with annual stockholder
meetings for publicly traded corporate issuers. Annual meetings of public companies include
shares held in "street name" (meaning that they are held of record by
brokers or banks, which in turn hold the shares on behalf of their clients, the ultimate beneficial owners) and shares
held in "registered name" (shares registered directly in the names of their
owners). Broadridge ICS Definitions
Equities
–
Mutual
Funds
–
Contest –
Specials –
Mutual
Funds
(Annual/Semi-Annual
Reports/Annual
Prospectuses)
–
Transaction Reporting
–
Post-Sale
Fulfillment
–
Pre-Sale
Fulfillment
–
Other –
Other –
Proxy
Interims
Transaction Reporting
Fulfillment
Other Communications |
 26
Use of Material Contained Herein
The
information
contained
in
this
presentation
is
being
provided
for your convenience and
information only. This information is accurate as of the date of its initial
presentation. If you plan to use this information for any purpose,
verification of its continued accuracy is your responsibility.
Broadridge assumes no duty to update or revise the information contained in
this presentation. You may reproduce information contained in this
presentation provided you do not alter, edit, or delete any of the content and
provided you identify the source of the information as Broadridge Financial
Solutions, Inc., which owns the copyright.
Financial information presented for periods prior to the March 30, 2007
spin-off of Broadridge from Automatic Data Processing, Inc.
(“ADP”) represents the operations of the brokerage services
business which were operated as part of ADP. Broadridge’s
financial results for periods before the spin-off from ADP may not be
indicative of our future performance and do not necessarily reflect what our
results would have been had Broadridge operated as a separate,
stand-alone entity during the periods presented, including changes in
our operations and capitalization as a result of the spin-off from
ADP.
Broadridge and the Broadridge logo are registered trademarks of Broadridge
Financial Solutions, Inc. |