Attached files
| file | filename |
|---|---|
| 8-K - 8-K - HMS HOLDINGS CORP | a11-11087_38k.htm |
| EX-99.1 - EX-99.1 - HMS HOLDINGS CORP | a11-11087_3ex99d1.htm |
Exhibit 99.2
|
|
Q1 2011 Earnings April 29, 2011 Bill Lucia, CEO Walter Hosp, CFO |
|
|
Discussion Outline Q1 2011 Financial Performance New Business Strategic Progress Q&A 2 |
|
|
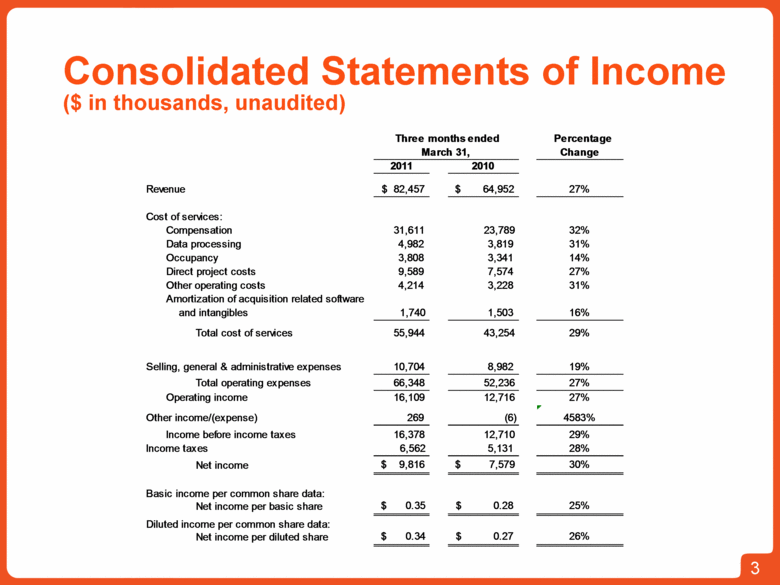
3 Consolidated Statements of Income ($ in thousands, unaudited) Three months ended Percentage March 31, Change 2011 2010 Revenue $ 82,457 $ 64,952 27% Cost of services: Compensation 31,611 23,789 32% Data processing 4,982 3,819 31% Occupancy 3,808 3,341 14% Direct project costs 9,589 7,574 27% Other operating costs 4,214 3,228 31% Amortization of acquisition related software and intangibles 1,740 1,503 16% Total cost of services 55,944 43,254 29% Selling, general & administrative expenses 10,704 8,982 19% Total operating expenses 66,348 52,236 27% Operating income 16,109 12,716 27% Other income/(expense) 269 (6) 4583% Income before income taxes 16,378 12,710 29% Income taxes 6,562 5,131 28% Net income $ 9,816 $ 7,579 30% Basic income per common share data: Net income per basic share $ 0.35 $ 0.28 25% Diluted income per common share data: Net income per diluted share $ 0.34 $ 0.27 26% |
|
|
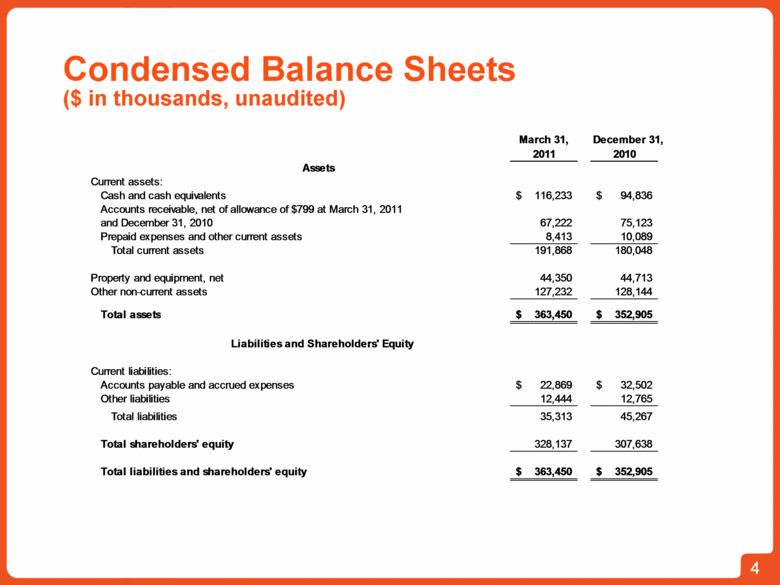
4 Condensed Balance Sheets ($ in thousands, unaudited) March 31, December 31, 2011 2010 Assets Current assets: Cash and cash equivalents $ 116,233 $ 94,836 Accounts receivable, net of allowance of $799 at March 31, 2011 and December 31, 2010 67,222 75,123 Prepaid expenses and other current assets 8,413 10,089 Total current assets 191,868 180,048 Property and equipment, net 44,350 44,713 Other non-current assets 127,232 128,144 Total assets $ 363,450 $ 352,905 Liabilities and Shareholders' Equity Current liabilities: Accounts payable and accrued expenses $ 22,869 $ 32,502 Other liabilities 12,444 12,765 Total liabilities 35,313 45,267 Total shareholders' equity 328,137 307,638 Total liabilities and shareholders' equity $ 363,450 $ 352,905 |
|
|
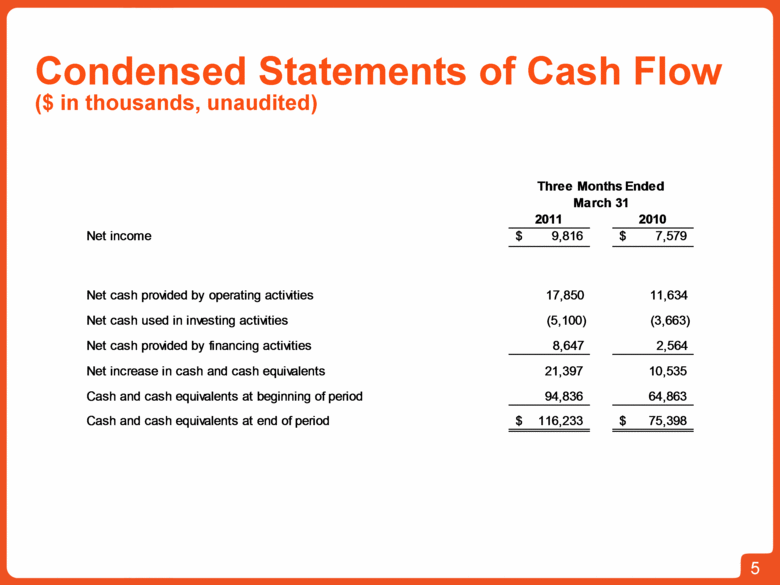
5 Condensed Statements of Cash Flow ($ in thousands, unaudited) Three Months Ended March 31 2011 2010 Net income $ 9,816 $ 7,579 Net cash provided by operating activities 17,850 11,634 Net cash used in investing activities (5,100) (3,663) Net cash provided by financing activities 8,647 2,564 Net increase in cash and cash equivalents 21,397 10,535 Cash and cash equivalents at beginning of period 94,836 64,863 Cash and cash equivalents at end of period $ 116,233 $ 75,398 |
|
|
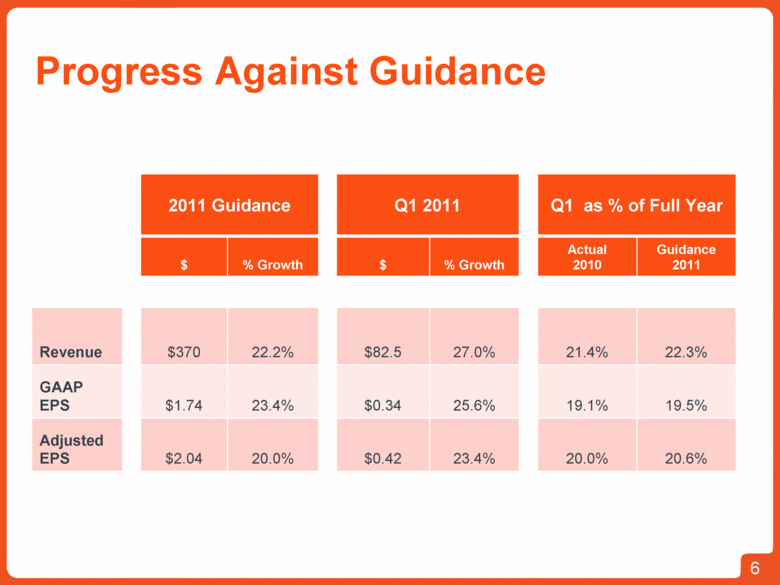
6 Progress Against Guidance 2011 Guidance Q1 2011 Q1 as % of Full Year $ % Growth $ % Growth Actual 2010 Guidance 2011 Revenue $370 22.2% $82.5 27.0% 21.4% 22.3% GAAP EPS $1.74 23.4% $0.34 25.6% 19.1% 19.5% Adjusted EPS $2.04 20.0% $0.42 23.4% 20.0% 20.6% |
|
|
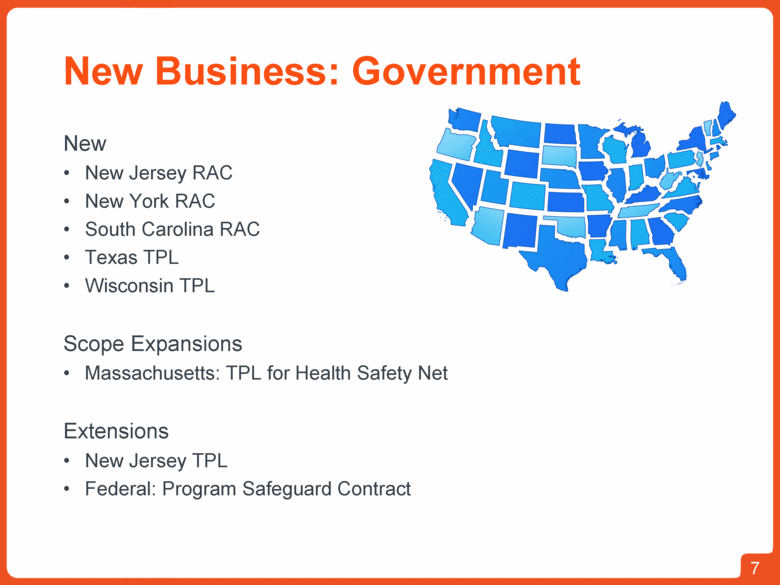
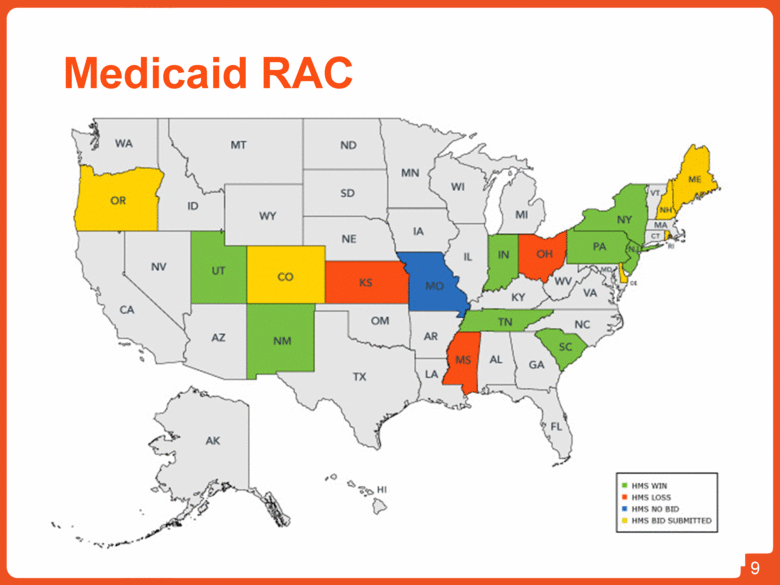
New Business: Government New New Jersey RAC New York RAC South Carolina RAC Texas TPL Wisconsin TPL Scope Expansions Massachusetts: TPL for Health Safety Net Extensions New Jersey TPL Federal: Program Safeguard Contract 7 |
|
|
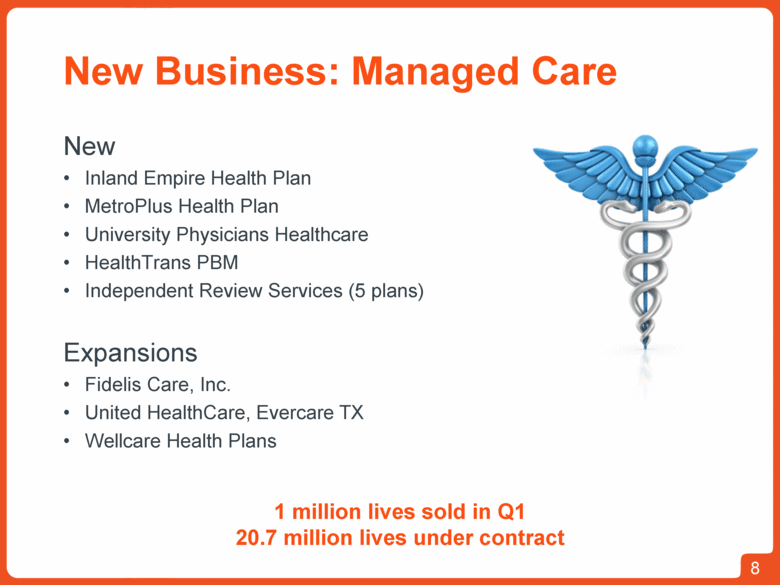
New Business: Managed Care New Inland Empire Health Plan MetroPlus Health Plan University Physicians Healthcare HealthTrans PBM Independent Review Services (5 plans) Expansions Fidelis Care, Inc. United HealthCare, Evercare TX Wellcare Health Plans 8 1 million lives sold in Q1 20.7 million lives under contract |
|
|
Medicaid RAC 9 |
|
|
Strategic Progress Strategic sales across markets RAC footprint expanded 3:1 stock split scheduled for July 2011 Strong outlook for 2011-2012 10 |
|
|
11 Safe Harbor Statement This Press Release contains “forward-looking statements” within the meaning of the U.S. Private Securities Litigation Reform Act of 1995. Such statements give our expectations or forecasts of future events; they do not relate strictly to historical or current facts. Forward-looking statements can be identified by words such as “anticipates,” “estimates,” “expects,” “projects,” “intends,” “plans,” “believes,” “will,” “target,” “seeks,” “forecast” and similar expressions. In particular, these include statements relating to future actions, business plans, objects and prospects, and future operating or financial performance. Forward-looking statements are based on our current expectations and assumptions regarding our business, the economy and other future conditions. Should known or unknown risks or uncertainties materialize, or should underlying assumptions prove inaccurate, actual results could differ materially from past results and those anticipated, estimated or projected. We caution you therefore against relying on any of these forward-looking statements. Factors that could cause or contribute to such differences include, but are not limited to: the development by competitors of new or superior services or products or the entry into the market of new competitors; all the risks inherent in the development, introduction, and implementation of new products and services; the loss of a major customer, customer dissatisfaction or early termination of customer contracts triggering significant costs or liabilities; variations in our results of operations; negative results of government reviews, audits or investigations to verify our compliance with contracts and applicable laws and regulations; changing conditions in the healthcare environment, particularly as they relate to current healthcare reform initiatives; government regulatory, political and budgetary pressures that could affect the procurement practices and operations of healthcare organizations, reducing the demand for our services; and, our failure to comply with laws and regulations governing health data or to protect such data from theft and misuse. A further description of risks, uncertainties, and other matters can be found in the Company’s Annual Report on Form 10-K for the fiscal year ended December 31, 2010, a copy of which may be obtained from the Company’s website at www.hms.com under the “Investor Relations” tab. Any forward-looking statements made by us in this Press Release speak only as of the date of this Press Release. Factors or events that could cause actual results to differ may emerge from time to time and it is not possible for us to predict all of them. We undertake no obligation to publicly update forward-looking statements, whether as a result of new information, future events or otherwise, except as may be required by law. |
|
|
12 NASDAQ: HMSY |

