Attached files
| file | filename |
|---|---|
| EX-32.1 - EXHIBIT 32.1 - SOCKET MOBILE, INC. | k10ex32_1.htm |
| EX-31.1 - EXHIBIT 31.1 - SOCKET MOBILE, INC. | k10ex31_1.htm |
| EX-23.1 - EXHIBIT 23.1 - SOCKET MOBILE, INC. | k10ex23_1.htm |
| EX-31.2 - EXHIBIT 31.2 - SOCKET MOBILE, INC. | k10ex31_2.htm |
UNITED
STATES
SECURITIES AND EXCHANGE COMMISSION
WASHINGTON, DC 20549
FORM 10-K
|
|
ANNUAL REPORT PURSUANT TO SECTION 13 or 15(d) OF THE SECURITIES EXCHANGE ACT OF 1934 |
For the fiscal year ended December 31, 2010
|
|
TRANSITION REPORT PURSUANT TO SECTION 13 OR 15(d) OF THE SECURITIES EXCHANGE ACT OF 1934 For the transition period from ____________ to ____________ |
Commission file number 1-13810
SOCKET MOBILE, INC.
(Exact name of registrant as specified in its charter)
|
|
|
|
|
|
39700 Eureka Drive, Newark, CA 94560
(Address of principal executive offices including zip code)
(510) 933-3000
(Registrant's telephone number, including area code)
Securities registered pursuant to Section 12(b) of the Exchange Act:
|
|
|
|
|
|
|
|
Securities registered
pursuant to Section 12(g) of the Exchange Act:
None
Indicate by check mark if the registrant is a well-known seasoned issuer, as defined in Rule 405 of the Securities Act. YES [ ] NO [X]
Indicate by check mark if the registrant is not required to file reports pursuant to Section 13 or Section 15(d) of the Act. YES [ ] NO [X]
Indicate by check mark whether the registrant (1) has filed all reports required to be filed by Section 13 or 15(d) of the Securities Exchange Act of 1934 during the preceding 12 months (or for such shorter period that the registrant was required to file such reports), and (2) has been subject to such filing requirements for the past 90 days. YES [X] NO [ ]
Indicate by check mark whether the registrant has submitted electronically and posted on its corporate Web site, if any, every Interactive Data File required to be submitted and posted pursuant to Rule405 of Regulation S-T (§ 232.405 of this chapter) during the preceding 12 months (or for such shorter period that the registrant was required to submit and post such files). YES [ ] NO [ ]
Indicate by check mark if disclosure of delinquent filers pursuant to Item 405 of Regulation S-K (§ 229.405 of this chapter) is not contained herein, and will not be contained, to the best of registrant's knowledge, in definitive proxy or information statements incorporated by reference in Part III of this Form 10-K or any amendment to this Form 10-K. [X]
Indicate by check mark whether the registrant is a large accelerated filer, an accelerated filer, a non-accelerated filer, or a smaller reporting company. See the definitions of "large accelerated filer," "accelerated filer," and "smaller reporting company" in Rule 12b-2 of the Exchange Act. Large accelerated filer [ ] Accelerated filer [ ] Non-accelerated filer [ ] Smaller reporting company [X]
Indicate by check mark whether the registrant is a shell company (as defined in Rule 12b-2 of the Exchange Act). YES [ ] NO [X]
As of June 30, 2010, the aggregate market value of the registrant's Common Stock ($0.001 par value) held by non-affiliates of the registrant was $8,544,879 based on the closing sale price as reported on the National Association of Securities Dealers Automated Quotation Capital Market System.
Number of shares of Common Stock ($0.001 par value) outstanding
as of March 10, 2011: 4,084,476 shares
DOCUMENTS INCORPORATED BY REFERENCE
Items 10, 11, 12, 13, and 14 of Part III are incorporated by reference from the Registrant's Proxy Statement for the Annual Meeting of Stockholders to be held on April 27, 2011. Such Proxy Statement will be filed within 120 days after the end of the fiscal year covered by this Annual Report on Form 10-K.
PART I
This Annual Report contains forward-looking statements within the meaning
of Section 27A of the Securities Act of 1933, as amended, and Section 21E of
the Securities Exchange Act of 1934, as amended. These statements include statements
forecasting our future financial condition and results, our future operating
activities, market acceptance of our products, expectations for general market
growth of handheld computers and other mobile computing devices, growth in demand
for our products, expansion of the markets that we serve, expansion of the distribution
channels for our products, adoption of our embedded products by third-party
manufacturers of electronic devices, and the timing of the introduction and
availability of new products, as well as other forecasts discussed under "Management's
Discussion and Analysis of Financial Condition and Results of Operations."
Words such as "may," "will," "predicts," "anticipates,"
"expects," "intends," "plans," "believes,"
"seeks," "estimates," variations of such words, and similar
expressions are intended to identify such forward-looking statements. Such forward-looking
statements are based on current expectations, estimates, and projections about
our industry, management's beliefs, and assumptions made by management. These
forward-looking statements are not guarantees of future performance and are
subject to certain risks, uncertainties, and assumptions that are difficult
to predict; therefore, actual results and outcomes may differ materially from
what is expressed or forecasted in any such forward looking statements. Factors
that could cause actual results and outcomes to differ materially include, but
are not limited to: continued weakness in the U.S. and world economy generally
and in the markets we serve in particular; the risk of delays in the availability
of our products due to technological, market or financial factors including
the availability of product components and necessary working capital; our ability
to successfully develop, introduce and market future products; our ability to
effectively manage and contain our operating costs; the availability of announced
third-party handheld computer hardware and software that our products are intended
to work with; product delays associated with new model introductions and product
changeovers by the makers of products that our products are intended to work
with; continued growth in demand for handheld computers; market acceptance of
emerging standards such as Bluetooth and wireless LAN and of our related connection,
data collection and mobile handheld computer products; the ability of our strategic
relationships to benefit our business as expected; our ability to enter into
additional distribution relationships; or other factors described in this Form
10-K including "Item 1A. Risk Factors" and recent Form 8-K and Form
10-Q reports filed with the Securities and Exchange Commission. We assume no
obligation to update such forward-looking statements or to update the reasons
why actual results could differ materially from those anticipated in such forward-looking
statements.
You should read the following discussion in conjunction with the consolidated financial statements and notes included elsewhere in this report, and other information contained in other reports and documents filed from time to time with the Securities and Exchange Commission.
The Company
We are a producer of mobile handheld computers and data collection products serving the business mobility markets. We offer a family of handheld computer products designed for business enterprise use and a wide range of data collection products including two dimensional (2D) and linear (1D) bar code scanners, Radio Frequency Identification (RFID) readers, and magnetic stripe readers. We also offer wearable ring scanners, customized versions of our handheld computers, embedded wireless LAN cards and Bluetooth modules as OEM products to third party companies. Our data collection products work with our handheld computers and our cordless hand scanners work with many third-party mobile handheld devices including smartphones, tablet computers, ultra-mobile personal computers (UMPCs), notebooks and desktop systems, adding data collection capabilities to these devices. Our products are designed to run or enhance mobile applications that enable the accessing, collection and processing of data by employees while mobile. Our mobile computing products utilize popular Bluetooth and wireless LAN connection technologies using management software we developed for ease of use. See "Products" for more information on the products that we produce.
1
We work closely with software application developers offering or developing vertical software applications for use with our handheld computers and for use with Smartphones, including phones running Apple iOS4, Google Android, RIM BlackBerry and Microsoft Windows operating systems for use with our cordless hand scanners. Healthcare and hospitality are two of the primary areas of focus for software application developers who have developed applications for use on our handheld computers, and a significant portion of our handheld computer sales now come from organizations within these two market segments. Other vertical markets benefiting from mobile solutions include retail merchandising, automotive, government and education. These mobile solutions are designed to improve the productivity of business enterprises and service providers by automating manual tasks, improving the quality of information collected, and enhancing mobile productivity by processing and transferring information from remote locations and mobile devices to the business or medical enterprise, and then if required, back to the remote locations and mobile devices. See "Vertical Market Applications", "Market Dynamics" and "Marketing Strategy" for more information on the markets that we serve and the application developers who have developed applications for the mobile enterprise.
We believe growth in the mobile workforce along with technical advances and cost reductions in mobile devices, Smartphones and networking technologies along with the pervasive use of the Internet are driving broader adoption of mobile computing solutions. Our products are designed to address the growing need for mobile computing by today's mobile workforce by enabling them to run or enhance mobile applications that allow access to business data files, or collect and process data while mobile, thereby enhancing their productivity and allowing them to exploit time sensitive opportunities and improve customer satisfaction. Overall, our hardware products enable mobile third-party applications to become complete mobile data collection and connectivity solutions.
We also make available to original equipment manufacturers ("OEMs") our wearable ring scanners, customized versions of our handheld computers, component Bluetooth and wireless LAN technologies. We customize these products and components for our use in our own products and leverage that investment through the sale of modified versions or modules and plug-in cards to OEM manufacturers to embed into their products, including driver and device management software that is designed to simplify the ability of mobile employees to get and stay connected with Wi-Fi as well as with Bluetooth.
Total employee headcount on December 31, 2010 was 64 people. We subcontract the manufacturing of all of our products to independent third-party contract manufacturers located in the U.S., China and Taiwan who have the equipment, know-how and capacity to manufacture products to our specifications. Our handheld computers and data collection products are sold through a worldwide network of distributors and resellers, vertical industry partners, and value added resellers (VARs). Our OEM products are sold directly to the original equipment manufacturers. See "Personnel," "Sales and Marketing," and "Manufacturing" for additional information about our personnel, sales and marketing and manufacturing operations.
2
We have financed our operations since inception primarily from the sale of equity capital. In November 2010 we issued $1 million in 18 month convertible notes convertible into common stock at the option of the holder to provide additional working capital. In February 2011 we issued $500,000 in common stock to our primary contract manufacturer in exchange for an equal reduction in our trade payables balance.
We were founded in March 1992 as Socket Communications, Inc. and reincorporated in Delaware in 1995 prior to our initial public offering in June 1995. We began doing business as Socket Mobile, Inc. in January 2007 to better reflect our market focus on the mobile business market and changed our legal name to Socket Mobile, Inc. in April 2008. Our Common Stock trades on the NASDAQ Capital Market under the symbol "SCKT". Our principal executive offices are located at 39700 Eureka Drive, Newark, CA 94560, and our phone number is (510) 933-3000. Our Internet home page is located at http://www.socketmobile.com; however, the information on, or that can be accessed through, our home page is not part of this Annual Report. Our annual reports on Form 10-K, quarterly reports on Form 10-Q, current reports on Form 8-K, and any amendments to such reports are available free of charge on or through our Internet home page, as soon as reasonably practical after we electronically file such material with, or furnish it to, the Securities and Exchange Commission.
Products
Our primary products are classified into three broad product families:
- Mobile handheld computer products;
- Data collection products; and
- OEM embedded products.
In addition, we continue to carry legacy plug-in connectivity products consisting of Ethernet cards and adapters which represented less than 4% of our revenue in 2010. These revenues in 2009 and 2008 included serial products, modems and other plug-in connectivity products that have been discontinued. Legacy products represented 10% of our revenue in 2009 and 12% of our revenue in 2008.
Our mobile handheld computer products are designed to be durable, lightweight and dependable devices which meet the requirements of the healthcare, hospitality and other markets we serve. Mobile handheld computer products and accessories represented approximately 44 percent, 38 percent and 18 percent of our revenue for the years ended December 31, 2010, 2009 and 2008, respectively.
Our initial model, the SoMo® 650 (SoMo is derived from Socket Mobile), was introduced in June 2007 with initial volume shipments in September 2007, and features the Microsoft Windows Mobile operating system, Version 6. Windows Mobile is the industry standard OS for mobile applications thereby ensuring that the SoMo is compatible with a large number of business applications and giving workers a familiar computing environment. Our mobile handheld computers are easy to customize for a particular application with peripherals and accessories. The SoMo products are designed with an expected product life cycle of three to five years which meets the needs of our customers who are deploying mobile solutions. In order to extend the life of the current product family, we upgrade SoMo technology components from time to time without impacting form, fit or function. We expect our SoMo650 product to continue to be offered into 2014, approximately seven years from its introduction.
3
The SoMo's features include wireless LAN and Bluetooth, a fast processor, a large, bright screen display enabling its use outdoors, large amounts of SDRAM and flash memory, an extended battery, programmable action buttons to activate peripheral devices, reinforced CompactFlash and SDIO card slots, and a durable case. The SoMo is available with multiple language support. The SoMo 650 was specifically designed without an integrated mobile phone to serve the market for business mobility applications that are not mobile phone centric such as medication dispensing in the healthcare market or tableside ordering in the hospitality market, most of which use Bluetooth or wireless LAN connections for data communications.
In late 2008, we introduced the SoMo 650 Rx Model made with antimicrobial materials added to the case plastics to provide an extra layer of protection to the device to aid against the multiplication and spread of potentially harmful bacteria and microbes found in healthcare environments. We also introduced a SoMo 650 DX Model without Bluetooth or wireless LAN for high security environments. We have also developed accessory products such as a back pack to enable direct connections to mobile phone networks using network phone cards and a durable case to provide additional protection in the event the computer is dropped. In addition, we work with third-party accessory providers, who have qualified to make a number of accessory products that work with the SoMo family of products, including headsets, battery chargers, keyboards, printers and smartcard readers.
Our data collection products are designed to enable the electronic collection of data from barcodes, radio frequency identification (RFID) tags or magnetic stripes. The products have been designed as durable devices for commercial use enabling a wide variety of accurate and rapid scans over a full work shift. All of the products come with SocketScan software that allows data to be edited when scanned and provides an easy-to-use interface for developers to build barcode scanning into their applications. Products are available in both standard and antimicrobial cases.
Our data collection products consist of:
- Cordless Hand Scanners: two dimensional (2D) and linear (1D) scanning used primarily with Smartphones and Tablet computers
- Plug-in barcode scanners: 2D and 1D in a CompactFlash form factor used primarily with our SoMo handheld computers
- Plug-in RFID products that read radio frequency identification tags used primarily with our SoMo handheld computers
- Combination plug-in barcode scanner and RFID reader/writer used primarily with our SoMo handheld computers
- Plug-in magnetic stripe reader used primarily with our SoMo handheld computers
- Wearable cordless ring scanner for industrial applications needing two hands
4
Our plug-in barcode scanning products plug into handheld computers and our cordless hand scanners connect wirelessly over Bluetooth to tablet computers, ultra-mobile personal computers, notebook computers and smartphones and turn these devices into portable barcode scanners and RFID readers that can be used in various retail and industrial workplaces; our cordless hand scanner and cordless ring scanner connect using Bluetooth technology.
Our Cordless Hand Scanners use Bluetooth technology as the connection interface. The scanners are available with two dimensional (2D) imagers and laser (1D) linear scanning engines. The scanners are available in standard cases or antimicrobial cases. The Cordless Hand Scanners are lightweight, ergonomically designed for ease of use and rapid repetitive scanning and are durable, lightweight and compact. During 2010, we redesigned our SocketScan software to enable the use of our Cordless Hand Scanners with a wide variety of smartphones, and we intend to add additional smartphone models as they are released by the smartphone manufacturers to provide wide ranging support for this fast emerging category of mobile devices. Currently SocketScan10 supports smartphones that use Windows Mobile, Windows CE, RIM Blackberry, and Google Android operating systems. The Human Interface Device (HID) Bluetooth protocol also allows the use of our Cordless Hand Scanners with HID-enabled devices including the iPad, iPhone, and iPod touch using the Apple iOS4 operating system. The HID protocol enters scanned data as if it was entered through the keyboard. During 2011, we intend to extend the benefits of SocketScan 10 software to Apple devices running the iOS operating system.
Our plug-in barcode scanners use the industry standard CompactFlash form factor and are available with two dimensional 2D and laser linear 1D scanning engines. When plugged into a mobile computing device with a CompactFlash slot and SocketScan loaded onto the device, the combination of device and plug-in barcode scanner can be used as a one handed barcode scanner operated from programmable buttons on the mobile computing device.
Our ring scanner is an industrial strength barcode scanner that is worn on the index finger and connects via Bluetooth to mobile or fixed data collection computing devices. The device enables a worker to scan while having two hands available and is designed for applications such as warehousing and pick-and-pack operations.
Our Radio Frequency Identification (RFID) products enable RFID tags to be read. We also offer an RFID/laser barcode scanner combination product that enables RFID tags to be read or written to and linear (1D) barcodes to be scanned with the same device.
Our Magnetic Stripe Reader is a plug-in device in a CompactFlash form factor for use with devices having a CompactFlash slot. The Reader enables magnetic card stripes such as on credit cards to be swiped and read electronically from a mobile location and is ideal for applications such as tableside ordering.
Data collection product revenues represented approximately 35 percent, 32 percent and 35 percent of our revenues for the three years ended December 31, 2010, 2009 and 2008, respectively.
Our OEM embedded products consist of Bluetooth and wireless LAN plug-in cards used primarily by Original Equipment Manufacturers (OEMs) of electronic products to build wireless connection functions into their products using the Bluetooth and wireless LAN standards for wireless connectivity. Our Bluetooth products use the Bluetooth 2.1 + EDR standard. Our plug-in cards for connecting wirelessly to local area networks were upgraded in 2009 to use the wireless LAN 802.11 a/b/g Wi-Fi standard, upgrading our products from the wireless LAN 802.11b/g standard used in 2008. Our wireless LAN products include extensive communications software with Cisco Compatible Extensions (CCX) designed to make these products easy to use. In 2008 our Bluetooth module sales peaked due to last time buys of older Bluetooth chip technology that was being phased out by the chip manufacturer. Our OEM product sales are primarily based on the acceptance of our designs by OEM customers (referred to as design-wins), and the product transitions described have resulted in last-time buys and reductions in ongoing revenue as new design-wins are pursued. OEM embedded products represented approximately 10 percent, 19 percent and 35 percent of our revenue for the years ended December 31, 2010, 2009 and 2008, respectively.
5
Our SocketCare services provide extended warranty and accidental breakage coverage for selected products including our handheld computers and our ring and cordless hand scanners. Premium service purchased at the time of product purchase provides coverage for three years. Service revenue was approximately $0.8 million or 6 percent of our revenue in 2010 and approximately $0.3 million or 2 percent of our revenue in 2009. Service revenues were insignificant for 2008.
Vertical Market Applications
Our products provide a mobile platform for use by third-party software developers,
value added resellers and end users in a number of vertical markets where workers
are mobile and can benefit from the collection, processing and transmittal of
data or access to data while mobile. We offer software developer kits to enable
the integration of our Bluetooth, wireless LAN and data collection hardware
and software programs with vertical market applications and we have an Authorized
Reseller Program enabling application developers to offer vertical market solutions
using our products. The Authorized Reseller Program includes pricing discounts
on our products, an online partner portal, tailored sales resources, and inclusion
of resellers in our marketing programs and communications tools including a
listing on our website at www.socketmobile.com.
Our product design priorities have focused on the healthcare and hospitality vertical market segments. Other vertical markets using our products in mobile applications include retail merchandising, automotive, government and education. Highlighted below are examples of partner solutions that result in productivity enhancing benefits to the users of the solutions:
Healthcare
Healthcare applications involve the real-time collection of and access to patient
data, the updating of patient records, the prevention of medication errors,
the management and control of pharmaceuticals prescribed for patients, and the
analysis of patient laboratory specimens.
Aranz Medical, Ltd. has selected the SoMo handheld computer to run its Silhouette product suite for advanced wound care. The system provides comprehensive imaging, measurement and documentation capabilities that provide significant advantages for patients, healthcare providers and funding organizations.
6
Epocal has integrated our handheld computer and CF plug-in barcode scanner into its blood diagnostic system.
Evangelical Lutheran Good Samaritan Society, the largest not-for-profit provider of senior care and services in the United States, is managing and monitoring daily patient care, capturing data at the point of care and providing immediate access to patient records and patient care diagnostic tools.
Hospira is marketing the VeriScan system to prevent medication errors at a patient's hospital bedside.
Resource Systems is using their CareTracker system to improve the quality of care in long term care facilities.
Hospitality
Hospitality applications include tableside order processing, curbside check-in,
poolside service, ticket scanning, mobile point of sale, and contact information
tracking.
Digital Dining offers tableside ordering capabilities for restaurants with their MenuSoft system using our handheld computer and a magnetic stripe reader;
MiniBar uses our handheld computer and a barcode scanner to service room refreshment centers in hotel rooms;
RedTech, an events management company in the U.K., offers a cashless mobile transaction processing system for events using our handheld computer and a third party smartcard reader.
Retail Merchandising
Cardinal Tracking streamlines inventory management for automotive recyclers,
and announced the adoption of their mobile solution by Buddy Automotive Innovations.
First Stop Convenience Stores uses our barcode scanners to streamline inventory processes.
Kelleher Corporation fulfills sales orders for its lumber and molding products more than 600% faster by using our scan card and a handheld computer to track inventory in real-time and dispatch sales orders right from a Home Depot store.
Fujitsu Systems is marketing a mobile point of sale solution with their tablet notebooks.
Automotive
Manheim Auto Auction, the largest wholesale auto auction in the United
States, enables dealers to view pricing and other details about vehicles being
auctioned while the dealers are mobile.
7
Tiva Software's Pricebook Connect software is used by First Stop Convenience Stores with a handheld computer barcode scanning solution to streamline ordering, pricing, inventory and back office activities.
Government, Education and Other
3M Corporation offers mobile extensions to its library management system
to enable the mobile inventory and processing of library materials.
Plasco ID offers a mobile tracking and data retrieval solution for identifying and tracking students and managing and processing real-time student information.
Telemedicine and Advanced Technology Research Center of the U.S. Army efficiently inventories blood supplies in combat zones, reducing blood spoilage and increasing availability.
Zerion Software creates mobile applications for businesses of all sizes on emerging platforms including the iPhone, iPod touch, Android, and iPad. Zerion Software's SAAS based mobile business applications help businesses reduce costs, increase productivity, and improve customer satisfaction. Zerion Software's flagship product, iFormBuilder, is an award-winning, patent-pending mobile platform that is being used across the globe in many different industries. It is currently utilized by 3 of the top 10 hotel brands in the world, the largest hospital in the US, the US Government, top franchises, amusement parks, and hundreds of small/mid-size businesses.
Market Dynamics
Mobile electronic computing devices have evolved over the past several years
from simple devices used mainly to hold personal information into small portable
units with functionality similar to desktop PCs. These devices include smartphones,
handheld computers, tablet computers, ultra-mobile personal computers (UMPCs),
and notebooks. Many handheld computers, tablets and notebooks, such as those
using the Windows or Windows Mobile operating system including our SoMo line
of mobile handheld computers, have built-in expansion capabilities in standard
form factors such as CompactFlash Input/Output plug-in slots or Bluetooth wireless
connection capabilities to allow for transfer of data over Bluetooth, Wireless
LAN or plug-in connections. Smartphones and tablet computers use a variety of
operating systems from Apple (iOS4), Google (Android), RIM (BlackBerry) and
Hewlett-Packard (WebOS). Advances in mobile phone technology have facilitated
rapid data transfers and internet access creating a dynamic, rapidly growing
smartphone market. Although smartphone applications are focused on consumer
applications, smartphones have the capability to support many business applications
and our data collection products are designed to work with smartphones from
the major smartphone manufacturers where repetitive or robust bar code scanning
requirements exceed the limited scanning capabilities of a phone camera (See
Products - Data Collection Products - Cordless Hand Scanners).
Advances in mobile network access and transfer speeds enable mobile computing device users to access the Internet, send and receive email including attachments, access corporate data files, and transfer data directly to and from other mobile devices using Bluetooth wireless technology or cables for short distances, wireless local area networks, or broadband cellular networks with increased speed and bandwidth. Our connectivity products and technologies (wireless LAN and Bluetooth) are designed to easily add these technologies to mobile devices. In addition, mobile devices with standard expansion capabilities are effective at collecting data. Our data collection products are designed to facilitate the collection of barcode, RFID, and magnetic stripe information on these devices by plugging into the standard expansion slots of these data collection devices or connecting wirelessly over a Bluetooth connection.
8
Handheld computers have traditionally been classified into consumer and industrial categories. Consumer devices such as those offered by Hewlett-Packard are designed for personal use and fit in a pocket or purse. Industrial devices such as those offered by Motorola and Intermec are designed for rugged environments such as outdoors or in warehouses and are much larger, heavier and more expensive. Businesses have had to choose from these two categories in designing mobile solutions, and we believe neither solution is an ideal fit for many business needs. Consumer units often are not designed with the durability required for the more extensive use required by businesses. Industrial units are designed for warehouse or inclement weather conditions and add unnecessary size, cost and expense for those businesses not needing that level of ruggedness. Our SoMo product line is designed to service this business market between consumer and industrial devices. Our handheld computers are similar in size and weight to consumer units which fit in a pocket or purse, but are designed to be more durable and come with our extensive SocketScan software that works with our barcode scanning, RFID and magnetic stripe reader products, and our Bluetooth and our wireless LAN driver and management software. Our wireless LAN software incorporates features needed by businesses such as seamless roaming to improve worker connectivity and the worker experience in using wireless LAN, easy and reliable Bluetooth connections, and multiple language support. Other features needed by businesses include fast processors, large memory and extended battery life. Included in our mobile handheld computer family of products are handheld computer and barcode scanner models made with antimicrobial materials added to the case plastics to provide an extra layer of protection to the devices to aid against the multiplication and spread of potentially harmful bacteria and microbes found in healthcare environments. Compared to industrial devices, our handheld computers are smaller in size and weight, less rugged, and less expensive. Our entire product line of handheld computers is offered with the expectation that they will be offered for sale for a minimum three to five year time period which reduces the number of times customers must upgrade their systems and test and purchase new devices. We work to extend this life by replacing or upgrading components as they are discontinued by their manufacturers without changing the form, fit or function of the product. We expect to continue to offer the SoMo650 for sale into 2014, approximately seven years from its introduction.
Growth in the mobile workforce and increasing reliance on the Internet and
on access to corporate databases and email are increasing the demand for mobile
data communications. The capability of a mobile workforce to collect data in
the field and to transfer it electronically generally improves the timeliness
and accuracy of information such as order entry, process management or transaction
reporting. Advances in connection technologies, local area networking and wide
area networking are being commercialized to enable handheld computers to interact
with nearby computers and with a wide array of electronic appliances, including
mobile phones, printers, digital cameras, local area network access points,
Global Positioning System (GPS) receivers, automobile communications systems,
barcode scanners, RFID tags, home entertainment and security systems, public
kiosks, public Internet access locations and vending machines.
9
Current market dynamics driving the adoption of mobile data communications by enterprises include:
Functionality of today's handheld computing devices is extensive and improving. Most handheld computing devices offer bright outdoor color screens and longer battery life, have software allowing their use as business messaging devices with capacity to store personal information, and have standard expansion capabilities or use Bluetooth or wireless local or wide area network connections to transfer data in and out of the device. Handheld devices also can become lightweight mobile barcode, RFID, and magnetic stripe scanning devices when used with our barcode scanning, RFID, or magnetic stripe reader products, enabling the capture and processing of barcode, RFID, or magnetic stripe information (such as credit or identification cards) in a mobile environment.
The mobile workforce is growing and is increasingly reliant on email and the Internet. The worldwide mobile workforce has been estimated at more than 20 percent of the global workforce. Before advancements in handheld computers through wireless local area network access points, the mobile workforce had been unable to effectively stay connected with email, the Internet or corporate data except through telephone lines. With the growth in the use of the Internet and email for business and personal applications, workers and consumers are increasingly dependent on access to the Internet and email for managing their business and personal lives. Recent improvements in wireless LAN connectivity and deployment of handheld computers by corporations to their mobile workforce are expected to be major factors driving growth in mobile data applications for businesses over the next several years.
Third-party applications for enterprises are becoming available in increasing numbers. Third-party software applications are becoming increasingly available for the collection, processing and transfer of information by a mobile workforce. In healthcare markets, handheld computers are being used for such diverse applications as checking patient medications when administering them in a hospital, capturing lot numbers of drug samples given to a doctor, alerting on-call personnel to needs for their services, collecting community and clinical health data, delivery of healthcare information to practitioners and researchers and patients, real-time monitoring of patient vital signs, and direct provision of care via mobile telemedicine applications. Other mobile applications include managing the stocking of shelves in retail establishments, or entering sales orders from the field. We have supported the development and deployment of our products in third-party applications through our Authorized Reseller Program. Our Authorized Reseller Program is described more fully under "Vertical Market Applications." The availability of productivity-enhancing application software is a major driver of enterprise deployment of mobile computing devices.
Marketing Strategy
Our marketing strategy has been to be a systems supplier to the Business Mobility
markets which today consists of two segments, the handheld computing market
and the mobile device centric market. For the handheld computing market segment,
we capitalize on our strategic relationships, expand and improve our product
offerings including software to enable wireless and wired connections designed
to provide an easy-to-use experience, build a strong brand name, and support
the development of third-party software applications and integrator solutions.
For the mobile device centric market, we expand awareness within the business
community of the data collection capabilities of all of the mobile computing
platforms that we serve including smartphones, tablets, and notebook computers,
expand the number of smartphone platforms that we serve to include smartphones
using all popular operating systems, and market the strengths of our wireless
driver and management software to other equipment manufacturers of mobile devices.
Our cordless data collection products offer commercial-grade rapid and robust
barcode scanning capabilities to the large and growing mobile device marketplace.
10
Transition from peripherals supplier to systems supplier to the Business Mobility markets. Our introduction in June 2007 of our handheld computer marked the start of our transition from being a peripherals supplier to being a systems supplier. As a peripherals supplier, we were dependent upon other third-party computer manufacturers for the handheld computers that comprised mobile business solutions. Changes by such third-parties to handheld computer models, operating systems and handheld computer programs forced us to expend significant efforts to make our peripherals work with third party handheld computers following such changes. Customer support was also more complicated in determining whether any reported problems were due to the handheld computer or to our peripherals. Solutions being developed by third-party application providers were also more complicated by the need to integrate their solutions with multiple hardware manufacturers. Although we continue to support third-party handheld computers, since the introduction of our mobile handheld computer we offer a complete hardware solution consisting of a mobile handheld computer and data collection peripherals which allows value added resellers and systems integrators to offer a one-stop solution in combination with vertical software applications for the mobile workforce. We have also expanded and refocused our sales personnel to work closely with third-party application providers, value added resellers, systems integrators and end users for software applications created in-house. Since the introduction of our SoMo family of handheld computers in 2007, we have sold more than 36,000 units around the world (See Products - Mobile Handheld Computer Products).
Capitalize on Strategic Relationships. We support and encourage direct endorsements and referrals for our products from our strategic relationships, including operating system providers, device manufacturers, third-party software developers, vertical industry partners, distributors, and end-user customers. We actively promote third-parties to integrate our products into their solutions through our Authorized Reseller Program. We have employees that manage each strategic relationship, and we provide software developer kits, training and technical support to our software and hardware developers. We coordinate our handheld computer product development efforts with Microsoft on an ongoing basis, with the goal of ensuring that our current and future products are compatible with new releases of Microsoft's operating systems. We spend extensive engineering time and resources to ensure that our data collection products are compatible with a wide variety of computers and smartphones. We adhere to standards of a number of standards setting bodies whose technologies are used in our products such as the Bluetooth SIG (Special Interest Group).
Expand and improve our product offerings. We offer a wide range of products under a modular concept that enables customers to design their mobile systems to meet their specific requirements, and we encourage our distributors to carry the full range of our products. The goal is for customers to view Socket as a primary source for their mobile application needs, instead of having to rely on individual product offerings from a number of different companies. During the past three years, we've upgraded the operating system and management software on our mobile handheld computer including adding many operating system features such as multiple language support, upgrading to later versions of the Windows Mobile operating system while continuing to support earlier versions, and upgrading our Bluetooth and wireless LAN management software. We have expanded our data collection product offerings with 2D imaging technology to add to our 1D linear barcode scanning capabilities. We design our products to comply with the regulations of the many worldwide agencies that regulate the safety, performance and use of electronic products.
11
Build a Strong Brand Name. We are building a brand image of "Business Mobility Now!™" This image closely associates us with business mobility solutions and to reflect this image, we changed our name to Socket Mobile, Inc. in April 2008. We stress with customers the design of our products for the handheld computing markets, emphasizing quality and standards-based connectivity. Mobility requires products that are compact and designed to be handled while mobile, with low power consumption to extend time between charges, and easy to use. We work closely with application developers developing productivity enhancing applications for the mobile workforce. Our overall company brand identity and positioning goal is to become "the leading provider of easy-to-deploy business mobility systems and peripherals to the Business Mobility market."
Support the development of third-party software applications and integrator solutions. We have created software developer kits (SDK's) for many of our products including barcode scanning, RFID, and wireless LAN. In addition, we have employees dedicated to assisting developers and integrators with integrating our products into their solutions. Our Authorized Reseller Program supports companies that offer or are developing software solutions which incorporate Socket products. These solutions primarily involve handheld computing and data collection and address improving the productivity of the mobile workforce in a number of vertical markets including healthcare, hospitality, retail merchandising, automotive, government and education.
Expand awareness within the business community of the data collection capabilities of all of the mobile device platforms that we serve including smartphones, tablets, and notebook computers. Our data collection software SocketScan has been designed to enable our barcode scanning peripherals to work on a number of third-party computing platforms including smartphones (supported operating systems include RIM BlackBerry, Windows Mobile, Android from Google, and in 2011, Apple iOS), tablets, UMPCs, and notebook or desktop computers (Windows based). Most of these devices can be used to collect barcode scanned or RFID read information from our Bluetooth enabled or plug-in scanners and readers, however many application providers are not aware of the capabilities of these devices, and increasing such awareness is a key step at increasing the number of mobile data collection applications available on these devices.
Market the strengths of our wireless driver and management software to original equipment manufacturers of mobile devices. To capture embedded connection business from original equipment manufacturers, we have built relationships with certain mobile device manufacturers and work with them to integrate our wireless LAN cards and value-add software into their own product designs. Our value-add is the extensive driver and management software for wireless LAN products that we use in our own products. The majority of these manufacturers are building vertical application devices for special purpose markets and it is often cost effective for them to purchase Bluetooth and wireless LAN software and connection cards rather than developing and maintaining such software themselves. We have employees that manage our OEM products business. We also provide software developer kits to our mobile device manufacturer customers to assist them as needed to integrate our embedded products into their mobile devices.
12
Competition and Competitive Risks
The overall market for handheld computing solutions is both complex and competitive.
Our hardware products compete with similar hardware products in all of our markets
in the United States, Europe and Asia. However, our longtime focus on creating
innovative mobile solutions for the mobile workforce has resulted in good brand
name recognition and reputation. We also believe that our brand name identifies
our products as durable, dependable, small form factor, low power and easy to
use, and the breadth of our product offerings, including the extensive features
of our software, will continue to differentiate us relative to our competitors.
The addition of a handheld computer since June 2007 has enabled us to better
control the handheld computing environment for our peripheral products and allows
us to offer one-stop shopping for the hardware portion of mobile business solutions.
Our handheld computer is becoming better recognized for its features and capabilities
with over 36,000 units shipped since its introduction in June 2007. The competition
in each of our product families is discussed in more detail below.
Handheld computers. Our SoMo handheld computers address the price/performance market gap between consumer handheld computers and industrial grade handheld computers. Consumer-oriented handheld computers are less durable and offer fewer features at a lower cost than industrial handheld computers. Industrial grade handheld computers are larger and more difficult to carry throughout the workday and are several times more expensive than consumer-oriented units. Our SoMo mobile handheld computer offers improved features over a consumer-oriented unit beneficial in a business environment including increased durability, improved software features such as wireless LAN roaming (staying connected between wireless LAN access points), and a combination of a fast processor, large memory, CompactFlash plug-in slots to add peripherals directly into the computer and wireless LAN and Bluetooth technologies to enable the transfer of data wirelessly. The SoMo mobile handheld computer is less rugged than an industrial handheld computer but has many of the same features at a significantly reduced price point. The SoMo mobile handheld computers are addressing specific needs of our healthcare customers such as the introduction of units made with an antimicrobial additive in the case plastics to provide an extra layer of protection to the device to aid against the multiplication and spread of potentially harmful bacteria and microbes found in healthcare environments. Consumer grade handheld computers without phones are offered by Hewlett-Packard, currently the largest supplier of this category of device, and others but the trend has been for them to offer more phone integrated units. Hewlett-Packard commencing late in 2010 began to discontinue the availability of their consumer grade handheld computers without phones in selected international locations. Ruggedized industrial grade handheld computers are offered by Motorola, Intermec, Honeywell and others. These companies have offered handheld computers for many years and have an established market presence. Their handheld computers are functional competitive alternatives to our mobile handheld computers, but are priced significantly higher and in most cases are larger in size because of their ruggedized features.
Data Collection Products. Our 2D/1D imager and 1D laser barcode scanning
products face competition from ruggedized integrated barcode scanning devices
from Motorola, Intermec, Honeywell, Datalogic, LXE, KoamTac, Infinite Peripherals,
Wasp Barcode Technologies and others. We purchase laser engines from Motorola
and imagers from Intermec for use in our products. We face competition outside
of the United States from products similar to our Cordless Hand Scanner from
Baracoda and from Code Corporation, and from other competitive laser scanning
products from Grabba (Australia) and Opticon (Japan). Motorola's patent position
for laser barcode scanning tends to limit the sale of laser scanning barcode
products by competitors in the United States, but a number of the Motorola patents
will expire over the next several years, and we may face increasing competition
from competitors both inside and outside the United States. We produce our laser
barcode scanning products under a license from Motorola. Motorola has historically
been selective in licensing their technologies to third-parties. The continued
availability of our licenses from Motorola and the continued absence of other
licensees are dependent upon future licensing decisions by Motorola.
13
In addition, companies such as Intermec have improved imager technology making such technology a viable alternative to laser scanning, and we expect both our laser and our imaging products to face more competition over time from devices deploying imaging technology.
OEM Embedded Products - Wireless Connections. We offer our wireless connection wireless LAN technologies in the form of SDIO plug-in cards. We compete based on our brand name and customer support infrastructure, as well as software enhancements that provide ease-of-use, security features, and monitoring and troubleshooting tools. Our wireless LAN software works well with our hardware, providing us a complete solution for embedding wireless LAN connections into third-party devices.
Manufacturers in Asia selling primarily hardware, such as Alps, Murata, and TaiyoYuden, along with integrators such as Bluesoft, ConnectBlue, Stonestreet One and Summit Data, are able to produce all or part of embedded solutions which may compete with our products and services. In addition, manufacturers of products that are sold in high volume may choose to build and support their own wireless LAN connections.
Our wireless LAN cards face competition in the market today principally from other manufacturers of low power wireless LAN 802.11 cards, including AmbiCom, Mobis, Silex, Spectec and Summit Data for SDIO cards.
Proprietary Technology
We have developed a number of technological building blocks that enhance our
ability to design new hardware and software products, to offer products which
run on multiple software and hardware platforms, and to manufacture and package
products efficiently.
We own and control the design of our handheld computer, enabling us to modify its features or software to meet specific customer requirements.
Another area of intellectual property is our expertise in embedded radio-dependent
firmware. Within our Bluetooth cordless products are software and firmware that
include a wide variety of functions to enable efficient radio control and overall
systems functionality. For cordless barcode scanning and RFID reading, this
includes our patented Error Proof Protocol, which is designed to ensure that
scanned data is correctly received by the mobile computing device and allow
for real-time validation of data and error notification to the user. We have
developed a library of software drivers and control modules that allow our products
to operate in handheld computers running the Windows Mobile operating systems
and in notebooks running Windows 7/Vista/XP operating systems and in smartphones
running operating systems from Apple (iOS4 - HID interface only at the end of
2010), Google (Android), Research In Motion (BlackBerry), Microsoft (Windows
Mobile) and Hewlett-Packard (WebOS - HID interface only at the end of 2010).
We have been awarded twenty-one U.S. Patents and ten design patents covering
various inventions that relate to mobile products and to the design of our products.
In July 2004 we also acquired from Khyber Technologies a U.S. patent entitled
Card Shaped Computer Peripheral Device. The patent is a basic patent covering
the design and functioning of plug-in barcode scanners, barcode imagers, and
RFID products. We have additional patents covering our proprietary technology
pending with the U.S. Patent and Trademark Office.
14
We have developed a number of software programs that provide unique functions and features for our connection and data collection products. For example, our SocketScan software enables all of our barcode scanning products to scan a variety of barcodes and to route the scanned data to many different types of data files. Our Bluetooth software used in conjunction with our Bluetooth hardware provides a completely functional Bluetooth solution enabling connections and data transfers between Bluetooth-enabled devices. Our wireless local area network software called Wi-Fi Companion provides an extensive set of features to help the user get and stay connected. We have also introduced a version incorporating Cisco Compatible Extension protocols called Enhanced Wi-Fi Companion or e-WFC. Either of these software programs used in conjunction with our wireless local area network hardware, provides a completely functional wireless local area network solution, enabling connections and data transfers from mobile computing devices over wireless local area networks. In addition, our Bluetooth and wireless LAN software programs are aligned to insure optimal performance even when both technologies are being utilized at the same time.
We have registered trademarks with the U.S. Patent and Trademark Office for the mark "Socket", our logo, the term "Go-WiFi" associated with our wireless LAN products and "SoMo", the mark associated with our mobile handheld computer.
We rely on a combination of patent, copyright, trademark and trade secret laws, and confidentiality procedures to protect our proprietary rights. As part of our confidentiality procedures, we generally enter into non-disclosure agreements with our employees, distributors and strategic partners, and limit access to our software, documentation and other proprietary information. Despite these precautions, it may be possible for a third-party to copy or otherwise obtain and use our products or technology without authorization, or to develop similar technology independently. In addition, we may not be able to effectively protect our intellectual property rights in certain foreign countries. From time to time we receive communications from third-parties asserting that our products infringe, or may infringe, their proprietary rights. In connection with any such claims, litigation could be brought against us that could result in significant additional expenses or compel us to discontinue or redesign some of our products.
Personnel
Our future success will depend in significant part upon the continued service
of certain of our key technical and senior management personnel, and our continuing
ability to attract, assimilate and retain highly qualified technical, managerial
and sales and marketing personnel. Our total employee headcount as of December
31, 2010 was 64 people. Our employees are not represented by a union, and we
consider our employee relationships to be good.
15
Sales and Marketing
We target business customers in selected vertical markets with our products.
Most of our products, except our embedded products, are sold through distributors
and resellers that service businesses. Our OEM embedded products are sold directly
to the manufacturers of products in which our products are embedded. The geographic
regions we serve include the Americas, Europe, the Middle East, Africa and Asia
Pacific.
During the year ended December 31, 2010, 76 percent of our sales were in North America, 20 percent in Europe, and 4 percent in Asia and Pacific Rim countries. In 2009, 58 percent of our sales were in North America, 31 percent in Europe, and 11 percent were in Asia and Pacific Rim countries. In 2008, 64 percent of our sales were in North America, 24 percent in Europe and 8 percent in Asia and Pacific Rim countries. Export sales are subject to the complications of complying with laws of various countries and the risk of import/export restrictions and tariff regulations.
We market our products through a worldwide network of distributors and resellers, as well as through original equipment manufacturers and value added resellers. In addition, we market our products through participants in our Authorized Reseller Program. Participants offer or are developing third-party software applications that utilize our products with their software solutions. Vertical markets addressed by participants include healthcare, hospitality, retail merchandising, automotive, government and education. Applications are designed to enable mobile workers to access data and record information while mobile. See "Vertical Market Applications" for additional information. We support our distributors, resellers, integration and application partners with software developer kits and we provide education, training and customer assistance through our sales, marketing, and technical support staff in the U.S., Europe and Asia-Pacific regions. As of December 31, 2010, we had 21 people in sales, marketing and customer support.
Sales to customers in 2010 representing 10 percent or more of our revenue consisted of distributors Ingram Micro (14 percent), Tech Data Corporation (13 percent) and Blue Star Corporation (11 percent) and our customer Epocal accounted for 10 percent. In 2009, Ingram Micro accounted for 18 percent of our revenue and Tech Data accounted for 17 percent of our revenue. In 2008, Ingram Micro accounted for 16 percent of our revenue and Tech Data accounted for 15 percent of our revenue and our customer Intermec accounted for 14 percent of our revenue.
Consistent with industry practice, we provide our distributors with stock balancing and price protection rights which permit these distributors to return slow-moving products to us for credit, and to receive price adjustments for inventories of our products held by the distributors if we lower the price of those products. The immediate effect of returns and adjustments on our quarterly operating results is limited, since we recognize revenues on products shipped to distributors only at the time the merchandise is sold by the distributor.
We rely significantly on our distributors and resellers for distribution of
our products. Our agreements with our distributors and resellers generally are
nonexclusive and may be terminated on short notice by either party without cause.
Furthermore, our distributors and resellers are not within our control, are
not obligated to purchase products from us, and may represent other lines of
products, including those of our competitors. If any distributors or resellers
reduce or discontinue efforts to sell our products, our revenues and operating
results could be materially adversely affected.
16
Manufacturing
We subcontract the manufacturing of substantially all of our products to independent
third-party contract manufacturers located in the U.S., China, and Taiwan
and who have the equipment, know-how and capacity to manufacture products
to our specifications. We perform final product testing and package our products
at our Newark, California facility for most of our sales. As of December 31,
2010, we had 23 people employed in manufacturing operations, including planning,
buying, manufacturing engineering, quality control, product assembly, shipping
and receiving, and product support.
Certain of our products or product components are available from only one vendor. These sole sourced products or components include the interface chip that controls the signal transmission between all of our plug-in CompactFlash products (except our Ethernet and wireless LAN cards) and the card slot on the mobile computer, our Ethernet, wireless LAN and Bluetooth chips, our imager and laser scanning engines, our SDIO plug-in cards, and certain cable and connector components and several major components of our mobile handheld computers including our flash memory, screen, processor and audio components. With the exception of recent worldwide supply shortages of LCD screens for our handheld computer (See Management's Discussion and Analysis), we have generally been able to obtain adequate supplies of these products or components, they are generally purchased on a purchase order basis under standard commercial terms and conditions, and we do not have long-term supply contracts for these products or components. Accordingly, the manufacturers could stop providing these products or components to us at any time. Alternatively, although our suppliers are generally large, well-financed organizations, they could encounter financial difficulties that interfere with our product supplies. In such an event, we could experience a decline in revenues until we establish sufficient manufacturing supply through an alternative source. Locating and qualifying alternative suppliers, and commencing new manufacturing operations, could take a significant period of time, although we believe that we can relocate manufacturing or find alternative suppliers for sole sourced products or components should it become necessary. We generally stock higher inventory quantities of sole sourced products or components as safety stocks to mitigate the risk of supply disruption.
Research and Development
Since our inception, we have made substantial investments in research and
development. Research and development expenditures were $2.4 million in 2010,
$2.9 million in 2008, and $4.5 million in 2007. The amount of expense is determined
in part by the number of development projects.
As of December 31, 2010, we had 10 people on our product development staff, and we hire engineering consultants to perform additional engineering services as required. We anticipate that we will continue to commit substantial resources to research and development in the future.
General and Administration
As of December 31, 2010, we had 10 people responsible for our financial and
administrative activities including accounting and finance, personnel, internal
computer systems and administrative support.
17
There is substantial doubt about our ability to continue as a going concern.
Our financial statements have been prepared on a going concern basis. During the years ended December 31, 2010, 2009, and 2008, we incurred net losses of $4.0 million, $7.9 million, and $2.8 million, respectively. As of December 31, 2010, we have an accumulated deficit of $54.8 million and a working capital deficit of $1.6 million. The report of our Independent Registered Public Accounting Firm on our financial statements for the year ended December 31, 2010 and 2009, contains an explanatory paragraph noting that certain conditions raise substantial doubt about our ability to continue as a going concern. Our continued operating losses and declines in our working capital balances are conditions that raise doubt about the Company's ability to continue as a going concern. Our ability to continue as a going concern is dependent upon our ability to establish profitable operations and to raise additional financing. We have been taking steps intended to reduce operating losses and achieve profitability including the introduction of new products, continued close support of our distributors and of our application partners as they establish their mobile applications in key vertical markets, and management of our costs. We believe that we will be able to improve our liquidity and secure additional sources of financing by managing our working capital balances, and raising additional capital as needed, including development funding from development partners and the issuance of additional equity securities. Nonetheless, there can be no assurance that we will be successful in achieving any of these steps, and there can be no assurance that additional financing will be available on acceptable terms, if at all, and any such terms may be dilutive to existing stockholders. Our inability to secure and maintain the necessary liquidity would have a material adverse effect on our financial condition and results of operations. Our financial statements do not include any adjustments to reflect the possible future effects on the recoverability and classification of assets or the amounts and classification of assets and liabilities that may result from the outcome of this uncertainty.
The global economic financial crisis may continue to have an impact on our business and financial condition in ways that we currently cannot predict, and may further limit our ability to raise additional funds.
The continued credit crisis and related turmoil in the global financial system may continue to have an impact on our business and our financial condition. We may face significant challenges if economic conditions and conditions in the financial markets do not improve or continue to worsen. In particular, should these conditions cause our revenues to be materially less than forecast, we may find it necessary to initiate further reductions in our expenses and defer additional product development programs. In addition, our ability to access the capital markets and raise funds required for our operations may be severely restricted at a time when we would like, or need, to do so, which could have an adverse effect on our ability to meet our current and future funding requirements and on our flexibility to react to changing economic and business conditions.
We have a history of operating losses and may not achieve ongoing profitability.
We have been unprofitable in every quarter except one during the past three fiscal years. Fiscal year 2004 was the only profitable year in our history, and only to the extent of $288,000. Prior to 2004, we incurred significant operating losses in each financial period since our inception. To achieve ongoing profitability, we must accomplish numerous objectives, including growth in our business and the development of successful new products. We cannot foresee with any certainty whether we will be able to achieve these objectives in the future. Accordingly, we may not generate sufficient net revenue or manage our expenses sufficiently to achieve ongoing profitability. If we cannot achieve ongoing profitability, we will not be able to support our operations from positive cash flows, and we would use our existing cash to support operating losses. If we are unable to secure the necessary capital to replace that cash, we may need to suspend some or all of our current operations.
18
We may require additional capital in the future, but that capital may not be available on reasonable terms, if at all, or on terms that would not cause substantial dilution to your stock holdings.
We may incur operating losses in future quarters and would need to raise capital to fund such losses. Our forecasts are highly dependent on factors beyond our control, including market acceptance of our products, deployments by businesses of applications that use our handheld computers and our data collection products, and supply delays in key components such as we experienced in the fourth quarter of 2010. If capital requirements vary materially from those currently planned, we may require additional capital sooner than expected. There can be no assurance that such capital will be available in sufficient amounts or on terms acceptable to us, if at all.
We may require additional capital in the future to repay our outstanding convertible note, but that capital may not be available on reasonable terms, if at all, or available only on terms that result in substantial dilution to your stock holdings.
Although the convertible note that we issued in November 2010 is priced to facilitate its conversion into equity over the eighteen-month term of the convertible note, such conversion is at the option of the noteholder and the note, including interest, if outstanding at the end of the eighteen-month period, would require repayment by the Company. Our failure to repay the convertible note including interest if outstanding at the end of its term, would be an event of default. In addition, the convertible note contains other events of default, including in the event the Company is unable to maintain the minimum cash and accounts receivables balance and the minimum current ratio required by the convertible note. There can be no assurance that capital to refinance the convertible note at the end of its eighteen-month term or upon an event of default would be available on terms acceptable to the Company, if at all. The terms of our November 2010 convertible note financing contain certain anti-dilution provisions. Should we need to raise additional capital in the future at prices below the conversion price of the convertible note, if outstanding at such future time, substantial dilution could result from such a financing.
Our quarterly operating results may fluctuate in future periods, which could cause our stock price to decline.
We expect to experience quarterly fluctuations in operating results in the future. We generally ship orders as received, and as a result we may have little backlog. Quarterly revenues and operating results therefore depend on the volume and timing of orders received during the quarter, which are difficult to forecast. Historically, we have often recognized a substantial portion of our revenue in the last month of the quarter. This subjects us to the risk that even modest delays in orders or in the manufacture of products relating to orders received, may adversely affect our quarterly operating results. Our operating results may also fluctuate due to factors such as:
19
- the demand for our products;
- the size and timing of customer orders;
- unanticipated delays or problems in our introduction of new products and product enhancements;
- the introduction of new products and product enhancements by our competitors;
- the timing of the introduction and deployments of new applications that work with our products;
- changes in the revenues attributable to royalties and engineering development services;
- product mix;
- timing of software enhancements;
- changes in the level of operating expenses;
- competitive conditions in the industry including competitive pressures resulting in lower average selling prices;
- timing of distributors' shipments to their customers;
- delays in supplies of key components used in the manufacturing of our products; and
- general economic conditions and conditions specific to our customers' industries.
Because we base our staffing and other operating expenses on anticipated revenues, unanticipated declines or delays in the receipt of orders can cause significant variations in operating results from quarter to quarter. As a result of any of the foregoing factors, or a combination, our results of operations in any given quarter may be below the expectations of public market analysts or investors, in which case the market price of our Common Stock would be adversely affected.
Goodwill comprises a significant portion of our assets and may be subject to impairment write-downs in future periods which would substantially increase our losses, make it more difficult to achieve profitability, and cause our stock price to decline.
We review our goodwill for impairment at least annually and more often if factors suggest potential impairment. Many factors are considered in evaluating goodwill including our market capitalization, comparable companies within our industry, our estimates of our future performance, and discounted cash flow analysis. Many of these factors are highly subjective and may be negatively impacted by our financial results and market conditions in the future. We recorded goodwill impairment charges in 2009 of $5.4 million. We may incur goodwill impairment charges in the future and any future write-downs of our goodwill would increase our net losses, make it more difficult to achieve profitability, and as a result the market price of our Common Stock could be adversely affected.
We may be unable to manufacture our products, because we are dependent on a limited number of qualified suppliers for our components.
Several of our component parts, including our serial interface chip, our Ethernet chip, our bar code scanning modules, and our line of mobile handheld computers, are produced by one or a limited number of suppliers. Shortages could occur in these essential components due to an interruption of supply or increased demand in the industry. In particular, shipments of our mobile handheld computers in the fourth quarter 2010 were adversely affected by a worldwide supply chain LCD screen shortage, due to increased demand for LCD screens by tablet and smart phone manufacturers. If we are unable to procure certain component parts such as we experienced in the fourth quarter of 2010, we could be required to reduce our operations while we seek alternative sources for these components, which could have a material adverse effect on our financial results. To the extent that we acquire extra inventory stocks to protect against possible shortages, we would be exposed to additional risks associated with holding inventory, such as obsolescence, excess quantities, or loss.
20
If third-parties do not produce and sell innovative products with which our products are compatible, or if our own line of mobile handheld computers is not successful, we may not achieve our sales projections.
Our success has been dependent upon the ability of third-parties in the mobile computer industry to successfully develop products that include or are compatible with our technology and then to sell these products into the marketplace. Even if we are successful in marketing and selling our new line of mobile handheld computers, our ability to generate increased revenue depends significantly on the commercial success of other parties' Windows mobile products, particularly vertical market software applications for use with our handheld computer and peripheral products, and standard Pocket PC handhelds, phone-integrated devices, tablet computers, and other phone-integrated devices, including those from Nokia, Blackberry, Google, Hewlett-Packard and Apple, with which our plug-in and wireless peripherals can be used, and the adoption of these mobile computer devices for business use. A number of manufacturers of handheld computers have reduced the number of handheld products they offer, or curtailed development of future handheld computer products. If manufacturers are unable or choose not to ship new products such as Windows Mobile devices, or experience difficulties with new product transitions that cause delays in the market, or if these products fail to achieve or maintain market acceptance, the number of our potential new customers could be reduced and we may not be able to meet our sales expectations.
If we fail to develop and introduce new products rapidly and successfully, we will not be able to compete effectively, and our ability to generate sufficient revenues will be negatively affected.
The market for our products is prone to rapidly changing technology, evolving industry standards and short product life cycles. If we are unsuccessful at developing and introducing new products and services on a timely basis that include the latest technologies conforming to the newest standards and that are appealing to end users, we will not be able to compete effectively, and our ability to generate significant revenues will be seriously harmed.
The development of new products and services can be very difficult and requires high levels of innovation. The development process is also lengthy and costly. Short product life cycles expose our products to the risk of obsolescence and require frequent new product introductions. We will be unable to introduce new products and services into the market on a timely basis and compete successfully, if we fail to:
21
- invest significant resources in research and development, sales and marketing, and customer support;
- identify emerging trends, demands and standards in the field of mobile computing products;
- enhance our products by adding additional features;
- maintain superior or competitive performance in our products; and
-
anticipate our end users' needs and technological trends accurately.
We cannot be sure that we will have sufficient resources to make adequate investments in research and development or that we will be able to identify trends or make the technological advances necessary to be competitive.
A significant portion of our revenue currently comes from three distributors, and any decrease in revenue from these distributors could harm our business.
A significant portion of our revenue comes from two distributors, Tech Data Corporation and Ingram Micro Inc., which together represented approximately 27%, 35%, and 31% of our worldwide revenues in fiscal years 2010, 2009, and 2008, respectively. We expect that a significant portion of our revenue will continue to depend on sales to Tech Data Corporation and Ingram Micro Inc. Additionally, 11% of our revenues in fiscal 2010 came from our distributor BlueStar, Inc., and 10% of our revenue in fiscal 2010 came from Epocal, Inc., an OEM customer. We do not have long-term commitments from Tech Data Corporation, Ingram Micro Inc., or BlueStar, Inc. to carry our products. Any could choose to stop selling some or all of our products at any time, and each of these companies also carries our competitors' products. If we lose our relationship with Tech Data Corporation, Ingram Micro Inc., or BlueStar, Inc., we would experience disruption and delays in marketing our products.
If the market for mobile computers experiences delays, or fails to grow, we may not achieve our sales projections.
Substantially all of our peripheral products are designed for use with mobile computers, including handhelds, notebooks, tablets, and handhelds with integrated phones. If the mobile computer industry does not grow, if its growth slows, or if product or operating system changeovers by mobile computer manufacturers and partners cause delays in the market, or if the markets for our mobile handheld computers do not grow, or if the impact of the global economic financial crisis continues, we may not achieve our sales projections.
Our sales will be hurt if the new technologies used in our products do not become widely adopted, or are adopted slower than expected.
Many of our products use new technologies, such as two dimensional bar code scanning and radio frequency identification, which are not yet widely adopted in the market. If these technologies fail to become widespread, or are adopted slower than expected, our sales will suffer.
We could face increased competition in the future, which would adversely affect our financial performance.
The market for mobile handheld computers in which we operate is very competitive. Our future financial performance is contingent on a number of unpredictable factors, including that:
22
- some of our competitors have greater financial, marketing, and technical resources than we do;
- we periodically face intense price competition, particularly when our competitors have excess inventories and discount their prices to clear their inventories; and
- certain manufacturers of personal computers, mobile phones and handheld computers offer products with built-in functions, such as Bluetooth wireless technology, Wi-Fi, or bar code scanning, that compete with our products.
Increased competition could result in price reductions, fewer customer orders, reduced margins, and loss of market share. Our failure to compete successfully against current or future competitors could harm our business, operating results and financial condition.
If we do not correctly anticipate demand for our products, our operating results will suffer.
The demand for our products depends on many factors and is difficult to forecast. We expect that it will become more difficult to forecast demand given current economic conditions, as we introduce and support more products, and as competition in the market for our products intensifies. If demand is lower than forecasted levels, we could have excess production resulting in higher inventories of finished products and components, which could lead to write-downs or write-offs of some or all of the excess inventories, and reductions in our cash balances. Lower than forecasted demand could also result in excess manufacturing capacity at our third-party manufacturers and in our failure to meet minimum purchase commitments, each of which may lower our operating results.
If demand increases beyond forecasted levels, we would have to rapidly increase production at our third-party manufacturers. We depend on suppliers to provide additional volumes of components, and suppliers might not be able to increase production rapidly enough to meet unexpected demand. Even if we were able to procure enough components, our third-party manufacturers might not be able to produce enough of our devices to meet our customer demand. In addition, rapid increases in production levels to meet unanticipated demand could result in higher costs for manufacturing and supply of components and other expenses. These higher costs could lower our profit margins. Further, if production is increased rapidly, manufacturing yields could decline, which may also lower operating results.
We rely primarily on distributors, resellers, vertical industry partners, and OEMs to sell our products, and our sales would suffer if any of these third-parties stops selling our products effectively.
Because we sell our products primarily through distributors, resellers, vertical industry partners, and OEMs, we are subject to risks associated with channel distribution, such as risks related to their inventory levels and support for our products. Our distribution channels may build up inventories in anticipation of growth in their sales. If such growth in their sales does not occur as anticipated, the inventory build up could contribute to higher levels of product returns. The lack of sales by any one significant participant in our distribution channels could result in excess inventories and adversely affect our operating results and working capital liquidity.
Our agreements with distributors, resellers, vertical industry partners, and OEMs are generally nonexclusive and may be terminated on short notice by them without cause. Our distributors, resellers, vertical industry partners, and OEMs are not within our control, are not obligated to purchase products from us, and may offer competitive lines of products simultaneously. Sales growth is contingent in part on our ability to enter into additional distribution relationships and expand our sales channels. We cannot predict whether we will be successful in establishing new distribution relationships, expanding our sales channels or maintaining our existing relationships. A failure to enter into new distribution relationships or to expand our sales channels could adversely impact our ability to grow our sales.
23
We allow our distribution channels to return a portion of their inventory to us for full credit against other purchases. In addition, in the event we reduce our prices, we credit our distributors for the difference between the purchase price of products remaining in their inventory and our reduced price for such products. Actual returns and price protection may adversely affect future operating results and working capital liquidity by reducing our accounts receivable and increasing our inventory balances, particularly since we seek to continually introduce new and enhanced products and are likely to face increasing price competition.
We depend on alliances and other business relationships with a small number of third-parties, and a disruption in any one of these relationships would hinder our ability to develop and sell our products.
We depend on strategic alliances and business relationships with leading participants in various segments of the communications and mobile handheld computer markets to help us develop and market our products. Our strategic partners may revoke their commitment to our products or services at any time in the future or may develop their own competitive products or services. Accordingly, our strategic relationships may not result in sustained business alliances, successful product or service offerings, or the generation of significant revenues. Failure of one or more of such alliances could result in delay or termination of product development projects, failure to win new customers, or loss of confidence by current or potential customers.
We have devoted significant research and development resources to design products to work with a number of operating systems used in mobile devices including Windows Mobile, Windows CE, Windows 7/Vista/XP, RIM Blackberry, Apple, Google's Android, and to develop our own family of mobile handheld computers. Such design activities have diverted financial and personnel resources from other development projects. These design activities are not undertaken pursuant to any agreement under which Microsoft, Research In Motion, Apple, or Google is obligated to continue the collaboration or to support the products produced from the collaboration. Consequently, these organizations may terminate their collaborations with us for a variety of reasons, including our failure to meet agreed-upon standards or for reasons beyond our control, such as changing market conditions, increased competition, discontinued product lines, and product obsolescence.
Our intellectual property and proprietary rights may be insufficient to protect our competitive position.
Our business depends on our ability to protect our intellectual property. We rely primarily on patent, copyright, trademark, trade secret laws, and other restrictions on disclosure to protect our proprietary technologies. We cannot be sure that these measures will provide meaningful protection for our proprietary technologies and processes. We cannot be sure that any patent issued to us will be sufficient to protect our technology. The failure of any patents to provide protection to our technology would make it easier for our competitors to offer similar products. In connection with our participation in the development of various industry standards, we may be required to license certain of our patents to other parties, including our competitors, that develop products based upon the adopted standards.
24
We also generally enter into confidentiality agreements with our employees, distributors, and strategic partners, and generally control access to our documentation and other proprietary information. Despite these precautions, it may be possible for a third-party to copy or otherwise obtain and use our products, services, or technology without authorization, develop similar technology independently, or design around our patents.
Effective copyright, trademark, and trade secret protection may be unavailable or limited in certain foreign countries. Furthermore, certain of our customers have entered into agreements with us which provide that the customers have the right to use our proprietary technology in the event we default in our contractual obligations, including product supply obligations, and fail to cure the default within a specified period of time.
We may become subject to claims of intellectual property rights infringement, which could result in substantial liability.
In the course of operating our business, we may receive claims of intellectual property infringement or otherwise become aware of potentially relevant patents or other intellectual property rights held by other parties. Many of our competitors have large intellectual property portfolios, including patents that may cover technologies that are relevant to our business. In addition, many smaller companies, universities, and individuals have obtained or applied for patents in areas of technology that may relate to our business. The industry is moving towards aggressive assertion, licensing, and litigation of patents and other intellectual property rights.
If we are unable to obtain and maintain licenses on favorable terms for intellectual property rights required for the manufacture, sale, and use of our products, particularly those products which must comply with industry standard protocols and specifications to be commercially viable, our results of operations or financial condition could be adversely impacted.
In addition to disputes relating to the validity or alleged infringement of other parties' rights, we may become involved in disputes relating to our assertion of our own intellectual property rights. Whether we are defending the assertion of intellectual property rights against us or asserting our intellectual property rights against others, intellectual property litigation can be complex, costly, protracted, and highly disruptive to business operations by diverting the attention and energies of management and key technical personnel. Plaintiffs in intellectual property cases often seek injunctive relief, and the measures of damages in intellectual property litigation are complex and often subjective or uncertain. Thus, any adverse determinations in this type of litigation could subject us to significant liabilities and costs.
25
New industry standards may require us to redesign our products, which could substantially increase our operating expenses.
Standards for the form and functionality of our products are established by standards committees. These independent committees establish standards, which evolve and change over time, for different categories of our products. We must continue to identify and ensure compliance with evolving industry standards so that our products are interoperable and we remain competitive. Unanticipated changes in industry standards could render our products incompatible with products developed by major hardware manufacturers and software developers. Should any major changes, even if anticipated, occur, we would be required to invest significant time and resources to redesign our products to ensure compliance with relevant standards. If our products are not in compliance with prevailing industry standards for a significant period of time, we would miss opportunities to sell our products for use with new hardware components from mobile computer manufacturers and OEMs, thus affecting our business.
Undetected flaws and defects in our products may disrupt product sales and result in expensive and time-consuming remedial action.
Our hardware and software products may contain undetected flaws, which may not be discovered until customers have used the products. From time to time, we may temporarily suspend or delay shipments or divert development resources from other projects to correct a particular product deficiency. Efforts to identify and correct errors and make design changes may be expensive and time consuming. Failure to discover product deficiencies in the future could delay product introductions or shipments, require us to recall previously shipped products to make design modifications, or cause unfavorable publicity, any of which could adversely affect our business and operating results.
The loss of one or more of our senior personnel could harm our existing business.
A number of our officers and senior managers have been employed for sixteen to nineteen years by us, including our President, Executive Vice President, Chief Financial Officer, and Chief Technical Officer. Our future success will depend upon the continued service of key officers and senior managers. Competition for officers and senior managers is intense, and there can be no assurance that we will be able to retain our existing senior personnel. The loss of one or more of our officers or key senior managers could adversely affect our ability to compete.
The expensing of options will continue to reduce our operating results and may continue to cause us to incur net losses such that we may find it necessary to change our business practices to attract and retain employees.
Historically, we have used stock options as a key component of our employee compensation packages. We believe that stock options provide an incentive to our employees to maximize long-term stockholder value and, through the use of vesting, encourage valued employees to remain with us. Furthermore, on July 1, 2010, we completed a stockholder approved exchange offer for certain of our outstanding options. As a result, the total remaining unrecognized compensation costs related to unvested stock options increased by $0.74 million, which is being amortized over the weighted average remaining requisite period of 2.4 years. The expensing of employee stock options adversely affected our net income and earnings per share in each of the quarters in fiscal 2010, 2009, and 2008, will continue to adversely affect future quarters, and will make profitability harder to achieve. In addition, we may decide in response to the effects of expensing stock options on our operating results to reduce the number of stock options granted to employees or to grant options to fewer employees. This could adversely affect our ability to retain existing employees and attract qualified candidates, and also could increase the cash compensation we would have to pay to them.
26
If we are unable to attract and retain highly skilled sales and marketing and product development personnel, our ability to develop and market new products and product enhancements will be adversely affected.
We believe our ability to achieve increased revenues and to develop successful new products and product enhancements will depend in part upon our ability to attract and retain highly skilled sales and marketing and product development personnel. Our products involve a number of new and evolving technologies, and we frequently need to apply these technologies to the unique requirements of mobile products. Our personnel must be familiar with both the technologies we support and the unique requirements of the products to which our products connect. Competition for such personnel is intense, and we may not be able to attract and retain such key personnel. In addition, our ability to hire and retain such key personnel will depend upon our ability to raise capital or achieve increased revenue levels to fund the costs associated with such key personnel. Failure to attract and retain such key personnel will adversely affect our ability to develop and market new products and product enhancements.
We may not be able to collect revenues from customers who experience financial difficulties.
Our accounts receivable are derived primarily from distributors and OEMs. We perform ongoing credit evaluations of our customers' financial conditions but generally require no collateral from our customers. Reserves are maintained for potential credit losses, and such losses have historically been within such reserves. However, many of our customers may be thinly capitalized and may be prone to failure in adverse market conditions. Although our collection history has been good, from time to time a customer may not pay us because of financial difficulty, bankruptcy or liquidation. The current global financial crisis may have an impact on our customers' ability to pay us in a timely manner, and consequently, we may experience increased difficulty in collecting our accounts receivable, and we may have to increase our reserves in anticipation of increased uncollectible accounts.
Our operating results could be harmed by economic, political, regulatory and other risks associated with export sales.
Export sales (sales to customers outside the United States) accounted for approximately 24%, 42%, and 37% of our revenue in fiscal years 2010, 2009, and 2008, respectively. Accordingly, our operating results are subject to the risks inherent in export sales, including:
- longer payment cycles;
- unexpected changes in regulatory requirements, import and export restrictions and tariffs;
- difficulties in managing foreign operations;
- the burdens of complying with a variety of foreign laws;
- greater difficulty or delay in accounts receivable collection;
- potentially adverse tax consequences; and
- political and economic instability.
27
Our export sales are primarily denominated in United States dollars and in Euros for our sales to European distributors. Accordingly, an increase in the value of the United States dollar relative to foreign currencies could make our products more expensive and therefore potentially less competitive in foreign markets. Declines in the value of the Euro relative to the United States dollar may result in foreign currency losses relating to collection of Euro denominated receivables if left unhedged.
Our operations are vulnerable to interruption by fire, earthquake, power loss, telecommunications failure, and other events beyond our control.
Our corporate headquarters is located near an earthquake fault. The potential impact of a major earthquake on our facilities, infrastructure, and overall business is unknown. Additionally, we may experience electrical power blackouts or natural disasters that could interrupt our business. Should a disaster be widespread, such as a major earthquake, or result in the loss of key personnel, we may not be able to implement our disaster recovery plan in a timely manner. Any losses or damages incurred by us as a result of these events could have a material adverse effect on our business.
Failure to maintain effective internal controls could have a material adverse effect on our business, operating results and stock price.
We have evaluated and will continue to evaluate our internal control procedures in order to satisfy the requirements of Section 404 of the Sarbanes-Oxley Act, which requires an annual management assessment of the design and effectiveness of our internal control over financial reporting. If we fail to maintain the adequacy of our internal controls, as such standards are modified, supplemented or amended from time to time, we may not be able to ensure that we can conclude on an ongoing basis that we have effective internal control over financial reporting in accordance with Section 404 of the Sarbanes-Oxley Act. Moreover, effective internal controls, particularly those related to revenue recognition, are necessary for us to produce reliable financial reports and are important to helping prevent financial fraud. If we cannot provide reliable financial reports or prevent fraud, our business and operating results could be harmed, investors could lose confidence in our reported financial information, and the trading price of our stock could drop significantly.
The sale of a substantial number of shares of our Common Stock could cause the market price of our Common Stock to decline.
Sales of a substantial number of shares of our Common Stock in the public market could adversely affect the market price for our Common Stock. The market price of our Common Stock could also decline if one or more of our significant stockholders decided for any reason to sell substantial amounts of our Common Stock in the public market.
As of March 10, 2011, we had 4,084,476 shares of Common Stock outstanding. Substantially all of these shares are freely tradable in the public market, either without restriction or subject, in some cases, only to S-3 prospectus delivery requirements and, in other cases, only to manner of sale, volume, and notice requirements of Rule 144 under the Securities Act.
28
As of March 10, 2011, we had 1,394,673 shares of Common Stock subject to outstanding options under our stock option plans, and 129,439 shares of Common Stock were available for future issuance under the plans. We have registered the shares of Common Stock subject to outstanding options and reserved for issuance under our stock option plans. Accordingly, the shares of Common Stock underlying vested options will be eligible for resale in the public market as soon as the options are exercised.
As of March 10, 2011, we had 86,585 shares of Common Stock subject to outstanding warrants issued in our 2009 private placement. We have registered the resale of all shares of Common Stock subject to the warrants. Accordingly, the shares of Common Stock underlying these warrants will be eligible for resale in the public market as soon as the warrants are exercised, subject to S-3 prospectus delivery requirements.
As of March 10, 2011, we had 666,666 shares of Common Stock subject to the conversion of a note issued in our November 2010 senior convertible note financing. The conversion price of this note is subject to one additional conversion price reset one year from date of issuance of the note, and, depending upon the market price of our Common Stock at the time of such reset, can result in an increase in the number of shares we are obligated to issue upon conversion of the note up to an additional 97,732 shares in aggregate. As of March 10, 2011, we had 550,000 shares of Common Stock subject to outstanding warrants issued in connection with the convertible note financing in November 2010. The warrants are not exercisable until May 20, 2011. We have registered the resale of all shares of Common Stock subject to the note conversion and warrants. Accordingly, the shares of Common Stock underlying the note and warrants will be eligible for resale in the public market as soon as the note is converted and the warrants are eligible and exercised, subject to S-3 prospectus delivery requirements.
Volatility in the trading price of our Common Stock could negatively impact the price of our Common Stock.
During the period from January 1, 2010 through March 10, 2011, our Common Stock price fluctuated between a high of $5.44 and a low of $1.51. Following a one-for-ten reverse stock split effected on October 23, 2008, which significantly decreased the Company's share float, we have experienced low trading volumes in our stock, and thus relatively small purchases and sales can have a significant effect on our stock price. The trading price of our Common Stock could be subject to wide fluctuations in response to many factors, some of which are beyond our control, including general economic conditions and the outlook of securities analysts and investors on our industry. In addition, the stock markets in general, and the markets for high technology stocks in particular, have experienced high volatility that has often been unrelated to the operating performance of particular companies. These broad market fluctuations may adversely affect the trading price of our Common Stock.
29
(Table of
Contents)
Item 1B. Unresolved Staff Comments
None.
We lease a 37,100 square foot office facility in Newark, California under a lease expiring in June 2018. This facility houses our headquarters and manufacturing operations, and is used by all segments of the Company. We believe that our current facilities are sufficient and adequate to meet our needs for the foreseeable future.
We are currently not a
party to any material legal proceedings.
Item 4. Reserved
30
PART II
Item 5. Market for Registrant's Common Equity, Related Stockholder Matters and Issuer Purchases of Equity Securities
Common Stock
The Company's Common Stock is traded on the NASDAQ Capital Market under the symbol "SCKT."
The quarterly high and low sales prices of our Common Stock, as reported on the NASDAQ Capital Market through March 10, 2011 and for the last two fiscal years are as shown below:
|
Common
Stock
|
||||||
|
Quarter
Ended
|
High
|
Low
|
||||
|
2009
|
||||||
|
March 31, 2009
|
$ | 3.79 | $ | 1.32 | ||
|
June 30, 2009
|
$ | 3.98 | $ | 1.80 | ||
|
September 30, 2009
|
$ | 3.49 | $ | 2.25 | ||
|
December 31, 2009
|
$ | 3.65 | $ | 2.31 | ||
|
2010
|
||||||
|
March 31, 2010
|
$ | 5.44 | $ | 2.50 | ||
|
June 30, 2010
|
$ | 3.40 | $ | 2.31 | ||
|
September 30, 2010
|
$ | 3.04 | $ | 2.28 | ||
|
December 31, 2010
|
$ | 2.65 | $ | 1.51 | ||
|
2011
|
||||||
|
March 31, 2011 (through March 10, 2011)
|
$ | 2.25 | $ | 1.62 | ||
| _____________________________________________________________________________________________________________________________________________________________________________________________________________ |
On March 10, 2011, the closing sales price for our Common Stock as reported
on the NASDAQ Capital Market was $1.77. We had approximately 4,300 beneficial
stockholders of record as of February 28, 2011. We have not paid dividends on
our Common Stock, and we currrently intend to retain future earnings for use
in our business and do not anticipate paying dividends in the foreseeable future.
The information required by this item regarding equity compensation plans is incorporated by reference to the information set forth in Item 12 of this Annual Report on Form 10-K.
31
Performance Graph
The performance graph shown below shall not be deemed "filed" for purposes of Section 18 of the Securities Exchange Act of 1934, as amended, or otherwise subject to the liabilities under that section, and shall not be deemed to be incorporated by reference into any filing of Socket Mobile, Inc. under the Securities Act of 1933, as amended, or the Exchange Act. The performance graph below shows a five-year comparison of cumulative total stockholder return, calculated on a dividend reinvestment basis and based on a $100 investment, from December 31, 2005 through December 31, 2010 comparing the return on the Company's Common Stock with the Russell 2000 Index and the NASDAQ Computer & Data Processing Index. No dividends have been declared or paid on the Common Stock during such period. Historical stock price performance is not necessarily indicative of future stock price performance.
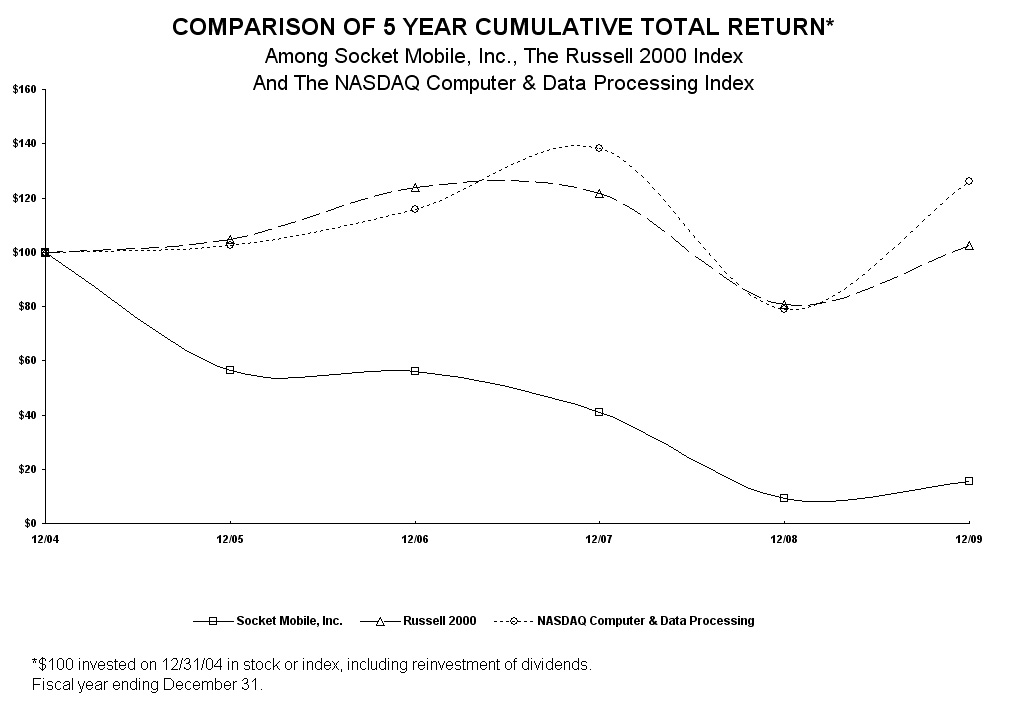
32
Item 6. Selected Financial Data
The following selected financial data should be read in conjunction with Item 7, "Management's Discussion and Analysis of Financial Condition and Results of Operations," and the financial statements and the notes thereto in Item 8, "Financial Statements and Supplementary Data."
| Years Ended December 31 | |||||||||||||||||||||
| (Amounts in thousands except per share) |
|
2006
|
2007
|
2008
|
2009(a)
|
2010
|
|||||||||||||||
| Income Statement Data: | |||||||||||||||||||||
|
Revenue
|
$ | 24,981 | $ | 24,118 | $ | 26,557 | $ | 17,127 | $ | 13,498 | |||||||||||
|
Gross profit
|
$ | 12,191 | $ | 11,873 | $ | 12,390 | $ | 7,374 | $ | 5,401 | |||||||||||
|
Operating expenses
|
$ | 15,120 | $ | 15,261 | $ | 15,074 | $ | 15,702 | $ | 9,116 | |||||||||||
|
Net loss
|
$ | (2,923 | ) | $ | (3,340 | ) | $ | (2,765 | ) | $ | (7,889 | ) | $ | (3,976 | ) | ||||||
|
Net loss per common share:
|
|||||||||||||||||||||
|
Basic
and diluted (b)
|
$ | (0.93 | ) | $ | (1.04 | ) | $ | (0.86 | ) | $ | (2.21 | ) | $ | (1.05 | ) | ||||||
|
Weighted average shares outstanding:
|
|||||||||||||||||||||
|
Basic
and diluted (b)
|
3,145 | 3,193 | 3,219 | 3,562 | 3,796 | ||||||||||||||||
|
At
December 31,
|
|||||||||||||||||||||
|
|
2006
|
2007
|
2008
|
2009
|
2010
|
||||||||||||||||
| Balance Sheet Data: | |||||||||||||||||||||
|
Cash and cash equivalents
|
$ | 6,104 | $ | 4,963 | $ | 757 | $ | 1,940 | $ | 461 | |||||||||||
|
Restricted cash (c)
|
$ | --- | $ | --- | $ | --- | $ | --- | $ | 711 | |||||||||||
|
Total assets
|
$ | 22,787 | $ | 21,974 | $ | 19,757 | $ | 11,743 | $ | 9,067 | |||||||||||
|
Bank line of credit
|
$ | 2,213 | $ | 2,622 | $ | 1,006 | $ | 1,002 | $ | --- | |||||||||||
|
Senior convertible note (c)
|
$ | --- | $ | --- | $ | --- | $ | --- | $ | 330 | |||||||||||
|
Capital leases and deferred rent - long term portion
|
$ | --- | $ | 140 | $ | 110 | $ | 97 | $ | 202 | |||||||||||
|
Total stockholders' equity
|
$ | 15,751 | $ | 13,534 | $ | 11,674 | $ | 5,388 | $ | 2,893 | |||||||||||
(a) Amounts for 2009 include goodwill impairment charges of $5.4 million recorded as of December 31, 2009. Additional information regarding goodwill impairment is contained in "Item 7. Management's Discussion and Analysis of Financial Condition and Results of Operations" and in "Note 1 - Summary of Significant Accounting Policies." |
(b) Shares used in per share calculations of basic and diluted net loss per share reflect a one-for-ten reverse stock split effected by the Company on October 23, 2008. Net income and loss per share for the periods presented prior to the reverse split have been retroactively restated. See "Note 9 - Reverse Stock Split" for additional information. |
(c) Under the terms of the senior convertible note financing closed in November 2010, the Company is required to set aside cash collateral to the extent qualified accounts receivables are less than the note plus interest. At December 31, 2010, the cash collateral requirement was $0.7 million. At December 31, 2010 the amount shown as the Company's senior convertible note, represents the $1.0 million face value of the note net of debt discount of $0.67 million. See "Note 2 - Senior Convertible Note Financing" for additional information. |
33
Item 7. Management's Discussion and Analysis of Financial Condition and Results of Operations
Critical Accounting Policies
Our significant accounting policies are described in Note 1 to our financial statements for the year ended December 31, 2010. The application of these policies requires us to make estimates and judgments that affect the reported amount of assets, liabilities, revenues and expenses, and related disclosure of contingent assets and liabilities. We base our estimates on a combination of historical experience and reasonable judgment applied to other facts. Actual results may differ from these estimates, and such differences may be material to the financial statements. In addition, the use of different assumptions or judgments may result in different estimates. We believe our critical accounting policies that are subject to these estimates are: Revenue Recognition and Accounts Receivable Reserves, Inventory Valuation, Stock Based-Compensation, and Valuation of Goodwill and Other Intangible Assets.
Revenue Recognition and Accounts Receivable Reserves
We defer revenue recognition on products sold to distributors until our distributors
sell the products to their customers, because our distributors generally have
rights to return products to us for stock rotation, stock reduction, or replacement
of defective product. The amount of deferred revenue net of related cost of
revenue is classified as deferred income on shipments to distributors on our
balance sheet. We use inventory reports received from our distributors at the
end of each reporting period to determine the extent of inventory at the distributor,
and thus, the amount of income to defer. Stock rotation and stock reduction
from our distributors generally results in a balance sheet adjustment to our
deferred income and does not impact our revenue or cost of revenue.
We generally recognize revenues on sales to customers other than distributors upon shipment provided that persuasive evidence of a sales arrangement exists, the price is fixed and determinable, title has transferred, collection of resulting receivables is reasonably assured, there are no customer acceptance requirements, and there are no remaining significant obligations. Most of our customers other than distributors do not have rights of return except under warranty.
We also earn revenue from an extended warranty service program offered on select products. Revenues from the extended warranty service program are recognized ratably over the life of the extended warranty contract. The amount of unrecognized warranty service revenue is classified as deferred service revenue and presented on our balance sheet in its short and long term components. We also earn revenue from services performed in connection with consulting arrangements. For those contracts that include contract milestones or acceptance criteria we recognize revenue as such milestones are achieved or as such acceptance occurs. In some instances the acceptance criteria in the contract requires acceptance after all services are complete and all other elements have been delivered, in which case revenue recognition is deferred until those requirements are met.
We estimate the amount of uncollectible receivables at the end of each reporting period based on the aging of the receivable balance, historical trends, and communications with our customers. If actual bad debts are significantly different from our estimates our operating results will be affected.
34
Inventory Valuation
Our inventories primarily consist of component parts used to assemble our products
after we receive orders from our customers. We purchase or have manufactured
the component parts required by our engineering bill of materials. The timing
and quantity of our purchases are based on order forecasts, the lead time requirements
of our vendors, and on economic order quantities. At the end of each reporting
period, we compare our inventory on hand to our forecasted requirements for
the next nine-month period, and write off the cost of any inventory that is
surplus, less any amounts that we believe we can recover from disposal of goods
that we specifically believe will be saleable past a nine-month horizon. Our
sales forecasts are based upon historical trends, communications from customers,
and marketing data regarding market trends and dynamics, which we discuss in
Item 1, Business. Surplus or obsolete inventory can also be created by changes
to our engineering bill of materials. Charges for the amounts we record as surplus
or obsolete inventory are included in cost of revenue.
Stock-Based Compensation
On January 1, 2006, we began accounting for share-based awards to employees,
including grants of employee stock options, in our financial statements based
on the fair values of the share-based awards. We use a binomial lattice valuation
model to estimate the fair value of stock option grants made on or after January
1, 2006. The binomial lattice model incorporates calculations for expected volatility,
risk-free interest rates, employee exercise patterns and post-vesting employment
termination behavior, and these factors affect the estimate of the fair value
of the stock option grants.
Valuation of Goodwill and Other Intangible Assets
Goodwill is tested for impairment at least annually and between annual tests
if indicators of potential impairment exist. We test goodwill for impairment
at the reporting unit level. A two-step test is required to be performed to
assess goodwill for impairment. The first step of the goodwill impairment test
requires a determination of whether the fair value of the reporting unit is
less than its carrying value. If the fair value exceeds the carrying value,
goodwill is not impaired and no further testing is performed. The second step
is performed only if the carrying value exceeds the fair value. The second step
involves an analysis reflecting the allocation of fair value determined in the
first step (as if it was the purchase price in a business combination). This
process may result in the determination of a new amount of goodwill. If the
calculated fair value of the goodwill resulting from this allocation is lower
than the carrying value of the goodwill in the reporting unit, the difference
is reflected as a non-cash impairment loss. The purpose of the second step is
only to determine the amount of goodwill that should be recorded on the balance
sheet. The recorded amounts of other items on the balance sheet are not adjusted.
We have determined that we have one reporting unit for purposes of goodwill
testing.
We estimate the fair value of our single reporting unit utilizing up to three valuation methods: market capitalization, income approach and market approach. Revenue and expense forecasts used in the evaluation of goodwill are based on trends of historical performance and our estimate of future performance. We assess the impairment of certain long-lived assets, including intangible assets with definite useful lives, at least annually and whenever events or changes in circumstances indicate that the carrying value may not be recoverable.
35
Revenues
Our revenues have been classified into three primary product families for the years ended December 31, 2010, 2009, and 2008. Additionally, we continue to carry legacy plug-in connectivity products, and up through 2009 carried serial products until the sale of our serial product line in the third quarter of 2009. Our product revenues are presented in the following table:
| (revenues in thousands) |
Years
ended December 31,
|
%
Increase (Decrease) |
||||||||||||||||||||||||
| 2010 | 2009 | 2008 | 2010
vs. 2009 |
2009
vs. 2008 |
||||||||||||||||||||||
| Product family: |
$'s
|
%'s
|
|
$'s
|
%'s
|
|
$'s
|
%'s
|
|
|||||||||||||||||
|
Mobile handheld computer products
|
$ | 6,622 | 49 | % | $ | 6,467 | 38 | % | $ | 4,730 | 18 | % | 2 | % | 37 | % | ||||||||||
|
Data collection products
|
4,956
|
37
|
%
|
5,632
|
33
|
%
|
9,296
|
35
|
%
|
(12
|
%)
|
(39
|
%)
|
|||||||||||||
|
OEM embedded products
|
1,414 | 10 | % | 3,318 | 19 | % | 9,306 | 35 | % | (57 | %) | (64 | %) | |||||||||||||
|
|
|
|
|
|||||||||||||||||||||||
|
Other:
|
||||||||||||||||||||||||||
|
Connectivity
|
506
|
4
|
%
|
815
|
5
|
%
|
1,617
|
6
|
%
|
(38
|
%)
|
(50
|
%)
|
|||||||||||||
|
Serial interface
|
--- |
|
895 | 5 |
%
|
1,608 | 6 |
%
|
(100 | %) | (44 | %) | ||||||||||||||
|
Total
|
$ | 13,498 | 100 | % | $ | 17,127 | 100 | % | $ | 26,557 | 100 | % | (21 | %) | (36 | %) | ||||||||||
Our mobile handheld computer product revenues in 2010 increased by 2%,
or $155,000 from mobile handheld computer product revenues in 2009. Sales of
our mobile handheld computer through the first nine months of 2010 increased
by 12% compared to the same period in 2009, due to an increase in the volume
of mobile handheld computer sales combined with an increase in related service
revenues as a result of an increased percentage of customers opting to purchase
our SocketCare extended warranty and accidental breakage coverage in conjunction
with their deployments. However, in the fourth quarter 2010, sales of our mobile
handheld computer products were reduced as a result of shortages in the availability
of LCD touch screens used in the manufacture of our mobile handheld computer.
Beginning in late 2010, major tablet and smartphone manufacturers secured a
majority of the LCD touch screen manufacturing capacity causing short term supply
disruptions as LCD touch screen manufacturers reprioritized their capacity commitments.
Our mobile handheld product revenues in the fourth quarter 2010 declined to
$1.2 million from $1.9 million in the third quarter 2010 as a consequence of
the supply delays and our inability to ship our customer orders scheduled for
shipment in the fourth quarter.
Increased revenues in 2009 from our mobile handheld computer products reflect higher sales volumes due to a growing customer base with larger average unit deployments compared to 2008. Although the annual revenues in 2009 indicate growth in our mobile handheld computer revenues, we believe this growth was slowed by the worldwide economic slowdown beginning in late 2008, as our customers took longer to make their deployment decisions. In the second half of 2009 mobile handheld computer revenues declined by 3% compared to the first half of 2009 due to the completion of a year-long roll-out to a key customer in the healthcare market early in the third quarter. Declines in sales to this key customer in the second half of 2009 were partially offset by growth in sales to existing customers in healthcare and other markets, which grew at a rate of 33% in the second half of 2009 compared to the first half.
36
Our data collection product revenues in 2010 decreased by $0.7 million from data collection revenues in 2009. Revenue decreases in 2010 were primarily from declines of $0.6 million in sales of our SDIO In-Hand Scan card due to reduced sales volumes of this product. Remaining declines in 2010 were from reduced sales of our Cordless Hand Scanner and Cordless Ring Scanner. Sales of our CompactFlash In-Hand Scan card were flat in 2010 compared to 2009. Our data collection product revenues continue to be affected by the worldwide economic slowdown as customers defer their deployment decisions. A significant sales volume of our plug-in scan cards are sold in conjunction with our mobile handheld computer. In the fourth quarter 2010 in particular, supply delays in our mobile handheld computer mentioned previously, adversely impacted our mobile handheld computer sales and consequently the companion plug-in scan card revenues as we were forced to defer shipments beyond year end.
In 2009, our data collection product revenues decreased by $3.7 million from data collection revenues in 2008. The decrease was due to a decline of $1.6 million in sales of our CompactFlash In-Hand Scan card product, a decline of $1.1 million in sales of our Cordless Hand Scanner, a decline $0.9 million in sales of our SDIO In-Hand Scan card, and a decline in sales of our Cordless Ring Scanner. Revenue declines in 2009 were due primarily to lower sales volumes of these primary scanning products due to the effects of the worldwide economic slowdown which began in the fourth quarter of 2008.
Service revenues from our SocketCare extended warranty program were $0.8 million or 6 % of our revenue in 2010 and approximately $0.3 million or 2 percent of our revenue in 2009. Service revenues were insignificant for 2008. Increases in SocketCare service revenues are due to an increased percentage of customers opting to purchase our SocketCare extended warranty and accidental breakage coverage in conjunction with their mobile handheld computer and data collection deployments. Revenues related to our SocketCare services have been allocated to the respective mobile handheld computer and data collection revenues for each of the years presented in the table above.
Our OEM embedded product revenues declined in 2010 by $1.9 million from revenues in 2009. Approximately half of the revenue decrease was due to reduced sales of Bluetooth products. Sales of our Bluetooth modules to our OEM customers declined as a result of phasing out older Bluetooth technology and a last-buy purchase program through 2009. Sales of Bluetooth plug-in products declined as a result of last-buys of these products as we completed the phase out of these products in 2010. Remaining declines in the 2010 were from reductions in sales of our wireless LAN plug-in cards.
In 2009, our OEM embedded product revenues declined by $6.0 million from revenues in 2008. Revenue decreases of $5.6 million in 2009 were from reduced sales of our Bluetooth modules to our OEM customers as a result of phasing out older Bluetooth technology and a last-buy purchase program mentioned previously. Our OEM customers made last-buy Bluetooth module purchases beginning in the third quarter of 2008, with the majority of these shipments occurring in the latter half of 2008, followed by the final remaining shipments completed primarily in the first quarter of 2009. Additional declines in 2009 of $0.5 million were from reductions in sales of our wireless LAN plug-in cards. Remaining declines in 2009 were from reduced sales of our Bluetooth plug-in cards, a trend that continued from 2008, reflecting lower overall requirements for these products by our OEM customers and the availability of this wireless technology already built into handheld computers to our non-OEM customers. Partially offsetting these declines in 2009 were increases of $0.2 million in sales of our wireless LAN modules.
37
Our connectivity product revenues for the three years presented in the above table consist of Ethernet plug-in cards, modems, and accessory products including our Mobile Power Pack, adapters and cables. Connectivity product revenues in 2010 decreased by $0.3 million from connectivity product revenues in 2009, and connectivity revenues in 2009 decreased by $0.8 million from connectivity product revenues in 2008. The decrease in 2010 was primarily due to declines in sales of our modem plug-in products with remaining declines from reduced sales of our Ethernet plug-in products. The decrease in 2009 was due primarily to a decline of $0.7 million from reduced sales of our modem plug-in products with remaining declines from reduced sales of our Ethernet plug-in products. Overall connectivity product revenues have declined in the periods presented, reflecting a trend of year-over-year reductions in corporate deployments of these wired connection solutions as most users of mobile computing devices now connect to networks wirelessly.
As a result of the sale of our serial product technology and business on September 30, 2009, there are no revenues from serial interface products recognized beyond fiscal 2009. Our serial interface product revenues declined in 2009 by $0.7 million from revenues in 2008. The decrease in 2009 was primarily from declines of $0.6 million in sales of our standard serial PC card products with additional declines due to lower sales of our Bluetooth serial adapter product, which were due in part to the sale of our serial product line to Quatech, Inc. on September 30, 2009 (see "Note 8 - Sale of Product Line Assets" for more information). Our standard serial PC card products were primarily sold to connect peripheral devices or other electronic equipment to notebook computers. Overall serial product revenues have declined in the periods presented through the date of sale of the product line, continuing a trend reflecting the gradual replacement of serial technology with USB and other newer connection technologies.
Gross Margins
Gross margins for 2010 were 40% of revenues compared to gross margins of 43%
in 2009 and 47% in 2008. We generally price our products as a markup from our
cost, and we offer discount pricing for higher volume purchases. Declines in
overall margins in 2010 compared to 2009 were due to declines in sales of above
average margin products combined with fixed overhead costs which comprised a
greater portion of the overall cost of goods sold due to lower revenues in 2010
compared to 2009. Partially offsetting these margin declines in 2010 were increases
in sales of our mobile handheld computer which comprised a greater portion of
our overall revenues combined with improved margins on this particular product
in 2010 compared to one year ago. Reductions in overall margins in 2009 compared
to 2008 were due primarily to increased sales of our mobile handheld computer
which comprised 37% of our revenues in 2009 compared to 18% in 2008. Margins
on our mobile handheld computer were below our average product margins, and
combined with a greater proportion of our revenues in 2009, resulted in overall
margin reductions compared to 2008. Additional margin declines in 2009 were
due to our fixed overhead costs, which comprise a greater portion of the overall
revenues and cost of goods sold due to lower revenues in 2009 compared to 2008.
38
Research and Development Expense
Research and development expense in 2010 was $2.4 million, a decrease of 16%
from research and development expense in 2009 of $2.9 million. Research and
development expense in 2009 decreased by 37% from research and development expense
in 2008 of $4.5 million. In 2010 we continued the implementation of cost reduction
programs in response to the economic climate. Approximately 31% if the reduction
in research and development expense in 2010 compared to 2009 was due to lower
personnel costs primarily from salary reductions. Remaining reductions in research
and development expense in 2010 were primarily from reduced development costs
due to a reduction in product development activities, and reduced equipment
costs related to the reductions in product development activities. Sixty three
percent of the reduction in research and development expense in 2009 was due
to reduced personnel costs as the result of a reduction-in-force action initiated
in the fourth quarter of 2008, followed by additional reductions in employee
compensation and related expense in 2009. In the fourth quarter of 2008 the
Company initiated a range of expense reductions across all departments and functional
expense categories in response to the worldwide economic slowdown, with additional
reductions following in the first and second quarters of 2009, and a continuation
of the reduced expense levels throughout the remaining quarters of 2009. Additional
reductions in research and development expense in 2009 were from decreases in
development fees due to a reduction in product development activities, and decreases
in equipment costs related to the reductions in product development activities.
Sales and Marketing Expense
Sales and marketing expense in 2010 was $4.1 million, a decrease of 21% compared
to sales and marketing expense in 2009 of $5.2 million. Sales and marketing
expense in 2009 decreased by 34% compared to sales and marketing expense in
2008 of $7.8 million. Approximately half of the reduction in sales and marketing
expense in 2010 was from reduced personnel costs due to salary reductions and
realignment of the sales force to emphasize inside sales personnel located at
the Company's Newark, CA headquarters to better serve our customer base. Additional
declines in 2010 were primarily from reduced advertising and promotion expense
and travel costs. Seventy five percent of the reduction in sales and marketing
expense in 2009 was due to reduced personnel costs as a result of the reduction-in-force
action initiated in the fourth quarter of 2008 referred to above and further
reductions in employee compensation and related expense during 2009. Additional
reductions in sales and marketing expense in 2009 were in the categories of
advertising and promotion expense, travel, outside services, and equipment costs.
General and Administrative Expense
General and administrative expense in 2010 was $2.5 million, an increase of
14% compared to general and administrative expense of $2.2 million in 2009.
General and administrative expense in 2009 decreased 16 % compared to general
and administrative expense of $2.7 million in 2008. In the fourth quarter 2010,
non-recurring expenses totaling $0.4 million related to the closing of our senior
convertible note financing in November 2010, were charged to general and administrative
expense. Excluding this fourth quarter non-recurring financing cost, remaining
general and administrative expenses in 2010 decreased 10% from comparable expenses
in 2009. Reductions in comparable general and administrative expense in 2010
were primarily from salary reductions, reduced occupancy costs and lower consulting
and professional fees. Partially offsetting these reductions in 2010 in comparable
expenses were increases in fees associated with our bank line of credit (through
the date of termination on November 2, 2010) and an increase in stock compensation
expense related to the stock option exchange completed on July 1, 2010. In 2009,
over half of the reduction in expense was due to decreases in payroll costs
primarily from reductions in employee compensation expense for the year. Additional
reductions in general and administrative expense in 2009 compared to 2008,were
primarily from decreases in consulting and professional fees and reduced investor
relations expense.
39
Amortization of Intangibles
In July 2004 we acquired a patent which covers the design and functioning of
plug-in bar code scanners, bar code imagers, and radio frequency identification
products. The patent was purchased for $600,000 and has been capitalized as
an intangible asset. The patent is being amortized on a straight line basis
over a ten-year period. Intangible assets of $571,000 remaining from a prior
acquisition in 2000 consisted of developed software and technology with estimated
lives at the time of acquisition of 8.5 years. Such amount was fully amortized
by mid 2009. Total amortization charges in 2010 for all acquired intangibles
were $60,000, compared to $77,000 in 2009, and $127,000 in 2008. The lower annual
amortization charges are due to components of intangible property becoming fully
amortized. Future intangible amortization charges are solely related to the
patent acquired in 2004, and will be $15,000 per quarter going forward until
fully amortized in June 2014.
Goodwill
Goodwill is tested for impairment annually as of September 30th or more frequently
when events or circumstances indicate that the carrying value of our single
reporting unit more likely than not exceeds its fair value. We performed the
annual goodwill impairment analysis as of September 30, 2010. We used the two-step
test as required to assess goodwill for impairment. The first step of the goodwill
impairment test consisted of comparing the carrying value of our reporting unit
to its fair value. We estimated the fair value of our reporting unit using various
methods and compared the fair value to the carrying amount (net book value)
to ascertain if potential goodwill impairment existed. We utilized methods that
focused on our ability to produce income ("Income Approach") and the
estimated consideration we would receive if there were a sale of the Company
("Market Approach"). Key assumptions utilized in the determination
of fair value in step one of the test included the following: our market capitalization;
market multiples of comparable companies within our industry; revenue and expense
forecasts used in the evaluation were based on trends of historical performance
and our estimate of future performance; cash flows utilized in the discounted
cash flow analysis were estimated using a weighted average cost of capital determined
to be appropriate for the Company. The fair value of our reporting unit exceeded
its carrying value and as a result, goodwill was considered not impaired as
of September 30, 2010, the date of our annual test for impairment. During the
fourth quarter of 2010, we also performed an update to the goodwill impairment
analysis. We determined goodwill was not impaired as of December 31, 2010 as
a result of our analysis. The factors used in performing a goodwill impairment
analysis are highly subjective and may be adversely affected by our future financial
results and market conditions, and may result in future impairment write-downs.
In the fourth quarter 2009 indications of impairment existed subsequent to the annual impairment test at September 30, 2009, and as a result we performed additional impairment testing with the assistance of a third party valuation specialist. Based on the impairment analysis at December 31, 2009, we recorded a preliminary estimate of $5,370,946 of goodwill impairment. In the quarter ended March 31, 2010, we finalized the impairment analysis without adjustment to the estimated impairment recorded at December 31, 2009.
40
Interest Income and Other, and Interest Expense
Interest income reflects interest earned on cash balances. Interest income in
2010 and 2009 was immaterial compared to interest income of $22,000 in 2008.
Lower interest income in the comparable periods reflects lower average cash
balances combined with lower average rates of return.
Interest expense was $246,000 in 2010 compared to $225,000 in 2009, and $71,000 in 2008. Interest expense is primarily related to interest on amounts drawn on our bank lines of credit (through the date of termination of the credit lines in November 2010), and in 2008 and also included interest related to a term loan outstanding which was repaid in full in December 2008 in conjunction with a new credit line agreement at that time. Additional interest expense is related to interest on equipment lease financing obligations in each of the years presented, and beginning in November 2010, interest on our senior convertible note payable and the related amortization of debt discount recognized in interest expense. Higher overall interest expense in 2010 compared to 2009 is due to the portion of debt discount amortized in 2010. Higher interest expense in 2009 compared to 2008 was due to higher average balances outstanding on our bank lines of credit at higher overall interest rates.
If unconverted for the duration of fiscal 2011, the annual interest expense on our senior convertible note will be $100,000, and the annual amortization of the related debt discount to be charged to interest expense will be approximately $678,000 (see "NOTE 2 - Senior Convertible Note Financing" for more information).
Income Taxes
Deferred tax expense of $16,000 in 2010, a deferred tax benefit of $225,000
in 2009, and deferred tax expense of $32,000 in 2008, and the corresponding
deferred tax liability shown on our balance sheet, is related entirely to the
deferred tax liability on the portion of our goodwill amortized for tax purposes.
Due to the indefinite characteristic of this deferred tax liability, it cannot
be offset against deferred tax assets. Goodwill impairment charges recorded
at December 31, 2009 on that portion of our goodwill being amortized for tax
purposes resulted in the reversal of accumulated deferred tax expense in 2009
and the related deferred tax liability, temporarily eliminating the difference
between financial and tax reporting at December 31, 2009, and through the first
half of 2010. Beginning in the third quarter 2010, differences between financial
and tax reporting resulted in deferred tax expense of $16,000 and the corresponding
deferred tax liability on our balance sheet at December 31, 2010. We maintain
a full valuation allowance for all other components of deferred tax assets.
There can be no assurance that the deferred tax assets subject to the valuation
allowance will be realized. We have not generated taxable income in any periods
in any jurisdiction, foreign or domestic.
41
Quarterly Results of Operations
The following table sets forth summary quarterly statements of operations data
for each of the quarters in 2009 and 2010. This unaudited quarterly information
has been prepared on the same basis as the annual information presented elsewhere
herein, and, in our opinion, includes all adjustments (consisting only of normal
recurring entries) necessary for a fair presentation of the information for
the quarters presented. The operating results for any quarter are not necessarily
indicative of results for any future period.
|
Quarter
Ended
|
|||||||||||||||||||||||||||||||||
| (amounts in thousands, except per share amounts) |
Mar
31,
|
Jun
30,
|
Sep
30,
|
Dec
31,
|
Mar
31,
|
Jun
30,
|
Sep
30,
|
Dec
31,
|
|||||||||||||||||||||||||
|
2009
|
2009
|
2009
|
2009
|
2010
|
2010
|
2010
|
2010
|
||||||||||||||||||||||||||
|
Summary
Quarterly Data:
|
|||||||||||||||||||||||||||||||||
|
Revenue
|
$ | 4,772 | $ | 4,143 | $ | 4,574 | $ | 3,638 | $ | 3,807 | $ | 3,654 | $ | 3,414 | $ | 2,623 | |||||||||||||||||
|
Cost of revenue
|
2,547 | 2,428 | 2,508 | 2,270 | 2,202 | 2,149 | 2,052 | 1,693 | |||||||||||||||||||||||||
|
Gross profit
|
2,225 | 1,715 | 2,066 | 1,368 | 1,605 | 1,505 | 1,362 | 930 | |||||||||||||||||||||||||
|
Operating expenses:
|
|||||||||||||||||||||||||||||||||
|
Research and development
|
776 | 727 | 664 | 683 | 681 | 559 | 581 | 582 | |||||||||||||||||||||||||
|
Sales and marketing
|
1,414 | 1,309 | 1,208 | 1,237 | 1,239 | 960 | 973 | 934 | |||||||||||||||||||||||||
|
General and administrative
|
642 | 549 | 504 | 541 | 661 | 492 | 515 | 879 | |||||||||||||||||||||||||
|
Amortization of intangibles
|
32 | 15 | 15 | 15 | 15 | 15 | 15 | 15 | |||||||||||||||||||||||||
|
Impairment charges
|
--- | --- | --- | 5,371 | --- | --- | --- | --- | |||||||||||||||||||||||||
|
Total operating expenses
|
2,864 | 2,600 | 2,391 | 7,847 | 2,596 | 2,026 | 2,084 | 2,410 | |||||||||||||||||||||||||
|
Gain on sale of assets
|
--- | --- | 450 | --- | --- | --- | --- | --- | |||||||||||||||||||||||||
|
Interest income (expense), net
|
(65 | ) | (52 | ) | (68 | ) | (40 | ) | (48 | ) | (54 | ) | (38 | ) | (106 | ) | |||||||||||||||||
|
Deferred tax expense (benefit)
|
8 | 8 | 8 | (238 | ) | --- | --- | 8 | 8 | ||||||||||||||||||||||||
|
Net income (loss)
|
$ | (712 | ) | $ | (945 | ) | $ | 49 | $ | (6,281 | ) | $ | (1,039 | ) | $ | (575 | ) | $ | (768 | ) | $ | (1,594 | ) | ||||||||||
|
Basic and diluted net income (loss) per share
|
$ | (0.22 | ) | $ | (0.27 | ) | $ | 0.01 | $ | (1.66 | ) | $ | (0.27 | ) | $ | (0.15 | ) | $ | (0.20 | ) | $ | (0.42 | ) | ||||||||||
|
|
|||||||||||||||||||||||||||||||||
We have experienced significant quarterly fluctuations in operating results, and we anticipate such fluctuations to continue in the future. We generally ship orders as received and therefore quarterly revenue and operating results depend on the volume and timing of orders received during the quarter, which are difficult to forecast. Historically, we have recognized a substantial portion of our revenue in the last month of the quarter. Operating results may also fluctuate due to factors such as the demand for our products, the size and timing of customer orders, the introduction of new products and product enhancements by us or our competitors, product mix, timing of software enhancements, manufacturing supply shortages, changes in the level of operating expenses, and competitive conditions in the industry. Because our staffing and other operating expenses are based on anticipated revenue, a substantial portion of which is not typically generated until the end of each quarter, delays in the receipt of orders can cause significant variations in operating results from quarter to quarter.
42
Liquidity and Capital Resources
During the years ended December 31, 2010, 2009, and 2008, we incurred net losses
of $4.0 million, $7.9 million, $2.8 million, respectively. As of December 31,
2010, we have an accumulated deficit of $54.8 million and a working capital
deficit of $1.6 million. These are conditions that raise substantial doubt about
our ability to continue as a going concern. These conditions include continuing
operating losses and declines in our working capital balances. Our ability to
continue as a going concern is dependent upon our ability to establish profitable
operations and to increase our capital. We have been taking steps intended to
reduce operating losses and achieve profitability including the introduction
of new products, continued close support of our distributors and of our application
partners as they establish their mobile applications in key vertical markets,
and management of our costs. We have the ability to reduce expenses further
if necessary. We believe that we will be able to improve liquidity and secure
additional sources of financing by managing our working capital balances, improving
our operating results to cash positive levels, and raising additional capital
as needed, including development funding from development partners and through
the issuance of additional equity securities. There can be no assurance that
we will be successful in achieving any of these steps, and there can be no assurance
that additional financing will be available on acceptable terms, if at all,
and any such terms may be dilutive to existing stockholders. Our inability to
secure and maintain the necessary liquidity would have a material adverse effect
on our financial condition and results of operations. If we are unable to secure
the necessary capital for our business, we may need to suspend some or all of
our current operations. The financial statements do not include any adjustments
to reflect the possible future effects on the recoverability and classification
of assets or the amounts and classification of assets and liabilities that may
result from the outcome of this uncertainty. If we can return to revenue growth
and attain profitability, we anticipate requirements for cash will include funding
of higher receivable and inventory balances, and increased expenses, including
more employees to support our growth and increases in salaries, benefits, and
related support costs for employees.
We have a history of operating losses and we may continue to be unprofitable in the foreseeable future. Historically we have financed our operations through the sale of equity securities, equipment financing, and revolving bank lines of credit. Since our inception we have raised approximately $41 million in equity capital to fund our operations.
As reflected in our Statements of Cash Flows, net cash used in operating activities was $0.6 million in 2010 compared to $0.1 million provided from operating activities in 2009, and $2.0 million used in operating activities in 2008. We calculate net cash used in operating activities by reducing our net loss ($4.0 million, $7.9 million, and $2.8 million in 2010, 2009, and 2008, respectively) by those expenses that did not require the use of cash, and reversing gains that did not generate cash. These items consist of stock based compensation expense, depreciation, amortization of intangible assets, changes in inventory reserves, deferred tax expense, and in 2010 in particular, the issuance of common stock for services and the amortization of debt discount, and in 2009 in particular, a reversal of deferred tax expense. These amounts totaled $1.5 million, $1.2 million, and $1.4 million in 2010, 2009, and 2008, respectively. Also, in 2009 our net loss includes a gain of $450,000 from the sale of our serial product line assets in September of 2009 (see "Note 8 - Sale of Product Line Assets" for more information) and goodwill impairment charges of $5.4 million. We adjusted the net loss for 2009 to exclude this gain and the impairment charges. Increases in non-cash charges in 2010 were primarily from increases in deferred tax expense, increases in inventory write-downs, and charges related to our senior convertible note financing including amortization of debt discount and common stock warrants issued for services. Partially offsetting these increases in non-cash charges in 2010 were decreases in depreciation expense due to reductions in the purchasing of equipment and tooling, and decreases in stock-based compensation expense compared to 2009. Reductions in non-cash items in 2009 were primarily from the deferred tax expense reversal related to the impairment charges on the portion of our goodwill being amortized for tax purposes and reductions in amortization expense due to components of our intangible assets becoming fully amortized, partially offset by an increase in inventory write-downs compared to 2008.
43
In addition, we report increases in assets and reductions in liabilities as uses of cash and decreases in assets and increases in liabilities as sources of cash, together referred to as changes in operating assets and liabilities. In 2010, changes in operating assets and liabilities resulted in a net source of cash of $1.9 million and were primarily from increases in accounts payable due to the timing of payments, reductions in inventory levels as a result of planned reductions from year-end levels, reductions in accounts receivable due to lower shipments in the fourth quarter of 2010 compared to the fourth quarter of 2009 resulting from a supply shortage in our mobile handheld computer from our contract manufacturer, and increases in deferred rent as a result of four months of rent abatement provided for under the terms of the amendment to our facilities lease completed in August 2010. Partially offsetting these were decreases in accrued payroll and related expenses in 2010 compared to 2009 due to lower personnel costs as a result of salary reductions, and declines in deferred income on shipments to distributors due to lower levels of inventory held by our distributors at year-end as a result of the shipping delays in the fourth quarter 2010 mentioned previously compared the same quarter one year ago. In 2009, changes in operating assets and liabilities resulted in a net source of cash of $2.0 million and were primarily from reductions in inventory due primarily to planned reductions in stocking levels of our mobile handheld computer from year-end inventory levels, reductions in accounts receivable due to lower shipments in the fourth quarter of 2009 compared to the fourth quarter of 2008, and increases in deferred service revenues, partially offset by reductions in accounts payable due to reductions in overall expenses and inventory purchases that create those payables, and reductions in deferred income on shipments to distributors due to lower stocking levels of our products in the distribution channel. Changes in operating assets and liabilities in 2008 were primarily from increased levels of inventories due to stocking higher quantities of our mobile handheld computer and increases in accounts receivable due to shipments concentrated in the last month of the fourth quarter of 2008, partially offset by increases in accounts payable due to the purchases that led to the increased levels of inventories, increases in deferred income on shipments to distributors due to increased stocking levels in the domestic distribution channel, and increases in deferred service revenue.
Cash used in investing activities was $144,000 in 2010, compared to cash provided by investing activities of $164,000 in 2009, and cash used in investing activities of $349,000 in 2008. Reductions in investing activities in 2010 compared to 2009 reflect reductions in equipment and tooling purchases due to fewer projects requiring these expenditures. In 2009, proceeds of $450,000 from the sale of our serial product line assets in September 2009 were partially offset by cash used for equipment and tooling purchases in 2009. Reductions in equipment and tooling purchases in 2009 were due to fewer development projects requiring these expenditures compared to 2008.
Cash provided from financing activities was $13,000 in 2010, compared to cash provided from financing activities of $0.9 million in 2009, and cash used in financing activities of $1.9 million in 2008. Financing activities in 2010 consisted primarily of net amounts paid of $1.0 million on our bank lines of credit through the date of termination in November 2010, offset by the proceeds from the issuance of our senior convertible note. Financing activities in 2009 consisted primarily of net proceeds of $0.9 million from the issuance of common stock and warrants. Financing activities in 2008 consisted primarily of net amounts paid of $1.6 million on our bank lines of credit and repayment of the outstanding balance of $0.4 million on our term loan in December 2008 in conjunction with entering into a new credit line agreement at that time, and payments on capital leases, partially offset by proceeds from the exercise of stock options and warrants totaling $0.2 million.
44
Our cash balances at December 31, 2010 were $1,172,000 of which $711,000 was designated as collateral and restricted from our use under the terms of our senior convertible note. Our balance sheet at December 31, 2010 has a current ratio (current assets divided by current liabilities) of 0.70 to 1.0, and a working capital deficit of $1,617,000 (current assets less current liabilities). In February 2011 we issued $500,000 in Common Stock to our primary contract manufacturer in exchange for an equal reduction in our trade payables balance.
Our contractual obligations at December 31, 2010 are outlined in the table shown below:
| Payments Due by Period | ||||||||||||||||||||||||
|
Contractual
Obligations
|
Total | Less than 1 year | 1 to 3 years | 4 to 5 years | More than 5 years | |||||||||||||||||||
|
Capital leases
|
$ | 32,000 | $ | 13,000 | $ | 19,000 | $ | --- | $ | --- | ||||||||||||||
|
Operating
leases
|
2,934,000 | 379,000 | 732,000 | 772,000 | 1,051,000 | |||||||||||||||||||
|
Senior convertible note (including interest)
|
1,139,000 | 100,000 | 1,039,000 | --- | --- | |||||||||||||||||||
|
Unconditional purchase obligations with contract manufacturers
|
3,249,000 | 3,249,000 | --- | --- | --- | |||||||||||||||||||
|
Total contractual obligations
|
$ | 7,354,000 | $ | 3,741,000 | $ | 1,790,000 | $ | 772,000 | $ | 1,051,000 | ||||||||||||||
Off-Balance Sheet Arrangements
As of December 31, 2010, we had no off-balance sheet arrangements as defined in Item 303 of Regulation S-K.
Recent Accounting Pronouncements
See Note 1 of "Notes to Financial Statements" of this Annual Report
for additional information regarding the status of recent accounting pronouncements.
45
Item 7A. Quantitative and Qualitative Disclosures About Market Risk
Interest Rate Risk
Our exposure to market risk for changes in interest rates relates primarily
to invested cash and our bank credit line facilities. Our cash is invested in
short-term money market investments backed by U.S. Treasury notes and other
investments that mature within one year and whose principal is not subject to
market rate fluctuations. Accordingly, interest rate declines would adversely
affect our interest income but would not affect the carrying value of our cash
investments. Based on a sensitivity analysis of our cash investments during
the quarter ended December 31, 2010, a decline of 1% in interest rates would
not have had a material effect on our quarterly interest income.
On November 2, 2010, we terminated our bank credit line facility in conjunction with the issuance of a senior convertible note in the note financing subsequently closed on November 19, 2010 (see "Note 4 - Bank Financing Arrangements" and "Note 2 - Senior Convertible Note Financing" for more information). There is no interest rate risk from our credit line facility beyond the termination date.
Foreign Currency Risk
A substantial majority of our revenue, expense and purchasing activities are transacted in U.S. dollars. However, we require our European distributors to purchase our products in Euros, we pay the expenses of our European employees in Euros and British pounds, and we may enter into selected future purchase commitments with foreign suppliers that may be paid in the local currency of the supplier. We hedge a significant portion of our European receivables balance denominated in Euros to reduce the foreign currency risk associated with these assets, and we have not been subject to significant losses from material foreign currency fluctuations. Based on a sensitivity analysis of our net foreign currency denominated assets and expenses at the beginning, during and at the end of the quarter ended December 31, 2010, an adverse change of 10% in exchange rates would have resulted in an increase in our net loss for the fourth quarter 2010 of approximately $18,000, if left unprotected. For the fourth quarter of 2010 the total net adjustment for the effects of changes in foreign currency on cash balances, collections, payables, and derivatives was a net gain of $1,000. We will continue to monitor, assess, and mitigate through hedging activities, the risk associated with these exposures.
Item 8. Financial Statements and Supplementary Data
The supplementary information required by this item is included in Item 7, "Management's Discussion and Analysis of Financial Condition and Results of Operations."
46
REPORT OF INDEPENDENT REGISTERED
PUBLIC ACCOUNTING FIRM
The Board of Directors and Stockholders
Socket Mobile, Inc.
We have audited the accompanying balance sheets of Socket Mobile, Inc. as of December 31, 2010 and 2009, and the related statements of operations, stockholders' equity, and cash flows for each of the years in the three year period ended December 31, 2010. Socket Mobile, Inc.'s management is responsible for these financial statements. Our responsibility is to express an opinion on these financial statements based on our audits.
We conducted our audits in accordance with the standards of the Public Company Accounting Oversight Board (United States). Those standards require that we plan and perform the audits to obtain reasonable assurance about whether the financial statements are free of material misstatement. The Company is not required to have, nor were we engaged to perform, an audit of its internal control over financial reporting. Our audit included consideration of internal control over financial reporting as a basis for designing audit procedures that are appropriate in the circumstances, but not for the purpose of expressing an opinion on the effectiveness of the Company's internal control over financial reporting. Accordingly, we express no such opinion. An audit includes examining, on a test basis, evidence supporting the amounts and disclosures in the financial statements. An audit also includes assessing the accounting principles used and significant estimates made by management, as well as evaluating the overall financial statement presentation. We believe that our audits provide a reasonable basis for our opinion.
In our opinion, the financial statements referred to above present fairly, in all material respects, the financial position of Socket Mobile, Inc. as of December 31, 2010 and 2009, and the results of its operations and its cash flows for each of the years in the three year period ended December 31, 2010, in conformity with accounting principles generally accepted in the United States of America.
The accompanying financial statements have been prepared assuming that the
Company will continue as a going concern. As discussed in Note 1 to the financial
statements, certain conditions raise substantial doubt about its ability to
continue as a going concern. Management's plans regarding these matters are
also described in Note 1. The accompanying financial statements do not include
any adjustments that might result from the outcome of this uncertainty.
/s/ Moss Adams LLP
Santa Clara, California
March 15, 2011
47
| December 31, | |||||||||
| 2010 | 2009 | ||||||||
| ASSETS | |||||||||
| Current assets: | |||||||||
|
Cash
and cash equivalents
|
$ | 460,833 | $ | 1,940,295 | |||||
|
Restricted
cash
|
710,797 | --- | |||||||
|
Accounts
receivable, net
|
813,569 | 1,659,383 | |||||||
|
Inventories
|
1,698,650 | 2,044,119 | |||||||
|
Prepaid
expenses and other current assets
|
128,131 | 415,102 | |||||||
|
Total current assets
|
3,811,980 | 6,058,899 | |||||||
| Property and equipment: | |||||||||
|
Machinery
and office equipment
|
2,140,897 | 2,165,775 | |||||||
|
Computer
equipment
|
1,285,197 | 1,253,511 | |||||||
|
|
3,426,094 | 3,419,286 | |||||||
|
Accumulated
depreciation
|
(2,954,757 |
)
|
(2,631,822 |
)
|
|||||
|
Property and equipment, net
|
471,337 | 787,464 | |||||||
| Intangible assets, net | 210,000 | 270,000 | |||||||
| Goodwill | 4,427,000 | 4,427,000 | |||||||
| Other assets | 146,298 | 199,834 | |||||||
|
Total assets
|
$ | 9,066,615 | $ | 11,743,197 | |||||
| LIABILITIES AND STOCKHOLDERS’ EQUITY | |||||||||
| Current liabilities: | |||||||||
|
Accounts
payable
|
$ | 3,683,771 | $ | 2,815,740 | |||||
|
Accrued
expenses
|
86,554 | 86,554 | |||||||
|
Accrued
payroll and related expenses
|
634,146 | 806,750 | |||||||
|
Bank
line of credit
|
--- | 1,002,088 | |||||||
|
Deferred
income on shipments to distributors
|
673,484 | 917,756 | |||||||
|
Short
term portion of deferred service revenue
|
324,267 | 304,193 | |||||||
|
Short
term portion of capital leases and deferred rent
|
27,080 | 42,491 | |||||||
|
Total
current liabilities
|
5,429,302 | 5,975,572 | |||||||
| Long term portion of deferred service revenue | 197,044 | 282,840 | |||||||
| Long term portion of capital leases and deferred rent | 202,072 | 96,785 | |||||||
| Senior convertible note payable, net of debt discount of $670,447 at December 31, 2010 | 329,553 | --- | |||||||
| Deferred income taxes | 15,515 | --- | |||||||
|
Total
liabilities
|
6,173,486 | 6,355,197 | |||||||
| Commitments and contingencies | |||||||||
| Stockholders' equity: | |||||||||
|
Common
stock, $0.001 par value: Authorized shares—10,000,000,
Issued and outstanding shares - 3,801,991 at December 31, 2010 and 3,788,767 at December 31, 2009 |
3,802 | 3,789 | |||||||
|
Additional
paid-in capital
|
57,671,065 | 56,190,112 | |||||||
|
Accumulated
deficit
|
(54,781,738 |
)
|
(50,805,901 |
)
|
|||||
|
Total
stockholders’ equity
|
2,893,129 | 5,388,000 | |||||||
| Total liabilities and stockholders’ equity | $ | 9,066,615 | $ | 11,743,197 | |||||
See accompanying notes.
48
| Years Ended December 31, | ||||||||||||||
| 2010 | 2009 | 2008 | ||||||||||||
|
Revenues
|
$ | 13,498,196 | $ | 17,126,630 | $ | 26,557,048 | ||||||||
|
Cost of revenues
|
8,096,520 | 9,753,006 | 14,167,085 | |||||||||||
|
Gross profit
|
5,401,676 | 7,373,624 | 12,389,963 | |||||||||||
|
Operating expenses:
|
||||||||||||||
|
Research
and development
|
2,403,268 | 2,850,167 | 4,496,070 | |||||||||||
|
Sales
and marketing
|
4,106,260 | 5,167,783 | 7,777,217 | |||||||||||
|
General
and administrative
|
2,546,648 | 2,236,306 | 2,673,320 | |||||||||||
|
Amortization
of intangible assets
|
60,000 | 76,787 | 127,147 | |||||||||||
|
Impairment
charges
|
--- | 5,370,946 | --- | |||||||||||
|
Total operating expenses
|
9,116,176 | 15,701,989 | 15,073,754 | |||||||||||
|
|
||||||||||||||
|
Operating loss
|
(3,714,500 | ) | (8,328,365 | ) | (2,683,791 | ) | ||||||||
|
|
||||||||||||||
|
Interest income
|
106 | 455 | 22,253 | |||||||||||
|
Interest expense
|
(245,928 | ) | (225,155 | ) | (71,126 | ) | ||||||||
|
Gain on sale of product line assets
|
--- |
|
450,000 |
|
--- |
|
||||||||
|
|
||||||||||||||
|
Net loss before deferred taxes
|
(3,960,322 | ) | (8,103,065 | ) | (2,732,664 | ) | ||||||||
|
Deferred tax (expense) benefit
|
(15,515 | ) | 214,261 | (31,939 | ) | |||||||||
|
Net loss
|
$ | (3,975,837 | ) | $ | (7,888,804 | ) | $ | (2,764,603 | ) | |||||
|
|
||||||||||||||
|
Net loss per common share:
|
||||||||||||||
|
Basic
and diluted
|
$ | (1.05 | ) | $ | (2.21 | ) | $ | (0.86 | ) | |||||
|
Weighted average shares outstanding:
|
||||||||||||||
|
Basic
and diluted
|
3,795,673 | 3,562,080 | 3,218,535 | |||||||||||
See accompanying notes.
49
SOCKET MOBILE,
INC.
STATEMENTS OF STOCKHOLDERS' EQUITY
|
Additional
|
Total
|
|||||||||||||||||||
|
Common
Stock
|
Paid-In
|
Accumulated
|
Stockholders'
|
|||||||||||||||||
|
Shares
|
Amount
|
Capital
|
Deficit
|
Equity
|
||||||||||||||||
|
Balance
at December 31, 2007
|
3,198,962 | $ | 3,199 | $ | 53,683,274 | $ | (40,152,494 | ) | $ | 13,533,979 | ||||||||||
|
Warrant
extension
|
--- | --- | 16,851 | --- | 16,851 | |||||||||||||||
|
Exercise
of warrants
|
22,485 | 22 | 135,470 | --- | 135,492 | |||||||||||||||
|
Exercise
of stock options
|
8,469 | 9 | 54,612 | --- | 54,621 | |||||||||||||||
|
Stock-based
compensation
|
--- | --- | 697,985 | 697,985 | ||||||||||||||||
|
Net
loss and comprehensive loss
|
--- | --- | --- |
|
(2,764,603 |
)
|
(2,764,603 |
)
|
||||||||||||
|
Balance
at December 31, 2008
|
3,229,916 | 3,230 | 54,588,192 | (42,917,097 | ) | 11,674,325 | ||||||||||||||
|
Issuance
of common stock and warrants
|
556,786 | 557 | 884,171 | --- | 884,728 | |||||||||||||||
|
Exercise
of warrants
|
705 | 1 | (1 | ) | --- | --- | ||||||||||||||
|
Exercise
of stock options
|
1,360 | 1 | 2,664 | --- | 2,665 | |||||||||||||||
|
Stock-based
compensation
|
--- | --- | 715,086 | --- | 715,086 | |||||||||||||||
|
Net
loss and comprehensive loss
|
--- | --- | --- |
|
(7,888,804 |
)
|
(7,888,804 |
)
|
||||||||||||
|
Balance
at December 31, 2009
|
3,788,767 | 3,789 | 56,190,112 | (50,805,901 | ) | 5,388,000 | ||||||||||||||
|
Exercise
of warrants
|
273 | --- | --- | --- | --- | |||||||||||||||
|
Exercise
of stock options
|
12,951 | 13 | 27,803 | --- | 27,816 | |||||||||||||||
|
Stock-based
compensation
|
--- | --- | 676,554 | --- | 676,554 | |||||||||||||||
|
Issuance
of warrants in conjunction with senior convertible note financing
|
--- | --- | 386,048 | --- | 386,048 | |||||||||||||||
|
Beneficial
conversion feature associated with senior convertible note financing
|
--- | --- | 390,548 | --- | 390,548 | |||||||||||||||
|
Net
loss and comprehensive loss
|
--- | --- | --- |
|
(3,975,837 |
)
|
(3,975,837 |
)
|
||||||||||||
|
Balance
at December 31, 2010
|
3,801,991 | $ | 3,802 | $ | 57,671,065 | $ | (54,781,738 | ) | $ | 2,893,129 | ||||||||||
See accompanying notes.
50
SOCKET MOBILE,
INC.
STATEMENTS OF CASH FLOWS
|
Years
Ended December 31,
|
|||||||||||||||
|
2010
|
2009
|
2008
|
|||||||||||||
|
Operating
activities
|
|||||||||||||||
|
Net loss
|
$ | (3,975,837 | ) | $ | (7,888,804 | ) | $ | (2,764,603 | ) | ||||||
|
Adjustments to reconcile net loss to net cash provided by (used in) operating
activities:
|
|||||||||||||||
|
Stock-based
compensation and warrant extension
|
676,554 | 715,086 | 714,836 | ||||||||||||
|
Depreciation
|
459,686 | 503,983 | 516,050 | ||||||||||||
|
Amortization
of intangible assets
|
60,000 | 76,787 | 127,147 | ||||||||||||
|
Issuance
of common stock warrant for services
|
50,500 | --- | --- | ||||||||||||
|
Amortization
of debt discount to interest expense
|
55,649 | --- | --- | ||||||||||||
|
Deferred
tax expense (benefit)
|
15,515 | (214,261 | ) | 31,939 | |||||||||||
|
Increase
in inventory write-downs
|
163,847 | 70,106 | 47,518 | ||||||||||||
|
Gain
on sale of product line assets
|
--- | (450,000 | ) | --- | |||||||||||
|
Impairment
charges
|
--- | 5,370,946 | --- | ||||||||||||
|
Changes
in operating assets and liabilities:
|
|||||||||||||||
|
Accounts
receivable
|
845,814 | 1,675,278 | (719,789 | ) | |||||||||||
|
Inventories
|
181,622 | 1,815,597 | (1,539,307 | ) | |||||||||||
|
Prepaid
expenses and other current assets
|
340,507 | (1,841 | ) | (71,784 | ) | ||||||||||
|
Accounts
payable and accrued expenses
|
868,031 | (611,476 | ) | 1,088,979 | |||||||||||
|
Accrued
payroll and related expenses
|
(172,604 | ) | 32,316 | (82,128 | ) | ||||||||||
|
Deferred
income on shipments to distributors
|
(244,272 | ) | (1,083,985 | ) | 343,638 | ||||||||||
|
Deferred
service revenue
|
(65,722 | ) | 154,381 | 346,195 | |||||||||||
|
Change
in deferred rent
|
102,189 |
|
(17,777 |
)
|
(5,895 |
)
|
|||||||||
|
Net cash provided by (used in) operating activities
|
(638,521 | ) | 146,336 | (1,967,204 | ) | ||||||||||
|
Investing
activities
|
|||||||||||||||
|
Purchase
of equipment and tooling
|
(143,559 | ) | (285,668 | ) | (348,657 | ) | |||||||||
|
Proceeds from sale of product line assets
|
--- |
|
450,000 |
|
--- |
|
|||||||||
|
Net cash provided by (used in) investing activities
|
(143,559 | ) | 164,332 | (348,657 | ) | ||||||||||
|
|
|||||||||||||||
|
Financing
activities
|
|||||||||||||||
|
Payments on capital leases and equipment financing notes
|
(12,313 | ) | (11,405 | ) | (37,069 | ) | |||||||||
|
Gross proceeds from borrowings under bank line of credit agreement
|
5,609,560 | 8,684,054 | 9,847,786 | ||||||||||||
|
Gross repayments of borrowings under bank line of credit agreement
|
(6,611,648 | ) | (8,687,757 | ) | (11,464,004 | ) | |||||||||
|
Proceeds from stock options exercised
|
27,816 | 2,665 | 54,620 | ||||||||||||
|
Proceeds from warrants exercised
|
--- | --- | 135,493 | ||||||||||||
|
Proceeds from the issuance of common stock and warrants
|
--- | 884,728 | --- | ||||||||||||
|
Proceeds from issuance of senior convertible note and warrants
|
1,000,000 | --- | --- | ||||||||||||
|
Repayments of bank term loan
|
--- | --- | (426,982 |
)
|
|||||||||||
|
Net cash provided by (used in) financing activities
|
13,415 | 872,285 | (1,890,156 | ) | |||||||||||
|
|
|||||||||||||||
|
Net
increase (decrease) in cash and cash equivalents
|
(768,665 | ) | 1,182,953 | (4,206,017 | ) | ||||||||||
|
Cash
and cash equivalents at beginning of year
|
1,940,295 | 757,342 | 4,963,359 | ||||||||||||
|
Cash
and cash equivalents at end of year
|
$ | 1,171,630 | $ | 1,940,295 | $ | 757,342 | |||||||||
|
|
|||||||||||||||
|
Supplemental
cash flow information
|
|||||||||||||||
|
Cash paid for interest
|
$ | 190,278 | $ | 225,132 | $ | 74,678 | |||||||||
|
Warrants issued in conjunction with common stock financing
|
$ | --- | $ | 107,034 | $ | --- | |||||||||
|
Non-cash investing and financing activities:
|
|||||||||||||||
|
Warrants issued in conjunction with senior convertible note
|
$ | 335,548 | $ | --- | $ | --- | |||||||||
|
Beneficial conversion feature associated with senior convertible
note
|
$ | 390,548 | $ | --- | $ | --- | |||||||||
|
Addition of equipment under capital lease
|
$ | --- | $ | 28,715 | $ | --- | |||||||||
See accompanying notes.
51
SOCKET MOBILE,
INC.
NOTES TO FINANCIAL STATEMENTS
NOTE 1 - Summary of Significant Accounting Policies
Organization and Business
Socket Mobile, Inc. (the "Company"), produces mobile handheld computers
and data collection products serving the business mobility market. The Company
offers a family of handheld computer products designed for business enterprise
use and a wide range of data collection products including two dimensional (2D)
and linear (1D) bar code scanners, Radio Frequency Identification (RFID) readers,
and magnetic stripe readers. The Company also offers wearable ring scanners,
customized versions of our handheld computers, and embedded Bluetooth and wireless
LAN cards and modules as OEM products to third party companies. The Company's
data collection products work with the Company's handheld computers and the
Company's cordless hand scanners work with many third-party mobile handheld
devices including smartphones, tablet computers, ultra-mobile personal computers
(UMPCs), notebooks and desktop systems, adding data collection capabilities
to these devices. For a complete description of the Company's products see "Products"
in "Item 1. Business." The Company works closely with software application
developers offering or developing vertical software applications for use with
the Company's handheld computers and for use with smartphones, including phones
running Apple, Google's Android, RIM BlackBerry and Microsoft Windows operating
systems for use with the Company's cordless hand scanners. Healthcare and hospitality
are two of the primary areas of focus for software application developers who
have developed applications for use on the Company's handheld computers, and
a significant portion of the Company's handheld computer sales now come from
organizations within these two market segments. Other vertical markets benefiting
from mobile solutions include retail merchandising, automotive, government and
education. The Company subcontracts the manufacturing of all of its products
to independent third-party contract manufacturers who are located in the U.S.,
China and Taiwan and who have the equipment, know-how and capacity to manufacture
products to the Company's specifications. The Company's mobile handheld computers
and data collection products are sold through a worldwide network of distributors
and resellers, vertical industry partners, and VARs. The Company's OEM products
are sold directly to the other equipment manufacturers. The geographic regions
served by the Company include the Americas, Europe, the Middle East, Africa
and Asia Pacific. The Company's total employee headcount on December 31, 2010
was 64 people.
The Company was founded in March 1992 as Socket Communications, Inc. and reincorporated in Delaware in 1995 prior to the Company's initial public offering in June 1995. The Company began doing business as Socket Mobile, Inc. in January 2007 to better reflect its market focus on the mobile business market, and changed its legal name to Socket Mobile, Inc. in April 2008. The Company's Common Stock trades on the NASDAQ Capital Market under the symbol "SCKT." The Company's principal executive offices are located at 39700 Eureka Drive, Newark, CA 94560.
Liquidity and Going Concern
The Company's financial statements have been prepared on a going concern basis.
During the years ended December 31, 2010, 2009, and 2008, the Company incurred
net losses of $4.0 million, $7.9 million, and $2.8 million, respectively. As
of December 31, 2010, the Company has an accumulated deficit of $54.8 million
and a working capital deficit of $1.6 million. The Company's cash balances at
December 31, 2010 were $1,172,000 of which $711,000 was designated as restricted
collateral under the terms of our senior convertible note. The Company's cash
balances at December 31, 2010, reflect net cash used in operating activities
in 2010 of $638,000, net payments of $1,002,000 on its bank lines of credit
as a result of terminating the lines in November 2010 in conjunction with the
issuance of the Company's $1.0 million senior convertible note in the same month.
The Company's balance sheet at December 31, 2010 has a current ratio (current
assets divided by current liabilities) of 0.70 to 1.0, and a working capital
deficit of $1,617,000 (current assets less current liabilities). These circumstances
raise substantial doubt about the Company's ability to continue as a going concern.
52
SOCKET MOBILE,
INC.
NOTES TO FINANCIAL STATEMENTS (Continued)
The Company took actions beginning in the fourth quarter of 2008 to reduce its expenses, including a reduction of 12% in its worldwide workforce, to align its cost structure with economic conditions in response to the slow-down in business spending resulting from the economic downturn beginning in late 2008. The Company took additional actions during 2009 to reduce expenses, and the Company reduced expenses further in 2010. The Company has the ability to further reduce expenses if necessary. Additional steps by management intended to reduce operating losses and achieve profitability include the introduction of new products, continued close support of the Company's distributors and its application partners as they establish their mobile applications in key vertical markets. In February 2011 the Company issued $500,000 in Common Stock to its primary contract manufacturer in exchange for an equal reduction in the Company's trade payables balance (see "NOTE 15 - Subsequent Event: Common Stock Financing" for more information). Management believes that it will be able to further improve the Company's liquidity and secure additional sources of financing by managing its working capital balances, and raising additional capital as needed including development funding from development partners and the issuance of additional equity securities. If the Company can return to revenue growth and attain profitability, the Company anticipates requirements for cash will include funding of higher receivable and inventory balances, and increased expenses, including an increase of costs relating to new employees to support our growth and increases in salaries, benefits, and related support costs for employees. If the Company cannot attain profitability, the Company will not be able to support its operations from positive cash flows, and the Company would use its existing cash to support operating losses. The Company may also find it necessary to raise additional capital to fund its operations, however, there can be no assurance that additional capital will be available on acceptable terms, if at all, and any such terms may be dilutive to existing stockholders. If the Company is unable to secure the necessary capital for its business, the Company may need to suspend some or all of its current operations.
The accompanying financial statements have been prepared assuming that the Company will continue as a going concern, which contemplates the realization of assets and the settlement of liabilities and commitments in the normal course of business. These financial statements do not include any adjustments to reflect the possible future effects on the recoverability and classification of assets or the amounts and classification of liabilities that may result from uncertainty related to the Company's ability to continue as a going concern.
Use of Estimates
The preparation of financial statements in conformity with U.S. generally accepted
accounting principles requires management to make estimates and assumptions
that affect the reported amounts of assets and liabilities, and the disclosure
of contingent assets and liabilities at the date of the financial statements
as well as the reported amounts of revenue and expense during the reporting
period. Actual results could differ from those estimates, and such differences
may be material to the financial statements.
53
SOCKET MOBILE,
INC.
NOTES TO FINANCIAL STATEMENTS (Continued)
Cash Equivalents
The Company considers all highly liquid investments purchased with a maturity
date of 90 days or less at date of purchase to be cash equivalents. As of December
31, 2010 and 2009, all of the Company's cash and cash equivalents consisted
of amounts held in demand and money market deposits in banks.
Restricted Cash
At December 31, 2010 all of the Company's restricted cash consisted of amounts
held in demand deposits in banks under the terms of our senior convertible note
issued in November 2010. Under the terms of the note the Company is required
at all times to maintain collateralization of the convertible note with an amount
equivalent to the unconverted principal plus accrued interest. Collateral consists
of qualified accounts receivables of the Company, plus cash to the extent qualified
accounts receivables are less than the unconverted principal plus accrued interest
(see "NOTE 2 - Senior Convertible Note Financing" for more information).
Fair Value of Financial Instruments
The carrying value of the Company's cash and cash equivalents, accounts receivable,
accounts payable, debt and foreign exchange contracts approximate fair value
due to the relatively short period of time to maturity.
Fair Value Measurements
The Company's estimates of fair value for assets and liabilities is based on
a framework that establishes a hierarchy of the inputs used in valuation and
gives the highest priority to quoted prices in active markets and requires that
observable inputs be used in the valuations when available. The disclosure of
fair value estimates is based on whether the significant inputs into the valuation
are observable. In determining the level of the hierarchy in which the estimate
is disclosed, the highest priority is given to unadjusted quoted prices in active
markets and the lowest priority to unobservable inputs that reflect our significant
market assumptions. The three levels of the hierarchy are as follows:
| Level 1: | Unadjusted quoted market prices for identical assets or liabilities in active markets that we have the ability to access. |
| Level 2: | Quoted prices for similar assets or liabilities in active markets; quoted prices for identical or similar assets in inactive markets; or valuations based on models where the significant inputs are observable (e.g., interest rates, yield curves, default rates, etc.) or can be corroborated by observable market data. |
| Level 3: | Valuations based on models where significant inputs are not observable. The unobservable inputs reflect our assumptions about the assumptions that market participants would use. |
There were no significant fair value measurements for the year ended December 31, 2010. The significant fair value measurements for the year ended December 31, 2009 were on a nonrecurring basis and related to the Company's goodwill impairment assessment as described below under "Goodwill and Other Intangible Assets Review." The Company performed an impairment test of its goodwill as of December 31, 2009 using Level 3 inputs and recorded estimated goodwill impairment charges of $5.4 million as of December 31, 2009.
54
SOCKET MOBILE,
INC.
NOTES TO FINANCIAL STATEMENTS (Continued)
Derivative Financial Instruments
The Company's primary objective for holding derivative financial instruments
is to manage foreign currency risks. The Company's derivative financial instruments
are recorded at fair value and are included in other current assets, other assets,
other accrued liabilities or long-term debt depending on the contractual maturity
and whether the Company has a gain or loss. The Company's accounting policies
for these instruments are based on whether they meet the Company's criteria
for designation as hedging transactions, either as cash flow or fair value hedges.
A hedge of the exposure to variability in the cash flows of an asset or a liability,
or of a forecasted transaction, is referred to as a cash flow hedge. A hedge
of the exposure to changes in fair value of an asset or a liability, or of an
unrecognized firm commitment, is referred to as a fair value hedge. The criteria
for designating a derivative as a hedge include the instrument's effectiveness
in risk reduction and, in most cases, a one-to-one matching of the derivative
instrument to its underlying transaction. Gains and losses on derivatives that
are not designated as hedges for accounting purposes are recognized currently
in earnings. The Company regularly enters into forward foreign currency contracts
to reduce exposures related to rate changes in certain foreign currencies. The
Company's forward foreign currency contracts are recorded at fair value at December
31, 2010. At December 31, 2010, these derivative instruments were not designated
as hedges, and accordingly, changes in the fair value of the forward foreign
currency contracts were recorded in earnings. At December 31, 2010, contracts
with a notional amount of $132,900 to hedge Euros had a fair value of an immaterial
amount based on quotations from financial institutions, and had maturity dates
in January 2010. At December 31, 2009, contracts with a notional amount of $721,500
to hedge Euros were recorded as an asset with a fair value of $5,175 based on
quotations from financial institutions, and had maturity dates in January 2009.
Comprehensive Income (Loss)
Comprehensive income (loss) consists of two components-net income (loss) and
other comprehensive income (loss). Other comprehensive income (loss) refers
to gains and losses that under U.S. generally accepted accounting principles
are recorded as an element of stockholders' equity but are excluded from net
income. As of December 31, 2010 and 2009, the Company had no material other
comprehensive income (loss).
Accounts Receivable Allowances
The Company estimates the amount of uncollectible accounts receivable at the
end of each reporting period based on the aging of the receivable balance, current
and historical customer trends, and communications with its customers. Amounts
are written off only after considerable collection efforts have been made and
the amounts are determined to be uncollectible. The following describes activity
in the allowance for doubtful accounts for the years ended December 31, 2010,
2009, and 2008:
|
Balance
at
|
|
|
Charged
to
|
|
|
|
|
Balance
at
|
|||||||
|
Beginning
of
|
|
|
Costs
and
|
|
|
Amounts
|
|
|
End
of
|
||||||
|
Year
|
Year
|
|
|
Expenses
|
|
|
Written
Off
|
|
|
Year
|
|||||
|
2010
|
$ | 121,713 | $ | --- | $ | 32,655 | $ | 89,058 | |||||||
|
2009
|
$ | 118,651 | $ | 3,062 | $ | --- | $ | 121,713 | |||||||
|
2008
|
$ | 118,651 | $ | --- | $ | --- | $ | 118,651 | |||||||
55
SOCKET MOBILE,
INC.
NOTES TO FINANCIAL STATEMENTS (Continued)
Inventories
Inventories consist principally of raw materials and sub-assemblies stated at
the lower of standard cost, which approximates actual costs (first-in, first-out
method), or market. Market is defined as replacement cost, but not in excess
of estimated net realizable value or less than estimated net realizable value
less a normal margin. At the end of each reporting period, the Company compares
its inventory on hand to its forecasted requirements for the next nine month
period and the Company writes-off the cost of any inventory that is surplus,
less any amounts that the Company believes it can recover from the disposal
of goods that it specifically believes will be saleable past a nine month horizon.
The Company's sales forecasts are based upon historical trends, communications
from customers, and marketing data regarding market trends and dynamics. Changes
in the amounts recorded for surplus or obsolete inventory are included in cost
of revenue. Inventory components at year-end, net of write-downs, are presented
in the following table:
| December 31, | |||||||
| 2010 | 2009 | ||||||
|
Raw materials and sub-assemblies
|
$ | 1,608,469 | $ | 1,939,416 | |||
|
Finished
goods
|
90,181 | 104,703 | |||||
|
|
$ | 1,698,650 | $ | 2,044,119 | |||
Property and Equipment
Property and equipment are stated at cost. Depreciation and amortization are
computed using the straight-line method, over the estimated useful lives of
the assets ranging from one to five years. Assets under capital leases are amortized
in a manner consistent with the Company's normal depreciation policy for owned
assets, or the remaining lease term if applicable.
Goodwill
Goodwill is tested for impairment annually at September 30th or more frequently
when events or circumstances indicate that the carrying value of the Company's
single reporting unit more likely than not exceeds its fair value. Accordingly,
the Company also tested goodwill for impairment as of December 31, 2010. No
impairment of goodwill was recorded in 2010.
Subsequent to the annual impairment test at September 30, 2009, indicators of impairment existed which resulted in the Company performing additional impairment testing with the assistance of a third party valuation specialist as of December 31, 2010. The Company used the two step test as required to assess goodwill for impairment. The first step of the goodwill impairment test consisted of comparing the carrying value of the reporting unit to its fair value. Management estimated the fair value of the Company using various methods and compared the fair value to the carrying amount (net book value) to ascertain if potential goodwill impairment existed. The Company utilized methods that focused on its ability to produce income ("Income Approach") and the estimated consideration it would receive if there were a sale of the Company ("Market Approach"). Key assumptions utilized in the determination of fair value in step one of the test included the following: the Company's market capitalization; market multiples of comparable companies within its industry; revenue and expense forecasts used in the evaluation were based on trends of historical performance and management's estimate of future performance; cash flows utilized in the discounted cash flow analysis were estimated using a weighted average cost of capital determined to be appropriate for the Company.
56
SOCKET MOBILE,
INC.
NOTES TO FINANCIAL STATEMENTS (Continued)
Based on the fair value estimated in step one, the Company determined a step one failure occurred which indicated a goodwill impairment may exist. The Company performed a step two analyses which included estimating the fair value of its assets and liabilities, including previously unrecognized intangible assets. The Income Approach was utilized to value the Company's identified intangible assets, including developed technology, trade name, patents, and internally developed software. As a result of a preliminary step two test, the estimated fair value of the Company's goodwill was $4,427,000 which exceeded the carrying value by $5,370,946. As a result, the Company recorded an estimated $5,370,946 goodwill impairment as of December 31, 2009. In the quarter ended March 31, 2010, the Company finalized the impairment analysis without adjustment to the estimated impairment recorded at December 31, 2009.
Concentration of Credit Risk
Financial instruments that potentially subject the Company to significant concentrations
of credit risk consist principally of cash, cash equivalents and accounts receivable.
The Company invests its cash in demand and money market deposit accounts in
banks. To the extent of the amounts recorded on the balance sheet, cash is concentrated
at the Company's bank to the extent needed to comply with the minimum cash balance
covenant of the bank line agreement. This exposure from an event of default
by the bank is offset in part by amounts drawn against the bank line. To date,
the Company has not experienced losses on these investments. The Company's trade
accounts receivables are primarily with distributors and OEMs. The Company performs
ongoing credit evaluations of its customers' financial conditions but the Company
generally requires no collateral. Reserves are maintained for potential credit
losses, and such losses have been within management's expectations. At December
31, 2010, there were five customers with material amounts outstanding totaling
62% of the Company's accounts receivable balances. At December 31, 2009, there
were two customers with material amounts outstanding totaling 31% of the Company's
accounts receivable balances.
Concentration of Suppliers
Several of the Company's component parts are produced by a sole or limited number
of suppliers. Shortages could occur in these essential materials due to an interruption
of supply or increased demand in the industry, such as the Company experienced
in the fourth quarter 2010 with the delays in availability of LCD touch screens
used in the manufacture of the Company's mobile handheld computer. If the Company
were unable to procure certain of such materials, it would be required to reduce
its operations, which could have a material adverse effect upon its results.
At December 31, 2010 and 2009, 32% and 33%, respectively, of the Company's accounts
payable balances were concentrated in a single supplier. For the years ended
December 31, 2010 and 2009, two suppliers accounted for 63% of the inventory
purchases in each of these years.
Revenue Recognition and Deferred Income
Revenue on sales to customers other than distributors is recognized upon shipment
provided that persuasive evidence of a sales arrangement exists, the price is
fixed or determinable, title has transferred, collection of resulting receivables
is reasonably assured, there are no customer acceptance requirements, and there
are no remaining significant obligations. Revenue on sales to distributors where
a right of return exists is recognized upon "sell-through," when products
are shipped from the distributor to the distributor's customer. Revenue related
to those products in our distribution channel at the end of each reporting period
which has not sold-through is deferred. The amount of deferred revenue net of
related cost of revenue is classified as deferred income on shipments to distributors
on the Company's balance sheet. At December 31, 2010 and 2009, deferred income
on shipments to distributors represented deferred revenues totaling $1,400,155
and $1,805,648, respectively, net of related costs of those revenues of $726,671
and $887,892, respectively.
57
SOCKET MOBILE,
INC.
NOTES TO FINANCIAL STATEMENTS (Continued)
The Company also earns revenue from its SocketCare Extended Warranty service program which offers extended warranty coverage of up to three years in duration on select products. Revenues from the SocketCare Extended Warranty service program are recognized ratably over the life of the extended warranty contract. The amount of unrecognized warranty service revenue is classified as deferred service revenue and presented on the Company's balance sheet in its short and long term components. The Company also earns revenue from services performed in connection with consulting arrangements. For those contracts that include contract milestones or acceptance criteria the Company recognizes revenue as such milestones are achieved or as such acceptance occurs. In some instances the acceptance criteria in the contract requires acceptance after all services are complete and all other elements have been delivered. Revenue recognition is deferred until those requirements are met. Revenues related to these services in the years presented were not material.
Research and Development
Research and development expenditures are charged to operations as incurred.
The accounting for the costs of computer software to be sold, leased or otherwise
marketed, requires the capitalization of certain software development costs
subsequent to the establishment of technological feasibility. Based on the Company's
product development process, technological feasibility is established upon the
completion of a working model. Costs incurred by the Company between the completion
of the working model and the point at which the product is ready for general
release have been insignificant. Accordingly, the Company has charged all such
costs to research and development expenses in the accompanying statements of
operations.
Advertising Costs
Advertising costs are charged to sales and marketing as incurred. The Company
incurred $188,600, $426,923, and $491,595, in advertising costs during 2010,
2009, and 2008, respectively.
Income Taxes
Deferred tax assets and liabilities are determined based on differences between
financial reporting and tax bases of assets and liabilities and are measured
using enacted tax rates and laws that will be in effect when the differences
are expected to reverse. The Company records a valuation allowance against deferred
tax assets when it is more likely than not that such assets will not be realized.
Shipping and handling costs
Shipping and handling costs are included in the cost of sales in the statement
of operations.
58
SOCKET MOBILE,
INC.
NOTES TO FINANCIAL STATEMENTS (Continued)
Net Loss Per Share
The following table sets forth the computation of basic and diluted net loss
per share:
|
Years
Ended December 31,
|
|||||||||||||
|
2010
|
2009
|
2008
|
|||||||||||
|
Numerator:
|
|||||||||||||
| Net loss | $ | (3,975,837 | ) | $ | (7,888,804 | ) | $ | (2,764,603 | ) | ||||
|
|
|||||||||||||
|
Denominator:
|
|||||||||||||
| Weighted average common shares outstanding used in computing net loss per share: | |||||||||||||
|
Basic
and diluted
|
3,795,673 | 3,562,080 | 3,218,535 | ||||||||||
|
|
|||||||||||||
| Net loss per share applicable to common stockholders: | |||||||||||||
|
Basic
and diluted
|
$ | (1.05 | ) | $ | (2.21 | ) | $ | (0.86 | ) | ||||
For the 2010, 2009, and 2008 periods presented, the diluted net loss per share
is equivalent to the basic net loss per share because the Company experienced
losses in these years and thus no potential common shares underlying stock options,
warrants, or convertible preferred stock have been included in the net loss
per share calculation. Options and warrants to purchase 1,829,375 and 1,298,501
shares of Common Stock in 2010 and 2009, respectively, and options to purchase
1,027,504 shares of Common Stock in 2008, have been omitted from the loss per
share calculation as their effect is anti-dilutive.
Stock-Based Compensation
The Company recognizes stock-based compensation in the financial statements
for all share-based awards to employees, including grants of employee stock
options, based on their fair values. The Company uses a binomial lattice valuation
model to estimate the fair value of stock option grants. The binomial lattice
model incorporates calculations for expected volatility, risk-free interest
rates, employee exercise patterns and post-vesting employment termination behavior,
and these factors affect the estimate of the fair value of the Company's stock
option grants.
In the year ended December 30, 2010, the Company granted stock options to purchase 858,950 shares of the Company's Common Stock at a weighted average per share fair value estimated at $1.92. A majority of the options granted resulted from an option exchange completed in the third quarter 2010. In June 2010 the Company offered to exchange certain outstanding stock options granted under the Company's equity incentive plans for new options to purchase shares of the Company's Common Stock under modified vesting terms. On July 1, 2010, the Company completed the exchange offer and cancelled stock options to purchase 703,550 shares and reissued new stock options to purchase an equivalent number of shares. The option exchange was treated as a modification for accounting purposes. The reissued stock options have an exercise price of $3.04 per share, a weighted average per share fair value estimated at $1.92, with a weighted average vesting period of 2.1 years. Incremental expense resulting from the modification was approximately $0.74 million. Total unrecognized compensation costs after completion of the exchange offer was approximately $1.6 million, which is being amortized over the weighted average remaining requisite period of 2.4 years. At December 31, 2010, options held by employees for 1,192,790 shares were outstanding, of which options for 413,847 shares were exercisable.
59
SOCKET MOBILE,
INC.
NOTES TO FINANCIAL STATEMENTS (Continued)
Weighted average assumptions for options issued and outstanding during the years ended December 31, 2010, 2009, and 2008 are shown as follows:
|
Years
Ended December 31.
|
||||||||||
|
|
2010
|
2009
|
2008
|
|||||||
|
Risk-free interest rate (%)
|
3.03
|
% | 3.05 | % | 4.17 | % | ||||
|
Dividend
yield
|
---
|
--- | --- | |||||||
|
Volatility factor
|
0.9
|
1.0 | 0.7 | |||||||
|
Expected
option life (years)
|
4.0
|
3.9 | 4.9 | |||||||
Total stock-based compensation expenses recognized in our statement of operations
for the years ended December 31, 2010, 2009, and 2008 are as follows:
|
Years
Ended December 31,
|
||||||||||
|
Income
Statement Classification
|
2010
|
2009 | 2008 | |||||||
|
Cost
of revenues
|
$
|
55,607
|
$
|
62,320 |
$
|
41,990 | ||||
|
Research
and development
|
151,978
|
161,406 | 187,653 | |||||||
|
Sales
and marketing
|
196,368
|
263,428 | 264,983 | |||||||
|
General
and administrative
|
272,601 | 227,932 | 203,359 | |||||||
|
Total
|
$
|
676,554 |
$
|
715,086 |
$
|
697,985 | ||||
At December 31, 2010, the fair value of unamortized stock-based compensation expense was $1,142,834, and will be amortized over a weighted average period of 1.94 years.
Segment Information
Operating segments are defined as components of an enterprise about which separate
financial information is available that is evaluated regularly by the chief
executive officer in deciding how to allocate resources and in assessing performance.
The Company operates in one segment-mobile systems solutions for businesses.
Mobile systems solutions typically consist of a handheld computer, data collection
and connectivity peripherals, and third-party vertical applications software.
The Company markets its products in the United States and foreign countries
through its sales personnel and distributors.
Revenues for the geographic areas for the years ended December 31, 2010, 2009, and 2008 are as follows:
|
Years
Ended December 31,
|
|||||||||||
|
Revenues:
(in thousands)
|
2010
|
2009
|
2008
|
||||||||
|
United
States
|
$ | 10,205 | $ | 9,930 | $ | 16,847 | |||||
|
Europe
|
2,742 | 5,386 | 6,470 | ||||||||
|
Asia
and rest of world
|
551 | 1,811 | 3,240 | ||||||||
| $ | 13,498 | $ | 17,127 | $ | 26,557 | ||||||
60
SOCKET MOBILE,
INC.
NOTES TO FINANCIAL STATEMENTS (Continued)
Export revenues are attributable to countries based on the location of the customers.
Information regarding product families for the years ended December 31, 2010, 2009, and 2008 is as follows:
|
Years
Ended December 31,
|
|||||||||||
|
Revenues:
(in thousands)
|
2010
|
2009
|
2008
|
||||||||
| Mobile handheld computer products | $ | 6,622 | $ | 6,467 | $ | 4,730 | |||||
| Data collection | 4,956 | 5,632 | 9,296 | ||||||||
| OEM embedded products | 1,414 | 3,318 | 9,306 | ||||||||
| Other: | |||||||||||
|
Connectivity
|
506 | 815 | $ | 1,617 | |||||||
|
Serial
interface *
|
--- | 895 | 1,608 | ||||||||
| $ | 13,498 | $ | 17,127 | $ | 26,557 | ||||||
*Note: On September 30, 2009, the Company sold its serial product line assets to Quatech, Inc. (see "Note 8 - Sale of Product Line Assets" for more information). |
Major Customers
Customers who accounted for at least 10% of total revenues for the years ended
December 31, 2010, 2009, and 2008 were as follows:
|
Years
Ended December 31,
|
||||||||||||
|
2010
|
2009
|
2008
|
||||||||||
| Ingram Micro, Inc. | 14 | % | 18 | % | 16 | % | ||||||
| Tech Data Corporation | 13 | % | 17 | % | 15 | % | ||||||
| BlueStar, Inc. | 11 | % | * | * | ||||||||
| Epocal, Inc. | 10 | % | * | * | ||||||||
| Intermec, Inc. | * | * | 14 | % | ||||||||
* Customer accounted for less than 10% of total revenues for the period. |
||||||||||||
Recent Accounting Standards
In October 2009, the FASB amended revenue recognition guidance for arrangements
with multiple deliverables. The guidance eliminates the residual method of revenue
recognition and allows the use of management's best estimate of selling price
for individual elements of an arrangement when vendor specific objective evidence
("VSOE"), vendor objective evidence ("VOE") or third-party
evidence ("TPE") is unavailable. This guidance should be applied on
a prospective basis for revenue arrangements entered into or materially modified
in fiscal years beginning on or after June 15, 2010, with early adoption permitted.
Full retrospective application of the guidance is optional. The Company is currently
evaluating the impact of adopting this guidance on its financial statements.
In October 2009, the FASB issued guidance which amends the scope of existing software revenue recognition accounting. Tangible products containing software components and non-software components that function together to deliver the product's essential functionality would be scoped out of the accounting guidance on software and accounted for based on other appropriate revenue recognition guidance. This guidance should be applied on a prospective basis for revenue arrangements entered into or materially modified in fiscal years beginning on or after June 15, 2010, with early adoption permitted. Full retrospective application of the new guidance is optional. This guidance must be adopted in the same period that the Company adopts the amended accounting for arrangements with multiple deliverables described in the preceding paragraph. The Company is currently evaluating the impact of adopting this guidance on its financial statements.
61
SOCKET MOBILE,
INC.
NOTES TO FINANCIAL STATEMENTS (Continued)
In January 2010, the FASB issued guidance which clarifies and provides additional disclosure requirements related to recurring and non-recurring fair value measurements. The Company must implement these new requirements in its first quarter of fiscal 2010. Certain additional disclosures about purchases, sales, issuances and settlements in the roll forward of activity in Level 3 fair value measures are not effective until fiscal years beginning after December 15, 2010. Other than requiring additional disclosures, implementation of this new guidance did not have a material impact on the Company's financial statements.
NOTE 2 - Senior Convertible Note Financing
On November 19, 2010, the Company issued a senior secured convertible note having a principal amount of $1,000,000 in a private placement financing. The note is convertible all or in part at the option of the noteholder into 500,000 shares of Common Stock, at an initial conversion price of $2.00 per share. The conversion price is subject to resets under certain market conditions. The convertible note matures eighteen months from the date of issuance, and will bear interest at the rate of 10% per annum, which is payable quarterly in arrears. The proceeds from the note financing were used for working capital purposes.
In conjunction with the convertible note, the Company issued to the investor a 5.5 year warrant to purchase 500,000 shares of Common Stock at $2.44 per share which was allocated a fair value of $335,548 from the proceeds of the convertible debt. In connection with the note financing, the Company issued to the private placement agent a 5.5 year warrant to purchase 50,000 shares of Common Stock with a fair value of $50,500 which was expensed in General and Administrative expense in the fourth quarter. The private placement agent warrants have terms that are substantially the same as the warrant issued to the investor, except that the private placement agent's warrant will allow for net exercise. The fair values of these warrants were derived using a binomial lattice valuation formula with the following assumptions: 0.0% dividend yield rate, 1.54% risk free interest rate, $2.11 fair value of common stock, $2.44 exercise price, a life of five and a half years, and a volatility of 65.32%.
The convertible note is recorded on the Company's balance sheet net of the associated debt discount of $726,096, which is comprised of the following:
- allocated fair value of the warrant issued to the investor of $335,548;
- beneficial conversion feature of $335,548 based on the allocation of the proceeds between the note and the fair value of the investor warrants; and
- in-the-money beneficial conversion feature of $55,000.
The debt discount will be amortized ratably over the life of the note, except in the case of conversion which may accelerate the amortization. Amortization of debt discount for the year ended December 31, 2010 was $55,649 and was included in interest expense.
62
SOCKET MOBILE,
INC.
NOTES TO FINANCIAL STATEMENTS (Continued)
The convertible note is secured by all of the assets of the Company. In order to secure the note, the Company terminated its credit line facilities with Silicon Valley Bank, who then released its security interest in the assets of the Company (see "Note 4 - Bank Financing Arrangements" for more information). The Company will be required at all times to maintain collateralization of the convertible note with an amount equivalent to the unconverted principal plus accrued interest. Collateral will consist of qualified accounts receivables of the Company, plus cash to the extent qualified accounts receivables are less than the unconverted principal plus accrued interest. At December 31, 2010, $710,797 of the note proceeds was reserved as collateral under the terms of the note and reflected as restricted cash on the Company's balance sheet.
On January 12, 2011, the Company completed the registration of 1,310,398 shares which is an amount equal to the maximum shares issuable for the conversion of the note and warrants. On January 20, 2011, the date of the first conversion price reset, 85% of the lowest reported closing bid price in the five days preceding the reset date resulted in a conversion price reset of $1.50 per share which added an additional 166,666 shares to be issued upon conversion of the note for a total of 666,666 shares issuable upon conversion. As a result of the reset, a beneficial conversion feature with a fair value of $273,904 will be added to debt discount in the first quarter 2011 and will be amortized ratably over the remaining life of the note, except in the case of conversion which may accelerate the amortization. The conversion price is subject to one additional price reset one year from date of closing subject to a conversion floor price of $1.31 per share and could result in an increase in the number of shares the Company is obligated to issue upon conversion of the note up to an additional 97,732 shares in aggregate. As the total debt discount is limited to the face value of the note, no additional debt discount will be recognized in the future.
NOTE 3 - Common Stock Financing
On May 26, 2009, the Company completed the sale of 556,786 shares of its Common Stock in a private placement with certain investors, including certain officers and directors of the Company and beneficial holders of more than five percent of the Company's outstanding capital stock. Of the shares sold, the Company issued 306,786 shares to non-management investors at $1.80 per share, 90 percent of the closing bid price of the Common Stock on the Nasdaq Capital Market one day prior to the execution of the Securities Purchase Agreement. Kevin J. Mills, President, Chief Executive Officer and a director of the Company, and Charlie Bass, Chairman of the Board of Directors of the Company, participated in the private placement for a total of 250,000 shares at $2.00 per share, the closing bid price of the Common Stock on the Nasdaq Capital Market one day prior to the execution of the Securities Purchase Agreement. In conjunction with the private placement, the Company issued to non-management investors five-year warrants to acquire an additional 61,356 shares of Common Stock at $1.80 per share, and issued to the placement agent a five-year warrant to acquire 27,839 shares of Common Stock at $1.80 per share. The aggregate amount raised in the private placement was $1,052,215, and net proceeds after costs and expenses were $884,728. The aggregate number of shares of Common Stock issued and reserved for the exercise of warrants issued in or in connection with the private placement was 645,981. Using a binomial lattice valuation formula with the following assumptions: 0.0% dividend yield rate, 2.30% risk free interest rate, $3.00 fair value of Common Stock, $1.80 exercise price, a life of five years, and a volatility of 109.63%, $73,627 of the proceeds were attributed to the warrants issued to non-management investors, and the warrant issued to the placement agent was valued at $33,407 which was included in the cost of the financing. The proceeds from the private placement were used to increase the Company's working capital balances.
63
SOCKET MOBILE,
INC.
NOTES TO FINANCIAL STATEMENTS (Continued)
NOTE 4 - Bank Financing Arrangements
For the years presented up through November 2, 2010, the Company had a credit facility with Silicon Valley Bank (the "Bank") which allowed the Company to borrow up to $2,500,000 based on the level of qualified domestic and international receivables, up to a maximum of $1,500,000 and $1,000,000, respectively. Borrowings under the lines bore an annual interest rate equal to the greater of (i) the Lender's prime rate plus 2%, or (ii) 6%. The annual interest rate in effect at December 30, 2009 and throughout fiscal 2010 was 6%. The borrowings under the credit facility were secured by a first priority security interest in the assets of the Company. The advance rate for receivables was 50% from distributors and 70% for all other receivables. The agreement also specified a collateral handling fee of 0.62% per month. The applicable interest and fees were calculated based on the full amount of the accounts receivable provided as collateral, rather than on the actual amounts borrowed. The outstanding amounts borrowed under the domestic and international lines at December 31, 2009 were $649,905 and $352,183, respectively, and the full amounts of accounts receivable provided as collateral were $1,124,770, and $678,794, respectively. The Company was out of compliance with the minimum revenue covenant for the quarter ended December 31, 2009. The Bank agreed to forbear any actions relating to the event of default through March 24, 2010.
On March 3, 2010, the Company agreed with the Bank to extend the term of the existing credit facility to March 23, 2011 and to amend its other terms. Under the terms of the amendment, the Company was required to maintain at all times a minimum cash deposit balance at the Bank of no less than $1,000,000, and to achieve minimum quarterly revenue requirements for fiscal 2010. The Company failed to meet the minimum revenue covenant for the quarters ended March 31, 2010, June 30, 2010, and September 30, 2010, however, the bank agreed to waive the events of default for the quarters ended March 31, 2010 and June 30, 2010, and to replace the quarterly minimum revenue requirements with quarterly net income targets beginning with the quarter ended June 30, 2010. On November 2, 2010, the Company repaid in full its outstanding indebtedness to the Bank and terminated the lines of credit. All obligations of the Company under the credit facility and any other related loan and collateral security documents, except those which specifically survive the termination of such agreements, were terminated. In conjunction with this termination the Company entered into a securities purchase agreement in conjunction with a convertible note financing which subsequently closed on November 19, 2010 (see "NOTE 2 - Senior Convertible Note Financing" for more information).
NOTE 5 - Intangible Assets
Intangible assets consist of a patent purchased in 2004 for $600,000 covering the design and functioning of plug-in bar code scanners, bar code imagers, and radio frequency identification products, which is being amortized on a straight line basis over its estimated life of ten years. Intangible assets of $570,750 remaining from a prior acquisition in 2000 consisting of developed software and technology with estimated lives at the time of acquisition of 8.5 years was fully amortized in the quarter ended June 30, 2009.
64
SOCKET MOBILE,
INC.
NOTES TO FINANCIAL STATEMENTS (Continued)
Amortization of all intangible assets for the years ended December 31, 2010, 2009, and 2008, was $60,000, $76,787, and $127,147, respectively. Intangible assets as of December 31, 2010 consisted of the following:
|
Gross
|
Accumulated
|
|||||||||||
|
Assets
|
Amortization
|
Net
|
||||||||||
| Patent | $ | 600,000 | $ | 390,000 | $ | 210,000 | ||||||
| Project management tools | 570,750 | 570,750 | --- | |||||||||
| Total intangible assets | $ | 1,170,750 | $ | 960,750 | $ | 210,000 | ||||||
Intangible assets as of December 31, 2009 consisted of the following:
|
Gross
|
Accumulated
|
|||||||||||
|
Assets
|
Amortization
|
Net
|
||||||||||
| Patent | $ | 600,000 | $ | 330,000 | $ | 270,000 | ||||||
| Project management tools | 570,750 | 570,750 | --- | |||||||||
| Total intangible assets | $ | 1,170,750 | $ | 900,750 | $ | 270,000 | ||||||
Based on identified intangible assets recorded at December 31, 2010 and assuming no subsequent impairment of the underlying assets, the annual amortization expense is expected to be as follows:
| Year |
Amount
|
|||
|
2011
|
$ | 60,000 | ||
|
2012
|
60,000 | |||
|
2013
|
60,000 | |||
|
2014
|
30,000 | |||
|
$
|
210,000 | |||
NOTE 6 - Capital Lease Obligations
The Company leases certain of its equipment under capital leases. The leases are collateralized by the underlying assets. At December 31, 2010 and 2009, property and equipment with a cost of $49,962 were subject to such financing arrangements. Related accumulated amortization at December 31, 2010 and 2009 amounted to $18,736 and $6,245, respectively. Future minimum payments under capital lease and equipment financing arrangements as of December 31, 2010, are as follows:
|
Annual
minimum payments
|
Amount
|
|||
|
2011
|
$ | 14,622 | ||
|
2012
|
14,622 | |||
|
2013
|
4,875 | |||
|
Total
minimum payments
|
34,119 | |||
|
Less
amount representing interest
|
(2,355 | ) | ||
|
Present
value of net minimum payments
|
31,764 | |||
|
Short
term portion of capital leases
|
(13,072 | ) | ||
|
Long
term portion of capital leases
|
$ | 18,692 | ||
65
SOCKET MOBILE,
INC.
NOTES TO FINANCIAL STATEMENTS (Continued)
NOTE 7 - Commitments
The Company operates its headquarters under a non-cancelable operating lease which provides for the lease by the Company of approximately 37,100 square feet of space in Newark, California. On August 30, 2010, the Company amended its commercial building lease agreement. The amendment was effective as of August 23, 2010 and extended the lease termination date from June 30, 2012 to June 30, 2018. The Company's base rent under the facilities lease was abated in its entirety in the amount of $31,983 for each of the months of September through December 2010. In addition, the base rent for the months of January 2011 through June 2012 was reduced by $1,278 per month. The base rent under the facilities lease shall be $29,705 per month for the period from July 1, 2012 through June 30, 2013. The base rent increases annually thereafter at a rate of four percent per year for the remaining five years under the facilities lease. Future minimum lease payments under all operating leases are as shown below:
|
Annual
minimum payments
|
Amount
|
||
|
2011
|
378,847 | ||
|
2012
|
368,692 | ||
|
2013
|
363,587 | ||
|
2014
|
378,130 | ||
|
2015
to 2018
|
1,444,429 | ||
|
Total
minimum payments
|
$ | 2,933,685 | |
Rental expense under all operating leases was $347,768, $351,532, and $351,532
for each of the years ended December 31, 2010, 2009, and 2008, respectively.
The amount of related deferred rent at December 31, 2010 and 2009 was $197,387
and $95,200, respectively.
As of December 31, 2010, the Company has non-cancelable purchase commitments for inventory to be used in the ordinary course of business of approximately $3,249,000.
NOTE 8 - Sale of Product Line Assets
On September 30, 2009, the Company entered into an asset purchase agreement pursuant to which the Company sold its serial product line to Quatech, Inc., a wholly owned subsidiary of DPAC Technologies Corp. and manufacturer of wireless machine-to-machine networking and device connectivity systems. Under the terms of the asset purchase agreement, Quatech acquired for the sum of $500,000 all rights, title and interest in the Company's serial products business including related product designs, the SocketSerial brand name and the SocketSerial website under which the serial products were marketed by the Company. The products in the SocketSerial product line consist of a CompactFlash serial card, a PC serial card, a PC dual serial card, and a PC quad serial card, all with fixed and removable cable models. Also included are the Company's USB to Serial Adapter, USB to Ethernet Adapter and a license to sell the Cordless Serial Adapter. Quatech intends to continue to manufacture and distribute the SocketSerial product line and will assume existing customer support responsibilities. At the time of closing, $450,000 of the purchase price was paid with the remaining $50,000 of the purchase price contingent and payable upon the attainment by Quatech of quarterly revenue from the sale of SocketSerial products of at least $250,000 in any quarter through the quarter ending December 31, 2010. The Company recognized $450,000 as a gain on sale of product line assets for the quarter ended September 30, 2009. The Company used the proceeds from the transaction for working capital purposes. SocketSerial product revenues in the quarters subsequent to the sale of the product line to Quatech through the quarter ended December 31, 2010, were below the minimum revenue attainment threshold required for payment of the contingent amount, and therefore no additional amounts from the sale of the SocketSerial product line were recognized in 2010.
66
SOCKET MOBILE,
INC.
NOTES TO FINANCIAL STATEMENTS (Continued)
In connection with the sale of the serial products business, the Company and Quatech also entered into a supply and licensing agreement pursuant to which the Company (i) supplies Quatech with its proprietary HIS3 interface chip used in the serial products, (ii) licensed its Bluetooth software to Quatech for use in the Cordless Serial Adapter, and (iii) supplies a limited quantity of the Cordless Serial Adapter product currently held in the Company's inventory.
NOTE 9 - Reverse Stock Split
On October 22, 2008, the Company's Board of Directors approved a one-for-ten reverse split of its Common Stock effective on October 23, 2008. The Company implemented the reverse stock split under the authority granted to the Board by the Company's stockholders at their annual meeting on April 23, 2008, to effect a reverse stock split of the Company's Common Stock, par value $0.001 per share, at a ratio within a range of from one-for-five to one-for-ten shares. As a result of the reverse stock split, each ten shares of Common Stock, par value $0.001 per share, of the Company issued and outstanding were, automatically and without any action on the part of the respective holders thereof, combined and reconstituted as one share of Common Stock, par value $0.001 per share, of the Company. The reverse stock split reduced the number of outstanding shares of Common Stock from 32,300,129 shares to 3,229,916 shares. Holders of a fractional share of Common Stock as a result of the reverse stock split were entitled to receive a cash amount, without interest, equal to the fair market value of that fraction based upon the average of the closing bid prices of the Common Stock as reported on the NASDAQ Capital Market for each of the five trading days immediately preceding the effective date of the reverse stock split. On the Company's balance sheet, the aggregate par value of the issued Common Stock was reduced by reclassifying the par value amount of the eliminated shares of Common Stock to additional paid-in capital. All per share amounts and outstanding shares, including all Common Stock equivalents, stock options, equity compensation plans, and convertible preferred stock, have been retroactively restated in the Financial Statements and in the Notes to the Financial Statements for all period presented to reflect the reverse stock split.
NOTE 10 - Stock Option/Stock Issuance Plan
The Company has three Stock Option Plans: the 1995 Stock Option/Stock Issuance Plan (the "1995 Plan"), the 1999 Stock Plan (the "1999 Plan"), and the 2004 Equity Incentive Plan (the "2004 Plan").
The 1995 Plan
The 1995 Plan provided for the grant of incentive stock options and nonstatutory
stock options to employees, directors, and consultants of the Company. The Company
granted incentive stock options and nonstatutory stock options at exercise prices
per share equal to the fair market value per share of Common Stock on the date
of grant. The vesting and exercise provisions were determined by the Board of
Directors, with a maximum term of ten years. Upon ratification of the 2004 Plan
by the shareholders in June 2004, shares in the 1995 Plan that had been reserved
but not issued, as well as any shares issued that would otherwise return to
the 1995 Plan as a result of termination of options or repurchase of shares,
were added to the shares reserved for issuance under the 2004 Plan. The 1995
Plan expired on April 28, 2005. No additional grants will be made from the 1995
Plan. In 2010 the shares in the 1995 Plan were cancelled and transferred to
the 2004 Plan.
67
SOCKET MOBILE,
INC.
NOTES TO FINANCIAL STATEMENTS (Continued)
Information with respect to the 1995 Plan is summarized as follows:
|
Outstanding
Options
|
||||||||||||
|
Options
|
Weighted
|
|||||||||||
|
Available
|
Number
|
Average
|
||||||||||
|
For
Grant
|
|
of
Shares
|
|
Price
Per Share
|
||||||||
| Balance at December 31, 2007 | --- | 440,387 | $ | 18.29 | ||||||||
| Canceled | 57,109 | (57,109 | ) | $ | 17.79 | |||||||
| Exercised | --- | (7,583 | ) | $ | 6.35 | |||||||
| Transferred to 2004 Plan | (57,109 |
)
|
--- |
|
||||||||
| Balance at December 31, 2008 | --- | 375,695 | $ | 18.61 | ||||||||
| Canceled | 74,350 | (74,350 | ) | $ | 16.74 | |||||||
| Transferred to 2004 Plan | (74,350 |
)
|
--- |
|
||||||||
| Balance at December 31, 2009 | --- | 301,345 | $ | 19.07 | ||||||||
| Canceled | 301,345 | (301,345 | ) | $ | 19.07 | |||||||
| Transferred to 2004 Plan | (301,345 |
)
|
--- |
|
||||||||
| Balance at December 31, 2010 | --- | --- | ||||||||||
The 1999 Plan
The 1999 Plan provided for the grant of nonstatutory stock options to employees, directors, and consultants of the Company. The Company grants nonstatutory stock options at an exercise price per share equal to the fair market value per share of Common Stock on the date of grant. The vesting and exercise provisions are determined by the Board of Directors, with a maximum term of ten years. The 1999 Plan expired on June 16, 2009.
Information with respect to the 1999 Plan is summarized as follows:
|
Outstanding
Options
|
||||||||||||
|
Options
|
Weighted
|
|||||||||||
|
Available
|
Number
|
Average
|
||||||||||
|
For
Grant
|
|
of
Shares
|
|
Price
Per Share
|
||||||||
| Balance at December 31, 2007 | 21,065 | 107,275 | $ | 27.81 | ||||||||
| No transactions | 1,000 |
|
(1,000 |
)
|
$ | 5.63 | ||||||
| Balance at December 31, 2008 | 22,065 | 106,275 | $ | 28.02 | ||||||||
| Canceled | 46,100 |
|
(46,100 |
)
|
$ | 21.25 | ||||||
| Options not granted at Plan expiration | (68,165 |
)
|
--- |
|
||||||||
| Balance at December 31, 2009 | --- | 60,175 | $ | 33.20 | ||||||||
| Canceled | 60,175 | (60,175 | ) | $ | 33.20 | |||||||
| Options not granted at Plan expiration | (60,175 |
)
|
--- |
|
||||||||
| Balance at December 31, 2010 | --- | --- | ||||||||||
68
SOCKET MOBILE,
INC.
NOTES TO FINANCIAL STATEMENTS (Continued)
The 2004 Plan
The 2004 Plan provides for the grant of incentive stock options, nonstatutory
stock options, restricted stock, stock appreciation rights, and performance
awards, to employees, directors, and consultants of the Company. Upon ratification
of the 2004 Plan by the shareholders in June 2004, shares in the 1995 Plan that
had been reserved but not issued, as well as any shares issued that would otherwise
return to the 1995 Plan as a result of termination of options or repurchase
of shares, were added to the shares reserved for issuance under the 2004 Plan.
The Company grants incentive stock options and non-statutory stock options at
an exercise price per share equal to the fair market value per share of Common
Stock on the date of grant. The vesting and exercise provisions are determined
by the Board of Directors, with a maximum term of ten years.
Information with respect to the 2004 Plan is summarized as follows:
|
Outstanding
Options
|
||||||||||||
|
Options
|
Weighted
|
|||||||||||
|
Available
|
Number
|
Average
|
||||||||||
|
For
Grant
|
|
of
Shares
|
|
Price
Per Share
|
||||||||
| Balance at December 31, 2007 | 83,972 | 451,863 | $ | 11.69 | ||||||||
| Increase in shares authorized | 127,967 | --- | ||||||||||
| Transferred from 1995 Plan | 57,109 | --- | ||||||||||
| Granted | (181,630 | ) | 181,630 | $ | 6.89 | |||||||
| Canceled | 87,959 |
|
(87,959 | ) | $ | 10.53 | ||||||
| Balance at December 31, 2008 | 175,377 | 545,534 | $ | 10.28 | ||||||||
| Increase in shares authorized | 129,196 | --- | ||||||||||
| Transferred from 1995 Plan | 74,350 | --- | ||||||||||
| Granted | (492,181 | ) | 492,181 | $ | 2.37 | |||||||
| Exercised | --- | (1,360 | ) | $ | 1.96 | |||||||
| Canceled | 187,008 |
|
(187,016 | ) | $ | 7.74 | ||||||
| Balance at December 31, 2009 | 73,750 | 849,339 | $ | 6.27 | ||||||||
| Increase in shares authorized | 151,550 | --- | ||||||||||
| Transferred from 1995 Plan | 301,345 | --- | ||||||||||
| Granted | (858,950 | ) | 858,950 | $ | 3.00 | |||||||
| Exercised | --- | (12,951 | ) | $ | 1.96 | |||||||
| Canceled | 502,548 |
|
(502,548 | ) | $ | 2.15 | ||||||
| Balance at December 31, 2010 | 170,243 | 1,192,790 | $ | 2.88 | ||||||||
The weighted average fair value of options granted during 2010, 2009, and 2008, under the 2004 Plan was $1.92, $1.64, and $4.13, respectively.
The 2004 Plan provides for an annual increase in the number of shares authorized under the plan to be added on the first day of each fiscal year equal to the lesser of 200,000 shares, four percent of the outstanding shares on that date, or a lesser amount as determined by the Board of Directors. On January 1, 2011, 2010, and 2009, a total of 152,079, 151,550, and 129,196 additional shares, respectively, became available for grant from the 2004 Plan. As of March 10, 2011, 207,450 options at a weighted average grant price of $1.04 per share have been granted from the 2004 Plan subsequent to December 31, 2010.
69
SOCKET MOBILE,
INC.
NOTES TO FINANCIAL STATEMENTS (Continued)
The outstanding and exercisable options at December 31, 2010 presented by price range are as follows:
| Options Outstanding |
Options
Exercisable
|
|||||||||||||||||||
|
Weighted
|
||||||||||||||||||||
|
Range
of
|
Number
of
|
Average
|
Weighted
|
Number
of
|
Weighted
|
|||||||||||||||
|
Exercise
|
Options
|
Remaining
Life
|
Average
|
Options
|
Average
|
|||||||||||||||
|
Prices
|
Outstanding
|
(Years)
|
Exercise
Price
|
Exercisable
|
Exercise
Price
|
|||||||||||||||
|
$1.96
|
213,930 | 8.17 | $ | 1.96 | 94,571 | $ | 1.96 | |||||||||||||
|
$2.35
- $2.45
|
51,900 | 8.42 | $ | 2.39 | 49,500 | $ | 2.40 | |||||||||||||
|
$2.74
- $3.04
|
794,530 | 9.58 | $ | 3.00 | 155,041 | $ | 3.01 | |||||||||||||
|
$3.15
- $4.48
|
123,590 | 8.75 | $ | 3.38 | 107,440 | $ | 3.39 | |||||||||||||
|
$6.90
- $7.20
|
4,000 | 7.42 | $ | 7.00 | 2,563 | $ | 7.02 | |||||||||||||
|
$10.00
- $15.10
|
4,840 | 5.50 | $ | 11.61 | 4,732 | $ | 11.64 | |||||||||||||
|
$1.96
- $15.10
|
1,192,790 | 9.17 | $ | 2.88 | 413,847 | $ | 2.92 | |||||||||||||
NOTE 11 - Warrants
The Company issued warrants to purchase Common Stock in connection with certain financing agreements. In November 2010, warrants were issued in conjunction with the senior convertible note financing (see "Note 2 - Senior Convertible Note Financing" for more information). In May 2009, warrants were issued in conjunction with a common stock financing (see "Note 3 - Common Stock Financing" for more information). The Company has the following outstanding warrants to purchase Common Stock at December 31, 2010:
|
Reason
|
Number
of Shares
|
|
|
Price
Per Share
|
|
|
Issue
Date
|
|
|
Expiration
Date
|
|||||
|
Common
stock financing
|
86,585
|
$1.80
|
May
2009
|
May 2014
|
|||||||||||
|
Senior
convertible note financing
|
550,000
|
$2.44
|
Nov
2010
|
May 2016
|
|||||||||||
|
636,585
|
|||||||||||||||
NOTE 12 - Shares Reserved
Common Stock reserved for future issuance was as follows:
|
Number
of shares at
December 31, |
||||||
|
2010
|
2009
|
|||||
|
Stock
option grants outstanding (see Note 9)
|
1,192,790 | 1,210,859 | ||||
|
Reserved
for future stock option grants (see Note 10)
|
170,243 | 73,750 | ||||
|
Reserved
for note conversion (see Note 2)
|
760,398 | --- | ||||
|
Reserved
for exercise of outstanding warrants (see Note 11)
|
636,585 | 87,642 | ||||
|
|
2,760,016 | 1,372,251 | ||||
70
SOCKET MOBILE,
INC.
NOTES TO FINANCIAL STATEMENTS (Continued)
NOTE 13 - Retirement Plan
The Company has a tax-deferred savings plan, the Socket Mobile, Inc. 401(k) Plan ("401(k) Plan"), for the benefit of qualified employees. The 401(k) Plan is designed to provide employees with an accumulation of funds at retirement. Qualified employees may elect to make contributions to the 401(k) Plan on a monthly basis. No contributions were made by the Company during the years ended December 31, 2010, 2009 or 2008. Administrative expenses relating to the 401(k) Plan are not significant.
NOTE 14 - Income Taxes
Deferred tax expense is related to the deferred tax liability on the portion
of the Company's goodwill amortized for tax purposes. Due to the indefinite
characteristic of this deferred tax liability, it cannot be offset against deferred
tax assets. Goodwill impairment charges recorded as of December 31, 2009 on
that portion of the Company's goodwill being amortized for tax purposes, resulted
in the reversal of accumulated deferred tax expense and the related deferred
tax liability, temporarily eliminating the difference between financial and
tax reporting at December 31, 2009 and through the first two quarters of 2010.
The provision for deferred tax for the periods ended December 31, 2010, 2009,
and 2008, consists of the following components:
|
Years
Ended December 31,
|
|||||||||||||
|
2010
|
2009
|
2008
|
|||||||||||
|
Current:
|
|||||||||||||
|
Federal
|
$ | --- | $ | --- | $ | --- | |||||||
|
State
|
--- | --- | --- | ||||||||||
|
Total
Current
|
--- | --- | --- | ||||||||||
|
|
|||||||||||||
|
Deferred:
|
|||||||||||||
|
Federal
|
15,515 | (214,261 | ) | 31,939 | |||||||||
|
State
|
--- | --- | --- | ||||||||||
|
Total
Deferred
|
15,515 | (214,261 | ) | 31,939 | |||||||||
|
Total
provision for deferred tax
|
$ | 15,515 | $ | (214,261 | ) | $ | 31,939 | ||||||
Reconciliation of the statutory federal income tax rate to the Company's effective
tax rate:
|
Years
Ended December 31,
|
||||||||||||||
|
2010
|
2009
|
|
2008
|
|||||||||||
|
Federal
tax at statutory rate
|
34.00 | % | 34.00 | % | 34.00 | % | ||||||||
|
State
income tax rate
|
5.83 | % | 5.83 | % | 5.83 | % | ||||||||
|
Losses
and credits not benefited
|
(39.44 | ) | % | (17.89 | ) | % | (38.66 | ) | % | |||||
|
Goodwill
impairment
|
--- | (19.30 | ) | % | --- | |||||||||
|
Provision
for taxes
|
0.39 | % | 2.64 | % | 1.17 | % | ||||||||
71
SOCKET MOBILE,
INC.
NOTES TO FINANCIAL STATEMENTS (Continued)
Deferred income tax reflects the net tax effects of temporary differences between
the carrying amount of assets and liabilities for financial reporting purposes
and the amount used for income tax purposes. Significant components of net deferred
tax assets are as follows:
|
Years
Ended December 31,
|
||||||||
| Deferred tax assets: |
2010
|
2009
|
||||||
| Net operating loss carryforwards | $ | 11,321,000 | $ | 9,749,000 | ||||
| Credits | 585,000 | 599,000 | ||||||
| Capitalized research and development costs | 649,000 | 757,000 | ||||||
| Other acquired intangibles | 222,000 | 260,000 | ||||||
| Accruals not currently deductible | 1,171,000 | 1,317,000 | ||||||
| Total deferred tax assets | 13,948,000 | 12,682,000 | ||||||
| Valuation allowance for deferred tax assets | (13,945,515 | ) | (12,682,000 | ) | ||||
| Net deferred tax assets | 2,485 | --- | ||||||
| Deferred tax liability: | ||||||||
| Acquired intangibles | (18,000 | ) | --- | |||||
| Net deferred tax liabilities | $ | (15,515 | ) | $ | --- | |||
The Company has not generated taxable income in any periods in any jurisdiction, foreign or domestic. The Company has maintained a valuation allowance for its deferred tax assets.
As of December 31, 2010, the Company had net operating loss carryforwards for federal income tax purposes of approximately $30,443,000, which will expire at various dates beginning in 2011 and through 2030, and federal research and development tax credits of approximately $338,000, which will expire at various dates beginning in 2018 and through 2030. As of December 31, 2010, the Company had net operating loss carryforwards for state income tax purposes of approximately $16,650,000, which will expire at various dates in 2012 and through 2030, and state research and development tax credits of approximately $259,000, which can be carried forward indefinitely. During 2010, approximately $2,342,000 of federal net operating loss carryforwards expired unutilized.
Utilization of the net operating loss and tax credit carryforwards is subject to annual limitations due to the ownership change limitations provided by the Internal Revenue Code Section 382 and similar state provisions. The annual limitation will result in the expiration of the net operating loss and credit carryforwards before utilization. The deferred tax assets for the year ended December 31, 2010 reflect estimates of Section 382 limitations.
72
SOCKET MOBILE,
INC.
NOTES TO FINANCIAL STATEMENTS (Continued)
A reconciliation of the beginning and ending amount of unrecognized tax benefits
("UTBs"), excluding interest and penalties, is as follows:
|
Amount
|
||||
| Beginning balance at January 1, 2010 | $ |
599,000
|
||
| Decreases in UTBs taken in prior years |
(14,000
|
)
|
||
| Increases in UTBs taken in current year |
12,000
|
|||
| Amount related to settlements |
---
|
|||
| Amount related to lapsing of statute of limitations |
---
|
|||
|
Ending balance at December 31, 2010 |
$ |
597,000
|
||
Future changes in the unrecognized tax benefit will have no impact on the effective tax rate due to the existence of the valuation allowance. It is the Company's policy to include interest and penalties related to tax positions as a component of income tax expense. No interest was accrued for the period ended December 31, 2010. The Company estimates that the unrecognized tax benefit will not change significantly within the next twelve months.
The Company files its tax returns as prescribed by the tax laws of the jurisdictions in which it operates. The Company is not currently under audit in any of its jurisdictions where income tax returns are filed. The tax years 1995 to 2010 remain open to examination by the major domestic taxing jurisdictions to which the Company is subject, and for the years 2002 to 2008 for the international taxing jurisdictions to which the Company is subject.
NOTE 15 - Subsequent Event: Common Stock Financing
On February 23, 2011, the Company completed the sale of 282,485 shares of its Common Stock in a private placement with AboCom Systems, Inc., a corporation organized under the laws of Taiwan and a contract manufacturer of the Company's products. The shares were priced at the closing bid price of $1.77 per share as reported on February 23, 2011 for a total of $499,998 raised in the private placement. The proceeds will be used to reduce the Company's trade payable balance with AboCom Systems by the same amount.
73
Item 9. Changes in and Disagreements with Accountants on Accounting and Financial Disclosure
Not Applicable.
Item 9A. Controls and Procedures
Conclusion Regarding the Effectiveness of Disclosure Controls and Procedures
Our management evaluated, with the participation of our Chief Executive Officer and our Chief Financial Officer, the effectiveness of our disclosure controls and procedures as of the end of the period covered by this Annual Report on Form 10-K. Based on this evaluation, our Chief Executive Officer and our Chief Financial Officer have concluded that our disclosure controls and procedures are effective to ensure that information we are required to disclose in reports that we file or submit under the Securities Exchange Act of 1934 is (i) recorded, processed, summarized and reported within the time periods specified in Securities and Exchange Commission rules and forms, and (ii) accumulated and communicated to our management, including our Chief Executive Officer and our Chief Financial Officer, as appropriate to allow timely decisions regarding required disclosure.
Management's Annual Report on Internal Control Over Financial Reporting
Our management is responsible for establishing and maintaining adequate internal control over financial reporting. There are inherent limitations in the effectiveness of any internal control, including the possibility of human error and the circumvention or overriding of controls. Accordingly, even effective internal control can provide only reasonable assurances with respect to financial statement preparation. Further, projections of any evaluation of effectiveness to future periods are subject to the risk that controls may become inadequate because of changes in conditions, or that the degree of compliance with the policies or procedures may deteriorate.
We assessed the effectiveness of the Company's internal control over financial reporting as of December 31, 2010. In making this assessment, we used the criteria set forth by the Committee of Sponsoring Organizations of the Treadway Commission (COSO) in Internal Control - Integrated Framework. This assessment included review of the documentation of controls, testing of operating effectiveness of controls and a conclusion on this assessment.
Based on our assessment using those criteria, we believe that, as of December 31, 2010, our internal control over financial reporting is effective.
This annual report does not include an attestation report of the Company's registered public accounting firm regarding internal control over financial reporting. Management's report was not subject to attestation by the Company's registered public accounting firm pursuant to the Dodd-Frank Wall Street Reform and Consumer Protection Act, which exempts non-accelerated filers from Section 404(b) of the Sarbanes-Oxley Act of 2002.
74
Changes in Internal Control Over Financial Reporting
There was no change in our internal control over financial reporting that occurred during the last fiscal quarter covered by this Annual Report on Form 10-K that has materially affected, or is reasonably likely to materially affect, our internal control over financial reporting.
None.
PART III
Item 10. Directors, Executive Officers and Corporate Governance
The information required hereunder is incorporated by reference from our Proxy Statement to be filed in connection with our annual meeting of stockholders to be held on April 27, 2011.
Item 11. Executive Compensation
The information required hereunder is incorporated by reference from our Proxy Statement to be filed in connection with our annual meeting of stockholders to be held on April 27, 2011.
Item 12: Security Ownership of Certain Beneficial Owners and Management and Related Stockholder Matters
Certain information required hereunder is incorporated by reference from our Proxy Statement to be filed in connection with our annual meeting of stockholders to be held on April 27, 2011.
The following table provides information as of December 31, 2010 about our Common Stock that may be issued under the Company's existing equity compensation plans. For additional information about the equity compensation plans see Note 9 to the Company's Financial Statements.
|
Number of securities to be issued upon exercise of outstanding options |
|
|
Weighted-average exercise price of outstanding options |
|
Number of securities remaining available for future issuance under equity compensation plans |
||||
| Equity compensation plans approved by security holders (1) |
1,192,790
|
$ |
2.88 |
170,283
|
|||||
(1) Consists of the 2004 Equity Incentive Plan. Pursuant to an affirmative vote by security holders in June 2004, an annual increase in the number of shares authorized under the 2004 Equity Incentive Plan is added on the first day of each fiscal year equal to the least of (a) 200,000 shares, (b) four percent of the total outstanding shares of the Company's Common Stock on that date, or (c) a lesser amount as determined by the Board of Directors. As a result, a total of 152,079 shares became available for grant under the 2004 Equity Incentive Plan on January 1, 2011, in addition to those set forth in the table above. |
|||||||||
75
Item 13. Certain Relationships and Related Transactions, and Director Independence
Certain information required hereunder is incorporated by reference from our Proxy Statement to be filed in connection with our annual meeting of stockholders to be held on April 27, 2011.
Item 14. Principal Accounting Fees and Services
Certain information required hereunder is incorporated by reference from our Proxy Statement to be filed in connection with our annual meeting of stockholders to be held on April 27, 2011.
PART IV
Item 15. Exhibits, Financial Statement Schedules
(a) Documents filed as part of this report:
1. All financial statements.
INDEX TO FINANCIAL STATEMENTS PAGE Report of Moss Adams LLP, Independent Registered Public Accounting Firm 47 Balance Sheets 48 Statements of Operations 49 Statements of Stockholders' Equity 50 Statements of Cash Flows 51 Notes to Financial Statements 52
2. Financial statement schedules.
All financial statement schedules are omitted because they are not applicable or not required or because the required information is included in the financial statements or notes herein.
3. Exhibits.
See Index of Exhibits on page 78. The Exhibits listed on the accompanying Index of Exhibits are filed or incorporated by reference as part of this report.
(b) Exhibits:
See Index of Exhibits on page 78. The Exhibits listed on the accompanying Index of Exhibits are filed or incorporated by reference as part of this report.
76
Pursuant to the requirements of Section 13 or 15(d) of the Securities Exchange Act of 1934, the registrant has duly caused this report to be signed on its behalf by the undersigned, hereunto duly authorized.
| SOCKET
MOBILE, INC. Registrant |
|
| Date: March 11, 2011 | /s/
Kevin J. Mills Kevin J. Mills President and Chief Executive Officer |
Pursuant to the requirements of the Securities Exchange Act of 1934, this report has been signed below by the following persons on behalf of the Registrant and in the capacities and on the dates indicated.
| By | /s/ Kevin J. Mills | President
and Chief Executive Officer (Principal Executive Officer) |
March 11, 2011 | |
| Kevin J. Mills | ||||
| By | /s/ Charlie Bass | Chairman of the Board | March 11, 2011 | |
| Charlie Bass | ||||
| By | /s/ David W. Dunlap | Vice
President of Finance and Administration and Chief Financial Officer (Principal Financial and Accounting Officer) |
March 11, 2011 | |
| David W. Dunlap | ||||
| By | /s/ Micheal L. Gifford | Executive Vice President and Director | March 11, 2011 | |
| Micheal L. Gifford | ||||
| By | /s/ Charles C. Emery, Jr. | Director | March 11, 2011 | |
| Charles C. Emery, Jr. | ||||
| By | /s/ Leon Malmed | Director | March 11, 2011 | |
| Leon Malmed | ||||
| By | /s/ Thomas Miller | Director | March 11, 2011 | |
| Thomas Miller | ||||
| By | /s/ Peter Sealey | Director | March 11, 2011 | |
| Peter Sealey |
77
|
Exhibit
Number
|
Description
|
|
3.1 (1)
|
Amended and Restated Certificate of Incorporation. |
|
3.2
(2)
|
Bylaws, as amended February 17, 2008. |
|
10.1
(3)*
|
Form of Indemnification Agreement entered into between the Company and its directors and officers. |
|
10.2
(4)*
|
1995 Stock Plan and forms of agreement thereunder. |
|
10.3 (5)*
|
Form of Amendment No.1 to Stock Option Agreement between the Company and certain Option Holders under the 1995 Stock Option Plan. |
|
10.4 (6)*
|
1999 Nonstatutory Stock Option Plan. |
|
10.5 (7)*
|
2004 Equity Incentive Plan and forms of agreement thereunder. |
|
10.6 (8)*
|
Form of Management Incentive Variable Compensation Plan between the Company and certain eligible participants. |
|
10.7 (9)*
|
Form of Employment Agreement dated January 21, 2009 between the Company and the officers of the Company. |
|
10.8 (10)
|
Standard Industrial /Commercial Multi-Tenant Lease by and between Del Norte Farms, Inc. and the Company dated October 24, 2006 (assigned to Newark Eureka Industrial Capital, LLC September 17, 2007 |
|
10.9 (11)
|
Second Amendment to Standard Industrial/Commercial Multi-Lessee Lease - Net dated August 30, 2010 |
|
10.10 (12)
|
Amended and Restated Securities Purchase Agreement between the Company and the investor listed on Exhibit A attached thereto dated November 19, 2010. |
|
10.11 (12)
|
Registration Rights Agreement between the Company and the purchaser listed on Exhibit A attached thereto dated May 18, 2009. |
|
10.12 (12)
|
Senior Secured Convertible Note issued November 19, 2010 by the Company to the Investor |
|
10.13 (12)
|
Warrants for the Purchase of Shares of Common Stock issued November 19, 2010 to the Investor and the Placement Agent in connection with a private placement. |
78
|
Exhibit
Number
|
Description
|
| 10.14 (13) | Securities Purchase Agreement between the Company and the investor listed on Exhibit A attached thereto dated February 23, 2011. |
| 10.15 (13) | Registration Rights Agreement between the Company and the investor listed on Exhibit A attached thereto dated February 23, 2011. |
| 11.1 | Computation of Earnings per Share (see Statements of Operations in Item 8). |
| 14.1 (14) | Code of Business Conduct and Ethics. |
|
23.1
|
Consent of Moss Adams LLP, Independent Registered Public Accounting Firm. |
| 31.1 | Certification of Chief Executive Officer pursuant to Section 302 of the Sarbanes-Oxley Act of 2002. |
| 31.2 | Certification of Chief Financial Officer pursuant to Section 302 of the Sarbanes-Oxley Act of 2002. |
| 32.1 | Certification of Chief Executive Officer and Chief Financial Officer pursuant to Section 906 of the Sarbanes-Oxley Act of 2002. |
|
_________ (2) Incorporated by reference to exhibits filed with the Company's Form 8-K filed on February 20, 2008. (3) Incorporated by reference to exhibits filed with the Company's Form 8-K filed on January 27, 2009. (4) Incorporated by reference to exhibits filed with Company's Registration Statement on Form SB 2 (File No. 33 91210 LA) filed on June 2, 1995 and declared effective on October 20, 2000. (5) Incorporated by reference to exhibits filed with the Company's Form 10-KSB filed on March 30, 1998. |
79
|
(6) Incorporated by reference to exhibits filed with the Company's Form 10-QSB filed on August 16, 1999. (7) Incorporated by reference to Appendix C filed with the Company's Form DEF 14A filed on April 29, 2004. (8) Incorporated by reference to Appendix B filed with the Company's Form DEF 14A filed on March 16, 2011. (9) Incorporated by reference to exhibits filed with the Company's Form 8-K filed on January 27, 2009. (10) Incorporated by reference to exhibits filed with the Company's Form 10-Q filed on November 13, 2006. (11) Incorporated by reference to exhibits filed with the Company's Form 8-K filed on August 30, 2010. (12) Incorporated by reference to exhibits filed with the Company's Form 8-K filed on November 19, 2010. (13) Incorporated by reference to exhibits filed with the Company's Form 8-K filed on February 23, 2010. (14) Incorporated by reference to exhibits filed with the Company's Form 10-K filed on March 10, 2006. |
80