Attached files
| file | filename |
|---|---|
| EXCEL - IDEA: XBRL DOCUMENT - SOCKET MOBILE, INC. | Financial_Report.xls |
| EX-23 - EXHIBIT 23.1 - SOCKET MOBILE, INC. | k10ex23_1.htm |
| EX-31 - EXHIBIT 31.2 - SOCKET MOBILE, INC. | k10ex31_2.htm |
| EX-31 - EXHIBIT 31.1 - SOCKET MOBILE, INC. | k10ex31_1.htm |
| EX-32 - EXHIBIT 32.1 - SOCKET MOBILE, INC. | k10ex32_1.htm |
UNITED STATES
SECURITIES AND EXCHANGE COMMISSION
WASHINGTON, DC 20549
FORM 10-K
| (X) | ANNUAL REPORT PURSUANT TO SECTION 13 or 15(d) OF THE SECURITIES EXCHANGE ACT OF 1934 |
For the fiscal year ended December 31, 2014
( ) TRANSITION REPORT PURSUANT TO SECTION 13 OR 15(d) OF THE SECURITIES EXCHANGE ACT OF 1934 For the transition period from _______ to _______.
Commission file number 1-13810

SOCKET MOBILE, INC.
(Exact name of registrant as specified in its charter)
| Delaware | 94-3155066 | |
(State or other jurisdiction of incorporation or organization) |
(IRS Employer Identification No.) |
39700 Eureka Drive, Newark, CA 94560
(Address of principal executive offices including zip code)
(510) 933-3000
(Registrant’s telephone number, including area code)
Securities registered pursuant to Section 12(b) of the Exchange Act:
| Title of Each Class | Name of Exchange on Which Registered | |
| Common Stock, $0.001 Par Value per Share | OTCQB |
Securities registered pursuant to Section 12(g) of the Exchange Act:
None
Indicate by check mark if the registrant is a well-known seasoned issuer, as defined in Rule 405 of the Securities Act. YES [ ] NO [X]
Indicate by check mark if the registrant is not required to file reports pursuant to Section 13 or Section 15(d) of the Act. YES [ ] NO [X]
Indicate by check mark whether the registrant (1) has filed all reports required to be filed by Section 13 or 15(d) of the Securities Exchange Act of 1934 during the preceding 12 months (or for such shorter period that the registrant was required to file such reports), and (2) has been subject to such filing requirements for the past 90 days. YES [X] NO [ ]
Indicate by check mark whether the registrant has submitted electronically and posted on its corporate Web site, if any, every Interactive Data File required to be submitted and posted pursuant to Rule405 of Regulation S-T (§ 232.405 of this chapter) during the preceding 12 months (or for such shorter period that the registrant was required to submit and post such files). YES [ X ] NO [ ]
Indicate by check mark if disclosure of delinquent filers pursuant to Item 405 of Regulation S-K (§ 229.405 of this chapter) is not contained herein, and will not be contained, to the best of registrant’s knowledge, in definitive proxy or information statements incorporated by reference in Part III of this Form 10-K or any amendment to this Form 10-K. [X]
Indicate by check mark whether the registrant is a large accelerated filer, an accelerated filer, a non-accelerated filer, or a smaller reporting company. See the definitions of “large accelerated filer,” “accelerated filer,” and “smaller reporting company” in Rule 12b-2 of the Exchange Act.
Large accelerated filer [ ] Accelerated filer [ ] Non-accelerated filer [ ] Smaller reporting company [X]
Indicate by check mark whether the registrant is a shell company (as defined in Rule 12b-2 of the Exchange Act). YES [ ] NO [X]
As of June 30, 2014, the aggregate market value of the registrant’s Common Stock ($0.001 par value) held by non-affiliates of the registrant was $8,139,917 based on the closing sale price as reported on the Over the Counter Marketplace system.
Number of shares of Common Stock ($0.001 par value) outstanding as of March 23, 2015: 5,544,230 shares
DOCUMENTS INCORPORATED BY REFERENCE
Items 10, 11, 12, 13, and 14 of Part III are incorporated by reference from the Registrant’s Proxy Statement for the Annual Meeting of Stockholders to be held on June 4, 2015. Such Proxy Statement will be filed within 120 days after the end of the fiscal year covered by this Annual Report on Form 10-K.
This Annual Report contains forward-looking statements within the meaning of Section 27A of the Securities Act of 1933, as amended, and Section 21E of the Securities Exchange Act of 1934, as amended. These statements include statements forecasting our future financial condition and results, our future operating activities, market acceptance of our products, expectations for general market growth of handheld computers and other mobile computing devices, growth in demand for our barcode scanning products, expansion of the markets that we serve, expansion of the distribution channels for our products, adoption of our embedded products by third-party manufacturers of electronic devices, and the timing of the introduction and availability of new products, as well as other forecasts discussed under “Management’s Discussion and Analysis of Financial Condition and Results of Operations.” Words such as “may,” “will,” “predicts,” “anticipates,” “expects,” “intends,” “plans,” “believes,” “seeks,” “estimates,” variations of such words, and similar expressions are intended to identify such forward-looking statements. Such forward-looking statements are based on current expectations, estimates, and projections about our industry, management’s beliefs, and assumptions made by management. These forward-looking statements are not guarantees of future performance and are subject to certain risks, uncertainties, and assumptions that are difficult to predict; therefore, actual results and outcomes may differ materially from what is expressed or forecasted in any such forward looking statements. Factors that could cause actual results and outcomes to differ materially include, but are not limited to: continued weakness in the U.S. and world economy generally and in the markets we serve in particular; the risk of delays in the availability of our products due to technological, market or financial factors including the availability of product components and necessary working capital; our ability to successfully develop, introduce and market future products; our ability to effectively manage and contain our operating costs; the availability of announced third-party handheld computer hardware and software that our products are intended to work with; product delays associated with new model introductions and product changeovers by the makers of products that our products are intended to work with; continued growth in demand for handheld computers and barcode scanners; market acceptance of emerging standards such as Bluetooth® and wireless LAN and of our related connection, data collection and mobile handheld computer products; the ability of our strategic relationships to benefit our business as expected; our ability to enter into additional distribution relationships; or other factors described in this Form 10-K including “Item 1A. Risk Factors” and recent Form 8-K and Form 10-Q reports filed with the Securities and Exchange Commission. We assume no obligation to update such forward-looking statements or to update the reasons why actual results could differ materially from those anticipated in such forward-looking statements.
You should read the following discussion in conjunction with the financial statements and notes included elsewhere in this report, and other information contained in other reports and documents filed from time to time with the Securities and Exchange Commission.
The Company
We are a leading producer of mobile cordless barcode scanners for the business mobility markets. Our 2014 barcode scanner revenue grew by 40% over 2013 to $13.7 million, generating 80 percent of our 2014 revenue compared to 62 percent of our revenue in 2013. Our barcode scanner products are designed for a mobile worker using applications running on mobile devices while walking or standing. We offer easy-to-use software developer kits (SDK) to application developers which enable the integration of our barcode scanning software into mobile applications running on smartphones, tablets and mobile computers. These devices use operating systems from Apple® (iOS), Google™ (Android™) and Microsoft® (Windows®/Windows Mobile™). We focus on serving the needs of application developers as our barcode scanner sales are application driven. Once we are built into an application, our products become an ingredient of the application solution and our products are marketed by the application developer or their resellers as part of that solution. Our registered developer program for barcode scanning has grown from 700 developers at the beginning of 2014 to 1,300 developers at the beginning of 2015. Our growth in 2014 was driven by mobile point of sale applications running on Apple tablets. Registered developers are developing applications for other mobile markets including hospitality and commercial services. We offer stand-alone barcode scanning models for both 1D (imager and laser) and 2D barcode scanning in standard cases (in 5 vivid colors) and durable cases. Our 7 Series barcode scanners are designed as handheld while our 8 Series barcode scanners are designed to be attachable to smartphones, but can also be used in handheld mode. All connect cordlessly over Bluetooth with applications running on a smartphone, tablet or mobile computer.
1 |
We also offer a classic handheld mobile computer running Windows Embedded 6.5 operating system from Microsoft. Handheld computer revenue in 2014 was $3.3 million, a decline of 38 percent from revenue of $5.3 million in 2013. Handheld computer revenue has been in decline for several years reflecting the movement of developers away from Windows Embedded devices to smartphones and tablets. Service revenue in 2014 of $0.6 million comprised the balance of our 2014 revenue.
We design our own products, test and assemble product components obtained from third party contract manufacturers. We perform final product assembly, test, package, and distribute our products at and from our Newark, California facility. We offer our products worldwide through two-tier distribution enabling customers to purchase from a large number of on-line resellers around the world including some application developers. We believe growth in mobile applications and the mobile workforce are resulting from technical advances in mobile technologies, cost reductions in mobile devices and the growing adoption by businesses of mobile applications, building a growing demand for our products. Our barcode scanning products address the growing need for speed and accuracy by today’s mobile workers, thereby enhancing their productivity and allowing them to exploit time sensitive opportunities and improve customer satisfaction.
Products
Cordless barcode scanners
We offer a family of cordless barcode scanning products that connect over Bluetooth with smartphones, tablets and mobile computers running operating systems from Apple (iOS), Google (Android), and Microsoft (Windows/Windows Mobile). Our cordless barcode scanners include two dimensional (2D) and linear (1D laser and 1D imager) barcode scanners in both durable and colorful cases. Our series 7 models are lightweight and ergonomically designed as handheld barcode scanners and are widely used with tablet computers. Our series 8 models can be used as handheld or attached to a smartphone to enable one-handed barcode scanning. We also offer wearable cordless ring scanners for hands free barcode scanning. Extended warranty programs are available for all of our barcode scanning products. In 2014, our cordless barcode scanning revenue represented 80 percent of total revenue compared to 62 percent in 2013, and increased 40 percent over 2013.
2 |
Handheld Computers
We offer a family of SoMo® (“Socket® Mobile”) handheld computer products with antimicrobial cases running the Windows Embedded Handheld System 6.5 operating system. Handheld computer accessories include plug-in 1D and 2D barcode scanners, charging cradles, durable cases, and radio frequency identification (RFID) readers with NFC (near field communication). Our handheld computers are designed with wireless LAN (802.11 b/g/n) and Bluetooth connectivity for use with applications that do not require phones. Our newest family of handheld computers, SoMo Model 655, commenced sales in June 2012, replacing the SoMo650 introduced in 2007. In 2014, our handheld computer revenues were $3.3 million or 19 percent of total revenue compared to revenue of $5.3 million or 34 percent of total revenue in 2013.
Service
Our products are warranted for one year and we offer SocketCare extended warranty programs for up to three years including repair or replacement due to accidental breakage. We will also repair or replace products that are beyond their warranty period.
Registered Developers and Developer Support Programs
Barcode Scanning. We offer a barcode scanning software developer kit (SDK) to registered software application developers. Our barcode scanning SDK enables developers to easily integrate Socket’s SocketScan barcode scanning software into their applications. When integrated, the application owns the barcode scanner and controls its behavior. The SocketScan software works with smartphones, tablets and mobile computers using operating systems from Apple (iOS), Google (Android), and Microsoft (Windows and Windows Mobile).
Handheld Computers. Our SDK for the SoMo 655 handheld computer was introduced in the second half of 2012 and enables registered developers to avail themselves of features on our SoMo655 handheld computer that would not otherwise be accessible on the SoMo655 operating system, Windows Embedded 6.5.
Registered developers and developer support. Registered developers consist of third party application providers and developers developing in-house solutions for businesses. As of March 2015 we had more than 1,200 registered developers. Most of the registered developers are registered to use the barcode scanning SDK. The primary segments being addressed by barcode scanning registered developers are mobile point of sale, hospitality and commercial services. We support our registered developers with periodic software updates and assistance and solicit their feedback in considering future product improvements and direction.
General
Total employee headcount on December 31, 2014 was 50. We subcontract the manufacturing of all of our product components to independent third-party contract manufacturers located in the United States, Mexico, Taiwan and Singapore that have the equipment, know-how and capacity to manufacture products to our specifications. We assemble, test and distribute our products from our facilities in Newark, California. Our handheld computers and data collection products are sold through a worldwide network of distributors and on-line resellers, application developers, and value added resellers.
3 |
We were founded in March 1992 as Socket Communications, Inc. and reincorporated in Delaware in 1995 prior to our initial public offering in June 1995. We have financed our operations since inception primarily from the sale of equity capital or convertible debt and a receivables-based revolving line of credit with our bank. We began doing business as Socket Mobile, Inc. in January 2007 to better reflect our market focus on the mobile business market and changed our legal name to Socket Mobile, Inc. in April 2008. Our common stock trades on the OTCQB Market under the symbol “SCKT”. Our principal executive offices are located at 39700 Eureka Drive, Newark, CA 94560, and our phone number is (510) 933-3000. Our Internet home page is located at http://www.socketmobile.com; however, the information on, or that can be accessed through, our home page is not part of this Annual Report. Our annual reports on Form 10-K, quarterly reports on Form 10-Q, current reports on Form 8-K, and any amendments to such reports are available free of charge on or through our Internet home page, as soon as reasonably practical after we electronically file such material with, or furnish it to, the Securities and Exchange Commission.
Marketing Strategy and Dynamics
Capitalize on Strategic Relationships. We actively promote software application developers to integrate our products into their applications through our registered developer program. We provide easy to use software developer kits (SDK), training and technical support to our registered developers. We support the marketing activities of our registered developers in promoting the applications that include our products. Once our barcode scanning products are integrated into a developer’s application, our products become part of the application solution and are part of the marketing program for that application. We stay current on operating system updates provided by Apple, Google and Microsoft to support new products running the latest versions of their operating systems on smartphones, tablets and mobile computers while providing backward compatibility. We spend extensive engineering time and resources to ensure that our cordless barcode scanning products are compatible with a wide variety of the most popular smartphones, tablets and mobile computers running a variety of operating systems. We adhere to standards of a number of standards setting bodies whose technologies are used in our products including Bluetooth (both handheld computers and cordless barcode scanners) and wireless LAN (handheld computers).
Markets. Our growth in 2014 was driven by sales of barcode scanners integrated into retail mobile point of sale applications for use with Apple tablets. Many developers of mobile point of sale applications have been funded by venture capital enabling their rapid development and growth. Other mobile markets being addressed by registered developers include hospitality and commercial services. We expect all of these markets to increase the availability and use of mobile applications and the demand for mobile barcode scanners. Our SoMo handheld computer is used in health care, hospitality and commercial services applications.
Expand and improve our product offerings. We offer a wide range of products that enable application developers and their customers to design their mobile systems to meet their specific requirements, and we encourage our distributors to support the full range of our products. The goal is for customers to view Socket as a primary source for their mobile barcode scanning needs. Within our family of barcode scanning products, we offer durable and standard cases (the latter in multiple colors), linear imaging and laser barcode scanning, 2D barcode scanning, and two form factors: an ergonomically designed handheld cordless barcode scanner (our model 7 series) and a smartphone attachable barcode scanner (our model 8 series) to enable one-handed barcode scanning. Both series 7 and series 8 products connect cordlessly over Bluetooth and may be used as handheld barcode scanners. We design our products to comply with the regulations of the many worldwide agencies that regulate the safety, performance and use of electronic products. For the SoMo family of handheld computers, we’ve upgraded the operating system and management software, adding many operating system features such as multiple language support, upgraded to later versions of the Windows (Mobile) embedded handheld operating system, and upgraded our Bluetooth and wireless LAN management software.
4 |
Price our products competitively and available worldwide. We have designed our products to be priced competitively although we are subject from time to time to changes in component pricing by our suppliers. We update our products from time to time and work with our vendors to achieve reductions in component pricing. We distribute our products through a worldwide distribution network that places products into geographic regions to shorten purchasing times and provides a credit shield to us. Our largest distributors are Ingram Micro®, ScanSource® and BlueStar, and they support a worldwide network of on-line resellers including Amazon®.com, CDW® and Barcodes, Inc.
Build a Strong Brand Name. We believe that our products make a difference in the daily work life of mobile workers and the people they serve. We are building a brand image focused on business mobility. This image closely associates us with business mobility solutions and to reflect this image, we began doing business as Socket Mobile, Inc. in January 2007 and changed our legal name to Socket Mobile, Inc. in April 2008. We stress with customers the design of our products for the markets they address, emphasizing quality and standards-based connectivity. Mobility requires products that are compact and designed to be handled while mobile, with low power consumption to extend time between charges, and easy to use. We strive to offer high performance products in a wide range of competitive prices. Through our developer support program, we work closely with application developers developing productivity enhancing applications for the mobile workforce. Our overall company brand identity and positioning goal is to be a leading provider of easy-to-deploy business mobility systems to the business mobility market.
Competition and Competitive Risks
The overall market for mobile handheld computing solutions is both complex and competitive. Our barcode scanning hardware products compete with similar hardware products in all of our markets in the United States, Europe and Asia and we differentiate our products with our SocketScan software and software developer kits (SDK). Our longtime focus on creating innovative mobile solutions for the mobile workforce has resulted in good brand name recognition and reputation. We believe that our brand name identifies our products as durable, dependable, small form factor, low power and easy to use, all features designed for a mobile worker while mobile, and the breadth of our product offerings, including the extensive features of our software and software developer kits (SDK), will continue to differentiate us relative to our competitors.
5 |
Cordless Barcode Scanning. We offer a full range of handheld cordless barcode scanners connecting to smartphones, tablets and other computing devices over Bluetooth. Our SocketScan Software Developer Kit (SDK) enables registered third party application developers to integrate the features of our SocketScan software into their applications and helps differentiate our products. We face competition from products similar to our cordless hand scanners from Koamtec, Code Corporation, and Opticon (Japan). Barcodes may also be scanned using the built-in camera in smartphones or tablets with the applications like Scanit or Manatee Works. However, scanning using the built-in camera is typically slower and more awkward especially as the devices get larger. Users may choose a barcode scanner that connects directly to an Apple tablet, iPhone or computer such as offered by Infinite Peripherals and Honeywell. Users also may choose more rugged barcode scanners as an alternative, some of which are integrated into computing devices from manufacturers such as Datalogic, Honeywell®, and Zebra Technologies. Many of these devices are not Apple certified. Many connect to Apple devices over Bluetooth in keyboard emulation mode, and do not offer extensive tools for software developers such as our software developer kit (SDK) to integrate features of our sophisticated barcode scanning software SocketScan into barcode scanning applications.
Handheld Computers. A number of larger, well financed companies manufacture handheld mobile computers. Most of the manufacturers offer only ruggedized systems that are higher priced and larger than our devices but are capable of running the same applications. Many of these systems have built in barcode scanners, are larger, heavier and more expensive, so do not directly compete with our products but are an alternative. These companies include Datalogic, Honeywell®, and Zebra Technologies. Consumer grade products (durable rather than rugged) also provide competitive alternatives to our products. These companies include Bluebird (selling under the brand name Pidion), Unitek and Janam and some of their products include integrated barcode scanners.
Our SoMo655 handheld computer’s operating system is Windows Embedded Handheld 6.5. Microsoft recently announced it would continue to support version 6.5 until 2020 which was designed to assure users of products running this version of a long period of continued support. Microsoft also announced Windows Mobile 8 Embedded, a superset of their phone operating systems for devices having phones and integrated barcode scanners. Windows Mobile 8 Embedded does not apply to our category of handheld computer which has neither a phone nor an integrated barcode scanner as our customers typically operate over wireless LAN and Bluetooth connections within the walls of their organization and do not require a phone. We do not directly compete with devices running Windows Mobile 8 Embedded but they can become competitive alternatives where a phone and an integrated scanner are needed.
Sales of our handheld computer family of products, the SoMo650, introduced in 2007 and replaced in 2012 with the SoMo655, are designed as a close replacement for classic PDAs such as the Hewlett-Packard Series 200 family of handheld computer products that were discontinued by Hewlett-Packard in 2011. We have enhanced our product offerings with a software developer kit (SDK) that enables registered developers to avail themselves of features on our SoMo655 handheld computer that would not otherwise be accessible under the Windows Embedded 6.5 operating system. Sales of handheld mobile computers have been in decline over the past several years as many application developers have been developing mobile applications for smartphones and tablets running Apple (iOS) and Google (Android) operating systems. More than 80,000 SoMo handheld computers have been sold since 2007.
6 |
Proprietary Technology and Intellectual Property
We have been granted 31 U.S. patents and 10 design patents and have other patent applications under review.. We have registered trademarks with the U.S. Patent and Trademark Office for the mark “Socket”, our logo, the terms “Go-WiFi” and “Battery Friendly” and “SoMo”, the mark associated with our mobile handheld computers.
We have developed a number of technological building blocks that enhance our ability to design new hardware and software products, to offer products which run on multiple software and hardware platforms, and to manufacture and package products efficiently.
We own and control the design of our barcode scanners and our SoMo handheld computer, enabling us to modify its features or software to meet specific customer requirements.
Building on our expertise in embedded radio-dependent firmware, within our Bluetooth cordless products are software and firmware that include a wide variety of functions to enable efficient radio control and overall systems functionality. For cordless barcode scanning this includes our patented Error Proof Protocol, which is designed to ensure that scanned data is correctly received by the mobile computing device and allows for real-time validation of data and error notification to the user. We have developed SocketScan barcode scanning software that allows our products to communicate with applications on smartphones and tablets running operating systems from Apple (iOS), Google (Android), and Microsoft (Windows and Windows Mobile).
We have developed a number of software programs that provide unique functions and features for our cordless barcode scanning and handheld computer products. For example, our SocketScan software enables all of our barcode scanning products to scan a variety of barcodes and to route the scanned data to many different types of data files on a number of operating systems used in mobile devices. Our Bluetooth software used in conjunction with our Bluetooth hardware provides a completely functional Bluetooth solution enabling connections and data transfers between Bluetooth-enabled devices. Our wireless local area network software called Enhanced Wi-Fi Companion included with our handheld computers provides an extensive set of features to help the user get and stay connected. This software program used in conjunction with our handheld computers provides a completely functional wireless local area network solution enabling connections and data transfers from and to our mobile computers over wireless local area networks. In addition, our Bluetooth and wireless LAN software programs are aligned to insure optimal performance even when both technologies are being utilized at the same time.
We rely on a combination of patent, copyright, trademark and trade secret laws, and confidentiality procedures to protect our proprietary rights. As part of our confidentiality procedures, we generally enter into non-disclosure agreements with our employees, distributors and strategic partners, and limit access to our software, documentation and other proprietary information. Despite these precautions, it may be possible for a third-party to copy or otherwise obtain and use our products or technology without authorization, or to develop similar technology independently. In addition, we may not be able to effectively protect our intellectual property rights in certain foreign countries. From time to time we receive communications from third parties asserting that our products infringe, or may infringe, their proprietary rights. In connection with any such claims, litigation could be brought against us that could result in significant additional expense or compel us to discontinue or redesign some of our products.
7 |
Personnel
Our future success will depend in significant part upon the continued service of certain of our key technical and senior management personnel, and our continuing ability to attract, assimilate and retain highly qualified technical, managerial and sales and marketing personnel. Our total employee headcount as of December 31, 2014 was 50. Our employees are not represented by a union, and we consider our employee relationships to be good. As of December 31, 2014, we had 15 persons in sales, marketing and customer service, 9 persons in development engineering, 8 persons in finance and administration, and 18 persons in operations.
Our ability to continue as a going concern is dependent upon our ability to maintain ongoing profitable operations and to increase our capital.
Our historical operating losses and declines in our working capital balances are conditions that raise substantial doubt about our ability to continue as a going concern. Our ability to continue as a going concern is dependent upon our ability to maintain ongoing profitable operations and to increase our capital as needed. We have been taking steps intended to improve operating results and achieve future profitability including the introduction of new products, continued close support of our distributors and of our application partners as they establish their mobile applications in key vertical markets, and management of our costs. Our operations in 2014 were profitable and we increased our capital during the year by $895,000. We believe that we will be able to continue to improve our liquidity and secure additional sources of financing by managing our working capital balances, use of our bank lines of credit, and raising additional capital as needed including the exercising of warrants and stock options and the issuance of additional equity securities. Nonetheless, there can be no assurance that we will be successful in achieving any of these steps, and there can be no assurance that additional financing will be available on acceptable terms, if at all, and any such terms may be dilutive to existing stockholders. Our inability to secure and maintain the necessary liquidity would have a material adverse effect on our financial condition and results of operations. Our financial statements do not include any adjustments to reflect the possible future effects on the recoverability and classification of assets or the amounts and classification of assets and liabilities that may result from our inability to continue as a going concern.
We have a history of operating losses and may not maintain ongoing profitability.
We were profitable in 2014. However, except for fiscal years 2014 and 2004, we incurred significant operating losses in each financial period since our inception. To maintain ongoing profitability, we must accomplish numerous objectives, including continued growth in our business, ongoing support to registered developers whose applications support the use of our barcode scanning products, and the development of successful new products. We cannot foresee with any certainty whether we will be able to achieve these objectives in the future. Accordingly, we may not generate sufficient net revenue or manage our expenses sufficiently to maintain ongoing profitability. If we cannot maintain ongoing profitability, we will not be able to support our operations from positive cash flows, and we would use our existing cash to support operating losses. If we are unable to secure the necessary capital to replace that cash, we may need to suspend some or all of our current operations.
8 |
We may require additional capital in the future, but that capital may not be available on reasonable terms, if at all, or on terms that would not cause substantial dilution to your stock holdings.
We may incur operating losses in future quarters and would need to raise capital to fund such losses. Our forecasts are highly dependent on factors beyond our control, including market acceptance of our products and delays in deployments by businesses of applications that use our
handheld computers and our data collection products. Even if we maintain profitable operating levels, we may need to raise capital to provide sufficient working capital to fund our growth. If capital requirements vary materially from those currently planned, we may require additional capital sooner than expected. There can be no assurance that such capital will be available in sufficient amounts or on terms acceptable to us, if at all.
If application developers are not successful in their efforts to develop, market and sell their applications into which our software and products are incorporated, we may not achieve our sales projections.
We are dependent upon application developers to integrate our scanning and software products into their applications designed for mobile workers using smartphones, tablets and mobile computers, and to successfully market and sell those application products and solutions into the marketplace. We focus on serving the needs of application developers as sales of our barcode scanners are application driven. However, these developers may take considerable time to complete development of their applications, may experience delays in their development timelines, may develop competing applications, may be unsuccessful in marketing and selling their application products and solutions to customers, or may experience delays in customer deployments and implementations, which would adversely affect our ability to achieve our revenue projections.
Global economic conditions may continue to have a negative impact on our business and financial condition in ways that we currently cannot predict, and may further limit our ability to raise additional funds.
Continued tight credit and related strains in the global financial system, particularly in Europe and Asia, may continue to have an impact on our business and our financial condition. We may face significant challenges if economic conditions and conditions in the financial markets do not improve or continue to worsen. In particular, should these conditions cause our revenues to be materially less than forecast, we may find it necessary to initiate further reductions in our expenses and defer product development programs. In addition, our ability to access the capital markets and raise funds required for our operations may be severely restricted at a time when we would like, or need, to do so, which could have an adverse effect on our ability to meet our current and future funding requirements and on our flexibility to react to changing economic and business conditions.
9 |
Our quarterly operating results may fluctuate in future periods, which could cause our stock price to decline.
We expect to experience quarterly fluctuations in operating results in the future. We generally ship orders as received, and as a result we may have little backlog. Quarterly revenues and operating results therefore depend on the volume and timing of orders received during the quarter, which are difficult to forecast. Historically, we have often recognized a substantial portion of our revenue in the last month of the quarter. This subjects us to the risk that even modest delays in orders or in the manufacture of products relating to orders received, may adversely affect our quarterly operating results. Our operating results may also fluctuate due to factors such as:
| • | the demand for our products; |
| • | the size and timing of customer orders; |
| • | unanticipated delays or problems in our introduction of new products and product enhancements; |
| • | the introduction of new products and product enhancements by our competitors; |
| • | the timing of the introduction and deployments of new applications that work with our products; |
| • | changes in the revenues attributable to royalties and engineering development services; |
| • | product mix; |
| • | timing of software enhancements; |
| • | changes in the level of operating expenses; |
| • | competitive conditions in the industry including competitive pressures resulting in lower average selling prices; |
| • | timing of distributors’ shipments to their customers; |
| • | delays in supplies of key components used in the manufacturing of our products, and |
| • | general economic conditions and conditions specific to our customers’ industries. |
Because we base our staffing and other operating expenses on anticipated revenues, unanticipated declines or delays in the receipt of orders can cause significant variations in operating results from quarter to quarter. As a result of any of the foregoing factors, or a combination, our results of operations in any given quarter may be below the expectations of public market analysts or investors, in which case the market price of our common stock would be adversely affected.
In order to maintain the availability of our bank lines of credit we must remain in compliance with the covenants as specified under the terms of the credit agreements and the bank may exercise discretion in making advances to us.
Our credit agreements with our bank requires us to maintain cash and qualified receivables that are at least two times amounts borrowed and outstanding under the credit agreements. The agreements contain customary representations, warranties, covenants and events of default that limit our ability to incur additional liens or indebtedness, make distributions to our stockholders and make investments. The events of default entitle our bank to accelerate our obligations and require repayment of our outstanding indebtedness thereunder. These events of default include a breach of our payment obligations or covenants, a material impairment in our financial condition or ability to repay any indebtedness to our bank and the commencement of dissolution or insolvency proceedings. The agreement may be terminated by us or by our bank at any time. Upon such termination, our bank would no longer make advances under the credit agreement and outstanding advances would be repaid as receivables are collected. All advances are at our bank’s discretion and our bank is not obligated to make advances. Our bank has been granted a first priority security interest in all of our assets, including our intellectual property.
10 |
Goodwill comprises a significant portion of our assets and may be subject to impairment write-downs in future periods which would substantially increase our losses, make it more difficult to achieve profitability, and could cause our stock price to decline.
We review our goodwill for impairment at least annually as of September 30th, and more often if factors suggest potential impairment. Many factors are considered in evaluating goodwill including our market capitalization, comparable companies within our industry, our estimates of our future performance, and discounted cash flow analysis. Many of these factors are highly subjective and may be negatively impacted by our financial results and market conditions in the future. We may incur goodwill impairment charges in the future and any future write-downs of our goodwill would adversely affect our operating results, make it more difficult to maintain profitability, and as a result the market price of our common stock could be adversely affected.
We may be unable to manufacture our products, because we are dependent on a limited number of qualified suppliers for our components.
Several of our component parts, including our barcode scanning modules, and our line of mobile handheld computers, are produced by one or a limited number of suppliers. Shortages or delays could occur in these essential components due to an interruption of supply or increased demand in the industry. Suppliers may choose to restrict credit terms or require advance payment causing delays in the procurement of essential materials. If we are unable to procure certain component parts, we could be required to reduce our operations while we seek alternative sources for these components, which could have a material adverse effect on our financial results. To the extent that we acquire extra inventory stocks to protect against possible shortages, we would be exposed to additional risks associated with holding inventory, such as obsolescence, excess quantities, or loss.
If application developers are not successful in their efforts to develop, market, and sell their applications into which our software and products are incorporated, we may not achieve our sales projections.
We are dependent upon application developers to integrate our scanning software and scanning products into their applications designed for mobile workers using smartphones, tablets and mobile computers, and to successfully market and sell those application products and solutions into the marketplace. We focus on serving the needs of application developers as sales of our barcode scanners are application driven. However, these developers may take considerable time to complete development of their applications, may experience delays in their development timelines, may develop applications that support competitive alternatives to our barcode scanners, may be unsuccessful in marketing and selling their application products and solutions to customers, or may experience delays in customer deployments and implementations, which would adversely affect our ability to achieve our revenue projections.
11 |
If we fail to develop and introduce new products rapidly and successfully, we will not be able to compete effectively, and our ability to generate sufficient revenues will be negatively affected.
The market for our products is prone to rapidly changing technology, evolving industry standards and short product life cycles. If we are unsuccessful at developing and introducing new products and services on a timely basis that include the latest technologies conform to the newest standards and that are appealing to end users, we will not be able to compete effectively, and our ability to generate significant revenues will be seriously harmed.
The development of new products and services can be very difficult and requires high levels of innovation. The development process is also lengthy and costly. Short product life cycles for smartphones and tablets expose our products to the risk of obsolescence and require frequent new product upgrades and introductions. We will be unable to introduce new products and services into the market on a timely basis and compete successfully, if we fail to:
| • | invest significant resources in research and development, sales and marketing, and customer support; |
| • | identify emerging trends, demands and standards in the field of mobile computing products; |
| • | enhance our products by adding additional features; |
| • | maintain superior or competitive performance in our products; and |
| • | anticipate our end users’ needs and technological trends accurately. |
We cannot be sure that we will have sufficient resources to make adequate investments in research and development or that we will be able to identify trends or make the technological advances necessary to be competitive.
A significant portion of our revenue currently comes from a limited number of distributors, and any decrease in revenue from these distributors could harm our business.
A significant portion of our revenue comes from a limited number of distributors. In fiscal years 2014 and 2013, Ingram Micro Inc., ScanSource, Inc., and BlueStar, Inc. together represented approximately 67% and 55%, respectively, of our worldwide revenues. We expect that a significant portion of our revenue will continue to depend on sales to a limited number of distributors. We do not have long-term commitments from our distributors to carry our products, and any of our distributors may from quarter to quarter comprise a significant concentration of our revenues. Any could choose to stop selling some or all of our products at any time, and each of these companies also carries our competitors’ products. If we lose our relationship with any of our significant distributors, we would experience disruption and delays in marketing our products.
We may not be able to collect revenues from customers who experience financial difficulties.
Our accounts receivable are derived primarily from distributors. We perform ongoing credit evaluations of our customers’ financial conditions but generally require no collateral from our customers. Reserves are maintained for potential credit losses, and such losses have historically been within such reserves. However, many of our customers may be thinly capitalized and may be prone to failure in adverse market conditions. Although our collection history has been good, from time to time a customer may not pay us because of financial difficulty, bankruptcy or liquidation. Current global financial conditions may have an impact on our customers’ ability to pay us in a timely manner, and consequently, we may experience increased difficulty in collecting our accounts receivable, and we may have to increase our reserves in anticipation of increased uncollectible accounts.
12 |
We could face increased competition in the future, which would adversely affect our financial performance.
The market for mobile handheld computers in which we operate is very competitive. Our future financial performance is contingent on a number of unpredictable factors, including that:
| • | some of our competitors have greater financial, marketing, and technical resources than we do; |
| • | we periodically face intense price competition, particularly when our competitors have excess inventories and discount their prices to clear their inventories; and |
| • | certain manufacturers of tablets, mobile phones and handheld computers offer products with built-in functions, such as Bluetooth wireless technology, Wi-Fi, or barcode scanning, that compete with our products. |
Increased competition could result in price reductions, fewer customer orders, reduced margins, and loss of market share. Our failure to compete successfully against current or future competitors could harm our business, operating results and financial condition.
If we do not correctly anticipate demand for our products, our operating results will suffer.
The demand for our products depends on many factors and is difficult to forecast. We expect that it will become more difficult to forecast demand given current economic conditions as we introduce and support more products, and as competition in the markets for our products intensifies. If demand is lower than forecasted levels, we could have excess production resulting in higher inventories of finished products and components, which could lead to write-downs or write-offs of some or all of the excess inventories, and reductions in our cash balances. Lower than forecasted demand could also result in excess manufacturing capacity at our third-party manufacturers and in our failure to meet minimum purchase commitments, each of which may lower our operating results.
If demand increases beyond forecasted levels, we would have to rapidly increase production at our third-party manufacturers. We depend on suppliers to provide additional volumes of components, and suppliers might not be able to increase production rapidly enough to meet unexpected demand. Even if we were able to procure enough components, our third-party manufacturers might not be able to produce enough of our devices to meet our customer demand. In addition, rapid increases in production levels to meet unanticipated demand could result in higher costs for manufacturing and supply of components and other expenses. These higher costs could lower our profit margins. Further, if production is increased rapidly, manufacturing yields could decline, which may also lower operating results.
13 |
We rely primarily on distributors, resellers, and vertical industry partners to sell our products, and our sales would suffer if any of these third-parties stops selling our products effectively.
Because we sell our products primarily through distributors, resellers, and vertical industry partners, we are subject to risks associated with channel distribution, such as risks related to their inventory levels and support for our products. Our distribution channels may build up inventories in anticipation of growth in their sales. If such growth in their sales does not occur as anticipated, the inventory build-up could contribute to higher levels of product returns. The lack of sales by any one significant participant in our distribution channels could result in excess inventories and adversely affect our operating results and working capital liquidity.
Our agreements with distributors, resellers, and vertical industry partners are generally nonexclusive and may be terminated on short notice by them without cause. Our distributors, resellers, and vertical industry partners are not within our control, are not obligated to purchase products from us, and may offer competitive lines of products simultaneously. Sales growth is contingent in part on our ability to enter into additional distribution relationships and expand our sales channels. We cannot predict whether we will be successful in establishing new distribution relationships, expanding our sales channels or maintaining our existing relationships. A failure to enter into new distribution relationships or to expand our sales channels could adversely impact our ability to grow our sales.
We allow our distribution channels to return a portion of their inventory to us for full credit against other purchases. In addition, in the event we reduce our prices, we credit our distributors for the difference between the purchase price of products remaining in their inventory and our reduced price for such products. Actual returns and price protection may adversely affect future operating results and working capital liquidity by reducing our accounts receivable and increasing our inventory balances, particularly since we seek to continually introduce new and enhanced products and are likely to face increasing price competition.
We depend on alliances and other business relationships with a small number of third-parties, and a disruption in any one of these relationships would hinder our ability to develop and sell our products.
We depend on strategic alliances and business relationships with leading participants in various segments of the mobile applications and mobile handheld computer markets to help us develop and market our products. Our strategic partners may revoke their commitment to our products or services at any time in the future or may develop their own competitive products or services. Accordingly, our strategic relationships may not result in sustained business alliances, successful product or service offerings, or the generation of significant revenues. Failure of one or more of such alliances could result in delay or termination of product development projects, failure to win new customers, or loss of confidence by current or potential customers.
We have devoted significant research and development resources to design products to work with a number of operating systems used in mobile devices including Windows Mobile, Windows CE, Windows 7/Vista/XP, Windows Embedded Handheld, Apple iOS, Google’s Android and to develop our own family of mobile handheld computers. Such design activities have diverted financial and personnel resources from other development projects. These design activities are not undertaken pursuant to any agreement under which Microsoft, Apple, or Google is obligated to collaborate or to support the products produced from such collaboration. Consequently, these organizations may terminate their collaborations with us for a variety of reasons, including our failure to meet agreed-upon standards or for reasons beyond our control, such as changing market conditions, increased competition, discontinued product lines, and product obsolescence.
14 |
Our intellectual property and proprietary rights may be insufficient to protect our competitive position.
Our business depends on our ability to protect our intellectual property. We rely primarily on patent, copyright, trademark, trade secret laws, and other restrictions on disclosure to protect our proprietary technologies. We cannot be sure that these measures will provide meaningful protection for our proprietary technologies and processes. We cannot be sure that any patent issued to us will be sufficient to protect our technology. The failure of any patents to provide protection to our technology would make it easier for our competitors to offer similar products. In connection with our participation in the development of various industry standards, we may be required to license certain of our patents to other parties, including our competitors that develop products based upon the adopted standards.
We also generally enter into confidentiality agreements with our employees, distributors, and strategic partners, and generally control access to our documentation and other proprietary information. Despite these precautions, it may be possible for a third-party to copy or otherwise obtain and use our products, services, or technology without authorization, develop similar technology independently, or design around our patents.
Effective copyright, trademark, and trade secret protection may be unavailable or limited in certain foreign countries.
We may become subject to claims of intellectual property rights infringement, which could result in substantial liability.
In the course of operating our business, we may receive claims of intellectual property infringement or otherwise become aware of potentially relevant patents or other intellectual property rights held by other parties. Many of our competitors have large intellectual property portfolios, including patents that may cover technologies that are relevant to our business. In addition, many smaller companies, universities, and individuals have obtained or applied for patents in areas of technology that may relate to our business. The industry is moving towards aggressive assertion, licensing, and litigation of patents and other intellectual property rights.
If we are unable to obtain and maintain licenses on favorable terms for intellectual property rights required for the manufacture, sale, and use of our products, particularly those products which must comply with industry standard protocols and specifications to be commercially viable, our results of operations or financial condition could be adversely impacted.
15 |
In addition to disputes relating to the validity or alleged infringement of other parties’ rights, we may become involved in disputes relating to our assertion of our own intellectual property rights. Whether we are defending the assertion of intellectual property rights against us or asserting our intellectual property rights against others, intellectual property litigation can be complex, costly, protracted, and highly disruptive to business operations by diverting the attention and energies of management and key technical personnel. Plaintiffs in intellectual property cases often seek injunctive relief, and the measures of damages in intellectual property litigation are complex and often subjective or uncertain. Thus, any adverse determinations in this type of litigation could subject us to significant liabilities and costs.
New industry standards may require us to redesign our products, which could substantially increase our operating expenses.
Standards for the form and functionality of our products are established by standards committees. These independent committees establish standards, which evolve and change over time, for different categories of our products. We must continue to identify and ensure compliance with evolving industry standards so that our products are interoperable and we remain competitive. Unanticipated changes in industry standards could render our products incompatible with products developed by major hardware manufacturers and software developers. Should any major changes, even if anticipated, occur, we would be required to invest significant time and resources to redesign our products to ensure compliance with relevant standards. If our products are not in compliance with prevailing industry standards for a significant period of time, we would miss opportunities to sell our products for use with new hardware components from mobile computer manufacturers and OEMs, thus affecting our business.
Undetected flaws and defects in our products may disrupt product sales and result in expensive and time-consuming remedial action.
Our hardware and software products may contain undetected flaws, which may not be discovered until customers have used the products. From time to time, we may temporarily suspend or delay shipments or divert development resources from other projects to correct a particular product deficiency. Efforts to identify and correct errors and make design changes may be expensive and time consuming. Failure to discover product deficiencies in the future could delay product introductions or shipments, require us to recall previously shipped products to make design modifications, or cause unfavorable publicity, any of which could adversely affect our business and operating results.
The loss of one or more of our senior personnel could harm our existing business.
A number of our officers and senior managers have been employed for nineteen to twenty-one years by us, including our President, Chief Financial Officer, Vice President of Operations and Vice President of Engineering/Chief Technical Officer. Our future success will depend upon the continued service of key officers and senior managers. Competition for officers and senior managers is intense, and there can be no assurance that we will be able to retain our existing senior personnel. The loss of one or more of our officers or key senior managers could adversely affect our ability to compete.
The expensing of options will continue to reduce our operating results such that we may find it necessary to change our business practices to attract and retain employees.
Historically, we have used stock options as a key component of our employee compensation packages. We believe that stock options provide an incentive to our employees to maximize long-term stockholder value and, through the use of vesting, encourage valued employees to remain with us. The expensing of employee stock options adversely affects our net income and earnings per share, will continue to adversely affect future quarters, and will make profitability harder to achieve. In addition, we may decide in response to the effects of expensing stock options on our operating results to reduce the number of stock options granted to employees or to grant options to fewer employees. This could adversely affect our ability to retain existing employees and attract qualified candidates, and also could increase the cash compensation we would have to pay to them.
16 |
If we are unable to attract and retain highly skilled sales and marketing and product development personnel, our ability to develop and market new products and product enhancements will be adversely affected.
We believe our ability to achieve increased revenues and to develop successful new products and product enhancements will depend in part upon our ability to attract and retain highly skilled sales and marketing and product development personnel. Our products involve a number of new and evolving technologies, and we frequently need to apply these technologies to the unique requirements of mobile products. Our personnel must be familiar with both the technologies we support and the unique requirements of the products to which our products connect. Competition for such personnel is intense, and we may not be able to attract and retain such key personnel. In addition, our ability to hire and retain such key personnel will depend upon our ability to raise capital or achieve increased revenue levels to fund the costs associated with such key personnel. Failure to attract and retain such key personnel will adversely affect our ability to develop and market new products and product enhancements.
Our operating results could be harmed by economic, political, regulatory and other risks associated with export sales.
Export sales (sales to customers outside the United States) accounted for approximately 25% and 30% of our revenue in fiscal years 2014 and 2013, respectively. Accordingly, our operating results are subject to the risks inherent in export sales, including:
| • | longer payment cycles; |
| • | unexpected changes in regulatory requirements, import and export restrictions and tariffs; |
| • | difficulties in managing foreign operations; |
| • | the burdens of complying with a variety of foreign laws; |
| • | greater difficulty or delay in accounts receivable collection; |
| • | potentially adverse tax consequences; and |
| • | political and economic instability. |
Our export sales are primarily denominated in United States dollars and in Euros for our sales to European distributors. Accordingly, an increase in the value of the United States dollar relative to foreign currencies could make our products more expensive and therefore potentially less competitive in foreign markets. Declines in the value of the Euro relative to the United States dollar may result in foreign currency losses relating to collection of Euro denominated receivables if left unhedged. Furthermore, the recent economic instability of the Eurozone could have an adverse effect on our business, including the ability of our distributors to sell our products and our ability the collect the related Euro receivables.
17 |
Our operations are vulnerable to interruption by fire, earthquake, power loss, telecommunications failure, and other events beyond our control.
Our corporate headquarters is located near an earthquake fault. The potential impact of a major earthquake on our facilities, infrastructure, and overall business is unknown. Additionally, we may experience electrical power blackouts or natural disasters that could interrupt our business. Should a disaster be widespread, such as a major earthquake, or result in the loss of key personnel, we may not be able to implement our disaster recovery plan in a timely manner. Any losses or damages incurred by us as a result of these events could have a material adverse effect on our business.
Failure to maintain effective internal controls could have a material adverse effect on our business, operating results and stock price.
We have evaluated and will continue to evaluate our internal control procedures in order to satisfy the requirements of Section 404 of the Sarbanes-Oxley Act, which requires an annual management assessment of the design and effectiveness of our internal control over financial reporting. If we fail to maintain the adequacy of our internal controls, as such standards are modified, supplemented or amended from time to time, we may not be able to ensure that we can conclude on an ongoing basis that we have effective internal control over financial reporting in accordance with Section 404 of the Sarbanes-Oxley Act. Moreover, effective internal controls, particularly those related to revenue recognition, are necessary for us to produce reliable financial reports and are important to helping prevent financial fraud. If we cannot provide reliable financial reports or prevent fraud, our business and operating results could be harmed, investors could lose confidence in our reported financial information, and the trading price of our stock could drop significantly.
The sale of a substantial number of shares of our common stock could cause the market price of our common stock to decline.
Sales of a substantial number of shares of our common stock in the public market could adversely affect the market price for our common stock. The market price of our common stock could also decline if one or more of our significant stockholders decided for any reason to sell substantial amounts of our common stock in the public market.
As of March 23, 2015, we had 5,544,230 shares of common stock outstanding. Substantially all of these shares are freely tradable in the public market, either without restriction or subject, in some cases, only to S-3 prospectus delivery requirements and, in other cases, only to manner of sale, volume, and notice requirements of Rule 144 under the Securities Act.
As of March 23, 2015, we had 2,032,488 shares of common stock subject to outstanding options under our stock option plans, and 195,676 shares of common stock were available for future issuance under the plans. We have registered the shares of common stock subject to outstanding options and reserved for issuance under our stock option plans. Accordingly, the shares of common stock underlying vested options will be eligible for resale in the public market as soon as the options are exercised.
18 |
As of March 23, 2015, we had 169,335 shares of common stock subject to outstanding warrants issued in our 2009 private placement and in connection with a convertible note financing in November 2010. We have registered the resale of all shares of common stock subject to the warrants. Accordingly, the shares of common stock underlying these warrants will be eligible for resale in the public market as soon as the warrants are exercised, subject only to S-3 prospectus delivery requirements.
As of March 23, 2015, we had $752,625 in subordinated convertible notes payable. Up to 977,398 shares of common stock could be issued for conversion of the notes plus all accrued interest thru the maturity date of September 4, 2017.
Volatility in the trading price of our Common Stock could negatively impact the price of our Common Stock.
During the period from January 1, 2014 through March 23, 2015, our common stock price fluctuated between a high of $3.19 and a low of $0.70. On July 30, 2012, our common stock was delisted from the Nasdaq market and began trading on the Over-the-Counter Marketplace due to our equity balances falling below the minimum threshold required for continued Nasdaq listing. We have experienced low trading volumes in our stock, and thus relatively small purchases and sales can have a significant effect on our stock price. The trading price of our common stock could be subject to wide fluctuations in response to many factors, some of which are beyond our control, including general economic conditions and the outlook of securities analysts and investors on our industry. In addition, the stock markets in general, and the markets for high technology stocks in particular, have experienced high volatility that has often been unrelated to the operating performance of particular companies. These broad market fluctuations may adversely affect the trading price of our common stock.
Item 1B. Unresolved Staff Comments
None.
We lease a 37,100 square foot office facility in Newark, California under a lease expiring in June 2022. This facility houses our headquarters and manufacturing operations, and is used by all segments of the Company. We believe that our current facilities are sufficient and adequate to meet our needs for the foreseeable future.
We are currently not a party to any material legal proceedings.
Item 4. Mine Safety Disclosures
Not applicable.
19 |
Item 5. Market for Registrant’s Common Equity, Related Stockholder Matters and Issuer Purchases of Equity Securities
Common Stock
The Company’s common stock is traded on the OTCQB Marketplace under the symbol “SCKT.”
The quarterly high and low sales prices of our common stock, as reported on the OTCQB Marketplace through March 23, 2015 and for the last two fiscal years are as shown below:
Common Stock | ||||||||||
Quarter Ended | High | Low | ||||||||
| 2013 | ||||||||||
| March 31, 2013 | $ | 1.89 | $ | 0.70 | ||||||
| June 30, 2013 | $ | 2.20 | $ | 0.92 | ||||||
| September 30, 2013 | $ | 1.98 | $ | 1.12 | ||||||
| December 31, 2013 | $ | 1.45 | $ | 0.70 | ||||||
| 2014 | ||||||||||
| March 31, 2014 | $ | 1.14 | $ | 0.70 | ||||||
| June 30, 2014 | $ | 1.91 | $ | 0.85 | ||||||
| September 30, 2014 | $ | 2.74 | $ | 1.40 | ||||||
| December 31, 2014 | $ | 2.75 | $ | 1.95 | ||||||
| 2015 | ||||||||||
| March 31, 2015 (through March 23, 2015) | $ | 3.19 | $ | 2.00 | ||||||
On March 23, 2015, the closing sales price for our common stock as reported on the OTCQB Marketplace was $2.10. We had approximately 3,400 beneficial stockholders of record as of March 23, 2015. We have not paid dividends on our common stock, and we currrently intend to retain future earnings for use in our business and do not anticipate paying dividends in the foreseeable future.
The information required by this item regarding equity compensation plans is incorporated by reference to the information set forth in Item 12 of this Annual Report on Form 10-K.
20 |
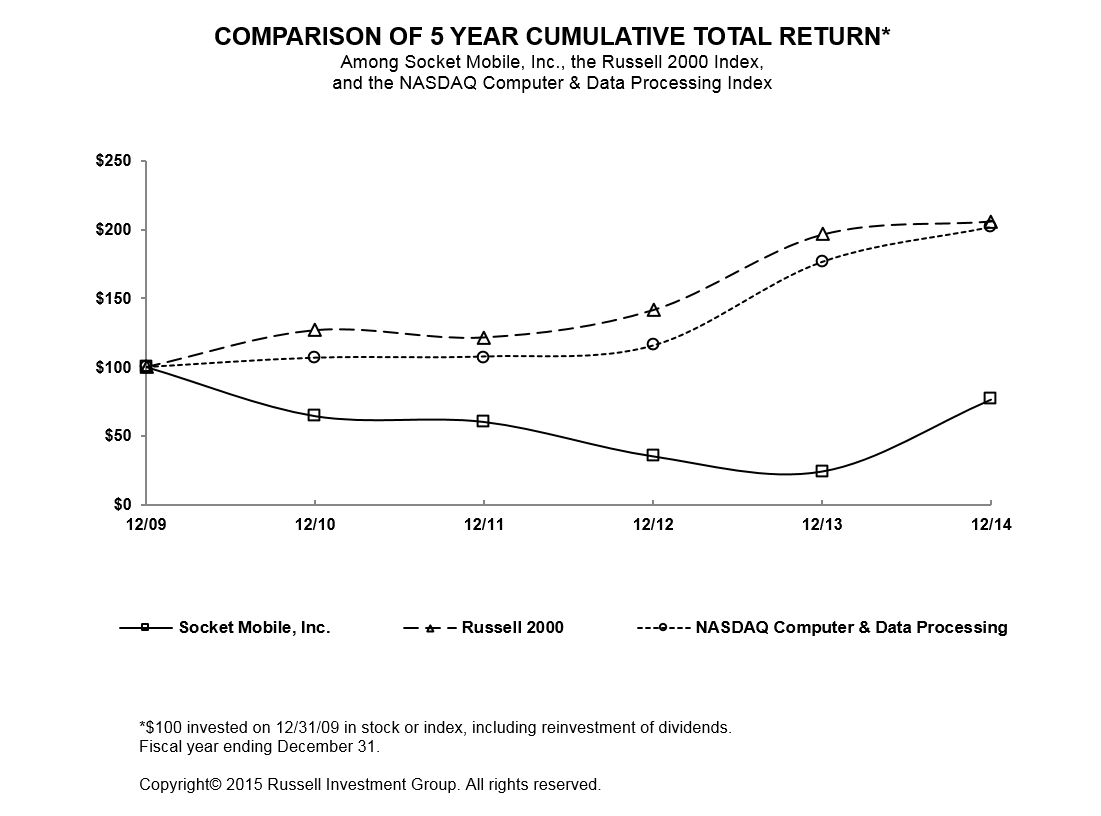
Performance Graph
The performance graph shown below shall not be deemed “filed” for purposes of Section 18 of the Securities Exchange Act of 1934, as amended, or otherwise subject to the liabilities under that section, and shall not be deemed to be incorporated by reference into any filing of Socket Mobile, Inc. under the Securities Act of 1933, as amended, or the Exchange Act. The performance graph below shows a five-year comparison of cumulative total stockholder return, calculated on a dividend reinvestment basis and based on a $100 investment, from December 31, 2008 through December 31, 2014 comparing the return on the Company's common stock with the Russell 2000 Index and the NASDAQ Computer & Data Processing Index. No dividends have been declared or paid on the common stock during such period. Historical stock price performance is not necessarily indicative of future stock price performance.
21 |
Item 6. Selected Financial Data
The following selected financial data should be read in conjunction with Item 7, “Management’s Discussion and Analysis of Financial Condition and Results of Operations,” and the financial statements and the notes thereto in Item 8, “Financial Statements and Supplementary Data.”
| Years Ended December 31, | ||||||||||||||||||||
| (Amounts in thousands except per share) | 2010 | (b) | 2011 | (b) | 2012 | 2013 | 2014 | |||||||||||||
| Income Statement Data: | ||||||||||||||||||||
| Revenues | $ | 13,498 | $ | 17,511 | $ | 13,565 | $ | 15,661 | $ | 17,021 | ||||||||||
| Gross profit | $ | 5,401 | $ | 7,250 | $ | 5,047 | $ | 6,303 | $ | 7,413 | ||||||||||
| Operating expenses | $ | 9,116 | $ | 8,524 | $ | 8,056 | $ | 6,426 | $ | 6,482 | ||||||||||
| Net income (loss) | $ | (3,976 | ) | $ | (2,422 | ) | $ | (3,298 | ) | $ | (620 | ) | $ | 432 | ||||||
Net income (loss) per share: Basic | $ | (1.05 | ) | $ | (0.56 | ) | $ | (0.68 | ) | $ | (0.13 | ) | $ | 0.09 | ||||||
| Diluted | $ | (1.05 | ) | $ | (0.56 | ) | $ | (0.68 | ) | $ | (0.13 | ) | $ | 0.08 | ||||||
| Weighted average shares outstanding: | ||||||||||||||||||||
| Basic | 3,796 | 4,360 | 4,854 | 4,865 | 5,006 | |||||||||||||||
| Diluted | 3,796 | 4,360 | 4,854 | 4,865 | 5,251 | |||||||||||||||
| At December 31, | ||||||||||||||||||||
| 2010 | 2011 | 2012 | 2013 | 2014 | ||||||||||||||||
| Balance Sheet Data: | ||||||||||||||||||||
| Cash and cash equivalents | $ | 461 | $ | 957 | $ | 391 | $ | 606 | $ | 633 | ||||||||||
| Restricted cash (a) | $ | 711 | $ | — | $ | — | $ | — | $ | — | ||||||||||
| Total assets | $ | 9,067 | $ | 10,397 | $ | 7,921 | $ | 8,102 | $ | 8,370 | ||||||||||
| Bank line of credit | $ | — | $ | 1,110 | $ | 811 | $ | 764 | $ | 816 | ||||||||||
| Senior convertible note (a) | $ | 330 | $ | — | $ | — | $ | — | $ | — | ||||||||||
| Related party convertible notes payable | $ | — | $ | — | $ | 750 | $ | 812 | $ | 893 | ||||||||||
| Short term notes payable | $ | — | $ | — | $ | 95 | $ | 650 | $ | 600 | ||||||||||
| Capital leases and deferred rent - long term portion | $ | 202 | $ | 184 | $ | 227 | $ | 265 | $ | 276 | ||||||||||
| Total stockholders’ equity | $ | 2,893 | $ | 3,126 | $ | 469 | $ | 133 | $ | 1,029 | ||||||||||
| (a) | Under the terms of the senior convertible note financing closed in November 2010, the Company was required to set aside cash collateral to the extent qualified accounts receivables are less than the note plus interest. At December 31, 2010, the cash collateral requirement was $0.7 million. At December 31, 2010 the amount shown as the Company’s senior convertible note, represents the $1.0 million face value of the note net of debt discount of $0.67 million. The note was subsequently called by the Company in August 2011, and the note holder completed full conversion of the note to common stock by September 2011. |
| (b) | In the years ended December 31, 2010 and 2011, the net loss includes non-cash charges to interest expense of approximately $56,000 and $1,050,000, respectively, related to the Company’s senior convertible note closed in November 2010 (see item (a) discussed immediately above). |
22 |
Item 7. Management’s Discussion and Analysis of Financial Condition and Results of Operations
Liquidity and Going Concern
In 2014, we generated $17.0 million in revenue and $0.4 million in net income. However, except for fiscal years 2014 and 2004, we incurred significant operating losses in each financial period since our inception. As of December 31, 2014, we have an accumulated deficit of $60.7 million. Our cash balance at December 31, 2014 was $0.6 million, including $0.8 million advanced on our bank lines of credit. At December 31, 2014, we had additional unused borrowing capacity of approximately $0.4 million on our bank lines of credit. Our balance sheet at December 31, 2014 has a current ratio (current assets divided by current liabilities) of 0.6 to 1.0, and a working capital deficit of $2.8 million (current assets less current liabilities). These circumstances raise substantial doubt about our ability to continue as a going concern.
We have taken actions to reduce our expenses and to align our cost structure with economic conditions. We have the ability to further reduce expenses if necessary. Steps taken by us to reduce operating losses and achieve profitability included reduction of headcount to manage payroll costs, the introduction of new products, and continued close support of our distributors and registered developers whose applications support the use of our barcode scanning products. We extended the maturity dates on our convertible notes originally issued in 2012 (see NOTE 2 — Related Party Convertible Notes Payable” for more information). We completed additional financing in 2013 (see “NOTE 3 — Related Party and Other Short-Term Notes Payable” for more information). We believe that we will be able to further improve our liquidity and secure additional sources of financing by managing our working capital balances, use of our bank lines of credit, and raising additional capital as needed including the issuance of additional equity securities. However, there can be no assurance that additional capital will be available on acceptable terms, if at all, and any such terms may be dilutive to existing stockholders. Our bank lines of credit may be terminated by the bank or by us at any time (see “NOTE 4 – Bank Financing Arrangements”). If we cannot maintain ongoing profitability, we will not be able to support our operations from positive cash flows, and we would use our existing cash to support operating losses. If we are unable to secure the necessary capital for our business, we may need to suspend some or all of our current operations.
To maintain revenue growth and profitability, we anticipate requirements for cash will include funding of higher receivable and inventory balances, and increased expenses, including an increase of costs relating to new employees to support our growth and increases in salaries, benefits, and related support costs for employees.
Critical Accounting Policies
Our significant accounting policies are described in Note 1 to our financial statements for the years ended December 31, 2014 and 2013. The application of these policies requires us to make estimates and judgments that affect the reported amount of assets, liabilities, revenues and expenses, and related disclosure of contingent assets and liabilities. We base our estimates on a combination of historical experience and reasonable judgment applied to other facts. Actual results may differ from these estimates, and such differences may be material to the financial statements. In addition, the use of different assumptions or judgments may result in different estimates. We believe our critical accounting policies that are subject to these estimates are: Revenue Recognition and Accounts Receivable Reserves, Inventory Valuation, Stock Based-Compensation, and Valuation of Goodwill and Other Intangible Assets.
23 |
Revenue Recognition and Accounts Receivable Reserves
We defer revenue recognition on products sold to distributors until our distributors sell the products to their customers, because our distributors generally have limited rights to return products to us for stock rotation, stock reduction, or replacement of defective product. The amount of deferred revenue net of related cost of revenue is classified as deferred income on shipments to distributors on our balance sheet. We use inventory reports received from our distributors at the end of each reporting period to determine the extent of inventory at the distributor, and thus, the amount of income to defer. Stock rotation and stock reduction from our distributors generally results in a balance sheet adjustment to our deferred income and does not impact our revenue or cost of revenue.
We generally recognize revenues on sales to customers other than distributors upon shipment provided that persuasive evidence of a sales arrangement exists, the price is fixed and determinable, title has transferred, collection of resulting receivables is reasonably assured, there are no customer acceptance requirements, and there are no remaining significant obligations. Most of our customers other than distributors do not have rights of return except under warranty.
We also earn revenue from an extended warranty service program offered on select products. Revenues from the extended warranty service program are recognized ratably over the life of the extended warranty contract. The amount of unrecognized warranty service revenue is classified as deferred service revenue and presented on our balance sheet in its short and long-term components. We also earn revenue from services performed in connection with consulting arrangements. For those contracts that include contract milestones or acceptance criteria we recognize revenue as such milestones are achieved or as such acceptance occurs. In some instances the acceptance criteria in the contract requires acceptance after all services are complete and all other elements have been delivered, in which case revenue recognition is deferred until those requirements are met.
We estimate the amount of uncollectible receivables at the end of each reporting period based on the aging of the receivable balance, historical trends, and communications with our customers. If actual bad debts are significantly different from our estimates our operating results will be affected.
Inventory Valuation
Our inventories primarily consist of component parts used to assemble our products after we receive orders from our customers. We purchase or have manufactured the component parts required by our engineering bill of materials. The timing and quantity of our purchases are based on order forecasts, the lead time requirements of our vendors, and on economic order quantities. At the end of each reporting period, we compare our inventory on hand to our forecasted requirements for the next nine-month period, and write off the cost of any inventory that is surplus, less any amounts that we believe we can recover from disposal of goods that we specifically believe will be saleable past a nine-month horizon. Our sales forecasts are based upon historical trends, communications from customers, and marketing data regarding market trends and dynamics. Surplus or obsolete inventory can also be created by changes to our engineering bill of materials. Charges for the amounts we record as surplus or obsolete inventory are included in cost of revenue.
24 |
Stock-Based Compensation
We account for share-based awards to employees, including grants of employee stock options, in our financial statements based on the grant date fair values of the share-based awards. We use a binomial lattice valuation model to estimate the fair value of stock option grants. The binomial lattice model incorporates calculations for expected volatility, risk-free interest rates, employee exercise patterns and post-vesting employment termination behavior, and these factors affect the estimate of the fair value of the stock option grants.
Valuation of Goodwill
Goodwill is tested for impairment at least annually as of September 30th and between annual tests if indicators of potential impairment exist. We test goodwill for impairment at the reporting unit level. Prior to performing the goodwill impairment test we determine whether any triggering events are present that could cause impairment of goodwill. We then perform a two-step test to assess goodwill for impairment. The first step of the goodwill impairment test requires a determination of whether the fair value of the reporting unit is less than its carrying value. If the fair value exceeds the carrying value, goodwill is not impaired and no further testing is performed. The second step is performed only if the carrying value exceeds the fair value. The second step involves an analysis reflecting the allocation of fair value determined in the first step (as if it was the fair value of the consideration transferred in a business combination). This process may result in the determination of a new amount of goodwill. If the implied fair value of the goodwill resulting from this hypothetical acquisition accounting is lower than the carrying value of the goodwill in the reporting unit, the difference is reflected as a non-cash impairment loss. The purpose of the second step is only to determine the amount of goodwill that should be recorded on the balance sheet. The recorded amounts of other items on the balance sheet are not adjusted. We have determined that we have one reporting unit for purposes of goodwill testing.
If the carrying value of the reporting unit is zero or negative, the second step of the impairment test, as described above, is required to be performed to measure the amount of impairment loss, if any, when it is more likely than not that a goodwill impairment exists. In determining whether it is more likely than not that a goodwill impairment exists, we are required to evaluate whether there are adverse qualitative factors.
We estimate the fair value of our reporting unit utilizing up to three valuation methods: market capitalization, income approach and market approach. Revenue and expense forecasts used in the evaluation of goodwill are based on trends of historical performance and our estimate of future performance. We determined that the fair value of the Company's reporting unit at September 30, 2014, the date of the Company’s annual impairment test, exceeded its carrying value and as a result, goodwill is considered not impaired. Furthermore, we determined there were no indicators of impairment in the subsequent fourth quarter 2014.
25 |
Revenues
Our revenues have been classified into two primary product families for the years ended December 31, 2014 and 2013. Additionally, we sell OEM embedded products to third parties, and we continue to carry legacy plug-in connectivity products. Our product revenues including accessories and service are presented in the following table:
| (revenues in thousands) | Years ended December 31, | % | ||||||||||||||||||
| 2014 | 2013 | Increase (Decrease) | ||||||||||||||||||
| Product family: | $’s | %’s | $’s | %’s | 2014 vs. 2013 | |||||||||||||||
Cordless barcode scanning and related products and service | $ | 13,665 | 80 | % | $ | 9,747 | 62 | % | 40 | % | ||||||||||
Mobile handheld computer and related products and service | 3,256 | 19 | % | 5,287 | 34 | % | (38 | %) | ||||||||||||
| OEM and legacy products | 100 | 1 | % | 627 | 4 | % | (84 | %) | ||||||||||||
| Total | $ | 17,021 | 100 | % | $ | 15,661 | 100 | % | 9 | % | ||||||||||
Our cordless barcode scanning and related product and service revenues in 2014 were $13.7 million, an increase of $3.9 million or 40%, from cordless barcode scanning and related revenues in 2013. Revenue increases totaling $1.5 million were from increased sales volumes of our Apple certified Series-7 entry level 1D cordless handheld scanner 7Ci and 7Di models. Revenue increases of $1.1 million were from increased sale volume of our Apple certified Series-7 high performance 1D cordless handheld barcode scanner 7Mi and 7Pi models. Revenue increases of $0.7 million were from increased sales volumes of our Series-8 cordless scanner 8Ci models optimized for use with and attachable to smartphones. Revenue increases of $0.5 million were due to increased sales volumes of our Apple certified Series-7 imager based 2D cordless handheld scanner 7Xi and 7Qi models. Remaining revenue increases were due to increased sales volumes of our cordless handheld scanning accessories, partially offset by slight declines in sales volumes of our cordless ring scanner.
Our mobile handheld computer and related products and service revenues in 2014 were $3.3 million, a decline of $2.0 million or 38%, from mobile handheld computer and related product revenues in 2013. Declines in mobile handheld computer and related products and service revenues was primarily from declines in sales volumes of companion plug-in data collection products and declines in sales volumes of accessories and services. Declines were primarily from declines of $1.1 million in sales volumes of our mobile handheld computers. Additional declines were from declines in sales volumes of companion plug-in data collection products and declines in sales of accessories and services, reflective of the overall lower unit sales volumes of our mobile handheld computers. Sales of our mobile computer models have been affected by the uncertainty surrounding Microsoft’s support of the Windows Embedded Handheld 6.5 operating system, which they clarified in mid-2013 by their announced commitment to this operating system until early 2020. Additionally, sales of standard handheld computing devices such as our mobile handheld computer have been declining due to the increased popularity of alternative tablet and smartphone devices.
26 |
Service revenues were $0.5 million or 3% of our revenues in 2014 and $0.6 million or 4% of our revenues in 2013. Declines in service revenues in 2014 reflect the declines in unit sales of our mobile handheld computers in 2014 compared to 2013. The majority of our SocketCare service contracts are purchased by our customers in conjunction with the purchase of mobile handheld computers. Service revenues have been allocated to the respective products serviced in the table above.
OEM and legacy products revenues in 2014 were $0.1 million, a decline of $0.5 million or 84%, from other revenues in 2014. Revenues in 2013 were primarily related to one-time buys of legacy products including our Bluetooth modules and wireless LAN plug-in cards primarily within the first half of 2013 by OEM customers.
Gross Margins
Gross margins for 2014 were 44% of revenues compared to gross margins of 40% in 2013. We generally price our products as a markup from our cost, and we offer discount pricing for higher volume purchases. Improvements in overall margins in 2014 were due primarily to improved margins on our cordless barcode scanning product line from 52% in 2013 to 56% in 2014 due to cost reduction in components purchased. Margins on our mobile handheld computer product line were 52% in both 2014 and 2013.
Research and Development Expense
Research and development expense in 2014 was $2.3 million, an increase of 3% from research and development expense in 2013. Increases in the level of research and development expense were primarily due to higher personnel costs reflecting compensation increases which were phased in during the second quarter 2014 and increases in professional consulting fees. Partially offsetting these increases were decreases in outside services and lower amortization expense in 2014 due to a purchased patent becoming fully amortized in the first half of 2014.
Sales and Marketing Expense
Sales and marketing expense in 2014 was $2.2 million, a decrease of 6% compared to sales and marketing expense in 2013 of $2.3 million. Decreases in sales and marketing expense in 2014 were due primarily to declines in personnel costs due to lower overall headcount in the first nine months, with additional declines from planned reductions in advertising and promotional expenditures. Partially offsetting these declines were increases in outside services expense.
General and Administrative Expense
General and administrative expense in 2014 was $2.0 million, an increase of 7% compared to general and administrative expense of $1.8 million in 2013. Increases in general and administrative expenses were primarily due to higher personnel costs reflecting compensation increases which were phased in during the second quarter 2014 and higher variable compensation reflecting increased attainment of financial results on which the variable compensation programs are based, compared to the prior year. Partially offsetting these increases were declines in consulting and professional fees.
27 |
Interest Expense and Other, net of Interest Income and Other
Interest expense and other, net of interest income and other, was $405,000 in 2014 compared to $466,000 in 2013. Interest expense in 2014 was related primarily to interest on our notes payable, interest on our convertible notes payable issued in 2012 and reissued in September of 2013, and interest on amounts drawn on our bank lines of credit (see “NOTE 2 — Related Party Convertible Notes Payable” and “NOTE 3 — Related Party and Other Short Term Notes Payable” for more information). Additionally, interest expense includes interest on equipment lease financing obligations in each of the two years presented. Lower interest expense in 2014 reflects lower interest rates on our new bank line of credit effective March 7, 2014 compared to our previous bank line of credit, and lower interest expense related to our subordinated notes as a result of lower interest rates in effect on the reissued two-year subordinated notes which replaced the previous notes maturing on June 1, 2014.
Interest income and other, reflects interest earned on cash balances. Interest income in 2014 and 2014, was nominal, reflecting low average cash balances combined with low average rates of return. Other income and expense includes foreign currency transaction gains and losses, which were nominal in each of the periods presented.
Income Taxes
Deferred tax expense of $32,000 in the year ended December 31, 2014 and 2013, and the corresponding deferred tax liability shown on our balance sheet, is related entirely to the deferred tax liability on the portion of our goodwill amortized for tax purposes. Due to the indefinite characteristic of this deferred tax liability, it cannot be offset against deferred tax assets. We maintain a full valuation allowance for all other components of deferred tax assets. There can be no assurance that the deferred tax assets subject to the valuation allowance will be realized. We have not generated taxable income in any periods in any jurisdiction, foreign or domestic.
28 |
Quarterly Results of Operations
The following table sets forth summary quarterly statements of operations data for each of the quarters in 2013 and 2014. This unaudited quarterly information has been prepared on the same basis as the annual information presented elsewhere herein, and, in our opinion, includes all adjustments (consisting only of normal recurring entries) necessary for a fair presentation of the information for the quarters presented. The operating results for any quarter are not necessarily indicative of results for any future period.
Quarter Ended (unaudited) | ||||||||||||||||||||||||||||||||
| (amounts in thousands, except per share amounts) | Mar 31, 2013 | Jun 30, 2013 | Sep 30, 2013 | Dec 31, 2013 | Mar 31, 2014 | Jun 30, 2014 | Sep 30, 2014 | Dec 31, 2014 | ||||||||||||||||||||||||
| Summary Quarterly Data: | ||||||||||||||||||||||||||||||||
| Revenue | $ | 4,265 | $ | 4,435 | $ | 3,292 | $ | 3,669 | $ | 3,795 | $ | 4,391 | $ | 4,922 | $ | 3,913 | ||||||||||||||||
| Cost of revenue | 2,557 | 2,631 | 2,009 | 2,161 | 2,172 | 2,490 | 2,778 | 2,168 | ||||||||||||||||||||||||
| Gross profit | 1,708 | 1,804 | 1,283 | 1,508 | 1,623 | 1,901 | 2,144 | 1,745 | ||||||||||||||||||||||||
| Operating expenses: | ||||||||||||||||||||||||||||||||
| Research and development | 525 | 594 | 578 | 573 | 554 | 586 | 612 | 581 | ||||||||||||||||||||||||
| Sales and marketing | 559 | 585 | 499 | 684 | 476 | 527 | 545 | 650 | ||||||||||||||||||||||||
| General and administrative | 461 | 449 | 395 | 524 | 521 | 512 | 467 | 451 | ||||||||||||||||||||||||
| Total operating expenses | 1,545 | 1,628 | 1,472 | 1,781 | 1,551 | 1,625 | 1,624 | 1,682 | ||||||||||||||||||||||||
| Interest expense and other, net | (80 | ) | (125 | ) | (124 | ) | (137 | ) | (136 | ) | (175 | ) | (81 | ) | (75 | ) | ||||||||||||||||
| Deferred tax expense | (8 | ) | (8 | ) | (8 | ) | (8 | ) | (8 | ) | (8 | ) | (8 | ) | (8 | ) | ||||||||||||||||
| Net income (loss) | $ | 75 | $ | 43 | $ | (321 | ) | $ | (418 | ) | $ | (72 | ) | $ | 93 | $ | 431 | $ | (20 | ) | ||||||||||||
| Basic net income (loss) per share | $ | 0.02 | $ | 0.01 | $ | (0.07 | ) | $ | (0.09 | ) | $ | (0.01 | ) | $ | 0.02 | $ | 0.09 | $ | (0.00 | ) | ||||||||||||
| Fully diluted net income (loss) per share | $ | 0.02 | $ | 0.01 | $ | (0.07 | ) | $ | (0.09 | ) | $ | (0.01 | ) | $ | 0.02 | $ | 0.08 | $ | (0.00 | ) | ||||||||||||
We have experienced significant quarterly fluctuations in operating results, and we anticipate such fluctuations to continue in the future. We generally ship orders as received and therefore quarterly revenue and operating results depend on the volume and timing of orders received during the quarter, which are difficult to forecast. Historically, we have recognized a substantial portion of our revenue in the last month of the quarter. Operating results may also fluctuate due to factors such as the demand for our products, the size and timing of customer orders, the introduction of new products and product enhancements by us or our competitors, product mix, timing of software enhancements, manufacturing supply shortages, changes in the level of operating expenses, and competitive conditions in the industry. Because our staffing and other operating expenses are based on anticipated revenue, a substantial portion of which is not typically generated until the end of each quarter, delays in the receipt of orders can cause significant variations in operating results from quarter to quarter.
29 |
Cash Flows and Contractual Obligations
As reflected in our Statements of Cash Flows, net cash provided by operating activities in 2014 was $52,000, compared to $94,000 used in operating activities in 2013. We calculate net cash provided by or used in operating activities by increasing our net income ($0.4 million in 2014) or reducing our net loss ($0.6 million in 2013), by those expenses that did not require the use of cash, and reversing gains that did not generate cash. These items consist of stock based compensation expense, depreciation, amortization of intangible assets, deferred tax expense, and in 2014 the loss on extinguishment of debt in the second quarter. These amounts totaled $0.6 million in both 2014 and 2013. In addition, we report increases in assets and reductions in liabilities as uses of cash and decreases in assets and increases in liabilities as sources of cash, together referred to as changes in operating assets and liabilities. In 2014, net cash used by changes in operating assets and liabilities was $937,000 and were primarily from decreases in accounts payable due to increased payments to suppliers and vendors, and increases in accounts receivable due to the higher level shipments to distributors in the fourth quarter 2014 compared to the same period a year ago. These uses of cash in 2014 were partially offset by reductions in inventory levels. In 2013, changes in operating assets and liabilities resulted in a net use of cash of $65,000 and were primarily from reductions in accounts payable due to increased payments to suppliers and vendors, increases in inventory levels, and declines in deferred service revenues reflecting the reduced sales volumes of our handheld computer in 2013, which comprise a larger portion of our SocketCare service revenues. Partially offsetting these uses of cash were increases in deferred income on shipments to distributors due to higher levels of inventory in our distribution channel, increases in accrued payroll, and declines in accounts receivable.
Cash used in investing activities was $166,000 in 2014 and $159,000 in 2013. Investing activities in both 2014 and 2013 are related primarily to expenditures on product tooling and purchases of computer equipment.
Cash provided by financing activities was $0.1 million in 2014 compared to $0.5 million in 2013. Financing activities in 2014 consisted primarily of proceeds from the exercise of stock options and warrants and net amounts advanced on our bank lines of credit, partially offset by a related party convertible note holder redemption. The proceeds from and repayments of borrowings in 2014 as shown on our Statement of Cash Flows excludes $752,000 related to the amounts outstanding under the credit line with our former bank which was transferred to our new bank on March 7, 2014 (see “NOTE 4 — Bank Financing Arrangements” for more information). Financing activities in 2013 consisted primarily of proceeds from the issuance of related party and other short term notes payable, partially offset by repayment of a short term note originally advanced on August 31, 2012 with final repayment completed in January 2013, and note redemptions by a related party convertible note holder and another note holder, and net repayments on our bank line of credit.
30 |
Our contractual obligations at December 31, 2014 are outlined in the table shown below:
| Payments Due by Period | ||||||||||||||||||||
Contractual Obligations |
Total | 1 year | 2 to 3 years | 4 to 5 years | More than 5 years | |||||||||||||||
Unconditional purchase obligations with contract manufacturers | $ | 1,404,000 | $ | 1,404,000 | $ | — | $ | — | $ | — | ||||||||||
| Operating leases | 3,359,000 | 393,000 | 834,000 | 902,000 | 1,230,000 | |||||||||||||||
| Short term note payable | 600,000 | 600,000 | — | — | — | |||||||||||||||
| Capital leases | 37,000 | 12,000 | 25,000 | — | — | |||||||||||||||
Total contractual obligations | $ | 5,400,000 | $ | 2,409,000 | $ | 859,000 | $ | 902,000 | $ | 1,230,000 | ||||||||||
Off-Balance Sheet Arrangements
As of December 31, 2014, we had no off-balance sheet arrangements as defined in Item 303 of Regulation S-K.
Recent Accounting Pronouncements
See Note 1 of "Notes to Financial Statements" of this Annual Report for additional information regarding the status of recent accounting pronouncements.
31 |
Item 7A. Quantitative and Qualitative Disclosures about Market Risk
Interest Rate Risk
Our exposure to market risk for changes in interest rates relates primarily to invested cash and our bank credit line facilities. Our cash is invested in short-term money market investments backed by U.S. Treasury notes and other investments that mature within one year and whose principal is not subject to market rate fluctuations. Accordingly, interest rate declines would adversely affect our interest income but would not affect the carrying value of our cash investments. Based on a sensitivity analysis of our cash investments during the quarter ended December 31, 2014, a decline of 1% in interest rates would not have had a material effect on our interest income. Our bank credit line facilities (effective March 7, 2014) of up to $2.5 million have variable interest rates based on the lender's prime rate (minimum of 3.25%) plus 1.5%, for both the domestic line (up to $1.5 million) and the international line (up to $1.0 million). Accordingly, interest rate increases could increase our interest expense on our outstanding credit line balances. Based on a sensitivity analysis during the quarter ended December 31, 2014, an increase of 1% in the interest rate would have increased our quarterly borrowing costs by approximately $2,000.
Foreign Currency Risk
A substantial majority of our revenue, expense and purchasing activities are transacted in U.S. dollars. However, we require our European distributors to purchase our products in Euros and we pay the expenses of our European employees in Euros and British pounds. We may enter into selected future purchase commitments with foreign suppliers that may be paid in the local currency of the supplier. We hedge a significant portion of our European receivables balance denominated in Euros to reduce the foreign currency risk associated with these assets, and we have not been subject to significant losses from material foreign currency fluctuations. Based on a sensitivity analysis of our net foreign currency denominated assets and expenses at the beginning, during and at the end of the quarter ended December 31, 2014, an adverse change of 10% in exchange rates would have resulted in an increase in our net loss for the fourth quarter 2014 of approximately $29,000 if left unprotected. For the fourth quarter of 2014, the total net adjustment for the effects of changes in foreign currency on cash balances, collections, payables, and derivatives used to hedge foreign currency risks, was a net loss of $4,000. We will continue to monitor, assess, and mitigate through hedging activities, our risks related to foreign currency fluctuations.
Item 8. Financial Statements and Supplementary Data
The supplementary information required by this item is included in Item 7, “Management’s Discussion and Analysis of Financial Condition and Results of Operations.”
32 |
REPORT OF INDEPENDENT REGISTERED PUBLIC ACCOUNTING FIRM
To the Board of Directors and Stockholders of
Socket Mobile, Inc.
We have audited the accompanying balance sheets of Socket Mobile, Inc. (the “Company”) as of December 31, 2014 and 2013, and the related statements of operations, stockholders’ equity and cash flows for the years then ended. These financial statements are the responsibility of the Company’s management. Our responsibility is to express an opinion on these financial statements based on our audits.
We conducted our audits in accordance with the standards of the Public Company Accounting Oversight Board (United States). Those standards require that we plan and perform the audit to obtain reasonable assurance about whether the consolidated financial statements are free of material misstatement. The Company is not required to have, nor were we engaged to perform, an audit of its internal control over financial reporting. Our audits included consideration of internal control over financial reporting as a basis for designing audit procedures that are appropriate in the circumstances, but not for the purpose of expressing an opinion on the effectiveness of the Company’s internal control over financial reporting. Accordingly, we express no such opinion. An audit also includes examining, on a test basis, evidence supporting the amounts and disclosures in the financial statements, assessing the accounting principles used and significant estimates made by management, as well as evaluating the overall financial statement presentation. We believe that our audits provide a reasonable basis for our opinion.
In our opinion the financial statements referred to above present fairly, in all material respects, the financial position of Socket Mobile, Inc. as of December 31, 2014 and 2013, and the results of its operations and cash flows for the years then ended in conformity with accounting principles generally accepted in the United States of America.
The accompanying financial statements have been prepared assuming that the Company will continue as a going concern. As discussed in the Note 1 to the financial statements, the Company has an accumulated deficit of $60,690,557 and a working capital deficit, all of which raises substantial doubt about its ability to continue as a going concern. Management’s plans concerning these matters are also described in the Note 1 to the financial statements. The accompanying financial statements do not include any adjustments that might result from the outcome of this uncertainty.
/s/ Sadler, Gibb & Associates, LLC
Salt Lake City, UT
March 27, 2015
33 |
| SOCKET MOBILE, INC. | ||||||||
| BALANCE SHEETS | ||||||||
| December 31, | ||||||||
| 2014 | 2013 | |||||||
| ASSETS | ||||||||
| Current assets: | ||||||||
| Cash and cash equivalents | $ | 632,631 | $ | 606,255 | ||||
| Accounts receivable, net | 1,896,701 | 1,427,590 | ||||||
| Inventories | 957,327 | 1,105,088 | ||||||
| Prepaid expenses and other current assets | 125,707 | 93,647 | ||||||
| Total current assets | 3,612,366 | 3,232,580 | ||||||
| Property and equipment: | ||||||||
| Machinery and office equipment | 2,025,397 | 1,918,187 | ||||||
| Computer equipment | 984,099 | 1,059,943 | ||||||
| 3,009,496 | 2,978,130 | |||||||
| Accumulated depreciation | (2,764,964 | ) | (2,683,193 | ) | ||||
| Property and equipment, net | 244,532 | 294,937 | ||||||
| Intangible assets, net | — | 30,000 | ||||||
| Goodwill | 4,427,000 | 4,427,000 | ||||||
| Other assets | 85,918 | 117,518 | ||||||
| Total assets | $ | 8,369,816 | $ | 8,102,035 | ||||
| LIABILITIES AND STOCKHOLDERS’ EQUITY | ||||||||
| Current liabilities: | ||||||||
| Accounts payable and accrued expenses | $ | 3,007,048 | $ | 3,524,148 | ||||
| Accrued payroll and related expenses | 528,155 | 580,665 | ||||||
| Bank line of credit | 815,981 | 763,487 | ||||||
| Deferred income on shipments to distributors | 978,555 | 1,006,057 | ||||||
| Related party and other short term notes payable | 600,000 | 650,000 | ||||||
| Related party convertible notes payable-current portion | 380,696 | 405,696 | ||||||
| Short term portion of deferred service revenue | 131,344 | 172,474 | ||||||
| Short term portion of capital leases and deferred rent | 25,102 | 22,818 | ||||||
| Total current liabilities | 6,466,881 | 7,125,345 | ||||||
| Related party convertible notes payable | 371,929 | 371,929 | ||||||
| Long term portion of deferred service revenue | 83,301 | 95,049 | ||||||
| Long term portion of capital leases and deferred rent | 275,589 | 265,002 | ||||||
| Deferred income taxes | 143,274 | 111,334 | ||||||
| Total liabilities | 7,340,974 | 7,968,659 | ||||||
| Commitments and contingencies | ||||||||
| Stockholders’ equity: | ||||||||
| Common stock, $0.001 par value: Authorized – 20,000,000 shares, | ||||||||
Issued and outstanding – 5,403,851 shares at December 31, 2014 and 4,867,063 shares at December 31, 2013 | 5,404 | 4,867 | ||||||
| Additional paid-in capital | 61,713,995 | 61,251,183 | ||||||
| Accumulated deficit | (60,690,557 | ) | (61,122,674 | ) | ||||
| Total stockholders’ equity | 1,028,842 | 133,376 | ||||||
| Total liabilities and stockholders’ equity | $ | 8,369,816 | $ | 8,102,035 | ||||
See accompanying notes.
34 |
SOCKET MOBILE, INC. | ||||||||
| STATEMENTS OF OPERATIONS | ||||||||
| Years Ended December 31, | ||||||||
| 2014 | 2013 | |||||||
| Revenues | $ | 17,020,754 | $ | 15,661,305 | ||||
| Cost of revenues | 9,607,829 | 9,357,868 | ||||||
| Gross profit | 7,412,925 | 6,303,437 | ||||||
| Operating expenses: | ||||||||
| Research and development | 2,332,918 | 2,269,454 | ||||||
| Sales and marketing | 2,199,009 | 2,327,296 | ||||||
| General and administrative | 1,950,191 | 1,829,294 | ||||||
| Total operating expenses | 6,482,118 | 6,426,044 | ||||||
| Operating income (loss) | 930,807 | (122,607 | ) | |||||
| Interest expense and other, net | (405,250 | ) | (465,947 | ) | ||||
| Loss on extinguishment of debt | (61,500 | ) | — | |||||
| Net income (loss) before income taxes | 464,057 | (588,554 | ) | |||||
| Income tax expense | (31,940 | ) | (31,939 | ) | ||||
| Net income (loss) | $ | 432,117 | $ | (620,493 | ) | |||
| Net income (loss) per share: | ||||||||
| Basic | $ | 0.09 | $ | (0.13 | ) | |||
| Diluted | $ | 0.08 | $ | (0.13 | ) | |||
| Weighted average shares outstanding: | ||||||||
| Basic | 5,005,579 | 4,865,036 | ||||||
| Diluted | 5,250,914 | 4,865,036 | ||||||
See accompanying notes.
35 |
SOCKET MOBILE, INC. |
|||||||||||
| STATEMENTS OF STOCKHOLDERS’ EQUITY | |||||||||||
| Additional | Total | ||||||||||
| Common Stock | Paid-In | Accumulated | Stockholders’ | ||||||||
| Shares | Amount | Capital | Deficit | Equity | |||||||
| Balance at December 31, 2012 | 4,861,063 | $ 4,861 | 60,966,505 | (60,502,181) | 469,185 | ||||||
| Exercise of warrants | — | — | — | — | — | ||||||
| Exercise of stock options | 6,000 | 6 | 6,474 | — | 6,480 | ||||||
| Stock-based compensation | — | — | 249,704 | — | 249,704 | ||||||
| Common stock issued to settle litigation | — | — | 28,500 | — | 28,500 | ||||||
| Net loss | — | — | — | (620,493) | (620,493 | ) | |||||
| Balance at December 31, 2013 | 4,867,063 | 4,867 | 61,251,183 | (61,122,674) | 133,376 | ||||||
| Issuance of common stock | 10,000 | 10 | 12,490 | — | 12,500 | ||||||
| Exercise of warrants | 457,813 | 458 | 137,042 | — | 137,500 | ||||||
| Exercise of stock options | 68,975 | 69 | 47,102 | — | 47,171 | ||||||
| Stock-based compensation | — | — | 204,678 | — | 204,678 | ||||||
| Loss on extinguishment of debt | — | — | 61,500 | — | 61,500 | ||||||
| Net income | — | — | — | 432,117 | 432,117 | ||||||
| Balance at December 31, 2014 | 5,403,851 | $ 5,404 | $ 61,713,995 | $(60,690,557) | $ 1,028,842 | ||||||
See accompanying notes.
36 |
| SOCKET MOBILE, INC. | ||||||||
| STATEMENTS OF CASH FLOWS | ||||||||
| Years Ended December 31, | ||||||||
| 2014 | 2013 | |||||||
| Operating activities | ||||||||
| Net income (loss) | $ | 432,117 | $ | (620,493 | ) | |||
| Adjustments to reconcile net income (loss) to net cash provided by (used in) operating activities: | ||||||||
| Stock-based compensation | 217,178 | 249,704 | ||||||
| Depreciation | 216,577 | 221,337 | ||||||
| Amortization of intangible assets | 30,000 | 60,000 | ||||||
| Deferred income tax expense | 31,940 | 31,939 | ||||||
| Fair value of common stock issued to settle litigation | — | 28,500 | ||||||
| Loss on extinguishment of debt | 61,500 | — | ||||||
| Changes in operating assets and liabilities: | ||||||||
| Accounts receivable | (469,111 | ) | 81,504 | |||||
| Inventories | 147,761 | (164,021 | ) | |||||
| Prepaid expenses and other current assets | (460 | ) | 9,787 | |||||
| Accounts payable and accrued expenses | (517,100 | ) | (194,990 | ) | ||||
| Accrued payroll and related expenses | (52,510 | ) | 102,581 | |||||
| Deferred income on shipments to distributors | (27,502 | ) | 151,898 | |||||
| Deferred service revenue | (52,878 | ) | (100,891 | ) | ||||
| Change in deferred rent | 34,702 | 49,245 | ||||||
| Net cash provided by (used in) operating activities | 52,214 | (93,900 | ) | |||||
| Investing activities | ||||||||
| Purchase of equipment and tooling | (166,172 | ) | (158,903 | ) | ||||
| Net cash used in investing activities | (166,172 | ) | (158,903 | ) | ||||
| Financing activities | ||||||||
| Payments on capital leases | (21,831 | ) | (20,447 | ) | ||||
| Proceeds from borrowings under bank line of credit agreement | 988,764 | 8,017,095 | ||||||
| Repayments of borrowings under bank line of credit agreement | (936,270 | ) | (8,064,294 | ) | ||||
| Stock options exercised | 47,171 | 6,480 | ||||||
| Warrants exercised | 137,500 | — | ||||||
| Proceeds from issuance of short term note payable | — | 700,000 | ||||||
| Repayment of short term notes payable | (50,000 | ) | (145,289 | ) | ||||
| Redemption of related party convertible notes payable | (25,000 | ) | (25,000 | ) | ||||
| Net cash provided by financing activities | 140,334 | 468,545 | ||||||
| Net increase in cash and cash equivalents | 26,376 | 215,742 | ||||||
| Cash and cash equivalents at beginning of year | 606,255 | 390,513 | ||||||
| Cash and cash equivalents at end of year | $ | 632,631 | $ | 606,255 | ||||
| Supplemental cash flow information | ||||||||
| Cash paid for interest | $ | 280,762 | $ | 387,092 | ||||
| Non-cash financing activities: | ||||||||
| Conversion of accrued note payable interest to note principal | — | $ | 52,625 | |||||
| Addition of equipment under capital lease | — | $ | 14,600 | |||||
See accompanying notes.
37 |
SOCKET MOBILE, INC.
NOTES TO FINANCIAL STATEMENTS
NOTE 1 — Summary of Significant Accounting Policies
Organization and Business
Socket Mobile, Inc. (the “Company”) produces barcode scanning and mobile handheld computer products serving the business mobility market and designed for the mobile worker. The Company offers a family of cordless barcode scanning products that connect over Bluetooth with smartphones, tablets and mobile computers. The Company also offers wearable cordless ring scanners for hands free barcode scanning. The Company offers a family of general purpose handheld computer products running the Windows Embedded Handheld System 6.5 operating system and a wide range of accessories including plug-in two dimensional (2D) and linear (1D) bar code scanners, cradles, Radio Frequency Identification (RFID) readers, and magnetic stripe readers. The Company also offers customized versions of its handheld computers as OEM products to third-party companies. The Company’s cordless hand scanners work with many third-party mobile handheld devices, and the Company’s plug-in data collection products work with the Company’s handheld computers. For a complete description of the Company’s products see “Products” in “Item 1. Business.”
The Company works closely with software application developers offering or developing software applications for use with the Company’s family of cordless barcode scanners and mobile handheld computers. The Company offers software developer kits (SDK) to enable developers to easily integrate the Company’s barcode scanning products into their applications, and to enable greater hardware control in applications using the Company’s mobile handheld computers. The Company’s family of barcode scanners are designed to work with a wide range of smartphones, tablets, and computers running operating systems from Apple (iOS), Google (Android), and Microsoft (Windows/Windows Mobile). The primary segments being addressed by our registered developers are retail point of sale, healthcare, and commercial services. Retail point of sale is the primary market for the Company’s family of cordless barcode scanners. Healthcare and hospitality are two of the primary areas of focus for software application developers who have developed applications for use on the Company’s handheld computers. Other vertical markets benefiting from mobile solutions include inspections, automotive, government and education. These mobile application solutions are designed to improve the productivity of business enterprises and service providers.
The Company subcontracts the manufacturing of substantially all of its products to independent third-party contract manufacturers who are located in the U.S., Mexico, China and Taiwan and who have the equipment, know-how and capacity to manufacture products to the Company’s specifications. The Company markets its products through a worldwide network of distributors and resellers, as well as through original equipment manufacturers and value added resellers. The geographic regions served by the Company include the Americas, Europe, the Middle East, Africa and Asia Pacific. The Company’s total employee headcount on December 31, 2014 was 50 people.
The Company was founded in March 1992 as Socket Communications, Inc. and reincorporated in Delaware in 1995 prior to the Company’s initial public offering in June 1995. The Company began doing business as Socket Mobile, Inc. in January 2007 to better reflect its market focus on the mobile business market, and changed its legal name to Socket Mobile, Inc. in April 2008. The Company’s common stock trades on the OTCQB Marketplace under the symbol “SCKT.” The Company’s principal executive offices are located at 39700 Eureka Drive, Newark, CA 94560.
38 |
SOCKET MOBILE, INC.
NOTES TO FINANCIAL STATEMENTS (Continued)
Liquidity and Going Concern
In 2014, the Company generated $17.0 million in revenue and $0.4 million in net income. However, except for fiscal years 2014 and 2004, the Company incurred significant operating losses in each financial period since inception. As of December 31, 2014, the Company has an accumulated deficit of $60.7 million. The Company’s cash balance at December 31, 2014 was $0.6 million, including $0.8 million advanced on our bank lines of credit. At December 31, 2014, the Company had additional unused borrowing capacity of approximately $0.4 million on our bank lines of credit. The Company’s balance sheet at December 31, 2014 has a current ratio (current assets divided by current liabilities) of 0.6 to 1.0, and a working capital deficit of $2.8 million (current assets less current liabilities). These circumstances raise substantial doubt about our ability to continue as a going concern.
The Company has taken actions to reduce its expenses and to align its cost structure with economic conditions. The Company has the ability to further reduce expenses if necessary. Steps taken by the Company intended to reduce operating losses and achieve profitability include reduction of headcount to manage payroll costs, the introduction of new products, and continued close support of its distributors and registered developers whose applications support the use of the Company’s barcode scanning products. The Company extended the maturity dates on its convertible notes originally issued in 2012 (see NOTE 2 — Related Party Convertible Notes Payable” for more information). The Company completed additional financing in 2013 (see “NOTE 3 — Related Party and Other Short-Term Notes Payable” for more information). The Company believes it will be able to further improve its liquidity and secure additional sources of financing by managing its working capital balances, use of its bank lines of credit, and raising additional capital as needed including the issuance of additional equity securities. However, there can be no assurance that additional capital will be available on acceptable terms, if at all, and any such terms may be dilutive to existing stockholders. The Company’s bank lines of credit may be terminated by the bank or by the Company at any time (see “NOTE 4 – Bank Financing Arrangements”). If the Company cannot maintain ongoing profitability, it will not be able to support its operations from positive cash flows, and would use its existing cash to support operating losses. If the Company is unable to secure the necessary capital for its business, it may need to suspend some or all of its current operations.
To maintain revenue growth and profitability, the Company anticipates requirements for cash will include funding of higher receivable and inventory balances, and increased expenses, including an increase of costs relating to new employees to support its growth and increases in salaries, benefits, and related support costs for employees.
The accompanying financial statements have been prepared assuming that the Company will continue as a going concern, which contemplates the realization of assets and the settlement of liabilities and commitments in the normal course of business. These financial statements do not include any adjustments to reflect the possible future effects on the recoverability and classification of assets or the amounts and classification of liabilities that may result from the Company’s inability to continue as a going concern.
39 |
SOCKET MOBILE, INC.
NOTES TO FINANCIAL STATEMENTS (Continued)
Use of Estimates
The preparation of financial statements in conformity with U.S. generally accepted accounting principles requires management to make estimates and assumptions that affect the reported amounts of assets and liabilities, and the disclosure of contingent assets and liabilities at the date of the financial statements as well as the reported amounts of revenue and expense during the reporting period. Actual results could differ from those estimates, and such differences may be material to the financial statements.
Cash Equivalents
The Company considers all highly liquid investments purchased with a maturity date of 90 days or less at date of purchase to be cash equivalents. As of December 31, 2014 and 2013, all of the Company’s cash and cash equivalents consisted of demand and money market deposits held in accounts within a single bank.
Fair Value of Financial Instruments
The carrying value of the Company’s cash and cash equivalents, accounts receivable, accounts payable, debt and foreign exchange contracts approximate fair value due to the relatively short period of time to maturity.
Derivative Financial Instruments
The Company's primary objective for holding derivative financial instruments is to manage foreign currency risks. The Company's derivative financial instruments are recorded at fair value and are included in other current assets, other assets, other accrued liabilities or long-term debt depending on the contractual maturity and whether the Company has a gain or loss. The Company's accounting policies for these instruments are based on whether they meet the Company's criteria for designation as hedging transactions, either as cash flow or fair value hedges. A hedge of the exposure to variability in the cash flows of an asset or a liability, or of a forecasted transaction, is referred to as a cash flow hedge. A hedge of the exposure to changes in fair value of an asset or a liability, or of an unrecognized firm commitment, is referred to as a fair value hedge. The criteria for designating a derivative as a hedge include the instrument's effectiveness in risk reduction and, in most cases, a one-to-one matching of the derivative instrument to its underlying transaction. Gains and losses on derivatives that do not qualify for hedge accounting are recognized immediately in earnings. The Company regularly enters into forward foreign currency contracts to reduce exposures related to rate changes in certain foreign currencies.
The Company's forward foreign currency contracts were recorded at fair value at December 31, 2014. At December 31, 2014, these derivative instruments were not designated as hedges, and accordingly, changes in the fair value of the forward foreign currency contracts were recorded in earnings. At December 31, 2014 contracts with a notional amount of $302,500 to hedge Euros had a fair value of an immaterial amount based on quotations from financial institutions, and had maturity dates in January 2015. At December 31, 2013 contracts with a notional amount of $171,750 to hedge Euros had a fair value of an immaterial amount based on quotations from financial institutions, and had maturity dates in January 2014.
40 |
SOCKET MOBILE, INC.
NOTES TO FINANCIAL STATEMENTS (Continued)
Foreign Currency
The functional currency for the Company is the U.S. dollar. However, the Company requires European distributors to purchase products in Euros and pays the expenses of European employees in Euros and British pounds. The Company hedges a significant portion of the European receivables balance denominated in Euros to reduce the foreign currency risk associates with these assets. In 2014, the total net adjustment for the effects of changes in foreign currency on cash balances, collections, payables, and derivatives used to hedge foreign currency risks, was a net loss of $14,000 compared to a net loss of $1,000 in 2013.
Accounts Receivable Allowances
The Company estimates the amount of uncollectible accounts receivable at the end of each reporting period based on the aging of the receivable balance, current and historical customer trends, and communications with its customers. Amounts are written off only after considerable collection efforts have been made and the amounts are determined to be uncollectible. The following describes activity in the allowance for doubtful accounts for the years ended December 31, 2014 and 2013:
| Year | Balance at Beginning of Year | Charged to Costs and Expenses | Amounts Written Off | Balance at End of Year | ||||||||||||||
| 2014 | $ | 89,058 | $ | — | $ | — | $ | 89,058 | ||||||||||
| 2013 | $ | 89,058 | $ | — | $ | — | $ | 89,058 | ||||||||||
Inventories
Inventories consist principally of raw materials and sub-assemblies stated at the lower of standard cost, which approximates actual costs (first-in, first-out method), or market. Market is defined as replacement cost, but not in excess of estimated net realizable value or less than estimated net realizable value less a normal margin. At the end of each reporting period, the Company compares its inventory on hand to its forecasted requirements for the next nine-month period and the Company writes-off the cost of any inventory that is surplus, less any amounts that the Company believes it can recover from the disposal of goods that it specifically believes will be saleable past a nine- month horizon. The Company’s sales forecasts are based upon historical trends, communications from customers, and marketing data regarding market trends and dynamics. Changes in the amounts recorded for surplus or obsolete inventory are included in cost of revenue. Inventory components at year-end, net of write-downs, are presented in the following table:
| December 31, | ||||||||
| 2014 | 2013 | |||||||
| Raw materials and sub-assemblies | $ | 930,886 | $ | 1,045,356 | ||||
| Finished goods | 26,441 | 59,732 | ||||||
| $ | 957,327 | $ | 1,105,088 | |||||
41 |
SOCKET MOBILE, INC.
NOTES TO FINANCIAL STATEMENTS (Continued)
Property and Equipment
Property and equipment are stated at cost. Depreciation and amortization are computed using the straight-line method, over the estimated useful lives of the assets ranging from one to five years. Assets under capital leases are amortized in a manner consistent with the Company’s normal depreciation policy for owned assets, or the remaining lease term as applicable. Depreciation expense in the years ended December 31, 2014 and 2013, was $216,577 and $221,337, respectively.
Goodwill
Goodwill is tested for impairment annually as of September 30th or more frequently when events or circumstances indicate that the carrying value of the Company's single reporting unit more likely than not exceeds its fair value. The Company performed its annual goodwill impairment analysis as of September 30, 2014. The Company used the two-step test as required to assess goodwill for impairment. The first step of the goodwill impairment test consisted of comparing the carrying value of the reporting unit to its fair value. Management estimated the fair value of the Company's reporting unit using various methods and compared the fair value to the carrying amount (net book value) to ascertain if potential goodwill impairment existed. The Company utilized methods that focused on its ability to produce income ("Income Approach") and the Company’s market capitalization ("Market Capitalization Approach"). Key assumptions utilized in the determination of fair value in step one of the test included the following: the Company's market capitalization; revenue and expense forecasts used in the evaluation were based on trends of historical performance and management's estimate of future performance; cash flows utilized in the discounted cash flow analysis were estimated using a weighted average cost of capital determined to be appropriate for the Company. No impairment of goodwill was recorded in the two years ended December 31, 2014.
Deferred Rent
The Company operates its headquarters under a non-cancelable operating lease. The Company recognizes rent expense under its lease on a straight line basis measured over the term of the lease. The excess of accumulated rental expense measured on a straight lined basis over actual accumulated rent paid is capitalized as a liability on the Company’s balance sheet in its short and long term components. Deferred rent at December 31, 2014 and December 31, 2013 was $263,476 and $228,773, respectively, and was classified as long term at each reporting date.
42 |
SOCKET MOBILE, INC.
NOTES TO FINANCIAL STATEMENTS (Continued)
Concentration of Credit Risk
Financial instruments that potentially subject the Company to significant concentrations of credit risk consist principally of cash, cash equivalents and accounts receivable. The Company invests its cash in demand and money market deposit accounts in banks. To the extent of the amounts recorded on the balance sheet, cash is concentrated at the Company’s bank to the extent needed to comply with the minimum liquidity ratio of the bank line agreement. To date, the Company has not experienced losses on these investments. The Company’s trade accounts receivables are primarily with distributors and original equipment manufacturers (OEMs). The Company performs ongoing credit evaluations of its customers’ financial conditions but the Company generally requires no collateral. Reserves are maintained for potential credit losses, and such losses have been within management’s expectations. Customers who accounted for at least 10% of the Company’s accounts receivable balances at December 31, 2014 and December 31, 2013 were as follows:
| December 31, | December 31, | |||||||
| 2014 | 2013 | |||||||
| Company A | 42 | % | 43 | % | ||||
| Company B | 25 | % | 28 | % | ||||
| Company C | 14 | % | 14 | % | ||||
Concentration of Suppliers
Several of the Company’s component parts are produced by a sole or limited number of suppliers. Shortages could occur in these essential materials due to an interruption of supply or increased demand in the industry. If the Company were unable to procure certain of such materials, it would be required to reduce its operations, which could have a material adverse effect upon its results. At December 31, 2014 and December 31, 2013, 22% and 28%, respectively, of the Company’s accounts payable balances were concentrated in a single supplier. For the years ended December 31, 2014 and 2013, this supplier and two other suppliers accounted for 71% and 63%, respectively, of the inventory purchases in each of these years.
Revenue Recognition and Deferred Income
Revenue on sales to customers other than distributors is recognized upon shipment provided that persuasive evidence of a sales arrangement exists, the price is fixed or determinable, title has transferred, collection of resulting receivables is reasonably assured, there are no customer acceptance requirements, and there are no remaining significant obligations. Revenue on sales to distributors where a right of return exists is recognized upon “sell-through,” when products are shipped from the distributor to the distributor’s customer. Revenue related to those products in the Company’s distribution channel at the end of each reporting period which has not sold-through is deferred. The amount of deferred revenue net of related cost of revenue is classified as deferred income on shipments to distributors on the Company’s balance sheet. At December 31, 2014 and December 31, 2013, deferred income on shipments to distributors represented deferred revenues totaling $2,012,217 and $2,144,546, respectively, net of related costs of those revenues of $1,033,662 and $1,138,489, respectively.
The Company defers revenue and income on advance payments from customers when performance obligations have yet to be completed and/or services performed. Such deferred revenue does not include amounts related to products delivered to distributors which have not sold-through to the distributors’ end customers as described above.
43 |
SOCKET MOBILE, INC.
NOTES TO FINANCIAL STATEMENTS (Continued)
The Company also earns revenue from its SocketCare services program which provides for extended warranty and accidental breakage coverage for selected products. Service purchased at the time of product purchase provides for coverage in two-year and three-year terms. We additionally offer comprehensive coverage and program term extensions. Revenues from the SocketCare services program are recognized ratably over the life of the extended warranty contract. The amount of unrecognized warranty service revenue is classified as deferred service revenue and presented on the Company’s balance sheet in its short and long term components. The Company also earns revenue from services performed in connection with consulting arrangements. For those contracts that include contract milestones or acceptance criteria, the Company recognizes revenue as such milestones are achieved or as such acceptance occurs. In some instances the acceptance criteria in the contract requires acceptance after all services are complete and all other elements have been delivered. Revenue recognition is deferred until those requirements are met. Revenues related to these services in the years presented were not material.
Warranty
The Company’s products typically carry a one year warranty. The Company reserves for estimated product warranty costs at the time revenue is recognized based upon the Company’s historical warranty experience, and additionally for any known product warranty issues. If actual costs differ from initial estimates, the Company records the difference in the period they are identified. Actual claims are charged against the warranty reserve. The following describes activity in the reserves for product warranty costs for the years ended December 31, 2014 and 2013:
| Year | Balance at Beginning of Year | Additional Warranty Reserves | Amounts Charged to Reserves | Balance at End of Year | ||||||||||||||
| 2014 | $ | 69,554 | $ | 44,817 | $ | (35,500 | ) | $ | 78,871 | |||||||||
| 2013 | $ | 74,554 | $ | 40,562 | $ | (45,562 | ) | $ | 69,554 | |||||||||
Research and Development
Research and development expenditures are charged to operations as incurred. The major components of research and development costs include salaries and employee benefits, stock-based compensation expense, third party development costs including consultants and outside services, and allocations of overhead and occupancy costs.
The accounting for the costs of computer software to be sold, leased or otherwise marketed, requires the capitalization of certain software development costs subsequent to the establishment of technological feasibility. Based on the Company’s product development process, technological feasibility is established upon the completion of a working model. Costs incurred by the Company between the completion of the working model and the point at which the product is ready for general release have been insignificant. Accordingly, the Company has charged all such costs to research and development expenses in the accompanying statements of operations.
44 |
SOCKET MOBILE, INC.
NOTES TO FINANCIAL STATEMENTS (Continued)
Advertising Costs
Advertising costs are charged to sales and marketing as incurred. The Company incurred $186,530 and $217,881, in advertising costs during 2014 and 2013, respectively.
Income Taxes
The Company uses the asset and liability method to account for income taxes. Deferred tax assets and liabilities are determined based on differences between financial reporting and tax bases of assets and liabilities and are measured using enacted tax rates and laws that will be in effect when the differences are expected to reverse. The Company records a valuation allowance against deferred tax assets when it is more likely than not that such assets will not be realized. The effect on deferred tax assets and liabilities of a change in tax rates is recognized in income in the period that includes the enactment date.
The Company recognizes the tax benefit from uncertain tax positions if it is more likely than not that the tax positions will be sustained on examination by the tax authorities, based on the technical merits of the position. The tax benefit is measured based on the largest benefit that has a greater than 50% likelihood of being realized upon ultimate settlement. It is the Company's policy to include interest and penalties related to tax positions as a component of income tax expense.
Shipping and handling costs
Shipping and handling costs are included in the cost of revenues in the statement of operations.
Net Income (Loss) Per Share
The following table sets forth the computation of basic and diluted net loss per share:
| Years Ended December 31, | ||||||||
| 2014 | 2013 | |||||||
| Numerator: | ||||||||
| Net income (loss) | $ | 432,117 | $ | (620,493 | ) | |||
| Denominator: | ||||||||
| Weighted average shares outstanding used in computing net income (loss) per share: | ||||||||
| Basic | 5,005,579 | 4,865,036 | ||||||
| Diluted | 5,250,914 | 4,865,036 | ||||||
| Net income (loss) per share applicable to common stockholders: | ||||||||
| Basic | $ | 0.09 | $ | (0.13 | ) | |||
| Diluted | $ | 0.08 | $ | (0.13 | ) | |||
45 |
SOCKET MOBILE, INC.
NOTES TO FINANCIAL STATEMENTS (Continued)
For the 2014 period presented, the diluted shares outstanding include the dilutive effect of assumed conversion of convertible notes and assumed exercise of all in-the-money employee stock options and warrants, which is calculated based on the average share price for the 2014 fiscal period using the treasury stock method. Under the treasury stock method, the hypothetically received proceeds from the exercise of in-the-money options and warrants are assumed to be used to repurchase shares. For 2014, options and warrants to purchase, and shares issuable for convertible notes and related accrued interest, totaling 2,325,260 shares of the Company’s Common Stock were excluded from the calculation of the diluted earnings per share because the exercise prices were greater than or equal to the average price of the common shares, and therefore their inclusion would have been anti-dilutive. For the 2013 period presented, the diluted net loss per share is equivalent to the basic net loss per share because the Company experienced losses and thus no potential common shares underlying stock options or warrants, or shares underlying conversion of convertible notes, have been included in the net loss per share calculation as their effect is anti-dilutive. For 2013, options and warrants to purchase, and shares issuable for convertible notes and related accrued interest, totaling 3,342,915 shares of common stock, have been omitted from the income (loss) per share calculation.
Stock-Based Compensation Expense
The Company has incentive plans that reward employees with stock options. The amount of compensation cost for these stock-based awards is measured based on the fair value of the awards as of the date that the awards are issued. The fair values of stock options are generally determined using a binomial lattice valuation model which incorporates assumptions about expected volatility, risk-free interest rate, dividend yield, and expected life. Compensation cost for stock-based awards is recognized on a straight-line basis over the vesting period.
Segment Information
Operating segments are defined as components of an enterprise about which separate financial information is available that is evaluated regularly by the chief executive officer in deciding how to allocate resources and in assessing performance.
The Company operates in one segment—mobile systems solutions for businesses. Mobile systems solutions typically consist of a handheld computer or other mobile device such as a smartphone or tablet, some with data collection peripherals, and third-party vertical applications software. The Company markets its products in the United States and foreign countries through its sales personnel and distributors.
Revenues for the geographic areas for the years ended December 31, 2014 and 2013 are as follows:
| Years Ended December 31, | ||||||||
| Revenues: (in thousands) | 2014 | 2013 | ||||||
| United States | $ | 12,840 | $ | 10,918 | ||||
| Europe | 2,864 | 2,728 | ||||||
| Asia and rest of world | 1,317 | 2,015 | ||||||
| $ | 17,021 | $ | 15,661 | |||||
Export revenues are attributable to countries based on the location of the Company’s customers. The Company does not hold long-lived assets in foreign locations.
46 |
SOCKET MOBILE, INC.
NOTES TO FINANCIAL STATEMENTS (Continued)
Information regarding product families for the years ended December 31, 2014 and 2013 is as follows:
| Years Ended December 31, | ||||||||
| Revenues: (in thousands) | 2014 | 2013 | ||||||
| Cordless barcode scanning and related product and service | $ | 13,665 | $ | 9,747 | ||||
| Mobile handheld computer and related product and service | 3,256 | 5,287 | ||||||
| OEM and legacy products | 100 | 627 | ||||||
| $ | 17,021 | $ | 15,661 | |||||
Major Customers
Customers who accounted for at least 10% of total revenues for the years ended December 31, 2014 and 2013 were as follows:
| Years Ended December 31, | ||||||||
| 2014 | 2013 | |||||||
| Ingram Micro Inc. | 31 | % | 20 | % | ||||
| Scansource, Inc. | 19 | % | 20 | % | ||||
| BlueStar, Inc. | 17 | % | 15 | % | ||||
Reclassification of Financial Statement Accounts
Certain amounts in the December 31, 2013 financial statements have been reclassified to conform to the presentation in the December 31, 2014 financial statements.
Recently Issued Financial Accounting Standards
In August 2014, the Financial Accounting Standards Board ("FASB") issued Accounting Standards Update (ASU) 2014-15, which requires management to assess, at each annual and interim reporting period, the entity's ability to continue as a going concern within one year after the date that the financial statements are issued and provide related disclosures. The guidance is effective for the year ended December 31, 2016, with early adoption permitted. We have assessed the impact of this standard and do not believe that it will have a material impact on our consolidated financial statements or disclosures upon adoption.
In May 2014, the FASB issued authoritative guidance amending the FASB Accounting Standards Codification and creating a new Topic 606, Revenue from Contracts with Customers. The new guidance clarifies the principles for recognizing revenue and develops a common revenue standard for U.S. GAAP applicable to revenue transactions. This guidance provides that an entity should recognize revenue to depict the transfer of promised goods or services to customers in an amount that reflects the consideration to which the entity expects to be entitled in exchange for those goods or services. The existing industry guidance will be eliminated when the new guidance becomes effective and annual disclosures will be substantially revised. The amendments in the new guidance are effective for annual reporting periods beginning after December 15, 2016, including interim periods within those reporting periods. Early application is not permitted. We intend to adopt the new standard effective January 1, 2017. This update provides for two transition methods to the new guidance: a full retrospective or a modified retrospective adoption. We are evaluating the transition methods and the anticipated impact the application of this guidance will have on our financial position, results of operations and cash flows.
47 |
SOCKET MOBILE, INC.
NOTES TO FINANCIAL STATEMENTS (Continued)
In July 2013, the FASB issued authoritative guidance which concludes that, under certain circumstances, unrecognized tax benefits should be presented in the financial statements as a reduction to a deferred tax asset for a net operating loss carry-forward, a similar tax loss, or a tax credit carry-forward. We adopted this guidance early, as permitted, for the fiscal year ended December 31, 2013. The adoption of this guidance did not have a material effect on our consolidated financial statements.
NOTE 2 — Related Party Convertible Notes Payable
Short Term Related Party Convertible Notes Payable
Short term related party convertible notes payable at December 31, 2014 and December 31, 2013 are $380,696 and $405,696 respectively. The notes were issued on September 4, 2013 to officers and directors of the Company and mature on September 4, 2017. The notes have an interest rate of 8% per annum that compounds quarterly, and contain a holder call provision that became effective on September 4, 2014. The notes are convertible into common stock at the option of the holder at $2.44 per share as long as warrants issued on November 19, 2010 are outstanding (warrants expire May 20, 2016) or at $1.25 per share. The convertible notes are secured by all of the assets of the Company and are subordinated to amounts outstanding under the Company’s working capital bank line of credit with the Company’s bank.
The notes described in the preceding paragraph replaced two-year notes and accrued interest originally issued on August 1, 2012 and expiring on August 1, 2014. $25,000 in original note principal plus accrued interest of $1,216 was repaid prior to issuance of the four-year notes described above. $25,000 of note principal of the original notes was not converted and the principal plus accrued interest of $3,420 was repaid in April 2014.
Long Term Related Party Convertible Notes Payable
Long term related party convertible notes payable at December 31, 2014 and December 31, 2013 are $371,929. The notes were issued on September 4, 2013 to the Company’s Chairman and mature on September 4, 2017. The notes have an interest rate of 18% per annum that compounds quarterly. The notes are convertible into common stock at the option of the holder at $2.44 per share as long as warrants issued on November 19, 2010 are outstanding (warrants expire May 20, 2016) or at $1.25 per share. The convertible notes are secured by all of the assets of the Company and are subordinated to amounts outstanding under the Company’s working capital bank line of credit with the Company’s bank.
The notes described in the preceding paragraph replaced notes issued at various dates in November and December 2012 plus accrued interest.
48 |
SOCKET MOBILE, INC.
NOTES TO FINANCIAL STATEMENTS (Continued)
Other Information Pertaining to Short and Long Term Convertible Notes Payable
For the short and long term replacement notes issued on September 4, 2013, the Company determined per ASC 470-50-40-10a, that the fair value of the embedded conversion option in the reissued convertible notes as a result of the change in conversion price and term, increased by more than 10% from the original notes. Therefore, debt extinguishment accounting rules apply. Accordingly, the reissued convertible notes payable were initially recorded at fair value; however, as there was no difference between the reissued amount of the notes and the net carrying amount of the original notes, no gain or loss was recorded. Accrued interest expense at December 31, 2014 related to all convertible subordinated notes outstanding was $140,078.
NOTE 3 — Related Party and Other Short-Term Notes Payable
On January 31, 2013, the Company’s Board of Directors approved a subordinated line of credit of up to $1,000,000 including up to $550,000 in advances by the Company’s Chairman. The funds raised are being used for working capital purposes. On December 31, 2014, a total of $600,000 in notes payable were outstanding under this line, of which $450,000 and $50,000 respectively are from the Company’s Chairman and Chief Executive Officer. The notes mature on June 1, 2016, and are repayable by the Company at any time and have an interest rate of 18% per annum payable monthly in cash. Beginning October 1, 2014, investors may request note repayment at will. Balances under the line of credit are secured by all of the assets of the Company and are subordinated to amounts outstanding under the Company’s credit facility with its bank. Interest expenses at December 31, 2014 and December 31, 2013, related to the line of credit notes were $207,299 and $263,771 respectively.
The notes originally issued under the subordinated line of credit had an initial expiration date of December 1, 2013, which in November 2013 was extended to June 1, 2014. Interest on the original notes accrued at the rate of 1% per week and was paid weekly through the extended maturity date of June 1, 2014. On May 15, 2014, the Company’s Board of Directors approved the issue of subordinated notes totaling $650,000 to replace the subordinated line of credit notes in the same amount maturing on June 1, 2014 mentioned previously. The replacement subordinated notes are two-year notes that mature on June 1, 2016 as discussed in the preceding paragraph. The Company extended the expiration date of 35,775 warrants originally issued to the outside investors on May 26, 2009 to June 1, 2016. These warrants were scheduled to expire on May 26, 2014. The warrants are exercisable into common stock at $1.80 per share. The Board approved stock option grants of 45,000 and 5,000 shares respectively for the Company’s Chairman and Chief Executive Officer. These stock options will vest monthly over a 24 month period
The Company determined per ASC 470-50-40-10, that the present value of the cash flows under the terms of the replacement subordinated notes payable differed by more than 10 percent from the present value of the remaining cash flows of the subordinated notes being replaced. Therefore, debt extinguishment accounting rules apply. There was no change in the net carrying value of the subordinated notes. However, the value of the options granted as consideration in connection with the issuance of the replacement subordinated notes was determined to be $61,500, of which the full amount was accordingly recorded as a loss on extinguishment of debt in the three month period ending June 30, 2014, and shown in the accompanying Statements of Operations for the year ended December 31, 2014.
49 |
SOCKET MOBILE, INC.
NOTES TO FINANCIAL STATEMENTS (Continued)
NOTE 4 — Bank Financing Arrangements
On February 27, 2014, the Company entered into a credit facility agreement with Bridge Bank (the “Bank”). The credit facility was activated and transfer of the credit facility from the Company’s former bank was completed on March 7, 2014. The revolving credit line agreement is for a two year period ending February 27, 2016. Under the terms of the credit facility agreement with the Bank, the Company may borrow up to $2.5 million, of which up to $1.5 million is based on qualified receivables from domestic customers and up to $1.0 million is based on qualified receivables from international customers. The Company’s total borrowings under the line may not exceed 50% of the sum of cash plus qualified receivables. Advances against the domestic and international lines are calculated at 70% of qualified receivables. Borrowings under the lines bear an annual interest rate equal to the Bank’s prime rate (minimum of 3.25%) plus 1.5%. The annual interest rate in effect beginning March 7, 2014 is 4.75% per annum. There is also a collateral handling fee of 0.2% per month of the financed receivables outstanding. The applicable interest and fees are calculated based on the actual amounts borrowed. At December 31, 2014, the effective rate (interest plus all applicable fees) on actual cash advanced is 7.15% per annum. The borrowings under the credit facility are secured by a first priority security interest in the assets of the Company. All advances are at the Bank’s discretion and the Bank is not obligated to make advances. The agreement may be terminated by the Company or by the Bank at any time. The outstanding amounts borrowed under the domestic line at December 31, 2014 were $815,981. There were no amounts borrowed under the international line at December 31, 2014.
On March 23, 2015, the Company signed a Business Financing Modification Agreement by and between the Company and the Bank to extend the expiration date of a revolving credit line agreement for the domestic (U.S. based) portion of the line from February 27, 2016 to February 27, 2017. All other terms of the revolving credit line agreement remain unchanged.
During 2013 and up through March 7, 2014, the Company had a credit facility agreement with Silicon Valley Bank. The credit facility allowed the Company to borrow up to $2,500,000 based on the level of qualified domestic and international receivables, up to a maximum of $1,500,000 and $1,000,000, respectively. Advances against the domestic line were calculated at 80% of qualified receivables except for receivables from distributors which are calculated at 60%. Advances against the international line were calculated at 90% against qualified hedged receivables and 70% against qualified non-hedged receivables and receivables from distributors. Borrowings under the lines bore an annual interest rate equal to the greater of (i) the Bank’s prime rate plus 1%, or (ii) 5%. The rate in effect through March 7, 2014 was 5%. There was also a collateral handling fee of 0.25% per month of the financed receivable balance outstanding. The applicable interest and fees were calculated based on the full amount of the accounts receivable provided as collateral for the actual amounts borrowed. The effective rate (interest plus all applicable fees) on actual cash advances in 2013 was 13.6% per annum. The outstanding amounts borrowed under the domestic and international lines at December 31, 2013 were $655,130 and $108,357, respectively, and the full amounts of accounts receivable provided as collateral were $1,078,053, and $153,372, respectively. The outstanding amount borrowed at March 7, 2014 was $751,906, which was transferred to our new bank line of credit with Bridge Bank.
Total interest expense on the amounts drawn under the Company’s bank credit lines in effect during the years ended December 31, 2014 and 2013, was $69,874 and $117,551, respectively. Accrued interest related to the amounts outstanding under the Company’s bank lines of credit at December 31, 2014 and December 31, 2013 was $3,981 and $7,019, respectively.
50 |
SOCKET MOBILE, INC.
NOTES TO FINANCIAL STATEMENTS (Continued)
NOTE 5 — Intangible Assets
Intangible assets consist of a patent purchased in 2004 for $600,000 covering the design and functioning of plug-in bar code scanners, bar code imagers, and radio frequency identification products, which was amortized on a straight line basis over its estimated life of ten years. The Company completed the amortization of the patent in the first half of 2014. Intangible assets of $570,750 remaining from a prior acquisition in 2000 consisting of developed software and technology with estimated lives at the time of acquisition of 8.5 years was fully amortized in the quarter ended June 30, 2009.
Amortization of all intangible assets in the years ended December 31, 2014 and 2013, was $30,000 and $60,000, respectively, and is included in research and development expense. Intangible assets as of December 31, 2014 consisted of the following:
| Gross Assets | Accumulated Amortization | Net | ||||||||||
| Patent | $ | 600,000 | $ | 600,000 | $ | — | ||||||
| Project management tools | 570,750 | 570,750 | — | |||||||||
| Total intangible assets | $ | 1,170,750 | $ | 1,170,750 | $ | — | ||||||
Intangible assets as of December 31, 2013 consisted of the following:
| Gross Assets | Accumulated Amortization | Net | ||||||||||
| Patent | $ | 600,000 | $ | 570,000 | $ | 30,000 | ||||||
| Project management tools | 570,750 | 570,750 | — | |||||||||
| Total intangible assets | $ | 1,170,750 | $ | 1,140,750 | $ | 30,000 | ||||||
NOTE 6 — Commitments and Contingencies
Operating Lease
The Company operates its headquarters under a non-cancelable operating lease which provides for the lease by the Company of approximately 37,100 square feet of space in Newark, California. On December 28, 2012, the Company amended its commercial building lease agreement to extend the term of the lease to June 30, 2022. The base rent under the facilities lease was $29,705 per month for the period from July 1, 2012 through June 30, 2013. The base rent increases annually thereafter at a rate of four percent per year for the remaining term of the lease ending June 30, 2022.
51 |
SOCKET MOBILE, INC.
NOTES TO FINANCIAL STATEMENTS (Continued)
Future minimum lease payments under all operating leases are as shown below:
| Annual minimum payments: | Amount | |||||
| 2015 | $ | 393,255 | ||||
| 2016 | 408,986 | |||||
| 2017 | 425,345 | |||||
| 2018 | 442,359 | |||||
| 2019 to 2022 | 1,689,777 | |||||
| Total minimum payments | $ | 3,359,722 | ||||
Rental expense under all operating leases for the years ended December 31, 2014 and 2013 was $428,647 and $427,827, respectively. The amount of deferred rent at December 31, 2014 and December 31, 2013 was $263,476 and $228,773, respectively.
Capital Lease Obligations
The Company leases certain of its equipment under capital leases. The leases are collateralized by the underlying assets. At December 31, 2014 and 2013, property and equipment with a cost of $87,945, was subject to such financing arrangements. Related accumulated amortization at December 31, 2014 and December 31, 2013, amounted to $22,408 and $20,518, respectively.
Future minimum payments under capital lease and equipment financing arrangements as of December 31, 2014, are as follows:
| Annual minimum payments: | Amount | |||
| 2015 | 27,531 | |||
| 2016 | 12,449 | |||
| Total minimum payments | 39,980 | |||
| Less amount representing interest | (2,764 | ) | ||
| Present value of net minimum payments | $ | 37,216 | ||
| Short term portion of capital leases | (25,102 | ) | ||
| Long term portion of capital leases | $ | 12,114 | ||
Purchase Commitments
At December 31, 2014, the Company’s non-cancelable purchase commitments for inventory to be used in the ordinary course of business during the first nine months of 2015 were approximately $1,404,000.
Legal Matters
The Company is subject to disputes, claims, requests for indemnification and lawsuits arising in the ordinary course of business. Under the indemnification provisions of the Company’s customer agreements, the Company routinely agrees to indemnify and defend its customers against infringement of any patent, trademark, copyright, trade secrets, or other intellectual property rights arising from customers’ legal use of the Company’s products or services. The exposure to the Company under these indemnification provisions is generally limited to the total amount paid for the indemnified products. However, certain indemnification provisions potentially expose the Company to losses in excess of the aggregate amount received from the customer. To date, there have been no claims against the Company by its customers pertaining to such indemnification provisions, and no amounts have been recorded.
52 |
SOCKET MOBILE, INC.
NOTES TO FINANCIAL STATEMENTS (Continued)
On October 9, 2013, Hudson Bay Master Fund Ltd. filed a complaint in the United States District Court for the Northern District of Illinois, Eastern Division, alleging that the Company had triggered anti-dilution provisions of its warrant and was entitled to adjustment of the exercise price and the number of shares. The warrant was issued on November 19, 2010 for 500,000 shares at an exercise price of $2.44 per share. On December 28, 2013, the Company agreed to a settlement with Hudson Bay Master Fund Ltd. and the case was dismissed without judgment as to the merits of Hudson Bay Master Fund’s allegations. In the settlement, the Company agreed to amend the warrant to reset the conversion price to $1.25 per share under the anti-dilution provisions of the warrant, and increase the number of common shares issuable upon exercise to 976,000 shares, which retains the total amount of proceeds under the terms of the original warrant. The amended warrant is a continuation of the original warrant under the anti-dilution terms and does not constitute a change in the underlying warrant. The Company also agreed to issue 37,500 shares of common stock to the warrant holder, valued at the reported closing price on December 31, 2013 of $0.76 per share, resulting in an expense of $28,500 in the fourth quarter of 2013. The shares of common stock were subsequently issued in January 2014.
NOTE 7 — Share-Based Compensation Plan
Stock Option Plan
The Company has one Stock Option Plan in effect in the two years presented: the 2004 Equity Incentive Plan (the “2004 Plan”). The 2004 Plan provides for the grant of incentive stock options, non-statutory stock options, restricted stock, stock appreciation rights, and performance awards to employees, directors, and consultants of the Company. Upon ratification of the 2004 Plan by the shareholders in June 2004, shares in the 1995 Plan that had been reserved but not issued, as well as any shares issued that would otherwise return to the 1995 Plan as a result of termination of options or repurchase of shares, were added to the shares reserved for issuance under the 2004 Plan. The Company grants incentive stock options and non-statutory stock options at an exercise price per share equal to the fair market value per share of common stock on the date of grant. The vesting and exercise provisions are determined by the Board of Directors, with a maximum term of ten years. The 2004 Plan expires on April 23, 2024.
The Company calculates the value of each stock option grant, estimated on the date of grant, using binomial lattice option pricing model. The weighted-average estimated fair value of stock options granted during 2014 and 2013 was $0.96 and $0.77, respectively, using the following weighted-average assumptions:
| Years Ended December 31, | ||||||||
| 2014 | 2013 | |||||||
| Risk-free interest rate (%) | 2.56 | % | 2.01 | % | ||||
| Dividend yield | — | — | ||||||
| Volatility factor | 87.44 | % | 85.93 | % | ||||
| Expected option life (years) | 4.6 | 4.7 | ||||||
53 |
SOCKET MOBILE, INC.
NOTES TO FINANCIAL STATEMENTS (Continued)
The table below presents information related to sock option activity for the years ended December 31, 2014 and 2013:
| December 31, | ||||||||
| 2014 | 2013 | |||||||
| Total intrinsic value of stock options exercised | $ | 20,684 | $ | 4,140 | ||||
| Cash received from stock option exercises | 44,771 | 6,480 | ||||||
Changes in stock options for the years ended December 31, 2014 and 2013 are as follows:
| Outstanding Options | ||||||||||||||||||||
| |
Options Available For Grant |
Number of Shares | Weighted Average Price Per Share | Remaining Contractual Term (in years) |
Intrinsic | |||||||||||||||
| Balance at December 31, 2012 | 62,438 | 1,624,188 | $ | 2.47 | ||||||||||||||||
| Increase in shares authorized | 194,442 | — | ||||||||||||||||||
| Granted | (241,900 | ) | 241,900 | $ | 1.16 | |||||||||||||||
| Exercised | — | (6,000 | ) | $ | 1.08 | |||||||||||||||
| Canceled | 200,918 | (200,918 | ) | $ | 2.41 | |||||||||||||||
| Balance at December 31, 2013 | 215,898 | 1,659,170 | $ | 2.29 | ||||||||||||||||
| Increase in shares authorized | 194,682 | — | ||||||||||||||||||
| Granted | (382,000 | ) | 382,000 | $ | 1.41 | |||||||||||||||
| Exercised | — | (31,475 | ) | $ | 1.50 | |||||||||||||||
| Canceled | 118,637 | (118,637 | ) | $ | 2.65 | |||||||||||||||
| Balance at December 31, 2014 | 147,217 | 1,891,058 | $ | 2.09 | 6.33 | $ | 969,705 | |||||||||||||
| Exercisable | 1,430,394 | $ | 2.32 | 5.67 | 526,341 | |||||||||||||||
| Unvested | 460,664 | $ | 1.42 | 8.17 | 443,364 | |||||||||||||||
The 2004 Plan provides for an annual increase in the number of shares authorized under the plan to be added on the first day of each fiscal year equal to the lesser of 200,000 shares, four percent of the outstanding shares on that date, or a lesser amount as determined by the Board of Directors. On January 1, 2015, 2014, and 2013, a total of 200,000, 194,682, and 194,442 additional shares, respectively, became available for grant from the 2004 Plan. As of March 23, 2015, 201,200 stock options at a weighted average grant price of $2.27 per share have been granted from the 2004 Plan subsequent to December 31, 2014.
54 |
SOCKET MOBILE, INC.
NOTES TO FINANCIAL STATEMENTS (Continued)
The following table summarizes information about stock options outstanding and exercisable at December 31, 2014:
| Options Outstanding | Options Exercisable | |||||||||||||
| Range of Exercise Prices |
Number of Options Outstanding | Weighted Average Remaining Life (Years) | Weighted Average Exercise Price | Number of Options Exercisable | Weighted Average Exercise Price | |||||||||
| $0.95 - $1.10 | 478,986 | 8.58 | $ | 0.95 | 212,861 | $ | 1.05 | |||||||
| $1.20 - $1.25 | 58,000 | 8.50 | $ | 1.22 | 30,583 | $ | 1.20 | |||||||
| $1.50 - $1.80 | 207,088 | 7.25 | $ | 1.71 | 180,747 | $ | 1.72 | |||||||
| $1.89 - $2.27 | 340,035 | 6.42 | $ | 2.03 | 275,923 | $ | 2.04 | |||||||
| $2.35 - $2.74 | 225,967 | 2.00 | $ | 2.50 | 149,298 | $ | 2.52 | |||||||
| $3.04 - $3.45 | 577,792 | 5.50 | $ | 3.08 | 577,792 | $ | 3.08 | |||||||
| $6.90 - $7.20 | 1,050 | 3.50 | $ | 6.94 | 1,050 | $ | 6.94 | |||||||
| $10.00 - $11.70 | 1,790 | 1.67 | $ | 10.80 | 1,790 | $ | 10.80 | |||||||
| $15.00 | 350 | 0.08 | $ | 15.00 | 350 | $ | 15.00 | |||||||
| $0.95 - $15.00 | 1,891,058 | 6.33 | $ | 2.09 | 1,430,394 | $ | 2.32 | |||||||
Stock-Based Compensation Expense
The stock-based compensation expense included in the Company’s statement of operations for the years ended December 31, 2014 and 2013, consisted of the following:
| Years Ended December 31, | ||||||||
| Income Statement Classification | 2014 | 2013 | ||||||
| Cost of revenues | $ | 21,597 | $ | 26,196 | ||||
| Research and development | 54,679 | 72,104 | ||||||
| Sales and marketing | 33,030 | 43,970 | ||||||
| General and administrative | 95,372 | 107,434 | ||||||
| $ | 204,678 | $ | 249,704 | |||||
As of December 31, 2014, the total remaining unamortized stock-based compensation expense was $365,279, and is expected to be amortized over a weighted average period of 2.72 years.
55 |
SOCKET MOBILE, INC. NOTES TO FINANCIAL STATEMENTS (Continued)
NOTE 8 — Warrants
The Company has the following outstanding warrants to purchase common stock at December 31, 2014:
| Reason | Number of Shares | Price Per Share | Issue Date | Expiration Date | ||||||||
| Common stock financing | 35,775 | $ | 1.80 | May 2009 | June 2016 | |||||||
| Senior convertible note financing (fully converted in 2011) (a) | 277,600 | $ | 1.25 | Nov 2010 | May 2016 | |||||||
| 313,375 | ||||||||||||
The Company had the following outstanding warrants to purchase common stock at December 31, 2013:
| Reason | Number of Shares | Price Per Share | Issue Date | Expiration Date | ||||||||
| Common stock financing | 57,776 | $ | 1.80 | May 2009 | May 2014 | |||||||
| Senior convertible note financing (fully converted in 2011) (a) | 1,073,600 | $ | 1.25 | Nov 2010 | May 2016 | |||||||
| 1,131,376 | ||||||||||||
| (a) | In conjunction with a settlement agreement, the warrant was amended on December 31, 2013 to reset the conversion price under the anti-dilution terms of the warrant from the original $2.44 per share to $1.25 per share, and to increase the common shares issuable upon conversion from 550,000 shares to 976,000 shares (see “Legal Matters” within “NOTE 6 — Commitments and Contingencies” for more information). |
NOTE 9 — Shares Reserved
Common stock reserved for future issuance was as follows:
| December 31, | ||||||||
| 2014 | 2013 | |||||||
| Stock option grants outstanding (see Note 7) | 1,891,058 | 1,659,170 | ||||||
| Reserved for future stock option grants (see Note 7) | 146,917 | 215,898 | ||||||
| Reserved for note conversion (see Note 2) | 977,398 | 1,050,325 | ||||||
| Reserved for exercise of outstanding warrants (see Note 8) | 313,375 | 1,033,776 | ||||||
| 3,328,748 | 3,959,169 | |||||||
NOTE 10 — Retirement Plan
The Company has a tax-deferred savings plan, the Socket Mobile, Inc. 401(k) Plan (“401(k) Plan”), for the benefit of qualified employees. The 401(k) Plan is designed to provide employees with an accumulation of funds at retirement. Qualified employees may elect to make contributions to the 401(k) Plan on a monthly basis. No contributions were made by the Company during the years ended December 31, 2014 and 2013. Administrative expenses relating to the 401(k) Plan are not significant.
56 |
SOCKET MOBILE, INC. NOTES TO FINANCIAL STATEMENTS (Continued)
NOTE 11 — Income Taxes
Deferred tax expense is related to the deferred tax liability on the portion of the Company's goodwill amortized for tax purposes. Due to the indefinite characteristic of this deferred tax liability, it cannot be offset against deferred tax assets. The provision for deferred tax for the periods ended December 31, 2014 and 2013, consists of the following components:
| Years Ended December 31, | ||||||||
| 2014 | 2013 | |||||||
| Current: | ||||||||
| Federal | $ | — | $ | — | ||||
| State | — | — | ||||||
| Total Current | — | — | ||||||
| Deferred: | ||||||||
| Federal | 31,940 | 31,939 | ||||||
| State | — | — | ||||||
| Total Deferred | 31,940 | 31,939 | ||||||
| Total provision for deferred tax | $ | 31,940 | $ | 31,939 | ||||
Reconciliation of the statutory federal income tax rate to the Company's effective tax rate:
| Years Ended December 31, | ||||||||
| 2014 | 2013 | |||||||
| Federal tax at statutory rate | 34.00 | % | 34.00 | % | ||||
| State income tax rate | 5.83 | % | 5.83 | % | ||||
| Losses and credits not benefited | (32.95 | %) | (34.40 | %) | ||||
| Goodwill impairment | — | — | ||||||
| Provision for taxes | 6.88 | % | 5.43 | % | ||||
As of December 31, 2014, the Company did not recognize deferred tax assets relating to an excess tax benefit for stock-based compensation deduction of $2,046,000. Unrecognized deferred tax benefits will be accounted for as a credit to additional-paid-in-capital when realized through a reduction in income taxes payable.
57 |
SOCKET MOBILE, INC.
NOTES TO FINANCIAL STATEMENTS (Continued)
Deferred income tax reflects the net tax effects of temporary differences between the carrying amount of assets and liabilities for financial reporting purposes and the amount used for income tax purposes. Significant components of net deferred tax assets are as follows:
| Years Ended December 31, | ||||||||
| Deferred tax assets: | 2014 | 2013 | ||||||
| Net operating loss carryforwards | $ | 9,729,000 | $ | 10,347,000 | ||||
| Credits | 716,000 | 682,000 | ||||||
| Capitalized research and development costs | 122,000 | 295,000 | ||||||
| Other acquired intangibles | 134,000 | 165,000 | ||||||
| Accruals not currently deductible | 1,356,000 | 1,318,000 | ||||||
| Total deferred tax assets | 12,057,000 | 12,807,000 | ||||||
| Valuation allowance for deferred tax assets | (12,032,274 | ) | (12,788,334 | ) | ||||
| Net deferred tax assets | 24,726 | 18,666 | ||||||
| Deferred tax liability: | ||||||||
| Acquired intangibles | (168,000 | ) | (130,000 | ) | ||||
| Net deferred tax liabilities | $ | (143,274 | ) | $ | (111,334 | ) | ||
The Company has not generated taxable income in any periods in any jurisdiction, foreign or domestic. The Company has maintained a full valuation allowance for all deferred tax assets.
As of December 31, 2014, the Company had net operating loss carryforwards for federal income tax purposes of approximately $28,974,000 which will expire at various dates beginning in 2017 and through 2033, and federal research and development tax credits of approximately $450,000, which will expire at various dates beginning in 2018 and through 2034. As of December 31, 2014, the Company had net operating loss carryforwards for state income tax purposes of approximately $18,006,000, which will expire at various dates in 2013 and through 2033, and state research and development tax credits of approximately $280,000, which can be carried forward indefinitely. During 2014, approximately $3,936,000 of state net operating loss carryforwards expired unutilized.
Utilization of the net operating loss and tax credit carryforwards is subject to annual limitations due to the ownership change limitations provided by the Internal Revenue Code Section 382 and similar state provisions. The annual limitation will result in the expiration of the net operating loss and credit carryforwards before utilization. The deferred tax assets for the year ended December 31, 2014 reflect estimates of Section 382 limitations.
58 |
SOCKET MOBILE, INC.
NOTES TO FINANCIAL STATEMENTS (Continued)
A reconciliation of the beginning and ending amount of unrecognized tax benefits (“UTBs”), excluding interest and penalties, is as follows:
| Amount | ||||
| Beginning balance at January 1, 2014 | $ | 682,000 | ||
| Increases in UTBs taken in prior years | 34,000 | |||
| Increases in UTBs taken in current year | 14,000 | |||
| Ending balance at December 31, 2014 | $ | 730,000 | ||
Future changes in the unrecognized tax benefit will have no impact on the effective tax rate due to the existence of the valuation allowance. It is the Company's policy to include interest and penalties related to tax positions as a component of income tax expense. No interest was accrued for the period ended December 31, 2014. The Company estimates that the unrecognized tax benefit will not change significantly within the next twelve months.
The Company files its tax returns as prescribed by the tax laws of the jurisdictions in which it operates. The Company is not currently under audit in any of its jurisdictions where income tax returns are filed. The tax years 1996 to 2013 remain open to examination by the major domestic taxing jurisdictions to which the Company is subject, and for the years 2002 to 2009 for the international taxing jurisdictions to which the Company is subject.
NOTE 12 — Subsequent Events
On March 23, 2015, the Company signed a Business Financing Modification Agreement by and between the Company and Bridge Bank to extend the expiration date of a revolving credit line agreement for the domestic (U.S. based) portion of the line from February 27, 2016 to February 27, 2017. All other terms of the revolving credit line agreement remain unchanged.
As of March 23, 2015, 201,200 stock options at a weighted average grant price of $2.27 per share have been granted from the 2004 Plan subsequent to December 31, 2014.
As of March 23, 2015, the Company has issued 140,379 shares of common stock for the exercise of warrants and stock options.
59 |
Item 9. Changes in and Disagreements with Accountants on Accounting and Financial Disclosure
Not Applicable.
Item 9A. Controls and Procedures
Conclusion Regarding the Effectiveness of Disclosure Controls and Procedures
Our management evaluated, with the participation of our Chief Executive Officer and our Chief Financial Officer, the effectiveness of our disclosure controls and procedures as of the end of the period covered by this Annual Report on Form 10-K. Based on this evaluation, our Chief Executive Officer and our Chief Financial Officer have concluded that our disclosure controls and procedures are effective to ensure that information we are required to disclose in reports that we file or submit under the Securities Exchange Act of 1934 is (i) recorded, processed, summarized and reported within the time periods specified in Securities and Exchange Commission rules and forms, and (ii) accumulated and communicated to our management, including our Chief Executive Officer and our Chief Financial Officer, as appropriate to allow timely decisions regarding required disclosure.
Management’s Annual Report on Internal Control Over Financial Reporting
Our management is responsible for establishing and maintaining adequate internal control over financial reporting. There are inherent limitations in the effectiveness of any internal control, including the possibility of human error and the circumvention or overriding of controls. Accordingly, even effective internal control can provide only reasonable assurances with respect to financial statement preparation. Further, projections of any evaluation of effectiveness to future periods are subject to the risk that controls may become inadequate because of changes in conditions, or that the degree of compliance with the policies or procedures may deteriorate.
We assessed the effectiveness of the Company’s internal control over financial reporting as of December 31, 2014. In making this assessment, we used the criteria set forth by the Committee of Sponsoring Organizations of the Treadway Commission (COSO) in Internal Control – Integrated Framework issued in 1992. This assessment included review of the documentation of controls, testing of operating effectiveness of controls and a conclusion on this assessment.
Based on our assessment using those criteria, we believe that, as of December 31, 2014, our internal control over financial reporting is effective.
This annual report does not include an attestation report of the Company’s registered public accounting firm regarding internal control over financial reporting. Management’s report was not subject to attestation by the Company’s registered public accounting firm pursuant to the Dodd-Frank Wall Street Reform and Consumer Protection Act, which exempts non-accelerated filers from Section 404(b) of the Sarbanes-Oxley Act of 2002.
60 |
Changes in Internal Control Over Financial Reporting
There was no change in our internal control over financial reporting that occurred during the last fiscal quarter covered by this Annual Report on Form 10-K that has materially affected, or is reasonably likely to materially affect, our internal control over financial reporting.
None.
61 |
Item 10. Directors, Executive Officers and Corporate Governance
The information required hereunder is incorporated by reference from our Proxy Statement to be filed in connection with our annual meeting of stockholders to be held on June 4, 2015.
Item 11. Executive Compensation
The information required hereunder is incorporated by reference from our Proxy Statement to be filed in connection with our annual meeting of stockholders to be held on June 4, 2015.
Item 12. Security Ownership of Certain Beneficial Owners and Management and Related Stockholder Matters
Certain information required hereunder is incorporated by reference from our Proxy Statement to be filed in connection with our annual meeting of stockholders to be held on June 4, 2015.
The following table provides information as of December 31, 2014 about our common stock that may be issued under the Company’s existing equity compensation plans. For additional information about the equity compensation plans see Note 7 to the Company’s Financial Statements.
Number of securities to be issued upon exercise of outstanding options |
Weighted-average exercise price of outstanding options | Number of securities remaining available for future issuance under equity compensation plans | ||||||||||
Equity compensation plans approved by security holders (1) | 1,891,058 | $ | 2.09 | 147,217 | ||||||||
| (1) | Consists of the 2004 Equity Incentive Plan. Pursuant to an affirmative vote by security holders in June 2004, an annual increase in the number of shares authorized under the 2004 Equity Incentive Plan is added on the first day of each fiscal year equal to the least of (a) 200,000 shares, (b) four percent of the total outstanding shares of the Company’s common stock on that date, or (c) a lesser amount as determined by the Board of Directors. As a result, a total of 200,000 shares became available for grant under the 2004 Equity Incentive Plan on January 1, 2015, in addition to those set forth in the table above. |
Item 13. Certain Relationships and Related Transactions, and Director Independence
Certain information required hereunder is incorporated by reference from our Proxy Statement to be filed in connection with our annual meeting of stockholders to be held on June 4, 2015.
62 |
Item 14. Principal Accounting Fees and Services
Certain information required hereunder is incorporated by reference from our Proxy Statement to be filed in connection with our annual meeting of stockholders to be held on June 4, 2015.
Item 15. Exhibits, Financial Statement Schedules
(a)
Documents filed as part of this report:
1. All financial
statements.
| INDEX TO FINANCIAL STATEMENTS | PAGE | ||
| Report of Sadler Gibb, Independent Registered Public Accounting Firm | 33 | ||
| Balance Sheets | 34 | ||
| Statements of Operations | 35 | ||
| Statements of Stockholders' Equity | 36 | ||
| Statements of Cash Flows | 37 | ||
| Notes to Financial Statements | 38 |
| 2. | Financial statement schedules. |
All financial statement schedules are omitted because they are not applicable or not required or because the required information is included in the financial statements or notes herein.
| 3. | Exhibits. |
See Index of Exhibits on page 65. The Exhibits listed on the accompanying Index of Exhibits are filed or incorporated by reference as part of this report.
(b) Exhibits:
See Index of Exhibits on page 65. The Exhibits listed on the accompanying Index of Exhibits are filed or incorporated by reference as part of this report.
63 |
Pursuant to the requirements of Section 13 or 15(d) of the Securities Exchange Act of 1934, the registrant has duly caused this report to be signed on its behalf by the undersigned, hereunto duly authorized.
| SOCKET MOBILE, INC. | |||
| Registrant | |||
| Date: March 27, 2015 | /s/ Kevin J. Mills | ||
| Kevin J. Mills | |||
| President and Chief Executive Officer | |||
Pursuant to the requirements of the Securities Exchange Act of 1934, this report has been signed below by the following persons on behalf of the Registrant and in the capacities and on the dates indicated.
| /s/
Kevin J. Mills Kevin J. Mills |
|
March 27, 2015 | ||
| /s/
Charlie Bass Charlie Bass |
Chairman of the Board | March 27, 2015 | ||
| /s/
David W. Dunlap David W. Dunlap |
Vice President of Finance and Administration and Chief Financial Officer (Principal Financial and Accounting Officer) |
March 27, 2015 | ||
| /s/
Peter Sealey Peter Sealey |
Director | March 27, 2015 | ||
| /s/
Charles C. Emery, Jr. Charles C. Emery, Jr. |
Director | March 27, 2015 |
64 |
| Exhibit Number |
Description |
| 3.1 (1) | Amended and Restated Certificate of Incorporation. |
| 3.2 (2) | Bylaws, as amended February 17, 2008. |
| 10.1 (3)* | Form of Indemnification Agreement entered into between the Company and its directors and officers. |
| 10.2 (4)* | 2004 Equity Incentive Plan and forms of agreement thereunder. |
| 10.3 (5)* | Form of Management Incentive Variable Compensation Plan between the Company and certain eligible participants. |
| 10.4 (6) | Standard Industrial /Commercial Multi-Tenant Lease by and between Del Norte Farms, Inc. and the Company dated October 24, 2006 (assigned to Newark Eureka Industrial Capital, LLC September 17, 2007. |
| 10.5 (7) | Second Amendment to Standard Industrial/Commercial Multi-Lessee Lease – Net dated August 30, 2010. |
| 10.6 (8) | Third Amendment to Standard Industrial /Commercial Multi-Tenant Lease – Net dated December 28, 2012. |
| 10.7 (9) | Amended and Restated Securities Purchase Agreement between the Company and the investor listed on Exhibit A attached thereto dated November 19, 2010. |
| 10.8 (9) | Senior Secured Convertible Note issued November 19, 2010 by the Company to the Investor. |
| 10.9 (9) | Warrants for the Purchase of Shares of Common Stock Issued November 19, 2010 to the Investor and the Placement Agent in connection with a private placement. |
| 10.10 (10) | Form of Employment Agreement dated March 8, 2012 between the Company and the officers of the Company. |
| 10.11 (11) | Loan and Security Agreement dated February 27, 2014 by and between the Company and Bridge Bank, National Association. |
11.1 |
Computation of Earnings per Share (see Statements of Operations in Item 8). |
65 |
| Exhibit Number |
Description |
14.1 (12) |
Code of Business Conduct and Ethics. |
23.1 |
Consent of Sadler Gibb & Associates, LLC, Independent Registered Public Accounting Firm. |
31.1 |
Certification of Chief Executive Officer pursuant to Section 302 of the Sarbanes-Oxley Act of 2002. |
31.2 |
Certification of Chief Financial Officer pursuant to Section 302 of the Sarbanes-Oxley Act of 2002. |
32.1 |
Certification of Chief Executive Officer and Chief Financial Officer pursuant to Section 906 of the Sarbanes-Oxley Act of 2002. |
_________
* Executive compensation plan or arrangement.
| (1) | Incorporated by reference to exhibits filed with the Company’s Form 10-K filed on March 16, 2009. |
| (2) | Incorporated by reference to exhibits filed with the Company’s Form 8-K filed on February 20, 2008. |
| (3) | Incorporated by reference to exhibits filed with the Company’s Form 8-K filed on January 27, 2009. |
| (4) | Incorporated by reference to Appendix C filed with the Company’s Form DEF 14A filed on April 29, 2004. |
| (5) | Incorporated by reference to Appendix B filed with the Company’s Form DEF 14A filed on March 16, 2011. |
| (6) | Incorporated by reference to exhibits filed with the Company’s Form 10-Q filed on November 13, 2006. |
| (7) | Incorporated by reference to exhibits filed with the Company’s Form 8-K filed on August 30, 2010. |
| (8) | Incorporated by reference to exhibits filed with the Company’s Form 8-K filed on January 4, 2013. |
66 |
| (9) | Incorporated by reference to exhibits filed with the Company’s Form 8-K filed on November 19, 2010. |
| (10) | Incorporated by reference to exhibits filed with the Company’s Form 8-K filed on March 8, 2012. |
| (11) | Incorporated by reference to exhibits filed with the Company’s Form 8-K filed on March 7, 2014. |
| (12) | Incorporated by reference to exhibits filed with the Company’s Form 10-K filed on March 10, 2006. |
67 |