Attached files
| file | filename |
|---|---|
| 8-K - 8-K - KAPSTONE PAPER & PACKAGING CORP | a11-5717_18k.htm |
| EX-99.2 - EX-99.2 - KAPSTONE PAPER & PACKAGING CORP | a11-5717_1ex99d2.htm |
| EX-99.1 - EX-99.1 - KAPSTONE PAPER & PACKAGING CORP | a11-5717_1ex99d1.htm |
Exhibit 99.3
|
|
February 2011 WELL POSITIONED TO PROSPER Matt Kaplan President and Chief Operating Officer Andrea K. Tarbox Vice President and Chief Financial Officer |
|
|
2 FORWARD LOOKING STATEMENTS The information in this presentation and statements made during this presentation may contain certain forward-looking statements within the meaning of federal securities laws. These statements reflect management’s expectations regarding future events and operating performance. These forward-looking statements involve a number of risks and uncertainties. A list of the factors that could cause actual results to differ materially from those expressed in, or underlying, any forward-looking statements can be found in the Company’s filings with the Securities and Exchange Commission, such as its annual and quarterly reports. The Company disclaims any obligation to revise or update such statements to reflect the occurrence of events after the date of this presentation. This presentation refers to non-U.S. GAAP financial information. For a reconciliation to U.S. GAAP financial measures, please refer to the appendix. Forward-Looking Statements Non-GAAP Financial Measures Risk Factors |

|
|
3 A UNIQUE BEGINNING In April 2005, KapStone was founded as a Special Purpose Acquisition Corp. Management team consisted of two paper and packaging industry veterans, Roger Stone and Matt Kaplan Successful record of managing paper and packaging assets History of identifying and acquiring assets at attractive valuations Outstanding long-term reputation in the credit markets Proven track record of growing shareholder value Collectively are largest stakeholders in stock $120 million raised in IPO Focus on paper, packaging, and forest products industries |
|
|
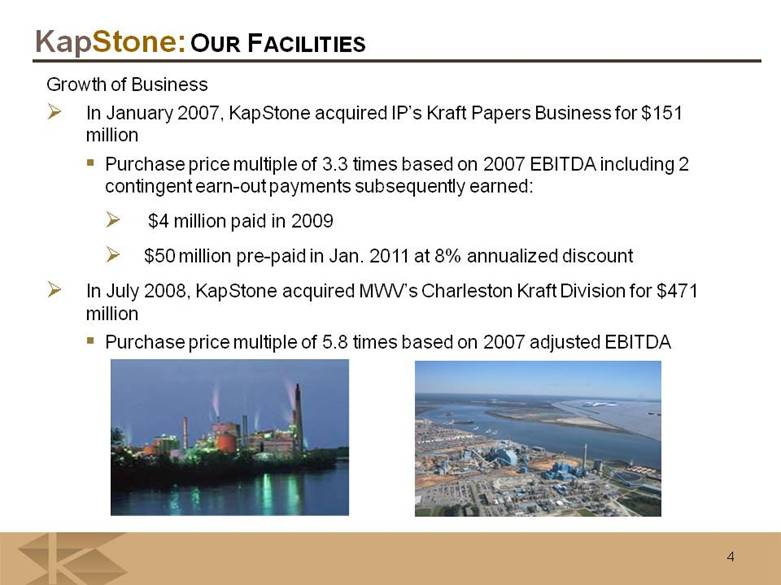
4 Growth of Business In January 2007, KapStone acquired IP’s Kraft Papers Business for $151 million Purchase price multiple of 3.3 times based on 2007 EBITDA including 2 contingent earn-out payments subsequently earned: $4 million paid in 2009 $50 million pre-paid in Jan. 2011 at 8% annualized discount In July 2008, KapStone acquired MWV’s Charleston Kraft Division for $471 million Purchase price multiple of 5.8 times based on 2007 adjusted EBITDA OUR FACILITIES |
|
|
5 OUR FACILITIES Two highly efficient and cost effective paper mills Capable of producing approximately 1.3 million tons of various paper grades annually Locations Both mills well located for domestic and export distribution Access to abundant, high quality, low cost wood Quality leader across product lines Moderate annual maintenance CAPEX of $25 to $30 million |
|
|
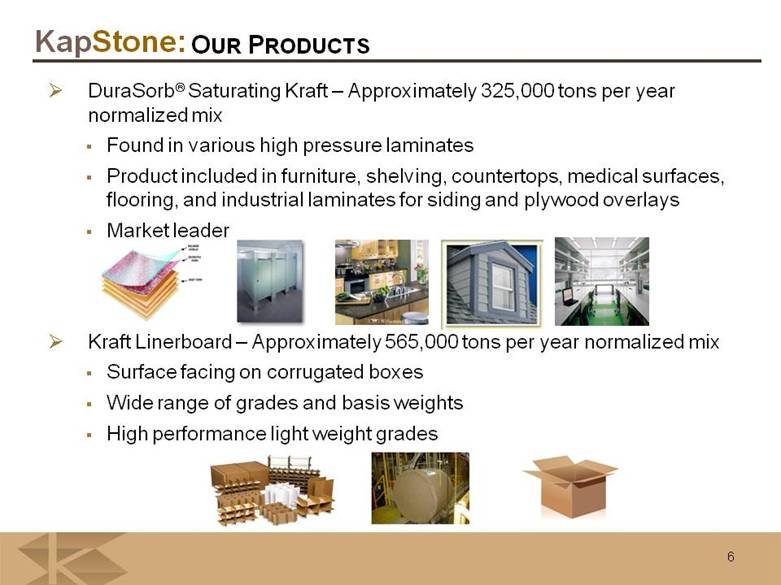
6 OUR PRODUCTS DuraSorb® Saturating Kraft – Approximately 325,000 tons per year normalized mix Found in various high pressure laminates Product included in furniture, shelving, countertops, medical surfaces, flooring, and industrial laminates for siding and plywood overlays Market leader Kraft Linerboard – Approximately 565,000 tons per year normalized mix Surface facing on corrugated boxes Wide range of grades and basis weights High performance light weight grades |
|
|
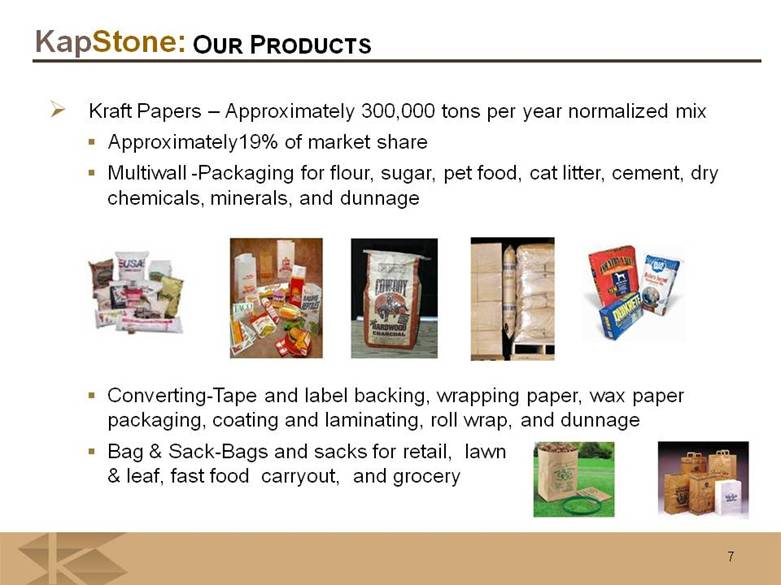
7 OUR PRODUCTS Kraft Papers – Approximately 300,000 tons per year normalized mix Approximately19% of market share Multiwall -Packaging for flour, sugar, pet food, cat litter, cement, dry chemicals, minerals, and dunnage Converting-Tape and label backing, wrapping paper, wax paper packaging, coating and laminating, roll wrap, and dunnage Bag & Sack-Bags and sacks for retail, lawn & leaf, fast food carryout, and grocery |
|
|
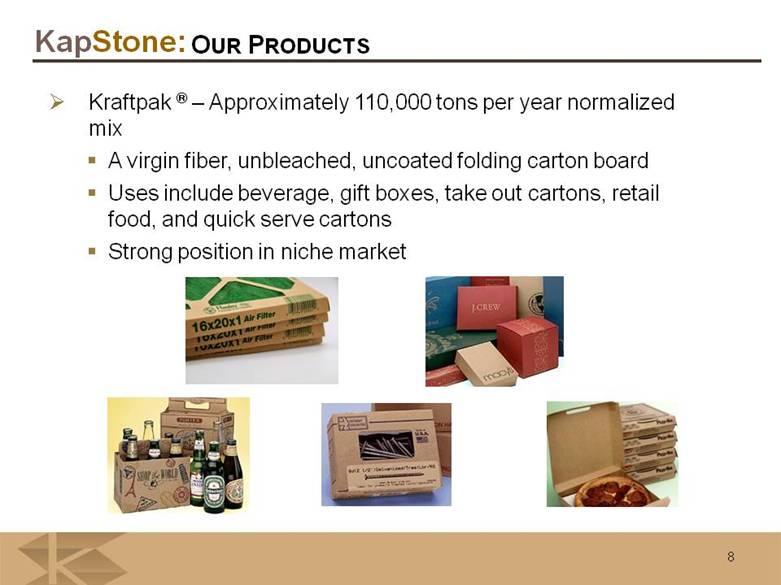
8 OUR PRODUCTS Kraftpak ® – Approximately 110,000 tons per year normalized mix A virgin fiber, unbleached, uncoated folding carton board Uses include beverage, gift boxes, take out cartons, retail food, and quick serve cartons Strong position in niche market |
|
|
9 OUR INDUSTRY A CHANGING INDUSTRY Consolidation Sale of timber assets Behavioral changes in industry Capacity closures |

|
|
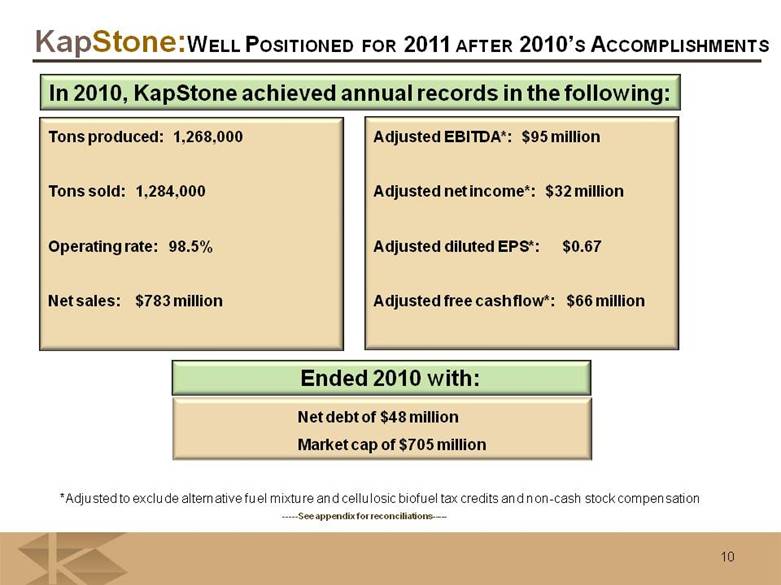
WELL POSITIONED FOR 2011 AFTER 2010’S ACCOMPLISHMENTS Tons produced: 1,268,000 Tons sold: 1,284,000 Operating rate: 98.5% Net sales: $783 million Adjusted EBITDA*: $95 million Adjusted net income*: $32 million Adjusted diluted EPS*: $0.67 Adjusted free cash flow*: $66 million In 2010, KapStone achieved annual records in the following: *Adjusted to exclude alternative fuel mixture and cellulosic biofuel tax credits and non-cash stock compensation 10 Net debt of $48 million Market cap of $705 million Ended 2010 with: -----See appendix for reconciliations----- |
|
|
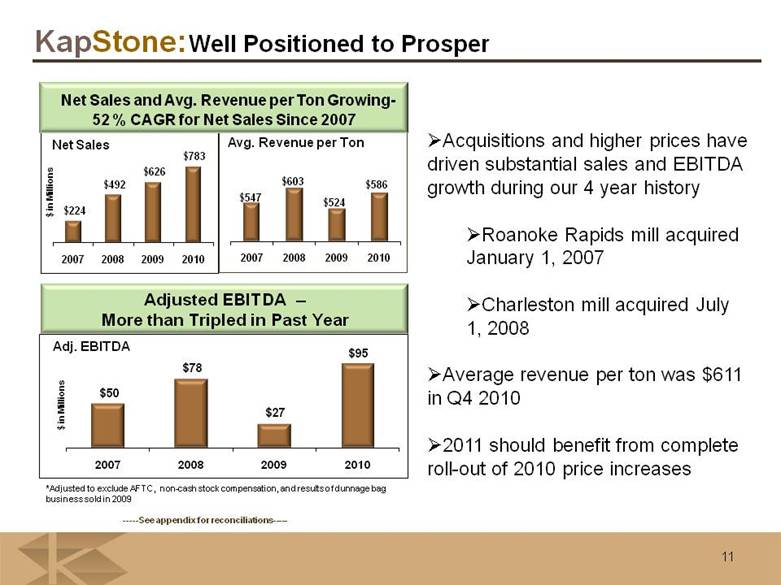
11 Well Positioned to Prosper Avg. Revenue per Ton Adjusted EBITDA – More than Tripled in Past Year Net Sales and Avg. Revenue per Ton Growing- 52 % CAGR for Net Sales Since 2007 Net Sales Adj. EBITDA -----See appendix for reconciliations----- $ in Millions Acquisitions and higher prices have driven substantial sales and EBITDA growth during our 4 year history Roanoke Rapids mill acquired January 1, 2007 Charleston mill acquired July 1, 2008 Average revenue per ton was $611 in Q4 2010 2011 should benefit from complete roll-out of 2010 price increases *Adjusted to exclude AFTC, non-cash stock compensation, and results of dunnage bag business sold in 2009 |
|
|
Substantial cash generation Adjusted free cash flows were $66 million for the 2010 full year, or $1.41 per diluted share Capex for 2011 expected to be approximately $41 million *Calculated by adjusting EBITDA for AFTC, Capex, cash taxes and interest, non-cash stock compensation expense, and results of dunnage bag business sold in 2009 Includes $13 million of income tax refunds in 2010 and 2009 For the Years Ended December 31 Adjusted Free Cash Flows* 12 Well Positioned to Prosper -----See appendix for reconciliations----- $27 $34 $(10) $66 2007 2008 2009 2010 $ in millions |
|
|
|
|
|
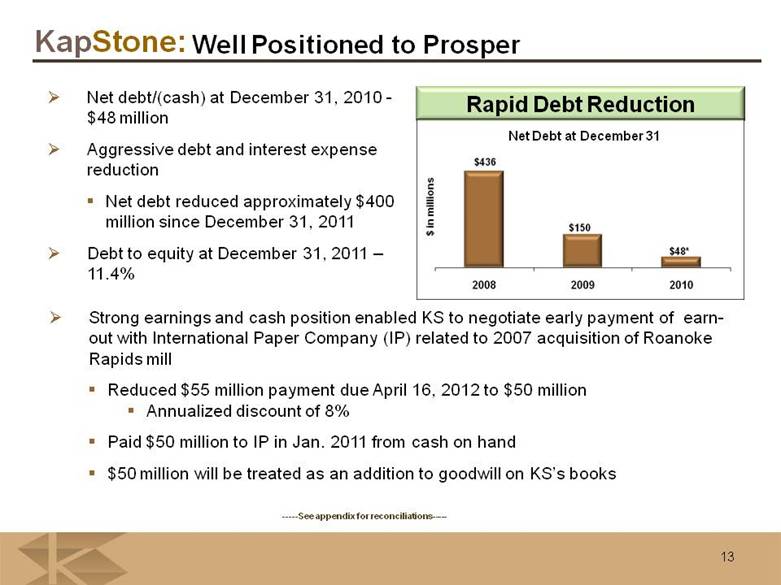
13 Net debt/(cash) at December 31, 2010 - $48 million Aggressive debt and interest expense reduction Net debt reduced approximately $400 million since December 31, 2011 Debt to equity at December 31, 2011 – 11.4% Rapid Debt Reduction Strong earnings and cash position enabled KS to negotiate early payment of earn-out with International Paper Company (IP) related to 2007 acquisition of Roanoke Rapids mill Reduced $55 million payment due April 16, 2012 to $50 million Annualized discount of 8% Paid $50 million to IP in Jan. 2011 from cash on hand $50 million will be treated as an addition to goodwill on KS’s books Net Debt at December 31 Well Positioned to Prosper -----See appendix for reconciliations----- |
|
|
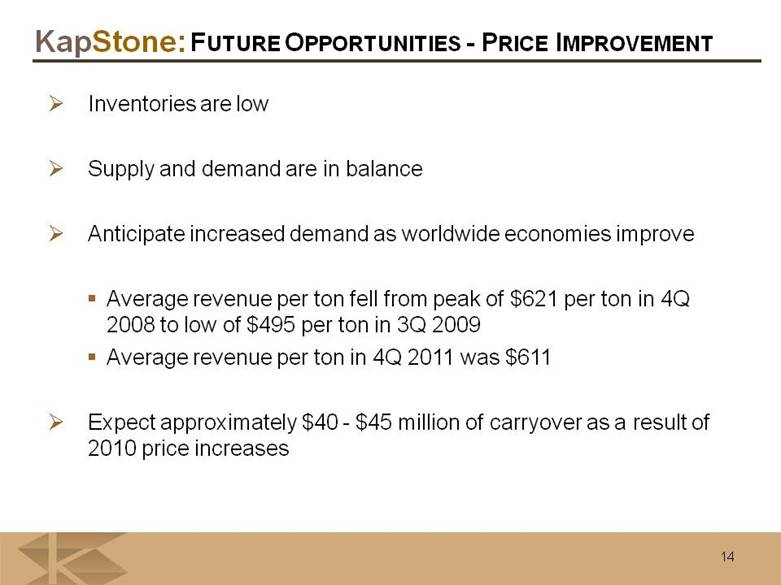
Inventories are low Supply and demand are in balance Anticipate increased demand as worldwide economies improve Average revenue per ton fell from peak of $621 per ton in 4Q 2008 to low of $495 per ton in 3Q 2009 Average revenue per ton in 4Q 2011 was $611 Expect approximately $40 - $45 million of carryover as a result of 2010 price increases FUTURE OPPORTUNITIES - PRICE IMPROVEMENT 14 |
|
|
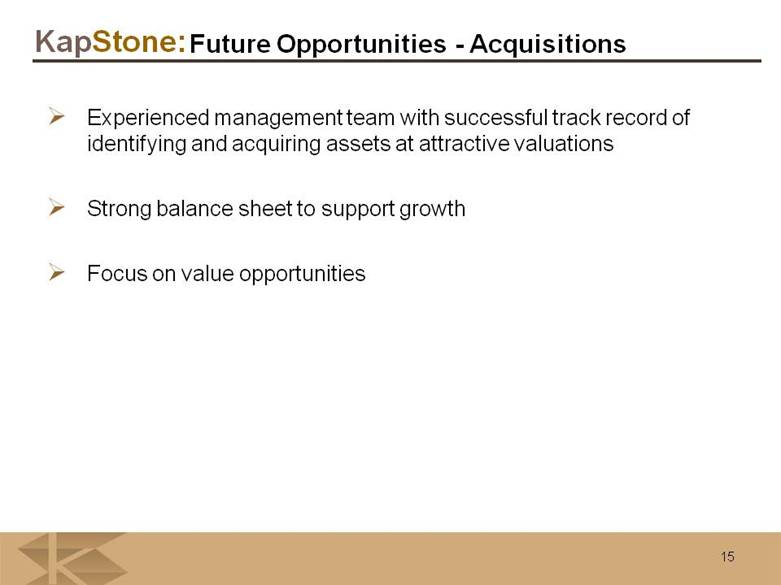
15 Future Opportunities - Acquisitions Experienced management team with successful track record of identifying and acquiring assets at attractive valuations Strong balance sheet to support growth Focus on value opportunities |
|
|
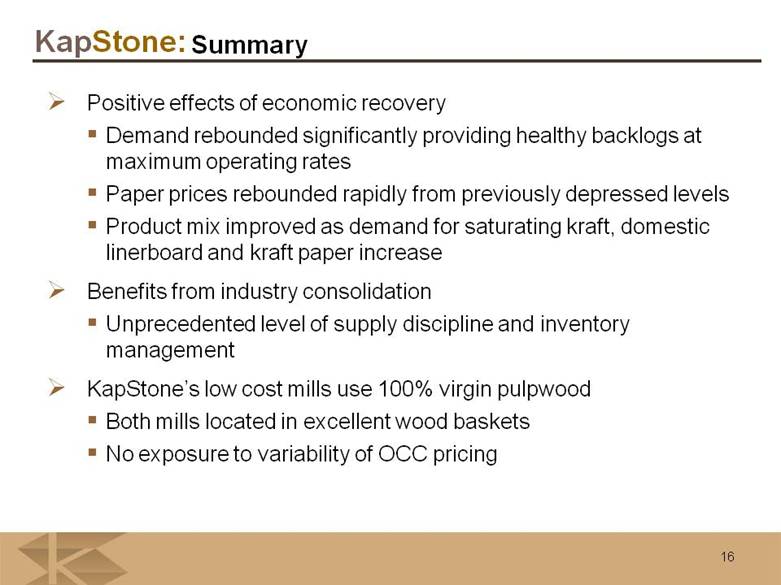
16 Summary Positive effects of economic recovery Demand rebounded significantly providing healthy backlogs at maximum operating rates Paper prices rebounded rapidly from previously depressed levels Product mix improved as demand for saturating kraft, domestic linerboard and kraft paper increase Benefits from industry consolidation Unprecedented level of supply discipline and inventory management KapStone’s low cost mills use 100% virgin pulpwood Both mills located in excellent wood baskets No exposure to variability of OCC pricing |
|
|
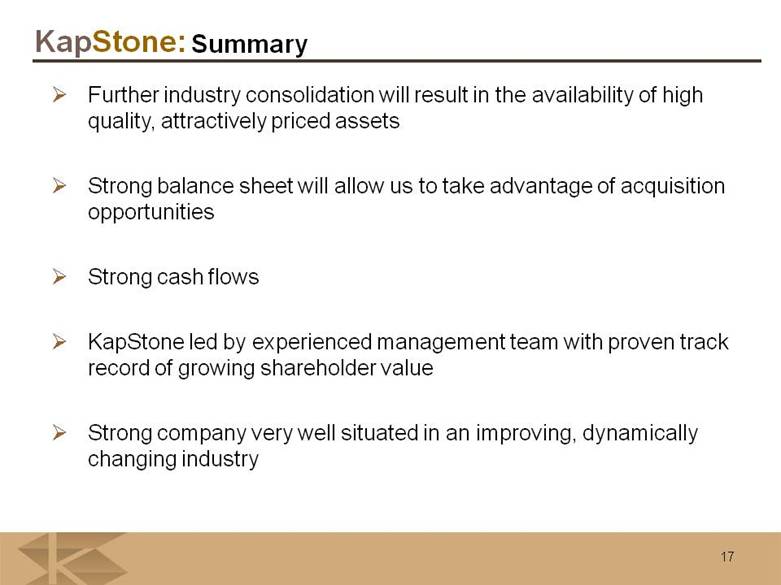
17 Summary Further industry consolidation will result in the availability of high quality, attractively priced assets Strong balance sheet will allow us to take advantage of acquisition opportunities Strong cash flows KapStone led by experienced management team with proven track record of growing shareholder value Strong company very well situated in an improving, dynamically changing industry |
|
|
18 Track Record of Providing Return to Our Shareholders Closing Price of $17.47 Feb. 8, 2011 Ranked 5th by Fortune in 2010 annual list of 100 Fastest Growing Companies on: Growth in revenue, EPS and total stock market return over past 3 years Ranked 1st for industrial companies FORTUNE |
|
|
Appendix |
|
|
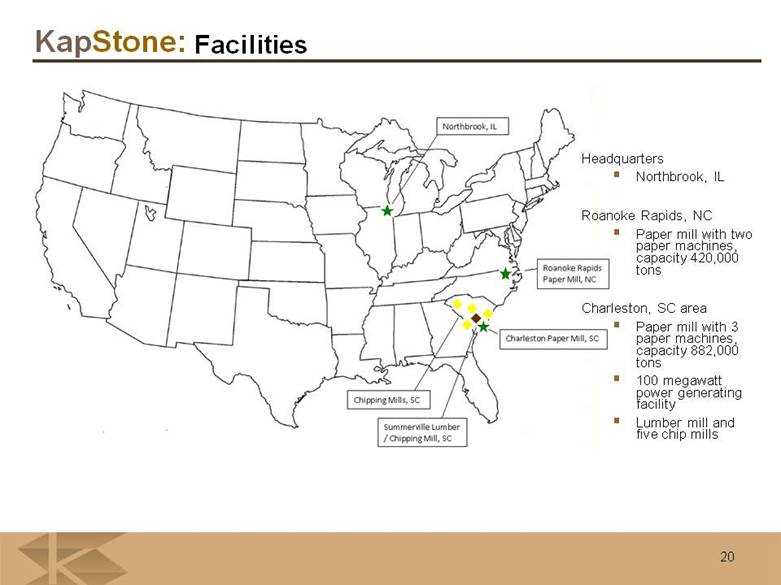
20 Facilities Headquarters Northbrook, IL Roanoke Rapids, NC Paper mill with two paper machines, capacity 420,000 tons Charleston, SC area Paper mill with 3 paper machines, capacity 882,000 tons 100 megawatt power generating facility Lumber mill and five chip mills |
|
|
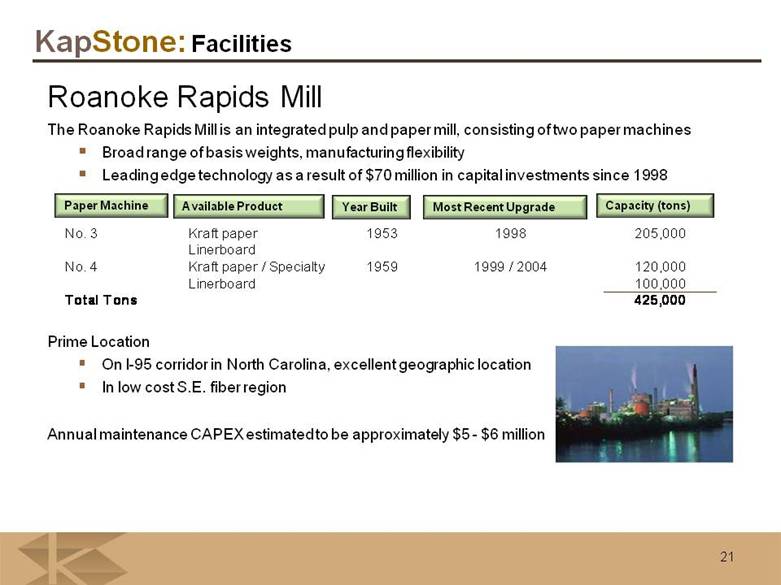
Roanoke Rapids Mill The Roanoke Rapids Mill is an integrated pulp and paper mill, consisting of two paper machines Broad range of basis weights, manufacturing flexibility Leading edge technology as a result of $70 million in capital investments since 1998 Prime Location On I-95 corridor in North Carolina, excellent geographic location In low cost S.E. fiber region Annual maintenance CAPEX estimated to be approximately $5 - $6 million 21 Facilities Paper Machine Available Product Year Built Most Recent Upgrade Capacity (tons) No. 3 Kraft paper 1953 1998 205,000 Linerboard No. 4 Kraft paper / Specialty 1959 1999 / 2004 120,000 Linerboard 100,000 Total Tons 425,000 |
|
|
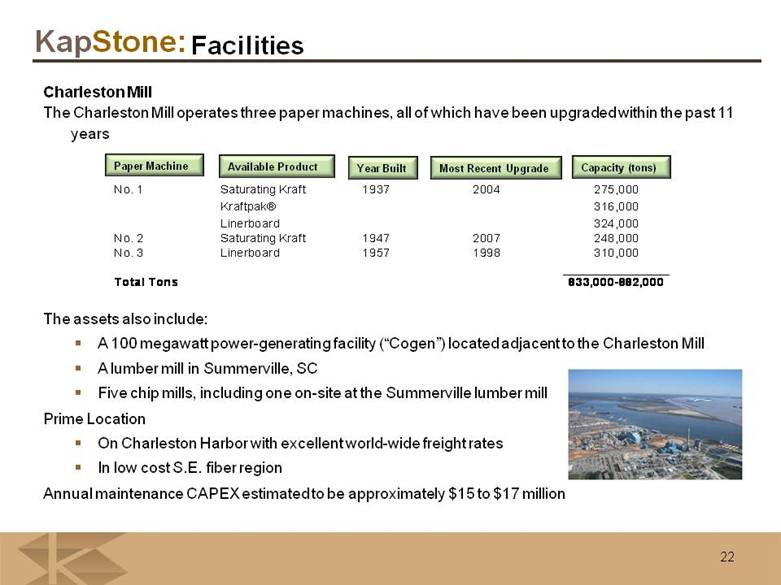
Charleston Mill The Charleston Mill operates three paper machines, all of which have been upgraded within the past 11 years The assets also include: A 100 megawatt power-generating facility (“Cogen”) located adjacent to the Charleston Mill A lumber mill in Summerville, SC Five chip mills, including one on-site at the Summerville lumber mill Prime Location On Charleston Harbor with excellent world-wide freight rates In low cost S.E. fiber region Annual maintenance CAPEX estimated to be approximately $15 to $17 million 22 Facilities Paper Machine Available Product Year Built Most Recent Upgrade Capacity (tons) No. 1 Saturating Kraft 1937 2004 275,000 Kraftpak® 316,000 Linerboard 324,000 No. 2 Saturating Kraft 1947 2007 248,000 No. 3 Linerboard 1957 1998 310,000 Total Tons 833,000-882,000 |
|
|
23 Reconciliation of Non-GAAP Financial Measures The non-GAAP financial measures are used in the presentation materials in addition to, and in conjunction with, results presented in accordance with GAAP. These non-GAAP financial measures should not be relied upon to the exclusion of GAAP financial measures. These non-GAAP financial measures reflect an additional way of viewing aspects of our operations that, when viewed with our GAAP results and the accompanying reconciliations to corresponding GAAP financial measures, may provide a more complete understanding of factors and trends affecting our business. We strongly encourage investors to review our consolidated financial statements and publicly filed reports in their entirety and to not rely on any single financial measure. Because non-GAAP financial measures are not standardized, it may not be possible to compare these financial measures with other companies’ non-GAAP financial measures having the same or similar names. |
|
|
24 Supplemental Information KapStone Paper and Packaging Corporation ($ in thousands, except share and per share amounts) (preliminary and unaudited) Year Ended December 31, 2007 2008 2009 2010 Net Income (GAAP) to EBITDA (Non-GAAP) to Adjusted EBITDA (Non-GAAP): Net income (GAAP) $ 26,963 $ 19,665 $ 80,280 $ 65,041 Interest income (2,096) (927) (12) (37) Interest expense 4,041 16,442 13,196 3,203 Amortization of debt issuance costs 254 2,007 5,980 2,237 Provision (benefit) for income taxes 15,138 12,482 52,137 (2,407) Depreciation and amortization 11,327 31,683 54,667 45,245 EBITDA (Non-GAAP) $ 55,627 $ 81,352 $ 206,248 $ 113,282 Alternative fuel mixture tax credits - - (163,998) (22,195) Dunnage bag business (6,699) (5,248) (17,165) - Stock based compensation expense 697 1,754 2,377 3,592 Adjusted EBITDA (Non-GAAP) $ 49,625 $ 77,858 $ 27,462 $ 94,679 Net Income (GAAP) to Adjusted Net Income (Non-GAAP): Net income (GAAP) 26,963 19,665 80,280 65,041 Alternative fuel mixture tax credits - - (99,427) (21,048) Cellulosic Biofuel Producers tax credit - - - (14,737) Dunnage bag business (4,287) (3,210) (10,407) - Stock based compensation expense 446 1,073 1,441 2,385 Adjusted Net Income (Non-GAAP) $ 23,122 $ 17,528 $ (28,113) $ 31,641 Diluted EPS (GAAP) to Adjusted Diluted EPS (Non-GAAP): Diluted earnings per share (GAAP) $ 0.75 $ 0.57 $ 2.29 $ 1.38 Alternative fuel mixture tax credits - - (2.84) (0.45) Cellulosic Biofuel Producers tax credit - - - (0.31) Dunnage bag business (0.12) (0.09) (0.30) - Stock based compensation expense 0.01 0.03 0.04 0.05 Adjusted Diluted EPS (Non-GAAP) $ 0.64 $ 0.51 $ (0.81) $ 0.67 |
|
|
25 Supplemental Information GAAP to Non GAAP Reconciliations (preliminary and unaudited) Year ended $ 000's December 31, 2007 December 31, 2008 December 31, 2009 December 31, 2010 Net Income (GAAP) to EBITDA (Non-GAAP) Net income (GAAP) $ 26,963 $ 19,665 $ 80,280 $ 65,041 Interest income (2,096) (927) (12) (37) Interest expense 4,041 16,442 13,196 3,203 Amortization of debt issuance costs 254 2,007 5,980 2,237 Provision (benefit) for income taxes 15,138 12,482 52,137 (2,407) Depreciation and amortization 11,327 31,683 54,667 45,245 EBITDA (Non-GAAP) $ 55,627 $ 81,352 $ 206,248 $ 113,282 Plus non cash stock compensation expense 697 1,754 2,377 3,592 Less capital expenditures (11,861) (23,170) (29,165) (38,318) Plus / (less ) cash income taxes received / (paid) (13,812) (11,441) 11,306 13,207 Less cash interest paid (4,041) (9,132) (19,952) (3,318) Free cash flow 26,610 39,363 170,814 88,445 Dunnage bag business - (5,248) (17,165) - Less Alternative fuel mixture tax credit - - (163,998) (22,195) Adjusted free cash flow (non GAAP) $ 26,610 $ 34,115 $ (10,349) $ 66,250 |