Attached files
| file | filename |
|---|---|
| 8-K - 8-K - KAPSTONE PAPER & PACKAGING CORP | a11-5717_18k.htm |
| EX-99.1 - EX-99.1 - KAPSTONE PAPER & PACKAGING CORP | a11-5717_1ex99d1.htm |
| EX-99.3 - EX-99.3 - KAPSTONE PAPER & PACKAGING CORP | a11-5717_1ex99d3.htm |
Exhibit 99.2
|
|
2010 Fourth Quarter and Full Year Review Matt Kaplan President and Chief Operating Officer Andrea K. Tarbox Vice President and Chief Financial Officer February 14, 2011 |
|
|
Forward Looking Statements The information in this presentation and statements made during this presentation may contain certain forward-looking statements within the meaning of federal securities laws. These statements reflect management’s expectations regarding future events and operating performance. These forward-looking statements involve a number of risks and uncertainties. A list of the factors that could cause actual results to differ materially from those expressed in, or underlying, any forward-looking statements can be found in the Company’s filings with the Securities and Exchange Commission, such as its annual and quarterly reports. The Company disclaims any obligation to revise or update such statements to reflect the occurrence of events after the date of this presentation. This presentation refers to non-U.S. GAAP financial information. For a reconciliation to U.S. GAAP financial measures, please refer to the appendix. Forward-Looking Statements Non-GAAP Financial Measures Risk Factors 2 |
|
|
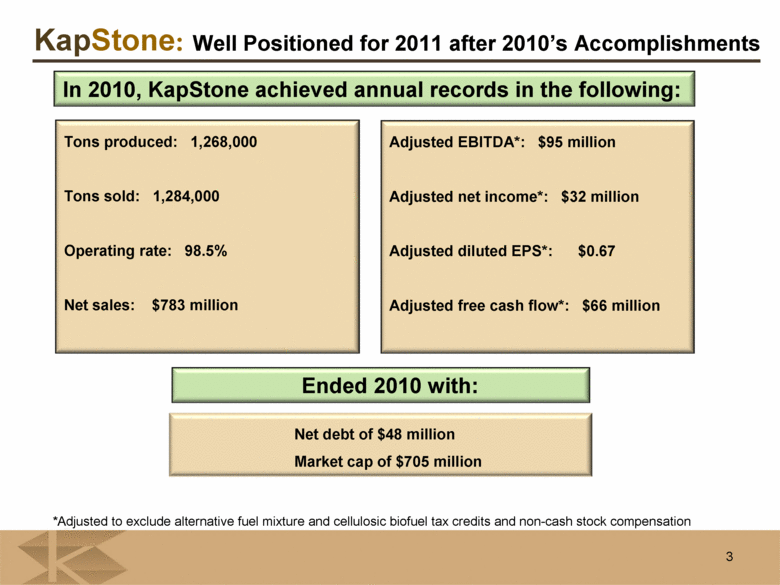
Well Positioned for 2011 after 2010’s Accomplishments Tons produced: 1,268,000 Tons sold: 1,284,000 Operating rate: 98.5% Net sales: $783 million Adjusted EBITDA*: $95 million Adjusted net income*: $32 million Adjusted diluted EPS*: $0.67 Adjusted free cash flow*: $66 million In 2010, KapStone achieved annual records in the following: *Adjusted to exclude alternative fuel mixture and cellulosic biofuel tax credits and non-cash stock compensation 3 Net debt of $48 million Market cap of $705 million Ended 2010 with: |
|
|
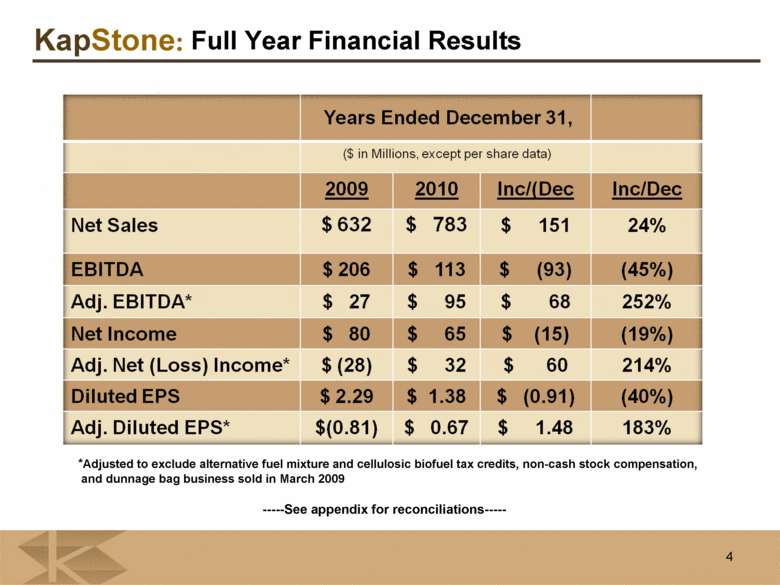
Full Year Financial Results *Adjusted to exclude alternative fuel mixture and cellulosic biofuel tax credits, non-cash stock compensation, and dunnage bag business sold in March 2009 -----See appendix for reconciliations----- 4 Years Ended December 31, ($ in Millions, except per share data) 2009 2010 Inc/(Dec Inc/Dec Net Sales $ 632 $ 783 $ 151 24% EBITDA $ 206 $ 113 $ (93) (45%) Adj. EBITDA* $ 27 $ 95 $ 68 252% Net Income $ 80 $ 65 $ (15) (19%) Adj. Net (Loss) Income* $ (28) $ 32 $ 60 214% Diluted EPS $ 2.29 $ 1.38 $ (0.91) (40%) Adj. Diluted EPS* $(0.81) $ 0.67 $ 1.48 183% |
|
|
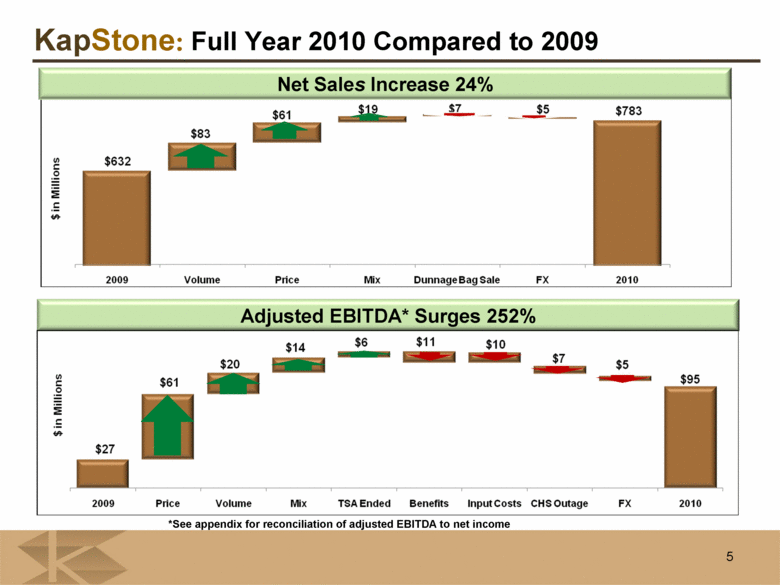
Net Sales Increase 24% Adjusted EBITDA* Surges 252% 5 Full Year 2010 Compared to 2009 *See appendix for reconciliation of adjusted EBITDA to net income |
|
|
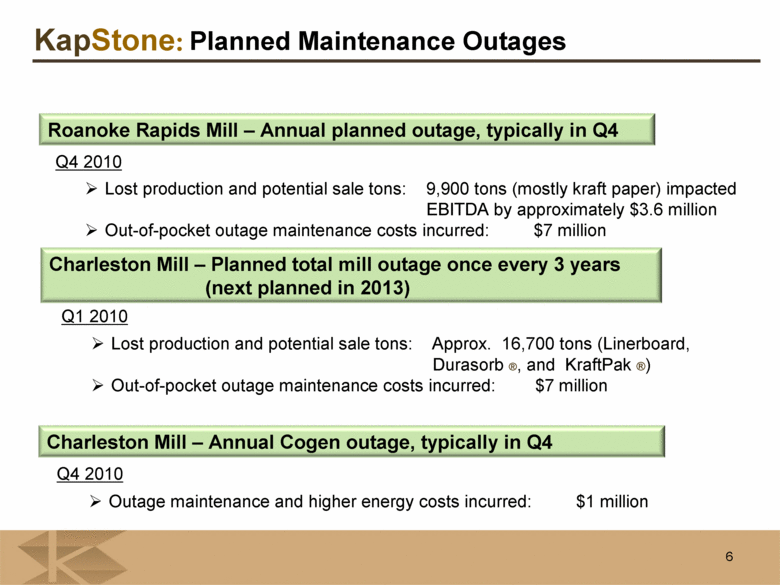
Planned Maintenance Outages Lost production and potential sale tons: 9,900 tons (mostly kraft paper) impacted EBITDA by approximately $3.6 million Out-of-pocket outage maintenance costs incurred: $7 million Roanoke Rapids Mill – Annual planned outage, typically in Q4 Charleston Mill – Planned total mill outage once every 3 years (next planned in 2013) Q4 2010 Lost production and potential sale tons: Approx. 16,700 tons (Linerboard, Durasorb ®, and KraftPak ®) Out-of-pocket outage maintenance costs incurred: $7 million Q1 2010 Charleston Mill – Annual Cogen outage, typically in Q4 Outage maintenance and higher energy costs incurred: $1 million Q4 2010 6 |
|
|
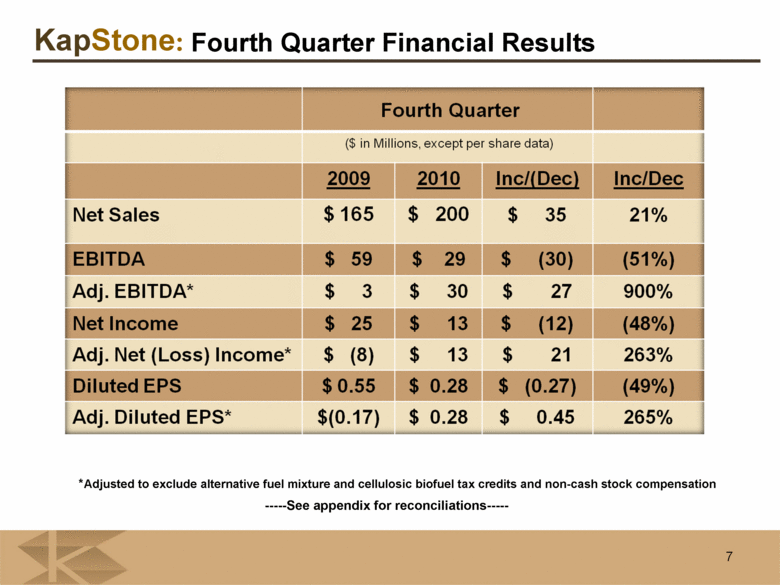
Fourth Quarter Financial Results *Adjusted to exclude alternative fuel mixture and cellulosic biofuel tax credits and non-cash stock compensation -----See appendix for reconciliations----- 7 Fourth Quarter ($ in Millions, except per share data) 2009 2010 Inc/(Dec) Inc/Dec Net Sales $ 165 $ 200 $ 35 21% EBITDA $ 59 $ 29 $ (30) (51%) Adj. EBITDA* $ 3 $ 30 $ 27 900% Net Income $ 25 $ 13 $ (12) (48%) Adj. Net (Loss) Income* $ (8) $ 13 $ 21 263% Diluted EPS $ 0.55 $ 0.28 $ (0.27) (49%) Adj. Diluted EPS* $(0.17) $ 0.28 $ 0.45 265% |
|
|
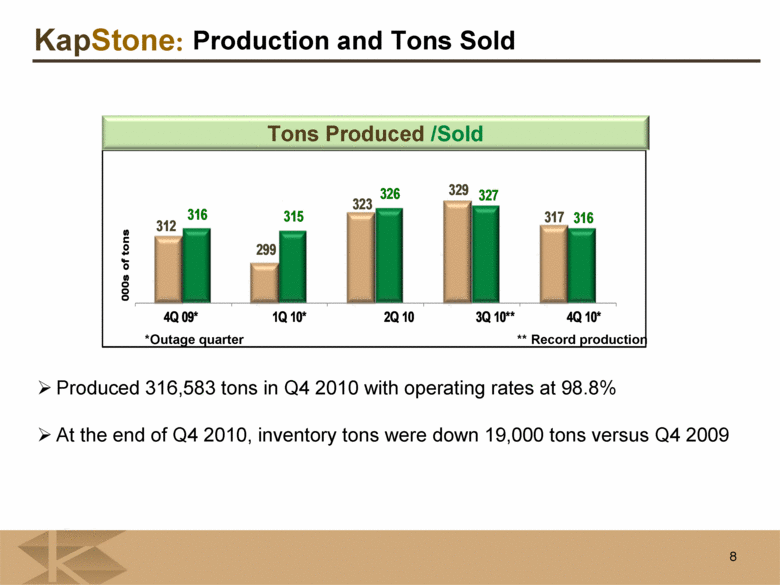
Production and Tons Sold Produced 316,583 tons in Q4 2010 with operating rates at 98.8% At the end of Q4 2010, inventory tons were down 19,000 tons versus Q4 2009 *Outage quarter ** Record production Tons Produced /Sold 8 312 299 323 329 317 316 315 326 327 316 000s of tons 4Q 09* 1Q 10* 2Q 10 3Q 10** 4Q 10* |
|
|
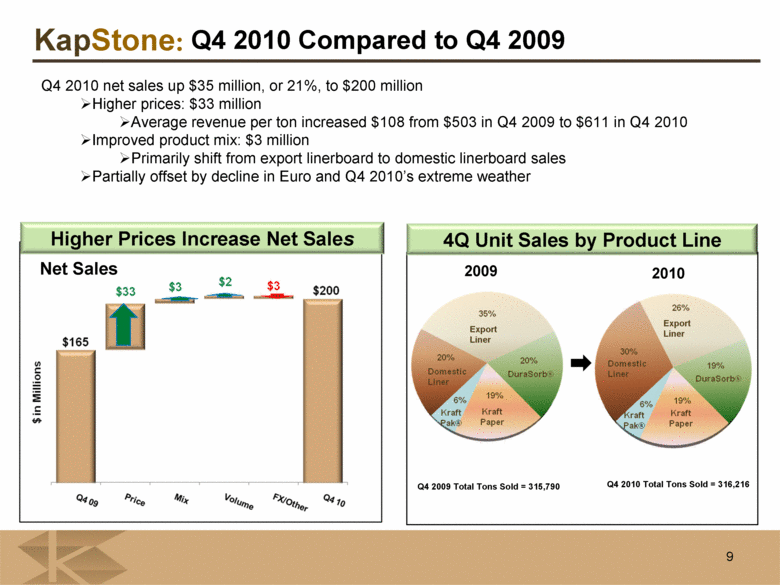
Higher Prices Increase Net Sales Q4 2010 net sales up $35 million, or 21%, to $200 million Higher prices: $33 million Average revenue per ton increased $108 from $503 in Q4 2009 to $611 in Q4 2010 Improved product mix: $3 million Primarily shift from export linerboard to domestic linerboard sales Partially offset by decline in Euro and Q4 2010’s extreme weather Net Sales 4Q Unit Sales by Product Line 9 Export Liner Export Liner Q4 2010 Total Tons Sold = 316,216 Q4 2009 Total Tons Sold = 315,790 2009 2010 Q4 2010 Compared to Q4 2009 |
|
|
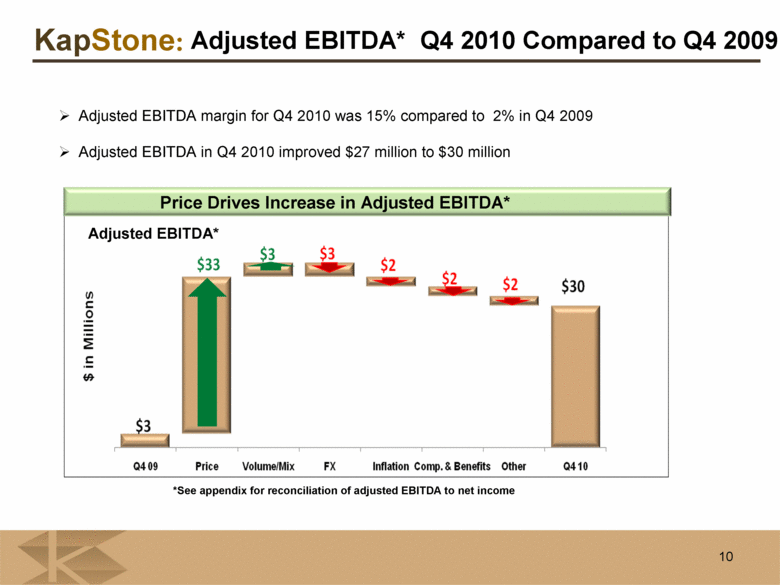
Adjusted EBITDA* Q4 2010 Compared to Q4 2009 *See appendix for reconciliation of adjusted EBITDA to net income Adjusted EBITDA margin for Q4 2010 was 15% compared to 2% in Q4 2009 Adjusted EBITDA in Q4 2010 improved $27 million to $30 million Price Drives Increase in Adjusted EBITDA* Adjusted EBITDA* 10 |
|
|
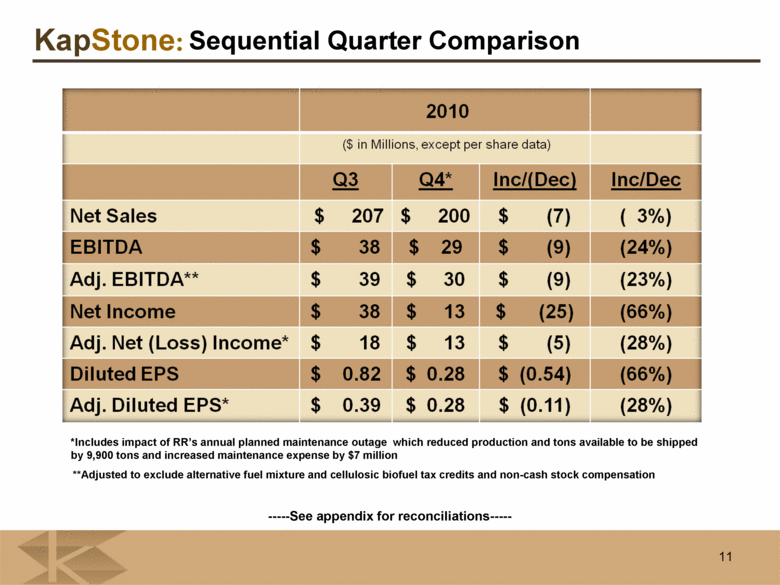
Sequential Quarter Comparison **Adjusted to exclude alternative fuel mixture and cellulosic biofuel tax credits and non-cash stock compensation -----See appendix for reconciliations----- *Includes impact of RR’s annual planned maintenance outage which reduced production and tons available to be shipped by 9,900 tons and increased maintenance expense by $7 million 11 2010 ($ in Millions, except per share data) Q3 Q4* Inc/(Dec) Inc/Dec Net Sales $ 207 $ 200 $ (7) ( 3%) EBITDA $ 38 $ 29 $ (9) (24%) Adj. EBITDA** $ 39 $ 30 $ (9) (23%) Net Income $ 38 $ 13 $ (25) (66%) Adj. Net (Loss) Income* $ 18 $ 13 $ (5) (28%) Diluted EPS $ 0.82 $ 0.28 $ (0.54) (66%) Adj. Diluted EPS* $ 0.39 $ 0.28 $ (0.11) (28%) |
|
|
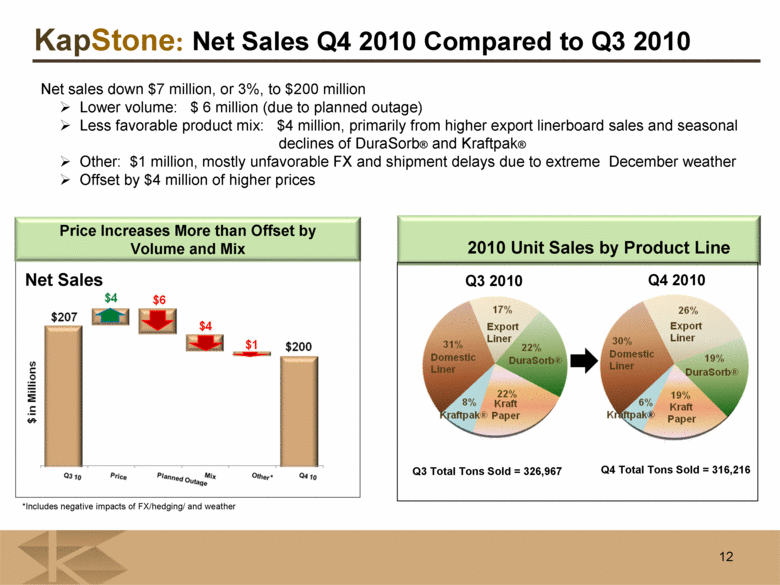
Net Sales Q4 2010 Compared to Q3 2010 Price Increases More than Offset by Volume and Mix Net sales down $7 million, or 3%, to $200 million Lower volume: $ 6 million (due to planned outage) Less favorable product mix: $4 million, primarily from higher export linerboard sales and seasonal declines of DuraSorb® and Kraftpak® Other: $1 million, mostly unfavorable FX and shipment delays due to extreme December weather Offset by $4 million of higher prices Net Sales *Includes negative impacts of FX/hedging/ and weather 2010 Unit Sales by Product Line Q3 Total Tons Sold = 326,967 Q4 Total Tons Sold = 316,216 12 Q3 2010 Q4 2010 * |
|
|
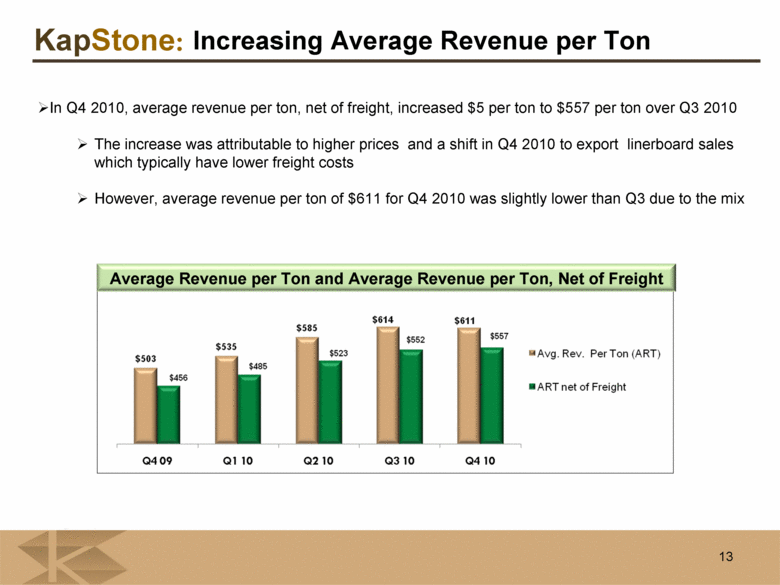
Increasing Average Revenue per Ton In Q4 2010, average revenue per ton, net of freight, increased $5 per ton to $557 per ton over Q3 2010 The increase was attributable to higher prices and a shift in Q4 2010 to export linerboard sales which typically have lower freight costs However, average revenue per ton of $611 for Q4 2010 was slightly lower than Q3 due to the mix Average Revenue per Ton and Average Revenue per Ton, Net of Freight 13 |
|
|
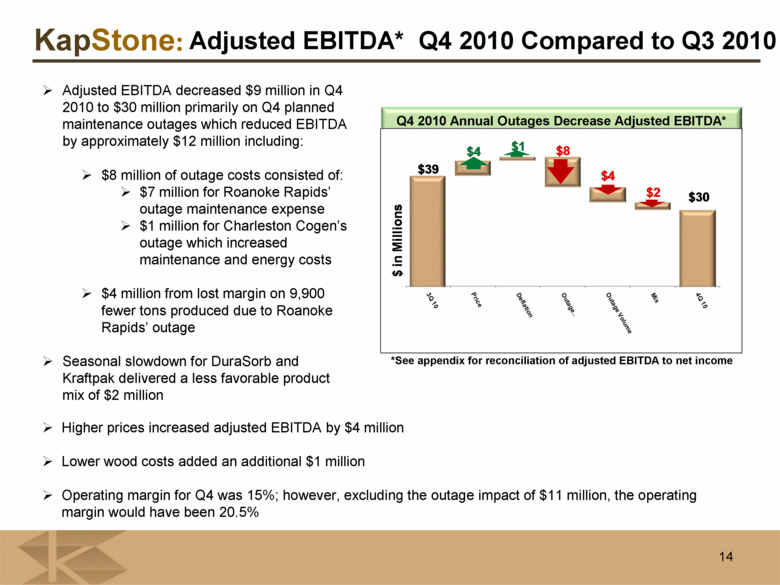
Adjusted EBITDA* Q4 2010 Compared to Q3 2010 *See appendix for reconciliation of adjusted EBITDA to net income Q4 2010 Annual Outages Decrease Adjusted EBITDA* Adjusted EBITDA decreased $9 million in Q4 2010 to $30 million primarily on Q4 planned maintenance outages which reduced EBITDA by approximately $12 million including: $8 million of outage costs consisted of: $7 million for Roanoke Rapids’ outage maintenance expense $1 million for Charleston Cogen’s outage which increased maintenance and energy costs $4 million from lost margin on 9,900 fewer tons produced due to Roanoke Rapids’ outage Seasonal slowdown for DuraSorb and Kraftpak delivered a less favorable product mix of $2 million Higher prices increased adjusted EBITDA by $4 million Lower wood costs added an additional $1 million Operating margin for Q4 was 15%; however, excluding the outage impact of $11 million, the operating margin would have been 20.5% 14 $39 $4 $1 $8 $4 $2 $30 $ in Millions |
|
|
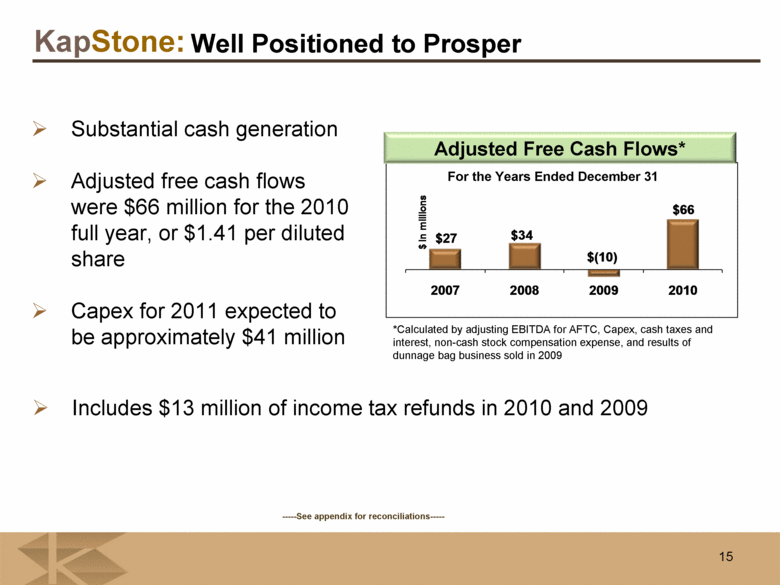
Substantial cash generation Adjusted free cash flows were $66 million for the 2010 full year, or $1.41 per diluted share Capex for 2011 expected to be approximately $41 million *Calculated by adjusting EBITDA for AFTC, Capex, cash taxes and interest, non-cash stock compensation expense, and results of dunnage bag business sold in 2009 Includes $13 million of income tax refunds in 2010 and 2009 For the Years Ended December 31 Adjusted Free Cash Flows* 15 Well Positioned to Prosper -----See appendix for reconciliations----- $27 $34 $(10) $66 2007 2008 2009 2010 $ in millions |
|
|
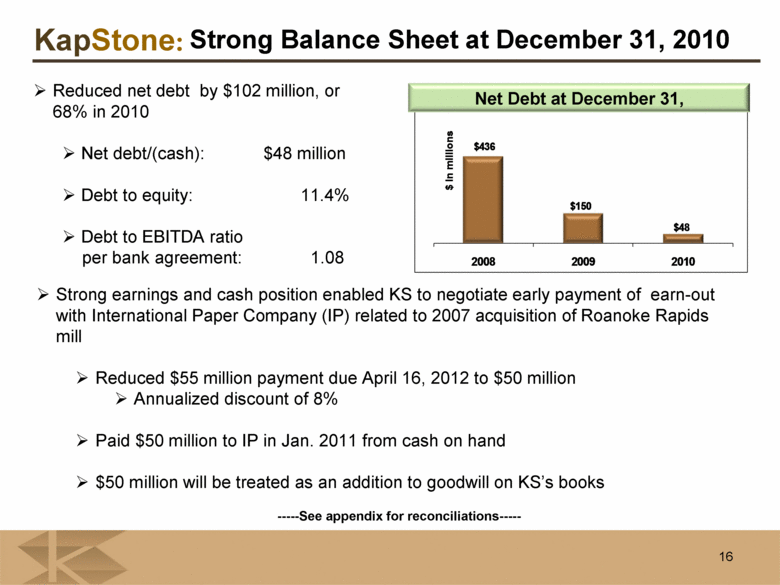
Strong Balance Sheet at December 31, 2010 Reduced net debt by $102 million, or 68% in 2010 Net debt/(cash): $48 million Debt to equity: 11.4% Debt to EBITDA ratio per bank agreement: 1.08 Net Debt at December 31, Strong earnings and cash position enabled KS to negotiate early payment of earn-out with International Paper Company (IP) related to 2007 acquisition of Roanoke Rapids mill Reduced $55 million payment due April 16, 2012 to $50 million Annualized discount of 8% Paid $50 million to IP in Jan. 2011 from cash on hand $50 million will be treated as an addition to goodwill on KS’s books 16 -----See appendix for reconciliations----- $436 $150 $48 2008 2009 2010 $ in millions |
|
|
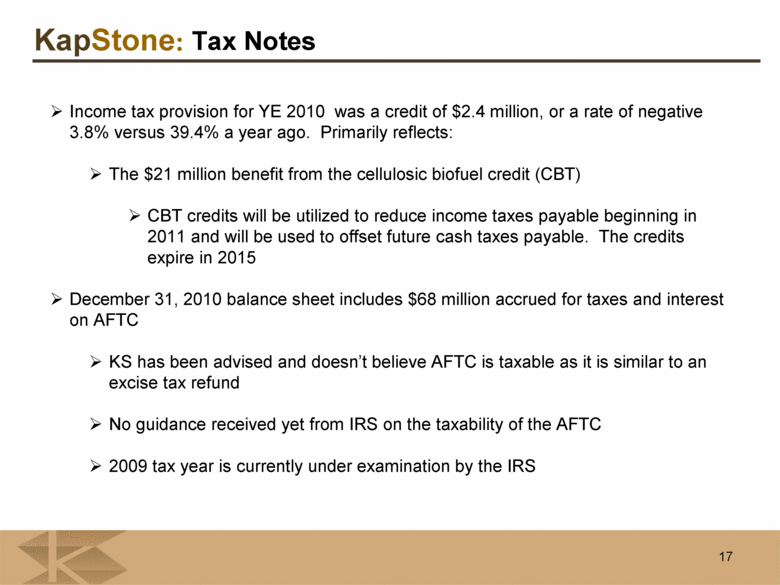
Income tax provision for YE 2010 was a credit of $2.4 million, or a rate of negative 3.8% versus 39.4% a year ago. Primarily reflects: The $21 million benefit from the cellulosic biofuel credit (CBT) CBT credits will be utilized to reduce income taxes payable beginning in 2011 and will be used to offset future cash taxes payable. The credits expire in 2015 December 31, 2010 balance sheet includes $68 million accrued for taxes and interest on AFTC KS has been advised and doesn’t believe AFTC is taxable as it is similar to an excise tax refund No guidance received yet from IRS on the taxability of the AFTC 2009 tax year is currently under examination by the IRS Tax Notes 17 |
|
|
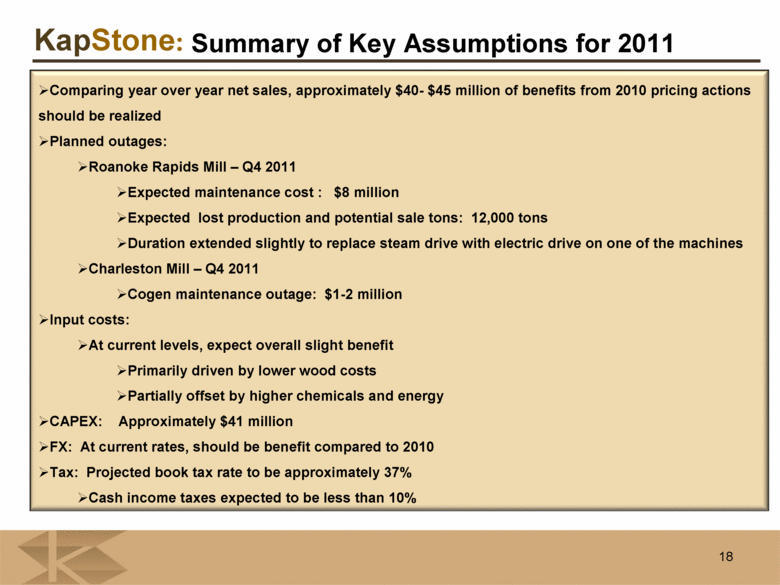
Summary of Key Assumptions for 2011 Comparing year over year net sales, approximately $40- $45 million of benefits from 2010 pricing actions should be realized Planned outages: Roanoke Rapids Mill – Q4 2011 Expected maintenance cost : $8 million Expected lost production and potential sale tons: 12,000 tons Duration extended slightly to replace steam drive with electric drive on one of the machines Charleston Mill – Q4 2011 Cogen maintenance outage: $1-2 million Input costs: At current levels, expect overall slight benefit Primarily driven by lower wood costs Partially offset by higher chemicals and energy CAPEX: Approximately $41 million FX: At current rates, should be benefit compared to 2010 Tax: Projected book tax rate to be approximately 37% Cash income taxes expected to be less than 10% 18 |
|
|
APPENDIX |
|
|
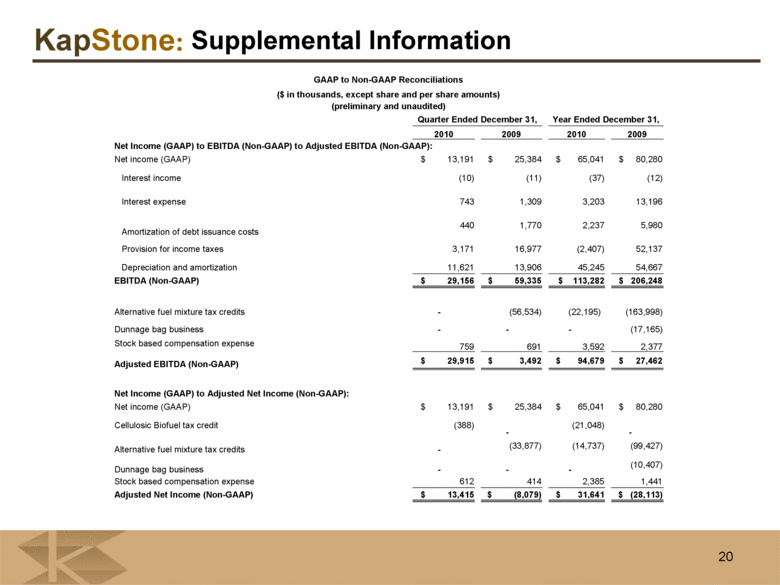
20 Supplemental Information GAAP to Non-GAAP Reconciliations ($ in thousands, except share and per share amounts) (preliminary and unaudited) Quarter Ended December 31, Year Ended December 31, 2010 2009 2010 2009 Net Income (GAAP) to EBITDA (Non-GAAP) to Adjusted EBITDA (Non-GAAP): Net income (GAAP) $ 13,191 $ 25,384 $ 65,041 $ 80,280 Interest income (10) (11) (37) (12) Interest expense 743 1,309 3,203 13,196 Amortization of debt issuance costs 440 1,770 2,237 5,980 Provision for income taxes 3,171 16,977 (2,407) 52,137 Depreciation and amortization 11,621 13,906 45,245 54,667 EBITDA (Non-GAAP) $ 29,156 $ 59,335 $ 113,282 $ 206,248 Alternative fuel mixture tax credits - (56,534) (22,195) (163,998) Dunnage bag business - - - (17,165) Stock based compensation expense 759 691 3,592 2,377 Adjusted EBITDA (Non-GAAP) $ 29,915 $ 3,492 $ 94,679 $ 27,462 Net Income (GAAP) to Adjusted Net Income (Non-GAAP): Net income (GAAP) $ 13,191 $ 25,384 $ 65,041 $ 80,280 Cellulosic Biofuel tax credit (388) - (21,048) - Alternative fuel mixture tax credits - (33,877) (14,737) (99,427) Dunnage bag business - - - (10,407) Stock based compensation expense 612 414 2,385 1,441 Adjusted Net Income (Non-GAAP) $ 13,415 $ (8,079) $ 31,641 $ (28,113) |
|
|
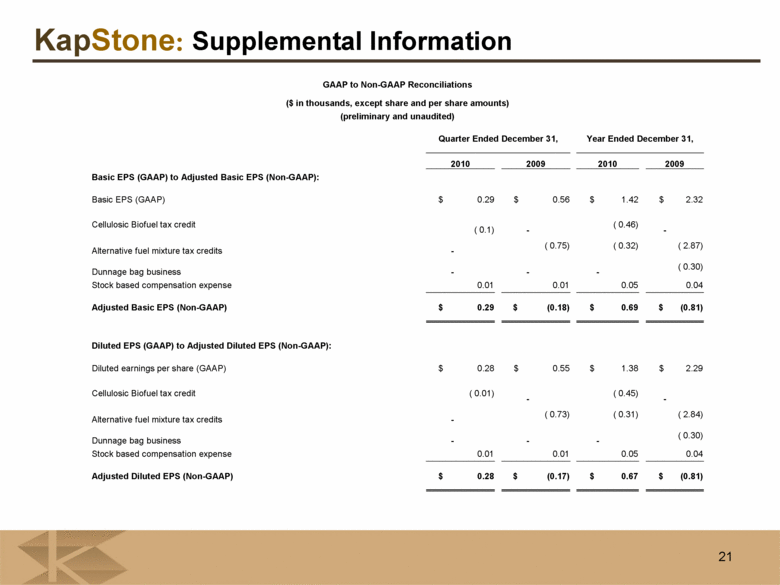
21 Supplemental Information GAAP to Non-GAAP Reconciliations ($ in thousands, except share and per share amounts) (preliminary and unaudited) Quarter Ended December 31, Year Ended December 31, 2010 2009 2010 2009 Basic EPS (GAAP) to Adjusted Basic EPS (Non-GAAP): Basic EPS (GAAP) $ 0.29 $ 0.56 $ 1.42 $ 2.32 Cellulosic Biofuel tax credit (0.1) - ( 0.46) - Alternative fuel mixture tax credits - ( 0.75) ( 0.32) ( 2.87) Dunnage bag business - - - ( 0.30) Stock based compensation expense 0.01 0.01 0.05 0.04 Adjusted Basic EPS (Non-GAAP) $ 0.29 $ (0.18) $ 0.69 $ (0.81) Diluted EPS (GAAP) to Adjusted Diluted EPS (Non-GAAP): Diluted earnings per share (GAAP) $ 0.28 $ 0.55 $ 1.38 $ 2.29 Cellulosic Biofuel tax credit ( 0.01) - ( 0.45) - Alternative fuel mixture tax credits - ( 0.73) ( 0.31) ( 2.84) Dunnage bag business - - - ( 0.30) Stock based compensation expense 0.01 0.01 0.05 0.04 Adjusted Diluted EPS (Non-GAAP) $ 0.28 $ (0.17) $ 0.67 $ (0.81) |
|
|
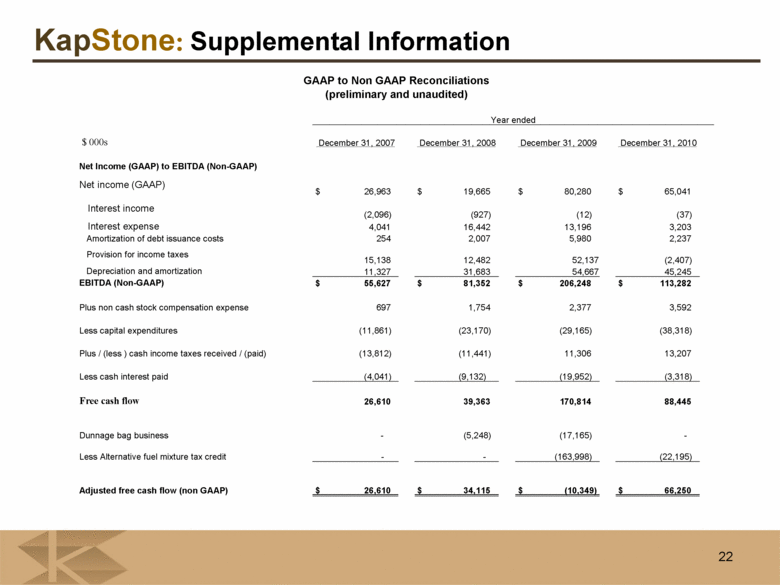
KapStone: 22 Supplemental Information GAAP to Non GAAP Reconciliations (preliminary and unaudited) Year ended $ 000s December 31, 2007 December 31, 2008 December 31, 2009 December 31, 2010 Net Income (GAAP) to EBITDA (Non-GAAP) Net income (GAAP) $ 26,963 $ 19,665 $ 80,280 $ 65,041 Interest income (2,096) (927) (12) (37) Interest expense 4,041 16,442 13,196 3,203 Amortization of debt issuance costs 254 2,007 5,980 2,237 Provision for income taxes 15,138 12,482 52,137 (2,407) Depreciation and amortization 11,327 31,683 54,667 45,245 EBITDA (Non-GAAP) $ 55,627 $ 81,352 $ 206,248 $ 113,282 Plus non cash stock compensation expense 697 1,754 2,377 3,592 Less capital expenditures (11,861) (23,170) (29,165) (38,318) Plus / (less ) cash income taxes received / (paid) (13,812) (11,441) 11,306 13,207 Less cash interest paid (4,041) (9,132) (19,952) (3,318) Free cash f low 26,610 39,363 170,814 88,445 Dunnage bag business - (5,248) (17,165) - Less Alternative fuel mixture tax credit - - (163,998) (22,195) Adjusted free cash flow (non GAAP) $ 26,610 $ 34,115 $ (10,349) $ 66,250 |

