Attached files
| file | filename |
|---|---|
| EX-32.1 - EX-32.1 - KAPSTONE PAPER & PACKAGING CORP | a2227447zex-32_1.htm |
| EX-31.1 - EX-31.1 - KAPSTONE PAPER & PACKAGING CORP | a2227447zex-31_1.htm |
| EX-21.1 - EX-21.1 - KAPSTONE PAPER & PACKAGING CORP | a2227447zex-21_1.htm |
| EX-31.2 - EX-31.2 - KAPSTONE PAPER & PACKAGING CORP | a2227447zex-31_2.htm |
| EX-23.1 - EX-23.1 - KAPSTONE PAPER & PACKAGING CORP | a2227447zex-23_1.htm |
| EX-32.2 - EX-32.2 - KAPSTONE PAPER & PACKAGING CORP | a2227447zex-32_2.htm |
Use these links to rapidly review the document
TABLE OF CONTENTS1
TABLE OF CONTENTS2
UNITED STATES
SECURITIES AND EXCHANGE COMMISSION
WASHINGTON, D.C. 20549
FORM 10-K
ý |
ANNUAL REPORT PURSUANT TO SECTION 13 OR 15(d) OF THE SECURITIES EXCHANGE ACT OF 1934 |
|
For the fiscal year ended December 31, 2015 |
||
o |
TRANSITION REPORT PURSUANT TO SECTION 13 OR 15(d) OF THE SECURITIES EXCHANGE ACT OF 1934 |
|
For the transition period from to , |
||
Commission File No.: 001-33494
KapStone Paper and Packaging Corporation
(Exact name of registrant as specified in its charter)
| Delaware (State or other jurisdiction of incorporation or organization) |
20-2699372 (I.R.S. Employer Identification No.) |
KapStone Paper and Packaging Corporation
1101 Skokie Blvd. Suite 300
Northbrook, IL 60062
(Address of principal executive offices) (ZIP Code)
Registrant's telephone number, including area code: (847) 239-8800
SECURITIES REGISTERED PURSUANT TO SECTION 12(b) OF THE ACT:
| Title of Each Class | Name of Exchange On Which Registered | |
|---|---|---|
| Common Stock (Par Value $0.0001) | New York Stock Exchange |
SECURITIES REGISTERED PURSUANT TO SECTION 12(g) OF THE ACT: NONE
Indicate by check mark if the registrant is a well-known seasoned issuer, as defined in Rule 405 of the Securities Act. Yes ý No o
Indicate by check mark if the registrant is not required to file reports pursuant to Section 13 or Section 15(d) of the Act. Yes o No ý
Indicate by check mark whether the registrant (1) has filed all reports required to be filed by Section 13 or 15(d) of the Securities Exchange Act of 1934 during the preceding 12 months (or for such shorter period that the registrant was required to file such reports), and (2) has been subject to such filing requirements for the past 90 days. Yes ý No o
Indicate by check mark whether the registrant has submitted electronically and posted on its corporate Web site, if any, every Interactive Data File required to be submitted and posted pursuant to Rule 405 of regulation S-T (§ 232.405 of this chapter) during the preceding 12 months (or for shorter period that the registrant was required to submit and post such files). Yes ý No o
Indicate by check mark if disclosure of delinquent filers pursuant to item 405 of Regulation S-K is not contained herein, and will not be contained, to the best of the registrant's knowledge in definitive proxy or information statements incorporated by reference in Part III of this Form 10-K or any amendment to this Form 10-K. o
Indicate by check mark whether the registrant is a large accelerated filer, an accelerated filer, a non-accelerated filer or a smaller reporting company. See the definition of the above in Rule 12b-2 of the Exchange Act.
| Large Accelerated Filer ý | Accelerated Filer o | Non-Accelerated Filer o (Do not check if a smaller reporting company) |
Smaller Reporting Company o |
Indicate by check mark whether the registrant is a shell company (as defined in Rule 12b-2 of the Exchange Act). Yes o No ý
The aggregate market value of the 85,454,365 shares of Common Stock held by non-affiliates of the registrant on June 30, 2015, was $1,975,704,919. This calculation was made using a price per share of Common Stock of $23.12; the closing price of the Common Stock on the New York Stock Exchange on June 30, 2015 the last day of the registrant's most recently completed second fiscal quarter of 2015. Solely for purposes of this calculation, all shares held by directors and executive officers of the registrant have been excluded. This exclusion should not be deemed an admission that these individuals are affiliates of the registrant.
On February 19, 2016, there were 96,372,155 shares of Common Stock outstanding.
DOCUMENTS INCORPORATED BY REFERENCE:
The registrant's Definitive Proxy Statement for its 2016 Annual Meeting of Stockholders will be filed with the Securities and Exchange Commission no later than 120 days after the end of the fiscal year covered by this Form 10-K pursuant to General Instruction G(3) of the Form 10-K. Information from such Definitive Proxy Statement will be incorporated by reference into Part III.
KapStone Acquisition History
KapStone Paper and Packaging Corporation was formed in Delaware as a special purpose acquisition corporation on April 15, 2005 for the purpose of effecting a merger, capital stock exchange, asset acquisition or other similar business combination with an unidentified operating business in the paper, packaging, forest products, and related industries. Unless the context otherwise requires, references to "KapStone," the "Company," "we," "us" and "our" refer to KapStone Paper and Packaging Corporation and its subsidiaries.
On January 2, 2007, we acquired from International Paper Company substantially all of the assets and assumed certain liabilities of the Kraft Papers Business ("KPB") for $155.0 million, less $7.8 million of working capital adjustments. The KPB assets consisted of an unbleached kraft paper manufacturing facility in Roanoke Rapids, North Carolina, Ride Rite® Converting, an inflatable dunnage bag manufacturer located in Fordyce, Arkansas, trade accounts receivable and inventories. We subsequently paid an aggregate of $53.7 million additional purchase price pursuant to contingent earn-out payments based upon achieving certain EBITDA targets.
On July 1, 2008, we acquired from MeadWestvaco Corporation ("MWV") substantially all of the assets and assumed certain liabilities of the Charleston Kraft Division ("CKD") for $485.0 million (net of cash acquired of $10.6 million), less $8.9 million of working capital adjustments. The CKD assets consisted of an unbleached kraft paper manufacturing facility in North Charleston, South Carolina (including a cogeneration facility), chip mills located in Elgin, Hampton, Andrews and Kinards, South Carolina, a lumber mill located in Summerville, South Carolina, trade accounts receivable and inventories.
On March 31, 2009, we completed the sale of our dunnage bag business to Illinois Tool Works Inc. for $36.0 million, less $1.1 million of working capital adjustments. The Company considered the sale an opportunity to reduce its debt and focus on its core business.
On October 31, 2011, we acquired U.S. Corrugated Acquisition Inc. ("USC") pursuant to a merger for $330.0 million in cash plus $1.9 million of working capital adjustments. USC owned, at the time of the merger, a recycled containerboard paper mill in Cowpens, South Carolina and fourteen corrugated packaging plants across the Eastern and Midwestern United States.
On July 18, 2013, we acquired 100 percent of the stock of Longview Fibre Paper and Packaging, Inc., ("Longview") for $1.025 billion plus $41.5 million of working capital adjustments. Longview is a leading manufacturer of high quality containerboard, kraft papers and corrugated products. Longview's operations include a paper mill located in Longview, Washington equipped with five paper machines which have the capacity to produce approximately 1.3 million tons of containerboard and kraft paper annually. Longview also owns seven converting facilities located in the Pacific Northwest.
On June 1, 2015, we acquired 100 percent of the partnership interests in Victory Packaging, L.P. and its subsidiaries ("Victory") for $615.0 million in cash and $2.0 million of working capital adjustments. Victory, headquartered in Houston, TX, provides its customers comprehensive packaging solutions and services and is one of the largest North American distributors of packaging materials. Victory's operations include more than 60 distribution and fulfillment facilities in the United States, Mexico and Canada. See Note 3, Victory Acquisition, for further detail.
The Company operates in two segments: Paper and Packaging and Distribution. Our Paper and Packaging segment manufactures and sells a wide variety container board, corrugated products and specialty paper for industrial and consumer markets. The Distribution segment was acquired June 1,
2
2015 through the acquisition of Victory. The Company also has a Corporate and other category, which includes expenses and certain assets not attributable to either of the segments.
Future Acquisitions
In an effort to diversify and/or grow our business we have been, and continue to be, engaged in evaluating a number of potential acquisition opportunities. No assurance can be given that we will consummate additional transactions. The structuring and financing of any future acquisitions may be dependent on the terms and availability of additional financing to us that either replaces or does not conflict with the Company's existing senior secured credit facility.
General
Our Paper and Packaging segment produces containerboard, corrugated products and specialty paper. In 2015, we produced 2.7 million tons, nearly 82 percent of which was sold to third party converters or shipped to our corrugated products manufacturing plants based in the United States, and 18 percent of which was sold to foreign based customers. In 2015, our corrugated products manufacturing plants produced and sold about 849 thousand tons or 13.4 billion square feet ("BSF") of corrugated products in the U.S. Our net sales in 2015 totaled $2.1 billion, which was comprised of $1.4 billion of containerboard and corrugated products and $0.7 billion of specialty paper.
Our Distribution segment, which operates under the Victory and Golden State Container trade names, provides its customers comprehensive packaging solutions and services and distributes corrugated packaging materials, as well as other specialty packaging materials, such as plastics, wood, void fill, tapes and stretch wraps. For the seven months ended December 31, 2015, Victory's net sales totaled $0.6 billion, 14 percent of which was sold to foreign-based customers. We believe the Victory acquisition provides us with an additional distribution channel for our corrugated packaging products and, ultimately, our container board mills.
The Company's business is affected by cyclical industry conditions and general economic conditions in North America and in other parts of the world where we export containerboard and specialty paper and distribute packaging materials. These conditions affect the prices that we are able to charge for our products and services. Our foreign and export sales may also be affected by fluctuations in foreign exchange rates and trade policies and relations.
Industry Overviews
Our Paper and Packaging segment competes in the containerboard, corrugated products and specialty paper markets. We view the specialty paper market as including kraft paper, saturating kraft and unbleached folding carton board.
Our Distribution segment competes in the distribution and fulfillment services market, serving customers across a range of industries. These customers include governmental entities, as well as customers in the moving and storage, automotive, retail and other industries.
Paper and Packaging Segment
Containerboard
Containerboard, consisting of linerboard and corrugated medium, is primarily used to manufacture corrugated containers for packaging products. U.S. demand for corrugated containers and containerboard tends to be driven by industrial production of processed foods, nondurable goods and certain durable goods.
3
The American Forest and Paper Association's ("AF&PA") estimate of the size of the U.S. containerboard market is as follows:
| (In millions) |
2015 | 2014 | 2013 | |||||||
|---|---|---|---|---|---|---|---|---|---|---|
Total U.S. sales |
32.2 tons | 31.7 tons | 30.8 tons | |||||||
U.S. production |
35.8 tons | 35.4 tons | 34.8 tons | |||||||
Imports |
1.1 tons | 1.0 tons | 0.8 tons | |||||||
Exports |
4.8 tons | 4.7 tons | 4.2 tons | |||||||
U.S. operating rates |
94 |
% |
96 |
% |
96 |
% |
||||
The primary markets for our containerboard are our corrugated products manufacturing plants, independent corrugated and laminated products customers who focus on specialty niche packaging and Victory.
Corrugated Products
According to the Fibre Box Association's most recent annual report dated April 2015, the value of industry shipments of corrugated products was $29.8 billion, an increase of $1.4 billion, or 4.9 percent.
The primary end-use markets for corrugated products are shown below (as reported in the most recent Fibre Box Association annual report dated April 2015):
Food, beverages and agricultural products |
39 | % | ||
General retail and wholesale trade |
19 | % | ||
Paper products |
19 | % | ||
Miscellaneous manufacturing |
11 | % | ||
Petroleum, plastic, synthetic, and rubber products |
8 | % | ||
Appliances, vehicles, and metal products |
4 | % |
Corrugated products manufacturing plants tend to be located in close proximity to customers to minimize freight costs and shipping times. The Fibre Box Association estimates that the U.S. corrugated products industry consists of approximately 540 companies and over 1,200 plants.
Specialty Paper
Kraft Paper
We produce three general categories of kraft paper:
- •
- Multiwall paper is used to produce bags for agricultural products, pet food, baking
products, cement and chemicals. We are the only U.S. manufacturer of extensible, high performance multiwall kraft paper. Our FibreShield® and TEA-Kraft® lines of products offer
durability, savings, efficiency and are supported by our exceptional customer and technical service. We also manufacture durable flat multiwall sack paper for a variety of end-use applications.
- •
- Specialty products have a large variety of uses within coating and laminating applications that requires a smooth surface. Specialty paper is also used to produce shingle wrap, end caps, roll wrap and dunnage bags. Our specialty paper products are designed to meet the unique needs of a variety of customers and end uses. We modify a range of specialty paper products for our specialty paper grades, such as sizing, smoothness, porosity, wet strength, pH and others. Our specialty paper products are manufactured for a variety of converters, including laminators, coaters, insulation manufacturers, agricultural product processors and food product packaging producers.
4
- •
- Lightweight paper is used in a variety of flexible packaging applications that range from 100 percent recycled content for quick-service restaurants carry out bags to 100 percent virgin content for direct contact food packaging. Our lightweight virgin furnished papers are produced from specifically blended wood chip recipes. These wood chip and pulp recipes are specifically designed to develop paper properties important for a variety of specialty packaging end uses and coating base paper applications. Our recycled content light weight papers are made in a wide variety of basis weights and percentages of recycled fiber content, and are valued for their cleanliness, strength, sustainability and end-use possibilities. The most recently developed product line, FibreGreen®, is composed of old corrugated containers ("OCC") processed in our state-of-the-art OCC facility and are available in a wide range of basis weights. FibreGreen® meets the U.S. Food and Drug Administration's requirements for direct food contact and is certified by the Sustainable Forestry Initiative®.
The AF&PA's estimate of the size of the U.S. kraft paper market is as follows:
| (In millions) |
2015 | 2014 | 2013 | |||||||
|---|---|---|---|---|---|---|---|---|---|---|
Total U.S. sales |
1.58 tons | 1.40 tons | 1.34 tons | |||||||
U.S. production |
1.15 tons | 1.34 tons | 1.27 tons | |||||||
Imports |
0.17 tons | 0.17 tons | 0.18 tons | |||||||
Exports |
0.21 tons | 0.21 tons | 0.21 tons | |||||||
U.S. operating rates |
90 | % | 90 | % | 77 | % | ||||
Over the last two decades, unbleached kraft paper production capacity has declined. This decline was primarily driven by plastic bags replacing paper at most grocery stores across North America. The multiwall shipping sack market also contributed to the decrease in capacity resulting from conversion to plastic and woven poly in certain end-use markets, primarily pet food, chemicals and seed and feed markets.
Saturating Kraft
Saturating kraft is used in multiple industries around the world, including construction, electronics manufacturing and furniture manufacturing. The major end-use is thin high pressure laminates ("HPL"), used to create decorative surfaces such as kitchen and bath countertops, home and office furniture and flooring. Within the HPL market there is a growing and distinct HPL segment manufacturing and selling a much thicker product called compact laminates used as surfacing products such as exterior cladding, partitions and doors. In Asia, there is significant use of saturating kraft product for the manufacturing of printed circuit boards and copper clad laminates and there is also a growing use for thin HPL in decorative surfaces. We are not aware of any published data reporting the size of the saturating kraft market. Barriers to entry for producing high quality saturating kraft are high as it is a technically difficult grade of paper to produce.
Unbleached Folding Carton Board
Unbleached folding carton board is a low density virgin fiber board. Applications are widely spread throughout end uses in the general folding carton segment of the paperboard packaging market. This product can replace the use of more expensive coated recycled board, coated natural kraft board and solid bleached sulfate board which are currently much larger markets. There is no published data we are aware of reporting the size of the unbleached, uncoated folding carton market.
Distribution Segment
Victory has been delivering comprehensive packaging solutions in the packaging services and distribution industry for almost 40 years. The Distribution segment, through Victory's operations, works
5
with customers to improve and facilitate the various aspects of packaging and distribution, including packaging design, creation, storage, delivery and management. Based in Houston, TX, Victory has more than 60 warehouses and distribution facilities, with the majority in the United States, 3 in Canada and 18 in Mexico, and operates in California under the name of Golden State Container. Nationwide, Victory is one of the largest distributors specializing in packaging solutions for its customers on a national scale. Victory also oversees local packaging and distribution for regional customers. The Distribution segment's national network includes more than 7 million square feet of warehouse space and approximately 220 delivery vehicles.
Victory distributes corrugated and other specialty packaging products, which include stretch film, void fill, carton sealing tape and other specialty tapes.
Manufacturing
We operate four paper mills, three in the Southeastern region and one in the Pacific Northwest region of the United States. In 2015, we produced 2.7 million tons of containerboard and specialty paper at our mills in North Charleston, South Carolina; Roanoke Rapids, North Carolina; Cowpens, South Carolina and Longview, Washington. Our mills generally operate 24 hours a day, seven days a week. Fiber used to make containerboard and specialty paper is produced from a combination of locally sourced roundwood and woodchips. After the wood is debarked and chipped, the chips are loaded into digesters for cooking. Woodchips, chemicals and steam are mixed in the digester to produce softwood pulp. Hardwood pulp is produced in North Charleston in a similar fashion for the production of DuraSorb® saturating kraft. The pulp is screened and washed through a series of washers and then stored prior to the paper making process. OCC is used to make recycled containerboard at our Cowpens mill and is a component of certain grades of kraft paper and containerboard at our Longview mill. The Company processes pulp using eleven paper machines at our facilities. Management monitors productivity on a real-time basis with on-line reporting tools that track production values versus targets. Overall equipment efficiency is also monitored daily through production reporting systems.
As of December 31, 2015, we operated 21 corrugated products manufacturing plants, comprised of 13 box plants, six sheet plants and two sheet feeder plants. Box plants operate as combining operations that manufacture corrugated sheets and finished corrugated products. Sheet feeder plants have a corrugator machine and manufacture corrugated sheets, which are shipped to sheet or box plants. Sheet plants have various machines that convert corrugated sheets, purchased either from our operations or third parties, into finished corrugated products. Plants with a corrugating machine have total capacity of approximately 18 BSF.
Our corrugated products manufacturing plants operate in 15 states in the U.S., with no manufacturing facilities outside of the continental U.S. Each plant, for the most part, serves a market radius that typically averages 200 miles. Our sheet plants are generally located in close proximity to our larger corrugated plants, which enables us to offer additional services and converting capabilities, such as small volume and quick turnaround items.
We produce a wide variety of products ranging from basic corrugated shipping containers to specialized packaging. We also have multi-color printing capabilities to make high-impact graphics boxes and displays that offer customers such as consumer products companies more attractive packaging.
We have dedicated personnel who coordinate and execute all containerboard buy/sell arrangements with other containerboard manufacturers. As is industry practice, we also "trade" among industry participants who are located more closely to converting plants in order to reduce freight costs.
6
Supply Chain
Containerboard and specialty paper produced in our paper mills is shipped by rail or truck to customers in the U.S. and is shipped by truck to nearby ports and then by ocean vessel to our export customers. Domestic rail shipments represent about 41 percent of the tons shipped and the remaining 59 percent is shipped by truck.
Our corrugated products are delivered by truck due to our customers demand for timely service. We use a combination of a dedicated third-party fleet and our own trucks.
The majority of Victory's products in the U.S. and Canada are delivered directly from Victory's network of distribution and fulfillment facilities using its fleet of approximately 220 delivery vehicles. In Mexico, delivery is outsourced to third party logistics companies. Our distribution and fulfillment facilities offer a range of delivery options depending on the customer's needs and preferences, and the strategic placement of the distribution and fulfillment facilities also allows for delivery of special or "rush" orders to many customers.
Sales and Marketing
Our containerboard and specialty paper marketing strategy is to sell our products to third-party converters and manufacturers of industrial and consumer packaging products. We seek to meet the quality and service needs of the customers of our corrugated operations at the most efficient cost, while balancing those needs against the demands of our containerboard customers.
We sell our products directly to end users and converters, as well as through sales agents. Our sales groups are responsible for the sale of these products to third party converters in the U.S. Sales to export markets are managed by separate teams of which certain personnel are based in Europe and Asia.
Our corrugated and packaging products and services are sold through an internal sales and marketing organization. We have sales representatives and sales managers who serve local and regional accounts. We also have corporate account managers who serve large national accounts at multiple customer locations. Our corrugated operations focus on supplying both high-volume commodity products and specialized packaging with high-value graphics.
Customers and Products
The following represents the Company's sales by product line:
| |
Years Ended December 31, | ||||||||||||||||||||||||
|---|---|---|---|---|---|---|---|---|---|---|---|---|---|---|---|---|---|---|---|---|---|---|---|---|---|
| |
Net Sales (in thousands) |
|
|
|
|
|
|
||||||||||||||||||
| |
|
|
Tons Sold | |
|
||||||||||||||||||||
| |
Increase/ (Decrease) |
|
Increase/ (Decrease) |
|
|||||||||||||||||||||
Product Line Revenue:
|
2015 | 2014 | % | 2015 | 2014 | % | |||||||||||||||||||
Containerboard / Corrugated products |
$ | 1,399,522 | $ | 1,463,670 | $ | (64,148 | ) | (4.4 | )% | 1,688,868 | 1,764,628 | (75,760 | ) | (4.3 | )% | ||||||||||
Specialty paper |
720,588 | 741,601 | (21,013 | ) | (2.8 | )% | 1,017,905 | 1,031,024 | (13,119 | ) | (1.3 | )% | |||||||||||||
Distribution |
582,949 | — | 582,949 | +100 | % | — | — | — | — | ||||||||||||||||
Other |
86,286 | 95,649 | (9,363 | ) | (9.8 | )% | — | — | — | — | |||||||||||||||
| | | | | | | | | | | | | | | | | | | | | | | | | | |
Product sold |
$ | 2,789,345 | $ | 2,300,920 | $ | 488,425 | 21.2 | % | 2,706,773 | 2,795,652 | (88,879 | ) | (3.2 | )% | |||||||||||
| | | | | | | | | | | | | | | | | | | | | | | | | | |
| | | | | | | | | | | | | | | | | | | | | | | | | | |
| | | | | | | | | | | | | | | | | | | | | | | | | | |
Our Paper and Packaging segment has over 3,000 U.S.-based and over 200 export customers, and our Distribution segment has approximately 6,200 active customers.
Containerboard is sold to domestic and foreign converters in the corrugated packaging industry and to other converters for a variety of uses including laminated tier sheets and wrapping material, among others. Historically, our focus is on independent converters who do not have their own mill systems or converters who otherwise commonly purchase containerboard in the open market.
7
Corrugated products are sold primarily to regional and local accounts, which are broadly diversified across industries and geographic locations. We have a select number of national accounts, or those customers with a national presence. These national customers typically purchase corrugated products from several of our box plants throughout the United States.
Specialty paper is sold to both domestic and export converters who produce multiwall bags for food grade agricultural products, pet food, cement and chemicals, grocery bags and specialty conversion products, such as wrapping paper products, dunnage bags and roll wrap.
Our saturating kraft paper, sold under the trade name Durasorb®, has a customer base split among three geographic regions: the Americas, Europe and Asia. Approximately 86 percent of our Durasorb® sales are exports to customers in Europe, Latin America and Asia where growth opportunities are favorable. KapStone, or its predecessor, has done business with many of these customers for well over 40 years. Some customers have consolidated to form a greater presence in their end-use markets. Customer consolidation is particularly evident in North America and is in the early phase in Europe. In Asia, there are numerous players and it is a highly fragmented market making entry difficult for some companies that do not have a presence in the region. KapStone has acquired a leadership position with our Durasorb® product through knowledge of our markets and understanding the technical needs of our customers' manufacturing processes and the demanding requirements of their products.
Our unbleached folding carton board sold under the Kraftpak® trade name has a customer base consisting primarily of integrated and independent converters in the folding carton industry. Our unbleached folding carton board product is a unique, low-density virgin fiber board. KapStone believes that the best growth opportunities for Kraftpak® are in consumer brands that are changing their images to promote environmental friendliness and sustainability. Kraftpak® and similar products replace the use of coated recycled board, coated natural kraft board and solid bleached sulfate board, which are currently much larger markets.
Victory's customer base includes local, regional and national accounts across a wide range of industries and size and through a variety of means ranging from multi-year supply agreements to transactional sales. Besides offering material-neutral design capabilities and high levels of distribution services, Victory also specializes in fulfillment, kitting and contract packaging services.
Victory has valuable, multi-year, long-term supply agreements with many of its largest customers that set forth the terms and conditions of sale, including product pricing and warranties. Generally, customers are not required to purchase any minimum amount of products under these agreements and can place orders on an individual purchase order basis. However, Victory enters into negotiated supply agreements with certain of our customers, which include commitments to inventory held in Victory's distribution facilities. Victory's working capital needs generally reflect the need to carry significant amounts of inventory in our distribution and fulfillment facilities to meet delivery requirements of our distribution and fulfillment customers, as well as significant accounts receivable balances. As is typical in this industry, our customers often do not pay upon receipt, but are offered terms which are heavily dependent on the specific circumstances of the sale.
No customer accounts for more than 10 percent of consolidated net sales. Our business is not dependent upon a single customer or upon a small number of major customers. We do not believe the loss of any one customer would have a material adverse effect on our business.
Seasonality and Backlog
In our Paper and Packaging segment, demand for our major product lines is relatively constant throughout the year, and seasonal fluctuations in marketing, production, shipments and inventories are not significant. Slight seasonal fluctuations are largely driven by the agricultural market within the western United States. Backlogs are a factor in the industry, as they allow paper mills to run more efficiently. However, most orders are placed for delivery within 30 days.
8
In our Distribution segment, operating results are subject to some seasonal influences that are not material to the consolidated results of the Company. Historically, our highest shipments occur during the second and third quarters, while our lowest shipments occur during the first quarter. Within the Distribution segment, shipments for the first quarter are typically less than shipments for the fourth quarter of the preceding year.
Suppliers and Major Raw Materials Used
Fiber is the single largest cost in the manufacture of containerboard and specialty paper. KapStone consumes both wood fiber and recycled fiber in its paper mills. Our paper mills in North Charleston and Roanoke Rapids use 100 percent virgin fiber. The fiber needs in 2015 of our Longview, Washington mill were supplied by approximately 66 percent of virgin fiber and 34 percent recycled fiber. Fiber used to make containerboard and specialty paper is produced from a combination of locally sourced roundwood and woodchips. We rely on supply agreements and open-market purchases to supply these mills with roundwood and wood chips. Fiber resources are generally available within economic proximity to these mills and we have not experienced any significant difficulty in obtaining our mill fiber needs.
Our mill in Cowpens, South Carolina is a 100 percent recycled mill, whose fiber consumption consists solely of recycled fiber or OCC. We obtain OCC pursuant to certain supply agreements and in open market purchases from suppliers within economic proximity to the Cowpens Mill. OCC has historically exhibited significant price volatility. The Cowpens mill has not experienced any significant difficulty in obtaining OCC.
Our corrugated manufacturing plants consume containerboard produced at our mills or from third parties and through buy/sell arrangements. We also use third-party mills which are closer to our corrugated manufacturing plants to realize freight savings. Containerboard, which includes both linerboard and corrugating medium, is the principal raw material used to manufacture corrugated products. Linerboard is used as the inner and outer facings, or liners, of corrugated products. Corrugating medium is fluted and laminated to linerboard in corrugated plants to produce corrugated sheets. The sheets are subsequently printed, cut, folded and glued to produce corrugated products.
Victory purchases products from a number of suppliers, mainly in the U.S. Victory's suppliers consist of large paper and packaging corporations, regional corrugated and sheet plants and non-corrugated corporations. Upon being acquired by KapStone, Victory increased its purchases from KapStone's corrugated products manufacturing plants. Suppliers are selected based on customer demand for the product and a supplier's total service, cost and product quality offering.
The product sourcing is designed to ensure that Victory is able to offer consistent but varied product selections and market competitive pricing across the enterprise while maintaining the ability to service localized market requirements. Our procurement program is also focused on replenishment, which includes purchase order placement and managing the total cost of inventory by improving the number of days inventory on hand, negotiating favorable payment terms and maintaining vendor-owned and vendor-managed programs. As a large purchaser of packaging material, we can qualify for volume allowances with some suppliers and can realize significant economies of scale. We in turn enter into incentive agreements with certain of our largest customers, which are generally based on sales to these customers.
Energy
Energy at the paper mills is obtained through purchased electricity or through various fuels, which are converted to steam or electricity on-site. Fuel sources include coal, biomass fuel, natural gas, oil, bark, sawdust and by-products of the manufacturing and pulping process, including black liquor. These fuels are burned in boilers to produce steam. Steam turbine generators are used to produce electricity.
9
To reduce our mill energy cost, we have invested in processes and equipment to ensure a high level of purchased fuel flexibility. In recent history, fuel oil has exhibited higher costs per thermal unit and more price volatility than natural gas and coal. During 2015, approximately 60 percent of our North Charleston, South Carolina and Roanoke Rapids, North Carolina mills' purchased fuel needs were from coal, historically our lowest cost purchased fuel. A substantial portion of our Longview mill electricity requirements are satisfied by hydroelectric power, which has relatively stable pricing.
In 2015, we purchased coal under one contract that ended on December 31, 2015. In 2016, the Company has one coal contract for all of its needs with contracted pricing through December 31, 2016.
KapStone's corrugated products manufacturing plants primarily use boilers that produce steam which is used in the product manufacturing process. The majority of these boilers burn natural gas, although some also have the ability to burn fuel oil. Sheet plants use electricity for their main source of power.
Volatile fuel prices have a direct impact on our Distribution segment, as it affects the prices paid by us for products as well as the costs incurred to deliver products to our distribution and fulfillment customers. Victory purchases diesel fuel under contracts tied to market prices for diesel and does not engage in any material forward or hedging fuel contracts.
Competition
The markets in which we sell our products are highly competitive and comprised of many participants. We face significant competitors, including large, vertically integrated companies and numerous smaller companies.
Our principal competitors with respect to sales of our containerboard and specialty paper are a number of large, diversified paper companies, including International Paper Company, Georgia-Pacific (owned by Koch Industries, Inc.), WestRock Company and Packaging Corporation of America, all of which have greater financial resources than we do. We also compete with other regional manufacturers of these products. Our specialty paper products (other than our Durasorb® and Kraftpak® products) are each generally considered a commodity-type product that can be purchased from numerous suppliers and competition is based primarily on price, product specification, service and quality.
Corrugated products businesses seek to differentiate themselves through pricing, quality, service and product design and innovation. We compete for both local and national account business, and we compete against producers of other types of packaging products. On a national level, our primary competitors include International Paper Company, Georgia-Pacific (owned by Koch Industries, Inc.), WestRock Company and Packaging Corporation of America. However, with our strategic focus on local and regional accounts, we also compete with the smaller, independent converters.
The packaging distribution industry is highly competitive, with numerous regional and local competitors, and is a mature industry characterized by slowing growth. Victory's principal competitors include regional and local distributors, national and regional manufacturers and independent brokers. Most of these competitors generally offer a wide range of products at prices comparable to those Victory offers, though at varying service levels. On a national level, our primary competitors include International Paper Company, Georgia-Pacific (owned by Koch Industries, Inc.), WestRock Company, Veritiv and Packaging Corporation of America. However, with our strategic focus on local and regional accounts, we also compete with the smaller, independent distribution companies. Additionally, new competition could arise from non-traditional sources, group purchasing organizations, e-commerce, discount wholesalers or consolidation among competitors. We believe that Victory offers the full range of services required to effectively compete, but if new competitive sources appear it may result in margin erosion or make it more difficult to attract and retain customers.
10
Intellectual Property
The Company owns patents, licenses, trademarks and trade names on products. However, we do not believe that our intellectual property is material to our business and the loss of any or our intellectual property rights would not have a material adverse effect on our operations or financial condition.
Employees
As of December 31, 2015, we had approximately 6,400 employees. Of these, approximately 2,000 employees are salaried and 4,400 are hourly. Approximately 2,400 of our hourly employees are represented by unions. The majority of our unionized employees are represented by the United Steel Workers.
Currently, there is a collective bargaining agreement in effect with respect to approximately 360 employees at the Roanoke Rapids paper mill through August 2016. The Longview union contract, covering approximately 600 employees, expired in June 2014 and the North Charleston contract, covering approximately 540 employees, expired in June 2015. We experienced a 12-day work stoppage at Longview from August 27, 2015 until September 8, 2015 when the union employees returned to work without a contract.
Environmental Matters
Compliance with environmental requirements is a significant factor in our business operations. We commit substantial resources to maintaining environmental compliance and managing environmental risk. We are subject to, and must comply with, a variety of federal, state and local environmental laws, particularly those relating to air and water quality, waste disposal, and cleanup of contaminated soil, groundwater or rivers. The most significant of these laws affecting us are:
- 1.
- Resource
Conservation and Recovery Act;
- 2.
- Clean
Water Act;
- 3.
- Clean
Air Act;
- 4.
- The
Emergency Planning and Community Right-to-Know-Act;
- 5.
- Toxic
Substance Control Act; and
- 6.
- Safe Drinking Water Act.
We believe that we are currently in material compliance with these and all applicable environmental rules and regulations. Because environmental regulations are constantly evolving, we have incurred, and will continue to incur, costs to maintain compliance with these and other environmental laws and regulations. We work diligently to anticipate and budget for the impact of applicable environmental regulations and do not currently expect that future environmental compliance obligations will materially affect our business or financial condition.
We do not believe that any ongoing remedial projects are material in nature.
The Company's subsidiary, Longview is a potentially responsible party under the Comprehensive Environmental Response, Compensation and Liability Act ("CERCLA") with respect to the Lower Duwamish Waterway Superfund Site in the State of Washington (the "Site"). The U.S. Environmental Protection Agency ("EPA") asserts that the Site is contaminated as a result of discharges from various businesses and government entities located along the Lower Duwamish Waterway, including a corrugated converting plant owned and operated by Longview. In November 2014, the EPA issued a Record of Decision ("ROD") for the Site. The ROD includes a selected remedy for the Site. In the
11
ROD, EPA states that the total estimated net present value costs (discounted at 2.3 percent) for the selected remedy are $342 million. Neither the Company nor Longview has received a specific monetary demand regarding its potential liability for the Site. In addition, Longview is a participant in a non-judicial allocation process with respect to the Site. Pursuant to the non-judicial allocation process, Longview and other participating parties will seek to allocate certain costs, including but not limited to, the costs necessary to perform the work under the ROD. The non-judicial allocation process is not scheduled to be completed until 2017. Based upon the information available to the Company at this time, the Company cannot reasonably estimate its potential liability for this Site.
We could also incur environmental liabilities as a result of claims by third parties for civil damages, including liability for personal injury or property damage, arising from releases of hazardous substances or contamination. We are not aware of any material claims of this type currently pending against us.
While legislation regarding the regulation of greenhouse gas emissions has been proposed from time to time at the federal level, it is uncertain whether such legislation will be passed and, if so, what the breadth and scope of such legislation will be. The EPA has begun to propose and / or adopt regulations regulating certain aspects of greenhouse gas emissions. To the extent such regulations become applicable to our operations, they could potentially adversely affect the Company. The result of a broader regulation of greenhouse gas emissions could be an increase in our future environmental compliance costs, through caps, taxes or additional capital expenditures to modify facilities, which may be material. However, climate change legislation and the resulting future energy policy could also provide us with opportunities if the use of renewable energy is encouraged. We currently generate a significant portion of our power requirements for our mills using bark, black liquor and biomass as fuel, which are derived from renewable resources. While we believe we are well-positioned to take advantage of any renewable energy incentives, it is uncertain what the ultimate costs and opportunities of any climate change legislation or regulation will be and how our business and industry will be affected.
In 2004, EPA published the Boiler MACT regulations, establishing air emissions standards and certain other requirements for industrial boilers. These regulations have been subject to a series of legal challenges and have been repurposed and / or amended by EPA several times since the initial rules were published. A final reconsidered regulation was issued in January 2013 but legal challenges have been filed and it remains uncertain as to whether the rule as currently promulgated will be further revised. Based upon the Company's current understandings of the rules, it is unclear what the total cost of compliance will be, if any.
In addition to Boiler MACT and greenhouse gas standards, the EPA has recently finalized a number of other environmental rules, which may impact the pulp and paper industry. The EPA also is revising existing environmental standards and developing several new rules that may apply to the industry in the future. We cannot currently predict with certainty how any future changes in environmental laws and regulations (or their interpretation) and/or enforcement practices will affect our business; however, it is possible that our compliance, capital expenditure requirements and operating costs could increase materially.
Available Information
We make available free of charge our annual report on Form 10-K, quarterly reports on Form 10-Q, current reports on Form 8-K and amendments to those reports filed or furnished as required by Section 13(a) or 15(d) of the Securities Exchange Act of 1934, as amended, through our Internet Website (www.kapstonepaper.com) as soon as is reasonably practicable after we electronically file such material with, or furnish it to, the Securities and Exchange Commission. Information contained in or incorporated into our Internet Website is not incorporated by reference herein.
Financial Information About Segments and Geographic Areas
We operate as two segments with 82 percent of our revenues sold in the United States and 18 percent sold to foreign based customers. See "Segment Information" of Note 2—Summary of Significant Accounting Policies and Note 16—Segment Information contained in the "Notes to Consolidated Financial Statements."
12
Some of the statements in this report and, in particular, statements found in Management's Discussion and Analysis of Financial Condition and Results of Operations, that are not historical in nature are forward-looking statements within the meaning of the Private Securities Litigation Reform Act of 1995. Forward-looking statements include statements about our expectations regarding our future liquidity, earnings, expenditures and financial condition. These statements are often identified by the words "will," "should," "anticipate," "believe," "expect," "intend," "estimate," "hope," or similar expressions. These statements reflect management's current views with respect to future events and are subject to risks and uncertainties. There are important factors that could cause actual results to differ materially from those in forward-looking statements, many of which are beyond our control. These factors, risks and uncertainties include, but are not limited to, the factors described below.
Our actual results, performance, financial condition and liquidity could differ materially from those expressed in, or implied by, these forward-looking statements, and accordingly, we can give no assurances that any of the events anticipated by the forward-looking statements will transpire or occur, or if any of them do so, what impact they will have on our business results of operations, financial condition or liquidity. In view of these uncertainties, investors are cautioned not to place undue reliance on these forward-looking statements. We expressly disclaim any obligation to publicly revise any forward looking statements that have been made to reflect the occurrence of events after the date hereof, except as required by law or regulation.
Risks associated with our business
We are dependent upon key management executives and other key employees, the loss of whom may adversely impact our business.
We depend on the expertise, experience and continued services of corporate, mill and distribution services management, and other key employees. The loss of such management, or an inability to attract or retain other key individuals, could materially adversely affect our business. There can be no assurance that our salaries and incentive compensation plans will allow us to retain the services of these key management executives and key employees or hire new key employees. We compete with other businesses for management and other key employees and invest significant resources in training and motivating them. There is no assurance that we will be able to attract or retain highly qualified employees. The inability to retain or hire qualified personnel at economically reasonable compensation levels would restrict our ability to improve our business and result in lower operating results and profitability.
Our indebtedness may adversely affect our financial health.
As of December 31, 2015, we had approximately $1.6 billion of outstanding debt. As a result of the indebtedness, our ability to obtain additional financing for working capital, capital expenditures, acquisitions or other general corporate purposes may be impaired in the future. The debt could make us vulnerable to economic downturns and may hinder our ability to adjust to rapidly changing market conditions.
A significant portion of our cash flow from operations will be needed to meet the payment of principal and interest on our indebtedness. The business may not generate sufficient cash flow from operations to enable it to repay our indebtedness and to fund other liquidity needs, including capital expenditure requirements, or to pay dividends on our common stock. The indebtedness incurred by us under our senior credit facility (the "Credit Facility") under our Second Amended and Restated Credit Agreement (as amended, the "Credit Agreement")bears interest at variable rates, and therefore if interest rates increase, our debt service requirements would increase. In such case, we may need to refinance or restructure all or a portion of our indebtedness on or before maturity. We may not be able
13
to refinance any of our indebtedness, including the Credit Facility, on commercially reasonable terms, or at all. If we cannot service or refinance our indebtedness, we may have to take actions such as suspending the payment of, or reducing the amount of, dividends, selling assets, seeking additional equity or reducing or delaying capital expenditures, any of which could have a material adverse effect on our operations and financial condition.
Our Credit Facility contains restrictive covenants that limit our liquidity and corporate activities, including our ability to pursue additional acquisitions. Our Credit Facility imposes operating and financial restrictions that limit our ability to:
- •
- incur additional indebtedness;
- •
- create additional liens on our assets;
- •
- make investments;
- •
- engage in mergers or acquisitions;
- •
- pay dividends; and
- •
- sell all or any substantial part of our assets.
In addition, our Credit Facility also imposes other restrictions on us. Therefore, we would need to seek permission from the lenders in order to engage in certain corporate actions. The lenders' interests may be different from ours, and no assurance can be given that we will be able to obtain the lenders' permission when needed. This may prevent us from taking actions that are in our best interest.
Our Credit Facility requires us to maintain certain financial ratios. The failure to maintain the specified ratios could result in an event of default if not cured or waived.
In the event of a default under our Credit Agreement, the lenders generally would be able to declare all outstanding indebtedness, together with accrued interest, to be due and payable. In addition, borrowings under the Credit Facility are secured by a first priority lien on substantially all of our assets (other than real estate) and, in the event of a default under that facility, the lenders generally would be entitled to seize the collateral. A default under any debt instrument, unless cured or waived, would likely have a material adverse effect on our business, liquidity and financial condition.
If we fail to extend or renegotiate the collective bargaining agreements as they expire from time to time, or if our unionized employees were to engage in a strike or other work stoppage, our business, operating results and financial condition could be materially harmed.
Most of our hourly paid employees are represented by trade unions. From time to time, we may be party to collective bargaining contracts which apply to approximately 900 employees at various corrugating manufacturing plants, 600 employees at the Longview mill, 540 employees at the North Charleston mill and 360 employees at the Roanoke Rapids mill. No assurance can be given that we will be able to successfully extend or renegotiate the collective bargaining agreements as they expire from time to time. Currently, there is a collective bargaining agreement in effect with respect to Roanoke Rapids through August 2016. The Longview union contract expired in June 2014 and the North Charleston contract expired in June 2015. We experienced a 12-day work stoppage at Longview from August 27, 2015 until September 8, 2015 when the union employees returned to work without a contract.
If we are unable to extend or negotiate new agreements without work stoppages, it could negatively impact our ability to manufacture our products and adversely affect our business results of operations and financial condition. In addition, we can give no assurances that the Longview work stoppage in 2015 is any indication of the duration and impact on our business or results of operations of any future work stoppage. Furthermore, if a significant number of our remaining employees were to
14
unionize, including in the wake of any future legislation or administrative regulation that makes it easier for employees to unionize, our business, results of operations and financial condition could be adversely affected. Any inability to negotiate acceptable new contracts under these collective bargaining arrangements could cause strikes or other work stoppages, and new contracts could result in increased operating costs. If any such strikes or other work stoppages occur, or if additional employees become represented by a union, a disruption of our operations and higher labor costs could result. Labor relations matters affecting our suppliers of products and services could also adversely affect our business from time to time.
We sell some of our products internationally, and, accordingly, our business, results of operations, cash flows and financial condition could be adversely affected by the political and economic conditions of the countries in which we conduct business, by fluctuations in exchange rates and other factors related to our international operations.
Approximately 18 percent of our revenues in 2015 and 2014 were derived from foreign and export sales. Our international operations and activities face increasing exposure to the risks of selling to customers in foreign countries. These factors include:
- •
- Changes in foreign currency exchange rates or controls which could adversely affect selling prices for our products and therefore our
competitive position in a particular market.
- •
- Trade protection measures in favor of local producers of competing products, including government subsidies, tax benefits, trade
actions (such as anti-dumping proceedings) and other measures giving local producers a competitive advantage over us.
- •
- Changes generally in political, regulatory, social or economic conditions in the countries in which we sell our products.
A stronger U.S. dollar adversely affects our pricing with respect to exports, increases foreign imports of containerboard at relatively lower prices, impacts our U.S. sales, and adversely affects our business and results of operations. These risks could affect the cost of selling our products, our pricing, sales volume and ultimately our financial performance. The likelihood of such occurrences and their potential effect on the Company vary from country to country and are unpredictable.
We may be required to record a charge to our earnings if our goodwill becomes impaired.
We test for impairment of goodwill annually in accordance with generally accepted accounting standards. When events or changes in circumstances indicate that the carrying value for such assets may not be recoverable, we review goodwill for impairment on an interim basis. Factors that may be considered a change in circumstances requiring our interim testing include a decline in stock price as compared to our book value per share, future cash flows and slower growth rates. In connection with future annual or interim tests, we may be required to record a non-cash charge to earnings during the period in which any impairment of goodwill is determined, which would adversely impact our results of operations.
See Note 2. "Significant Accounting Policies—Goodwill and Intangible Assets" in the Notes to the Consolidated Financial Statements for additional information related to testing for impairment of goodwill.
We may incur business disruptions.
We take measures to minimize the risks of disruptions at our manufacturing facilities. However, the occurrence of a natural disaster, such as a hurricane, tropical storm, earthquake, tornado, flood, fire or other unanticipated problems, such as labor difficulties (including work stoppages or strikes), equipment failure or unscheduled maintenance, could cause operational disruptions and could
15
materially adversely affect our earnings and cash flows. Any losses due to these events may not be covered by our existing insurance policies or may be subject to certain deductibles.
Our operations are dependent upon certain supply agreements for fiber.
We rely on certain supply arrangements to provide us roundwood and woodchips. If one of these suppliers failed to deliver quality roundwood or woodchips in the quantities we require, KapStone's supply may not be adequate to cover customer needs, which could have an adverse effect on our results of operations, cash flows and financial condition.
We rely on key customers and a loss of one or more of our key customers could adversely affect our business, results of operations, cash flows and financial condition.
During the year ended December 31, 2015, no customer accounted for more than 10 percent of consolidated net sales. However, losses of key customers in either of our segments could significantly impact our business, results of operations, cash flows and financial condition.
Our business depends on effective information management systems.
We rely on our enterprise resource planning systems to support such critical business operations as processing sales orders and invoicing, inventory control, purchasing and supply chain management, payroll and human resources and financial reporting. We periodically implement upgrades to such systems or migrate one or more of our affiliates, facilities or operations, including acquired businesses and assets, from one system to another. If we are unable to adequately maintain such systems to support our developing business requirements or effectively manage any upgrade or migration, we could encounter difficulties that could have a material adverse impact on our business, internal controls over financial reporting, financial results or our ability to timely and accurately report such results.
We are subject to cyber-security risks related to certain customer, employee, vendor or other company data.
We use information technologies to securely manage operations and various business functions. We rely upon various technologies to process, store and report on our business and interact with customers, vendors and employees. Despite our security design and controls, and those of our third-party providers, we could become subject to cyber attacks which could result in operational disruptions or the misappropriation of sensitive data. Our ability to plan our operations, source materials, manufacture and ship product, account for orders and interface generally with our customers and vendors could be denied or misused. Likewise, our internal financial reporting system could be compromised. In addition, theft of intellectual property, trade secrets of confidential information about us or our employees, vendors or customers could result from a cyber incident. There can be no assurance that any such disruptions or misappropriations and the resulting repercussions would not be material to our results of operations, financial condition or cash flows.
Environmental regulations and potential environmental liabilities could materially adversely affect our results of operations and financial condition and require us to make unexpected capital expenditures.
We are subject to environmental regulation by federal, state and local authorities in the United States and by authorities in Mexico with respect to our Distribution segment operations located in Northern Mexico, including requirements that regulate discharge into the environment, waste management, hazardous substance reporting, remediation of environmental contamination, forestry operations and endangered species habitats. We cannot predict the impact of future environmental laws and regulations (or changes in interpretations of existing or environmental laws and regulations), particularly in the areas of emissions, climate control initiatives or enforcement practices, will have on our operations and capital expenditure requirements. Environmental liabilities or new or changed compliance obligations could result in civil or criminal fines or penalties, enforcement actions, or other
16
additional significant costs, which could adversely impact our results of operations, cash flows and financial condition.
Due to past history of industrial operations at the Roanoke Rapids mill, North Charleston mill, Longview mill and some of our corrugating manufacturing plants, the possibility of on-site and off-site environmental impact to the soil and groundwater may present a heightened risk of contamination. If we are required to make significant expenditures for remediation, the costs of such efforts may have a significant negative impact on our results of operations, cash flows and financial condition.
Risks related to compliance with U.S. and international laws, rules and regulations could adversely impact our business and results of operations.
Our operations are subject to U.S. and international laws, rules and regulations, including those concerning transportation and safety, the import and export of goods, customs regulations, payments to government officials, bribery, fraud, anti-kickback and false claims rules, competition, money laundering, and data privacy laws. While we strive to maintain high standards, we cannot provide assurance that our internal controls and compliance systems will always protect us from acts committed by our employees, agents, or business partners that would violate such laws, rules or regulations. We could incur substantial costs in order to comply with such laws, rules and regulations, or incur substantial fines or sanctions, enforcement actions (including orders limiting our operations or requiring corrective measures), and third-party claims for property damage and personal injury as a result of violations of, or liabilities under, laws, regulations, codes and common law.
Our pension costs are subject to a variety of factors and assumptions that could cause these costs to change.
We have a defined benefit pension plan that covers 54 percent of our U.S. employees. Our pension costs are dependent upon a variety of factors and assumptions based upon past experience. Fluctuations in market returns, interest rates, mortality rates, the number of retirees and longer life-expectancy may result in increased pension costs. Similarly, changes in assumptions regarding current discount rates and expected rates of return on plan assets could also change pension costs. Material adverse changes in these factors could have a negative impact on our results of operations, cash flows, and financial condition.
We may not be able to fully compensate for increases in fuel costs.
Volatile fuel prices have a direct impact on our business. The cost of fuel affects the price paid by us for products and raw materials as well as the costs incurred to produce and deliver products to our customers. Although we have been able to pass along a portion of increased fuel costs to our customers in the past, there is no guarantee that we can continue to do so, which may have a negative impact on our business and our profitability.
Risks Associated with KapStone's Common Stock
The market price for our common stock may be highly volatile.
The market price of our common stock may be volatile due to certain factors, including, but not limited to: quarterly fluctuations in our financial and operating results; general conditions in the paper and packaging industries; or changes in earnings estimates.
Our named executive officers and directors control a substantial percentage, approximately 11 percent, of our common stock and thus may influence certain actions requiring a stockholder vote.
At December 31, 2015, our named executive officers and directors owned 10.9 million shares of our common stock, or approximately 11 percent of our total outstanding common stock. Accordingly, our named executive officers and directors may have some influence over the outcome of all matters
17
requiring approval by our stockholders, including future acquisitions and the election of directors. In addition, our board of directors is divided into three classes, each of which will generally serve for a term of three years with only one class of directors being elected in each year. At the annual meeting, as a consequence of our "staggered" board of directors, only a minority of the board of directors will be considered for election and our officers and directors, because of their ownership position, will have some influence regarding the outcome of the election.
Risks associated with the paper, packaging, forest products and related industries
The paper, packaging, forest products and related industries are highly cyclical. Fluctuations in the prices of and the demand for products could result in smaller profit margins and lower sales volumes.
Historically, economic and market shifts, fluctuations in capacity and changes in foreign currency exchange rates have created cyclical changes in prices, sales volume and margins for products in the paper, packaging, forest products and related industries. The length and magnitude of industry cycles have varied over time and by product, but generally reflect changes in macroeconomic conditions and levels of industry capacity. Most paper products and many wood products used in the packaging industry are commodities that are widely available from many producers. Because commodity products have few distinguishing qualities from producer to producer, competition for these products is based primarily on price, which is determined by supply relative to demand. The overall levels of demand for these commodity products reflect fluctuations in levels of end-user demand, which depend in large part on general macroeconomic conditions in North America and regional economic conditions in our markets (including Europe, Asia, and Central and South America), as well as foreign currency exchange rates. The foregoing factors could materially and adversely impact our sales, cash flows, profitability and results of operations.
An increase in the cost or a reduction in the availability of wood fiber, other raw materials, energy and transportation may have an adverse effect on our profitability and results of operations.
Wood fiber including OCC is the principal raw material in many parts of the paper and packaging industry. Wood fiber is a commodity, and prices historically have been cyclical and have varied on a regional basis. Environmental litigation and regulatory developments have caused, and may cause in the future, significant reductions in the amount of timber available for commercial harvest in the United States. In addition, future domestic or foreign legislation and litigation concerning the use of timberlands, the protection of endangered species, the promotion of forest health and the response to and prevention of catastrophic wildfires could also affect timber supplies. Availability of harvested timber may further be limited by fire, insect infestation, disease, ice storms, wind storms, flooding and other causes, thereby reducing supply and increasing prices. Increasing demand for products packaged in containers with greater (or 100 percent) recycled paper content have and may continue to increase the demand for OCC. In addition, demand for OCC, especially from China, could result in shortages or spikes in the cost of OCC.
Industry supply of commodity paper and wood products is also subject to fluctuation, as changing industry conditions can influence producers to idle or permanently close individual machines or entire mills. In addition, to avoid substantial cash costs in connection with idling or closing a mill, some producers will choose to continue to operate at a loss, sometimes even a cash loss, which could prolong weak pricing environments due to oversupply. Oversupply in these markets can also result from producers introducing new capacity in response to favorable short-term pricing trends. Industry supply of commodity papers and wood products is also influenced by overseas production capacity, which has grown in recent years and is expected to continue to grow. Wood fiber pricing is subject to regional market influences, and the cost of wood fiber may increase in particular regions due to market shifts in those regions. In addition, the ability to obtain wood fiber from foreign countries may be impacted by economic, legal and political conditions in those countries as well as transportation difficulties.
18
Energy is a significant input cost for the paper and packaging industry. Increases in energy prices can be expected to adversely impact businesses. Energy prices, particularly for electricity, coal and fuel oil, have been volatile in recent years and currently coal and electricity prices exceed historical averages. These fluctuations have historically impacted manufacturing costs of companies in the industry, often contributing to reduced margins and increased earnings volatility. Current or future environmental laws, rules and regulations (or their interpretation or changes in their interpretation) that adversely and materially impact electric utilities, including those restricting or limiting "greenhouse gas" emissions, are likely to result in increased electric costs and could adversely effect our results of operations, profitability and financial condition. We could be materially adversely impacted by energy supply disruptions or the inability to pass on cost increases to our customers.
Disruptions in transportation could adversely affect our supply or raw materials and/or our ability to distribute our products and could have an adverse effect on our results, profitability and liquidity.
Since we distribute our products by truck, rail, and ship, the reduced availability of those modes of transportation could limit our ability to promptly deliver products to our customers. Reduced availability of transportation could also affect our ability to receive adequate supplies of raw materials in a timely manner. In addition, the increased costs of transportation may reduce our profitability if we are not able to recover those costs through price increases for our products.
Our business in the past has been and in the future could be adversely affected by strikes and labor renegotiations affecting seaports, labor disputes between railroads or trucking companies and their union employees, or by a work stoppage at one or more seaports, railroads or local trucking companies servicing the areas in which we operate or with whom we do business. The impact of any transportation disruption on our business and operations is unpredictable and will be affected by, among other things, the duration of the disruption, alternative modes of transportation available to us, if any, and the additional costs associated with any alternative transportation method, which costs we may not be able to pass on to our customers.
Certain paper and wood products are vulnerable to long-term declines in demand due to competing technologies or materials.
Companies in the paper and packaging industry are subject to possible declines in demand for their products as the use of alternative materials and technologies grows and the prices of such alternatives become more competitive. Any substantial shift in demand from wood and paper products to competing technologies or materials could result in a material decrease in sales of our products and could adversely affect our results of operations, cash flows and financial condition. We cannot ensure that any efforts we might undertake to adapt our product offerings to such changes would be successful or not adversely impact our business, results of operations or financial condition.
Paper and packaging companies are subject to significant environmental regulation and environmental compliance expenditures, as well as other potential environmental liabilities.
Companies in the paper and packaging industry are subject to a wide range of general and industry specific environmental laws and regulations, particularly with respect to air emissions, wastewater discharges, solid and hazardous waste management, hazardous substance reporting, hazardous substance release notification, site remediation, forestry operations and endangered species habitats. We may incur substantial expenditures to maintain compliance with applicable environmental laws and regulations (or new interpretations thereof), which could adversely affect our results of operations. Failure to comply with applicable environmental laws and regulations could expose us to civil or criminal fines or penalties or enforcement actions, including orders limiting operations or requiring corrective measures, installation of pollution control equipment or other remedial actions.
19
Risks Associated with Acquisitions
The anticipated benefits of the Victory Packaging acquisition may not be realized.
We expected that the Victory acquisition would result in various benefits including, among others, enhanced revenues and cash flows, an additional distribution channel for the Company's converting facilities and corrugated box products and increased mill vertical integration. In addition, we expect the acquisition of Victory to allow the Company to allocate more containerboard production to converting operations and reduce exposure to the relatively lower price export sales of linerboard, expand and optimize our linerboard and medium production capabilities, strengthen the Company's design and packaging capabilities, enhance our logistics and vendor managed inventory experience and expand our converting and corrugated box presence nationally. The acquisition presents challenges to management, including the integration of operations, information systems, properties and personnel of Victory and our existing operations. Achieving the anticipated benefits of the acquisition is subject to a number of uncertainties, including, but not limited to, whether we can retain the Victory management team and integrate our business and the Victory business in an efficient and effective manner. Failure to achieve these anticipated benefits could result in increased costs, decreases in the amount of expected revenues and diversion of management's time and energy and could materially and adversely impact our business, financial condition and operating results.
Future acquisitions of businesses by us would subject us to additional business, operating and industry risks, the impact of which cannot presently be evaluated, and could adversely impact our capital structure.
We have completed several relatively large acquisitions in recent years and may pursue other acquisition opportunities in an effort to diversify our investments and/or grow our business. There can be no assurances that we will successfully be able to identify suitable acquisition candidates, complete and finance acquisitions, integrate acquired businesses or operations into our existing businesses and operations, realize the anticipated synergies and business opportunities or expand into new markets or products. Any business acquired by us may cause us to be affected by numerous risks inherent in the acquired business' operations. Any future acquisition may not achieve the same levels of profitability or revenues as our existing businesses or perform as expected and could require us to make unexpected capital contributions, expose us to additional liabilities or require a disproportionate amount of management time and attention. If we acquire a business in an industry characterized by a high level of risk, we may be adversely affected by the currently unascertainable risks of that industry. We cannot ensure that we would be able to properly ascertain or assess all of the significant risk factors with any such acquisitions.
In addition, the financing of any acquisition completed by us could adversely impact our capital structure as any such financing would likely include and/or the issuance of additional equity securities and/or the borrowing of additional funds. The issuance of additional equity securities may significantly dilute our stockholders and/or adversely affect prevailing market prices for our common stock. Increasing our indebtedness could increase the risk of a default that would entitle the holder to declare all of such indebtedness due and payable and/or to seize any collateral securing the indebtedness. In addition, default under one debt instrument could in turn permit lenders under other debt instruments to declare borrowings outstanding under those other instruments to be due and payable pursuant to cross default clauses. Accordingly, the financing of future acquisitions could adversely impact our capital structure and the value of your equity interest in us.
Except as required by law or the rules of any securities exchange on which our securities might be listed at the time we seek to consummate a subsequent acquisition, stockholders will not be asked to vote on any such proposed acquisition.
Item 1B. Unresolved Staff Comments
None.
20
The table below provides a summary of our paper mills, the principal products produced and each mill's annual practical maximum capacity based upon all of our paper machines' production capabilities, as reported to the AF&PA:
Location
|
Products | Capacity (tons) | ||||
|---|---|---|---|---|---|---|
Longview, WA |
Containerboard / Specialty Paper | 1,300,000 | ||||
North Charleston, SC |
Containerboard / Specialty Paper | 975,000 | ||||
Roanoke Rapids, NC |
Containerboard / Specialty Paper | 460,000 | ||||
Cowpens, SC |
Recycled containerboard | 255,000 | ||||
| | | | | | | |
Total |
2,990,000 | |||||
As of December 31, 2015, our corrugated products manufacturing plants included:
Corrugated Products Manufacturing Plants
|
Approx. Sq. Ft. |
Property Leased(1)/ Owned |
|||
|---|---|---|---|---|---|
Full-Line Box Plants |
|||||
Amsterdam, NY |
227,000 | Leased | |||
Aurora, IL |
323,000 | Leased | |||
Bowling Green, KY |
306,000 | Leased | |||
Cedar Rapids, IA |
386,000 | Leased | |||
College Park, GA |
183,000 | Owned | |||
Longview, WA |
241,000 | Owned | |||
Mesquite, TX |
275,000 | Leased | |||
Minneapolis, MN |
275,000 | Leased | |||
Oakland, CA |
216,000 | Owned | |||
Seattle, WA |
132,000 | Owned | |||
Spanish Fork, UT |
519,000 | Owned | |||
Twin Falls, ID |
446,000 | Owned | |||
Yakima,WA |
420,000 | Owned | |||
Sheet Plants |
|||||
Atlanta, GA |
113,000 | Leased | |||
Cedar City, UT |
143,000 | Owned | |||
Grand Forks, ND |
85,000 | Leased | |||
Seward, NE |
85,000 | Leased | |||
Somerset, KY |
87,000 | Leased | |||
Springfield, MA |
235,000 | Owned | |||
Sheet Feeders |
|||||
Atlanta, GA |
133,000 | Leased | |||
Fort Worth, TX |
100,000 | Owned | |||
- (1)
- Of the leased property 1.4 million square feet expire in 2032. The equipment in the leased facilities is, in virtually all cases, owned by KapStone, except for forklifts, trailers and other rolling stock which are leased.
As of December 31, 2015, our Distribution segment had a network of more than 60 distribution centers all of which were leased. Our leased locations comprise approximately 6.0 million square feet located in the U.S. and approximately 1.2 million square feet located in Mexico. These facilities are strategically located throughout the U.S., Canada and Mexico in order to efficiently serve our customer base and the surrounding areas while also facilitating expedited delivery services for special orders. We
21
continually evaluate location, size and attributes to maximize efficiency, deliver top quality customer service and achieve economies of scale.
We currently lease space for our corporate headquarters in Northbrook, Illinois. The lease for this facility expires in 2020.
We currently believe that our owned and leased space for facilities and properties are sufficient to meet our operating requirements for the foreseeable future.
We are from time to time subject to various administrative and legal investigations, claims and proceedings incidental to our business, including environmental and safety matters, labor and employments matters, personal injury claims, contractual, commercial and other disputes and taxes. We establish reserves for claims and proceedings when it is probable that liabilities exist and where reasonable estimates can be made. We also maintain insurance that may limit our financial exposure for defense costs, as well as liability, if any, for claims covered by the insurance (subject also to deductibles and self-insurance amounts). While any investigation, claim or proceeding has an element of uncertainty, and we cannot predict or assure the outcome of any claim or proceeding involving the Company, we believe the outcome of any pending or threatened claim or proceeding (other than those that cannot be assessed due to their preliminary nature), or all of them combined, will not have a material adverse effect on our results of operations, cash flows or financial condition.
Item 4. Mine Safety Disclosure
Not applicable.
Item 5. Market for Registrant's Common Equity, Related Stockholder Matters and Issuer Purchases of Equity Securities
Our common stock, par value $0.0001 per share, trades on the New York Stock Exchange ("NYSE") under the symbol "KS". As of December 31, 2015, there were 11 shareholders of record of our common stock. The number of shareholders of record includes one single shareholder, Cede & Co., for all of the shares held by our shareholders in individual brokerage accounts maintained at banks, brokers and institutions.
The following table sets forth the high and low sales price information for the Company's common stock from January 1, 2014 through December 31, 2015, as reported by the NYSE and the cash dividends declared per common share during the last two years.
| |
2015 | |
2014 | |
|||||||||||||||
|---|---|---|---|---|---|---|---|---|---|---|---|---|---|---|---|---|---|---|---|
| |
Dividends Declared |
Dividends Declared |
|||||||||||||||||
Quarter Ended
|
Low | High | Low | High | |||||||||||||||
March 31 |
$ | 28.82 | $ | 35.43 | $ | 0.10 | $ | 26.71 | $ | 32.59 | $ | — | |||||||
June 30 |
$ | 23.12 | $ | 32.16 | $ | 0.10 | $ | 24.74 | $ | 33.34 | $ | — | |||||||
September 30 |
$ | 16.34 | $ | 25.00 | $ | 0.10 | $ | 28.13 | $ | 33.35 | $ | — | |||||||
December 31 |
$ | 17.00 | $ | 24.76 | $ | 0.10 | $ | 24.46 | $ | 31.56 | $ | 0.10 | |||||||
At December 31, 2015, the closing share price on the NYSE was $22.59.
The timing and amount of future dividends are subject to the determination of the Company's board of directors.
22
Stock Performance Graph
The performance graph shall not be deemed to be "soliciting material" or to be "filed" with the commission or subject to Regulation 14A or 14C, or to the liabilities of Section 18 of the Securities Exchange Act of 1934 as amended.
The following graph compares a $100 investment in our common stock on December 31, 2010 with a $100 investment in each of the S&P 500 and the S&P Paper and Packaging Index (the Company's peer group) also made on December 31, 2010. The graph portrays total return, 2010-2015, assuming reinvestment of dividends.
Comparison of 5 Year Cumulative Total Return
Assumes Initial Investment of $100
December 2015
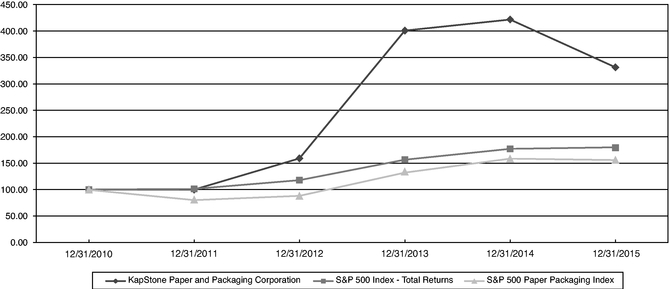
23
Item 6. Selected Financial Data
The following table sets forth KapStone's selected financial information derived from its audited consolidated financial statements as of, and for the years ended, December 31, 2015, 2014, 2013, 2012 and 2011.
The selected financial data presented below summarizes certain financial data which has been derived from and should be read in conjunction with Item 7. "Management's Discussion and Analysis of Financial Condition and Results of Operations" and KapStone's audited consolidated financial statements included in Item 8.
| |
Years Ended December 31, | |||||||||||||||
|---|---|---|---|---|---|---|---|---|---|---|---|---|---|---|---|---|
| In thousands, except per share amounts |
2015(1) | 2014 | 2013(1) | 2012 | 2011(1) | |||||||||||
Statement of Income Data: |
||||||||||||||||
Net sales |
$ | 2,789,345 | $ | 2,300,920 | $ | 1,748,162 | $ | 1,216,637 | $ | 906,119 | ||||||
Operating income |
$ | 199,167 | $ | 299,931 | $ | 219,888 | $ | 109,560 | $ | 106,741 | ||||||
Net income(2) |
$ | 106,386 | $ | 171,915 | $ | 127,338 | $ | 62,505 | $ | 123,981 | ||||||
Basic net income per share(3) |
$ | 1.11 | $ | 1.79 | $ | 1.34 | $ | 0.67 | $ | 1.34 | ||||||
Diluted net income per share(3) |
$ | 1.09 | $ | 1.76 | $ | 1.32 | $ | 0.65 | $ | 1.31 | ||||||
Cash dividends declared per common share(4) |
$ | 0.40 | $ | 0.10 | $ | — | $ | 1.00 | $ | — | ||||||
Balance Sheet Data: |
||||||||||||||||
Cash and cash equivalents |
$ | 6,821 | $ | 28,467 | $ | 12,967 | $ | 16,488 | $ | 8,062 | ||||||
Total assets |
$ | 3,222,110 | $ | 2,556,274 | $ | 2,651,862 | $ | 1,135,860 | $ | 1,130,147 | ||||||
Long-term liabilities |
$ | 2,026,775 | $ | 1,501,328 | $ | 1,715,504 | $ | 414,628 | $ | 442,269 | ||||||
Total stockholders' equity |
$ | 845,280 | $ | 778,127 | $ | 666,080 | $ | 517,948 | $ | 546,278 | ||||||
- (1)
- Results
for 2015 reflect the Victory acquisition on June 1, 2015. Results for 2013 and later reflect the Longview acquisition on July 18,
2013. Results for 2011 and later reflect the USC acquisition on October 31, 2011.
- (2)
- 2013
and 2011 net income includes a $5.0 million and $63.0 million benefit, respectively, from the reversal of the tax reserves for
alternative fuel mixture credits.
- (3)
- Earnings
per share for all periods have been restated for the stock split declared in December 2013.
- (4)
- In 2015 and December 2014, the Company declared a regular quarterly dividend. In December 2012, the Company declared and paid a special cash dividend.
See Note 3 and Note 4 in the Notes to Consolidated Financial Statements for a discussion of the Victory and Longview acquisitions, respectively.
24
Item 7. Management's Discussion and Analysis of Financial Condition and Results of Operations
Overview
KapStone is the fifth largest producer of containerboard and the largest producer of kraft paper in North America, based on production capacity. We operate four containerboard mills and 22 corrugated products manufacturing plants. Our paper mills produce a combination of containerboard, which we ship to our corrugated products manufacturing plants and to third party converters, as well as specialty papers consisting of kraft paper, saturating kraft paper sold under the trade name Durasorb and uncoated paper stock board sold under the trade name Kraftpak. Our corrugated products manufacturing plants produce a wide variety of corrugated packaging products, including conventional shipping containers used to protect and transport manufactured goods and multi-color boxes and displays with strong visual appeal that help to merchandise the packaged product in retail locations. In addition, we produce packaging for fresh fruit and vegetables, processed food, beverages, and other industrial and consumer products. In addition, with the June 2015 acquisition of Victory, based in Houston, Texas, we operate a network of 60 distribution centers across the United States, Mexico and Canada which distribute packaging materials to a wide variety of customers and industry segments. Substantially all of our operations are located in the United States but we ship approximately 20 percent of containerboard and specialty products to customers in Europe, Asia and Latin America.
Executive Summary
In 2015, consolidated net sales grew 21 percent to a record $2.8 billion. We reported $106.4 million of net income, or $1.09 per diluted share in 2015, compared with $171.9 million, or $1.76 per share in 2014. In June 2015, we acquired Victory which contributed $582.9 million of revenues and $20.7 million of operating income for the seven months under KapStone ownership.
Compared to 2014, our consolidated earnings were negatively impacted by lower containerboard and extensible kraft paper prices, a less favorable product mix, a stronger US dollar which depressed results of our sales to many of our European customers who are billed in euros, lower sales volume, the impact of a 12 day strike at our Longview, Washington paper mill and inflation on compensation and benefits as well as fiber. The Victory acquisition was accretive to our earnings as well as the synergies generated from the integration of approximately 25,000 tons of its packaging products into the KapStone mill and plant system. For 2016, the Company expects the number of tons to be shipped to Victory to approximate 90,000 tons growing to at least 115,000 tons in 2017.
In 2015, our four paper mills produced a total of 2.7 million tons of containerboard and specialty products which was down 36,000 tons from 2014 which was a record year. A 12 day strike at our Longview mill reduced production by 29,000 tons.
In 2015, due to strong cash flow from operations we made debt prepayments of $103.5 million compared to $325.0 million in 2014. In addition, capital spending in 2015 totaled $126.8 million compared to $137.2 million in 2014. Key capital projects completed in 2015 consisted of a major upgrade to paper machines in Charleston and Longview, the installation of a new corrugator at the Aurora Illinois corrugated products manufacturing plant and other upgrades to our manufacturing plants to support volume growth. In 2015, we completed information systems projects to more fully integrate our Longview operations with KapStone. The Company expects capital spending in 2016 to approximate $115.0 million.
In late 2014, the Company's board of directors approved the initiation of a $0.10 per share common stock dividend. Accordingly in 2015 the Company paid approximately $38.7 million of dividends to shareholders.
In January 2016, Pulp and Paper Week announced price index reductions for containerboard of $15 to $20 per ton. The Company estimates that these reductions will have an annualized impact on
25
revenues and operating income of $20.0 to $26.0 million. In response to this, in February 2016, the Company announced plans to curtail certain employee benefits.
Results of Operations for the Years Ended December 31, 2015, 2014 and 2013
The following table compares results of operations for the years ended December 31, 2015 and 2014:
| |
Years Ended December 31, | |
% of Net Sales | |||||||||||||
|---|---|---|---|---|---|---|---|---|---|---|---|---|---|---|---|---|
| |
Increase/ (Decrease) |
|||||||||||||||
| |
2015 | 2014 | 2015 | 2014 | ||||||||||||
Paper and packaging |
$ | 2,228,676 | $ | 2,300,920 | $ | (72,244 | ) | 79.9 | % | 100.0 | % | |||||
Distribution |
582,949 | — | 582,949 | 20.9 | % | — | ||||||||||
Intersegment Eliminations |
(22,280 | ) | — | (22,280 | ) | (0.8 | )% | — | ||||||||
| | | | | | | | | | | | | | | | | |
Net sales |
$ | 2,789,345 | $ | 2,300,920 | $ | 488,425 | 100.0 | % | 100.0 | % | ||||||
| | | | | | | | | | | | | | | | | |
Paper and packaging |
224,012 | 334,753 | (110,741 | ) | 8.0 | % | 14.5 | % | ||||||||
Distribution |
20,719 | — | 20,719 | 0.7 | % | 0.0 | % | |||||||||
Corporate |
(45,564 | ) | (34,822 | ) | (10,742 | ) | (1.6 | )% | (1.5 | )% | ||||||
| | | | | | | | | | | | | | | | | |
Operating income |
$ | 199,167 | $ | 299,931 | $ | (100,764 | ) | 7.1 | % | 13.0 | % | |||||
| | | | | | | | | | | | | | | | | |
Foreign exchange loss |
2,556 | 1,222 | 1,334 | 0.1 | % | 0.1 | % | |||||||||
Loss on debt extinguishment |
1,218 | 5,617 | (4,399 | ) | 0.0 | % | 0.2 | % | ||||||||
Interest expense, net |
33,759 | 32,491 | 1,268 | 1.2 | % | 1.4 | % | |||||||||
| | | | | | | | | | | | | | | | | |
Income before taxes |
161,634 | 260,601 | (98,967 | ) | 5.8 | % | 11.3 | % | ||||||||
Provision for income taxes |
55,248 | 88,686 | (33,438 | ) | 2.0 | % | 3.9 | % | ||||||||
| | | | | | | | | | | | | | | | | |
Net income |
$ | 106,386 | $ | 171,915 | $ | (65,529 | ) | 3.8 | % | 7.5 | % | |||||
| | | | | | | | | | | | | | | | | |
| | | | | | | | | | | | | | | | | |
| | | | | | | | | | | | | | | | | |
Consolidated net sales for the year ended December 31, 2015 were $2,789.3 million compared to $2,300.9 million for the year ended December 31, 2014, an increase of $488.4 million, or 21.2 percent. The increase in net sales was primarily driven by the Victory acquisition on June 1, 2015, which accounted for $582.9 million of net sales.
Paper and Packaging segment net sales of $2,228.7 million decreased by $72.4 million from the prior year due to $47.4 million of lower volume, primarily due to the Longview mill work stoppage in the third quarter and internalizing more of the Company's corrugated products manufacturing plants demand, $26.9 million of lower prices and a less favorable product mix, $10.8 million due to a stronger U.S. dollar compared to the Euro and $9.4 million due to lower other sales. Average mill selling price per ton for 2015 was $667 compared to $684 for 2014, reflecting a stronger U.S. dollar compared to the Euro, lower containerboard domestic and export prices and a less favorable product mix, partially offset by higher domestic kraft paper prices.
Paper and Packaging segment sales to external customers by product line were as follows:
| |
Years Ended December 31, | ||||||||||||||||||||||||
|---|---|---|---|---|---|---|---|---|---|---|---|---|---|---|---|---|---|---|---|---|---|---|---|---|---|
| |
Net Sales (in thousands) | |
|
Tons Sold | |
|
|||||||||||||||||||
| |
Increase/ (Decrease) |
|
Increase/ (Decrease) |
|
|||||||||||||||||||||
Product Line Revenue:
|
2015 | 2014 | % | 2015 | 2014 | % | |||||||||||||||||||
Containerboard / Corrugated products |
$ | 1,421,802 | $ | 1,463,670 | $ | (41,868 | ) | (2.9 | )% | 1,714,476 | 1,764,628 | (50,152 | ) | (2.8 | )% | ||||||||||
Specialty paper |
720,588 | 741,601 | (21,013 | ) | (2.8 | )% | 1,017,905 | 1,031,024 | (13,119 | ) | (1.3 | )% | |||||||||||||
Other |
86,286 | 95,649 | (9,363 | ) | (9.8 | )% | — | — | — | — | |||||||||||||||
| | | | | | | | | | | | | | | | | | | | | | | | | | |
Product sold |
$ | 2,228,676 | $ | 2,300,920 | $ | (72,244 | ) | (3.1 | )% | 2,732,381 | 2,795,652 | (63,271 | ) | (2.3 | )% | ||||||||||
| | | | | | | | | | | | | | | | | | | | | | | | | | |
| | | | | | | | | | | | | | | | | | | | | | | | | | |
| | | | | | | | | | | | | | | | | | | | | | | | | | |
26
Tons of product sold in 2015 was 2,732,381 tons compared to 2,795,652 tons in 2014, a decrease of 63,271 tons, or 2.3 percent as follows:
- •
- Containerboard sales decreased by 65,201 tons, or 7.2 percent, primarily due to the Longview mill work stoppage in the third
quarter and volumes being redirected from outside sales to fulfill demand for internal converting. Corrugated product sales volume increased by approximately 15,049 tons, or 1.7 percent
(3.4 percent in BSF).
- •
- Specialty paper sales volume decreased by 13,119 tons, or 1.3 percent, primarily due to lower kraft paper export shipments of
37,680 tons, or 27.8 percent, reflecting increased competition in our export markets, partially offset by higher domestic kraft paper shipments of 19,389 tons.
- •
- Other sales declined primary due to lower energy and lumber prices.
Distribution segment net sales of $582.9 million reflect sales for Victory, which the Company acquired on June 1, 2015.
Cost of sales, excluding depreciation and amortization expense, for the year ended December 31, 2015 was $1,982.7 million compared to $1,551.5 million for the year ended December 31, 2014, an increase of $431.2 million, or 27.8 percent. The increase in cost of sales was mainly due to the $430.1 million impact of the Victory acquisition, including $5.8 million of expense related to the step up of inventory in purchase accounting. Excluding the acquisition, cost of sales was flat reflecting higher costs due to $20.4 million of inflation and $15.1 million caused by the Longview mill work stoppage. This increase in cost of sales was offset by $29.3 million of lower sales volume, $4.2 million of productivity gains and lower incentive compensation and $2.0 million of lower severance costs. Planned maintenance outage costs during 2015 and 2014 totaled $37.4 million and $36.1 million, respectively, and were included in cost of sales for those years.
Depreciation and amortization expense for the year ended December 31, 2015 totaled $162.2 million compared to $136.5 million for 2014. The increase of $25.7 million reflects $13.1 million from the Victory acquisition, including $11.1 million of amortization expense for acquired intangible assets. In addition, depreciation expense was higher due to $6.1 million from higher capital spending and $6.5 million of accelerated depreciation mainly for two boilers taken out of service due to modernizing the Longview paper mill.
Freight and distribution expenses for the year ended December 31, 2015 totaled $234.5 million compared to $175.9 million in 2014. The increase of $58.6 million was primarily due to $55.0 million from the Victory acquisition and $4.6 million due to product and customer mix, which was partially offset by $3.9 million of lower fuel costs.
Selling, general and administrative expenses for the year ended December 31, 2015 totaled $210.8 million compared to $137.0 million in 2014. The increase of $73.8 million, or 53.9 percent, includes $64.1 million for Victory direct selling and administrative expenses. Excluding Victory, selling, general and administrative expenses increased by $9.7 million due to $2.9 million of Victory acquisition expenses and $3.7 million of contingent consideration expense, $3.4 million of higher salary and benefit related expenses, $2.9 million of higher stock-based compensation expense and $2.2 million of higher legal and consulting expenses. This increase in selling, general and administrative expense was partially offset by $2.7 million of lower Longview integration expenses and $2.4 million of lower incentive compensation due to the Company's lower operating income in 2015. As a percentage of net sales, selling, general and administrative expenses increased to 7.6 percent in 2015 from 6.0 percent in 2014.
Loss on debt extinguishment for the years ended December 31, 2015 and 2014 totaled $1.2 million and $5.6 million, respectively, due to $103.5 million of prepayments on the term loans under the Credit Facility in 2015 and $325.0 million of prepayments in 2014.
27
Net interest expense for the years ended December 31, 2015 and 2014 was $33.8 million and $32.5 million, respectively. Interest expense reflects interest on the outstanding borrowings under the Credit Facility and the receivables credit facility in connection with our trade receivables securitization program (the "Receivables Credit Facility") and amortization of debt issuance costs. Interest expense was $1.3 million higher for the year ended 2015, primarily due to higher borrowings under the term loans to finance the Victory acquisition.
Provision for income taxes for the years ended December 31, 2015 and 2014 was $55.2 million and $88.7 million, respectively, reflecting an effective income tax rate of 34.2 percent for 2015, compared to 34.0 percent for 2014. The lower provision for income taxes in 2015 primarily reflects lower pre-tax income of $99.0 million.
The following table compares results of operations for the years ended December 31, 2014 and 2013:
| |
Years Ended December 31, | |
% of Net Sales | |||||||||||||
|---|---|---|---|---|---|---|---|---|---|---|---|---|---|---|---|---|
| |
% Change |
|||||||||||||||
| |
2014 | 2013 | 2014 | 2013 | ||||||||||||
Net sales |
$ | 2,300,920 | $ | 1,748,162 | 31.6 | % | 100.0 | % | 100.0 | % | ||||||
Cost of sales, excluding depreciation and amortization |
1,551,531 | 1,186,930 | 30.7 | % | 67.4 | % | 67.9 | % | ||||||||
Depreciation and amortization |
136,548 | 95,435 | 43.1 | % | 5.9 | % | 5.5 | % | ||||||||
Freight and distribution expenses |
175,901 | 135,972 | 29.4 | % | 7.6 | % | 7.8 | % | ||||||||
Selling, general and administrative expenses |
137,009 | 110,612 | 23.9 | % | 6.0 | % | 6.3 | % | ||||||||
Other operating income |
— | 675 | (100.0 | )% | — | — | ||||||||||
| | | | | | | | | | | | | | | | | |
Operating income |
299,931 | 219,888 | 36.4 | % | 13.0 | % | 12.6 | % | ||||||||
Foreign exchange gain/(loss) |
(1,222 | ) | 232 | 626.7 | % | (0.1 | )% | — | ||||||||
Loss on debt extinguishment |
5,617 | — | 100.0 | % | 0.2 | % | — | |||||||||
Interest expense, net |
32,491 | 25,130 | 29.3 | % | 1.4 | % | 1.4 | % | ||||||||
| | | | | | | | | | | | | | | | | |
Income before provision for income taxes |
260,601 | 194,990 | 33.6 | % | 11.3 | % | 11.2 | % | ||||||||
Provision for income taxes |
88,686 | 67,652 | 31.1 | % | 3.9 | % | 3.9 | % | ||||||||
| | | | | | | | | | | | | | | | | |
Net income |
$ | 171,915 | $ | 127,338 | 35.0 | % | 7.5 | % | 7.3 | % | ||||||
| | | | | | | | | | | | | | | | | |
| | | | | | | | | | | | | | | | | |
| | | | | | | | | | | | | | | | | |
Net sales for the year ended December 31, 2014 were $2,300.9 million compared to $1,748.2 million for the year ended December 31, 2013, an increase of $552.7 million of the increase. The increase in net sales was driven primarily by the Longview acquisition, which accounted for $510.2 million. In addition to the Longview acquisition, net sales increased by $29.5 million due to higher average selling prices and product mix changes and $11.1 million of higher sales volume. Average mill selling price per ton for 2014 was $684 compared to $669 for 2013. Average mill selling prices increased primarily due to the realization of 2013 containerboard and corrugated products price increases, along with 2013 specialty paper price increases and a $50 per ton 2014 kraft paper selling price increase.
28
The following represents the Company's sales by product line:
| |
Years Ended December 31, | ||||||||||||||||||||||||
|---|---|---|---|---|---|---|---|---|---|---|---|---|---|---|---|---|---|---|---|---|---|---|---|---|---|
| |
Net Sales (in thousands) | |
|
Tons Sold | |
|
|||||||||||||||||||
| |
Increase/ (Decrease) |
|
Increase/ (Decrease) |
|
|||||||||||||||||||||
Product Line Revenue:
|
2014 | 2013 | % | 2014 | 2013 | % | |||||||||||||||||||
Containerboard / Corrugated products |
$ | 1,463,670 | $ | 1,108,545 | $ | 355,125 | 32.0 | % | 1,764,628 | 1,403,797 | 360,831 | 25.7 | % | ||||||||||||
Specialty paper |
741,601 | 551,931 | 189,670 | 34.4 | % | 1,031,024 | 799,261 | 231,763 | 29.0 | % | |||||||||||||||
Other |
95,649 | 87,686 | 7,963 | 9.1 | % | — | — | — | — | ||||||||||||||||
| | | | | | | | | | | | | | | | | | | | | | | | | | |
Product sold |
$ | 2,300,920 | $ | 1,748,162 | $ | 552,758 | 31.6 | % | 2,795,652 | 2,203,058 | 592,594 | 26.9 | % | ||||||||||||
| | | | | | | | | | | | | | | | | | | | | | | | | | |
| | | | | | | | | | | | | | | | | | | | | | | | | | |
| | | | | | | | | | | | | | | | | | | | | | | | | | |
Tons of product sold in 2014 was 2,795,652 tons compared to 2,203,058 tons in 2013. Excluding the Longview acquisition, tons of products sold in 2014 decreased by 14,738 tons or 0.9 percent as follows:
- •
- Containerboard / Corrugated product sales volume decreased 1.3 percent. Containerboard sales decreased 5.8 percent
reflecting volumes being redirected from outside sales to fulfill demand for internal converting. Corrugated product sales volume increased 6.5 percent.
- •
- Specialty paper sales decreased by 0.1 percent, primarily due to lower Durasorb® sales, which decreased 5.8 percent, partially offset by a kraft paper volume increase of 3.2 percent.
Cost of sales, excluding depreciation and amortization expense, for the year ended December 31, 2014 was $1,551.5 million compared to $1,186.9 million for the year ended December 31, 2013, an increase of $364.6 million. The increase in cost of sales was mainly due to the $337.5 million impact of the Longview acquisition. In addition to the Longview acquisition, cost of sales increased mainly due to $21.5 million of inflation on labor, benefits and input costs, $18.7 million of higher sales volume, $11.2 million of higher planned maintenance outage costs, $6.6 million of voluntary severance plan charges and $4.4 million of other cost increases. These cost increases were partially offset by $35.3 million of productivity gains, primarily resulting from higher production and cost savings. Including Longview, annual planned maintenance outage costs during 2014 and 2013 totaled $36.1 million and $24.9 million, respectively, and were included in cost of sales for those years.
Depreciation and amortization expense for the year ended December 31, 2014 totaled $136.5 million compared to $95.4 million for 2013. The increase of $41.1 million was primarily due to $34.1 million from the Longview acquisition, $5.2 million of which reflected amortization of identified intangibles and $7.0 million was the result of higher capital spending.
Freight and distribution expenses for the year ended December 31, 2014 totaled $175.9 million compared to $136.0 million for 2013. The increase of $39.9 million was primarily due to $30.5 million from the Longview acquisition, $7.5 million from higher sales volumes and mix and $1.9 million of inflation and other cost increases.
Selling, general and administrative expenses for the year ended December 31, 2014 totaled $137.0 million compared to $110.6 million in 2013. The increase of $26.4 million was primarily due to $25.2 million from the Longview acquisition. In addition to the Longview acquisition, selling, general, and administrative expenses increased due to $3.9 million of higher compensation and benefit related expenses, $4.2 million of 2014 Longview integration related expenses, $0.9 million higher legal expenses and $0.3 million of voluntary severance plan charges, partially offset by $8.5 million of nonrecurring 2013 Longview acquisition related expenses. As a percentage of net sales, selling, general, and administrative expenses decreased to 6.0 percent in 2014 from 6.3 percent in 2013.
Loss on debt extinguishment for the year ended December 31, 2014 was $5.6 million due to the $325.0 million of voluntary prepayments on the term loans under the Credit Facility.
29
Net interest expense for the years ended December 31, 2014 and 2013 was $32.5 million and $25.1 million, respectively. Interest expense reflects interest on the Company's borrowings under its Credit Facility, Receivables Credit Facility and amortization of debt issuance costs. Interest expense was $7.4 million higher for the year ended 2014 due to higher term loan balances used to fund the Longview acquisition and an increase in variable interest rates.
Provision for income taxes for the years ended December 31, 2014 and 2013 was $88.7 million and $67.7 million, respectively, reflecting an effective income tax rate of 34.0 percent for 2014 compared to 34.7 percent for 2013. The higher provision for income taxes in 2014 primarily reflects higher pre-tax income. In addition, 2013 included a $5.0 million favorable adjustment for reversal of a tax reserve for an uncertain tax position relating to alternative fuel mixture credits.
Liquidity and Capital Resources
Acquisition
On June 1, 2015, the Company purchased 100 percent of the partnership interests in Victory for $615.0 million in cash and $2.0 million for certain post-closing adjustments. The Company will also be obligated to pay up to an additional $25.0 million of contingent consideration to the former owners of Victory if certain performance criteria are satisfied during the thirty months following the closing.
Credit Facility
In conjunction with the Victory acquisition, the Company entered into the Second Amended and Restated Credit Agreement (as amended from time to time, the "Credit Agreement") by and among KapStone Kraft Paper Corporation, as Borrower, the Company and certain subsidiaries of Borrower from time to time party thereto, as Guarantors, the lenders from time to time party thereto, and Bank of America, N.A., as Administrative Agent, Swing Line Lender and L/C Issuer. The Credit Agreement, which provides for a senior secured credit facility (the "Credit Facility") in an initial aggregate principal amount of $1.915 billion, consisting of a Term Loan A-1 in the aggregate amount of $940.0 million, a Term Loan A-2 in the aggregate amount of $475.0 million, and a $500.0 million revolving credit facility (including a $75.0 million letter of credit sub-facility and a $45.0 million swing line loan sub-facility, the "Revolver"). The Credit Facility also includes an "accordion" feature that allows the Company, subject to certain terms and conditions, to increase the commitments under the Credit Facility. The aggregate amount of such increases is not limited if the Company maintains a pro forma total leverage ratio equal to or less than 2.5 to 1.0 after giving effect to any increase. To the extent the pro forma total leverage ratio of the Company is greater than 2.5 to 1.0 after giving effect to any increase, the aggregate amount of such increases is limited to $600.0 million. The incremental borrowings from the Credit Agreement, consisting of proceeds from Term Loan A-1, Term Loan A-2, and $115.0 million of borrowings under the Revolver were used to finance the Company's acquisition of Victory and pay certain transaction fees and expenses.
On February 8, 2016, the Company entered into the First Amendment ("First Amendment") to the Credit Agreement. The First Amendment modifies, among other things, the financial covenant in the Credit Agreement related to maintenance of a maximum total leverage ratio by increasing the permitted total leverage ratio for fiscal quarters ending on or prior to June 30, 2018, and it modifies certain defined terms used in the calculation of the financial covenants in a manner favorable to the Company. The First Amendment also modifies the pricing grid applicable to interest rates and the unused commitment fee under the Credit Agreement in order to provide for an additional pricing level applicable based on the total leverage ratio of the Company.
Depending on the type of borrowing, the applicable interest rate under the Credit Facility is calculated at a per annum rate equal to (a) LIBOR plus an applicable margin[,which is currently 1.75% for Term Loan A-1 Eurodollar loans, 1.875% for Term Loan A-2 Eurodollar loans and 1.75% for
30
Revolver Eurodollar loans] or (b) the base rate that is calculated as (i) the greatest of (x) the prime rate, (y) the federal funds effective rate plus 0.50% or (z) a daily rate equal to one month LIBOR plus 1% plus (ii) an applicable margin[,which is currently 0.75% for Term Loan A-1 Eurodollar loans, 0.875% for Term Loan A-2 Eurodollar loans and 0.75% for Revolver base rate loans]. The unused portion of the Revolver is subject to an unused fee that is calculated at a per annum rate (the "Unused Fee Rate").
The applicable margin for borrowings under the Credit Facility and the Unused Fee Rate will be determined by reference to the pricing grid based on the Company's total leverage ratio. Under such pricing grid, the applicable margins for Term Loan A-1 and Revolver range from 1.00% to 2.00% for Eurodollar loans and from 0.00% to 1.00% for base rate loans, and the Unused Fee Rate range from 0.20% to 0.325%. The applicable margins for Term Loan A-2 will range from 1.125% to 2.125% for Eurodollar loans and from 0.125% to 1.25% for base rate loans.
Annual principal repayments, paid in quarterly installments beginning in the fourth quarter of 2017, are as follows:
Fiscal year ending: |
||||
2016 |
$ | — | ||
2017 |
12,938 | |||
2018 |
51,750 | |||
2019 |
51,750 | |||
2020 |
733,250 | |||
2021 |
4,750 | |||
2022 |
444,125 | |||
| | | | | |
Total |
$ | 1,298,563 | ||
| | | | | |
| | | | | |
| | | | | |
Receivables Credit Facility
Under our accounts receivable securitization program (the "Securitization Program"), certain of KapStone's subsidiaries sell, on an ongoing basis without recourse, certain trade accounts receivables (the "Receivables") and related assets to KapStone Receivables, LLC, a Delaware limited liability company and wholly owned, bankruptcy remote subsidiary of the Company ("KAR"), pursuant to a Receivables Sale Agreement dated as of September 26, 2014 (the "Receivables Sale Agreement") among the Company, as servicer, KapStone Kraft Paper Corporation, KapStone Container Corporation, KapStone Charleston Kraft LLC and Longview Fibre Paper and Packaging, Inc., as Originators (the "Originators"), and KAR, as buyer. KAR, in turn, sells the interests in the Receivables and related assets to certain financial institutions pursuant to a Receivables Purchase Agreement (the "Receivables Purchase Agreement") among KAR, as seller, the financial institutions from time to time party thereto as purchasers (the "Purchasers"), the Company, as servicer, and (iii) Wells Fargo Bank, N.A., as administrative agent.
Pursuant to the Securitization Program, (i) the Originators will sell or contribute certain of their respective Receivables and certain related assets to KAR, a portion of the purchase price of which will be paid from the proceeds of subordinated debt advanced by the Originators to KAR, (ii) the Purchasers have committed to purchase undivided interests in the Receivables in the aggregate principal amount of up to $175.0 million, which interests shall be secured by the Receivables (the "Receivables Credit Facility"), (iii) the Company will service and administer the Receivables on behalf of KAR and (iv) the Company will provide a performance guaranty to KAR in respect of the obligations of the Originators under the Receivables Sale Agreement, including without limitation, obligations to pay purchase price credits and indemnity obligations. The Purchasers receive yield on their investments based on a spread over the LIBOR rate for each day that their investments in the Receivables are outstanding, as well as a fee calculated on the unused portion of their commitments.
31
In June, 2015, the parties entered into (i) Amendment No. 1 to Receivables Purchase Agreement as of June 10, 2015 (the "Amendment to Receivables Purchase Agreement") amending its Receivables Purchase Agreement and (ii) Amendment No. 1 to Receivables Sale Agreement (the "Amendment to Receivables Sale Agreement" and, together with the Amendment to Receivables Purchase Agreement, the "Amendments") as of June 10, 2015 amending its Receivables Sale Agreement.
Pursuant to the Amendments:
- •
- Victory was added as an "Originator" under the Receivables Sale Agreement;
- •
- the principal amount of undivided interests in the receivables the financial institutions that are parties to the Receivables Purchase
Agreement (the "Purchasers") are committed to purchase was increased from up to $175.0 million to up to $275.0 million; and
- •
- the "Facility Termination Date" (as defined in the Receivables Purchase Agreement) was extended from September 26, 2015 to June 8, 2016 (the date by which the Purchasers commitment to purchase receivables will terminate).
As of December 31, 2015, the Company had $265.6 million of outstanding borrowings under its $275 million Receivables Credit Facility at an interest rate of 1.18 percent.
Voluntary and Mandatory Prepayments
For the year ended December 31, 2015, the Company made $103.5 million of voluntary prepayments on its term loans under its Credit Facility using cash generated from operations.
For the year ended December 31, 2015, the Company made $36.1 million in mandatory payments throughout the year on the Receivable Credit Facility based on the Company's eligible receivables.
For the year ended December 31, 2014, the Company made $325.0 million of voluntary prepayments on its term loans under its Credit Facility using $175.0 million of cash from the Receivables Credit Facility and $150.0 million of cash generated from operations.
For the year ended December 31, 2014, the Company made an $8.0 million mandatory payment on the Receivable Credit Facility based on the Company's eligible receivables. No mandatory prepayments were required under the Credit Facility.
Other Borrowing
In 2015 and 2014, the Company entered into financing agreements of $6.6 million and $6.3 million, respectively, at an annual interest rates of approximately 1.70 percent for its annual property insurance premiums. The amount due under the 2015 agreement was repaid in three quarterly payments through the term of the financing agreement which ended on December 31, 2015.
For 2016, the Company did not enter into a similar agreement.
Debt Covenants
The Company must comply on a quarterly basis with the financial covenants of its Credit Agreement, including a maximum permitted leverage ratio. The leverage ratio is calculated by dividing the Company's debt net of available cash by its rolling twelve month total earnings before interest expense, taxes, depreciation and amortization and allowable adjustments. The maximum permitted leverage ratio declines over the life of the Credit Agreement. On December 31, 2015, the maximum permitted leverage ratio was 4.25 to 1.00. On December 31, 2015, the Company was in compliance with a leverage ratio of 3.6 to 1.00. The First Amendment increased the maximum permitted leverage ratio for fiscal quarters ending on or prior to June 30, 2018.
The Credit Agreement also includes a financial covenant requiring a minimum interest coverage ratio. This ratio is calculated by dividing the Company's trailing twelve month total earnings before
32
interest expense, taxes, depreciation and amortization and allowable adjustments by the sum of our net cash interest payments during the twelve month period. On December 31, 2015, the interest coverage ratio was required to be at least 3.00 to 1.00. On December 31, 2015, the Company was in compliance with the Credit Agreement with an interest coverage ratio of 13.4 to 1.00.
As of December 31, 2015, the Company was also in compliance with all other covenants in the Credit Agreement.
Income Taxes
Income taxes paid, net of refunds, were $65.5 million, $77.5 million and $4.0 million in 2015, 2014 and 2013, respectively. The decrease in 2015 was primarily due to lower pre-tax income. The Company expects its 2016 cash tax rate to be approximately 35 percent.
Sources and Uses of Cash
Years ended December 31 ($ in thousands)
|
2015 | 2014 | 2013 | |||||||
|---|---|---|---|---|---|---|---|---|---|---|
Operating activities |
$ | 262,457 | $ | 313,198 | $ | 298,694 | ||||
Investing activities |
(743,802 | ) | (137,232 | ) | (634,945 | ) | ||||
Financing activities |
459,699 | (160,466 | ) | 332,730 | ||||||
| | | | | | | | | | | |
Total change in cash and cash equivalents |
$ | (21,646 | ) | $ | 15,500 | $ | (3,521 | ) | ||
| | | | | | | | | | | |
| | | | | | | | | | | |
| | | | | | | | | | | |
2015
Cash and cash equivalents decreased by $21.6 million from December 31, 2014, reflecting $262.5 million of net cash provided by operating activities, $743.8 million of net cash used in investing activities and $459.7 million of net cash provided by financing activities.
Net cash provided by operating activities was $262.5 million, comprised of net income of $106.4 million and non-cash charges of $187.4 million. Changes in operating assets and liabilities used $31.3 million of cash. Net cash provided by operating activities decreased by $50.7 million during the year ended December 31, 2015 compared to 2014, mainly due to a $65.5 million decrease in net income and a $25.3 million increase in cash used for working capital, partially offset by higher non-cash charges of $40.1 million. The increase in working capital mainly reflects higher inventory levels and income taxes.
Net cash used in investing activities includes $617.0 million for the Victory acquisition and $126.8 million for capital expenditures. Net cash used in investing activities increased by $606.6 million for the year ended December 31, 2015 compared to 2014, primarily due to the Victory acquisition, partially offset by $10.5 million of lower capital spending.
Net cash provided by financing activities was $459.7 million, reflecting $519.8 million of additional borrowings under the Credit Facility, $98.6 million of net borrowings under the Receivables Credit Facility and $6.4 million of net short-term borrowings under the Revolver. These borrowings were partially offset by $103.5 million of prepayments on the term loans under the Credit Facility, $38.7 million of dividend payments, $12.9 million principal payments on the term loans under the Credit Facility and $10.8 million of debt issuance costs for the Credit Agreement. Net cash provided by financing activities increased by $620.2 million in 2015 compared to 2014, primarily due to net borrowings to finance the Victory acquisition of $519.8 million and lower voluntary prepayments of $212.1 million, which was partially offset by the lower net borrowings under the Receivables Credit Facility of $68.4 million and cash dividend payments of $38.7 million.
33
2014
Cash and cash equivalents increased by $15.5 million from December 31, 2013, reflecting $313.2 million of net cash provided by operating activities, $137.2 million of net cash used in investing activities and $160.5 million of net cash used by financing activities.
Net cash provided by operating activities was $313.2 million, comprised primarily of net income of $171.9 million and non-cash charges of $147.4 million. Changes in operating assets and liabilities used $6.1 million of cash. Net cash provided by operating activities increased by $14.5 million during the year ended December 31, 2014 compared to 2013 mainly due to a $44.6 million increase in net income, which was partially offset by $18.9 million of cash used for working capital and lower non-cash charges of $11.2 million.
Net cash used in investing activities was $137.2 million for capital expenditures. For the year ended December 31, 2014, capital expenditures included $49.5 million for our Longview operations acquired on July 18, 2013 and $5.6 million for the completion of the North Charleston, South Carolina paper mill No. 3 paper machine upgrade. Capital expenditures increased by $40.5 million in 2014 compared to 2013 due to the Longview acquisition and higher strategic capital spending.
Net cash used in financing activities was $160.5 million and reflects $325.0 million of voluntary prepayments on the term loans under the Credit Facility, $8.0 million repayment on the Receivables Credit Facility as a result of a reduction in the Company's eligible receivables, $3.5 million for principal payments on the term loans under the Credit Facility, $1.1 million of fees paid for the Receivables Credit Facility and Amendments thereto and $0.2 million for cash dividends paid. These amounts were partially offset by $175.0 million of initial proceeds from Receivables Credit Facility and $2.4 million of proceeds from share transactions. Net cash provided by financing activities decreased by $493.2 million in 2014 compared to 2013, primarily due to higher net borrowings in 2013 as a result of the Longview acquisition.
Future Cash Needs
We expect that cash on hand at December 31, 2015 and cash generated from operating activities in 2016 and, if needed, the ability to draw from our $500.0 million Revolver and our $600.0 million accordion provision under our Credit Facility, if available, will be sufficient to meet anticipated cash needs, which primarily consists of approximately $115.0 million of expected capital expenditures, $38.7 million of dividends and any additional working capital needs.
At December 31, 2015, the Company had $6.4 million of borrowings under the Revolver and $476.5 million of remaining Revolver availability net of outstanding letters of credit.
On a long term basis, we expect that cash generated from operating activities and, if needed, the ability to draw from our Revolver and accordion provision, if available, will be sufficient to meet long term obligations. Our long term obligations primarily consist of $1.7 billion of debt service and interest (which includes a $716.8 million final payment on our term loan A-1 and $265.6 million on our Receivable Credit Facility in June 2020 and a final payment on our term loan A-2 in June 2022 of $442.9 million), capital expenditures of approximately $115.0 million to $125.0 million annually, dividends and working capital needs.
Off-Balance Sheet Arrangements
We have not entered into any off-balance sheet financing arrangements. The Company established a special purpose entity in connection with the Securitization Program. We have not guaranteed any debt or commitments of other entities or entered into any options on non-financial assets.
34
Critical Accounting Policies
The preparation of financial statements in conformity with accounting principles generally accepted in the United States of America requires management to make estimates and assumptions that affect the reported amounts of assets and liabilities at the date of the financial statements and the reported amounts of expenses during the reporting period. Actual results could differ from those estimates. We believe our critical accounting policies are those described below. The Company's audit committee has reviewed the policies listed below. For a detailed discussion of these and other accounting policies, see Note 2 "Significant Accounting Policies" of the Notes to the Consolidated Financial Statements.
Revenue Recognition
The Company recognizes revenue in accordance with Accounting Standards Codification ("ASC") 605, Revenue Recognition. Revenue is recognized when the customer takes title and assumes the risks and rewards of ownership. Sales with terms designated f.o.b. (free on board) shipping point are recognized at the time of shipment. For sales transactions with terms f.o.b. destination, revenue is recorded when the product is delivered to the customer's site and when title and risk of loss are transferred. Sales on consignment are recognized in revenue at the earlier of the month that the goods are consumed or after a period of time subsequent to receipt by the customer as specified by contract terms. Incentive rebates are typically paid in cash and are netted against revenue on an accrual basis as qualifying purchases are made by the customer to earn and thereby retain the rebate.
The Company recognizes revenue from the sale of shaft horsepower, generated by its cogeneration facility, and energy sales on a gross basis and is included in net sales.
Freight charged to customers is recognized in net sales.
Goodwill and Intangibles
Certain business acquisitions have resulted in the recording of goodwill. Upon acquisition, the purchase price is first allocated to identifiable assets and liabilities based on estimated fair value, with any remaining purchase price recorded as goodwill. Goodwill is considered indefinite lived intangible assets and as such is not amortized. At December 31, 2015, we have goodwill of $704.6 million. In conjunction with the Victory acquisition the Company's goodwill increased by $170.7 million, see Note 3 "Victory Acquisition" of the Notes to Consolidated Financial Statements.
Goodwill Valuations
Goodwill represents the excess of the cost of an acquired business over the fair value of the identifiable tangible and intangible assets acquired and liabilities assumed in a business combination. At December 31, 2015, we had $704.6 million of goodwill, of which we recorded $308.3 million in connection with the Longview acquisition in 2013 and $170.7 million in connection with the acquisition of Victory in 2015. At December 31, 2015, we had $533.9 million and $170.7 million of goodwill allocated to our Paper and Packaging and Distribution segments, respectively.
All of our intangible assets are amortized over their estimated useful lives, except goodwill, which we test for impairment annually in the fourth quarter, or sooner, if events or changes in circumstances indicate that the carrying value of the asset may exceed fair value. The test is performed at the reporting unit level. A reporting unit is an operating segment or one level below an operating segment (referred to as a "component"). A component is considered a reporting unit for purposes of goodwill testing if the component constitutes a business for which discrete financial information is available and segment management regularly reviews the operating results of that component. We now maintain three reporting units for purposes of our goodwill and intangible asset impairment testing, Western Paper and Packaging Operations, Eastern Paper and Packaging Operations and Distribution. The
35
Distribution segment was added in 2015 in conjunction with the Victory acquisition. Regional paper and packaging reporting units make up our Paper and Packaging segment and the Distribution reporting unit is the same as the Distribution segment. Segment information is discussed further in Note 16, Segment Information, of the Notes to Consolidated Financial Statements. In 2015, we merged two reporting units into one regional unit. Our impairment analysis was conducted both immediately before and immediately after the merger of reporting units to determine if impairment existed at either of the merged reporting units prior to the merger. This combination of reporting units had no impact on the allocation of goodwill to our segments.
In conducting our goodwill impairment analysis, we use a two-step process. First, we compare the book value of a reporting unit, including goodwill, with its fair value. The fair value is estimated based on a market approach and a discounted cash flow analysis, also known as the income approach, and is reconciled back to the current market capitalization for the Company to ensure that the implied control premium is reasonable. If the book value of a reporting unit exceeds its fair value, we perform the second step to estimate an implied fair value of the reporting unit's goodwill by allocating the fair value for the reporting unit to all of the assets and liabilities other than goodwill (including any unrecognized intangible assets). The difference between the total fair value of the reporting unit and the fair value of all the assets and liabilities other than goodwill is the implied fair value of that goodwill. The amount of impairment loss is equal to the excess of the book value of the goodwill over the implied fair value of that goodwill. The initial step of our impairment test indicated no impairment, including our before and after test of the combined reporting unit.
The following assumptions are used in calculating the fair value of reporting units:
- •
- Company Business Projections. The discounted cash flow
model utilizes business projections that are developed internally by management for use in managing the business. These projections include assumptions for sales volume growth, price and mix changes,
synergy benefits from acquisitions, inflation on costs and expenses, income taxes, and capital expenditures. Our forecasts take into consideration recent sales data for existing products, planned
timing of capital projects, and economic indicators to estimate future production volumes, selling prices, and key input costs for our manufactured products. Our pricing assumptions include an
assessment of industry supply and demand dynamics for our major products.
- •
- Growth Rates. A growth rate is used to calculate the
terminal value in the discounted cash flow model. The growth rate is the expected rate at which earnings or revenue is projected to grow beyond the forecast period. Growth rate assumptions were
2.5 percent to 3.0 percent in our discounted cash flow models.
- •
- Discount Rates. Future cash flows are discounted at a
rate that is consistent with a weighted average cost of capital for a potential market participant. The weighted average cost of capital is an estimate of the overall after-tax rate of return required
by equity and debt holders of a business enterprise. The discount rates selected are based on existing conditions within our industry and reflect adjustments for potential risk premiums in those
markets as well as weighting of the market cost of equity versus debt. We used discount rates ranging from 9 percent to 12 percent in determining the discounted cash flows for each of
our reporting units.
- •
- EBITDA Multiples. The market approach requires the use of a valuation multiple to calculate the estimated fair value of a reporting unit. We use an EBITDA multiple based on a selection of comparable companies and recent acquisition transactions within our industries to corroborate the value calculated in our discounted cash flow model.
As of October 1, 2015, we determined that the fair values of our Western Paper and Packaging Operations and Eastern Paper and Packaging Operations reporting units were substantially in excess of the carrying amount, and therefore, no goodwill impairment existed. The fair value of our Distribution
36
reporting unit at October 1, 2015 exceeded carrying value and was also slightly higher than the fair value on the June 1, 2015 acquisition date. As a result, the second step of the goodwill impairment test was not required to be completed.
The estimates and assumptions we use are consistent with the business plans and estimates we use to manage operations and to make acquisition and divestiture decisions. The use of different assumptions could impact whether an impairment charge is required and, if so, the amount of such impairment. Future outcomes may also differ. If we fail to achieve estimated volume and pricing targets, experience unfavorable market conditions or achieve results that differ from our estimates, then revenue and cost forecasts may not be achieved, and we may be required to recognize impairment charges, which could have a significant noncash impact on our operating results and financial condition. We cannot predict the occurrence of future events that might adversely affect the reported value of our goodwill and intangible assets. As additional information becomes known, we may change our estimates.
Intangible assets acquired in a business combination or asset purchase are initially valued at the fair market value using generally accepted valuation methods appropriate for the type of the intangible asset. Definite-lived intangible assets are amortized over their estimated useful lives and are reviewed for impairment if indicators of impairment arise. The evaluation of the impairment is based upon a comparison of the carrying amount of the intangible asset to the estimated future undiscounted cash flows expected to be generated by the asset. If the estimated undiscounted future cash flows are less than the carrying amount of the assets, the asset is considered to be impaired. If impaired, the intangible asset is written down to estimated fair market value.
Pension and Postretirement Benefits
The Company provides pension and postretirement benefits to certain employees and accounts for these benefits in accordance with ASC 715, Compensation—Retirement Benefits. For financial reporting purposes, long-term assumptions are developed through consultations with actuaries. Such assumptions include the expected long-term rate of return on plan assets, discount rates, health care trend rates and mortality rates. The discount rate for the current year is based on long-term high quality bond rates. We describe these assumptions in Note 10 "Pension and Postretirement Benefits" of the Notes to Consolidated Financial Statements, which include, among others, the discount rate, expected long-term rate of return on plan assets and expected rates of increase in compensation levels. Although there is authoritative guidance on how to select most of these assumptions, management must exercise judgment when selecting these assumptions. We evaluate these assumptions with our actuarial advisors on an annual basis and we believe they are within accepted industry ranges, although an increase or decrease in the assumptions or economic events outside our control could have a direct impact on recorded obligations and reported net earnings. A summary of key assumptions for 2015, 2014 and 2013 is as follows:
| |
Pension Benefits Actuarial Assumptions |
|||||||||
|---|---|---|---|---|---|---|---|---|---|---|
| |
2015 | 2014 | 2013 | |||||||
Weighted-average discount rate assumption used to determine PBO at December 31, |
4.66 | % | 4.24 | % | 5.11 | % | ||||
Weighted-average actuarial assumptions for net expense: |
||||||||||
Discount rate |
4.24 | % | 5.11 | % | 4.77 | % | ||||
Long-term rate of return on plan assets |
6.50 | % | 6.98 | % | 6.25 | % | ||||
The measurement date for our plan is year-end as of December 31. Accordingly, at the end of each year, we determine the discount rate to be used to discount pension liabilities to its present value.
37
This rate is adjusted to match the duration of the liabilities associated with the pension plan. The discount rate reflects the current rate at which the pension liabilities could be effectively settled at the end of the year. The Company's estimate of its projected benefit obligation ("PBO") is highly dependent on changes in market interest rates. In estimating this rate at the end of 2015, we reviewed rates of return on relevant market indices and concluded that the Fidelity Bond Modeler is consistent with observable market conditions and industry standards for developing spot rate curves. The impact of the change in market interest rates during 2015 from the prior year resulted in a $31.0 million decrease to our December 31, 2015 PBO and was recorded through "Accumulated other comprehensive income / (loss)," a component of "Stockholders' Equity" in the Consolidated Balance Sheets.
A significant element in determining our net periodic benefit income is the expected return on plan assets. For 2015, we had assumed that the expected long-term rate of return on plan assets would be 6.50 percent, or $41.1 million. This expected return on plan assets is included in the net periodic benefit income for the year ended December 31, 2015. As a result of the combined effect of changes in market values of both the equity and bond investments, the actual return on plan assets was $(21.5) million in 2015, or (2.6) percent. More specifically, equities and certain fixed income credits came under pressure due to a multitude of macroeconomic factors, with the return seeking portfolio down 2.4 percent for the year, relative to a benchmark gain of 3.1 percent. While the return-seeking portfolio outperformed its policy benchmark, it lagged higher quality, domestic equity markets, with the S&P 500 one of the few sources of positive returns in 2015, returning +1.4 percent. The plan's equity allocation is globally diversified and seeks to achieve a return premium relative to global equities on a long-term basis. While this allocation will lead to short-term deviations from long-term return targets, it is constructed with the intent to achieve the plan's actuarial return total plan return of +6.5 percent over a long-term period.
The long duration segment of the portfolio, which achieved its objective of mimicking the returns on the plan's liability, was also in negative territory for 2015, (2.6) percent, consistent with the gain experienced on the plan's liability. The plan also exited a 6 percent allocation to Real Assets mid-way through the year, which held back performance in the first six months of the year, but avoided the commodity-driven slide that occurred in the latter half of 2015.
The difference between the expected return and the actual return on plan assets is reflected on the Consolidated Balance Sheets through charges to "Accumulated other comprehensive income / (loss)." As of December 31, 2015 and 2014, the fair value of plan assets is $593.1 million and $647.5 million, respectively.
In addition to the discount rate change, we adopted updated U.S. mortality tables in 2015 for purposes of determining our mortality assumption used in the defined benefit plan's liability calculation. The new assumptions were based on the Society of Actuaries recent mortality experience study and reflect future mortality improvement. Based on our experience and in consultation with our actuaries, we utilized a base RP-2014 with MP-2015 projection scale and appropriate collar adjustments. In 2014, we utilized the RP-2014 mortality tables with MP-2014 projection scale. The updated mortality assumption resulted in a decrease to the PBO of $10.9 million as of the end of 2015 and was recorded through "Accumulated other comprehensive income / loss," a component of "Stockholders' Equity" in the Consolidated Balance Sheets.
The increase in the discount rate, the change to the updated mortality assumption, and overall plan experience has decreased the PBO by $41.4 million to $626.1 million as of December 31, 2015 from $669.2 million as of December 31, 2014. As of December 31, 2015 and 2014, the plan's unfunded status was $32.9 million and $21.7 million, respectively.
We recognized net periodic pension income of $6.5 million in 2015, compared to $5.0 million in 2014. For the year ended December 31, 2016, we estimate net periodic pension expense to approximate $0.2 million, reflecting a discount rate of 4.66 percent, an expected return on plan assets of 6.5 percent and amortization of actuarial losses of $4.6 million.
38
Income Taxes
The Company accounts for income taxes under the liability method in accordance with ASC 740, Income Taxes. Accordingly, deferred income taxes are provided for the future tax consequences attributable to differences between the carrying amounts of assets and liabilities for financial reporting and income tax purposes. Deferred tax assets and liabilities are measured using tax rates in effect for the year in which those temporary differences are expected to be recovered or settled. A valuation allowance is established when necessary to reduce deferred tax assets to the amount that is more likely than not to be realized. The Company recognizes the benefit of tax positions when it is more likely than not to be sustained on its technical merits. The Company records interest and penalties on unrecognized tax benefits in the provision for income taxes. As of December 31, 2015, the Company does not have any valuation allowances.
Recent Accounting Pronouncements
See Note 2 "Significant Accounting Policies" in the Notes to Consolidated Financial Statements for a discussion of recent accounting pronouncements.
Contractual Obligations
The following table summarizes our contractual obligations as of December 31, 2015, ($000s):
| |
Payments Due by Period | |||||||||||||||||||||
|---|---|---|---|---|---|---|---|---|---|---|---|---|---|---|---|---|---|---|---|---|---|---|
Contractual Obligations
|
Total | 2016 | 2017 | 2018 | 2019 | 2020 | Thereafter | |||||||||||||||
Short-term borrowings |
$ | 6,400 | $ | 6,400 | $ | — | $ | — | $ | — | $ | — | $ | — | ||||||||
Long-term debt(1) |
1,298,563 | — | 12,938 | 51,750 | 51,750 | 733,250 | 448,875 | |||||||||||||||
Receivable credit facility(1) |
265,614 | — | — | — | — | 265,614 | — | |||||||||||||||
Interest on long-term debt(2) |
170,685 | 34,622 | 34,495 | 33,822 | 32,659 | 19,451 | 15,636 | |||||||||||||||
Operating lease obligations(3) |
234,792 | 38,726 | 35,288 | 29,877 | 24,799 | 22,355 | 83,747 | |||||||||||||||
Purchase obligations(4)(5) |
240,618 | 45,149 | 48,094 | 36,567 | 28,031 | 27,229 | 55,548 | |||||||||||||||
Victory contingent consideration(6) |
25,000 | — | 25,000 | — | — | — | — | |||||||||||||||
| | | | | | | | | | | | | | | | | | | | | | | |
Total |
$ | 2,241,672 | $ | 124,897 | $ | 130,815 | $ | 152,016 | $ | 137,239 | $ | 1,067,899 | $ | 603,806 | ||||||||
| | | | | | | | | | | | | | | | | | | | | | | |
| | | | | | | | | | | | | | | | | | | | | | | |
| | | | | | | | | | | | | | | | | | | | | | | |
- (1)
- These
obligations are reflected on our Consolidated Balance Sheet at December 31, 2015, in long-term debt net of current portion, as appropriate. See
Note 9 "Short-term Borrowings and Long-term Debt" in the Notes to Consolidated Financial Statements.
- (2)
- Assumes
debt is carried to full term. Debt bears interest at variable rates and the amounts above assume future interest will be incurred at the rates in
effect on December 31, 2015. These obligations are not reflected on our Consolidated Balance Sheet at December 31, 2015.
- (3)
- These
obligations are not reflected on our Consolidated Balance Sheet at December 31, 2015. See Note 14 "Commitments and Contingencies" in the
Notes to Consolidated Financial Statements.
- (4)
- Purchase obligations are agreements to purchase goods that are enforceable and legally binding on us and that specify all significant terms, including fixed or minimum quantities to be purchased. These obligations are not reflected on our Consolidated Balance Sheet at December 31, 2015. See Note 14 "Commitments and Contingencies" in the Notes to Consolidated Financial Statements regarding the Company's purchase obligation relating to the Long Term Fiber Supply Agreement and the purchase of a contracted volume of natural gas.
39
- (5)
- In
September, 2015 the Company signed a non-cancellable contract with a third party to produce wood chips for use at the Company's Charleston paper mill for
twenty years, with an annual purchase obligation of approximately $6.0 million.
- (6)
- Victory's contingent consideration of $25.0 million is the maximum amount payable to former owners of Victory if certain financial performance criteria are satisfied during the thirty month period following the closing. The contingent consideration, as of December 31, 2015 is recorded at a fair value of $13.3 million. See Note 3 "Victory Acquisition" in the Notes to Consolidated Financial Statements.
Item 7A. Quantitative and Qualitative Disclosures about Market Risk
Market risk is the sensitivity of income to changes in interest rates, commodity prices and foreign currency changes. The Company is exposed to the following types of market risk: interest rates, commodity prices and foreign currency.
Interest Rates
Under our Credit Agreement, at December 31, 2015 we have an outstanding Credit Facility consisting of two term loans totaling approximately $1.3 billion outstanding and the Revolver that provides for borrowing of up to $500 million. Depending on the type of borrowing, the applicable interest rate under the Credit Facility is calculated at a per annum rate equal to (a) LIBOR plus an applicable margin or (b) the base rate that is calculated as (i) the greatest of (x) the prime rate, (y) the federal funds effective rate plus 0.50% or (z) a daily rate equal to one month LIBOR plus 1% plus (ii) an applicable margin. The unused portion of the Revolver is also subject to the Unused Fee Rate.
The applicable margin for borrowings under the Credit Facility and the Unused Fee Rate is determined by reference to the pricing grid based on the Company's total leverage ratio. Under such pricing grid, the applicable margins for Term Loan A-1 and Revolver ranges from 1.0% to 2.00% for Eurodollar loans and from 0.0% to 1.00% for base rate loans and the Unused Fee Rate ranges from 0.20% to 0.325%. The applicable margins for Term Loan A-2 ranges from 1.125% to 2.25% for Eurodollar loans and from 0.125% to 1.125% for base rate loans. At December 31, 2015 the weighted average interest rate of the term loans was 2.22 percent.
Under our Receivables Credit Facility, at December 31, 2015 we have $265.6 million of outstanding borrowings. The outstanding capital of each investment in the receivable interests shall accrue yield for each day at a rate per annum equal to the sum of (a) for any day, the one-month Eurodollar rate for U.S. dollar deposits plus (b) the applicable margin. At December 31, 2015 the interest rate on outstanding amounts under the Receivables Credit Facility was 1.18 percent.
Changes in market rates may impact the base or LIBOR rate under all borrowings. For instance, if the LIBOR rate was to increase or decrease by one percentage point (1.0%), our annual interest expense would change by approximately $15.9 million based upon our expected future monthly term loan balances per our existing repayment schedule and the Receivables Credit Facility.
Commodity Prices
We are exposed to price fluctuations of certain commodities used in production and distribution. Key materials and energy used in the production process include roundwood and woodchips, recycled fiber (OCC), containerboard, electricity, coal, natural gas and caustic soda. Diesel fuel prices have a direct impact on our Distribution segment. We generally purchase these commodities in each of our segments at market prices and do not use forward contracts or other financial instruments to hedge our exposure to price risk related to these commodities. We have one contract to purchase coal at fixed prices through December 31, 2016 and contracts to purchase natural gas through mid-2018.
40
We are exposed to price fluctuations in the price of our finished goods. The prices we charge for our products are primarily based on market conditions.
Foreign Currency
We are exposed to currency fluctuations as we invoice certain European customers in Euros and Mexican customers in Pesos. As of December 31, 2015 and 2014, the Company did not have any foreign currency forward contracts and foreign exchange forward contracts outstanding.
As of December 31, 2015, trade accounts receivable denominated in Euros totaled $8.4 million. As of December 31, 2015, trade receivable denominated in Pesos totaled $3.5 million.
Item 8. Financial Statements and Supplementary Data
Financial statements are attached hereto beginning on Page F-1.
Item 9. Changes in and Disagreements with Accountants on Accounting and Financial Disclosure
None.
Item 9A. Controls and Procedures
Disclosure Controls and Procedures.
An evaluation of the effectiveness of our disclosure controls and procedures as of December 31, 2015 was made by our Chief Executive Officer and Chief Financial Officer. Based on that evaluation, the Chief Executive Officer and Chief Financial Officer concluded that our disclosure controls and procedures were effective as of the end of the period covered by this report.
Internal Control over Financial Reporting.
Management Annual Report on Internal Control over Financial Reporting. Our management's report on internal control over financial reporting is set forth on page F-2 of this report.
Changes in Internal Control over Financial Reporting. There were no changes in our internal control over financial reporting during the most recent fiscal quarter that have materially affected, or are reasonably likely to affect, our internal control over financial reporting.
None.
Item 10. Directors, Executive Officers and Corporate Governance
The information required by this item is incorporated by reference from our definitive proxy statement to be filed on or about March 30, 2016 with the Securities and Exchange Commission ("SEC").
Additional information required by this Item (i) with respect to members of our Board of Directors will be contained in the Company's Proxy Statement to be filed with the SEC on or about March 30, 2016 under the caption "Proposal 1—Election of Directors", (ii) with respect to our executive officers will be contained in the Company's Proxy Statement under the caption "Executive Officers", (iii) with respect to our audit committee will be contained in the Company's Proxy Statement under the caption "Governance Structure—What Committees has the Board Established?", (iv) with respect to compliance under Section 16(a) of the Securities Exchange Act of 1934 will be contained in
41
Company's Proxy Statement under the caption "Section 16(a) Beneficial Ownership Reporting Compliance", and (v) with respect to our code of ethics will be contained in the Company's Proxy Statement under the caption "Code of Ethics" and is incorporated herein by this reference.
KapStone adopted a code of ethics that applies to its CEO and CFO, as well as all other officers and employees of the Company and its affiliates. This code of ethics, entitled "Code of Conduct and Ethics," is posted on the Company's website at www.kapstonepaper.com under "Governance." The Code of Conduct and Ethics is administered by the Chief Compliance Officer of the Company. Any amendment to, or waiver of, a provision of the Code of Conduct and Ethics that applies to the CEO, CFO, or persons performing similar functions will be disclosed on the Company's website under "Governance." We will also provide a copy of the Code of Conduct and Ethics without charge at the written request of any shareholder of record. Requests for copies may be directed to the Chief Compliance Office at our corporate headquarters.
Item 11. Executive Compensation
The information required by this Item will be contained in the Company's Proxy Statement to be filed with the SEC on or about March 30, 2016 under the captions "Executive Compensation," "Risk Oversight of Compensation," "Summary Compensation Table," "2015 Grants of Plan-Based Awards," "Governance Structure," "Outstanding Equity Awards at 2015 Fiscal Year End," "Option Exercises and Stock Vested in 2015," "Pension Benefits in 2015," "Potential Payments upon Termination or Change-in-Control," "2015 Director Compensation," "Compensation Committee Interlocks and Insider Participation," and "Report of the Compensation Committee" and is incorporated herein by this reference.
Item 12. Security Ownership of Certain Beneficial Owners and Management and Related Stockholder Matters
The information required by this Item will be contained in the Company's Proxy Statement to be filed with the SEC on or about March 30, 2016 under the captions "Stock Ownership—Securities Authorized for Issuance Under Equity Compensation Plan", "Stock Ownership—Security Ownership of Management" and "Stock Ownership—Security Ownership of Certain Beneficial Stockholders" and is incorporated herein by this reference.
Item 13. Certain Relationships and Related Persons Transactions and Director Independence
The information required by this Item will be contained in the Company's Proxy Statement to be filed with the SEC on or about March 30, 2016 under the captions "Certain Relationships and Related Person Transactions," and "Governance Structure" is incorporated herein by this reference.
Item 14. Principal Accountant Fees and Services
The information required by this Item will be contained in the Company's Proxy Statement to be filed with the SEC on or about March 30, 2016 under the caption "Independent Registered Public Accounting Firm" and is incorporated herein by this reference.
42
Item 15. Exhibits and Financial Statement Schedules
(a)(1) Financial Statements
An index to Consolidated Financial Statements appears on page F-1.
(a)(2) Financial Statement Schedules
Certain financial statement schedules have been omitted because they are not applicable or the required information is shown in the financial statements or the notes thereto.
(b) Exhibits.
The following Exhibits are filed as part of this report:
| Exhibit No. |
Description | ||
|---|---|---|---|
| 2.1 | Agreement and Plan of Merger, dated as of September 22, 2011, by and among KapStone Kraft Paper Corporation, U.S. Corrugated Acquisition Inc., Pine Merger Corp., Dennis Dorian Mehiel, for purposes of Section 10.3, and Dennis Mehiel, for purposes of Section 10.3 and as the Representative. Incorporated by reference to the Registrant's Current Report on Form 8-K filed on September 22, 2011. | ||
2.2 |
Stock Purchase Agreement dated as of June 10, 2013, by and among KapStone Kraft Paper Corporation, Longview Fibre Paper and Packaging, Inc., Brookfield Capital Partners II (NR) L.P., Brookfield Capital Partners II (PC) L.P., Brookfield Capital Partners II L.P. and KapStone Paper and Packaging Corporation. Incorporated by reference to the Registrant's Current Report on Form 8-K filed on June 10, 2013. |
||
2.3 |
Equity Purchase Agreement, dated as of May 4, 2015, by and among KapStone Kraft Paper Corporation, KapStone Charleston Kraft LLC, VP Holdco, Inc. and Victory Packaging Management, LLC. Incorporated by reference to the Registrant's Current Report on Form 8-K filed on May 5, 2015. |
||
3.1 |
Restated Certificate of Incorporation of KapStone Paper and Packaging Corporation (as amended through January 2, 2007). Incorporated by reference to the Registrant's Annual Report on Form 10-K for the period ended December 31, 2009, filed on March 10, 2010. |
||
3.2 |
Amended and Restated By-laws. Incorporated by reference to the Registrant's Current Report on Form 8-K filed on May 19, 2014. |
||
4.1 |
Specimen Common Stock Certificate. Incorporated by reference to the Registrant's Registration Statement on Form S-1/A (File No. 333-124601) filed on June 14, 2005. |
||
10.1 |
* |
2006 Incentive Plan amended and restated as of May 18, 2012. Incorporated by reference to the Registrant's Annual Report filed on Form 10-K filed on March 4, 2013. |
|
10.2 |
* |
Performance Incentive Plan of KapStone Paper and Packaging Corporation. Incorporated by reference to the Registrant's Current Report on Form 8-K filed on April 14, 2008. |
|
10.3 |
* |
Form of Restricted Stock Unit Agreement. Incorporated by reference to the Registrant's Current Report on Form 8-K filed on April 14, 2008. |
|
10.4 |
* |
2014 Incentive Plan. Incorporated by reference to Annex A to Registrant's Definitive Proxy Statement filed on April 1, 2014. |
|
43
| Exhibit No. |
Description | ||
|---|---|---|---|
| 10.5 | * | KapStone Paper and Packaging Corporation Deferred Compensation Plan and the Adoption Agreement for the KapStone Paper and Packaging Corporation Deferred Compensation Plan. Incorporated by reference to the Registrant's Current Report on Form 8-K filed on December 16, 2014. | |
10.6 |
* |
KapStone Paper and Packaging Corporation Deferred Compensation Plan for Non-Employee Directors, together with adoption agreement effective as of January 1, 2016. Incorporated by reference to the Registrants Quarterly Report on Form 10-Q filed on October 28, 2015. |
|
10.7 |
Long-Term Fiber Supply Agreement, dated July 1, 2008, by and among MeadWestvaco Forestry LLC and KapStone Charleston Kraft LLC (with certain confidential information deleted there from). Incorporated by reference to the Registrant's Current Report on Form 8-K filed on July 2, 2008. |
||
10.8 |
Second Amended and Restated Credit Agreement dated as of June 1, 2015, by and among KapStone Paper and Packaging Corporation, KapStone Kraft Paper Corporation, as Borrower, the subsidiaries of Borrower named therein, as Guarantors, the lenders named therein, Bank of America, N.A., as Administrative Agent, Swing Line Lender and L/C Issuer, and Barclays Bank PLC and Wells Fargo Bank, National Association, as co-Syndication Agents. Incorporated by reference to the Registrant's Current Report on Form 8-K filed on June 3, 2015. |
||
10.9 |
First Amendment to the Second Amended and Restated Credit Agreement dated as of February 9, 2016, by and among KapStone Paper and Packaging Corporation, KapStone Kraft Paper Corporation, as Borrower, the subsidiaries of Borrower named therein, as Guarantors, the lenders named therein, Bank of America, N.A., as Administrative Agent, Swing Line Lender and L/C Issuer, and Barclays Bank PLC and Wells Fargo Bank, National Association, as co-Syndication Agents. Incorporated by reference to the Registrant's Current Report on Form 8-K filed on February 9, 2016. |
||
10.10 |
Receivables Purchase Agreement, dated as of September 26, 2014, by and among KapStone Paper and Packaging Corporation, as Servicer, KapStone Receivables, LLC, as Seller, the financial institutions from time to time party thereto, as Purchasers, and Wells Fargo Bank, N.A., as Administrative Agent. Incorporated by reference to the Registrant's Form 8-K filed on October 1, 2014. |
||
10.11 |
Amendment No. 1 to Receivables Purchase Agreement entered into as of June 10, 2015 by and among KapStone Paper and Packaging Corporation, as servicer; KapStone Receivables, LLC, as seller; the financial institutions from time to time party thereto, as purchasers; and Wells Fargo Bank, N.A., as administrative agent. Incorporated by reference to the Registrant's Current Report on Form 8-K filed on June 11, 2015. |
||
10.12 |
Receivables Sale Agreement, dated as of September 26, 2014, by and among KapStone Paper and Packaging Corporation, as Servicer, KapStone Receivables, LLC, as Buyer, and KapStone Kraft Paper Corporation, KapStone Container Corporation, KapStone Charleston LLC and Longview Fibre Paper and Packaging, Inc., as Originators. Incorporated by reference to the Registrant's Form 8-K filed on October 1, 2014. |
||
44
| Exhibit No. |
Description | ||
|---|---|---|---|
| 10.13 | Amendment No. 1 to Receivables Sale Agreement entered into as of June 10, 2015, by and among KapStone Paper and Packaging Corporation, as servicer; KapStone Receivables, LLC, as buyer; and KapStone Kraft Paper Corporation, KapStone Container Corporation, KapStone Charleston Kraft LLC, Longview Fibre Paper and Packaging, Inc., and Victory Packaging, L.P., as originators. Incorporated by reference to the Registrant's Current Report on Form 8-K filed on June 11, 2015. | ||
14.0 |
Code of Ethics. Incorporated by reference to the Registrant's Quarterly Report filed on Form 10-Q filed on May 5, 2015. |
||
21.1 |
Subsidiaries. |
||
23.1 |
Consent of Ernst & Young LLP. |
||
31.1 |
Certification of the Chief Executive Officer pursuant to Rule 13a-14(a) of the Securities Exchange Act, as amended. |
||
31.2 |
Certification of the Principal Financial Officer pursuant to Rule 13a-14(a) of the Securities Exchange Act, as amended. |
||
32.l |
Certification of the Chief Executive Officer pursuant to 18 U.S.C. 1350, as adopted pursuant to Section 906 of the Sarbanes-Oxley Act of 2002. |
||
32.2 |
Certification of the Principal Financial Officer pursuant to 18 U.S.C. 1350, as adopted pursuant to Section 906 of the Sarbanes-Oxley Act of 2002. |
||
101.INS |
XBRL Instance Document. |
||
101.SCH |
XBRL Taxonomy Extension Schema. |
||
101.CAL |
XBRL Taxonomy Extension Calculation Linkbase. |
||
101.DEF |
XBRL Taxonomy Extension Definition Linkbase. |
||
101.LAB |
XBRL Taxonomy Extension Label Linkbase. |
||
101.PRE |
XBRL Extension Presentation Linkbase. |
||
- *
- Management compensatory plan or arrangement.
45
Pursuant to the requirements of Section 13 or 15 (d) of the Securities Exchange Act of 1934, the Registrant had duly caused this report to be signed on its behalf by the undersigned, thereunto duly authorized.
| KAPSTONE PAPER AND PACKAGING CORPORATION | ||||
February 26, 2016 |
By: |
/s/ ROGER W. STONE Roger W. Stone, Chairman of the Board, Chief Executive Officer and Director |
||
Pursuant to the requirements of the Securities Exchange Act of 1934, this report has been signed below by the following persons on behalf of the Registrant and in the capacities and on the dates indicated.
| February 26, 2016 | By: | /s/ ROGER W. STONE Roger W. Stone, Chairman of the Board, Chief Executive Officer and Director (Principal Executive Officer) |
||
February 26, 2016 |
By: |
/s/ ANDREA K. TARBOX Andrea K. Tarbox, Vice President and Chief Financial Officer (Principal Financial Officer and Principal Accounting Officer) |
||
February 26, 2016 |
By: |
/s/ MATTHEW KAPLAN Matthew Kaplan, President, Chief Operating Officer and Director |
||
February 26, 2016 |
By: |
/s/ MARK NIEHUS Mark A. Niehus, Vice President and Corporate Controller |
||
February 26, 2016 |
By: |
/s/ ROBERT J. BAHASH Robert J. Bahash, Director |
46
| February 26, 2016 | By: | /s/ JOHN M. CHAPMAN John M. Chapman, Director |
||
February 26, 2016 |
By: |
/s/ JONATHAN R. FURER Jonathan R. Furer, Director |
||
February 26, 2016 |
By: |
/s/ DAVID G. GABRIEL David G. Gabriel, Director |
||
February 26, 2016 |
By: |
/s/ BRIAN R. GAMACHE Brian R. Gamache, Director |
||
February 26, 2016 |
By: |
/s/ RONALD J. GIDWITZ Ronald J. Gidwitz, Director |
||
February 26, 2016 |
By: |
/s/ MATTHEW H. PAULL Matthew H. Paull, Director |
||
February 26, 2016 |
By: |
/s/ MAURICE S. REZNIK Maurice S. Reznik, Director |
||
February 26, 2016 |
By: |
/s/ DAVID P. STORCH David P. Storch, Director |
47
KapStone Paper and Packaging Corporation
(INDEX TO FINANCIAL STATEMENTS)
F-1
MANAGEMENT'S ANNUAL REPORT ON INTERNAL CONTROL OVER FINANCIAL REPORTING
Our management is responsible for establishing and maintaining adequate internal control over financial reporting. Internal control over financial reporting is defined in Rule 3a-15(f) and 15d-15(f) under the Securities Exchange Act of 1934. Because of its inherent limitations, internal control over financial reporting may not prevent or detect misstatements and can provide only reasonable assurance with respect to financial statement preparation and presentation. Also, projections of any evaluation of effectiveness to future periods are subject to the risk that controls may become inadequate because of changes in conditions, or that the degree of compliance with the policies or procedures may deteriorate.
Management assessed the effectiveness of our internal control over financial reporting as of December 31, 2015. Management based this assessment on the criteria set forth by the Committee of Sponsoring Organizations of the Treadway Commission (COSO) in "Internal Control—Integrated Framework (2013 Framework)."
Our management has excluded Victory Packaging from its assessment of internal control over financial reporting as of December 31, 2015 as all of the partnership interests were purchased on June 1, 2015. Victory is a wholly-owned subsidiary whose total assets, total revenues, and total operating income represent approximately 21.0 percent, 21.0 percent and 10.0 percent of our consolidated financial statement amounts as of, and, for the year ended December 31, 2015. Under guidelines established by the Securities and Exchange Commission, companies are allowed to exclude acquisitions from their assessment of internal control over financial reporting during the first year of an acquisition.
Based on this assessment, management concluded that, as of December 31, 2015, our internal control over financial reporting is effective.
Ernst & Young LLP, an independent registered public accounting firm, has audited the consolidated financial statements of the Company and the Company's internal control over financial reporting and has included their reports herein.
F-2
REPORT OF INDEPENDENT REGISTERED PUBLIC ACCOUNTING FIRM
Board
of Directors and Stockholders
KapStone Paper and Packaging Corporation
We have audited KapStone Paper and Packaging Corporation's internal control over financial reporting as of December 31, 2015, based on criteria established in Internal Control—Integrated Framework issued by the Committee of Sponsoring Organizations of the Treadway Commission (2013 Framework) (the COSO criteria). KapStone Paper and Packaging Corporation's management is responsible for maintaining effective internal control over financial reporting, and for its assessment of the effectiveness of internal control over financial reporting included in the accompanying Management's Annual Report on Internal Control over Financial Reporting. Our responsibility is to express an opinion on the company's internal control over financial reporting based on our audit.
We conducted our audit in accordance with the standards of the Public Company Accounting Oversight Board (United States). Those standards require that we plan and perform the audit to obtain reasonable assurance about whether effective internal control over financial reporting was maintained in all material respects. Our audit included obtaining an understanding of internal control over financial reporting, assessing the risk that a material weakness exists, testing and evaluating the design and operating effectiveness of internal control based on the assessed risk, and performing such other procedures as we considered necessary in the circumstances. We believe that our audit provides a reasonable basis for our opinion.
A company's internal control over financial reporting is a process designed to provide reasonable assurance regarding the reliability of financial reporting and the preparation of financial statements for external purposes in accordance with generally accepted accounting principles. A company's internal control over financial reporting includes those policies and procedures that (1) pertain to the maintenance of records that, in reasonable detail, accurately and fairly reflect the transactions and dispositions of the assets of the company; (2) provide reasonable assurance that transactions are recorded as necessary to permit preparation of financial statements in accordance with generally accepted accounting principles, and that receipts and expenditures of the company are being made only in accordance with authorizations of management and directors of the company; and (3) provide reasonable assurance regarding prevention or timely detection of unauthorized acquisition, use, or disposition of the company's assets that could have a material effect on the financial statements.
Because of its inherent limitations, internal control over financial reporting may not prevent or detect misstatements. Also, projections of any evaluation of effectiveness to future periods are subject to the risk that controls may become inadequate because of changes in conditions, or that the degree of compliance with the policies or procedures may deteriorate.
As indicated in the accompanying Management's Annual Report on Internal Control over Financial Reporting, management's assessment of and conclusion on the effectiveness of internal control over financial reporting did not include the internal controls of Victory Packaging which is included in the 2015 consolidated financial statements of KapStone Paper and Packaging Corporation and constituted approximately 21.0 percent of total assets as of December 31, 2015, approximately 21.0 percent of total revenues and approximately 10.0 percent of total operating income for the year then ended. Our audit of internal control over financial reporting of KapStone Paper and Packaging Corporation also did not include an evaluation of the internal control over financial reporting of Victory Packaging.
In our opinion, KapStone Paper and Packaging Corporation maintained, in all material respects, effective internal control over financial reporting as of December 31, 2015, based on the COSO criteria.
F-3
We have also audited, in accordance with the standards of the Public Company Accounting Oversight Board (United States), the balance sheets of KapStone Paper and Packaging Corporation as of December 31, 2015 and 2014, and the related statements of comprehensive income, changes in stockholders' equity, and cash flows for each of the three years in the period ended December 31, 2015, and our report dated February 26, 2016, expressed an unqualified opinion thereon.
/s/
Ernst & Young LLP
Chicago,
Illinois
February 26, 2016
F-4
REPORT OF INDEPENDENT REGISTERED PUBLIC ACCOUNTING FIRM
Board
of Directors and Stockholders
KapStone Paper and Packaging Corporation
We have audited the accompanying consolidated balance sheets of KapStone Paper and Packaging Corporation as of December 31, 2015 and 2014, and the related consolidated statements of comprehensive income, changes in stockholders' equity and cash flows for each of the three years in the period ended December 31, 2015. These financial statements are the responsibility of the Company's management. Our responsibility is to express an opinion on these financial statements based on our audits.
We conducted our audits in accordance with the standards of the Public Company Accounting Oversight Board (United States). Those standards require that we plan and perform the audit to obtain reasonable assurance about whether the financial statements are free of material misstatement. An audit includes examining, on a test basis, evidence supporting the amounts and disclosures in the financial statements. An audit also includes assessing the accounting principles used and significant estimates made by management, as well as evaluating the overall financial statement presentation. We believe that our audits provide a reasonable basis for our opinion.
In our opinion, the financial statements referred to above present fairly, in all material respects, the consolidated financial position of KapStone Paper and Packaging Corporation as of December 31, 2015 and 2014, and the consolidated results of its operations and its cash flows for each of the three years in the period ended December 31, 2015, in conformity with U.S. generally accepted accounting principles.
We have also audited, in accordance with the standards of the Public Company Accounting Oversight Board (United States), KapStone Paper and Packaging Corporation's internal control over financial reporting as of December 31, 2015, based on criteria establish in Internal Control—Integrated Framework, issued by the Committee of Sponsoring Organizations of the Treadway Commission (2013 Framework) and our report dated February 26, 2016 expressed an unqualified opinion thereon.
/s/ Ernst & Young LLP
Chicago,
Illinois
February 26, 2016
F-5
KapStone Paper and Packaging Corporation
Consolidated Balance Sheets
(In thousands, except share and per share amounts)
| |
December 31, | ||||||
|---|---|---|---|---|---|---|---|
| |
2015 | 2014 | |||||
Assets |
|||||||
Current assets: |
|||||||
Cash and cash equivalents |
$ | 6,821 | $ | 28,467 | |||
Trade accounts receivable (Includes $345,372 at December 31, 2015, and $225,577 at December 31, 2014, associated with the securitization facility) |
363,869 | 228,740 | |||||
Other receivables |
18,732 | 12,833 | |||||
Inventories |
335,903 | 238,329 | |||||
Prepaid expenses and other current assets |
28,932 | 7,172 | |||||
| | | | | | | | |
Total current assets |
754,257 | 515,541 | |||||
| | | | | | | | |
Plant, property and equipment, net |
1,406,146 | 1,386,670 | |||||
Other assets |
12,532 | 10,135 | |||||
Intangible assets, net |
344,583 | 110,077 | |||||
Goodwill |
704,592 | 533,851 | |||||
| | | | | | | | |
Total assets |
$ | 3,222,110 | $ | 2,556,274 | |||
| | | | | | | | |
| | | | | | | | |
| | | | | | | | |
Liabilities and Stockholders' Equity |
|||||||
Current liabilities: |
|||||||
Short-term borrowings |
$ | 6,400 | $ | — | |||
Dividend payable |
9,862 | 9,911 | |||||
Accounts payable |
196,491 | 149,600 | |||||
Accrued expenses |
73,138 | 48,340 | |||||
Accrued compensation costs |
64,149 | 62,491 | |||||
Accrued income taxes |
15 | 6,477 | |||||
| | | | | | | | |
Total current liabilities |
350,055 | 276,819 | |||||
| | | | | | | | |
Other liabilities: |
|||||||
Long-term debt (Includes $265,614 at December 31, 2015, and $167,000 at December 31, 2014, associated with the securitization facility) |
1,543,748 | 1,046,063 | |||||
Pension and postretirement benefits |
40,510 | 32,800 | |||||
Deferred income taxes |
418,479 | 414,283 | |||||
Other liabilities |
24,038 | 8,182 | |||||
| | | | | | | | |
Total other liabilities |
2,026,775 | 1,501,328 | |||||
| | | | | | | | |
Stockholders' equity: |
|||||||
Preferred stock $0.0001 par value; 1,000,000 shares authorized; no shares issued and outstanding |
— | — | |||||
Common stock—$0.0001 par value; 175,000,000 shares authorized; 96,327,506 shares issued and outstanding (excluding 40,000 treasury shares) at December 31, 2015 and 96,046,554 shares issued and outstanding (excluding 40,000 treasury shares) at December 31, 2014 |
10 | 10 | |||||
Additional paid-in-capital |
266,220 | 255,505 | |||||
Retained earnings |
642,306 | 574,601 | |||||
Accumulated other comprehensive loss |
(63,256 | ) | (51,989 | ) | |||
| | | | | | | | |
Total stockholders' equity |
845,280 | 778,127 | |||||
| | | | | | | | |
Total liabilities and stockholders' equity |
$ | 3,222,110 | $ | 2,556,274 | |||
| | | | | | | | |
| | | | | | | | |
| | | | | | | | |
See notes to consolidated financial statements.
F-6
KapStone Paper and Packaging Corporation
Consolidated Statements of Comprehensive Income
(In thousands, except share and per share amounts)
| |
Years Ended December 31, | |||||||||
|---|---|---|---|---|---|---|---|---|---|---|
| |
2015 | 2014 | 2013 | |||||||
Net sales |
$ | 2,789,345 | $ | 2,300,920 | $ | 1,748,162 | ||||
Cost of sales, excluding depreciation and amortization |
1,982,686 | 1,551,531 | 1,186,930 | |||||||
Depreciation and amortization |
162,179 | 136,548 | 95,435 | |||||||
Freight and distribution expenses |
234,469 | 175,901 | 135,972 | |||||||
Selling, general, and administrative expenses |
210,844 | 137,009 | 110,612 | |||||||
Other operating income |
— | — | 675 | |||||||
| | | | | | | | | | | |
Operating income |
199,167 | 299,931 | 219,888 | |||||||
Foreign exchange loss / (gain) |
2,556 |
1,222 |
(232 |
) |
||||||
Loss on debt extinguishment |
1,218 | 5,617 | — | |||||||
Interest expense, net |
33,759 | 32,491 | 25,130 | |||||||
| | | | | | | | | | | |
Income before provision for income taxes |
161,634 | 260,601 | 194,990 | |||||||
Provision for income taxes |
55,248 | 88,686 | 67,652 | |||||||
| | | | | | | | | | | |
Net income |
$ | 106,386 | $ | 171,915 | $ | 127,338 | ||||
| | | | | | | | | | | |
| | | | | | | | | | | |
| | | | | | | | | | | |
Other comprehensive income, net of tax |
||||||||||
Defined pension and post-retirement plans: |
||||||||||
Net actuarial gain/(loss) |
(13,182 | ) | (59,645 | ) | 10,491 | |||||
Pension and postretirement plan reclassification adjustments: |
||||||||||
Amortization (accretion) of prior service costs |
1,413 | 128 | (43 | ) | ||||||
Amortization (accretion) of net (gain) / loss |
502 | (7 | ) | 189 | ||||||
| | | | | | | | | | | |
Other comprehensive income/(loss), net of tax |
(11,267 | ) | (59,524 | ) | 10,637 | |||||
| | | | | | | | | | | |
Total comprehensive income |
$ | 95,119 | $ | 112,391 | $ | 137,975 | ||||
| | | | | | | | | | | |
| | | | | | | | | | | |
| | | | | | | | | | | |
Weighted average number of shares outstanding: |
||||||||||
Basic |
96,257,749 | 95,900,179 | 95,258,756 | |||||||
| | | | | | | | | | | |
| | | | | | | | | | | |
| | | | | | | | | | | |
Diluted |
97,635,539 | 97,459,184 | 96,739,482 | |||||||
| | | | | | | | | | | |
| | | | | | | | | | | |
| | | | | | | | | | | |
Net income per share: |
||||||||||
Basic |
$ | 1.11 | $ | 1.79 | $ | 1.34 | ||||
| | | | | | | | | | | |
| | | | | | | | | | | |
| | | | | | | | | | | |
Diluted |
$ | 1.09 | $ | 1.76 | $ | 1.32 | ||||
| | | | | | | | | | | |
| | | | | | | | | | | |
| | | | | | | | | | | |
Dividends declared per common share |
$ | 0.40 | $ | 0.10 | $ | — | ||||
| | | | | | | | | | | |
| | | | | | | | | | | |
| | | | | | | | | | | |
See notes to consolidated financial statements.
F-7
KapStone Paper and Packaging Corporation
Consolidated Statements of Changes in Stockholders' Equity
(In thousands, except share amounts)
| |
Common Stock, net of Treasury Stock |
|
|
Accumulated Other Comprehensive Income (Loss) |
|
||||||||||||||
|---|---|---|---|---|---|---|---|---|---|---|---|---|---|---|---|---|---|---|---|
| |
Additional Paid-In Capital |
Retained Earnings |
Total Stockholders' Equity |
||||||||||||||||
| |
Shares | Amount | |||||||||||||||||
Balance—December 31, 2012 |
94,910,120 | $ | 10 | $ | 236,029 | $ | 285,011 | $ | (3,102 | ) | $ | 517,948 | |||||||
| | | | | | | | | | | | | | | | | | | | |
| | | | | | | | | | | | | | | | | | | | |
| | | | | | | | | | | | | | | | | | | | |
Stock-based compensation expense |
— | — | 5,203 | — | — | 5,203 | |||||||||||||
Payment of withholding taxes on vested restricted stock awards and options exercised |
127,952 | — | (860 | ) | — | — | (860 | ) | |||||||||||
Exercise of stock options |
602,900 | — | 1,934 | — | — | 1,934 | |||||||||||||
Excess tax benefit from stock-based compensation |
— | — | 3,531 | — | — | 3,531 | |||||||||||||
Employee Stock Purchase Plan |
25,240 | — | 349 | — | — | 349 | |||||||||||||
Net income |
— | — | — | 127,338 | — | 127,338 | |||||||||||||
Pension and postretirement plan adjustments, net of tax of $6,281 |
— | — | — | — | 10,637 | 10,637 | |||||||||||||
| | | | | | | | | | | | | | | | | | | | |
Balance—December 31, 2013 |
95,666,212 | $ | 10 | $ | 246,186 | $ | 412,349 | $ | 7,535 | $ | 666,080 | ||||||||
| | | | | | | | | | | | | | | | | | | | |
| | | | | | | | | | | | | | | | | | | | |
| | | | | | | | | | | | | | | | | | | | |
Stock-based compensation expense |
— | — | 6,956 | — | — | 6,956 | |||||||||||||
Payment of withholding taxes on vested restricted stock awards and options exercised |
176,724 | — | (1,755 | ) | — | — | (1,755 | ) | |||||||||||
Exercise of stock options |
183,130 | — | 869 | — | — | 869 | |||||||||||||
Excess tax benefit from stock-based compensation |
— | — | 2,649 | — | — | 2,649 | |||||||||||||
Employee Stock Purchase Plan |
20,488 | — | 600 | — | — | 600 | |||||||||||||
Dividends declared |
— | — | — | (9,663 | ) | — | (9,663 | ) | |||||||||||
Net income |
— | — | — | 171,915 | — | 171,915 | |||||||||||||
Pension and postretirement plan adjustments, net of tax of $34,346 |
— | — | — | — | (59,524 | ) | (59,524 | ) | |||||||||||
| | | | | | | | | | | | | | | | | | | | |
Balance—December 31, 2014 |
96,046,554 | $ | 10 | $ | 255,505 | $ | 574,601 | $ | (51,989 | ) | $ | 778,127 | |||||||
| | | | | | | | | | | | | | | | | | | | |
| | | | | | | | | | | | | | | | | | | | |
| | | | | | | | | | | | | | | | | | | | |
Stock-based compensation expense |
— | — | 9,835 | 9,835 | |||||||||||||||
Payment of withholding taxes on vested restricted stock awards and options exercised |
155,283 | (2,508 | ) | — | — | (2,508 | ) | ||||||||||||
Exercise of stock options |
91,256 | — | 896 | — | — | 896 | |||||||||||||
Excess tax benefit from stock-based compensation |
— | — | 1,649 | — | — | 1,649 | |||||||||||||
Employee Stock Purchase Plan |
34,413 | — | 843 | — | — | 843 | |||||||||||||
Dividends declared |
— | — | — | (38,681 | ) | — | (38,681 | ) | |||||||||||
Net income |
— | — | — | 106,386 | — | 106,386 | |||||||||||||
Pension and postretirement plan adjustments, net of tax of $6,852 |
— | — | — | — | (11,267 | ) | (11,267 | ) | |||||||||||
| | | | | | | | | | | | | | | | | | | | |
Balance—December 31, 2015 |
96,327,506 | $ | 10 | $ | 266,220 | $ | 642,306 | $ | (63,256 | ) | $ | 845,280 | |||||||
| | | | | | | | | | | | | | | | | | | | |
| | | | | | | | | | | | | | | | | | | | |
| | | | | | | | | | | | | | | | | | | | |
See notes to consolidated financial statements.
F-8
KapStone Paper and Packaging Corporation
Consolidated Statements of Cash Flows
(In thousands)
| |
Years Ended December 31, | |||||||||
|---|---|---|---|---|---|---|---|---|---|---|
| |
2015 | 2014 | 2013 | |||||||
Operating activities |
||||||||||
Net income |
$ | 106,386 | $ | 171,915 | $ | 127,338 | ||||
Adjustments to reconcile net income to net cash provided by operating activities: |
||||||||||
Depreciation and amortization |
162,179 | 136,548 | 95,435 | |||||||
Stock-based compensation expense |
9,835 | 6,956 | 5,203 | |||||||
Pension and postretirement |
(11,182 | ) | (11,523 | ) | (3,908 | ) | ||||
Excess tax benefit from stock-based compensation |
(1,649 | ) | (2,649 | ) | (3,531 | ) | ||||
Amortization of debt issuance costs |
5,546 | 5,696 | 4,489 | |||||||
Loss on debt extinguishment |
1,218 | 5,617 | — | |||||||
Loss on disposal of fixed assets |
951 | 4,252 | 1,012 | |||||||
Deferred income taxes |
11,042 | 2,455 | 59,865 | |||||||
Inventory step-up expense |
5,800 | — | — | |||||||
Contingent consideration expense |
3,700 | — | — | |||||||
Changes in assets and liabilities: |
||||||||||
Trade accounts receivable, net |
8,960 | 3,649 | (11,133 | ) | ||||||
Other receivables |
(1,596 | ) | (1,434 | ) | 6,374 | |||||
Inventories |
(13,086 | ) | (22,973 | ) | 2,934 | |||||
Prepaid expenses and other current assets |
(13,375 | ) | (767 | ) | 9,488 | |||||
Other assets |
478 | (1,433 | ) | (382 | ) | |||||
Accounts payable |
(13,352 | ) | (5,705 | ) | (6,191 | ) | ||||
Accrued expenses and other liabilities |
16,155 | 6,072 | (3,364 | ) | ||||||
Accrued compensation costs |
(7,120 | ) | 7,620 | 15,065 | ||||||
Accrued income taxes |
(8,433 | ) | 8,902 | — | ||||||
| | | | | | | | | | | |
Net cash provided by operating activities |
262,457 | 313,198 | 298,694 | |||||||
| | | | | | | | | | | |
Investing activities |
||||||||||
Victory acquisition, net of cash acquired |
(617,046 | ) | — | — | ||||||
Longview acquisition, net of cash acquired |
— | — | (538,239 | ) | ||||||
Capital expenditures |
(126,756 | ) | (137,232 | ) | (96,706 | ) | ||||
| | | | | | | | | | | |
Net cash used in investing activities |
(743,802 | ) | (137,232 | ) | (634,945 | ) | ||||
| | | | | | | | | | | |
Financing activities |
||||||||||
Proceeds from revolving credit facility |
350,000 | 97,900 | 321,613 | |||||||
Repayments on revolving credit facility |
(343,600 | ) | (97,900 | ) | (385,113 | ) | ||||
Proceeds from receivables credit facility |
134,701 | 175,000 | — | |||||||
Repayments on receivables credit facility |
(36,088 | ) | (8,000 | ) | — | |||||
Proceeds from long-term debt |
519,763 | — | 1,275,000 | |||||||
Repayments of long-term debt |
(116,438 | ) | (328,525 | ) | (356,550 | ) | ||||
Redemption of Longview senior notes |
— | — | (507,520 | ) | ||||||
Cash dividends paid |
(38,729 | ) | (223 | ) | — | |||||
Payment of loan amendment and debt issuance costs |
(10,790 | ) | (1,081 | ) | (19,654 | ) | ||||
Proceeds from other current borrowings |
6,615 | 6,300 | 5,115 | |||||||
Repayments on other current borrowings |
(6,615 | ) | (6,300 | ) | (5,115 | ) | ||||
Payment of withholding taxes on stock awards |
(2,508 | ) | (1,755 | ) | (860 | ) | ||||
Proceeds from exercises of stock options |
896 | 869 | 1,934 | |||||||
Proceeds from shares issued to ESPP |
843 | 600 | 349 | |||||||
Excess tax benefit from stock-based compensation |
1,649 | 2,649 | 3,531 | |||||||
| | | | | | | | | | | |
Net cash provided by (used in) financing activities |
459,699 | (160,466 | ) | 332,730 | ||||||
| | | | | | | | | | | |
Net increase (decrease) in cash and cash equivalents |
(21,646 | ) | 15,500 | (3,521 | ) | |||||
Cash and cash equivalents-beginning of period |
28,467 | 12,967 | 16,488 | |||||||
| | | | | | | | | | | |
Cash and cash equivalents-end of period |
$ | 6,821 | $ | 28,467 | $ | 12,967 | ||||
| | | | | | | | | | | |
| | | | | | | | | | | |
| | | | | | | | | | | |
See notes to consolidated financial statements.
F-9
KAPSTONE PAPER AND PACKAGING CORPORATION
NOTES TO CONSOLIDATED FINANCIAL STATEMENTS
($ in thousands, except share and per share amounts)
1. Description of Business and Basis of Presentation
KapStone Paper and Packaging Corporation, or the "Company," produces and sells a variety of containerboard, corrugated products and specialty paper products in the United States and globally. The Company was incorporated on April 15, 2005 in Delaware.
On June 1, 2015, the Company acquired 100 percent of the partnership interests in Victory Packaging, L.P. and its subsidiaries ("Victory"), and on July 18, 2013, the Company acquired 100 percent of the stock of Longview Fibre Paper and Packaging, Inc. ("Longview"). As a result of the Victory and Longview acquisitions, the accompanying consolidated financial statements are not comparative. The accompanying consolidated financial statements include the results of Victory and Longview since the date of the respective acquisitions (see Note 3—"Victory Acquisition" and Note 4—"Longview Acquisition").
Due to the recent adoption of ASU 2015-17, "Balance Sheet Classification of Deferred Taxes" $2.0 million was reclassified in 2014 from net current deferred income tax liability to net non-current deferred income tax liability to conform to current presentation.
Principles of Consolidation—The consolidated financial statements have been prepared on the accrual basis of accounting in conformity with accounting principles generally accepted in the United States of America ("U.S. GAAP"). The consolidated financial statements include the accounts of the Company and its subsidiaries. All significant intercompany accounts and transactions have been eliminated.
Use of Estimates—The preparation of financial statements and related disclosures requires management to make estimates and assumptions that affect the amounts reported in the consolidated financial statements and accompanying notes. Although these estimates are based on management's best knowledge of current events and actions that the Company may undertake in the future, actual results may be different from the estimates.
Recently Adopted Accounting Pronouncements—During November 2015, the FASB issued ASU 2015-17, "Balance Sheet Classification of Deferred Taxes", which simplifies the presentation of deferred income taxes. This ASU requires that deferred tax assets and liabilities be classified as non-current in a statement of financial position. We early adopted ASU 2015-17 effective December 31, 2015 and applied it on a retrospective basis.
In May 2015, the FASB issued ASU 2015-07, "Fair Value Measurement (Topic 820): Disclosures for Investments in Certain Entities That Calculate Net Asset Value per Share (or Its Equivalent)". This guidance impacts reporting entities that measure an investment's fair value using the net asset value per share (or an equivalent) practical expedient. The amendments in ASU No. 2015-07 eliminate the requirement to classify the investment within the fair value hierarchy. In addition, the requirement to make specific disclosures for all investments eligible to be assessed at fair value with the net asset value per share practical expedient has been removed. Instead, such disclosures are restricted only to investments that the entity has decided to measure using the practical expedient.
For public entities, the amendments are effective for fiscal years beginning after December 15, 2015, and the interim periods within, and are applied retrospectively to all periods offered. Early application is permitted. The Company has adopted this ASU for its fiscal year ending December 31, 2015, and has retrospectively eliminated investments in which fair value is assessed through the net
F-10
KAPSTONE PAPER AND PACKAGING CORPORATION
NOTES TO CONSOLIDATED FINANCIAL STATEMENTS (Continued)
($ in thousands, except share and per share amounts)
1. Description of Business and Basis of Presentation (Continued)
asset value per share practical expedient from the fair value hierarchy for all periods presented. See Note 10—"Pension and Postretirement Benefits".
In September 2015, the FASB issued ASU 2015-16, "Business Combinations (Topic 805): Simplifying the Accounting for Measurement-Period Adjustments", which eliminates the requirement for an acquirer in a business combination to account for measurement-period adjustments retrospectively. Instead, acquirers must recognize measurement-period adjustments during the period in which they determine the amounts, including the effect on earnings of any amounts they would have recorded in previous periods if the accounting had been completed at the acquisition date. The ASU is effective for public business entities for fiscal years beginning after 15 December 2015, and interim periods within those fiscal years. Early adoption is permitted. The Company has adopted this ASU for its fiscal year ending December 31, 2015.
2. Significant Accounting Policies
Revenue Recognition—Revenue is recognized when the customer takes title and assumes the risks and rewards of ownership, when the price is fixed and determinable and when collectability is reasonably assured. Sales with terms f.o.b. (free on board) shipping point are recognized at the time of shipment. For sales transactions with terms f.o.b. destination, revenue is recorded when the product is delivered to the customer's site and when title and risk of loss are transferred. Sales on consignment are recognized in revenue at the earlier of the month that the goods are consumed or after a period of time subsequent to receipt by the customer as specified by contract terms, provided all other revenue recognition criteria is met. Incentive rebates are typically paid in cash and are netted against revenue on an accrual basis as qualifying purchases are made by the customer to earn and thereby retain the rebate. During 2015, 2014, and 2013, customer rebates totaled $32.7 million, $28.3 million and $26.2 million, respectively.
Freight charged to customers is recognized in net sales.
Cost of Sales—Cost of sales includes material, labor and overhead costs, but excludes depreciation and amortization. Proceeds received from the sale of by-products generated from the paper and packaging manufacturing process are reflected as a reduction to cost of sales. Income from sales of by-products is derived primarily from the sale of tall oil, hardwood, turpentine and waste bales to third parties. During 2015, 2014 and 2013, cost of sales was reduced by $36.1 million, $35.8 million and $32.3 million, respectively for these by-product sales.
Freight and Distribution Expenses—Freight and distribution includes shipping and handling costs for product sold to customers and is excluded from cost of sales.
Planned Maintenance Outage Costs—The Company recognizes the cost of maintenance activities in the period in which they occur under the direct expense method in accordance with ASC 360, Property, Plant and Equipment. The Company performs planned maintenance outages at its paper mills. Costs of approximately $37.4 million, $36.1 million and $24.9 million related to planned maintenance outages are included in cost of sales for the years ended December 31, 2015, 2014 and 2013, respectively.
Net Income per Common Share—Basic net income per share is based on the weighted average number of common shares outstanding during the period. Diluted income per share reflects the
F-11
KAPSTONE PAPER AND PACKAGING CORPORATION
NOTES TO CONSOLIDATED FINANCIAL STATEMENTS (Continued)
($ in thousands, except share and per share amounts)
2. Significant Accounting Policies (Continued)
potential dilution assuming common shares were issued for the exercise of outstanding in-the-money stock options and unvested restricted stock awards and assuming the proceeds thereof were used to purchase common shares at the average market price during the period such awards were outstanding and inclusion of such shares is dilutive to net income per share.
Concentrations of Risk—Financial instruments that potentially expose the Company to concentrations of credit and market risk consist primarily of cash and cash equivalents and trade accounts receivable from sales of product to third parties. When excess cash and cash equivalents are invested they are placed in investment grade commercial paper.
No customer accounted for more than 10 percent of consolidated net sales in 2015, 2014 and 2013. In order to mitigate credit risk, the Company obtains letters of credit for certain export customers. For the years ended December 31, 2015, 2014 and 2013, net sales to US based customers were 82 percent, 80 percent and 80 percent, respectively, of consolidated net sales. Net sales to foreign based customers during 2015, 2014 and 2013 were 18 percent, 20 percent and 20 percent, respectively, of consolidated net sales. See Note 16—"Segment Information".
The Company establishes its allowance for doubtful accounts based upon factors mainly surrounding the credit risks of specific customers and other related information. Once an account is deemed uncollectible, it is written off. At December 31, 2015, 2014 and 2013 changes to the allowance for doubtful accounts are summarized as follows ($000's):
Year ended:
|
Balance at beginning of year |
Acquisition | Charged to Expense |
Write-offs | Balance at end of year |
|||||||||||
|---|---|---|---|---|---|---|---|---|---|---|---|---|---|---|---|---|
December 31, 2015 |
$ | 285 | $ | 742 | $ | 368 | $ | (311 | ) | $ | 1,084 | |||||
December 31, 2014 |
$ | 682 | $ | — | $ | 217 | $ | (614 | ) | $ | 285 | |||||
December 31, 2013 |
$ | 96 | $ | — | $ | 607 | $ | (21 | ) | $ | 682 | |||||
Foreign Currency Transactions—The Company invoices certain European customers in Euros and Mexican customers in Pesos. Outstanding amounts for such transactions are translated into U.S. dollars at the year-end rate of exchange and statements of comprehensive income items are remeasured at the weighted average exchange rates for the period. Gains and losses arising from these transactions are included in foreign exchange gains / (losses) within the Consolidated Statements of Comprehensive Income.
Cash and Cash Equivalents—Cash equivalents include all highly liquid investments with maturities of three months or less when purchased.
Fair value of Financial Instruments—The Company's cash and cash equivalents, trade accounts receivables and accounts payables are financial assets and liabilities with carrying values that approximate fair value. The Company's variable rate term loans and short-term borrowing are financial liabilities with fair values that approximate their carrying value of $1.6 billion. See Note 9—"Short-term Borrowings and Long-term debt".
Inventories—Inventories are valued at the lower of cost or market; whereby cost includes all direct and indirect materials, labor and manufacturing overhead, less by-product recoveries. Costs of raw
F-12
KAPSTONE PAPER AND PACKAGING CORPORATION
NOTES TO CONSOLIDATED FINANCIAL STATEMENTS (Continued)
($ in thousands, except share and per share amounts)
2. Significant Accounting Policies (Continued)
materials, work-in-process, and finished goods are determined using the first-in, first-out method for the legacy KapStone locations. Replacement parts and other supplies are stated using the average cost method. Purchases and sales of inventory with the same counterparty that are entered into in contemplation of one another are combined and recorded as exchanges of inventory measured at the book value of the item exchanged.
In conjunction with the Longview acquisition, KapStone acquired Longview's inventories which were stated at fair value. Cost for the Longview inventories is determined on a last-in, first-out method except for replacement parts and supplies inventories, which are valued using the average cost method.
In conjunction with the Victory Acquisition, KapStone acquired Victory's inventories which were stated at fair value as of the acquisition date. The cost for the Victory inventories is stated at the lower cost or market and is determined under the first-in, first-out method.
Plant, Property, and Equipment, net—Plant, property, and equipment are stated at cost less accumulated depreciation. Property, plant, and equipment acquired in acquisitions were recorded at fair value on the date of acquisition. Depreciation is computed using the straight-line method over the assets' estimated useful lives. The range of estimated useful lives is as follows:
| |
Years | |||
|---|---|---|---|---|
Land improvements |
3 - 25 | |||
Buildings |
11 - 40 | |||
Machinery and equipment |
3 - 30 | |||
Furniture and office equipment |
5 - 10 | |||
Computer hardware and software |
3 - 5 | |||
The Company accounts for costs incurred for the development of software for internal use in accordance with ASC 350 Intangibles—Goodwill and Other. This standard requires the capitalization of certain costs incurred in connection with developing or obtaining internal use software.
Goodwill and Intangible Assets—Goodwill is the excess of purchase price over the fair value of the net assets of businesses acquired. On an annual basis and in accordance with ASC 350, Intangibles—Goodwill and Other, the Company evaluates goodwill using a quantitative or qualitative assessment to determine whether it is more likely than not that fair value of any reporting unit is less than it carrying amount. If the Company determines that the fair value of the reporting unit may be less than its carrying amount, the Company evaluates goodwill using a two-step impairment test. Otherwise, the Company concludes that no impairment is indicated and does not perform the two-step impairment test.
If the qualitative assessment concludes that the two-step impairment test is necessary, the first step is to compare the book value of the reporting unit, including goodwill, with its fair value. A reporting unit is an operating segment or one level below an operating segment (referred to as a "component"). A component is considered a reporting unit for purposes of goodwill testing if the component constitutes a business for which discrete financial information is available and segment management regularly reviews the operating results of that component. The Company has identified three reporting units. The fair value is estimated based on a market approach and a discounted cash flow analysis, also
F-13
KAPSTONE PAPER AND PACKAGING CORPORATION
NOTES TO CONSOLIDATED FINANCIAL STATEMENTS (Continued)
($ in thousands, except share and per share amounts)
2. Significant Accounting Policies (Continued)
known as the income approach, and is reconciled back to the current market capitalization for the Company to ensure that the implied control premium is reasonable. A discounted cash flow analysis requires the Company to make various judgmental assumptions, including assumptions about future cash flows, growth rates and discount rates. The assumptions about future cash flows and growth rates are based on the forecast and long-term business plans of each reporting unit. Discount rate assumptions are considered Level 3 inputs in the fair value hierarchy defined in ASC 820, Fair Value Measurements and Discounts. Management also considers market-multiple information to corroborate the fair value conclusions reached using the discounted cash flow analysis. If necessary, the second step of the goodwill impairment test compares the implied fair value of the reporting unit's goodwill with the carrying amount of that goodwill. The implied fair value of goodwill is determined in the same manner as the amount of goodwill recognized in a business combination. The Company's goodwill impairment analysis is performed annually at the beginning of the fourth quarter and did not result in an impairment charge for any periods presented.
Intangible assets acquired in a business combination or asset purchase are initially valued at the fair market value using generally accepted valuation methods appropriate for the type of the intangible asset. Definite-lived intangible assets are amortized over their estimated useful lives and are reviewed for impairment if indicators of impairment arise. The evaluation of the impairment is based upon a comparison of the carrying amount of the intangible asset to the estimated future undiscounted cash flows expected to be generated by the asset. If the estimated undiscounted future cash flows are less than the carrying amount of the assets, the asset is considered to be impaired. If impaired, the intangible asset is written down to estimated fair market value.
Pension and Postretirement Benefits—The Company provides pension and postretirement benefits to certain employees and accounts for these benefits in accordance with ASC 715, Compensation—Retirement Benefits. For financial reporting purposes, long-term assumptions are developed through consultations with actuaries. Such assumptions include the expected long-term rate of return on plan assets, discount rates, health care trend rates and mortality rates. The discount rate for the current year is based on long-term high quality bond rates.
The amount of unrecognized actuarial gains and losses recognized in the current year's operations is based on amortizing the unrecognized gains or losses for each plan that exceed the larger of 10% of the projected benefit obligation or the fair value of plan assets, also known as the corridor. The amount of unrecognized gain or loss that exceeds the corridor is amortized over the average future service of the plan participants. While we believe that our assumptions are appropriate, significant differences in our actual experience or significant changes in our assumptions may materially affect our pension and other postretirement benefit obligations and our future expense.
Income Taxes—The Company accounts for income taxes under the liability method in accordance with ASC 740, Income Taxes. Accordingly, deferred income taxes are provided for the future tax consequences attributable to differences between the carrying amounts of assets and liabilities for financial reporting and income tax purposes. Deferred tax assets and liabilities are measured using tax rates in effect for the year in which those temporary differences are expected to be recovered or settled. A valuation allowance is established when necessary to reduce deferred tax assets to the amount that is more likely than not to be realized. The Company recognizes the benefit of tax positions
F-14
KAPSTONE PAPER AND PACKAGING CORPORATION
NOTES TO CONSOLIDATED FINANCIAL STATEMENTS (Continued)
($ in thousands, except share and per share amounts)
2. Significant Accounting Policies (Continued)
when it is more likely than not to be sustained on its technical merits. The Company records interest and penalties on unrecognized tax benefits in the provision for income taxes.
Amortization of Debt Issuance Costs—The Company capitalizes costs incurred in connection with borrowings or establishment of credit facilities. These costs are amortized over the life of the borrowing or life of the credit facility using the effective interest method. For the years ended December 31, 2015, 2014 and 2013, $5.5 million, $5.7 million and $4.5 million, respectively, of debt issuance costs have been amortized and recognized within interest expense, net.
In December 2015 and 2014, the Company recorded losses on debt extinguishment of $1.2 million and $5.6 million, respectively, due to voluntary prepayments totaling $103.5 million and $325.0 million, respectively, on the term loans under the Company's senior secured credit facility.
Stock Based Compensation Expense—The Company accounts for employee stock and stock-based compensation in accordance with ASC 718, Compensation—Stock Compensation. Accordingly, compensation expense for the fair value of stock options, as determined on the date of grant, is recorded on an accelerated basis over the awards' vesting periods. The compensation expense for the fair value of restricted stock units, as determined on the date of grant, is recorded on a straight-line basis over the awards' vesting periods. Forfeitures are estimated on the date of grant and revised if actual or expected forfeiture activity differs materially from the original estimate.
Segment Information—Prior to the acquisition of Victory on June 1, 2015, we manufactured and sold packaging products and reported the Company's consolidated results as one segment. In connection with the acquisition, we began reporting in two segments: Paper and Packaging and Distribution. These segments represent distinct businesses that are managed separately because of differing products and services. Each of these businesses requires distinct operating and marketing strategies.
The Paper and Packaging segment produces containerboard, corrugated products and specialty paper which are sold to customers who convert our products into end-market finished products or internally to corrugating plants that produce a wide variety of products ranging from basic corrugated shipping containers to specialized packaging.
The Distribution segment, which operates under the Victory and Golden State Container trade names, provides its customers comprehensive packaging solutions and services and distributes primarily corrugated packaging materials, as well as other specialty packaging materials, such as plastics, wood, void fill, tapes and stretch wraps.
Recent Accounting Pronouncements
In May 2014, the Financial Accounting Standards Board ("FASB") issued Accounting Standards Update ("ASU") No. 2014-09 "Revenue from Contracts with Customers". The guidance in this update affects any entity that either enters into contracts with customers to transfer goods or services or enters into contracts for the transfer of nonfinancial assets unless those contracts are within the scope of other standards (for example, insurance contracts or lease contracts). The guidance in this update supersedes the revenue recognition requirements in Accounting Standards Codification ("ASC") Topic 605, "Revenue Recognition", and most industry-specific guidance throughout the Industry Topics of the
F-15
KAPSTONE PAPER AND PACKAGING CORPORATION
NOTES TO CONSOLIDATED FINANCIAL STATEMENTS (Continued)
($ in thousands, except share and per share amounts)
2. Significant Accounting Policies (Continued)
Codification. Additionally, this update supersedes some cost guidance included in Subtopic 605-35, "Revenue Recognition—Construction-Type and Production-Type Contracts". For a public entity, the amendments are effective for annual reporting periods beginning after December 15, 2016, including interim periods within that reporting period. In July 2015, the FASB approved a one-year deferral of the effective date for its new revenue standard for public and nonpublic entities reporting under GAAP. The standard will be effective for public entities for annual reporting periods beginning after December 15, 2017 and interim periods therein. Additionally the FASB approved the option to early adopt up to the original effective date (fiscal years beginning after December 15, 2016). We are currently evaluating the impact that the adoption of ASU 2014-09 will have on our financial condition, results of operations and disclosures.
In April 2015, the FASB issued ASU 2015-03, "Simplifying the Presentation of Debt Issuance Costs", which changes the presentation of debt issuance costs in financial statements. ASU 2015-03 requires an entity to present such costs in the balance sheet as a direct deduction from the related debt liability rather than as an asset. Amortization of the costs will continue to be reported as interest expense. It is effective for annual reporting periods beginning after December 15, 2015. Early adoption is permitted. The new guidance will be applied retrospectively to each prior period presented. The Company does not expect the adoption of this standard to have a material impact on its consolidated balance sheets.
In August 2015, the FASB issued ASU 2015-15, "Interest—Imputation of Interest" which relates to the presentation of debt issuance costs. This standard clarifies the guidance set forth in FASB ASU 2015-03, which required that debt issuance costs related to a recognized debt liability be presented on the balance sheet as a direct deduction from the debt liability rather than as an asset. The new pronouncement clarifies that debt issuance costs related to line-of-credit arrangements could continue to be presented as an asset and be subsequently amortized over the term of the line-of-credit arrangement, regardless of whether there are any outstanding borrowings on the arrangement. The Company does not expect the adoption of this standard to have a material impact on its consolidated balance sheets.
3. Victory Acquisition
On June 1, 2015, the Company purchased 100 percent of the partnership interests in Victory for $615.0 million in cash and $2.0 million for working capital adjustments. Of the purchase price, $40.0 million was placed into escrow to fund certain limited indemnity obligations of Victory. Victory, headquartered in Houston, TX, is a North American distributor of packaging materials.
The Company will also be obligated to pay up to an additional $25.0 million of contingent consideration to the former owners of Victory if certain financial performance criteria are satisfied during the thirty month period following the closing. The Company used a present value analysis to determine the fair value of the contingent consideration of $9.6 million as of June 1, 2015 and $13.3 million as of December 31, 2015. The contingent consideration is included in other non-current liabilities on the Company's Consolidated Balance Sheets and its fair value is categorized as Level 3 within the fair value hierarchy. This analysis considers, among other items, the financial forecasts of future operating results of Victory, the probability of reaching the forecast, and the associated discount rate. The $3.7 million increase in the contingent consideration from June 1, 2015 to December 31, 2015 is included in selling, general and administrative expenses on the Consolidated Statement of Comprehensive Income.
F-16
KAPSTONE PAPER AND PACKAGING CORPORATION
NOTES TO CONSOLIDATED FINANCIAL STATEMENTS (Continued)
($ in thousands, except share and per share amounts)
3. Victory Acquisition (Continued)
The acquisition was financed by borrowings under a Second Amended and Restated Credit Agreement dated June 1, 2015 as amended from time to time, the Credit Agreement, which provides for a senior secured credit facility (the "Credit Facility") in an initial aggregate principal amount of $1.915 billion, consisting of a Term Loan A-1 in the aggregate amount of $940.0 million, a Term Loan A-2 in the aggregate amount of $475.0 million, and a $500.0 million revolving credit facility ("Revolver"), which includes an accordion feature that provides for, subject to certain terms and conditions, up to $600.0 million of additional commitments. A portion of the funds borrowed under the Credit Facility were used to pay $10.6 million of debt issuance costs. See Note 9, "Short-term Borrowings and Long-term Debt", for more information on the Credit Agreement and Credit Facility.
The Victory acquisition represented an opportunity to acquire a distributor of packaging products with a strong historical growth track record and meaningful expected synergies with the Company's paper mills and corrugated products manufacturing plants.
Transaction fees and expenses for the Victory acquisition related to due diligence, advisory and legal services have been expensed as incurred. These costs were $2.9 million for the year ended December 31, 2015 and were recorded as selling, general and administrative expenses in the Consolidated Statements of Comprehensive Income.
The Victory acquisition was accounted for in accordance with the provisions of ASC 805, Business Combinations, and the accompanying consolidated financial statements include the results of Victory since June 1, 2015. The Company used third-party appraisals to assist in determining the fair market value for acquired tangible and intangible assets and a contingent earnout arrangement. Changes to these allocations may occur as additional information becomes available. The appraisal process for determining the fair value of the acquired assets included a valuation of the acquired assets with a consideration of the three traditional valuation approaches to fair value: cost, market and income. A cost valuation approach was used for equipment and the income valuation approach was used for intangible assets.
The excess of the purchase price paid at the time of the acquisition over the aggregate estimated fair value of net assets acquired was allocated to goodwill. The current purchase price allocation is as follows:
Purchase price |
$ | 615,000 | ||
Working capital adjustments |
2,046 | |||
| | | | | |
Cash paid |
$ | 617,046 | ||
Fair value of contingent consideration |
9,600 | |||
| | | | | |
Total acquisition consideration |
$ | 626,646 | ||
| | | | | |
| | | | | |
| | | | | |
F-17
KAPSTONE PAPER AND PACKAGING CORPORATION
NOTES TO CONSOLIDATED FINANCIAL STATEMENTS (Continued)
($ in thousands, except share and per share amounts)
3. Victory Acquisition (Continued)
The following table summarizes the allocation of the Victory acquisition consideration to the fair value of the assets acquired and liabilities assumed at the date of acquisition, as well as adjustments made during 2015 (referred to as "measurement period adjustments"):
| |
Amounts Recognized at Acquisition Date(1) |
Mesurement Period Adjustments(2) |
Amounts Recognized as of Acquisition Date (as Adjusted) |
|||||||
|---|---|---|---|---|---|---|---|---|---|---|
Trade accounts receivable |
$ | 144,497 | $ | (408 | ) | $ | 144,089 | |||
Other receivables |
4,302 | 4,302 | ||||||||
Inventories |
90,542 | (254 | ) | 90,288 | ||||||
Prepaid expenses and other current assets |
1,746 | 2,897 | 4,643 | |||||||
Plant, property and equipment |
18,865 | (794 | ) | 18,071 | ||||||
Other assets |
3,104 | 3,104 | ||||||||
Intangible assets |
257,700 | 100 | 257,800 | |||||||
Accounts payable |
(47,795 | ) | (47,795 | ) | ||||||
Accrued expenses |
(6,905 | ) | (2,897 | ) | (9,802 | ) | ||||
Accrued compensation costs |
(8,778 | ) | (8,778 | ) | ||||||
Other noncurrent liabilities |
(17 | ) | (17 | ) | ||||||
Goodwill |
167,703 | 3,038 | 170,741 | |||||||
| | | | | | | | | | | |
Total acquisition consideration |
$ | 624,964 | $ | 1,682 | $ | 626,646 | ||||
| | | | | | | | | | | |
| | | | | | | | | | | |
| | | | | | | | | | | |
- (1)
- Preliminary
allocation of Victory acquisition consideration to the fair value of the assets acquired and liabilities assumed at the date of acquisition.
- (2)
- The
measurement period adjustments include the following:
- •
- Property, plant and equipment were adjusted downward by $0.8 million as accounting policies were aligned across the Company.
- •
- Trade accounts receivable and inventory were adjusted by $0.4 million and $0.3 million, respectively, resulting from
minor adjustments to management estimates.
- •
- Certain prepaid expenses and liability amounts have been reclassified to conform to the Company's accounting policies.
The acquisition of Victory resulted in the recognition of $170.7 million of goodwill. Goodwill represents expected synergies with the Company's existing operations by transferring 115,000 tons of corrugated products currently being produced by Victory's existing suppliers to the Company's paper mills and corrugated products manufacturing plants. All of the goodwill recognized from the transaction is deductible for tax purposes.
F-18
KAPSTONE PAPER AND PACKAGING CORPORATION
NOTES TO CONSOLIDATED FINANCIAL STATEMENTS (Continued)
($ in thousands, except share and per share amounts)
3. Victory Acquisition (Continued)
The following table summarizes the acquired identified intangible assets and their respective fair values and estimated useful lives at the date of acquisition:
| |
Estimated Useful Life in Years |
Fair Value | ||||
|---|---|---|---|---|---|---|
Customer relationships |
14 | $ | 210,000 | |||
Definite-lived trademarks |
10 - 25 | 33,500 | ||||
Favorable / unfavorable leases |
6 | 11,200 | ||||
Non-compete agreements |
3 - 5 | 3,100 | ||||
| | | | | | | |
Total fair value of intangible assets |
$ | 257,800 | ||||
| | | | | | | |
| | | | | | | |
| | | | | | | |
The customer relationships were valued using the excess earnings method under the income approach. This method reflects the present value of the projected cash flows that are expected to be generated by the customer relationships, less charges representing the contribution of other assets to those cash flows, and an appropriate discount rate to reflect the time value and risk associated with the cash flows. The discount rate applied to the customer relationships' cash flow reflects the risk of the cash flows of the business plus a premium for the risk inherent in intangible assets. The Company utilized a discount rate of 15.0 percent in the valuation of the customer relationships. The 14 year term for customer relationships reflects the period of time at which the present value of cash flows are expected to approximate 90% of the initial value.
The fair value of the acquired identified intangible assets is amortized on a straight-line basis over the remaining useful life. The estimated amortization expense for the next five years is as follows:
2016 |
$ | 19,088 | ||
2017 |
19,088 | |||
2018 |
19,078 | |||
2019 |
18,969 | |||
2020 |
18,617 | |||
Thereafter |
151,825 | |||
| | | | | |
Total |
$ | 246,665 | ||
| | | | | |
| | | | | |
| | | | | |
Since the June 1, 2015 acquisition date, the Company's consolidated statement of comprehensive income for the year ended December 31, 2015 includes $582.9 million of net sales and $20.7 million of operating income from the Victory operations.
The following unaudited pro forma consolidated results of operations assume that the acquisition of Victory occurred as of January 1, 2014. The unaudited pro forma consolidated results include the accounting effects of the business combination, including the application of the Company's accounting policies, amortization of intangible assets and depreciation of equipment related to fair value adjustments, interest expense on acquisition related debt, elimination of intercompany sales and income tax effects of the adjustments. The pro forma adjustments are directly attributable to the Victory acquisition, factually supportable and are expected to have a continuing impact on the Company's
F-19
KAPSTONE PAPER AND PACKAGING CORPORATION
NOTES TO CONSOLIDATED FINANCIAL STATEMENTS (Continued)
($ in thousands, except share and per share amounts)
3. Victory Acquisition (Continued)
combined results. Unaudited pro forma data is based on historical information and does not necessarily reflect the actual results that would have occurred, nor is it indicative of future results of operations.
| |
Years Ended December 31, (unaudited) |
||||||
|---|---|---|---|---|---|---|---|
| |
2015 | 2014 | |||||
Net sales |
$ | 3,166,725 | $ | 3,247,218 | |||
Net income |
$ | 105,466 | $ | 172,954 | |||
Net income per share—diluted |
$ | 1.08 | $ | 1.77 | |||
4. Longview Acquisition
On July 18, 2013, the Company acquired 100 percent of the stock of Longview for $1.025 billion plus $41.5 million of working capital adjustments. Longview is a leading manufacturer of high quality containerboard, kraft papers, and corrugated products. Longview's operations include a paper mill located in Longview, Washington equipped with five paper machines which have the capacity to produce 1.3 million tons of containerboard and kraft paper annually. Longview also owns seven corrugated products manufacturing plants located in the Pacific Northwest.
The excess of the purchase price over the aggregate estimated fair value of net assets acquired was allocated to goodwill. The goodwill is not deductible for income tax purposes.
The following unaudited pro forma consolidated results of operations assume that the acquisition of Longview occurred as of January 1, 2012. The unaudited pro forma consolidated results includes the accounting effects of the business combination, including the application of the Company's accounting policies, amortization of intangible assets and depreciation of property, plant and equipment related to fair value adjustments, interest expense on acquisition related debt, elimination of intercompany sales and income tax effects of the adjustments. The pro forma adjustments are directly attributable to the Longview acquisition, factually supportable and are expected to have a continuing impact on the Company's combined results. Unaudited pro forma data is based on historical information and does not necessarily reflect the actual results that would have occurred, nor is it indicative of future results of operations.
| |
Year Ended December 31, 2013 |
|||
|---|---|---|---|---|
| |
(unaudited) |
|||
Net sales |
$ | 2,237,677 | ||
Net income |
$ | 157,367 | ||
F-20
KAPSTONE PAPER AND PACKAGING CORPORATION
NOTES TO CONSOLIDATED FINANCIAL STATEMENTS (Continued)
($ in thousands, except share and per share amounts)
5. Inventories
Inventories consist of the following at December 31, 2015 and 2014, respectively:
| |
December 31, | ||||||
|---|---|---|---|---|---|---|---|
| |
2015 | 2014 | |||||
Raw materials |
$ | 101,250 | $ | 99,390 | |||
Work in process |
6,165 | 3,634 | |||||
Finished goods |
149,774 | 63,639 | |||||
Replacement parts and supplies |
79,717 | 70,026 | |||||
| | | | | | | | |
Inventory at FIFO costs |
336,906 | 236,689 | |||||
LIFO inventory reserves |
(1,003 | ) | 1,640 | ||||
| | | | | | | | |
Inventories |
$ | 335,903 | $ | 238,329 | |||
| | | | | | | | |
| | | | | | | | |
| | | | | | | | |
At December 31, 2015 and 2014, finished goods inventory included inventory consigned to third parties totaling $13.6 million and $11.9 million, respectively.
At December 31, 2015, finished goods inventory included $83.2 million related to Victory. Victory's inventory is stated at the lower cost or market. Cost is determined under the first-in, first-out method.
6. Plant, Property and Equipment, net
Plant, property and equipment, net consist of the following at December 31, 2015 and 2014, respectively:
| |
December 31, | ||||||
|---|---|---|---|---|---|---|---|
| |
2015 | 2014 | |||||
Land and land improvements |
$ | 75,033 | $ | 74,434 | |||
Buildings and leasehold improvements |
158,274 | 151,542 | |||||
Machinery and equipment |
1,650,430 | 1,529,715 | |||||
Construction-in-process |
53,655 | 43,246 | |||||
| | | | | | | | |
|
1,937,392 | 1,798,937 | |||||
Less accumulated depreciation and amortization |
531,246 | 412,267 | |||||
| | | | | | | | |
Plant, property, and equipment, net |
$ | 1,406,146 | $ | 1,386,670 | |||
| | | | | | | | |
| | | | | | | | |
| | | | | | | | |
Depreciation expense for the years ended December 31, 2015, 2014, and 2013, was $136.9 million, $122.9 million, and $86.1 million, respectively. The increase in depreciation expense for the year ended December 31, 2015 was primarily due to $5.5 million of capital spending, $6.5 million of accelerated depreciation mainly for two boilers taken out of service due to modernizing the Longview paper mill and $2.0 million from the Victory acquisition.
F-21
KAPSTONE PAPER AND PACKAGING CORPORATION
NOTES TO CONSOLIDATED FINANCIAL STATEMENTS (Continued)
($ in thousands, except share and per share amounts)
7. Goodwill and Other Intangible Assets
The following table shows changes in goodwill for the years 2015 and 2014:
| |
Paper and Packaging |
Distribution | Total Goodwill |
|||||||
|---|---|---|---|---|---|---|---|---|---|---|
Balances at December 31, 2013 |
$ | 528,515 | $ | — | $ | 528,515 | ||||
Longview acquisition |
5,336 | — | 5,336 | |||||||
| | | | | | | | | | | |
Balances at December 31, 2014 |
$ | 533,851 | $ | — | $ | 533,851 | ||||
Victory acquisition |
— | 170,741 | 170,741 | |||||||
| | | | | | | | | | | |
Balances at December 31, 2015 |
$ | 533,851 | $ | 170,741 | $ | 704,592 | ||||
| | | | | | | | | | | |
| | | | | | | | | | | |
| | | | | | | | | | | |
The following table shows changes in other intangible assets for the years 2015 and 2014:
| |
Intangible Assets, Net |
|||
|---|---|---|---|---|
Balances at December 31, 2013 |
$ | 123,745 | ||
Amortization expense |
(13,668 | ) | ||
| | | | | |
Balances at December 31, 2014 |
$ | 110,077 | ||
Victory acquisition |
257,800 | |||
Other |
2,000 | |||
Amortization expense |
(25,294 | ) | ||
| | | | | |
Balances at December 31, 2015 |
$ | 344,583 | ||
| | | | | |
| | | | | |
| | | | | |
Intangible assets other than goodwill include the following:
| |
December 31, 2015 | December 31, 2014 | |||||||||||||||||
|---|---|---|---|---|---|---|---|---|---|---|---|---|---|---|---|---|---|---|---|
| |
Gross Carrying Amount |
Accumulated Amortization |
Net Carrying Amount |
Gross Carrying Amount |
Accumulated Amortization |
Net Carrying Amount |
|||||||||||||
Definite-lived trademarks |
$ | 68,800 | $ | (28,103 | ) | $ | 40,697 | $ | 35,300 | $ | (23,276 | ) | $ | 12,024 | |||||
Customer lists and relationships |
331,204 | (41,168 | ) | 290,036 | 119,204 | (22,440 | ) | 96,764 | |||||||||||
Lease, contracts and other |
30,243 | (16,393 | ) | 13,850 | 15,943 | (14,654 | ) | 1,289 | |||||||||||
| | | | | | | | | | | | | | | | | | | | |
Total |
$ | 430,247 | $ | (85,664 | ) | $ | 344,583 | $ | 170,447 | $ | (60,370 | ) | $ | 110,077 | |||||
| | | | | | | | | | | | | | | | | | | | |
| | | | | | | | | | | | | | | | | | | | |
| | | | | | | | | | | | | | | | | | | | |
Amortization expense for the years ended December 31, 2015, 2014, and 2013, was $25.3 million, $13.7 million, and $9.3 million, respectively. The increase in amortization expense for the year ended December 31, 2015 was primarily due to $11.1 million from the Victory acquisition.
Estimated amortization expense for the next five years, beginning with 2016, is as follows: $32.5 million, $29.3 million, $29.3 million, $29.2 million, and $28.7 million. At December 31, 2015, the weighted average remaining useful life for trademarks is 21.3 years; customer relationships is 12 years; other contractual agreements is 6 years; and for intangible assets in total is 13 years.
F-22
KAPSTONE PAPER AND PACKAGING CORPORATION
NOTES TO CONSOLIDATED FINANCIAL STATEMENTS (Continued)
($ in thousands, except share and per share amounts)
8. Accrued Expenses
Accrued expenses consist of the following at December 31, 2015 and 2014, respectively:
| |
December 31, | ||||||
|---|---|---|---|---|---|---|---|
| |
2015 | 2014 | |||||
Real and property taxes |
$ | 14,040 | $ | 11,927 | |||
Energy costs |
10,755 | 10,969 | |||||
Capital spending |
12,767 | 3,445 | |||||
Customer rebates |
8,332 | 6,077 | |||||
Worker's compensation |
7,642 | 2,875 | |||||
Current postretirement obligation |
1,839 | 2,610 | |||||
Freight |
1,951 | 3,465 | |||||
Other accruals |
15,812 | 6,972 | |||||
| | | | | | | | |
Accrued expenses |
$ | 73,138 | $ | 48,340 | |||
| | | | | | | | |
| | | | | | | | |
| | | | | | | | |
9. Short-term Borrowings and Long-term Debt
Long-term debt consists of the following at December 31, 2015 and 2014, respectively:
| |
December 31, | ||||||
|---|---|---|---|---|---|---|---|
| |
2015 | 2014 | |||||
Term loan A-1 under Credit Agreement with interest payable monthly at LIBOR of 0.4239% plus 1.75% at December 31, 2015 |
$ | 834,250 | $ | 664,125 | |||
Term loan A-2 under Credit Agreement with interest payable monthly at LIBOR of 0.4239% plus 1.875% at December 31, 2015 |
464,313 | 231,113 | |||||
Receivable Credit Facility with interest payable monthly at LIBOR of 0.4295% plus 0.75% at December 31, 2015 |
265,614 | 167,000 | |||||
| | | | | | | | |
Total long-term debt |
1,564,177 | 1,062,238 | |||||
Less unamortized debt issuance costs |
(20,429 | ) | (16,175 | ) | |||
| | | | | | | | |
Long-term debt, net of debt issuance costs |
$ | 1,543,748 | $ | 1,046,063 | |||
| | | | | | | | |
| | | | | | | | |
| | | | | | | | |
Interest paid was $28.1 million, $27.6 million, and $20.5 million, in 2015, 2014 and 2013, respectively.
F-23
KAPSTONE PAPER AND PACKAGING CORPORATION
NOTES TO CONSOLIDATED FINANCIAL STATEMENTS (Continued)
($ in thousands, except share and per share amounts)
9. Short-term Borrowings and Long-term Debt (Continued)
The principal portion of the total long-term debt at December 31, 2015 becomes due as follows:
2016 |
$ | — | ||
2017 |
12,938 | |||
2018 |
51,750 | |||
2019 |
51,750 | |||
2020 |
998,864 | |||
2021 |
4,750 | |||
2022 |
444,125 | |||
| | | | | |
Total |
$ | 1,564,177 | ||
| | | | | |
| | | | | |
| | | | | |
Second Amended and Restated Credit Agreement
In conjunction with the Victory acquisition, the Company entered into the Second Amended and Restated Credit Agreement (as amended from time to time, the "Credit Agreement") by and among KapStone Kraft Paper Corporation, as Borrower, the Company and certain subsidiaries of Borrower from time to time party thereto, as Guarantors, the lenders from time to time party thereto, and Bank of America, N.A., as Administrative Agent, Swing Line Lender and L/C Issuer. The Credit Agreement, which provides for a senior secured credit facility (the "Credit Facility") in an initial aggregate principal amount of $1.915 billion, consisting of a Term Loan A-1 in the aggregate amount of $940.0 million, a Term Loan A-2 in the aggregate amount of $475.0 million, and a $500.0 million revolving credit facility (including a $75.0 million letter of credit sub-facility and a $45.0 million swing line loan sub-facility, the "Revolver"). The Credit Facility also includes an "accordion" feature that allows the Company, subject to certain terms and conditions, to increase the commitments under the Credit Facility. The aggregate amount of such increases is not limited if the Company maintains a pro forma total leverage ratio equal to or less than 2.5 to 1.0 after giving effect to any increase. To the extent the pro forma total leverage ratio of the Company is greater than 2.5 to 1.0 after giving effect to any increase, the aggregate amount of such increases is limited to $600.0 million. The incremental borrowings from the Credit Agreement, consisting of proceeds from Term Loan A-1, Term Loan A-2, and $115.0 million of borrowings under the Revolver were used to finance the Company's acquisition of Victory and pay certain transaction fees and expenses.
On February 8, 2016, the Company entered into the First Amendment ("First Amendment") to the Credit Agreement. The First Amendment modifies, among other things, the financial covenant in the Credit Agreement related to maintenance of a maximum total leverage ratio by increasing the permitted total leverage ratio for fiscal quarters ending on or prior to June 30, 2018, and it modifies certain defined terms used in the calculation of the financial covenants in a manner favorable to the Company. The First Amendment also modifies the pricing grid applicable to interest rates and the unused commitment fee under the Credit Agreement in order to provide for an additional pricing level applicable based on the total leverage ratio of the Company.
Depending on the type of borrowing, the applicable interest rate under the Credit Facility is calculated at a per annum rate equal to (a) LIBOR plus an applicable margin[,which is currently 1.75% for Term Loan A-1 Eurodollar loans, 1.875% for Term Loan A-2 Eurodollar loans and 1.75% for
F-24
KAPSTONE PAPER AND PACKAGING CORPORATION
NOTES TO CONSOLIDATED FINANCIAL STATEMENTS (Continued)
($ in thousands, except share and per share amounts)
9. Short-term Borrowings and Long-term Debt (Continued)
Revolver Eurodollar loans] or (b) the base rate that is calculated as (i) the greatest of (x) the prime rate, (y) the federal funds effective rate plus 0.50% or (z) a daily rate equal to one month LIBOR plus 1% plus (ii) an applicable margin, [which is currently 0.75% for Term Loan A-1 Eurodollar loans, 0.875% for Term Loan A-2 Eurodollar loans and 0.75% for Revolver base rate loans]. The unused portion of the Revolver is subject to an unused fee that is calculated at a per annum rate (the "Unused Fee Rate").
The applicable margin for borrowings under the Credit Facility and the Unused Fee Rate will be determined by reference to the pricing grid based on the Company's total leverage ratio. Under such pricing grid, the applicable margins for Term Loan A-1 and Revolver range from 1.00% to 2.00% for Eurodollar loans and from 0.00% to 1.00% for base rate loans, and the Unused Fee Rate range from 0.20% to 0.325%. The applicable margins for Term Loan A-2 will range from 1.125% to 2.125% for Eurodollar loans and from 0.125% to 1.25% for base rate loans.
The Company incurred approximately $10.6 million of debt issuance costs associated with the Credit Agreement, which are being amortized using the effective interest method.
Receivables Credit Facility
Under our accounts receivable securitization program (the "Securitization Program"), certain of KapStone's subsidiaries sell, on an ongoing basis without recourse, certain trade receivables (the "Receivables") and related assets to KapStone Receivables, LLC, a Delaware limited liability company and wholly owned, bankruptcy remote subsidiary of the Company ("KAR"), pursuant to a Receivables Sale Agreement dated as of September 26, 2014 (the "Receivables Sale Agreement") among the Company, as servicer, KapStone Kraft Paper Corporation, KapStone Container Corporation, KapStone Charleston Kraft LLC and Longview Fibre Paper and Packaging, Inc., as Originators (the "Originators"),, and KAR, as buyer. KAR, in turn, sells the interests in the Receivables and related assets to certain financial institutions pursuant to a Receivables Purchase Agreement (the "Receivables Purchase Agreement") among KAR, as seller, the financial institutions from time to time party thereto as purchasers (the "Purchasers"), the Company, as servicer, and (iii) Wells Fargo Bank, N.A., as administrative agent.
Pursuant to the Securitization Program, (i) the Originators will sell or contribute certain of their respective Receivables and certain related assets to KAR, a portion of the purchase price of which will be paid from the proceeds of subordinated debt advanced by the Originators to KAR, (ii) the Purchasers have committed to purchase undivided interests in the Receivables in the aggregate principal amount of up to $175.0 million, which interests shall be secured by the Receivables (the "Receivables Credit Facility"), (iii) the Company will service and administer the Receivables on behalf of KAR and (iv) the Company will provide a performance guaranty to KAR in respect of the obligations of the Originators under the Receivables Sale Agreement, including without limitation, obligations to pay purchase price credits and indemnity obligations. The Purchasers receive yield on their investments based on a spread over the LIBOR rate for each day that their investments in the Receivables are outstanding, as well as a fee calculated on the unused portion of their commitments.
In June, 2015, the parties entered into (i) Amendment No. 1 to Receivables Purchase Agreement as of June 10, 2015 (the "Amendment to Receivables Purchase Agreement") amending its Receivables
F-25
KAPSTONE PAPER AND PACKAGING CORPORATION
NOTES TO CONSOLIDATED FINANCIAL STATEMENTS (Continued)
($ in thousands, except share and per share amounts)
9. Short-term Borrowings and Long-term Debt (Continued)
Purchase Agreement and (ii) Amendment No. 1 to Receivables Sale Agreement (the "Amendment to Receivables Sale Agreement" and, together with the Amendment to Receivables Purchase Agreement, the "Amendments") as of June 10, 2015 amending its Receivables Sale Agreement.
Pursuant to the Amendments:
- •
- Victory was added as an "Originator" under the Receivables Sale Agreement;
- •
- the principal amount of undivided interests in the receivables the financial institutions that are parties to the Receivables Purchase
Agreement (the "Purchasers") are committed to purchase was increased from up to $175.0 million to up to $275.0 million; and
- •
- the "Facility Termination Date" (as defined in the Receivables Purchase Agreement) was extended from September 26, 2015 to June 8, 2016 (the date by which the Purchasers commitment to purchase receivables will terminate).
KAR is considered a wholly-owned, bankruptcy-remote variable interest entity ("VIE"). The Company has the authority to direct the activities of the VIE and, as a result, we have concluded that we maintain control of the VIE, are the primary beneficiary (as defined by accounting guidance) and, therefore, consolidate the account balances of KAR. As of December 31, 2015, $345.4 million of our receivables were sold to KAR. KAR in turn assigns a collateral interest in these receivables to a financial institution under a one-year facility (the "Receivables Credit Facility") for proceeds up to $275.0 million. The assets of KAR are not available to us until all obligations of KAR are satisfied in the event of bankruptcy or insolvency proceedings. As of December 31, 2015, the Company had $265.6 million of outstanding borrowings under its $275 million Receivables Credit Facility at an interest rate of 1.18 percent.
The Company included the Receivables Credit Facility in Long-term debt on the Consolidated Balance Sheets based on management's intent to continue to refinance this agreement until the maturity of the Term loan A-l which is June 1, 2020. The Company also has the ability to refinance this short-term obligation on a long-term basis using its Revolving Credit Facility. There are no additional requirements as to when borrowings under the Revolver would need to be repaid other than the maturity date of June 1, 2020.
The Company incurred approximately $0.2 million of debt issuance costs associated with the Amendment, which is being amortized using the effective interest method.
Revolver
As of December 31, 2015, the Company had $6.4 million outstanding under the Revolver with current availability of $476.5 million.
Debt Covenants
Our Credit Agreement governing our Credit Facility contains, among other provisions, covenants with which we must comply. The covenants limit our ability to, among other things, incur indebtedness, create additional liens on our assets, make investments, engage in mergers and acquisitions and sell any assets outside the normal course of business.
F-26
KAPSTONE PAPER AND PACKAGING CORPORATION
NOTES TO CONSOLIDATED FINANCIAL STATEMENTS (Continued)
($ in thousands, except share and per share amounts)
9. Short-term Borrowings and Long-term Debt (Continued)
As of December 31, 2015, the Company was in compliance with all applicable covenants in the Credit Agreement.
Fair Value of Debt
As of December 31, 2015, the fair value of the Company's debt approximates the carrying value of $1.6 billion as the variable interest rates re-price frequently at current market rates. The debt was valued using Level 2 inputs in the fair value hierarchy which are significant observable inputs including quoted prices for debt of similar terms and maturities. As of December 31, 2015 and 2014 our weighted-average cost of borrowings was 2.05 percent and 1.98 percent, respectively.
Other Current Borrowing
In 2015 and 2014, the Company entered into financing agreements of $6.6 million and $6.3 million, respectively, at an annual interest rates of approximately 1.70 percent for its annual property insurance premiums. 2015 agreement required the Company to pay three quarterly payments through the term of the financing agreement ending on December 31, 2015.
10. Pension and Postretirement Benefits
The Company and its subsidiaries has a defined benefit retirement plan ("Plan") for certain eligible employees.
The Plan provides benefits based on years of credited service and stated dollar level multipliers for each year of service. We also sponsor postretirement plans which provide certain medical and life insurance benefits ("other benefits") to qualifying union employees.
The liabilities for the benefit obligation for the eligible union groups are based on the collective bargaining agreements currently in effect. Current and future negotiations on collective bargaining agreements could have an effect on these liabilities.
F-27
KAPSTONE PAPER AND PACKAGING CORPORATION
NOTES TO CONSOLIDATED FINANCIAL STATEMENTS (Continued)
($ in thousands, except share and per share amounts)
10. Pension and Postretirement Benefits (Continued)
The changes in benefit obligations and Plan assets at December 31, 2015 and 2014 were:
| |
Pension Benefits | Other Benefits | |||||||||||
|---|---|---|---|---|---|---|---|---|---|---|---|---|---|
| |
2015 | 2014 | 2015 | 2014 | |||||||||
Change in Benefit Obligation |
|||||||||||||
Benefit obligation at beginning of year |
$ | 669,225 | $ | 577,706 | $ | 13,700 | $ | 20,847 | |||||
Service cost |
4,723 | 9,886 | 33 | 34 | |||||||||
Interest cost |
27,610 | 28,847 | 428 | 627 | |||||||||
Actuarial loss (gain) |
(41,465 | ) | 92,156 | (121 | ) | (4,366 | ) | ||||||
Participant contributions |
— | — | 625 | 742 | |||||||||
Benefits paid |
(34,037 | ) | (39,419 | ) | (3,251 | ) | (4,184 | ) | |||||
Plan amendment |
— | 49 | (1,996 | ) | — | ||||||||
| | | | | | | | | | | | | | |
Benefit obligation at end of year |
$ | 626,056 | $ | 669,225 | $ | 9,418 | $ | 13,700 | |||||
| | | | | | | | | | | | | | |
| | | | | | | | | | | | | | |
| | | | | | | | | | | | | | |
Change in Plan Assets |
|||||||||||||
Fair value of plan assets at beginning of year |
$ | 647,515 | $ | 645,490 | $ | — | $ | — | |||||
Actual return on plan assets |
(21,460 | ) | 37,921 | — | — | ||||||||
Employer contributions |
1,107 | 3,523 | 2,626 | 3,442 | |||||||||
Participant contributions |
— | — | 625 | 742 | |||||||||
Benefits paid |
(34,037 | ) | (39,419 | ) | (3,251 | ) | (4,184 | ) | |||||
| | | | | | | | | | | | | | |
Fair value of plan assets at end of year |
$ | 593,125 | $ | 647,515 | $ | — | $ | — | |||||
| | | | | | | | | | | | | | |
| | | | | | | | | | | | | | |
| | | | | | | | | | | | | | |
The funded status and amounts recognized in our consolidated balance sheets at December 31, 2015 and 2014 were:
| |
Pension Benefits | Other Benefits | |||||||||||
|---|---|---|---|---|---|---|---|---|---|---|---|---|---|
| |
2015 | 2014 | 2015 | 2014 | |||||||||
Funded Status at End of Year |
$ | (32,931 | ) | $ | (21,710 | ) | $ | (9,418 | ) | $ | (13,700 | ) | |
| | | | | | | | | | | | | | |
| | | | | | | | | | | | | | |
| | | | | | | | | | | | | | |
Amounts Recognized in Consolidated Balance Sheets: |
|||||||||||||
Accrued expenses |
$ | — | $ | — | $ | (1,839 | ) | $ | (2,610 | ) | |||
Pension and postretirement benefits |
(32,931 | ) | (21,710 | ) | (7,579 | ) | (11,090 | ) | |||||
| | | | | | | | | | | | | | |
Net amount recognized |
$ | (32,931 | ) | $ | (21,710 | ) | $ | (9,418 | ) | $ | (13,700 | ) | |
| | | | | | | | | | | | | | |
| | | | | | | | | | | | | | |
| | | | | | | | | | | | | | |
Amounts Recognized in Accumulated Other Comprehensive Income / (Loss)—(Pre-tax) |
|||||||||||||
Total net actuarial (gain) loss |
$ | 105,835 | $ | 86,691 | $ | (3,202 | ) | $ | (4,208 | ) | |||
Prior service cost |
117 | 392 | (2,841 | ) | (1,086 | ) | |||||||
| | | | | | | | | | | | | | |
Total |
$ | 105,952 | $ | 87,083 | $ | (6,043 | ) | $ | (5,294 | ) | |||
| | | | | | | | | | | | | | |
| | | | | | | | | | | | | | |
| | | | | | | | | | | | | | |
Weighted-Average Discount Rate Assumption used to Determine Projected Benefit Obligations at December 31, 2015 and 2014 |
4.66 | % | 4.24 | % | 4.12 | % | 3.78 | % | |||||
F-28
KAPSTONE PAPER AND PACKAGING CORPORATION
NOTES TO CONSOLIDATED FINANCIAL STATEMENTS (Continued)
($ in thousands, except share and per share amounts)
10. Pension and Postretirement Benefits (Continued)
The accumulated benefit obligation for the defined Plan was $626.1 million and $699.2 million at December 31, 2015 and 2014, respectively.
The change in our Plan funded status in 2015 is primarily due to a higher discount rate applied to the pension obligations as well as changes in mortality assumptions. In 2015, we considered the new mortality tables from the Society of Actuaries and evaluated our mortality experience to establish mortality assumptions. Based on our experience and in consultation with our actuaries, we utilized a base RP-2014 with MP-2015 projection scale. In 2014, we utilized the RP-2014 mortality tables with MP-2014 projection scale.
Components of pension benefit and other postretirement benefit (income) / costs were:
| |
Pension Benefits | Other Benefits | |||||||||||||||||
|---|---|---|---|---|---|---|---|---|---|---|---|---|---|---|---|---|---|---|---|
| |
2015 | 2014 | 2013 | 2015 | 2014 | 2013 | |||||||||||||
Service cost |
$ | 4,723 | $ | 9,886 | $ | 8,274 | $ | 33 | $ | 34 | $ | 47 | |||||||
Interest cost |
27,610 | 28,847 | 13,555 | 428 | 627 | 354 | |||||||||||||
Expected return on plan assets |
(41,082 | ) | (44,143 | ) | (20,851 | ) | — | — | — | ||||||||||
Amortization of prior service cost (benefit) |
275 | 403 | 130 | (242 | ) | (200 | ) | (200 | ) | ||||||||||
Amortization of net loss (gain) |
1,934 | — | 289 | (1,126 | ) | (11 | ) | 20 | |||||||||||
| | | | | | | | | | | | | | | | | | | | |
Benefit (income)/cost—Company plans |
(6,540 | ) | (5,007 | ) | 1,397 | (907 | ) | 450 | 221 | ||||||||||
Pension benefit cost—multi-employer plan |
340 | 333 | 325 | — | — | — | |||||||||||||
| | | | | | | | | | | | | | | | | | | | |
Total benefit (income)/cost |
$ | (6,200 | ) | $ | (4,674 | ) | $ | 1,722 | $ | (907 | ) | $ | 450 | $ | 221 | ||||
| | | | | | | | | | | | | | | | | | | | |
| | | | | | | | | | | | | | | | | | | | |
| | | | | | | | | | | | | | | | | | | | |
Effective in 2015, Longview salaried personnel received a 401(k) contribution, under the Contribution Plan, rather than a cash balance plan contribution which was included in net pension benefit for the year ended December 31, 2014.
Weighted-Average actuarial assumptions used to determine benefit costs were:
| |
Pension Benefits | Other Benefits | |||||||||||||||||
|---|---|---|---|---|---|---|---|---|---|---|---|---|---|---|---|---|---|---|---|
| |
2015 | 2014 | 2013 | 2015 | 2014 | 2013 | |||||||||||||
Discount rate |
4.24 | % | 5.11 | % | 4.77 | % | 3.78 | % | 4.83 | % | 3.26 | % | |||||||
Long-term rate of return on plan assets |
6.50 | % | 6.98 | % | 6.25 | % | — | — | — | ||||||||||
The Company assumed health care cost trend rates for its postretirement benefits plans were as follows:
Plans
|
2016 | |||
|---|---|---|---|---|
Health care cost trend rate assumed for next year |
7.00 | % | ||
Rate to which the cost trend rate is assumed to decline (the ultimate rate) |
4.50 | % | ||
Year the rate reaches the ultimate trend rate |
2021 | |||
F-29
KAPSTONE PAPER AND PACKAGING CORPORATION
NOTES TO CONSOLIDATED FINANCIAL STATEMENTS (Continued)
($ in thousands, except share and per share amounts)
10. Pension and Postretirement Benefits (Continued)
The effect of a one percentage point increase or decrease in the assumed health care cost trend rates at December 31, 2015 is summarized below:
Change in Health Care
|
Minus 1% | Plus 1% | |||||
|---|---|---|---|---|---|---|---|
Service and interest cost |
$ | (11 | ) | $ | 12 | ||
Accumulated benefit obligation |
$ | (221 | ) | $ | 233 | ||
Other changes in Plan assets and benefit obligations recognized in accumulated other comprehensive (income) loss were:
| |
Pension Benefits | Other Benefits | |||||||||||
|---|---|---|---|---|---|---|---|---|---|---|---|---|---|
| |
2015 | 2014 | 2015 | 2014 | |||||||||
Net actuarial (gain) loss |
$ | 21,078 | $ | 98,378 | $ | (121 | ) | $ | (4,366 | ) | |||
Plan amendment |
— | 49 | — | — | |||||||||
Amortization of prior service (cost) benefit |
(276 | ) | (402 | ) | (1,754 | ) | 200 | ||||||
Amortization of net gain (loss) |
(1,934 | ) | — | 1,126 | 11 | ||||||||
| | | | | | | | | | | | | | |
Net amount recognized before tax |
$ | 18,868 | $ | 98,025 | $ | (749 | ) | $ | (4,155 | ) | |||
| | | | | | | | | | | | | | |
| | | | | | | | | | | | | | |
| | | | | | | | | | | | | | |
The amounts in accumulated other comprehensive income (loss) expected to be recognized as components of net expense during 2016 are as follows:
| |
Pension Benefits |
Other Benefits |
|||||
|---|---|---|---|---|---|---|---|
Prior service cost (benefit) |
$ | 95 | $ | (761 | ) | ||
Net actuarial loss / (gain) |
$ | 4,628 | $ | (657 | ) | ||
For pension plans, accumulated actuarial gains and losses in excess of 10 percent of the accumulated benefit obligation are amortized over the average future service period of approximately 9 years.
As of December 31, 2015 and 2014, $(63.3) million and $(52.0) million, respectively, were included net of tax in accumulated other comprehensive income (loss).
F-30
KAPSTONE PAPER AND PACKAGING CORPORATION
NOTES TO CONSOLIDATED FINANCIAL STATEMENTS (Continued)
($ in thousands, except share and per share amounts)
10. Pension and Postretirement Benefits (Continued)
Plan Assets
The fair value of Plan assets, summarized by level within the fair value hierarchy as of December 31, 2015 was as follows:
| |
Level 1 | Level 2 | Level 3 | Total | |||||||||
|---|---|---|---|---|---|---|---|---|---|---|---|---|---|
Cash and cash equivalents |
$ | 9,190 | $ | — | $ | — | $ | 9,190 | |||||
Equity securities: |
|||||||||||||
Common stock |
9,885 | — | — | 9,885 | |||||||||
Domestic equity mutual funds |
9,531 | — | — | 9,531 | |||||||||
International equity mutual funds |
49,711 | — | — | 49,711 | |||||||||
U.S. large cap collective funds |
— | 109,947 | — | 109,947 | |||||||||
Fixed income: |
|||||||||||||
Bond Funds |
10,877 | — | — | 10,877 | |||||||||
Corporate bonds and notes: |
|||||||||||||
Short-term |
— | 6,876 | — | 6,876 | |||||||||
Mid-term |
— | 31,661 | — | 31,661 | |||||||||
Long-term |
— | 157,527 | — | 157,527 | |||||||||
U.S. Government securities: |
|||||||||||||
Short-term |
— | 1,989 | — | 1,989 | |||||||||
Mid-term |
— | 2,544 | — | 2,544 | |||||||||
Long-term |
— | 81,155 | — | 81,155 | |||||||||
Limited partnership investments |
— | — | 17,048 | 17,048 | |||||||||
| | | | | | | | | | | | | | |
|
$ | 89,194 | $ | 391,699 | $ | 17,048 | $ | 497,941 | |||||
| | | | | | | | | | | | | | |
| | | | | | | | | | | | | | |
| | | | | | | | | | | | | | |
Assets measured at Net Asset Value |
|||||||||||||
Hedge funds: |
|||||||||||||
Fixed income funds |
34,218 | ||||||||||||
Equity funds |
60,966 | ||||||||||||
| | | | | | | | | | | | | | |
Total assets at fair value |
$ | 593,125 | |||||||||||
| | | | | | | | | | | | | | |
| | | | | | | | | | | | | | |
| | | | | | | | | | | | | | |
F-31
KAPSTONE PAPER AND PACKAGING CORPORATION
NOTES TO CONSOLIDATED FINANCIAL STATEMENTS (Continued)
($ in thousands, except share and per share amounts)
10. Pension and Postretirement Benefits (Continued)
The table below presents a summary of changes in the fair value of the Plans' level three assets as of December 31, 2015:
Year ended December 31, 2015
|
Limited Partnership Investments |
Total | |||||
|---|---|---|---|---|---|---|---|
Balance, beginning of year |
$ | 23,835 | $ | 23,835 | |||
Transfers into Level 3 |
— | — | |||||
Transfers out of Level 3 |
— | — | |||||
Total gains or (losses): |
|||||||
Included in changes in net assets |
240 | 240 | |||||
Included in other comprehensive income |
— | — | |||||
Purchases, issuances, sales, and settlements: |
|||||||
Purchases |
800 | 800 | |||||
Issuances |
— | — | |||||
Sales |
(7,827 | ) | (7,827 | ) | |||
Settlements |
— | — | |||||
| | | | | | | | |
Balance, end of year |
$ | 17,048 | $ | 17,048 | |||
| | | | | | | | |
| | | | | | | | |
| | | | | | | | |
The amount of total gains or losses for the year included in changes in net assets attributed to the change in unrealized gains or losses relating to assets still held at the reporting date |
$ | (1,729 | ) | $ | (1,729 | ) | |
| | | | | | | | |
| | | | | | | | |
| | | | | | | | |
F-32
KAPSTONE PAPER AND PACKAGING CORPORATION
NOTES TO CONSOLIDATED FINANCIAL STATEMENTS (Continued)
($ in thousands, except share and per share amounts)
10. Pension and Postretirement Benefits (Continued)
The fair value of Plan assets, summarized by level within the fair value hierarchy as of December 31, 2014 was as follows:
| |
Level 1 | Level 2 | Level 3 | Total | |||||||||
|---|---|---|---|---|---|---|---|---|---|---|---|---|---|
Cash and cash equivalents |
$ | 37,302 | $ | — | $ | — | $ | 37,302 | |||||
Equity securities: |
|||||||||||||
Common stock |
10,387 | — | — | 10,387 | |||||||||
Balance mutual funds |
30,795 | — | — | 30,795 | |||||||||
International equity mutual funds |
46,701 | — | — | 46,701 | |||||||||
U.S. large cap collective funds |
— | 75,709 | — | 75,709 | |||||||||
Fixed income: |
|||||||||||||
Corporate bonds and notes: |
|||||||||||||
Short-term |
— | 14,349 | — | 14,349 | |||||||||
Mid-term |
— | 35,884 | — | 35,884 | |||||||||
Long-term |
— | 159,453 | — | 159,453 | |||||||||
U.S. Government securities: |
|||||||||||||
Short-term |
— | 8,657 | — | 8,657 | |||||||||
Mid-term |
— | 8,555 | — | 8,555 | |||||||||
Long-term |
— | 65,234 | — | 65,234 | |||||||||
Limited partnership investments |
— | — | 23,835 | 23,835 | |||||||||
| | | | | | | | | | | | | | |
|
$ | 125,185 | $ | 367,841 | $ | 23,835 | $ | 516,861 | |||||
| | | | | | | | | | | | | | |
| | | | | | | | | | | | | | |
| | | | | | | | | | | | | | |
Assets measured at Net Asset Value |
|||||||||||||
Hedge funds: |
|||||||||||||
Fixed income funds |
49,201 | ||||||||||||
Equity funds |
81,453 | ||||||||||||
| | | | | | | | | | | | | | |
Total assets |
$ | 647,515 | |||||||||||
| | | | | | | | | | | | | | |
| | | | | | | | | | | | | | |
| | | | | | | | | | | | | | |
Level 1 assets are valued based on quoted prices in active markets for identical securities.
Level 2 assets are valued based on other significant observable inputs including quoted prices for similar securities, yield curves, indices, etc. Level 2 assets listed above consist primarily of commingled equity investments where values are based on the net asset value of the underlying investments held, individual fixed income securities where values are based on quoted prices of similar securities and observable market data, and commingled fixed income investments where values are based on the net asset value of the underlying investments held.
Level 3 assets are valued based on unobservable inputs. Quoted market prices are not available for certain investments, including real estate and limited partnership investments. These investments are recorded at their estimated fair market value; therefore, the reported value may differ from the value that would have been used had a quoted market price existed. Investments of this nature are valued by the Company based on the nature of each investment and the information available to management at the valuation date.
F-33
KAPSTONE PAPER AND PACKAGING CORPORATION
NOTES TO CONSOLIDATED FINANCIAL STATEMENTS (Continued)
($ in thousands, except share and per share amounts)
10. Pension and Postretirement Benefits (Continued)
Limited Partnership investments generally have limited liquidity and are made through long-term partnerships or joint ventures that invest in pools of capital invested in primarily non-publicly traded entities. Underlying investments include venture capital, buyout, and special situations investing. Private equity management firms typically acquire and then reorganize private companies to create increased long-term value. Valuation is based on statements received from the investment managers, transaction data, analysis of and judgments about underlying investments and other third-party information deemed reliable for the purposes of developing an estimate of fair market value.
Hedge funds are privately owned institutional investment funds that generally have moderate liquidity. Hedge funds seek specified levels of return, regardless of market conditions, and generally have a low correlation to public equity and debt markets. Hedge funds often invest substantially in financial market instruments (socks, bonds, commodities, currencies, derivatives, etc.) using a broad range of trading activities to manage portfolio risks. Plan holdings in hedge funds are valued using the net asset value ("NAV") provided by the administrator of the fund and reviewed by the Company. The NAV is based on the value of the underlying assets owned by the fund, minus liabilities and divided by the number of shares or units outstanding. These assets are reported at NAV as a practical expediency. For the year ended December 31, 2015, the Plan held hedge funds with restrictions on redemption for the first year after funds are invested, and funds restricting investment redemption to a 25% gate in any given quarter.
The Company believes that the reported amounts for these investments are a reasonable estimate of their fair value at December 31, 2015. However, the use of different methodologies or assumptions to determine the fair value of certain financial instruments could result in a different fair value at the reporting date.
To develop the expected long-term rate of return on plan assets assumption for the Plan, the Company considers the current asset allocation strategy, the historical investment performance, and the expectations for future returns of each asset class.
The Company's Plan weighted-average asset allocations and target asset allocations at December 31, 2015 and 2014, by asset category were as follows:
| |
2015 | 2014 | Target Allocation |
|||||||
|---|---|---|---|---|---|---|---|---|---|---|
Fixed income |
55 | % | 53 | % | 53 | % | ||||
Equity securities |
40 | % | 38 | % | 47 | % | ||||
Cash |
2 | % | 6 | % | — | % | ||||
Other |
3 | % | 3 | % | — | % | ||||
| | | | | | | | | | | |
Total |
100 | % | 100 | % | 100 | % | ||||
| | | | | | | | | | | |
| | | | | | | | | | | |
| | | | | | | | | | | |
The Company's investment strategy reflects the expectation that debt securities will outperform equity securities over the long term. Assets are invested in a prudent manner to maintain the security of funds while maximizing returns within the Company's Investment Policy guidelines. The strategy is implemented utilizing assets from the categories listed.
F-34
KAPSTONE PAPER AND PACKAGING CORPORATION
NOTES TO CONSOLIDATED FINANCIAL STATEMENTS (Continued)
($ in thousands, except share and per share amounts)
10. Pension and Postretirement Benefits (Continued)
The investment goals are to provide a total return that, over the long term, increases the ratio of Plan assets to liabilities subject to an acceptable level of risk. This is accomplished through diversification of assets in accordance with the Investment Policy guidelines. Investment risk is mitigated by periodic rebalancing between asset classes as necessitated by changes in market conditions within the Investment Policy guidelines.
The Company currently does not anticipate making any contributions in 2016. This estimate is based on current tax laws, plan asset performance, and liability assumptions, which are subject to change. The Company anticipates making contributions to the postretirement plans in 2016 as claims are submitted.
The following table presents estimated future gross benefit payments for the Company's Plans:
| |
Pension Benefits |
Other Benefits |
|||||
|---|---|---|---|---|---|---|---|
2016 |
$ | 37,334 | $ | 1,877 | |||
2017 |
37,615 | 1,480 | |||||
2018 |
38,320 | 1,192 | |||||
2019 |
39,396 | 1,028 | |||||
2020 |
40,156 | 882 | |||||
Succeeding 5 years |
206,937 | 2,281 | |||||
Postretirement Benefits Other Than Pensions
The Company provides postretirement health care insurance benefits through an indemnity plan and a health maintenance organization plan for certain salary and non-salary Longview employees and their dependents. Individual benefits generally continue until age 65. Effective for the majority of union employees active on June 1, 2010, the Company amended the plan such that postretirement health care insurance benefits terminated on December 31, 2013. The Company does not pre-fund these benefits, and, accordingly, there are no postretirement plan assets. The postretirement plan also includes a retiree contribution requirement for certain salaried and certain hourly employees. The retiree contribution amount is adjusted annually.
Multiemployer Pension Plan
In conjunction with each of the Longview and USC acquisitions, the Company assumed participation in the GCIU-Employer Retirement Fund (formerly IP&GCU—Employer Retirement Fund) (the "GCIU Fund") for hourly employees at four plant locations. The GCIU Fund is a multiemployer defined benefit retirement plan established for employers and unions in the newspaper, commercial printing, printing specialties and paper products industries that have entered into collective bargaining agreements wherein provisions are made for contributions to be made by the employers to provide retirement benefits to eligible employees or their beneficiaries.
The risks of participating in the multiemployer plan are different from single-employer plans. Unlike single employer plans, assets contributed to a multiemployer plan by one employer may be used to provide benefits to employees of other plan participants. All contributions to this plan are made
F-35
KAPSTONE PAPER AND PACKAGING CORPORATION
NOTES TO CONSOLIDATED FINANCIAL STATEMENTS (Continued)
($ in thousands, except share and per share amounts)
10. Pension and Postretirement Benefits (Continued)
solely by participating employers. As such, if a participating employer stops contributing to the plan, the Company may be liable for the related unfunded obligations. If the Company chooses to stop participating in the multiemployer plan, the Company may be required to pay the plan an amount based on the unfunded status of the plan. For more information related to the plan, the U.S. Department of Labor makes IRS filings and actuarial reports available to the public.
The contribution schedule for the multiemployer plan is determined by the collective bargaining agreements between participating employers and participating unions. The Company does not determine the actuarial present value of accumulated plan benefits, as net assets available for benefits allocable to the individual participating employers are determined by reference to the multiemployer plan's funding status as a whole. The Company makes contributions to the multiemployer plan in accordance with its contribution schedule, including employer surcharges and additional contributions resulting from the multiemployer plan's adoption of a rehabilitation plan effective November 1, 2009.
The multiemployer plan has a fiscal year end of December 31, which may impact financial information available as of December 31, 2015. The contributions made by the Company were less than 4.2 percent of the total employers' contributions to the multiemployer plan for the plan year ended December 31, 2014, the most recent date for which information was available.
| |
|
|
|
|
|
Contributions by the Company for the period Ended December 31, |
|
|
|||||||||||||||
|---|---|---|---|---|---|---|---|---|---|---|---|---|---|---|---|---|---|---|---|---|---|---|---|
| |
|
Pension Protection Act Zone Status |
|
|
Expiration Date of Collective- Bargaining Agreement |
||||||||||||||||||
| |
|
FIP / RP Status Pending / Implemented |
|
||||||||||||||||||||
| |
Federal EIN |
Surcharge Imposed |
|||||||||||||||||||||
Pension Fund
|
2015 | 2014 | 2013 | 2015 | 2014 | 2013 | |||||||||||||||||
GCIU- Employer Retirement Fund |
91-6024903 | Critical | Critical | Critical | Implemented | $ | 340 | $ | 333 | $ | 339 | Yes | Varies 6/16/2018 thru 9/27/2019 | ||||||||||
According to the audited financial statements of the multiemployer plan, the net assets available for benefits were $1,140.6 million and $1,150.0 million as of December 31, 2014 and 2013, respectively. An independent actuarial valuation calculated the actuarial present value of accumulated plan benefits to be $1,653 million and $1,655 million as of January 1, 2014 and 2013, respectively. At December 31, 2015, the Company's estimated withdrawal liability is $46.8 million and would only be incurred if the Company withdrew from the multiemployer pension plan. In accordance with ASC 715, Compensation—Retirement Benefits, this potential liability is not recognized in the Company's Consolidated Balance Sheets.
Defined Contribution Plan
We offer a 401(k) Defined Contribution Plan ("Contribution Plan") to eligible employees. The Company's monthly contributions are based on the matching of certain employee contributions or based on a union negotiated formula. The expense related to this plan was $22.3 million, $15.1 million and $12.3 million for the years ended December 31, 2015, 2014, and 2013, respectively, for the Company contributions to the Contribution Plan. The amount for the year ended December 31, 2015 includes $0.9 million attributable to Victory. Effective in 2015, Longview salaried personnel received a
F-36
KAPSTONE PAPER AND PACKAGING CORPORATION
NOTES TO CONSOLIDATED FINANCIAL STATEMENTS (Continued)
($ in thousands, except share and per share amounts)
10. Pension and Postretirement Benefits (Continued)
401(k) contribution, under the Contribution Plan, rather than a cash balance plan contribution which was included in net pension benefit for the year ended December 31, 2014.
11. Income taxes
The Company's U.S. federal statutory tax rates were 35.0 percent for each of 2015, 2014 and 2013. The Company's effective income tax rates for the years ended December 31, 2015, 2014 and 2013 were 34.2 percent, 34.0 percent and 34.7 percent, respectively.
The Company's provision for income taxes for the years ended December 31, 2015, 2014 and 2013 consists of the following:
| |
Years Ended December 31, | |||||||||
|---|---|---|---|---|---|---|---|---|---|---|
| |
2015 | 2014 | 2013 | |||||||
Income before provision for income taxes: |
||||||||||
United States |
$ | 159,790 | $ | 260,601 | $ | 194,990 | ||||
Foreign |
1,844 | — | — | |||||||
| | | | | | | | | | | |
Total |
$ | 161,634 | $ | 260,601 | $ | 194,990 | ||||
| | | | | | | | | | | |
| | | | | | | | | | | |
| | | | | | | | | | | |
Provision for income taxes: |
||||||||||
Current: |
||||||||||
US federal |
$ | 40,324 | $ | 78,105 | $ | 2,384 | ||||
State and local |
3,116 | 8,126 | 5,403 | |||||||
Foreign |
766 | — | — | |||||||
| | | | | | | | | | | |
Total current |
44,206 | 86,231 | 7,787 | |||||||
| | | | | | | | | | | |
Deferred: |
||||||||||
US federal |
10,990 | 826 | 53,404 | |||||||
State and local |
52 | 1,629 | 6,461 | |||||||
Foreign |
— | — | — | |||||||
| | | | | | | | | | | |
Total deferred |
11,042 | 2,455 | 59,865 | |||||||
| | | | | | | | | | | |
Total United States |
54,482 | 88,686 | 67,652 | |||||||
Foreign |
766 | — | — | |||||||
| | | | | | | | | | | |
Total provision for income taxes |
$ | 55,248 | $ | 88,686 | $ | 67,652 | ||||
| | | | | | | | | | | |
| | | | | | | | | | | |
| | | | | | | | | | | |
For the years ended December 31, 2015, 2014 and 2013, substantially all income was earned in the United States. For the year ended December 31, 2015, foreign earnings include results from Victory's operations in Mexico, which was acquired June 1, 2015.
Income taxes paid, net of refunds, were $65.5 million, $77.5 million and $4.0 million in 2015, 2014 and 2013, respectively.
F-37
KAPSTONE PAPER AND PACKAGING CORPORATION
NOTES TO CONSOLIDATED FINANCIAL STATEMENTS (Continued)
($ in thousands, except share and per share amounts)
11. Income taxes (Continued)
The Company's effective income tax rate differs from the statutory federal income tax rate as follows:
| |
Years Ended December 31, |
|||||||||
|---|---|---|---|---|---|---|---|---|---|---|
| |
2015 | 2014 | 2013 | |||||||
Statutory income tax rate |
35.0 | % | 35.0 | % | 35.0 | % | ||||
State income taxes, net of federal income tax benefit |
2.3 | % | 2.1 | % | 2.9 | % | ||||
Domestic manufacturing deduction |
(2.9 | )% | (3.0 | )% | (2.0 | )% | ||||
Changes in uncertain tax positions |
0.1 | % | (0.1 | )% | (2.6 | )% | ||||
Other |
(0.3 | )% | — | 1.4 | % | |||||
| | | | | | | | | | | |
Effective income tax rate |
34.2 | % | 34.0 | % | 34.7 | % | ||||
| | | | | | | | | | | |
| | | | | | | | | | | |
| | | | | | | | | | | |
The tax effects of the temporary differences that give rise to significant portions of the deferred tax assets and liabilities at December 31, 2015 and 2014, for the Company are as follows:
| |
Years Ended December 31, | ||||||
|---|---|---|---|---|---|---|---|
| |
2015 | 2014 | |||||
Deferred tax assets resulting from: |
|||||||
Accrued compensation costs |
$ | 6,631 | $ | 7,368 | |||
Pension and postretirement benefits |
16,036 | 14,450 | |||||
Stock based compensation |
9,637 | 6,073 | |||||
State tax credit and net operating loss carry-forwards |
2,354 | 1,955 | |||||
Other |
5,690 | 3,855 | |||||
| | | | | | | | |
Total deferred tax assets |
$ | 40,348 | $ | 33,701 | |||
| | | | | | | | |
Valuation allowance |
— | — | |||||
| | | | | | | | |
Net deferred tax assets |
$ | 40,348 | $ | 33,701 | |||
| | | | | | | | |
| | | | | | | | |
| | | | | | | | |
Deferred tax liabilities resulting from: |
|||||||
Depreciable assets |
(409,837 | ) | (398,072 | ) | |||
Goodwill and intangible assets |
(38,974 | ) | (37,078 | ) | |||
Other |
(10,016 | ) | (12,834 | ) | |||
| | | | | | | | |
Total deferred tax liabilities |
$ | (458,827 | ) | $ | (447,984 | ) | |
| | | | | | | | |
Net deferred tax liabilities |
$ | (418,479 | ) | $ | (414,283 | ) | |
| | | | | | | | |
| | | | | | | | |
| | | | | | | | |
The Company accounts for income taxes in accordance with ASC 740, Income Taxes, which provides that an entity shall initially recognize the financial statement effects of a tax position when it is more likely than not, based on the technical merits, that the position will be sustained upon examination. The term more likely than not means a likelihood of more than 50 percent. When measuring the tax benefit to be recorded, in concluding a tax position meets the more-likely-than-not recognition threshold we consider the amounts and probabilities of the possible outcomes that could be
F-38
KAPSTONE PAPER AND PACKAGING CORPORATION
NOTES TO CONSOLIDATED FINANCIAL STATEMENTS (Continued)
($ in thousands, except share and per share amounts)
11. Income taxes (Continued)
realized upon settlement using the facts, circumstances and information available at the reporting date. If these cumulative probabilities exceed 50 percent the tax benefit is recognized.
The Company has $8.0 million of state tax net operating loss carry-forwards, which are available to reduce future taxable income in various state jurisdictions and expire between 2016 and 2030.
The Company has $3.1 million of state tax credit carry-forwards, which expires between 2016 and 2034.
Total unrecognized tax benefits as of December 31, 2015 and December 31, 2014 were $0.5 million. Unrecognized tax benefits and related accrued interest and penalties are included in other liabilities in the accompanying Consolidated Balance Sheets. The Company does not expect a material change in its unrecognized tax benefits within the next twelve months.
In the normal course of business, the Company is subject to examination by taxing authorities. The Company's open federal tax years are 2013 and 2014. The Company has open tax years for state income tax filings generally starting in 2012.
12. Stockholder's equity
Employee Stock Purchase Plan
In December 2009, the Company established the KapStone Paper and Packaging Corporation Employee Stock Purchase Plan ("ESPP"), effective January 1, 2010. The ESPP allows for employees to purchase shares of Company stock at a five percent discount from market price. A total of 1,000,000 shares were reserved for future purchases under the ESPP (amount reflects the stock split announced in December 2013). A total of 34,413 shares and 20,488 shares were issued under the ESPP for the years ended December 31, 2015 and 2014, respectively.
Common Stock Reserved for Issuance
At December 31, 2015, approximately 5.0 million shares of common stock were reserved for issuance, including 4.2 million shares for stock awards and 0.8 million shares for the ESPP.
Cash Dividends
For the year ended December 31, 2015, we paid $38.7 million of dividends to shareholders. On December 10, 2015, the board of directors approved a quarterly cash dividend $0.10 per share, which was paid on January 12, 2016, to shareholders of record as of December 30, 2015.
Stock Split
On December 11, 2013, the board of directors declared a two-for-one stock split in the form of a stock dividend on the Company's common stock (the "stock split"). To implement the stock split, one share of common stock for each then-outstanding share of common stock was distributed on January 7, 2014 to all shareholders of record as of the close of business on December 23, 2013. The consolidated financial statements and related footnotes for all periods presented reflect the stock split.
F-39
KAPSTONE PAPER AND PACKAGING CORPORATION
NOTES TO CONSOLIDATED FINANCIAL STATEMENTS (Continued)
($ in thousands, except share and per share amounts)
13. Stock-Based Compensation
Share-Based Plan
On May 15, 2014, stockholders of the Company approved the 2014 Incentive Plan ("2014 Plan").
Under the 2014 Plan, awards may be granted to employees, officers and directors of, and consultants and advisors to, the Company. The maximum number of shares was increased to 8,500,000 shares of our common stock which will initially be available for all awards, subject to adjustment in the event of certain corporate transactions described in the 2014 Plan.
As of December 31, 2015, approximately 4.2 million shares were reserved for granting additional stock options, restricted stock awards or stock appreciation rights. If any award is forfeited or expires without being exercised, or if restricted stock is repurchased by the Company, the common shares subject to the award shall be available for additional grants under the 2014 Plan. The number of shares available under the 2014 Plan is subject to adjustment in the event of any stock split, stock dividend, recapitalization, spin-off or other similar action. Awards may be granted to employees, officers and directors of, and consultants or advisors to, the Company. Options intended to qualify, under the standards set forth in certain federal tax rules, as incentive stock options ("ISOs") may be granted only to employees while actually employed by the Company. Non-employee directors, consultants and advisors are not entitled to receive ISOs. Option awards granted under the 2014 Plan are exercisable for a period fixed by the administrator, but no longer than 10 years from the date of grant, at an exercise price which is not less than the fair market value of the shares on the date of the grant.
The compensation committee of the board of directors approves all stock awards. The Company accounts for stock awards in accordance with ASC 718, Compensation—Stock Compensation, which requires that the cost resulting from all share-based payment transactions be recognized as compensation cost over the vesting period based on the fair value of the instrument on the date of grant.
Total non-cash stock-based compensation expense related to stock options and restricted stock for the years ended December 31, 2015, 2014 and 2013 is as follows:
| |
Years Ended December 31, | |||||||||
|---|---|---|---|---|---|---|---|---|---|---|
| |
2015 | 2014 | 2013 | |||||||
Stock option compensation expense |
$ | 4,938 | $ | 3,595 | $ | 2,830 | ||||
Restricted stock unit compensation expense |
4,897 | 3,361 | 2,373 | |||||||
| | | | | | | | | | | |
Total stock-based compensation expense |
$ | 9,835 | $ | 6,956 | $ | 5,203 | ||||
| | | | | | | | | | | |
| | | | | | | | | | | |
| | | | | | | | | | | |
Total unrecognized stock-based compensation cost related to the stock options and restricted stock as of December 31, 2015 and 2014 is as follows:
| |
December 31, | ||||||
|---|---|---|---|---|---|---|---|
| |
2015 | 2014 | |||||
Unrecognized stock option compensation expense |
$ | 4,217 | $ | 3,243 | |||
Unrecognized restricted stock unit compensation expense |
5,094 | 3,923 | |||||
| | | | | | | | |
Total unrecognized stock-based compensation expense |
$ | 9,311 | $ | 7,166 | |||
| | | | | | | | |
| | | | | | | | |
| | | | | | | | |
F-40
KAPSTONE PAPER AND PACKAGING CORPORATION
NOTES TO CONSOLIDATED FINANCIAL STATEMENTS (Continued)
($ in thousands, except share and per share amounts)
13. Stock-Based Compensation (Continued)
As of December 31, 2015, total unrecognized compensation cost related to non-vested stock options and restricted stock units is expected to be recognized over a weighted average period of 2.1 years and 2.0 years, respectively.
In accordance with ASC 781, the Company recognized excess tax benefits of $1.6 million, $2.6 million and $3.5 million for the years ended December 31, 2015, 2014 and 2013, respectively.
Stock Options
In 2015, 2014, and 2013 the Company granted stock options for 668,362, 454,161 and 604,296 common shares, respectively, to executive officers, directors and employees as compensation for service. The Company's outstanding stock options vest as follows: 50 percent after two years and the remaining 50 percent after three years. Stock options granted in 2015, 2014, and 2013 have a contractual term of ten years. The stock options are subject to forfeiture should these employees terminate their employment with the Company for certain reasons prior to vesting in their awards, or the occurrence of certain other events such as termination with cause. The exercise price of these stock options is based on closing market price of our common stock on the date of grant. Compensation expense is recorded on an accelerated basis over the awards' vesting periods.
In December 2013, the board of directors approved a two-for-one stock split. In accordance with the Company's Amended and Restated 2008 Incentive Plan, the compensation committee of the board of directors selected to increase the number of unexercised stock options. The increase in the number of options did not result in any incremental fair value or compensation cost.
A summary of information related to stock options is as follows (amounts restated for the 2013 stock split):
| |
Options | Weighted Average Exercise Price |
Weighted Average Remaining Life (Years) |
Intrinsic Value (dollars in thousands) |
|||||||||
|---|---|---|---|---|---|---|---|---|---|---|---|---|---|
Outstanding at December 31, 2012 |
2,563,856 | $ | 5.46 | ||||||||||
Granted |
604,296 | 14.53 | |||||||||||
Exercised |
(616,406 | ) | 3.51 | ||||||||||
Lapsed (forfeited or cancelled) |
(37,364 | ) | 9.43 | ||||||||||
| | | | | | | | | | | | | | |
Outstanding at December 31, 2013 |
2,514,382 | 8.05 | |||||||||||
Granted |
454,161 | 30.42 | |||||||||||
Exercised |
(183,130 | ) | 5.74 | ||||||||||
Lapsed (forfeited or cancelled) |
(26,107 | ) | 16.85 | ||||||||||
| | | | | | | | | | | | | | |
Outstanding at December 31, 2014 |
2,759,306 | 11.81 | |||||||||||
Granted |
668,362 | 30.24 | |||||||||||
Exercised |
(108,952 | ) | 10.35 | ||||||||||
Lapsed (forfeited or cancelled) |
(52,816 | ) | 23.03 | ||||||||||
| | | | | | | | | | | | | | |
Outstanding at December 31, 2015 |
3,265,900 | $ | 15.45 | 6.5 | $ | 38,955 | |||||||
| | | | | | | | | | | | | | |
| | | | | | | | | | | | | | |
| | | | | | | | | | | | | | |
Exercisable at December 31, 2015 |
1,941,801 | $ | 7.41 | 5.0 | $ | 35,663 | |||||||
| | | | | | | | | | | | | | |
| | | | | | | | | | | | | | |
| | | | | | | | | | | | | | |
F-41
KAPSTONE PAPER AND PACKAGING CORPORATION
NOTES TO CONSOLIDATED FINANCIAL STATEMENTS (Continued)
($ in thousands, except share and per share amounts)
13. Stock-Based Compensation (Continued)
The total intrinsic value of options exercised during 2015, 2014 and 2013 was $2.0 million, $4.5 million and $10.5 million, respectively.
The weighted average fair value of the Company stock options granted in 2015, 2014 and 2013 was $9.45, $10.39 and $5.58, respectively. The fair value of awards granted in 2015, 2014 and 2013 was $6.3 million, $4.7 million and $3.4 million, respectively. The fair value was calculated using the Black-Scholes option-pricing model based on the market price at the grant date and the weighted average assumptions specific to the underlying options. Beginning in 2013, the expected life used by the Company is based on the historical average life of stock option awards. The expected volatility assumption is based on the volatility of the Company's common stock from the same time period as the expected term of the stock options. The risk-free interest rate was selected based upon yields of U.S. Treasury issues with a term similar to the expected life of the stock options.
Cash proceeds from the exercise of stock options during 2015, 2014, and 2013 totaled $0.9 million, $0.9 million and $1.9 million, respectively.
The assumptions utilized for determining the fair value of stock options awarded during the years 2015, 2014 and 2013 are as follows:
| |
December 31, | |||||||||
|---|---|---|---|---|---|---|---|---|---|---|
| |
2015 | 2014 | 2013 | |||||||
KapStone Stock Options Black-Scholes assumptions (weighted average): |
||||||||||
Expected volatility |
38.73 | % | 39.92 | % | 49.39 | % | ||||
Expected life (years) |
4.92 | 4.32 | 4.00 | |||||||
Risk-free interest rate |
1.36 | % | 1.35 | % | 0.63 | % | ||||
Expected dividend yield |
1.55 | % | — | % | — | % | ||||
Restricted Stock
In 2015, 2014 and 2013, the Company granted restricted stock units of 214,051, 161,418 and 233,544 to executive officers, directors, and employees as compensation for service. These are restricted as to transferability until they vest three years from the grant date. These restricted shares are subject to forfeiture should these employees terminate their employment with the Company for certain reasons prior to vesting in their awards, or the occurrence of certain other events. The value of these restricted shares is based on the closing market price of the Company's common stock on the date of grant and compensation expense is recorded on a straight-line basis over the awards' vesting periods.
F-42
KAPSTONE PAPER AND PACKAGING CORPORATION
NOTES TO CONSOLIDATED FINANCIAL STATEMENTS (Continued)
($ in thousands, except share and per share amounts)
13. Stock-Based Compensation (Continued)
The following table summarizes non-vested restricted stock amounts and activity (amounts in 2013and 2012 are restated for the stock split):
| |
Units | Weighted Average Grant Price |
|||||
|---|---|---|---|---|---|---|---|
Outstanding at December 31, 2012 |
651,524 | $ | 8.18 | ||||
Granted |
233,544 | 14.44 | |||||
Vested |
(181,578 | ) | 5.73 | ||||
Forfeited |
(16,122 | ) | 10.19 | ||||
| | | | | | | | |
Outstanding at December 31, 2013 |
687,368 | $ | 10.91 | ||||
Granted |
161,418 | 30.44 | |||||
Vested |
(248,293 | ) | 9.00 | ||||
Forfeited |
(12,426 | ) | 15.25 | ||||
| | | | | | | | |
Outstanding at December 31, 2014 |
588,067 | $ | 16.98 | ||||
Granted |
214,051 | 30.41 | |||||
Vested |
(228,825 | ) | 10.94 | ||||
Forfeited |
(23,284 | ) | 20.43 | ||||
| | | | | | | | |
Outstanding at December 31, 2015 |
550,009 | $ | 24.60 | ||||
| | | | | | | | |
| | | | | | | | |
| | | | | | | | |
The fair value of awards granted in 2015, 2014 and 2013 was $6.5 million, $4.9 million and $3.4 million, respectively. The fair value of awards vested in 2015, 2014 and 2013 was $2.5 million, $2.2 million and $1.0 million, respectively.
14. Commitments and Contingencies
Commercial Commitments
The Company's commercial commitments as of December 31, 2015 represent commitments not recorded on the balance sheet, but potentially triggered by future events, and primarily consist of letters of credit to provide security for certain transactions and operating leases as requested by third parties. The Company had $17.1 million and $4.3 million of these commitments as of December 31, 2015 and 2014, respectively, with all expiring in 2016 if not renewed. No amounts have been drawn under these letters of credit.
Legal claims
We are from time to time subject to various administrative and legal investigations, claims and proceedings incidental to our business, including environmental and safety matters, labor and employments matters, personal injury claims, contractual, commercial and other disputes and taxes. We establish reserves for claims and proceedings when it is probable that liabilities exist and where reasonable estimates can be made. We also maintain insurance that may limit our financial exposure for defense costs, as well as liability, if any, for claims covered by the insurance (subject also to deductibles and self-insurance amounts). While any investigation, claim or proceeding has an element
F-43
KAPSTONE PAPER AND PACKAGING CORPORATION
NOTES TO CONSOLIDATED FINANCIAL STATEMENTS (Continued)
($ in thousands, except share and per share amounts)
14. Commitments and Contingencies (Continued)
of uncertainty, and we cannot predict or assure the outcome of any claim or proceeding involving the Company, we believe the outcome of any of any pending or threatened claim or proceeding (other than those that cannot be assessed due to their preliminary nature), or all of them combined, will not have a material adverse effect on our results of operations, cash flows or financial condition.
The Company's subsidiary, Longview, is a potentially responsible party under the Comprehensive Environmental Response, Compensation and Liability Act ("CERCLA") with respect to the Lower Duwamish Waterway Superfund Site in the State of Washington (the "Site"). The U.S. Environmental Protection Agency ("EPA") asserts that the Site is contaminated as a result of discharges from various businesses and government entities located along the Lower Duwamish Waterway, including a corrugated converting plant owned and operated by Longview. In November 2014, the EPA issued a Record of Decision ("ROD") for the Site. The ROD includes a selected remedy for the Site. In the ROD, EPA states that the total estimated net present value costs (discounted at 2.3%) for the selected remedy are $342 million. Neither the Company nor Longview has received a specific monetary demand regarding its potential liability for the Site. In addition, Longview is a participant in a non-judicial allocation process with respect to the Site. Pursuant to the non-judicial allocation process, Longview and other participating parties will seek to allocate certain costs, including but not limited to the costs necessary to perform the work under the ROD. The non-judicial allocation process is not scheduled to be completed until 2019. Based upon the information available to the Company at this time, the Company cannot reasonably estimate its potential liability for this Site.
Operating Leases
The Company leases space for twelve of its corrugated products manufacturing plants with the majority of space leased through 2032 and approximately 60 of its distribution warehouses. The twelve corrugated products manufacturing plants' leases include a provision for a one percent rent increase beginning in 2020.
Future minimum rentals under non-cancellable leases
The following represents the Company's future minimum rental payments due under non-cancellable operating leases that have initial or remaining lease terms in excess of one year as of the following years:
Years Ended December 31,
|
|
|||
|---|---|---|---|---|
2016 |
$ | 38,726 | ||
2017 |
35,288 | |||
2018 |
29,877 | |||
2019 |
24,799 | |||
2020 |
22,355 | |||
Thereafter |
83,747 | |||
| | | | | |
Total |
$ | 234,792 | ||
| | | | | |
| | | | | |
| | | | | |
The Company's rental expense under operating leases amounted to $36.0 million, $16.9 million and $14.9 million for the years ended December 31, 2015, 2014 and 2013, respectively. The increase in
F-44
KAPSTONE PAPER AND PACKAGING CORPORATION
NOTES TO CONSOLIDATED FINANCIAL STATEMENTS (Continued)
($ in thousands, except share and per share amounts)
14. Commitments and Contingencies (Continued)
rental expense for the year ended December 31, 2015 reflects the inclusion of more than 60 distribution and fulfillment centers assumed with the Victory acquisition on June 1, 2015 including $2.2 million paid to related parties in 2015. These leases with related parties were terminated in January 2016.
Purchase Obligations
In conjunction with the 2008 Charleston Kraft Division acquisition, the Company entered into a 15-year fiber supply agreement. Pursuant to the agreement, expiring in 2023, the Company's North Charleston mill will purchase approximately 25 percent of its pine pulpwood and 60 percent of its saw timber requirements. The purchases are based on market prices and are accounted for as raw materials. The Company's North Charleston mill purchased approximately $39.1 million, $40.0 million and $35.6 million of materials in accordance with the agreement for years ended December 31, 2015, 2014 and 2013, respectively.
The Company has committed to purchase $30.4 million of natural gas through 2018. These purchases are accounted for under the normal purchase normal sale rules. The Company can resell the natural gas committed over its requirements on the open market, and has entered into a contract to do so, should it become necessary.
Limited Partnership Investments
The Pension Plan invests in various limited partnership investments in accordance with their stated investment policies. As of December 31, 2015, the plan had unfunded commitments to contribute capital to limited partnerships totaling $3.5 million.
Union Contract Status and Work Stoppage
The union contract covering approximately 600 employees at the Longview paper mill expired in June 2014. From July 2014 through early June 2015 the Company negotiated a new contract with the union but could not agree on terms. On June 12, 2015, the union provided a "10 Day Notice," which made it possible for union employees to go out on legal strike at any time after June 22, 2015.
On August 27, 2015, KapStone received a notice of a work stoppage at the Longview mill from the union. The work stoppage lasted 12 days with a production loss of approximately 29,000 tons. During the 12 day work stoppage, the Company performed certain maintenance work and thereafter commenced operating certain paper machines prior to the union workers return to work. There has been no additional work stoppage since September 7, 2015.
The Longview paper mill continues to operate without an executed agreement with the union.
The union contract covering approximately 540 employees at the North Charleston paper mill expired in June 2015 and continues to operate without an executed agreement with the union.
F-45
KAPSTONE PAPER AND PACKAGING CORPORATION
NOTES TO CONSOLIDATED FINANCIAL STATEMENTS (Continued)
($ in thousands, except share and per share amounts)
15. Net income per share
The Company's basic and diluted net income per share is calculated as follows:
| |
Years Ended December 31, | |||||||||
|---|---|---|---|---|---|---|---|---|---|---|
| |
2015 | 2014 | 2013 | |||||||
Net income |
$ | 106,386 | $ | 171,915 | $ | 127,338 | ||||
Weighted-average number of common shares for basic net income per share |
96,257,749 | 95,900,179 | 95,258,756 | |||||||
Incremental effect of dilutive common stock equivalents: |
||||||||||
Unexercised stock options |
1,096,085 | 1,207,903 | 1,038,293 | |||||||
Unvested restricted stock awards |
281,705 | 351,102 | 442,433 | |||||||
| | | | | | | | | | | |
Weighted-average number of shares for diluted net income per share |
97,635,539 | 97,459,184 | 96,739,482 | |||||||
| | | | | | | | | | | |
| | | | | | | | | | | |
| | | | | | | | | | | |
Net income per share—basic |
$ | 1.11 | $ | 1.79 | $ | 1.34 | ||||
Net income per share—diluted |
$ | 1.09 | $ | 1.76 | $ | 1.32 | ||||
A total of 972,801 and 355,132 weighted average unexercised stock options were outstanding at December 31, 2015, and 2014, respectively, but were not included in the computation of diluted net income per share because the awards were anti-dilutive.
Shares and earnings per share amounts for 2013 have been restated to reflect the 2013 stock split.
16. Segment Information
Prior to the acquisition of Victory on June 1, 2015, the Company manufactured and sold packaging products and reported the Company's consolidated results as one segment. In connection with the acquisition, we began reporting in two segments: Paper and Packaging and Distribution. These segments represent distinct businesses that are managed separately because of differing products and services. Each of these businesses requires distinct operating and marketing strategies.
Paper and Packaging: This segment manufactures and sells a wide variety of container board, corrugated products, and specialty paper for industrial and consumer markets.
Distribution: Through Victory, a North American distributor of packaging materials, with its more than 60 distribution centers located in the United States, Mexico and Canada, the Company provides packaging materials and related products to a wide variety of customers.
Each segment's profits and losses are measured on operating profits before interest expense and interest income.
F-46
KAPSTONE PAPER AND PACKAGING CORPORATION
NOTES TO CONSOLIDATED FINANCIAL STATEMENTS (Continued)
($ in thousands, except share and per share amounts)
16. Segment Information (Continued)
An analysis of operations by segment is as follows:
| |
Net Sales | |
|
|
|
|||||||||||||||||
|---|---|---|---|---|---|---|---|---|---|---|---|---|---|---|---|---|---|---|---|---|---|---|
Year Ended December 31, 2015
|
Trade | Inter- segment |
Total | Operating Income (Loss) |
Depreciation and Amortization |
Capital Expenditures |
Assets | |||||||||||||||
Paper and Packaging: |
||||||||||||||||||||||
Containerboard / Corrugated products |
$ | 1,399,522 | $ | 22,280 | $ | 1,421,802 | ||||||||||||||||
Specialty paper |
720,588 | — | 720,588 | |||||||||||||||||||
Other |
86,286 | — | 86,286 | |||||||||||||||||||
| | | | | | | | | | | | | | | | | | | | | | | |
Total Paper and Packaging |
$ | 2,206,396 | $ | 22,280 | $ | 2,228,676 | $ | 224,012 | $ | 145,363 | $ | 108,599 | $ | 2,489,683 | ||||||||
Distribution(a) |
582,949 | — | 582,949 | 20,719 | 13,108 | 3,190 | 675,204 | |||||||||||||||
Corporate |
— | — | — | (45,564 | ) | 3,708 | 14,967 | 57,223 | ||||||||||||||
Intersegment eliminations |
— | (22,280 | ) | (22,280 | ) | — | — | — | — | |||||||||||||
| | | | | | | | | | | | | | | | | | | | | | | |
|
$ | 2,789,345 | $ | — | $ | 2,789,345 | $ | 199,167 | $ | 162,179 | $ | 126,756 | $ | 3,222,110 | ||||||||
| | | | | | | | | | | | | | | | | | | | | | | |
| | | | | | | | | | | | | | | | | | | | | | | |
| | | | | | | | | | | | | | | | | | | | | | | |
| |
Net Sales | |
|
|
|
|||||||||||||||||
|---|---|---|---|---|---|---|---|---|---|---|---|---|---|---|---|---|---|---|---|---|---|---|
Year Ended December 31, 2014
|
Trade | Inter- segment |
Total | Operating Income (Loss) |
Depreciation and Amortization |
Capital Expenditures |
Assets | |||||||||||||||
Paper and Packaging: |
||||||||||||||||||||||
Containerboard / Corrugated products |
$ | 1,463,670 | $ | — | $ | 1,463,670 | ||||||||||||||||
Specialty paper |
741,601 | — | 741,601 | |||||||||||||||||||
Other |
95,649 | — | 95,649 | |||||||||||||||||||
| | | | | | | | | | | | | | | | | | | | | | | |
Total Paper and Packaging |
$ | 2,300,920 | $ | — | $ | 2,300,920 | $ | 334,753 | $ | 133,302 | $ | 128,593 | $ | 2,505,896 | ||||||||
Distribution(a) |
— | — | — | — | — | — | — | |||||||||||||||
Corporate |
— | — | — | (34,822 | ) | 3,246 | 8,639 | 50,378 | ||||||||||||||
Intersegment eliminations |
— | — | — | — | — | — | — | |||||||||||||||
| | | | | | | | | | | | | | | | | | | | | | | |
|
$ | 2,300,920 | $ | — | $ | 2,300,920 | $ | 299,931 | $ | 136,548 | $ | 137,232 | $ | 2,556,274 | ||||||||
| | | | | | | | | | | | | | | | | | | | | | | |
| | | | | | | | | | | | | | | | | | | | | | | |
| | | | | | | | | | | | | | | | | | | | | | | |
F-47
KAPSTONE PAPER AND PACKAGING CORPORATION
NOTES TO CONSOLIDATED FINANCIAL STATEMENTS (Continued)
($ in thousands, except share and per share amounts)
16. Segment Information (Continued)
| |
Net Sales | |
|
|
|
|||||||||||||||||
|---|---|---|---|---|---|---|---|---|---|---|---|---|---|---|---|---|---|---|---|---|---|---|
Year Ended December 31, 2013
|
Trade | Inter- segment |
Total | Operating Income (Loss) |
Depreciation and Amortization |
Capital Expenditures |
Assets | |||||||||||||||
Paper and Packaging: |
||||||||||||||||||||||
Containerboard / Corrugated products |
$ | 1,108,545 | $ | — | $ | 1,108,545 | ||||||||||||||||
Specialty paper |
551,931 | — | 551,931 | |||||||||||||||||||
Other |
87,686 | — | 87,686 | |||||||||||||||||||
| | | | | | | | | | | | | | | | | | | | | | | |
Total Paper and Packaging |
$ | 1,748,162 | $ | — | $ | 1,748,162 | $ | 255,174 | $ | 92,326 | $ | 93,312 | $ | 2,623,582 | ||||||||
Distribution(a) |
— | — | — | — | — | — | — | |||||||||||||||
Corporate |
— | — | — | (35,286 | ) | 3,109 | 3,394 | 28,280 | ||||||||||||||
Intersegment eliminations |
— | — | — | — | — | — | — | |||||||||||||||
| | | | | | | | | | | | | | | | | | | | | | | |
|
$ | 1,748,162 | $ | — | $ | 1,748,162 | $ | 219,888 | $ | 95,435 | $ | 96,706 | $ | 2,651,862 | ||||||||
| | | | | | | | | | | | | | | | | | | | | | | |
| | | | | | | | | | | | | | | | | | | | | | | |
| | | | | | | | | | | | | | | | | | | | | | | |
- (a)
- Results for the year ended December 31, 2015 includes Victory for the period June 1 through December 31, 2015 and is included in the Distribution segment.
| |
Years Ended December 31, | |||||||||
|---|---|---|---|---|---|---|---|---|---|---|
Net sales by location:
|
2015 | 2014 | 2013 | |||||||
To customers located in the United States |
$ | 2,300,806 | $ | 1,847,531 | $ | 1,398,326 | ||||
Foreign and export sales to foreign based customers |
488,539 | 453,389 | 349,836 | |||||||
| | | | | | | | | | | |
Total |
$ | 2,789,345 | $ | 2,300,920 | $ | 1,748,162 | ||||
| | | | | | | | | | | |
| | | | | | | | | | | |
| | | | | | | | | | | |
No foreign country accounted for more than 10 percent of consolidated net sales in 2015, 2014, or 2013.
Substantially all long-lived assets are located within the United States.
17. Quarterly Financial Information (Unaudited)
The following tables set forth the historical unaudited quarterly financial data for 2015 and 2014. The information for each of these periods has been prepared on the same basis as the audited consolidated financial statements and, in our opinion, reflects all adjustments consisting only of normal
F-48
KAPSTONE PAPER AND PACKAGING CORPORATION
NOTES TO CONSOLIDATED FINANCIAL STATEMENTS (Continued)
($ in thousands, except share and per share amounts)
17. Quarterly Financial Information (Unaudited) (Continued)
recurring adjustments necessary to present fairly our financial results. Operating results for previous periods do not necessarily indicate results that may be achieved in any future period.
| |
Quarters Ended | ||||||||||||
|---|---|---|---|---|---|---|---|---|---|---|---|---|---|
| |
March 31, 2015 |
June 30, 2015 |
September 30, 2015 |
December 31, 2015 |
|||||||||
Fiscal 2015: |
|||||||||||||
Net sales(1) |
$ | 546,289 | $ | 671,255 | $ | 807,563 | $ | 764,238 | |||||
Gross profit(1) |
$ | 85,543 | $ | 109,890 | $ | 125,173 | $ | 89,405 | |||||
Operating income |
$ | 47,349 | $ | 61,409 | $ | 61,596 | $ | 28,813 | |||||
Net income(2) |
$ | 26,100 | $ | 34,256 | $ | 34,206 | $ | 11,824 | |||||
Net income per share: |
|||||||||||||
Basic |
$ | 0.27 | $ | 0.36 | $ | 0.36 | $ | 0.12 | |||||
Diluted |
$ | 0.27 | $ | 0.35 | $ | 0.35 | $ | 0.12 | |||||
- (1)
- Results
of the Victory acquisition are included above since June 1, 2015.
- (2)
- Gross
profit is defined as net sales less cost of sales, depreciation and amortization, freight, and distribution expenses. Gross profit includes planned
maintenance outage costs of $8.6 million, $11.1 million, $4.4 million and $13.3 million in the quarters ended March 31, June 30, September 30 and
December 31, 2015, respectively.
- (3)
- Net income includes a loss on debt extinguishment of $0.6 million for each of the quarters ended September 30 and December 31, 2015.
| |
Quarters Ended | ||||||||||||
|---|---|---|---|---|---|---|---|---|---|---|---|---|---|
| |
March 31, 2014 |
June 30, 2014 |
September 30, 2014 |
December 31, 2014 |
|||||||||
Fiscal 2014: |
|||||||||||||
Net sales |
$ | 548,952 | $ | 590,449 | $ | 598,106 | $ | 563,413 | |||||
Gross profit(1) |
$ | 92,263 | $ | 119,406 | $ | 128,295 | $ | 96,976 | |||||
Operating income |
$ | 58,118 | $ | 85,313 | $ | 94,162 | $ | 62,338 | |||||
Net income(2) |
$ | 32,099 | $ | 51,459 | $ | 54,254 | $ | 34,103 | |||||
Net income per share: |
|||||||||||||
Basic |
$ | 0.34 | $ | 0.54 | $ | 0.57 | $ | 0.36 | |||||
Diluted |
$ | 0.33 | $ | 0.53 | $ | 0.56 | $ | 0.35 | |||||
- (1)
- Gross
profit is defined as net sales less cost of sales, depreciation and amortization, freight, and distribution expenses. Gross profit includes planned
maintenance outage costs of $14.8 million, $5.2 million, $ 5.2 million, and $10.9 million in the quarters ended March 31, June 30, September 30 and
December 31, 2014, respectively.
- (2)
- Net income includes a loss on debt extinguishment of $3.0 million and $2.6 million for the quarters ended September 30 and December 31, 2014, respectively.
F-49