Attached files
| file | filename |
|---|---|
| 8-K - FORM 8-K - E TRADE FINANCIAL CORP | d8k.htm |
 Goldman, Sachs & Co.
2010 U.S. Financial Services Conference
Steven Freiberg
Chief Executive Officer
©
2010 E*TRADE Financial Corp. All rights reserved.
This presentation contains confidential information and may not be disclosed
without E*TRADE Financial Corporation’s written permission.
December 8, 2010
Exhibit 99.1 |
 ©
2010 E*TRADE Financial Corp. All rights reserved.
This presentation contains confidential information and may not be disclosed
without E*TRADE Financial Corporation’s written permission.
2
Safe Harbor Statement
This presentation contains certain projections or other forward-
looking statements regarding future events or the future
performance of the Company. Various factors, including risks
and uncertainties referred to in the 10Ks, 10Qs and other
reports E*TRADE Financial Corporation periodically files with
the SEC, could cause our actual results to differ materially
from those indicated by our projections or other forward-
looking statements. This presentation also contains disclosure
of non-GAAP financial measures. A reconciliation of these
financial measures to the most directly comparable GAAP
financial measures can be found on the investor relations site
at https://investor.etrade.com.
©
2010 E*TRADE Financial Corp. All rights reserved. |
 ©
2010 E*TRADE Financial Corp. All rights reserved.
This presentation contains confidential information and may not be disclosed
without E*TRADE Financial Corporation’s written permission.
3
Overview
Solid Retail Brokerage Franchise, Enhanced by
Corporate Services & Market Making Businesses
Optimizing Value of Customer Deposits
Strengthening Financial Position
Improving Legacy Loan Portfolio |
 ©
2010 E*TRADE Financial Corp. All rights reserved.
This presentation contains confidential information and may not be disclosed
without E*TRADE Financial Corporation’s written permission.
4
Solid Retail Brokerage Franchise
***********************************************
***********************************************
***********************************************
***********************************************
***********************************************
***********************************************
*********************************************** |
 ©
2010 E*TRADE Financial Corp. All rights reserved.
This presentation contains confidential information and may not be disclosed
without E*TRADE Financial Corporation’s written permission.
5
Solid Retail Brokerage Franchise
Achieving competitive DART levels, continuing
to gain market share versus traditional brokers
Growing net new brokerage assets
Improving brokerage account attrition,
account quality, and customer satisfaction
Introducing new products and enhancements
for both active traders and long-term investors
Maintaining disciplined expense management
Generating consistent profitability |
  ©
2010 E*TRADE Financial Corp. All rights reserved.
This presentation contains confidential information and may not be disclosed
without E*TRADE Financial Corporation’s written permission.
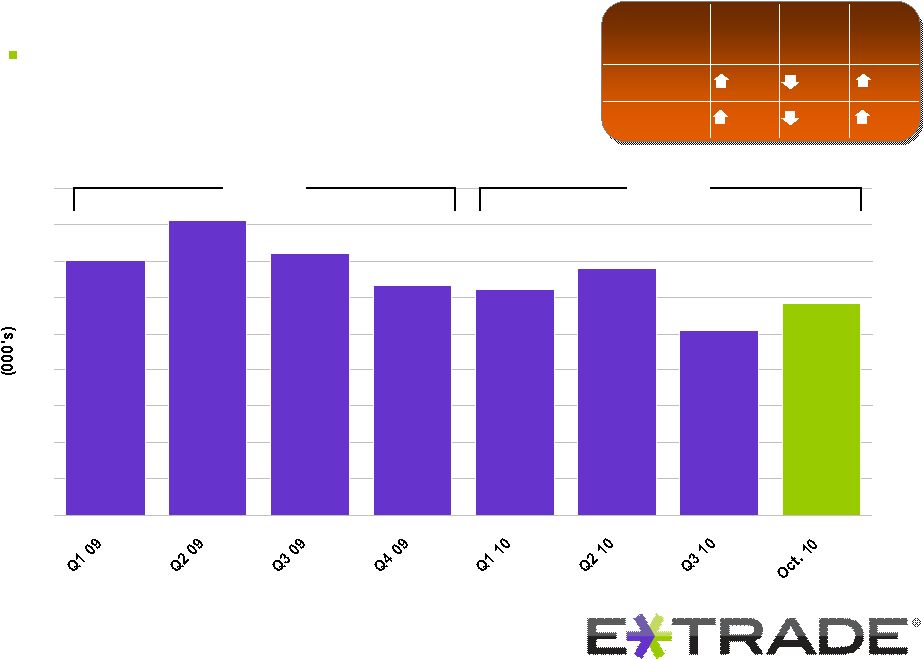
175
203
180
158
155
170
127
145
0
25
50
75
100
125
150
175
200
225
6
Solid Retail Brokerage Franchise
Competitive DART levels
179K
150K
YTD
2010
Oct /
Sep
Q3/
Q2
Q2/
Q1
E*TRADE
14%
26%
10%
Industry
10%
21%
7% |
 ©
2010 E*TRADE Financial Corp. All rights reserved.
This presentation contains confidential information and may not be disclosed
without E*TRADE Financial Corporation’s written permission.
0
7
Solid Retail Brokerage Franchise
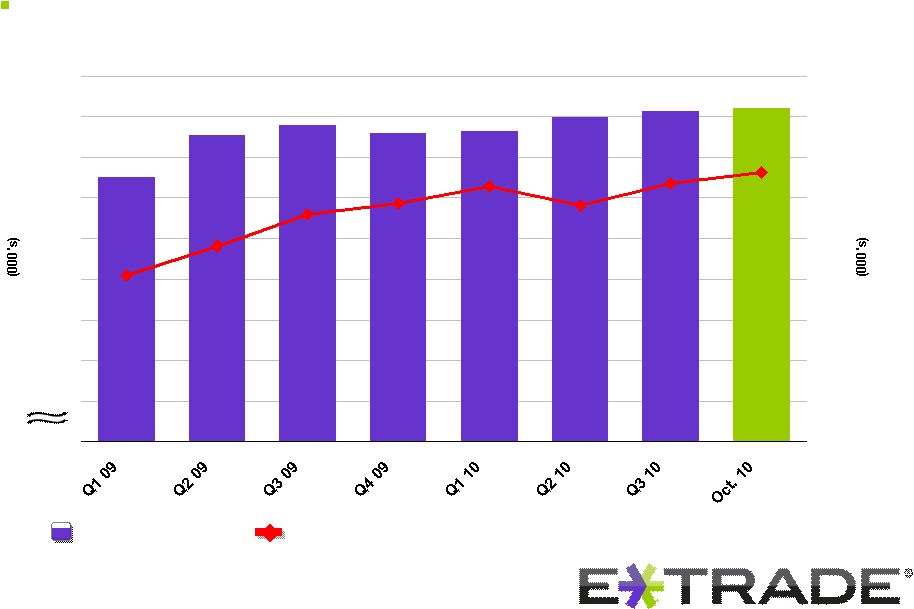
Growth in brokerage accounts & average assets per account
Brokerage accounts
Average brokerage assets per account
(1)
2,300
2,350
2,400
2,450
2,500
2,550
2,600
2,650
2,700
$0
$10
$20
$30
$40
$50
$60
$70 |
 ©
2010 E*TRADE Financial Corp. All rights reserved.
This presentation contains confidential information and may not be disclosed
without E*TRADE Financial Corporation’s written permission.
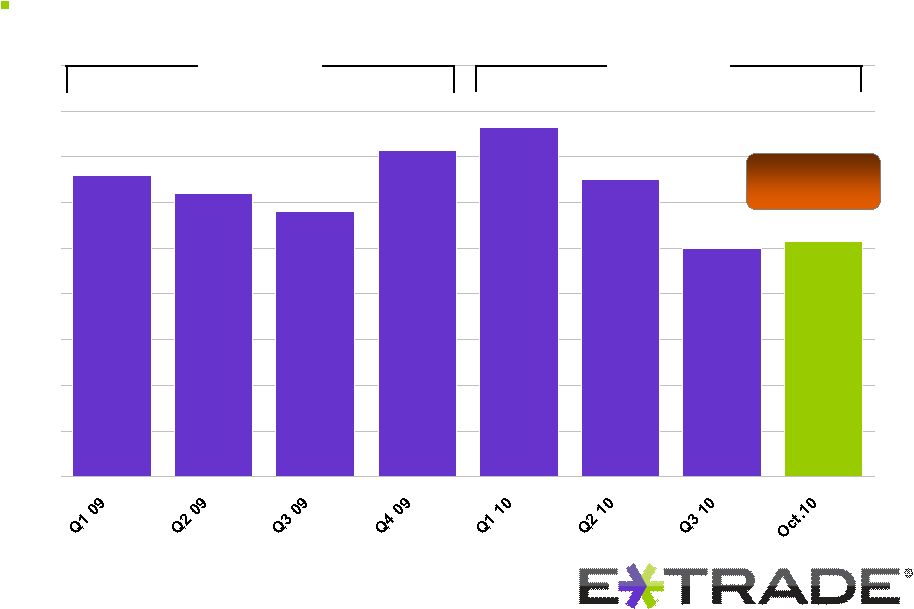
13.2%
12.4%
11.6%
14.3%
15.3%
13.0%
10.0%
10.3%
0%
2%
4%
6%
8%
10%
12%
14%
16%
18%
8
Solid Retail Brokerage Franchise
Improved
brokerage
account
attrition
(2)
Goal: 10%
13.3%
12.6% |
 ©
2010 E*TRADE Financial Corp. All rights reserved.
This presentation contains confidential information and may not be disclosed
without E*TRADE Financial Corporation’s written permission.
$0.0
$0.5
$1.0
$1.5
$2.0
$2.5
Solid Retail Brokerage Franchise
9
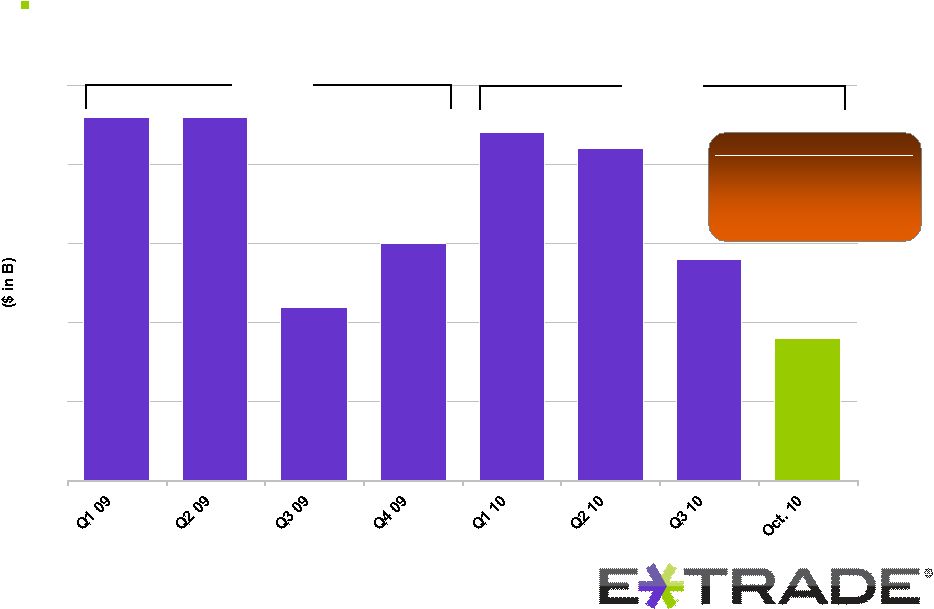
$7.2B
Consistent
growth
in
net
new
brokerage
assets
(3)
$6.6B
YTD
Brokerage asset flows
(4)
FY 2008: 3.6%
FY 2009: 8.6%
YTD 2010: 6.6% |
 ©
2010 E*TRADE Financial Corp. All rights reserved.
This presentation contains confidential information and may not be disclosed
without E*TRADE Financial Corporation’s written permission.
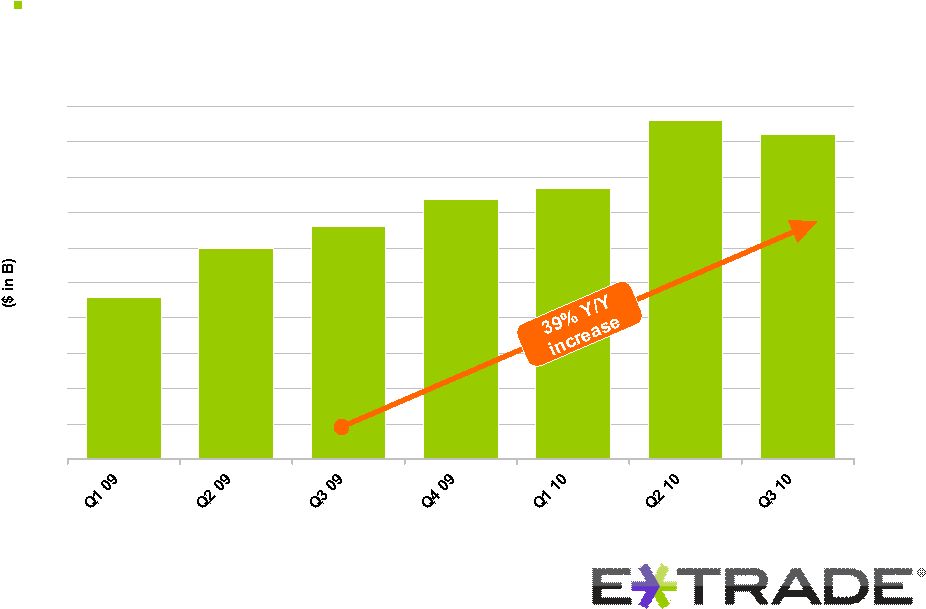
$4.6
$4.8
$3.8
$3.7
$3.3
$3.0
$2.3
$0.0
$0.5
$1.0
$1.5
$2.0
$2.5
$3.0
$3.5
$4.0
$4.5
$5.0
Solid Retail Brokerage Franchise
10
Growth in customer margin receivables |
 ©
2010 E*TRADE Financial Corp. All rights reserved.
This presentation contains confidential information and may not be disclosed
without E*TRADE Financial Corporation’s written permission.
$0
$5
$10
$15
$20
$25
$30
$35
Solid Retail Brokerage Franchise
11
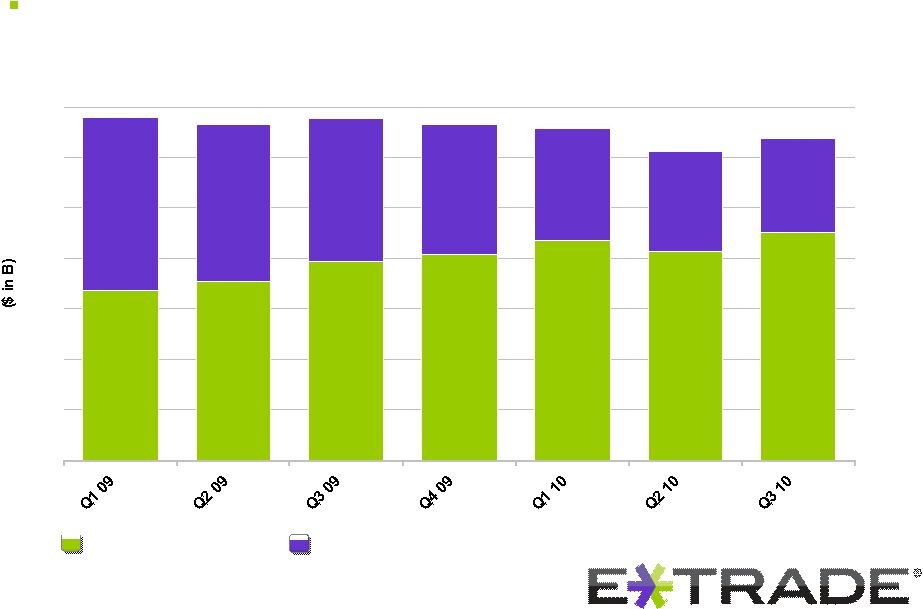
Improved strategic mix of customer cash,
providing longer duration and lower cost funding
Brokerage related cash
Bank related cash
29%
71%
32%
68%
34%
66%
39%
61%
42%
58%
47%
53%
51%
49% |
 ©
2010 E*TRADE Financial Corp. All rights reserved.
This presentation contains confidential information and may not be disclosed
without E*TRADE Financial Corporation’s written permission.
Solid Retail Brokerage Franchise
12
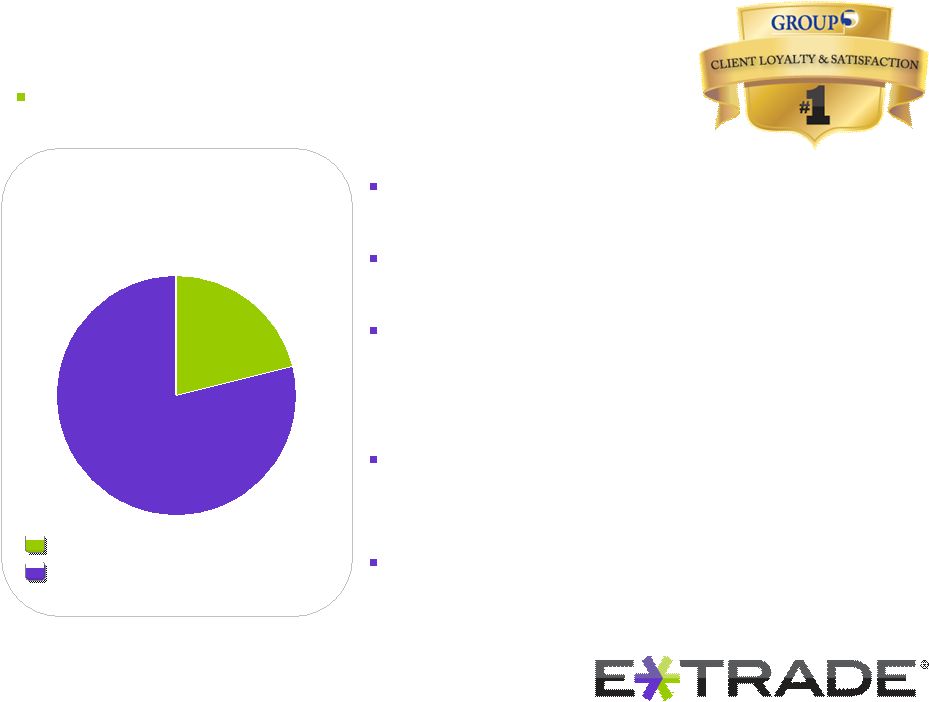
21%
79%
Enhanced by Corporate Services Group
Market leader in
administering stock plans
for public companies
More than 8 other providers
E*TRADE Corporate Services
Build on position as market leader:
Corporate clients comprise +20% of the S&P 500
Leverage best in class platform:
Equity Edge Online
Foster strategically important channel for
brokerage accounts:
Generating 25-30% of gross new brokerage
accounts
Cultivate retail relationships with corporate
employees:
Increasing dedicated relationship managers
Pursue strategic partnerships for growth:
Leveraging complementary capabilities
*GROUP FIVE rating for overall satisfaction and loyalty among broker plan
administrators for full and partial outsourced stock plan administration. |
 ©
2010 E*TRADE Financial Corp. All rights reserved.
This presentation contains confidential information and may not be disclosed
without E*TRADE Financial Corporation’s written permission.
Solid Retail Brokerage Franchise
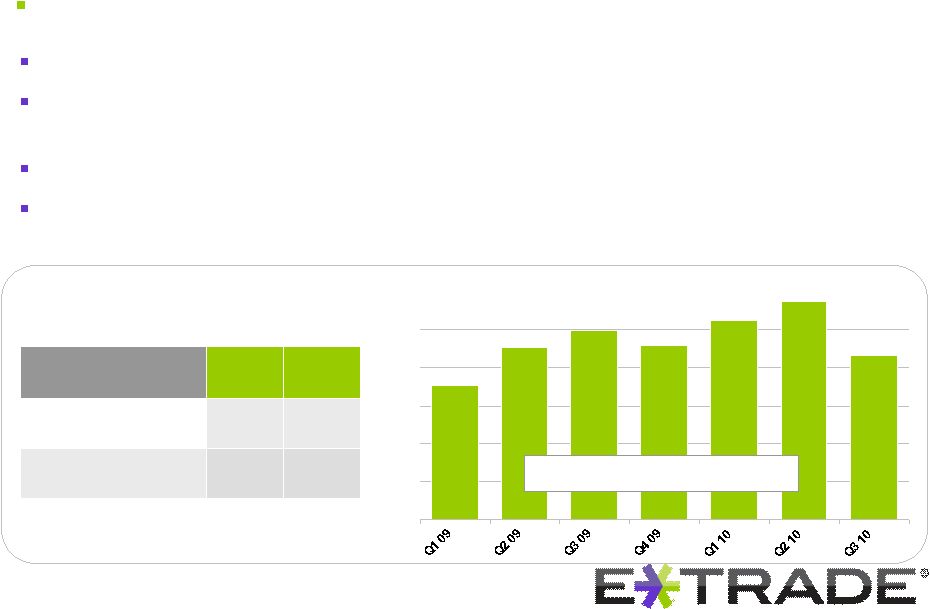
Enhanced by Market Making operations
Leveraging world class technologies and superior execution capabilities
Leading market share in OTC, foreign securities /
ADRs;
growing market share in National Market Securities
Capitalizing on strategically important internal order flow
Growing base of external customers, comprising 165+ broker/dealers,
up 15%+ y/y
($ in MM)
2009
2010
YTD
Revenue
$88
$76
Revenue from
external customers
36%
44%
Principal Transactions Revenue
13
$0
$5
$10
$15
$20
$25
20% growth since 2008
(5) |
 ©
2010 E*TRADE Financial Corp. All rights reserved.
This presentation contains confidential information and may not be disclosed
without E*TRADE Financial Corporation’s written permission.
$0
$50
$100
$150
$200
$250
$300
$350
Solid Retail Brokerage Franchise
14
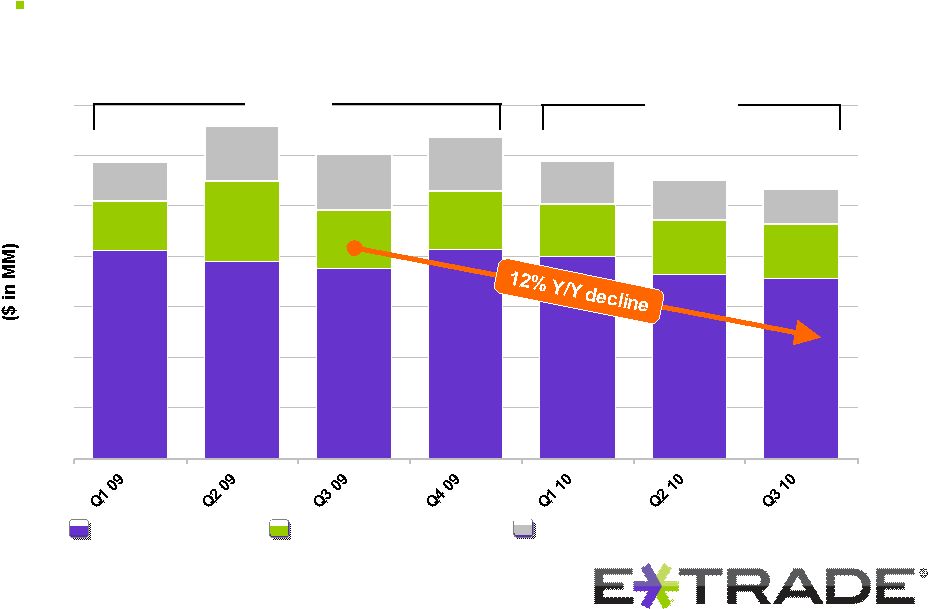
Disciplined expense management
Trading and Investing
$1.2B
Balance Sheet Management
Corporate
$0.8B
YTD |
 ©
2010 E*TRADE Financial Corp. All rights reserved.
This presentation contains confidential information and may not be disclosed
without E*TRADE Financial Corporation’s written permission.
$0
$50
$100
$150
$200
$250
Solid Retail Brokerage Franchise
15
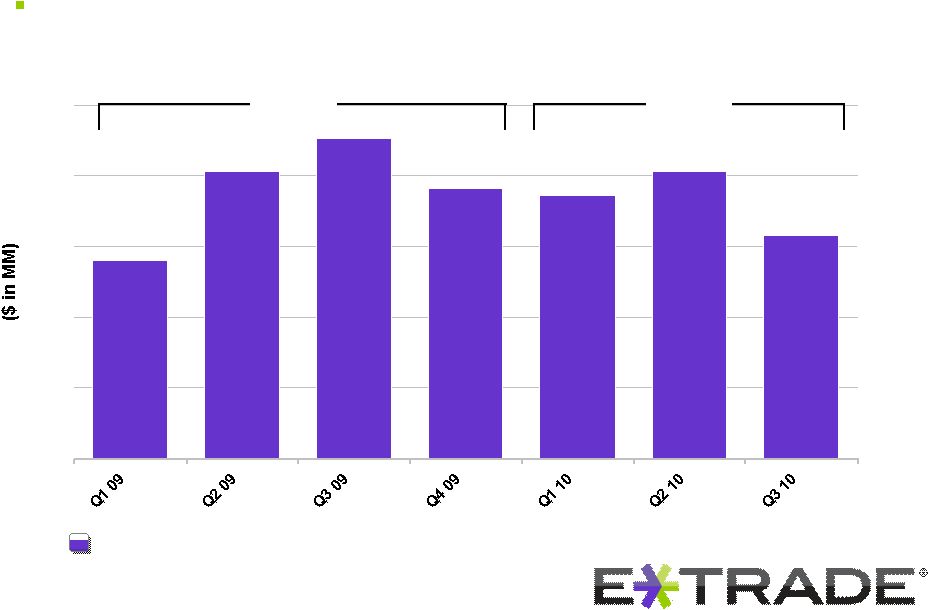
Consistently profitable trading and investing segment
Segment income
$760M
$547M
YTD |
 ©
2010 E*TRADE Financial Corp. All rights reserved.
This presentation contains confidential information and may not be disclosed
without E*TRADE Financial Corporation’s written permission.
16
Solid Retail Brokerage Franchise
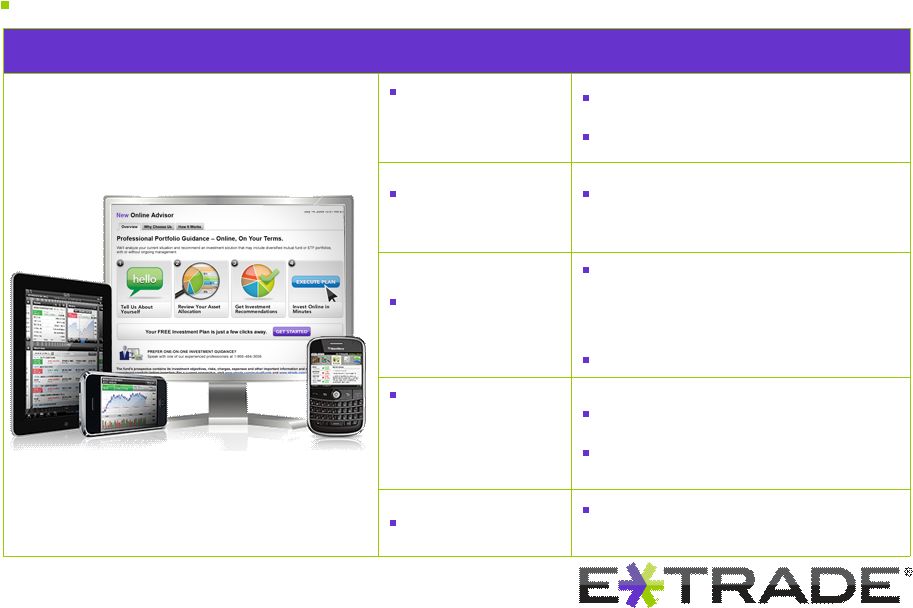
Strategies for growth
Increasing partner network
Rolling out developer kit
Application
Programming
Interface (API)
Evolving Products & Platform
Personalized
investor portal
A unique, customizable
investor experience
E*TRADE
Mobile Pro
Superior mobile platform,
accessing our most powerful
desktop tools
Platform for Android
Enhanced
capabilities in
options, futures
and FX
3-4 legged spreads
Portfolio margining
Communities
Connecting customers for
education, investing ideas |
 ©
2010 E*TRADE Financial Corp. All rights reserved.
This presentation contains confidential information and may not be disclosed
without E*TRADE Financial Corporation’s written permission.
17
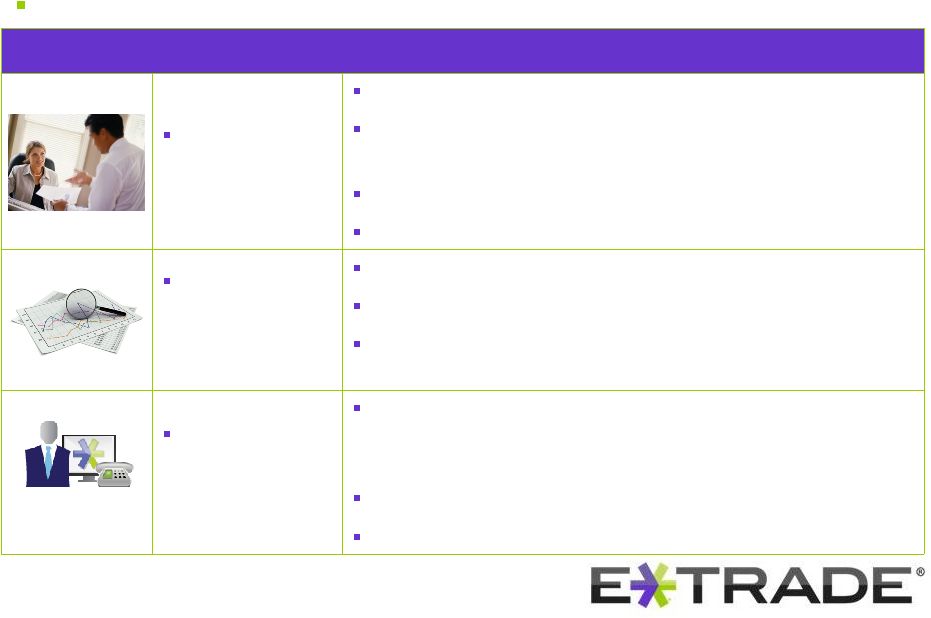
Solid Retail Brokerage Franchise
Strategies for growth
Turbocharging
Sales & Enhancing Service
Significantly
increasing sales
impact
Increase sales network +35% in 2011; incremental to +17% in 2010
Implementing performance management plan that clearly measures,
targets, and rewards performance
Improving lead generation, maximizing asset gathering
Segmentation and targeting of long-term investors for outreach
Expanding
annuitized
revenue product
sales
Greater focus on mutual funds and Managed Investment Portfolios
Launching unified managed and separately managed accounts
Continuous improvements in awareness/packaging of diversified
investment products
Continuously
improving the
customer
experience
Improved first call resolution from 30% to 60%; raised customer
satisfaction 24% over 2 years. Net promoter score 33% in 2010, up
from 16% in 2009.
Enhanced
self-help
tools
–
online
service
center
Re-engineered
customer
routing
–
50%
interactive
voice
response |
     ©
2010 E*TRADE Financial Corp. All rights reserved.
This presentation contains confidential information and may not be disclosed
without E*TRADE Financial Corporation’s written permission.
18
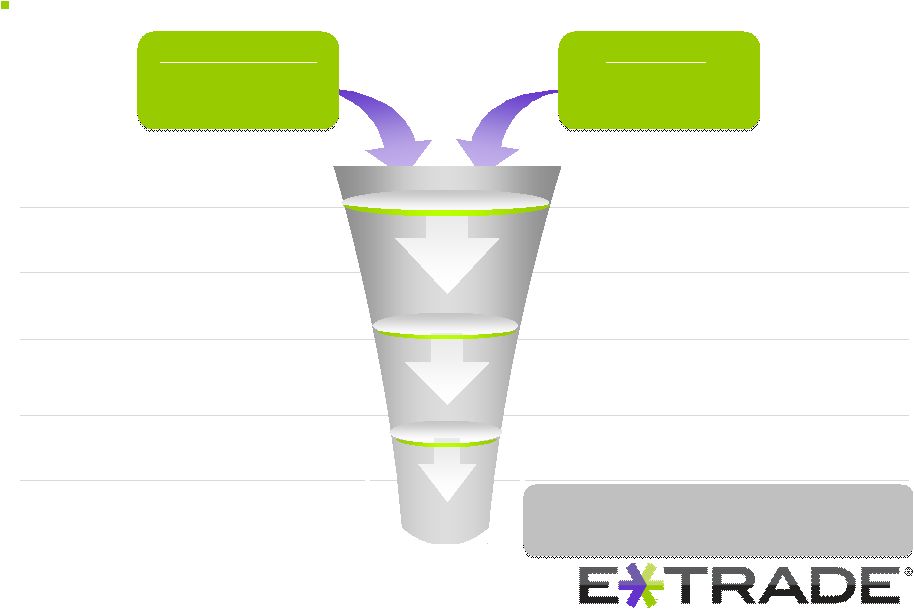
Funds account
Completes application…
Starts application process…
Prospect visits site…
Opportunities to drive greater
conversion
New advertising campaign
Homepage optimization
w/dynamic content
New online application
Updated on-boarding
Opportunities for greater conversion of prospects
Solid Retail Brokerage Franchise
•Print
•Other
•TV
•Online
Marketing
Sales Channels
•Local branches
•National centers
Every 10k gross new accounts
~$200MM in assets / $3MM in revenue |
 ©
2010 E*TRADE Financial Corp. All rights reserved.
This presentation contains confidential information and may not be disclosed
without E*TRADE Financial Corporation’s written permission.
19
Solid Retail Brokerage Franchise
Strategies for growth
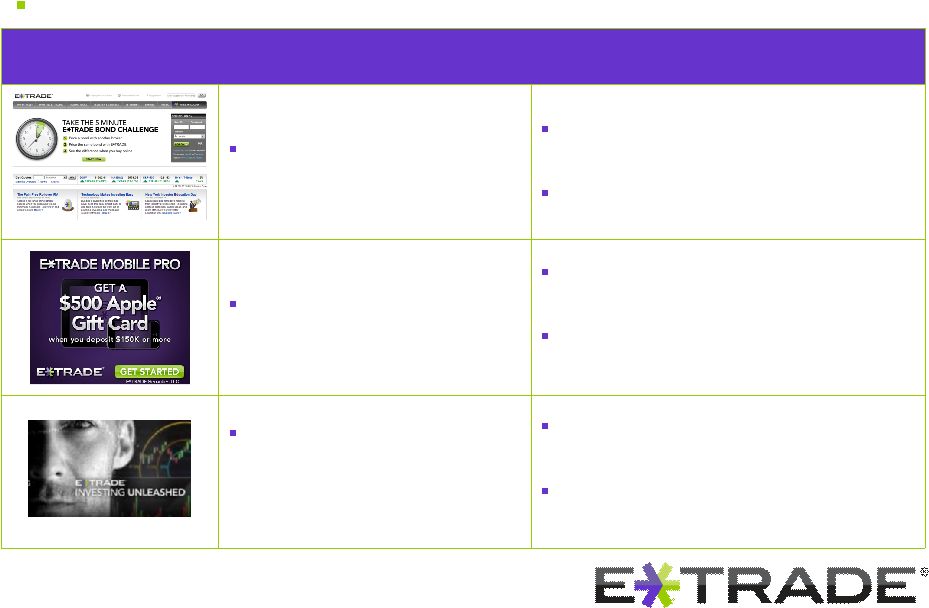
Refining Brand & Marketing
Prospect site & homepage
optimization
8 BETA versions of site, increasing
prospect conversions +5%
Overhauled online application
Targeted and aggressive
offers and direct marketing
Testing multiple offers; focused on
greater assets and account quality
Dynamic communication in online
ads; audience targeting
Balancing campaign mix
between renowned “baby”
and new “passion”
advertisements
“Passion”
campaign focused on
mature, wealthy prospects
Expanding brand recognition
beyond trading |
 ©
2010 E*TRADE Financial Corp. All rights reserved.
This presentation contains confidential information and may not be disclosed
without E*TRADE Financial Corporation’s written permission.
20
Solid Retail Brokerage Franchise
Expanding offerings for long-term investors
Broaden and strengthen revenue drivers through disruptive
innovation, expanding beyond current business
model (customer base, wallet share, other
revenue drivers) Complementing organic growth
strategies
Developing innovative product and service offerings based on significant
unmet consumer needs and large opportunity spaces
Creating opportunities to grow revenue with new, larger population
segments
Focusing on concepts with disruptive & scale potential; leveraging brand,
business model, and customer base
Formed an experienced and focused group to lead disruptive innovation;
currently in research to identify, understand, test, and prioritize approach
to: |
 ©
2010 E*TRADE Financial Corp. All rights reserved.
This presentation contains confidential information and may not be disclosed
without E*TRADE Financial Corporation’s written permission.
21
Optimizing Value of
Customer Deposits
***********************************************
***********************************************
***********************************************
***********************************************
***********************************************
***********************************************
*********************************************** |
 ©
2010 E*TRADE Financial Corp. All rights reserved.
This presentation contains confidential information and may not be disclosed
without E*TRADE Financial Corporation’s written permission.
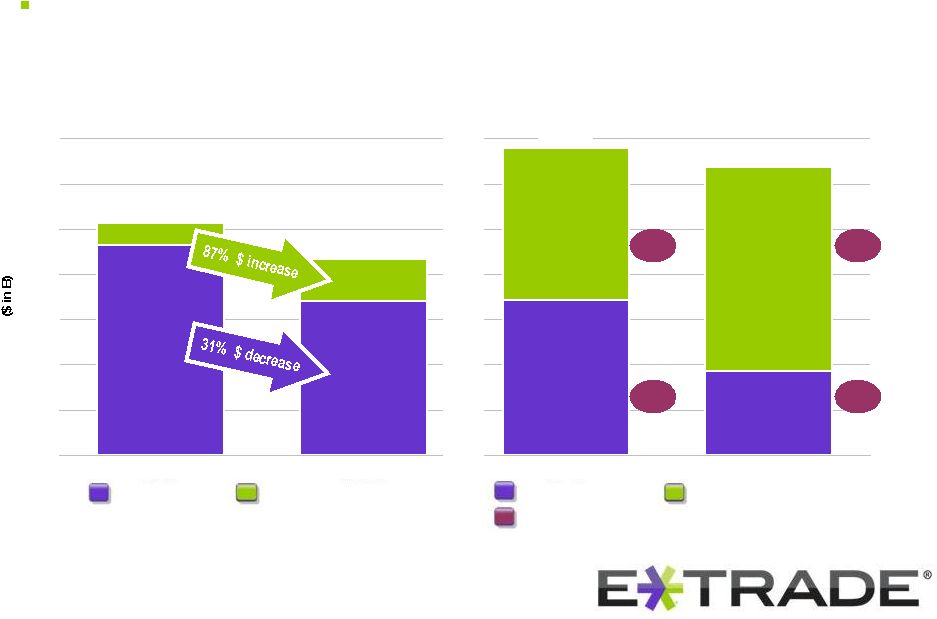
Optimizing Value of Customer Deposits
22
Improving mix of loans and customer deposits
$0
$5
$10
$15
$20
$25
$30
$35
Q1 09
Q3 10
Q1 09
Q3 10
91%
78%
51%
29%
$34B
$32B
22%
49%
71%
$26B
9%
Loans, net
Margin receivables
Bank related cash
Brokerage related cash
$21B
Loans
Customer Deposits
Average customer yield
(6)
12bps
39bps
22bps
222bps |
 ©
2010 E*TRADE Financial Corp. All rights reserved.
This presentation contains confidential information and may not be disclosed
without E*TRADE Financial Corporation’s written permission.
23
Optimizing Value of Customer Deposits
Customer deposit franchise driving balance sheet size and mix
Target interest earning assets: ~ $40B
Balance Sheet Reinvestment Strategies
Continue to increase brokerage deposits
Focus on growing customer margin receivables
Segmentation of legacy loan portfolio
Invest in agencies and other high quality assets
Manage challenges of interest rate environment |
 ©
2010 E*TRADE Financial Corp. All rights reserved.
This presentation contains confidential information and may not be disclosed
without E*TRADE Financial Corporation’s written permission.
24
Optimizing Value of Customer Deposits
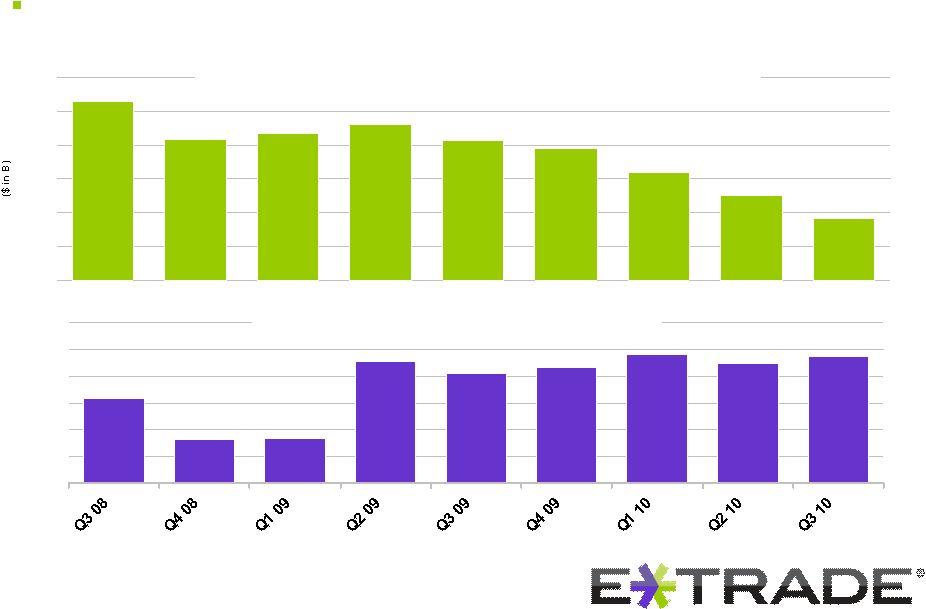
Customer deposit franchise driving balance sheet size and mix
$46.6
$44.3
$44.7
$45.2
$44.3
$43.8
$42.4
$41.0
$39.7
$36
$38
$40
$42
$44
$46
$48
2.63%
2.32%
2.34%
2.91%
2.82%
2.86%
2.96%
2.89%
2.95%
2.00%
2.20%
2.40%
2.60%
2.80%
3.00%
3.20%
Average enterprise interest earning assets
Enterprise net interest spread |
 ©
2010 E*TRADE Financial Corp. All rights reserved.
This presentation contains confidential information and may not be disclosed
without E*TRADE Financial Corporation’s written permission.
25
Improving Legacy Loan Portfolio
***********************************************
***********************************************
***********************************************
***********************************************
***********************************************
***********************************************
*********************************************** |
 ©
2010 E*TRADE Financial Corp. All rights reserved.
This presentation contains confidential information and may not be disclosed
without E*TRADE Financial Corporation’s written permission.
26
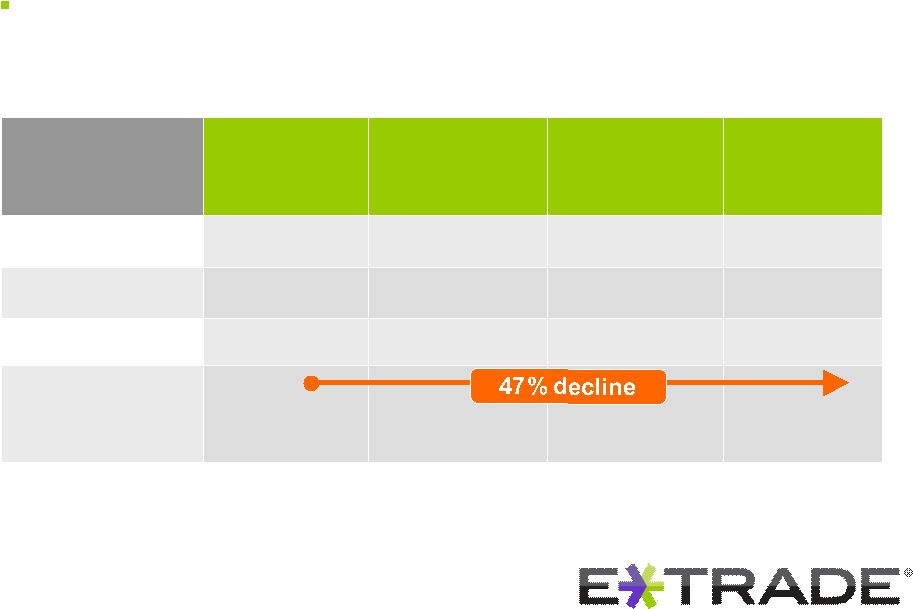
Improving Legacy Loan Portfolio
($ in B)
Loan
Balance
9/30/07
(7)
Paydowns
(8)
Charge-offs
Loan
Balance
9/30/10
(7)
1-4 Family loans
$16.9
($7.4)
($0.8)
$8.7
Home equity
$12.4
($3.3)
($2.3)
$6.8
Consumer
$3.0
($1.2)
($0.2)
$1.6
TOTAL
$32.3
($11.9)
($3.3)
$17.1
Loan portfolio continues to run off |
 ©
2010 E*TRADE Financial Corp. All rights reserved.
This presentation contains confidential information and may not be disclosed
without E*TRADE Financial Corporation’s written permission.
$0
$100
$200
$300
$400
$500
$600
$700
27
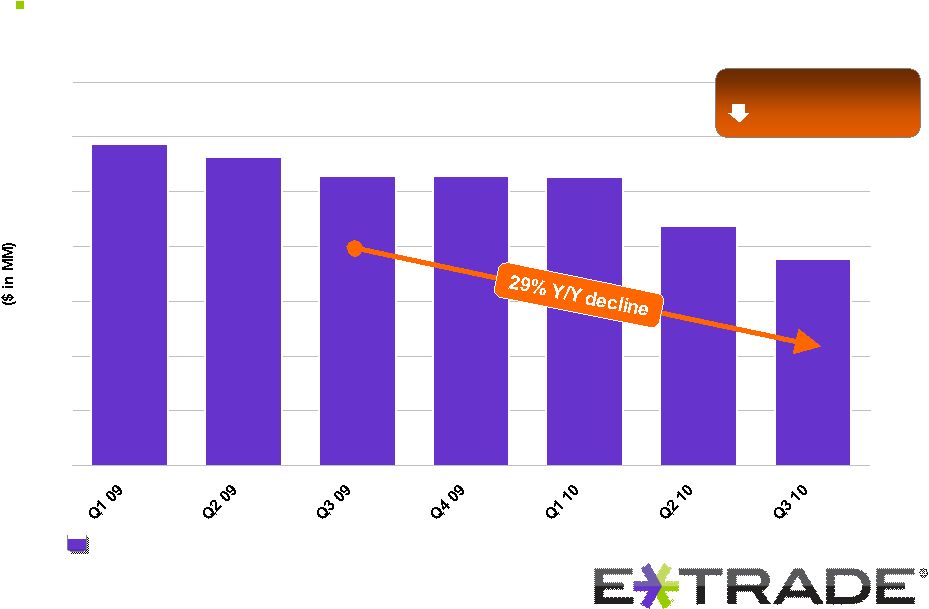
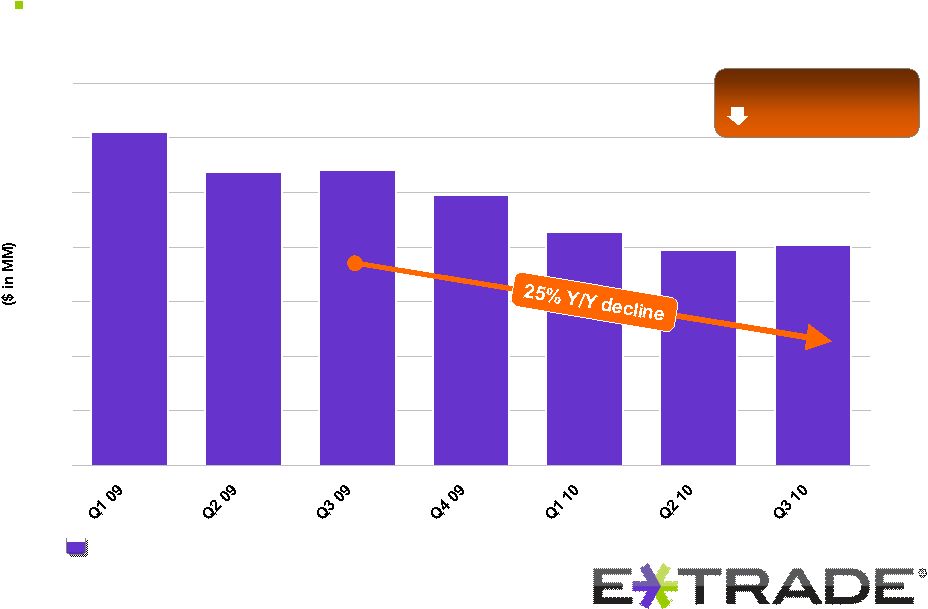
Improving Legacy Loan Portfolio
Improvement in 1-4 family delinquencies
30-89 Days delinquent
Portfolio size: $8.7B
48% from 2007 peak |
 ©
2010 E*TRADE Financial Corp. All rights reserved.
This presentation contains confidential information and may not be disclosed
without E*TRADE Financial Corporation’s written permission.
$0
$50
$100
$150
$200
$250
$300
$350
28
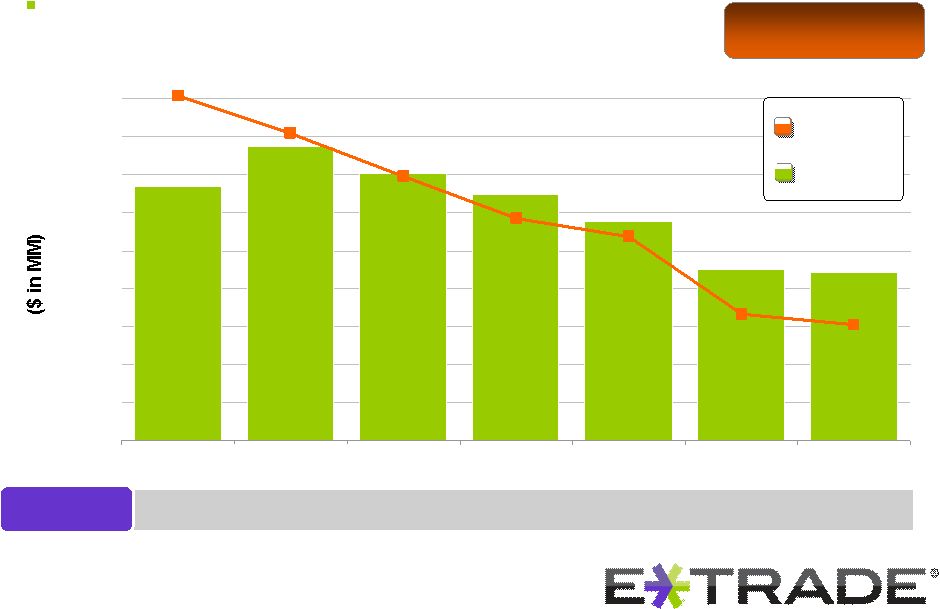
Improving Legacy Loan Portfolio
Improvement in home equity delinquencies
30-89 Days delinquent
Portfolio size: $6.8B
48% from 2007 peak |
 ©
2010 E*TRADE Financial Corp. All rights reserved.
This presentation contains confidential information and may not be disclosed
without E*TRADE Financial Corporation’s written permission.
$0
$50
$100
$150
$200
$250
$300
$350
$400
$450
$500
Q1 09
Q2 09
Q3 09
Q4 09
Q1 10
Q2 10
Q3 10
29
Improving Legacy Loan Portfolio
Allowance
Provision for
loan losses
Charge-offs
Continued decline in provision and charge-offs
$1,201
$1,219
$1,215
$1,183
$1,162
$1,103
$1,033
8 quarters of
declining provision |
 ©
2010 E*TRADE Financial Corp. All rights reserved.
This presentation contains confidential information and may not be disclosed
without E*TRADE Financial Corporation’s written permission.
30
Strengthening Financial Position
***********************************************
***********************************************
***********************************************
***********************************************
***********************************************
***********************************************
*********************************************** |
 ©
2010 E*TRADE Financial Corp. All rights reserved.
This presentation contains confidential information and may not be disclosed
without E*TRADE Financial Corporation’s written permission.
31
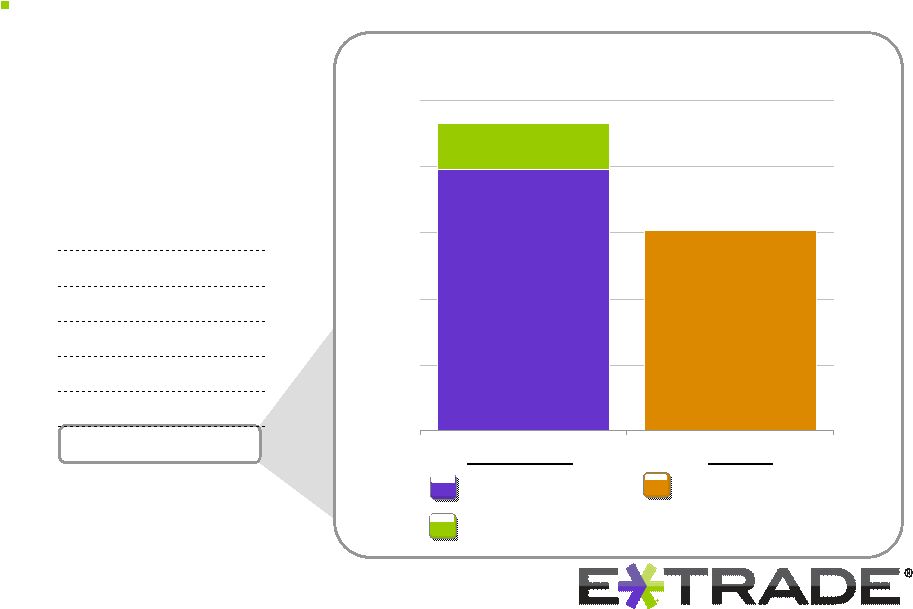
Strengthening Financial Position
Generating regulatory risk-based capital ($ in MM)
Q1 09
($271)
Q2 09
($33)
Q3 09
($26)
Q4 09
($86)
Q1 10
$47
Q2 10
$63
Q3 10
$81
Capital generation
(usage)
(9)
$35
$152
$198
$0
$50
$100
$150
$200
$250
Sources
Uses
Q3 2010 capital generation
(9)
of $81MM
Bank earnings
(10)
Loan loss provision
Portfolio changes and other
(11) |
 ©
2010 E*TRADE Financial Corp. All rights reserved.
This presentation contains confidential information and may not be disclosed
without E*TRADE Financial Corporation’s written permission.
32
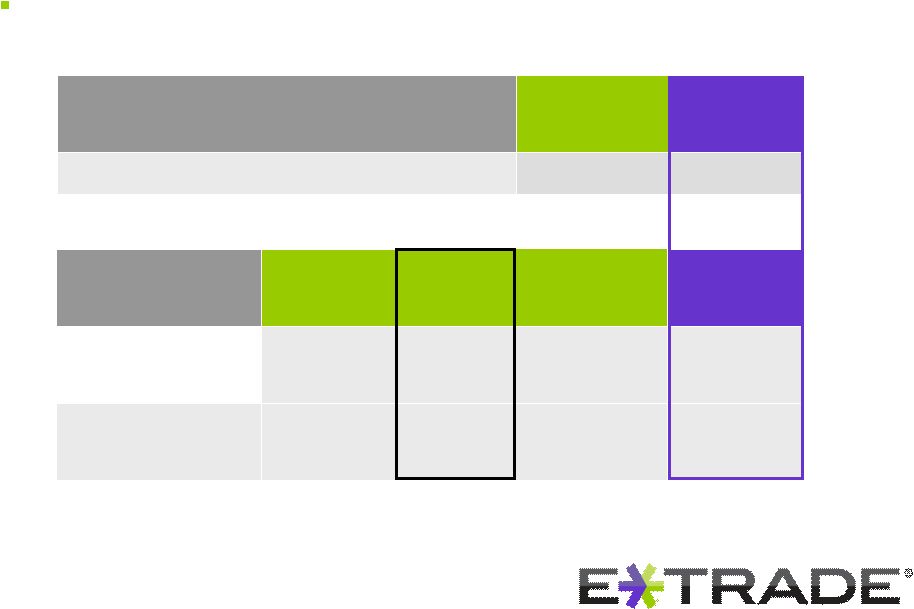
Strengthening Financial Position
Generating capital in excess of regulatory and management targets
Bank capital
(12)
as of 9/30/10 ($ in millions)
Well-
capitalized
threshold
Ratio
Excess to
well-capitalized
threshold
Excess to
management
target
Total capital to
risk-weighted
assets
10.0%
15.0%
$1,090
$590
Tier I Capital to
total adjusted
assets
5.0%
7.4%
$976
$569
9/30/10
Excess to
management
target
Corporate cash
($ in millions)
$490
$158 |
 ©
2010 E*TRADE Financial Corp. All rights reserved.
This presentation contains confidential information and may not be disclosed
without E*TRADE Financial Corporation’s written permission.
33
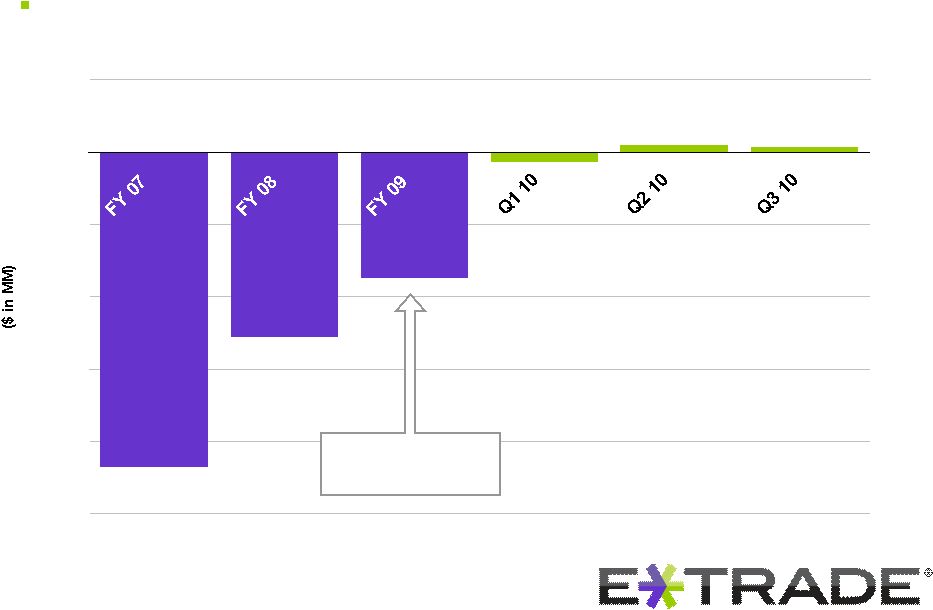
Strengthening Financial Position
Continued improvement in pre-tax income (loss)
($867)
($1,279)
($2,175)
-$2,500
-$2,000
-$1,500
-$1,000
-$500
$0
$500
Excludes impact
of Debt Exchange
(13) |
 ©
2010 E*TRADE Financial Corp. All rights reserved.
This presentation contains confidential information and may not be disclosed
without E*TRADE Financial Corporation’s written permission.
34
Overview
Solid Retail Brokerage Franchise, Enhanced by
Corporate Services & Market Making Businesses
Optimizing Value of Customer Deposits
Strengthening Financial Position
Improving Legacy Loan Portfolio |
 ©
2010 E*TRADE Financial Corp. All rights reserved.
This presentation contains confidential information and may not be disclosed
without E*TRADE Financial Corporation’s written permission.
35 |
 ©
2010 E*TRADE Financial Corp. All rights reserved.
This presentation contains confidential information and may not be disclosed
without E*TRADE Financial Corporation’s written permission.
36
Appendix
Explanation of Non-GAAP Measures and Certain Metrics
Management believes that bank earnings before taxes and before credit losses
is an appropriate measure for evaluating the operating and liquidity
performance of the Company. Management believes that the elimination of certain
items from the related GAAP measures is helpful to investors and analysts who may wish to use some or all
of this information to analyze our current performance, prospects and valuation.
Management uses non-GAAP information internally to evaluate our operating performance in formulating our
budget for future periods.
(1)
Average
brokerage
assets
per
account
is
calculated
as
the
sum
of
security
holdings
and
brokerage
related
cash
divided
by
end
of
period
brokerage
accounts.
(2)
The
attrition
rate
is
calculated
by
dividing
attriting
(a)
brokerage
accounts,
by
total
brokerage
accounts,
for
the
previous
period
end.
This
measure
is
presented
annually
and
on
an
annualized
basis (where it appears quarterly).
(a) Attriting
brokerage accounts: Gross new brokerage accounts, less net new brokerage
accounts. (3) The net new brokerage assets metrics treat asset flows between
E*TRADE entities in the same manner as unrelated third party accounts.
(4)
Brokerage
asset
flows
are
calculated
by
dividing
the
total
amount
of
net
new
brokerage
assets
for
the
period,
by
the
total
amount
of
brokerage
assets
(a)
for
the
previous
period
end.
(a) Brokerage assets: Sum of security holdings and brokerage related cash.
(5) Growth rate is calculated using annualized revenue for 2010 based on the nine
months ended September 30, 2010. (6) Average customer yield includes customer
cash balances held by third parties. (7) Represents unpaid principal
balances. (8) Net paydowns
includes paydowns
on loans as well as limited origination activity, home equity advances, repurchase
activity, limited sale and securitization activities and transfers to real
estate owned assets.
(9) Capital generation (usage) represents the increase (decrease) in excess
risk-based capital at E*TRADE Bank excluding any capital downstreams. Q3
2010 Q2 2010
Q1 2010
Q4 2009
Q3 2009
Q2 2009
Q1 2009
Income (loss) before income tax benefit
35,544
$
52,259
$
(65,929)
$
(128,530)
$
(1,151,349)$
$
(211,496)
(344,056)
$
Add back:
Non-bank loss before income tax benefit (b)
49,775
49,860
58,016
80,286
1,032,910
71,731
84,525
Provision for loan losses
151,983
165,666
267,979
292,402
347,222
404,525
453,963
Gains on loans and securities, net
(46,904)
(48,908)
(29,046)
(18,667)
(41,979)
(73,170)
(35,290)
Net impairment
7,301
12,158
8,652
21,412
19,229
29,671
18,783
Losses on early extinguishment of FHLB advances
-
-
-
-
37,239
10,356
2,999
Bank earnings before taxes and before credit losses
197,699
$
231,035
$
239,672
$
246,903
$
243,272
$
231,617
$
180,924
$
(10) Bank earnings before taxes and before credit losses represents the pre-tax
earnings of E*TRADE Bank Holding Company (“Bank”) provision for loan losses, gains (losses) on loans and
securities, net, net impairment and losses on early extinguishment of FHLB
advances. This metric shows the amount of earnings that the Bank, after accruing for the interest expense on its
trust
preferred
securities,
generates
each
quarter
prior
to
credit
related
losses,
primarily
provision
and
losses
on
securities.
Management
believes
this
non-GAAP
measure
is
useful
to
investors
and
analysts
as
it
is
an
indicator
of
the
level
of
credit
related
losses
the
Bank
can
absorb
without
causing
a
decline
in
E*TRADE
Bank’s
excess
risk-based
capita
l(a).
Below
is
a
reconciliation of Bank earnings before taxes and before credit losses from loss
before income taxes: (a)
Excess risk-based capital is the excess capital that E*TRADE Bank has compared
to the regulatory minimum well-capitalized threshold.
(b)
Non-bank loss represents all of the Company’s subsidiaries, including
Corporate, but excluding the Bank. |
 ©
2010 E*TRADE Financial Corp. All rights reserved.
This presentation contains confidential information and may not be disclosed
without E*TRADE Financial Corporation’s written permission.
37
(11) Portfolio
changes
and
other
includes
the
decrease
in
risk
based
capital
required
for
our
one-
to
four-family,
home
equity
and
consumer
loan
portfolios,
the
decrease
(increase)
in
margin,
capital downstreams
or upstreams
and other capital changes.
Q3 2010
Q2 2010
Q1 2010
Q4 2009
Q3 2009
Q2 2009
Q1 2009
Beginning E*TRADE Bank excess risk-based capital ($MM)
1,008
$
946
$
899
$
985
$
911
$
444
$
715
$
Bank earnings before taxes and before credit losses
198
231
240
247
243
232
181
Provision for loan losses
(152)
(166)
(268)
(292)
(347)
(405)
(454)
Loan portfolio run-off
(a)
72
71
85
81
131
101
84
Margin decrease (increase)
22
(90)
(17)
(37)
(30)
(69)
36
Capital downstream (upstream)
(b)
(34)
(25)
(39)
(28)
100
500
-
Other capital changes
(c)
(24)
41
46
(57)
(23)
108
(118)
Ending E*TRADE Bank excess risk-based capital ($MM)
1,090
$
1,008
$
946
$
899
$
985
$
911
$
444
$
(a)
The
capital
release
from
loan
portfolio
run-off
includes
the
decrease
in
risk-based
capital
required
for
our
one-
to
four-family,
home
equity
and
consumer
loan
portfolios.
(b)
Represents cash flows to and from the parent company.
(c)
Represents the capital impact related to changes in other risk-weighted assets.
Appendix
FY 2009
Pre-tax net loss
(1,835,431)
$
Add back: pre-tax non-cash charge on Debt Exchange
968,254
Adjusted pre-tax net loss
(867,177)
$
(12) Capital ratios, thresholds and excess capital amounts are at the E*TRADE Bank
level. (13) In the third quarter of 2009, the Company exchanged $1.7 billion
aggregate principal amount of interest-bearing corporate debt for an equal principal amount of newly-issued non-interest-
bearing
convertible
debentures.
This
Debt
Exchange
resulted
in
a
pre-tax
non-cash
charge
of
$968
million.
The
following
table
provides
a
reconciliation
of
GAAP
pre-tax
net
loss
to
non-GAAP
pre-tax net loss for FY2009: |
