Attached files
| file | filename |
|---|---|
| EX-99.1 - EX-99.1 - VIVUS INC | a10-19844_1ex99d1.htm |
| 8-K - 8-K - VIVUS INC | a10-19844_18k.htm |
Exhibit 99.2
|
|
Amount of Cardiometabolic Risk Reduction Is Directly Associated With Magnitude of Weight Loss With Low-Dose, Controlled-Release Phentermine/Topiramate Louis J. Aronne, MD New York-Presbyterian/Weill Cornell University, New York, NY Samuel Klein, MD William H. Danforth Professor of Medicine and Nutritional Science Washington University School of Medicine Craig A. Peterson, MS VIVUS, Inc. 1 |
|
|
Dr. Aronne has the following consulting and financial relationships to disclose: Grant/Research Support: Amylin, Arena, Merck, Orexigen, Pfizer, Vivus Consultant: GlaxoSmithKline, Neurosearch, Pfizer Major Stock Shareholder: Cardiometabolic Support Network Dr. Klein has the following consulting and financial relationships to disclose: Consultant in medical advisory boards for Amylin, Ethicon Endosurgery, Orexigen, Takeda, Vivus Stockholder in Aspiration Medical Technologies Disclosures 2 |
|
|
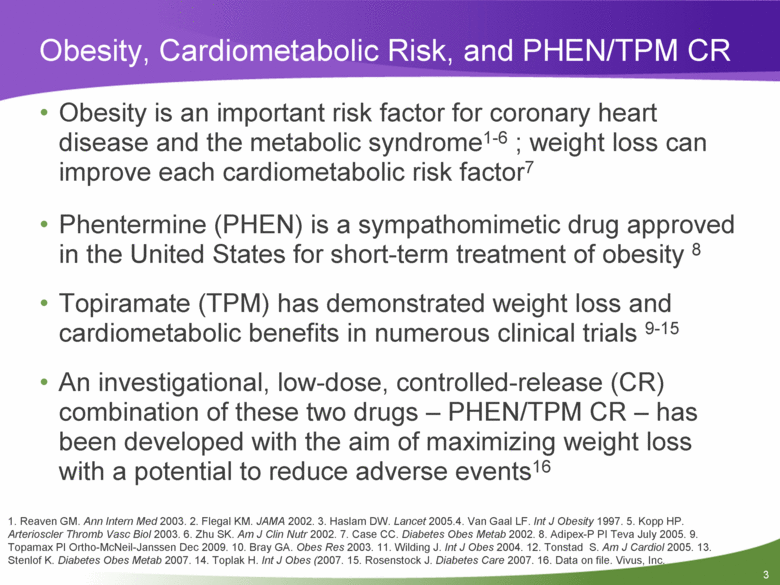
Obesity is an important risk factor for coronary heart disease and the metabolic syndrome1-6 ; weight loss can improve each cardiometabolic risk factor7 Phentermine (PHEN) is a sympathomimetic drug approved in the United States for short-term treatment of obesity 8 Topiramate (TPM) has demonstrated weight loss and cardiometabolic benefits in numerous clinical trials 9-15 An investigational, low-dose, controlled-release (CR) combination of these two drugs – PHEN/TPM CR – has been developed with the aim of maximizing weight loss with a potential to reduce adverse events16 Obesity, Cardiometabolic Risk, and PHEN/TPM CR 1. Reaven GM. Ann Intern Med 2003. 2. Flegal KM. JAMA 2002. 3. Haslam DW. Lancet 2005.4. Van Gaal LF. Int J Obesity 1997. 5. Kopp HP. Arterioscler Thromb Vasc Biol 2003. 6. Zhu SK. Am J Clin Nutr 2002. 7. Case CC. Diabetes Obes Metab 2002. 8. Adipex-P PI Teva July 2005. 9. Topamax PI Ortho-McNeil-Janssen Dec 2009. 10. Bray GA. Obes Res 2003. 11. Wilding J. Int J Obes 2004. 12. Tonstad S. Am J Cardiol 2005. 13. Stenlof K. Diabetes Obes Metab 2007. 14. Toplak H. Int J Obes (2007. 15. Rosenstock J. Diabetes Care 2007. 16. Data on file. Vivus, Inc. 3 |
|
|
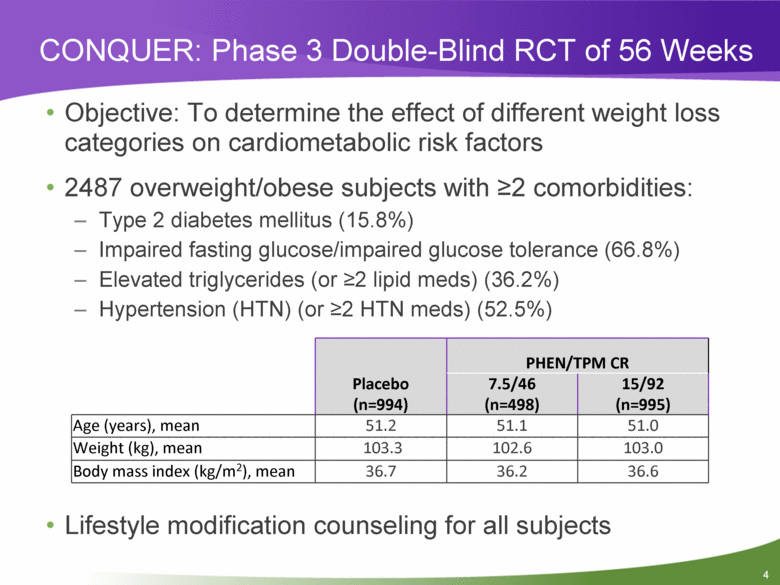
Objective: To determine the effect of different weight loss categories on cardiometabolic risk factors 2487 overweight/obese subjects with >2 comorbidities: Type 2 diabetes mellitus (15.8%) Impaired fasting glucose/impaired glucose tolerance (66.8%) Elevated triglycerides (or >2 lipid meds) (36.2%) Hypertension (HTN) (or >2 HTN meds) (52.5%) Lifestyle modification counseling for all subjects CONQUER: Phase 3 Double-Blind RCT of 56 Weeks Placebo (n=994) PHEN/TPM CR 7.5/46 (n=498) 15/92 (n=995) Age (years), mean 51.2 51.1 51.0 Weight (kg), mean 103.3 102.6 103.0 Body mass index (kg/m2), mean 36.7 36.2 36.6 4 |
|
|
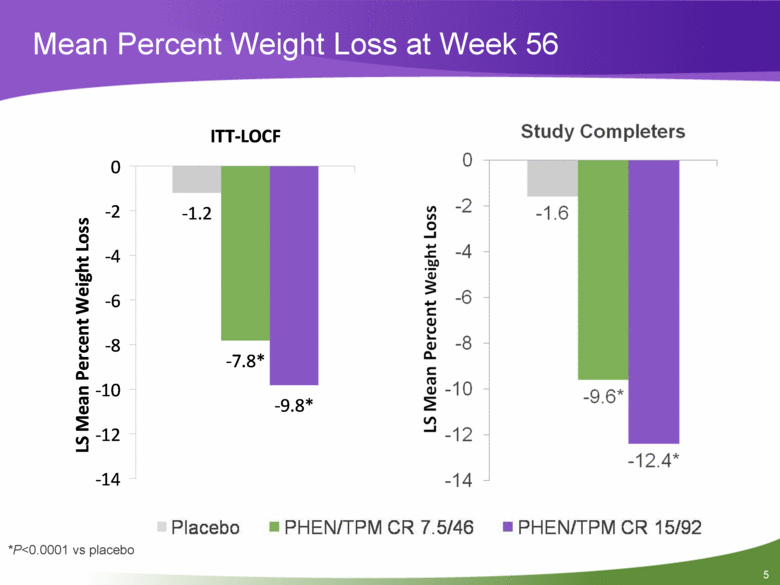
Mean Percent Weight Loss at Week 56 *P<0.0001 vs placebo -1.2 -7.8* -9.8* -14 -12 -10 -8 -6 -4 -2 0 ITT-LOCF LS Mean Percent Weight Loss 5 |
|
|
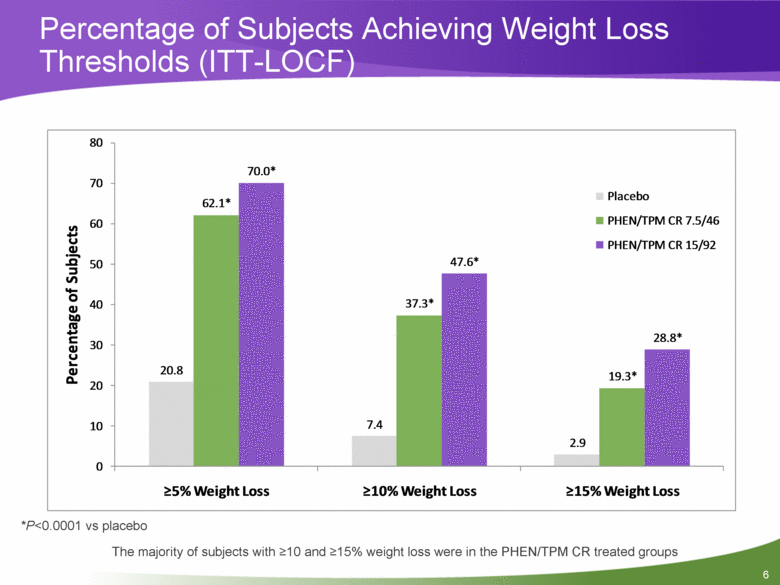
Percentage of Subjects Achieving Weight Loss Thresholds (ITT-LOCF) *P<0.0001 vs placebo The majority of subjects with >10 and >15% weight loss were in the PHEN/TPM CR treated groups 20.8 7.4 2.9 62.1* 37.3* 19.3* 70.0* 47.6* 28.8* 0 10 20 30 40 50 60 70 80 >5% Weight Loss >10% Weight Loss >15% Weight Loss Percentage of Subjects Placebo PHEN/TPM CR 7.5/46 PHEN/TPM CR 15/92 6 |
|
|
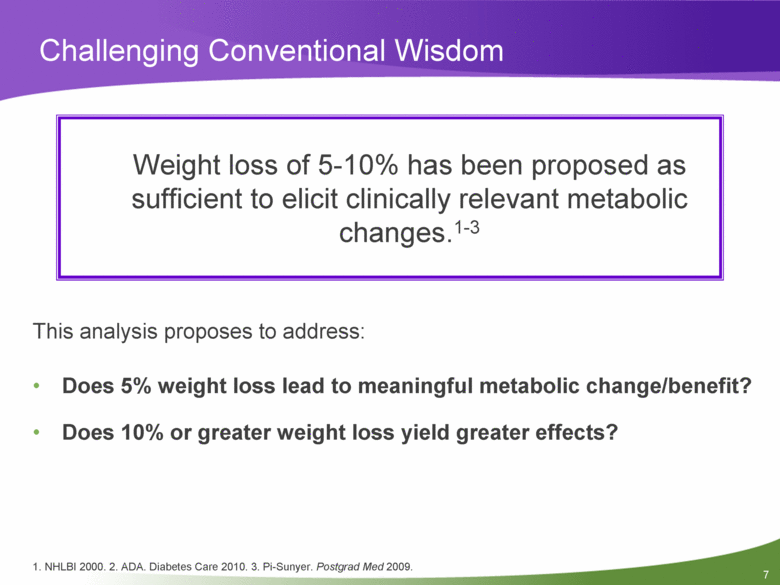
This analysis proposes to address: Does 5% weight loss lead to meaningful metabolic change/benefit? Does 10% or greater weight loss yield greater effects? Challenging Conventional Wisdom 1. NHLBI 2000. 2. ADA. Diabetes Care 2010. 3. Pi-Sunyer. Postgrad Med 2009. Weight loss of 5-10% has been proposed as sufficient to elicit clinically relevant metabolic changes.1-3 7 |
|
|
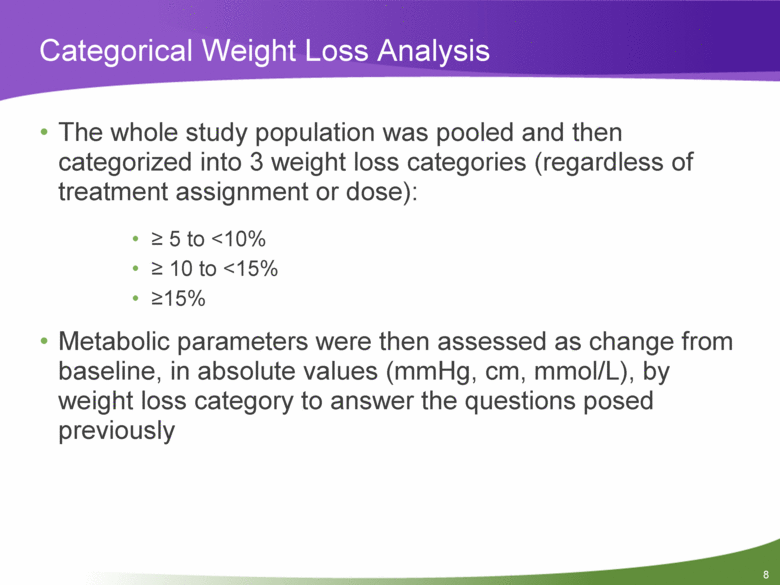
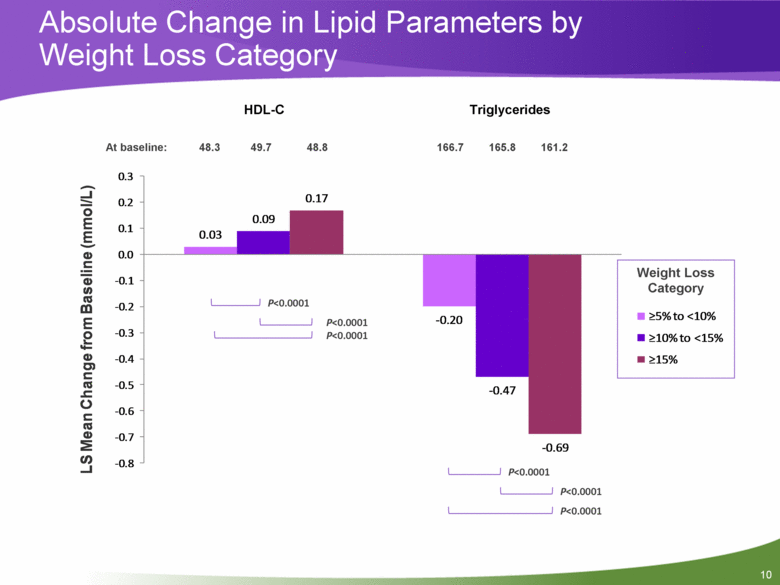
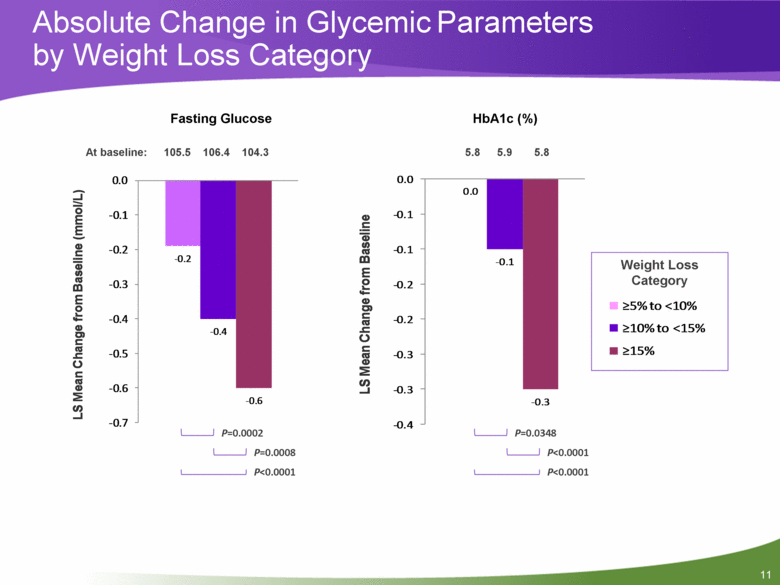
The whole study population was pooled and then categorized into 3 weight loss categories (regardless of treatment assignment or dose): > 5 to <10% > 10 to <15% >15% Metabolic parameters were then assessed as change from baseline, in absolute values (mmHg, cm, mmol/L), by weight loss category to answer the questions posed previously Categorical Weight Loss Analysis 8 |
|
|
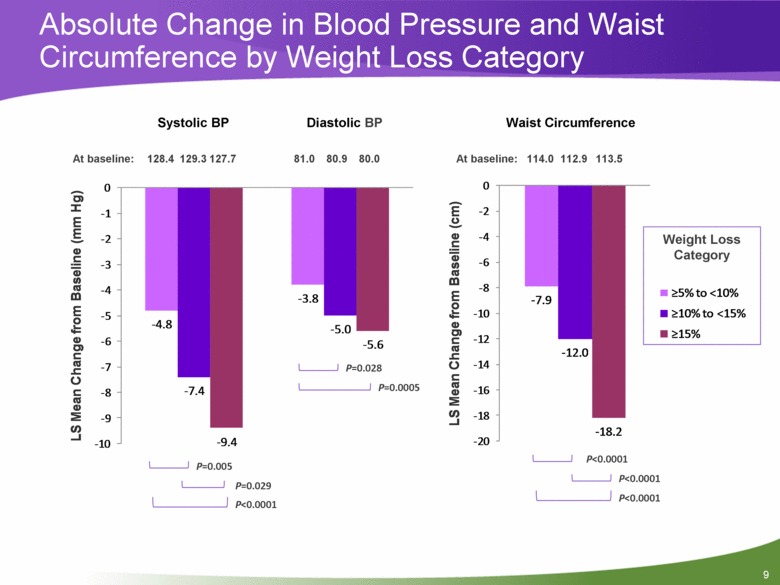
9 Absolute Change in Blood Pressure and Waist Circumference by Weight Loss Category P=0.029 P<0.0001 P=0.0005 P=0.028 P=0.005 Weight Loss Category P<0.0001 P<0.0001 P<0.0001 128.4 129.3 127.7 81.0 80.9 80.0 At baseline: 114.0 112.9 113.5 At baseline: Systolic BP Diastolic BP Waist Circumference - 4.8 - 3.8 - 7.4 - 5.0 - 9.4 - 5.6 - 10 - 9 - 8 - 7 - 6 - 5 - 4 - 3 - 2 - 1 0 LS Mean Change from Baseline (mm Hg) - 7.9 - 12.0 - 18.2 - 20 - 18 - 16 - 14 - 12 - 10 - 8 - 6 - 4 - 2 0 LS Mean Change from Baseline (cm) >5% to <10% >10% to <15% >15% |
|
|
10 Absolute Change in Lipid Parameters by Weight Loss Category Weight Loss Category 48.3 49.7 48.8 166.7 165.8 161.2 At baseline: P<0.0001 P<0.0001 P<0.0001 P<0.0001 P<0.0001 P<0.0001 HDL-C Triglycerides 0.03 - 0.20 0.09 - 0.47 0.17 - 0.69 - 0.8 - 0.7 - 0.6 - 0.5 - 0.4 - 0.3 - 0.2 - 0.1 0.0 0.1 0.2 0.3 LS Mean Change from Baseline (mmol/L) >5% to <10% >10% to <15% >15% |
|
|
11 Absolute Change in Glycemic Parameters by Weight Loss Category P<0.0001 P=0.0348 Weight Loss Category P=0.0002 P=0.0008 P<0.0001 P<0.0001 105.5 106.4 104.3 At baseline: Fasting Glucose HbA1c (%) 5.8 5.9 5.8 - 0.2 - 0.4 - 0.6 - 0.7 - 0.6 - 0.5 - 0.4 - 0.3 - 0.2 - 0.1 0.0 LS Mean Change from Baseline (mmol/L) 0.0 - 0.1 - 0.3 - 0.4 - 0.3 - 0.3 - 0.2 - 0.2 - 0.1 - 0.1 0.0 LS Mean Change from Baseline ?5% to <10% ?10% to <15% ?15% |
|
|
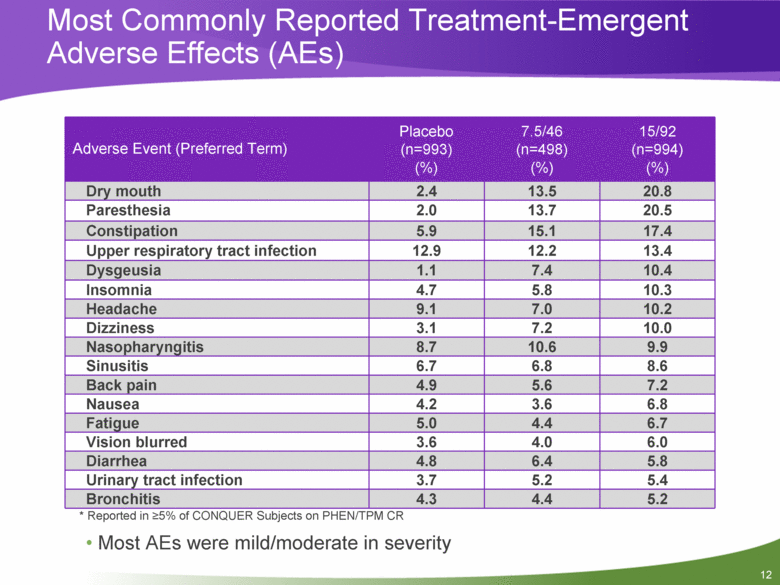
12 Most Commonly Reported Treatment-Emergent Adverse Effects (AEs) Adverse Event (Preferred Term) Placebo (n=993) (%) 7.5/46 (n=498) (%) 15/92 (n=994) (%) Dry mouth 2.4 13.5 20.8 Paresthesia 2.0 13.7 20.5 Constipation 5.9 15.1 17.4 Upper respiratory tract infection 12.9 12.2 13.4 Dysgeusia 1.1 7.4 10.4 Insomnia 4.7 5.8 10.3 Headache 9.1 7.0 10.2 Dizziness 3.1 7.2 10.0 Nasopharyngitis 8.7 10.6 9.9 Sinusitis 6.7 6.8 8.6 Back pain 4.9 5.6 7.2 Nausea 4.2 3.6 6.8 Fatigue 5.0 4.4 6.7 Vision blurred 3.6 4.0 6.0 Diarrhea 4.8 6.4 5.8 Urinary tract infection 3.7 5.2 5.4 Bronchitis 4.3 4.4 5.2 * Reported in >5% of CONQUER Subjects on PHEN/TPM CR Most AEs were mild/moderate in severity |
|
|
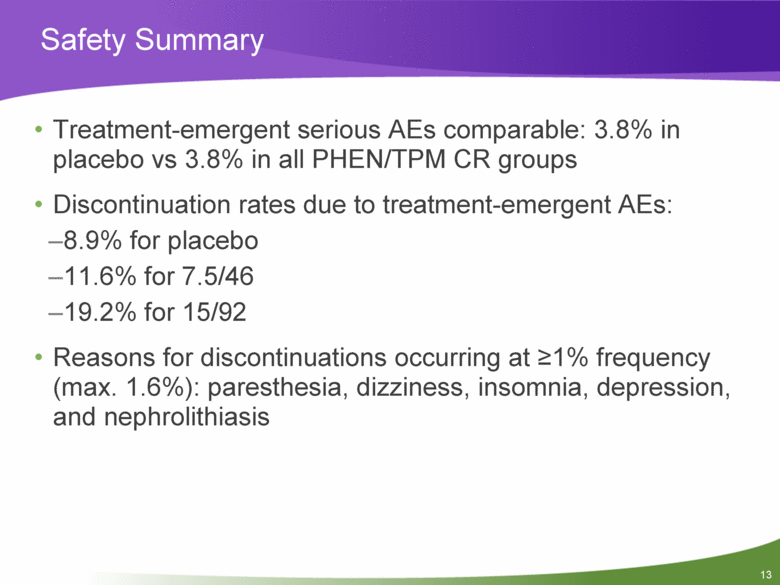
13 Safety Summary Treatment-emergent serious AEs comparable: 3.8% in placebo vs 3.8% in all PHEN/TPM CR groups Discontinuation rates due to treatment-emergent AEs: 8.9% for placebo 11.6% for 7.5/46 19.2% for 15/92 Reasons for discontinuations occurring at >1% frequency (max. 1.6%): paresthesia, dizziness, insomnia, depression, and nephrolithiasis |
|
|
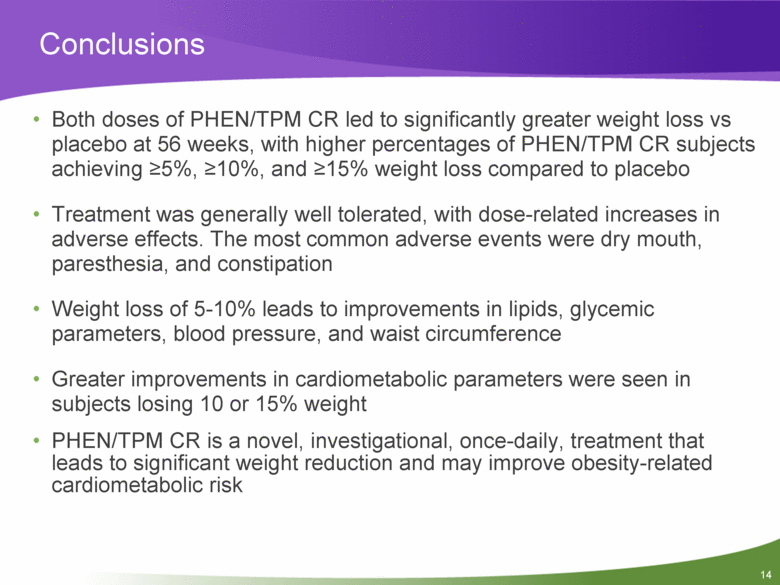
14 Both doses of PHEN/TPM CR led to significantly greater weight loss vs placebo at 56 weeks, with higher percentages of PHEN/TPM CR subjects achieving >5%, >10%, and >15% weight loss compared to placebo Treatment was generally well tolerated, with dose-related increases in adverse effects. The most common adverse events were dry mouth, paresthesia, and constipation Weight loss of 5-10% leads to improvements in lipids, glycemic parameters, blood pressure, and waist circumference Greater improvements in cardiometabolic parameters were seen in subjects losing 10 or 15% weight PHEN/TPM CR is a novel, investigational, once-daily, treatment that leads to significant weight reduction and may improve obesity-related cardiometabolic risk Conclusions |

