Attached files
| file | filename |
|---|---|
| EX-21.1 - EXHIBIT 21.1 - Mistras Group, Inc. | ex21_1.htm |
| EX-32.2 - EXHIBIT 32.2 - Mistras Group, Inc. | ex32_2.htm |
| EX-32.1 - EXHIBIT 32.1 - Mistras Group, Inc. | ex32_1.htm |
| EX-31.2 - EXHIBIT 31.2 - Mistras Group, Inc. | ex31_2.htm |
| EX-23.1 - EXHIBIT 23.1 - Mistras Group, Inc. | ex23_1.htm |
| EX-31.1 - EXHIBIT 31.1 - Mistras Group, Inc. | ex31_1.htm |
UNITED STATES
SECURITIES AND EXCHANGE COMMISSION
SECURITIES AND EXCHANGE COMMISSION
Washington, D.C. 20549
Form 10-K
ANNUAL REPORT PURSUANT TO SECTION 13 OR 15(d) OF THE
SECURITIES EXCHANGE ACT OF 1934
For the fiscal year ended May 31, 2010
Commission File Number 001-34481
Mistras Group, Inc.
(Exact name of registrant as specified in its charter)
|
Delaware
|
22-3341267
|
|
|
(State or other jurisdiction of
incorporation or organization)
|
|
(I.R.S. Employer
Identification Number)
|
195 Clarksville Road
Princeton Junction, New Jersey 08550
(609) 716-4000
(Address, including zip code, and telephone number, including area code, of registrant’s principal executive offices)
Securities registered pursuant to Section 12(b) of the Act:
|
Title of each class
|
|
Name of each exchange on which registered
|
|
Common Stock, par value $.01 par value
|
|
New York Stock Exchange
|
Securities registered pursuant to Section 12(g) of the Act: None
Indicate by check mark whether the registrant is a well-known seasoned issuer, as defined in Rule 405 of the Securities Act of 1933.
Yes o No þ
Indicate by check mark if the registrant is not required to file reports pursuant to Section 13 or Section 15(d) of the Securities Exchange Act of 1934 (the “Exchange Act”).
Yes o No þ
Indicate by check mark whether the registrant (1) has filed all reports required to be filed by Section 13 or 15(d) of the Exchange Act during the preceding 12 months (or for such shorter period that the registrant was required to file such reports), and (2) has been subject to such filing requirements for the past 90 days.
Yes þ No o
Indicate by check mark whether the registrant has submitted electronically and posted on its corporate Web site, if any, every Interactive Data File required to be submitted and posted pursuant to Rule 405 of Regulation S-T during the preceding 12 months (or for such shorter period that the registrant was required to submit and post such files).
Yes o No o
Indicate by check mark if disclosure of delinquent filers pursuant to Item 405 of Regulation S-K is not contained herein, and will not be contained, to the best of Registrant’s knowledge, in definitive proxy or information statements incorporated by reference in Part III of this Form 10-K or any amendment to this Form 10-K. þ
Indicate by check mark whether the registrant is a large accelerated filer, an accelerated filer, a non-accelerated filer or a smaller reporting company. See the definitions of “large accelerated filer,” “accelerated filer” and “smaller reporting company” in Rule 12b-2 of the Exchange Act. (Check one):
|
Large accelerated filer o
|
|
Accelerated filer o
|
|
|
|
|
|
Non-accelerated filer x
|
|
Smaller reporting company o
|
Indicate by check mark whether the registrant is a shell company (as defined in Rule 12b-2 of the Exchange Act).
Yes o No þ
The aggregate market value of the voting and non-voting common stock held by non-affiliates of the Registrant as of November 30, 2009, based upon the closing price of the common stock as reported by New York Stock Exchange on such date was approximately $133.8 million.
As of August 1, 2010, a total of 26,663,528 shares of the Registrant’s common stock were outstanding.
DOCUMENTS INCORPORATED BY REFERENCE
Information required by Part III (Items 10, 11, 12, 13 and 14) is incorporated by reference to portions of the registrant’s definitive Proxy Statement for its 2010 Annual Meeting of Stockholders (the “Proxy Statement”), which is expected to be filed not later than 120 days after the registrant’s fiscal year ended May 31, 2010. Except as expressly incorporated by reference, the Proxy Statement shall not be deemed to be a part of this report on Form 10-K.
MISTRAS GROUP, INC.
REPORT ON FORM 10-K
TABLE OF CONTENTS
|
PART I
|
||||
|
3
|
||||
|
24
|
||||
|
35
|
||||
|
35
|
||||
|
36
|
||||
|
36
|
||||
| EXECUTIVE OFFICERS |
36
|
|||
|
PART II
|
||||
|
38
|
||||
|
39
|
||||
|
40
|
||||
|
61
|
||||
|
63
|
||||
|
93
|
||||
|
93
|
||||
|
93
|
||||
|
|
||||
|
93
|
||||
|
94
|
||||
|
94
|
||||
|
94
|
||||
|
94
|
||||
|
|
||||
|
95
|
||||
|
97
|
||||
2
|
BUSINESS
|
FORWARD-LOOKING STATEMENTS
This Report on Form 10-K contains forward-looking statements regarding us and our business, financial condition, results of operations and prospects within the meaning of the Private Securities Litigation Reform Act of 1995. Such forward-looking statements include those that express plans, anticipation, intent, contingency, goals, targets or future development and/or otherwise are not statements of historical fact. These forward-looking statements are based on our current expectations and projections about future events and they are subject to risks and uncertainties known and unknown that could cause actual results and developments to differ materially from those expressed or implied in such statements. These forward-looking statements include statements about the following:
|
●
|
our evaluation of the history and the dynamics supporting the demand and growth in the asset protection solutions market;
|
|
|
●
|
estimates of market sizes and anticipated uses of our asset protection solutions;
|
|
|
●
|
our business strategy and our underlying assumptions about data and trends in the markets for asset protection solutions;
|
|
|
●
|
our ability to market, commercialize and achieve market acceptance for our asset protection solutions;
|
|
|
●
|
our estimates regarding future revenues, expenses, capital requirements, liquidity, the sufficiency of our cash resources and our needs for additional financing;
|
|
|
●
|
our ability to protect our intellectual property and operate our business without infringing upon the intellectual property rights of others; and
|
|
|
●
|
management’s goals, expectations and objectives and other similar expressions concerning matters that are not historical facts.
|
Actual events, results and outcomes may differ materially from our expectations due to a variety of factors. Although it is not possible to identify all of these factors, they include, among others, the following:
|
●
|
loss of or reduction in business with a significant customer;
|
|
|
●
|
an accident or incident involving our asset protection solutions;
|
|
|
●
|
our current dependence on customers in the oil and gas industry;
|
|
|
●
|
our ability to attract and retain trained engineers, scientists and other highly skilled workers as well as members of senior management;
|
|
|
●
|
strengths and actions of our competitors;
|
|
|
●
|
the timing, size and integration success of potential future acquisitions;
|
|
|
●
|
catastrophic events that cause disruptions to our business or the business of our customers; and
|
|
|
●
|
the continuing uncertain economic environment.
|
In some cases, you can identify forward-looking statements by terminology, such as “goals,” or “expects,” “anticipates,” “intends,” “plans,” “believes,” “seeks,” “estimates,” or the negative of such terms or other similar expressions. You are urged not to place undue reliance on any such forward-looking statements, any of which may turn out to be wrong due to inaccurate assumptions, unknown risks, uncertainties or other factors. Factors that could cause or contribute to differences in results and outcomes from those in our forward-looking statements include, without limitation, those discussed elsewhere in this Report in Part I, Item 1A. “Risk Factors” and in this Item 1, as well as those discussed in our other Securities and Exchange Commission (SEC) filings.
3
We urge you to carefully read and consider the disclosures found in these filings, all of which are available in the SEC EDGAR database at www.sec.gov. Except as otherwise required in our reports on Form 10-Q or Form 8-K as applicable, we undertake no obligation to (and expressly disclaim any such obligation to) revise or update the statements made herein or the risk factors that may relate thereto whether as a result of new information, future events or otherwise.
The following discussions should be read in conjunction with the sections of this Report entitled “Management’s Discussion and Analysis of Financial Condition and Results of Operations” and “Risk Factors”.
Our business
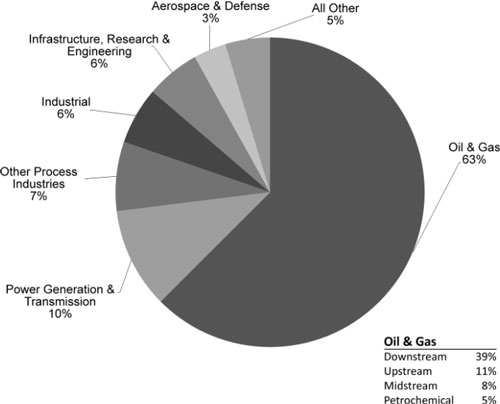
We are a “one source” leading global provider of technology-enabled asset protection solutions used to evaluate the structural integrity of critical energy, industrial and public infrastructure. We combine industry-leading products and technologies, expertise in mechanical integrity (MI) and non-destructive testing (NDT) services and proprietary data analysis and enterprise warehousing software to deliver a comprehensive portfolio of customized solutions, ranging from routine inspections to complex, plant-wide asset integrity assessments and management. These mission critical solutions enhance our customers’ ability to comply with governmental safety and environmental regulations, extend the useful life of their assets, increase productivity, minimize repair costs, manage risk and avoid catastrophic disasters. Given the role our services play in ensuring the safe and efficient operation of infrastructure, we have historically provided a majority of our services to our customers on a regular, recurring basis. We serve a global customer base of companies with asset-intensive infrastructure, including companies in the oil and gas (downstream, midstream & upstream), fossil and nuclear power, public infrastructure, chemicals, aerospace and defense, transportation, primary metals and metalworking, pharmaceutical/biotechnology, food processing and research and engineering institutions. As of May 31, 2010, we had approximately 2,300 employees, including 30 Ph.D.’s and more than 100 other degreed engineers and highly-skilled, certified technicians, in 72 offices across 15 countries. We have established long-term relationships as a critical solutions provider to many of the leading companies in our target markets. The following chart represents the percentage of consolidated revenues we generated from our various markets for fiscal 2010.
Mistras revenues by end market
(fiscal 2010)
4
Our asset protection solutions continuously evolve over time as we combine the disciplines of NDT, MI services and data analysis and data warehousing software to provide value to our customers. The foundation of our business is NDT, which is the examination of assets without impacting current and future usefulness or impairing the integrity of these assets. The ability to inspect infrastructure assets and not interfere with their operating performance makes NDT a highly attractive alternative to many traditional intrusive inspection techniques, which may require dismantling equipment or shutting down a plant, mill or site. Our MI services are a systematic engineering-based approach to developing best practices for ensuring the on-going integrity and safety of equipment and industrial facilities. MI services involve conducting an inventory of infrastructure assets, developing and implementing inspection and maintenance procedures, training personnel in executing these procedures and managing inspections, testing and assessments of customer assets. By assisting customers in implementing MI programs we enable them to identify gaps between existing and desired practices, find and track deficiencies and degradations to be corrected and establish quality assurance standards for fabrication, engineering and installation of infrastructure assets. We believe our MI services improve plant safety and reliability and regulatory compliance, and in so doing reduce maintenance costs. Our solutions also incorporate comprehensive data analysis from our proprietary asset protection software to provide customers with detailed, integrated and cost-effective solutions that rate the risks of alternative maintenance approaches and recommend actions in accordance with consensus industry codes and standards and help to establish and support key performance indicators (KPI’s) to ensure continued safe and economic operations.
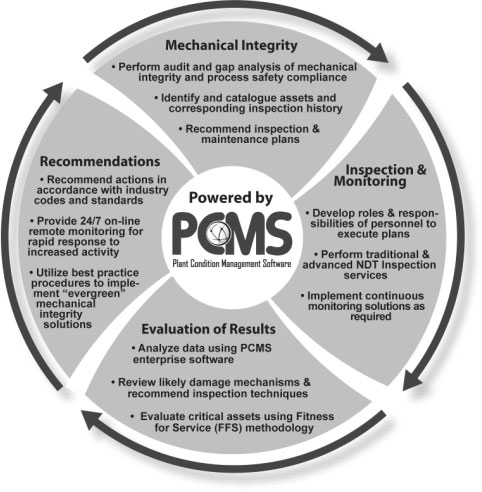
We differentiate ourselves by delivering these solution under our “One Source” umbrella utilizing a proven systematic method that creates a closed loop life cycle for addressing continuous asset protection and improvement as illustrated below. Under this business model, customers outsource their inspection to us on a “run and maintain” basis.
5
As a global asset protection leader, we provide a comprehensive range of solutions that includes:
|
●
|
traditional outsourced NDT services conducted by our technicians, mechanical integrity assessments, above-ground storage tank inspection and American Petroleum Institute (“API”) visual inspections and predictive maintenance (“PDM”) program development;
|
|
●
|
advanced asset protection solutions, in most cases involving proprietary acoustic emission (“AE”), digital radiography, infrared, wireless and/or automated ultrasonic sensors, which are operated by our highly trained technicians;
|
|
●
|
a proprietary and customized portfolio of software products for testing and analyzing data captured in real-time by our technicians and sensors, including advanced features such as pattern recognition and neural networks;
|
|
●
|
enterprise software and relational databases to store and analyze inspection data comparing to prior operations and testing of similar assets, industrial standards and specific risk conditions, such as use with highly flammable or corrosive materials, and developing asset integrity management plans based on risk-based inspection that specify an optimal schedule for the testing, maintenance and retirement of assets; and
|
|
●
|
on-line monitoring systems that provide for secure web-based remote or on-site asset inspection, real-time reports and analysis of plant or enterprise-wide structural integrity data, comparison of integrity data to our library of historical inspection data and analysis to better assess structural integrity and provide alerts for and prioritize future inspections and maintenance.
|
We offer our customers a customized package of services, products and systems or our enterprise software and other niche high-value products on a stand-alone basis. For example, customers can purchase most of our sensors and accompanying software to integrate with their own systems, or they can purchase a complete turn-key solution, including our installation, monitoring and assessment services. Importantly, however, we do not sell certain of our advanced and proprietary software and other products as stand-alone offerings; instead, we embed them in our comprehensive service offerings to protect our investment in intellectual property while providing an added value which generates a substantial source of recurring revenues.
We generated revenues of $272.1 million, $209.1 million and $152.3 million and adjusted EBITDA of $39.5 million, $31.1 million and $28.1 million for fiscal 2010, 2009 and 2008, respectively. An explanation of adjusted EBITDA and a reconciliation of these amounts to net income are set forth on page 40 For fiscal 2010, we generated approximately 84% of our revenues from our Services segment. Our revenues are diversified, with our top 10 customers accounting for approximately 45%, 35% and 39% of our revenues during fiscal 2010, 2009 and 2008, respectively. We provide our asset protection solutions to multiple divisions, locations and business units of major oil and gas corporations and power generation companies across the globe. Our largest customer accounted for approximately 18%, 17%, and 17% of our revenues for fiscal 2010, 2009 and 2008, respectively. No other customer accounted for more than 7% of our revenues during fiscal 2010, 2009 or 2008.
Asset protection industry overview
Asset protection is a large and rapidly growing industry that consists of NDT inspection, MI services and inspection data warehousing and analysis. NDT plays a crucial role in assuring the operational and structural integrity of critical infrastructure without compromising the usefulness of the tested materials or equipment. The evolution of NDT services, in combination with broader industry trends, including increased asset utilization and aging of infrastructure, the desire by companies to extend the useful life of their existing infrastructure, new construction projects, enhanced government regulation and the shortage of certified NDT professionals have made NDT an integral and increasingly outsourced part of many asset-intensive industries. Well-publicized industrial and public infrastructure failures and accidents such as the Deepwater Horizon oil spill in the Gulf of Mexico and the I-35W Mississippi River bridge collapse in Minnesota have raised the level of safety awareness of regulators, and owners and operators are recognizing the benefits that asset protection solutions can provide.
Historically, NDT solutions predominantly used qualitative testing methods aimed primarily at detecting defects in the tested materials. This methodology, which we categorize as “traditional NDT,” is typically labor intensive and, as a result, considerably dependent upon the availability and skill level of the certified technicians, engineers and scientists performing the inspection services. The traditional NDT market is highly fragmented, with a significant number of small vendors providing inspection services to divisions of companies or local governments situated in close proximity to the vendor’s field inspection engineers and scientists. Today, we believe that customers are increasingly looking for a single vendor capable of providing a wider spectrum of asset protection solutions for their global infrastructure that we call “one-source”. This shift in underlying demand, which began in the early 1990s, has contributed to a transition from traditional NDT solutions to more advanced solutions that employ automated digital sensor technologies and accompanying enterprise software, allowing for the effective capture, storage, analysis and reporting of inspection and engineering results electronically and in digital formats. These advanced techniques, taken together with advances in wired and wireless communication and information technologies, have further enabled the development of remote monitoring systems, asset-management and predictive maintenance capabilities and other data analytics and management. We believe that as advanced asset protection solutions continue to gain acceptance among asset-intensive organizations, only those vendors offering broad, complete and integrated solutions, scalable operations and a global footprint will have a distinct competitive advantage. Moreover, we believe that vendors that are able to effectively deliver both advanced solutions and data analytics, by virtue of their ownership of customers’ data, develop a significant barrier to entry for competitors, and so develop the capability to create significant recurring revenues.
6
We believe the following represent key dynamics driving the growth of the asset protection industry:
|
●
|
Extending the Useful Life of Aging Infrastructure. The prohibitive cost and challenge of building new infrastructure has resulted in the significant aging of existing infrastructure and caused companies to seek ways to extend the useful life of existing assets. For example, due to the significant cost associated with constructing new refineries, stringent environmental regulations which have increased the costs of managing them and difficulty in finding suitable locations on which to build them, no new refineries have been constructed in the United States since 1976. Another example is in the area of power transmission & distribution. The Smart Grid initiative in the United States is causing increased loading on aging transformers that are more than 30 years old in most cases. The need to test and monitor these units to ensure their reliability until replacement is instrumental in support of a reliable Smart Grid network. Because aging infrastructure requires relatively higher levels of maintenance and repair in comparison to new infrastructure, as well as more frequent, extensive and ongoing testing, companies and public authorities are increasing spending to ensure the operational and structural integrity of existing infrastructure.
|
|
●
|
Outsourcing of Non-Core Activities and Technical Resource Constraints. While many of our customers have historically performed NDT services in-house, the increasing sophistication and automation of NDT programs, together with a decreasing supply of skilled professionals and stricter governmental regulations, has led many companies and public authorities to outsource NDT to providers that have the necessary technical product portfolio, engineering expertise, technical workforce and proven track record of results-oriented performance to effectively meet their increasing requirements.
|
|
●
|
Increasing Asset and Capacity Utilization. Due to high energy prices, high repair and replacement costs and the limited construction of new infrastructure, existing infrastructure in some of our target markets is being used at higher capacities, causing increased stress and fatigue that accelerate deterioration. These higher prices and costs also motivate our customers to complete repairs, maintenance, replacements and upgrades more quickly. For example, increasing demand for refined petroleum products, combined with high plant utilization rates,, is driving refineries to upgrade facilities to make them more efficient and expand capacity. In order to sustain high capacity utilization rates, customers are increasingly using asset protection solutions to efficiently ensure the integrity and safety of their assets. Implementation of asset protection solutions can also lead to increased productivity as a result of reduced maintenance-related downtime.
|
|
●
|
Increasing Corrosion from Low-Quality Inputs. High commodities prices and increasing energy demands have led to the use of lower grade raw materials and feedstock’s, such as low-grade coal or petroleum, used in refinery and power generation processes. These lower grade raw materials and feedstock’s, especially in the case of the refining process, can rapidly corrode the infrastructure they come into contact with, which in turn increases the need for asset protection solutions to identify such corrosion and enable infrastructure owners to proactively combat the problems caused by such corrosion.
|
|
●
|
Increasing Use of Advanced Materials. Customers in our target markets are increasingly utilizing advanced materials, such as composites, and other unique technologies in the manufacturing and construction of new infrastructure and aerospace applications. As a result, they require advanced testing, assessment and maintenance technologies to inspect and to protect these assets, since many of these advanced materials cannot be tested using traditional NDT techniques. We believe that demand for NDT solutions will increase as companies and public authorities continue to use these advanced materials, not only during the operating phase of the lifecycle of their assets, but also during the design, manufacturing and quality control phases and integrating and embedding sensors directly into the end product in support of total life cycle asset management.
|
7
|
●
|
Meeting Safety Regulations. Owners and operators of infrastructure assets increasingly face strict government regulations and safety requirements. Failure to meet these standards can result in significant financial liabilities, increased scrutiny by OSHA and other regulators, higher insurance premiums and tarnished corporate brand value. There have been several industrial accidents, including explosions and fires, in recent years. These accidents created significant damage to the reputation of refineries and coupled with concern by owners, and led OSHA to strengthen process safety enforcement standards with the implementation of the National Emphasis Program (NEP) that also extends to chemical plants for compliance with Process Safety Management Regulation 29 CFR 1919.119. As a result, these owners and operators are seeking highly reliable asset protection suppliers with a proven track record of providing asset protection services, products and systems to assist them in meeting these increasingly stringent regulations.
|
|
●
|
Expanding Addressable End-Markets. Advances in NDT sensor technology and asset protection software systems, and the continued emergence of new technologies, are creating increased demand for asset protection solutions in applications where existing techniques were previously ineffective. Further, we expect increased demand in relatively new markets, such as the pharmaceutical and food processing industries, where infrastructure is only now aging to a point where significant maintenance is required.
|
|
●
|
Expanding Addressable Geographies. We believe that a substantial driver of incremental demand will come from international markets, including Asia, Europe and Latin America. Specifically, as companies and governments in these markets build and maintain infrastructure and applications that require the use of asset protection solutions, we believe demand for our solutions will increase.
|
We believe that the market available to us will continue to grow rapidly as a result of macro-market trends, including aging infrastructure, use of more advanced materials, such as composites, and the increasing outsourcing of asset protection solutions by companies who historically performed these services using internal resources.
Our target markets
We focus our sales, marketing and product development efforts on a range of infrastructure-intensive industries and governmental authorities. With our portfolio of asset protection services, products and systems, we can effectively serve our customer base throughout the lifecycle of their assets, beginning at the design stage, through the construction and maintenance phase and, as necessary, through the decommissioning of their infrastructure.
In general, our largest market in broad terms is energy related infrastructure. According to the United States Energy Information Administration (“EIA”) international outlook published in May 2010, overall world marketed energy consumption is expected to increase by 49 percent from 2007 to 2035. The most rapid growth in energy demand from 2007 to 2035 is expected to occur in nations outside the Organization for Economic Cooperation and Development (“non-OECD nations”), where energy consumption increases by 84 percent compared with a 14 percent increase in energy use among OECD countries. The global economic recession that began in 2008 and has continued has had an impact on world energy demand in the near term. Total world marketed energy consumption contracted by approximately 1% in 2008 and by an estimated 2% in 2009, as manufacturing and consumer demand for goods and services declined. Although the recession appears to have ended, the pace of recovery has been uneven so far, however, it is anticipated as the economic situation improves, most nations return to the economic growth paths that were anticipated before the recession began. Despite the near term impacts on our overall market, the other drivers of growth (aging infrastructure, need for safety and compliance, trends toward outsourcing) have minimized a decline in our opportunities.
World marketed energy use by fuel type (quadrillion Btu)*
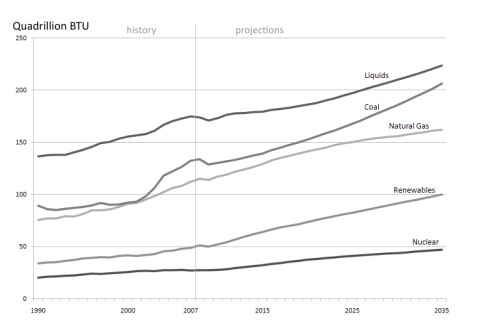
| Source: EIA |
8
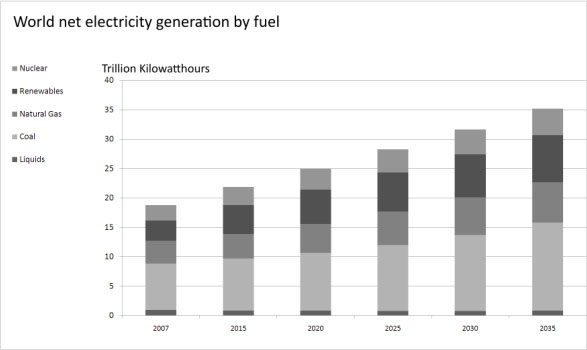
An important subset of this energy market for our asset protection solutions is the world’s electricity market where world net electricity generation is estimated by the EIA to increase by 87%, from 18.8 trillion kilowatt hours in 2007 to 25.0 trillion kilowatt hours in 2020 and 35.2 trillion kilowatt hours in 2035.
The rapid increase in world energy prices from 2003 to 2008, combined with concerns about the environmental consequences of greenhouse gas emissions, has led to renewed interest in alternatives to fossil fuels—particularly, nuclear power and renewable resources. As a result, long-term prospects continue to improve for generation from both nuclear and renewable energy sources—supported by government incentives and by higher fossil fuel prices.
Electricity from coal-fired generation is also expected to increase, making coal the second fastest-growing source for electricity generation. The outlook for coal could be altered substantially, however, by any future legislation that would reduce or limit the growth of greenhouse gas emissions.
The chart below is from the U.S. Government Energy Information Administration and is their latest estimate of this growth by kilowatt hours.
9
Within the broad energy sector, our key target markets include:
Oil and gas
Liquids including oil and gas remain the world’s largest energy source given their importance in the transportation and industrial end-use sectors. According to the EIA, world use of liquids and other petroleum based products will grow from 86.1 million barrels per day in 2007 to 92.1 million barrels per day in 2020, 103.9 million barrels per day in 2030, and 110.6 million barrels per day in 2035. On a global basis, liquids consumption remains flat in the buildings sector, increases modestly in the industrial sector, but declines in the electric power sector as electricity generators react to rising world oil prices by switching to alternative fuels whenever possible. In the transportation sector, despite rising prices, use of liquid fuels increases by an average of 1.3% per year, or 45% overall from 2007 to 2035.
According to the United States Energy Information Administration (EIA), in 2008 coal, oil and gas supplied approximately 80% of global primary energy demand. In addition, there were approximately 700 crude oil refineries in the world, with approximately150 refineries in the United States. High energy prices are driving consistently high utilization rates at these facilities. With aging infrastructure and growing capacity constraints, asset protection continues to grow as an indispensable tool in maintenance planning, quality control and prevention of catastrophic failure in refineries and petrochemical plants. Recent high oil and fossil fuel input prices have placed additional pressure on industry participants to increase capacity, focus on production efficiency and cost reductions and shorten shut-down time or “turnarounds.” Asset protection solutions are used for both off-stream inspections, or inspection when the tested infrastructure is shut-down, and increasingly, on-stream inspections, or inspection when the tested infrastructure is operating at normal levels. While we expect off-stream inspection of vessels and piping during a plant shut-down or turnaround to remain a routine practice by companies in these industries, we expect the areas of greatest future growth to occur as a result of on-stream inspections and monitoring of facilities, such as offshore platforms, transport systems and oil and gas transmission lines, because of the substantial opportunity costs of shutting them down. On-stream inspection enables companies to avoid the costs associated with shutdowns during testing while enabling the economic and safety advantages of advanced planning or predictive maintenance.
10
Traditional power generation and transmission
Asset protection in the power industry has traditionally been associated with the inspection of high-energy, critical steam piping, boilers, rotating equipment, utility aerial man-lift devices, large transformer testing and various other applications for nuclear and fossil-fuel based power plants. We believe that in recent years the use of asset protection solutions have grown rapidly in this industry due to the aging of critical power generation and transmission infrastructure. For instance, the average age of a nuclear power plant in the United States is over 30 years. Furthermore, global demand for power generation and transmission has grown rapidly and is expected to continue, primarily as a result of the energy needs of emerging economies such as China and India. The areas of traditional power generation and transmission that we focus our efforts on are as follows:
|
●
|
Nuclear. For the year ended December 31, 2009, U.S. commercial nuclear reactors operated at a capacity utilization rate of approximately 92% and provided 20% of the US electrical power generation. We believe that the need to sustain these high utilization rates, while also maintaining a high degree of safety, will result in increased spending on testing, on-line monitoring and maintenance of these assets. Industrial Information Resources projected that maintenance spending on the North American reactor fleet will exceed $800 million in 2008. The current U.S. administration is proposing a reduction of CO2 emissions to 1990 levels by 2020, with a further 80% reduction by 2050. Meeting these aggressive goals while gradually increasing the overall energy supply requires that all non-emitting technologies must be advanced. A December 2008 Electric Power Research Institute (EPRI) study called the PRISM analysis defines a possible technology mix within the electricity sector that would help achieve a comparable goal. In it, nuclear generation rises 20% from current levels by 2020 and nearly 200% by 2050. The EIA expects electricity generation from nuclear power to increase from about 2.6 trillion kilowatt hours in 2007 to a projected 3.6 trillion kilowatt hours in 2020 and then to 4.5 trillion kilowatt hours in 2035. Higher future prices for fossil fuels are likely to make nuclear power economically competitive with generation from coal, natural gas, and liquid fuels, despite the relatively high capital costs of nuclear power plants. Moreover, higher capacity utilization rates have been reported for many existing nuclear facilities, and the projection anticipates that most of the older nuclear power plants will be granted extensions to their operating lives.
|
|
Around the world, nuclear generation is attracting new interest as countries seek to increase the diversity of their energy supplies, improve energy security, and provide a low-carbon alternative to fossil fuels. Still, there is considerable uncertainty associated with nuclear power projections. Issues that could slow the expansion of nuclear power in the future include plant safety, radioactive waste disposal, rising construction costs and investment risk, and nuclear material proliferation concerns. Those issues continue to raise public concern in many countries and may hinder the development of new nuclear power reactors. Nevertheless, there is significant opportunity in existing facilities.
|
|
|
Globally, there were 438 nuclear reactors in operation as of June 30, 2010 with many additional reactors under construction. A majority of these reactors are more than 15 years old. As of August 2010, there are currently 104 sites licensed by the U.S. Nuclear Regulatory Commission and 32 companies that are licensed to operate nuclear reactors, and since 2007, there have been 22 applications for additional sites. We believe it will be increasingly important to provide asset protection solutions to the global nuclear power industry in order to prevent potentially catastrophic events and help the nuclear industry optimize availability and safety of their assets.
|
|
|
●
|
Fossil. The fossil fuel power generation market consists of facilities that burn coal, natural gas or oil to produce electricity. These facilities operate at high capacity levels and can incur productivity loss if a shutdown is required. As a result, there is a significant demand for continual testing and maintenance of these facilities and their assets. In addition, to meet growing electricity demand, fossil power generation companies are increasing capital spending for capacity expansions, emissions controls and new facility construction. In 2009, the EIA reported that there are over 80 fossil power stations proposed for construction in the United States.
|
|
●
|
Wind. Wind power has reached critical mass, with total installed capacity reaching approximately 35,000 megawatts (MW), of which approximately 10,000 MW were installed in 2009 alone. It is estimated that growth will continue to accelerate in the near term. There is significant demand for on-line condition monitoring for wind turbines, because their three critical components, of the main bearing, gearbox and generator, need to be fully operational at all times for a turbine to work efficiently and safely. Failure of a gearbox on a single wind turbine rated at 1.5 MW can cost up to $0.4 million to replace, which justifies the use of preventative maintenance monitoring and services for units both in and out of warranty. Our asset protection solutions are also being used in the research, design and development of the composite-based wind turbine blades to improve their structural integrity and efficiency and are being applied to inspect the structural integrity of the tower and base.
|
11
Other Process Industries
The process industries, or industries in which raw materials are treated or prepared in a series of stages, include chemicals, pharmaceuticals, food processing and paper and pulp. Three process industries that we focus our efforts on are described below.
|
●
|
Chemicals. As with oil and gas processing facilities, chemical processing facilities require significant spending on maintenance and monitoring. The average cost of plant construction for chemical assets has increased substantially, which we believe creates a more concentrated focus on asset protection solutions to limit further capital costs. Additionally, growing chemical end-markets continue to put strain on existing plants. Given their aging infrastructure, growing capacity constraints and increasing capital costs, we believe asset protection solutions continue to grow in importance in maintenance planning, quality and cost control and prevention of catastrophic failure in the chemicals industry.
|
|
●
|
Pharmaceuticals and food processing. Although the pharmaceuticals and food processing industries have historically not employed asset protection solutions as much as other industries, we are now seeing these industries increase the use of asset protection solutions throughout their manufacturing and other processes. Because these industries use equipment, structures, facilities and other infrastructure similar to those of many of our other target markets, and these assets have reached an age where structural failures are becoming a significant risk we are seeing an increasing demand from those companies looking to protect their existing investments and avoid costly maintenance repairs and revenue losses due to process or manufacturing line shutdowns. In addition, advanced NDT is more effective than traditional NDT solutions when testing the principal alloys and materials used in these industries’ infrastructure assets.
|
Public infrastructure
We believe that high profile infrastructure catastrophes, such as the collapse of the I-35W bridge in Minneapolis, have caused public authorities to more actively seek ways to prevent similar events from occurring. Public authorities tasked with the construction of new, and maintenance of existing, public infrastructure, including bridges and highways, increasingly use asset protection solutions to test and inspect these assets. Importantly, these authorities now employ asset protection solutions throughout the life of these assets, from their original design and construction, with the use of embedded sensing devices to enable on-line monitoring, through ongoing maintenance requirements. Nearly 25% of the approximately 600,000 public roads and bridges in the U.S. are classified as “deficient,” according to the U.S. Federal Highway Administration. An immediate “cost-beneficial” investment aimed at replacing or repairing deficient bridges may costs as much as $99 billion, according to the U.S. Department of Transportation.
This is a target market for our application technology and experience. Over the last ten years, we have provided testing and health monitoring on hundreds of bridges and structures worldwide, among which include some of the largest and well-known bridges in the United Kingdom, Pennsylvania and the greater New York metropolitan areas. In July 2010, we were awarded a continuous on-line Structural Health Monitoring System contract by the California Department of Transportation to be installed on the San Francisco Oakland Bay Bridge. As a result of our continued efforts to offer cost-effective application technology to address the need for increased safety measures, we received a $6.9 million project awarded under the National Institute of Standards and Technology (NIST) Innovation Program that is intended to bring a transformational impact in the area of civil infrastructure structural health monitoring using affordable self-powered wireless sensors.
Aerospace and defense
The operational safety, reliability, structural integrity and maintenance of aircraft and associated products is critical to the aerospace and defense industries. Industry participants increasingly use asset protection solutions to perform inspections upon delivery, and also periodically employ asset protection solutions during the operational service of aircraft, using advanced ultrasonic immersion systems or digital radiography in order to precisely detect structural defects. Industry participants also use asset protection solutions for the inspection of advanced composites found in new classes of aircraft, ultrasonic fatigue testing of complete aircraft structures, corrosion detection and on-board monitoring of landing gear and other critical components. We expect increased demand for our solutions from the aerospace industry to result from wider use of advanced composites and distributed on-line sensor networks and other embedded analytical applications built into the structure of assets to enable real-time performance monitoring and condition-based maintenance.
Primary metals and metalworking
The quality control requirements driven by the low defect tolerance within automated, robotic intensive metalwork industries, such as screw machining, serve as key drivers for the recent growth of NDT technologies, such as ultrasonics and radiography. We expect that increasingly stringent quality control requirements and competitive forces will drive the demand for more costly finishing and polishing which, in turn, will promote greater use of NDT throughout the production lifecycle.
Transportation
The use of asset protection solutions within the transportation industry is primarily focused in the automotive and rail segments. Within the automotive segment, manufacturers use asset protection solutions throughout the entire design and development process, including the inspection of raw material inputs, during in-process manufacturing and, finally, during end-product testing and analysis. Although asset protection technologies have been utilized in the automobile industry for a number of decades, we believe growth in the segment will increase as automobile manufacturers begin to outsource their asset protection requirements and take advantage of new technologies that enable them to more thoroughly inspect their products throughout the manufacturing process, reduce costs and shorten time to market. Within the rail segment, asset protection solutions are used primarily to test rails and passenger and tank cars.
12
Our competitive strengths
We believe the following competitive strengths contribute to our being a leading provider of asset protection solutions and will allow us to further capitalize on growth opportunities in our industry:
|
●
|
“One Source” Provider for Asset Protection Solutions Worldwide. We believe we have the comprehensive portfolio of proprietary and integrated asset protection solutions, including services, products and systems worldwide, which positions us to be the leading single source provider for a customer’s asset protection requirements. Through our network of 72 offices and independent representatives in 15 countries around the world, we offer an extensive portfolio of solutions that enables our customers to consolidate all their inspection requirements and the associated data storage and analytics on a single system that spans the customers’ entire enterprise. This allows our customers to more effectively manage their asset portfolio, plan asset maintenance based on predictive analytics rather than simple scheduled routines and track their assets globally, thereby enhancing asset productivity and utilization while minimizing the administrative costs of having multiple vendors. In addition, collaboration between our services teams and product design engineers generates enhancements to our services, products and systems, which provide a source of competitive advantage compared to companies that provide only NDT services or NDT products.
|
|
●
|
Long-Standing Trusted Provider to a Diversified and Growing Customer Base. By providing critical and reliable NDT services, products and systems for more than 30 years and expanding our asset protection solutions, we have become a trusted partner to a large and growing customer base across numerous infrastructure-intensive industries globally. Our customers include some of the largest and most well-recognized firms in the oil and gas, chemical, fossil and nuclear power, aerospace and defense industries as well as the largest public authorities. Approximately 90% of our top 20 customers by fiscal 2010 revenues have used our solutions for at least 5 years, with many of those customers using our solutions for over 10 years. We leverage our strong relationships to sell additional solutions to our existing customers while also attracting new customers. As asset protection is increasingly recognized by our customers as a strategic advantage, we believe our reputation and history of successful execution are key competitive differentiators.
|
|
●
|
Repository of Customer-Specific Inspection Data. Our enterprise software solutions enable us to capture and warehouse our customers’ testing and inspection data in a centralized database. As a result, we have accumulated large amounts of proprietary process data and information that allows us to provide our customers with value-added services, such as benchmarking, reliability centered maintenance solutions including predictive maintenance, inspection scheduling, data analytics and regulatory compliance. We believe our ability to provide these customized products and services, along with the high cost of switching to an alternative vendor, provide us with significant competitive advantages.
|
|
●
|
Proprietary Products, Software and Technology Packages. We have developed systems that have become the cornerstone of several high value-added unique NDT applications, such as those used for the testing of pressure vessels (the MONPAC technology package) or above-ground storage tanks (the TANKPAC technology package). These proprietary products allow us to efficiently and effectively provide highly valued solutions to our customers’ complex applications, resulting in a significant competitive advantage. In addition to the proprietary products and systems that we sell to customers on a stand-alone basis, we also develop a range of proprietary sensors, instruments, systems and software used exclusively by our Services segment.
|
|
●
|
Deep Domain Knowledge and Extensive Industry Experience. We are an industry leader in developing advanced asset protection solutions, including acoustic emission (AE) testing for non-intrusive on-line monitoring of storage tanks and pressure vessels, bridges and transformers, portable corrosion mapping, ultrasonic testing (UT) systems, on-line plant asset integrity management with sensor fusion, enterprise software solutions for plant-wide and fleet-wide inspection data archiving and management, advanced and thick composites inspection and ultrasonic phased array inspection of thick wall boilers. In addition, many of the members of our team have been instrumental in developing the testing standards followed by international standards-setting bodies, such as the American Society of Non-Destructive Testing and comparable associations in other countries. The scientists and engineers on our research and development team developed many of the advanced NDT technologies we use in our business, including portable corrosion mapping UT systems, enterprise software solutions for plant-wide and fleet-wide inspection data archiving and management, and non-intrusive above-ground tank testing.
|
13
|
●
|
Collaborating with Our Customers. Our asset protection solutions have historically been designed in response to our customers’ unique performance specifications and are supported by our proprietary technologies. Our sales and engineering teams work closely with our customers’ research and design staff during the design phase in order to incorporate our products into specified infrastructure projects, as well as with facilities maintenance personnel to ensure that we are able to provide the asset protection solutions necessary to meet these customers’ changing demands. As a result, we believe that our close, collaborative relationships with our customers provide us a significant competitive advantage.
|
|
●
|
Experienced Management Team. Our management team has a track record of leadership in NDT, averaging over 20 years experience in the industry. These individuals also have extensive experience in growing businesses organically and in acquiring and integrating companies, which we believe is important to facilitate future growth in the fragmented asset protection industry. In addition, our senior managers are supported by highly experienced project managers who are responsible for delivering our solutions to customers.
|
Our growth strategy
Our growth strategy emphasizes the following key elements:
|
●
|
Continue to Develop Technology-Enabled Asset Protection Services, Products and Systems. We intend to maintain and enhance our technological leadership by continuing to invest in the internal development of new services, products and systems. Our highly trained team of Ph.D.’s, engineers and highly-skilled, certified technicians has been instrumental in developing numerous significant asset protection standards, and we believe their knowledge base will enable us to innovate a wide range of new asset protection solutions more rapidly than our competition.
|
|
●
|
Increase Revenues from Our Existing Customers. Many of our customers are multinational corporations with asset protection requirements from multiple divisions at multiple locations across the globe. Currently, we capture a relatively small portion of their overall expenditures on these solutions. We believe our superior services, products and systems, combined with the trend of outsourcing asset protection solutions to a small number of trusted service providers, positions us to significantly expand both the number of divisions and locations that we serve as well as the types of solutions we provide. We strive to be the preferred global partner for our customers and aim to become the single source provider for their asset protection solution requirements.
|
|
●
|
Add New Customers in Existing Target Markets. Our current customer base represents a small fraction of the total number of companies in our target markets with asset protection requirements. Our scale, scope of products and services and expertise in creating technology-enabled solutions have allowed us to build a reputation for high-quality and has increased customer awareness about us and our asset protection solutions. We intend to leverage our reputation and solutions offerings to win new customers within our existing target markets, especially as asset protection solutions are adopted internationally. We intend to continue to leverage our competitive strengths to win new business as customers in our existing target markets continue to seek a single source and trusted provider of advanced asset protection solutions.
|
|
●
|
Expand Our Customer Base into New End Markets. We believe we have significant opportunities to rapidly expand our customer base in relatively new end markets, including the maritime shipping, wind turbine and other alternative energy and natural gas transportation industries and the market for public infrastructure, such as highways and bridges. The expansion of our addressable markets is being driven by the increased recognition and adoption of asset protection services, products and systems, and new NDT technologies enabling further applications in industries such as healthcare and compressed and liquefied natural gas transportation, and the aging of infrastructure, such as construction and loading cranes and ports, to the point where visual inspection has proven inadequate and new asset protection solutions are required. We expect to continue to expand our global sales organization, grow our inspection data management and data mining services and find new high-value applications, such as embedding our sensor technology in assembly lines for electronics and distributed sensor networks for aerospace applications. As companies in these emerging end markets realize the benefits of our asset protection solutions, we expect to expand our leadership position by addressing customer needs and winning new business.
|
|
●
|
Continue to Capitalize on Acquisitions. We intend to continue employing a disciplined acquisition strategy to broaden, complement and enhance our product and service offerings, add new customers and certified personnel, expand our sales channels, supplement our internal development efforts and accelerate our expected growth. We believe the market for asset protection solutions is highly fragmented with a large number of potential acquisition opportunities. We have a proven ability to integrate complementary businesses, as demonstrated by the success of our past acquisitions, which have often contributed entirely new products and services that have added significantly to our revenues and profitability. In addition, we have begun to offer and sell our advanced asset protection solutions to customers of companies we acquired that had previously relied on traditional NDT solutions. Importantly, we believe we have improved the operational performance and profitability of our acquired businesses by successfully integrating and selling a comprehensive suite of solutions to the customers of these acquired businesses.
|
14
Our solutions
We provide comprehensive asset protection solutions to a diverse customer base. We combine the strengths of our proprietary products, industry expertise, a suite of software solutions and our highly skilled and experienced technicians and engineers to deliver a broad set of inspection, engineering and information technology services that address the complex business challenges faced by our customers. Depending on the requirements of our customers, we can provide them our software and other products on a stand-alone basis or as a complete end-to-end solution consisting of sensor products, services and software. Importantly, as part of our solutions, we are increasingly providing on-line asset monitoring and management software enabling our customers to have real-time access to and assess the structural health of their infrastructure.
Our services
We provide a range of testing and inspection services to a diversified customer base across energy-related, industrial and public infrastructure industries. We either deploy our services directly at the customer’s location or through our own extensive network of field testing facilities. Our global footprint allows us to provide asset protection solutions through local offices in close proximity to our customers, permitting us to keep response time and per diem costs to a minimum, while maximizing our ability to develop meaningful, collaborative customer relationships. Examples of our comprehensive portfolio of services include: testing components of new construction as they are built or assembled, providing corrosion monitoring data to help customers determine whether to repair or retire infrastructure, providing material analysis to ensure the integrity of infrastructure components and supplying non-invasive on-stream techniques that enable our customers to pinpoint potential problem areas prior to failure. In addition, we also provide services to assist in the planning and scheduling of resources for repairs and maintenance activities. Our experienced inspection professionals perform these services, which are supported by our advanced proprietary software and hardware products.
Traditional NDT services
Our certified personnel provide a range of traditional inspection services. For example, our visual inspectors provide comprehensive assessments of the condition of our customers’ plant equipment during capital construction projects and maintenance shutdowns. Of the broad set of traditional NDT techniques that we provide, several lend themselves to integration with our other offerings and often serve as the initial entry point to more advanced customer engagements. For example, we provide a comprehensive program for the inspection of above-ground storage tanks designed to meet stringent industry standards for the inspection, repair, alteration and reconstruction of oil and petrochemical storage tanks. This program includes magnetic flux exclusion for the rapid detection of floor plate corrosion, advanced ultrasonic systems and leak detection of floor defects, remote ultrasonic crawlers for shell and roof inspections and trained, certified inspectors for visual inspection and documentation.
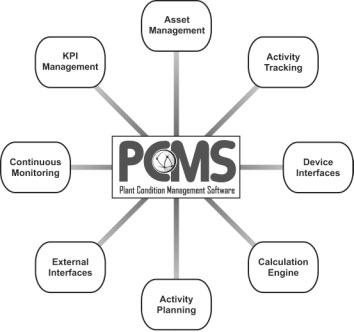
Advanced NDT services
In addition to traditional NDT services, we provide a broad range of proprietary advanced NDT services that we offer on a stand-alone basis or in combination with software solutions such as our proprietary enterprise data warehousing and plant condition monitoring software and systems (PCMS). We also provide on-line monitoring capabilities and other solutions that enable the delivery of accurate and real-time information to our customers. Our advanced NDT services require more complex equipment and more skilled inspection professionals to operate this equipment and interpret test results. Some of the technologies they use include:
|
● Automated ultrasonic testing
|
● Wireless data acquisition
|
|
● Guided ultrasonic long wave testing
|
● On-line plant asset integrity monitoring
|
|
● Infrared thermography
|
● Risk-based inspection
|
|
● Phased array ultrasonic testing
|
● Digital radiography
|
|
● Acoustic emission testing
|
● Sensor fusion (multi-sensor data integration)
|
15
Examples of our advanced NDT techniques include the following:
|
●
|
Automated Ultrasonic Phased Array Inspection. We primarily use this technique to inspect welded areas during large capital construction and maintenance projects to determine whether the welds can withstand anticipated operating conditions, such as high pressures or temperatures. This technique employs an automated mobile scanner to obtain structural ultrasonic inspection data from multiple angles and locations. The principal competing technique is radiographic inspection, which generally impedes or requires the construction or maintenance work to be halted during the inspection. By using ultrasonic phased array inspection, our customers can continue to weld while our inspections are taking place, which shortens downtime during maintenance projects and accelerates the completion of construction projects.
|
|
●
|
Guided Ultrasonic Long Wave Testing. We typically use this technique to locate corrosion or metal loss in large volumes of above ground or buried piping. It allows us to inspect a long continuous section of piping from one location and follow up with further inspections on problem areas, as compared to more costly and time-intensive methods which require inspections at multiple locations along the same section of pipe. It also allows us to inspect the entire pipe body, enabling us to identify a larger percentage of flaws as compared to traditional techniques that inspect only a small portion of pipe walls.
|
|
●
|
Advanced Infrared Inspection. We generally employ this technique in place of ultrasonic inspections of large operating systems, such as boilers in industrial power plants, which rely on scans of sample areas of the system to test their integrity rather than a scan of the entire system. Traditional infrared inspection locates unexpected temperature differences to alert inspection personnel to potential problems with insulation, process systems, electrical systems and proper operating parameters. Our proprietary advanced infrared system enables us to scan large areas using a robotic crawler and not only examine temperature differences but also precisely measure the thickness of objects or materials. Our proprietary infrared scanning system examines the entirety of the tested structure to supply more comprehensive inspection data to plant engineers, providing them a higher level of confidence when deciding whether to repair, replace or retire the structure.
|
|
●
|
Line Scanning Thermography (LST). LST in an inspection method that uses infrared thermal imaging developed to measure the thickness of boiler tubes. A unique characteristic of this system compared to other thermography methods is LST’s ability to develop an image almost instantly as it scans a boiler tube, while the other methods are significantly slower. Boiler tube inspections are traditionally inspected for loss of wall thickness using ultrasonic contact thickness gauges, which is a very tedious and time consuming method. The LST system can test a large area faster than other NDT methods and record the inspection with a digital image. Another application for which LST has shown promise is the inspection of composite materials for porosity, delaminations and non-visible impact damage. Inspection speed, sensitivity to defects, and the capability to store digital images are the key selling points of LST.
|
Mechanical Integrity services
We provide a broad range of MI services that enable our customers to meet stringent regulatory requirements. These services increase plant safety, minimize unscheduled downtime and allow our customers to plan for, repair and replace critical components and systems before failure occurs. Our services are designed to complement a comprehensive predictive and preventative inspection and maintenance program that we can provide for our customers in addition to the MI services. Customers of our MI services have, in many instances, also licensed our PCMS software, which allows for the storage and analysis of data captured by our testing and inspection products and services, and implemented this solution to complement our inspection services.
As a result of the information captured by PCMS and our risk-based inspection (RBI) software module we are able to provide a professional service known as “Mechanical Integrity Gap Analysis” for process facilities. Our Mechanical Integrity Gap Analysis service offers insight into the level of plant readiness, how best to manage and monitor the integrity of process facility assets, and how to extend the useful lives of such assets. Our Mechanical Integrity Gap Analysis service also assists customers in benchmarking and managing their infrastructure through key performance indicators and metrics.
Our products and systems
Our software
Our software solutions are designed to meet the demands of our customers’ data analysis and asset integrity management requirements. Some of our key software solutions include:
PCMS Enterprise software: asset protection and reliability
Our PCMS application is an enterprise software system that allows for the warehousing and analysis of data as captured by our testing and inspection products and services and convert it to valuable information. PCMS allows our customers to design and develop asset integrity management plans that include:
|
●
|
optimal systematic testing schedules for their infrastructure based on real-time data captured by our sensors;
|
16
|
●
|
alerts that notify customers when to perform special testing services on suspect areas, enabling them to identify and resolve flaws on a timely basis by using our PCMS risk-based inspection (“RBI”) software module; and
|
|
●
|
schedules for the maintenance and retirement of assets.
|
These plans are based on information stored in PCMS, which include results based upon the rates of deterioration shown by existing test results, information based on our past experiences in the operation and testing of similar structures and standards and recommended practices of numerous industrial standards-setting bodies and regulators, such as the American Society of Mechanical Engineers, the American Petroleum Institute and the Occupational Safety and Health Administration. Using PCMS allows our customers to demonstrate compliance with these standards and practices, which typically helps them reduce their insurance premiums and ensure asset, product and employee safety. PCMS also offers advantages by allowing the information it develops and stores to be organized, linked and synchronized with enterprise software systems such as SAP. We believe PCMS is one of the more widely used process condition management software systems in the world we estimate that approximately 37% of U.S. refineries, by capacity, currently use PCMS. This provides us not only with recurring software license fees, but also marketing opportunities for additional software, asset Integrity management and other asset protection solutions. With the addition of the RBI module, we expect the use of PCMS to expand in the future. In addition, our risk-based inspection (RBI) application enables PCMS users to test and analyze their assets operating conditions and other factors, such as operating temperature range and contact with highly flammable or corrosive products. This allows customers to classify or rank each asset according to the probability and consequences of its structural failure and schedule the appropriate frequency and types of testing for that asset. We believe our RBI program allows our customers to appropriately test their infrastructure in a more cost-effective manner while reducing their overall risk profile, which typically allows them to reduce their insurance premiums.
Application-based software
We provide a comprehensive portfolio of application-specific software products that covers a broad range of materials testing and analysis methods, for neural networks, pattern recognition, wavelet analysis and moment tensor analysis.
17
Some of the key software solutions we offer include:
|
●
|
Advanced Data Analysis Pattern Recognition & Neural Networks Software (NOESIS): An advanced data analysis and pattern recognition software package for AE applications. NOESIS enables our AE experts to develop automated remote monitoring systems for our customers.
|
|
●
|
AE Software Platform (AEwin and AEwinPost): Windows-based real time applications software for detection, processing and analysis of AE data. This software locates the general location of flaws on or in our customers’ structures.
|
|
●
|
Loose Parts Monitoring Software (LPMS): A software program for monitoring, detecting and evaluating metallic loose parts in nuclear reactor coolant systems in accordance with strict industry standards. LPMS alerts the operator on the plant floor and central control room about potential loose parts, provides a user-friendly interface for operators to differentiate between noise and loose parts and identifies the location of the problem.
|
|
●
|
Automated UT and Imaging Analysis Software (UTwin and UTIA): A complete software platform for analyzing ultrasonic inspection data and visualizing and identifying the location and size of potential flaws.
|
Technology packages
In order to address some of the more common problems faced by our customers, we have developed a number of robust technology solutions. These packages generally allow more rapid and effective testing of infrastructure because they minimize the need for service professionals to customize and integrate asset protection solutions with the infrastructure and interpret test results. These packaged solutions use proprietary and specialized testing procedures and hardware, advanced pattern recognition, neural network software and databases to compare test results against our prior testing data or national and international structural integrity standards. Some of our widely used technology packages in some of our target markets are:
|
Technology package
|
Type
|
Description
|
Benefits
|
|||
|
TANKPAC
|
AE On-line Tank Floor Inspection
|
Tests to monitor for emissions resulting from active corrosion of the tested infrastructure
|
● Ability to perform tests on-stream
● Non-intrusive testing
● Quickly identify tanks that need inspection and resolve associated problems
● Leave good tanks operational and save the shutdown and cleaning costs
|
|||
|
MONPAC
|
AE Pressure Vessel Testing
|
An AE “expert system” that evaluates the condition of metal pressure systems and tanks
|
● Ability to perform tests on-stream
● Rapid inspection capability
● Global monitoring (100% inspection, including welds, repairs, base metal)
● Reduction in inspection costs
● Reduction in downtime resulting from improved information about plant condition
|
|||
|
VPAC
|
Loss Control for Valves in Process Plants
|
Estimates valve leakage based on measurements made using our inspection products
|
● Cost savings from detection of valve leaks
● Cost savings are achieved in maintenance planning, troubleshooting plant operations and monitoring of losses for environmental purposes
|
|||
|
POWERPAC
|
AE On-line Power Transformer Monitoring
|
Through on-line monitoring, detects and locates partial discharge in power transformers by utilizing AE
|
● Non-intrusive testing
● On-line testing identifies problems characterizing defects
● Creates way to monitor problem transformers
|
|||
|
Wire Break
|
On-line monitoring of wire breaks in Bridge suspension cables
|
On-Line detection and location of wire breaks on suspension cable bridges
|
● Monitoring 24/7 for wire breaks
● Reports wire breaks and wire break locations over internet on secure web page
● Alerts bridge owners of area’s needing repairs
|
|||
|
LeakTEC
|
AE Leak detection
|
On-Line monitoring and detection of gas and liquid leaks in pipes and vessels
|
● Continuous leak monitoring detects and reports leaks
● Used in Power and Petrochemical industry
|
18
Our other products
AE products
We are a leader in the design and manufacture of AE sensors, instruments and turn-key systems used for the monitoring and testing of materials, pressure components, processes and structures. Though we principally sell our products as a system, which includes a combination of sensors, an amplifier, signal processing electronics, knowledge-based software and decision and feedback electronics, we can also sell these as individual components to certain customers that have the in-house expertise to perform their own services. Our sensors “listen” to structures and materials to detect real-time AE activity and to determine the presence of structural flaws in the inspected materials. Such materials include pressure vessels, storage tanks, heat exchangers, piping, turbine blades and reactors.
In addition, we provide leak monitoring and detection systems used in diverse applications, including the detection and location of both gaseous and liquid leaks in valves, vessels, pipelines and tanks. AE leak monitoring and detection, when applied in a systematic preventive maintenance program, has proven to substantially reduce costs by eliminating the need for visual valve inspection and unscheduled down-time. In addition, EPA requirements regarding fugitive emissions helps drive the market for this leak detection equipment.
Our complete AE product line includes:
|
●
|
AE Sensors: We offer over 200 different types of proprietary sensors. Our latest innovation includes a proprietary dual function sensor that is a true accelerometer and an AE sensor that records low and high frequencies simultaneously in one sensor body.
|
|
●
|
Multi-channel AE Systems: Multi-sensor parallel processing systems capable of monitoring, detecting and locating defects in large structures, such as vessels, pipelines and off-shore platforms. These systems include our DiSP, SAMOS, PCI-2, and Sensor Highway II, which is designed for on-line remote monitoring of bridges and large transformers.
|
|
●
|
Hand-held Instruments: Portable AE systems easily programmable for OEM applications.
|
|
●
|
Wireless AE Systems: Our wireless sensors save considerable installation time over wired sensor networks and are remotely monitored and controlled through a basestation. Multiple AE wireless sensors can combine with other sensors in geographically dispersed “mesh” networks. Wireless capabilities are fully integrated into our Sensor Highway II and Asset Condition Monitoring (ACM) units.
|
|
●
|
Small AE systems: USB-AE node for low cost, small channel count, laboratory or university applications, expands the use of AE to beginners and potential future customers.
|
|
●
|
Intrinsically Safe Products: Certified sensors and AE systems to work in hazardous and potentially explosive environments such as the petrochemical industry.
|
|
●
|
Software Development Kits: We offer software development kits for all our products for customers to develop their own special applications for future OEM business.
|
UT technology
We design, manufacture and market a full line of ultrasonic equipment. While AE technology detects flaws and pinpoints their location, our UT technology has the ability to size defects in three-dimensional geometric representations. We manufacture a complete line of UT systems including our line of Automated UT scanners such as our LSI crawler and Mini-Scanner, our unique portable UT handheld system with motion control to run our many inspection scanners, and our Immersion systems including small bench top units to large UT and Gantry systems over 50 feet long. We also design and fabricate custom scanners as requested by customers in the metals and aerospace industries.
19
Vibration sensors and systems
We design, manufacture and market a broad portfolio of vibration sensing products under our Vibra-Metrics brand name. These include a full line of accelerometers (vibration sensors), on-line condition-based management systems, data delivery systems and a comprehensive assortment of ancillary support products. Our patented Sensor Highway monitoring systems offer fully automated, unattended remote data acquisition and alarm reporting for rotating mechanical equipment and machines, which enable us to provide real-time predictive maintenance data to our customers.
On-line monitoring
Our on-line monitoring offerings combine all of our asset protection services, products and systems. We provide temporary, periodic and continuous monitoring of static infrastructures such as bridges, pipes, and transformers, as well as dynamic or rotating assets such as pumps, motors, gearboxes, steam and gas turbines. Temporary monitoring is typically used when there is a known defect or problem and the condition needs to be monitored until repaired or new equipment can be placed in service. Periodic monitoring, or “walk around” monitoring, is used as a preventative maintenance tool to take machine and device readings, on a periodic basis, to observe any change in the assets’ condition such as increased vibration or unusual heat buildup and dissipation. Continuous monitoring is applied “24/7” on critical assets to observe the earliest onset of a defect and track its progression to avoid catastrophic failure. Since 1988, we have provided these solutions to over eighty projects for a variety of industries and applications. Our monitoring systems can be accessed both on-site and remotely using state of the art wireless technology and can interface with customer data via the internet or other proprietary secured networks. These monitoring systems provide browser-based hierarchical displays of critical information and can include alarm and customer notification options using messaging and email services. By simultaneously using different sensing devices such as acoustic emission or sound, vibration, temperature, strain or corrosion gauges, often referred to as sensor fusion, we can monitor and correlate different sensor readiness to provide more accurate fault detection and location determination while reducing or eliminating false alarms. The information can also be used to correct operational procedures that contributed to the failures.
We provide a range of custom outsourced monitoring services for customers that do not have the resources to monitor their assets or interpret sensor data. An example of a continuous monitoring engagement involving static infrastructure is our monitoring of aging bridges for factors of degradation. Wire breakage in suspension bridges is usually the result of corrosion fatigue which slowly degrades the integrity of the bridge. Since wire breakage events are occasional and unpredictable, the most effective way to track the extent of deterioration is by continuous monitoring. Another example is offshore drilling platforms, which often develop slight flaws in high stress locations that can quickly and unpredictably expand into catastrophic failures. In many circumstances, such flaws cannot be reliably detected using conventional inspection techniques. An example and prime candidate for our temporary on-line monitoring solutions is a pressure vessel, such as a tank, in which a crack has been identified, but that can still be safely operated. In such cases, we are engaged to monitor the vessel until the crack grows dangerous or until a planned maintenance or shutdown occurs.
An example of continuous monitoring of dynamic or rotating assets is the monitoring of wind turbines. Each wind turbine is made up of a main bearing, gearbox and generator that combines to form the drive train. A typical wind park engagement will include around 50 wind turbines, each requiring drive train monitoring for early detection of potential mechanical faults, which in turn will allow for scheduling of maintenance prior to the catastrophic failure of a component, and isolating it to avoid damage to the other components in the drive train. These components are difficult to replace since they are usually installed on towers over 250 feet high, and replacement components are costly and have long lead times.
20
Customers
During fiscal 2010, we provided our asset protection solutions to approximately 4,800 different customers. The following table lists some of our larger customers by revenues for fiscal 2010, in each of our target markets.
|
Oil and gas, including petrochemical
|
Nuclear and fossil power
|
Composite and part testing, including aerospace
|
Chemicals
|
|||
|
BP
|
American Electric Power
|
Alcan
|
Air Products
|
|||
|
Chevron
|
Bechtel
|
ATC Manufacturing
|
Aux Sable Liquid Products
|
|||
|
Conoco Phillips
|
Constellation Power
|
Boeing
|
Bayers
|
|||
|
ExxonMobil
|
Dominion
|
Chinataly Aviation
|
Dow, Rohn & Haas
|
|||
|
Hess
|
Duke
|
Composite Solutions
|
Dupont
|
|||
|
Lyondell
|
Entergy
|
Hitco
|
Ferro Corporation
|
|||
|
Marathon Oil
|
Exelon
|
Jaxa
|
INEOS
|
|||
|
Petrobras
|
Florida Power & Light (FPL)
|
Kaiser Aluminum
|
Lyondell
|
|||
|
Shell
|
PP&L
|
Precision
|
Newmont Gold Corporation
|
|||
|
Tesoro
|
Progress Energy
|
Rolls Royce
|
Occidental Chemical Corp.
|
|||
|
Valero
|
PSE&G
|
Tyee Aircraft, Inc.
|
Solutia
|
|
Primary metals and metalworking
|
Transportation
|
Pharmaceuticals and food processing
|
Public infrastructure
|
|||
|
Cameron Value
Eden Cryogenics, LLC
High Steel Structures Mercon
Metal Tech
Mid-State Machine Products, Inc.
Rovanco Corp.
Sunshine Scientific
Verwater
Wollostan Alloy
|
BRC Rail Car Services
Dana Corporation
Emergency One, Inc.
Global Links
Sutphen Corp.
|
Anheuser-Busch
Dole
Merrick & Company Monsanto Pilgrim’s Pride
Sanofi Aventis USDA
|
Various governmental transportation agencies (worldwide)
Federal Highway Administration (U.S.)
Parsons Engineering
Amey (U.K.)
B E & K Construction
|
During the last three fiscal years, we derived our revenues from providing our asset protection solutions to customers in the United States and over 60 countries around the world. Foreign countries where we provided asset protection solutions and were responsible for approximately 1% or more of our revenues in fiscal 2010, listed in descending order of revenues, were: the United Kingdom, Brazil, Canada, France and the Netherlands.
Competition
We operate in a highly competitive, but fragmented, market. Our primary competitors are divisions of large companies, and many of our other competitors are small companies, limited to a specific product or technology and focused on a niche market or geographic region. We believe that none of our competitors currently provides the full range of asset protection and NDT products, enterprise software and the traditional and advanced services solutions that we offer. Our competition with respect to NDT services include the Acuren division of Rockwood Service Corporation, SGS Group, the TCM division of Team, Inc. and APPLUS RTD, which is majority-owned by The Carlyle Group. Our competition with respect to our PCMS software includes UltraPIPE, a division of Siemens, Lloyd’s Register Capstone, Inc. and Meridium Systems. Our competition with respect to our ultrasonic products are GE Inspection Technologies and Olympus NDT. In the traditional NDT market, we believe the principal competitive factors are project management, execution, price, reputation and quality. In the advanced NDT market, reputation, quality and size are more significant competitive factors than price. In light of several characteristics of the NDT industry and obstacles facing competitors, only a few of our existing competitors can compete with us on a global basis, and we believe few new companies are likely to enter the market. Some of the most significant of such characteristics and obstacles include: (1) having to acquire or develop advanced NDT services, products and systems technologies, which in our case occurred over many years of customer engagements and at significant internal research and development expense, (2) complex regulations and safety codes that require significant industry experience, (3) license requirements and evolved quality and safety programs, (4) costly and time-consuming certification processes, (5) capital requirements and (6) emphasis by large customers on size and critical mass, length of relationship and past service record.
21
Centers of excellence
Another differentiator in our business model is the formation of our Centers of Excellence (“COEs”), which we consider to be incubators of inspection technology, that are listed below. The COEs are focused around target applications in our key market segments. They are supported by subject matter experts that will engage in strategic sales opportunities offering customers value-added solutions using advanced technologies and methods providing oversight, management and consultation. The COEs have a blueprint for their areas that can be replicated throughout the world by delivering procedures, equipment, reports, certifications, etc. insuring a standardized approach to implementation yielding higher margin business.
|
API Turnaround Management
|
Tube Inspection
|
Rope Access
|
||
|
Storage Tanks & Vessels
|
Long Range Guided Wave UT
|
Transportation & Fire Apparatus
|
||
|
PCMS Inspection IT & RBI
|
Acoustic Emission
|
Asset Integrity Management Services (AIMS)
|
||
|
Pipeline Integrity
|
Pipeline Construction
|
Infrastructure
|
||
|
Refractory Inspection
|
Automated Ultrasonics
|
24/7 On-Line Remote Monitoring
|
||
|
Transformers & Distribution
|
Mechanical Integrity
|
Predictive Maintenance
|
Sales and marketing
We sell our asset protection solutions through all of our 72 offices worldwide. As of May 31, 2010, our world-wide sales and marketing team, together with our “center of excellence” managers, consisted of 63 employees. In addition, our project and laboratory managers as well as our management are trained on our solutions and often are the source of sales leads and customer contacts. Our direct sales and marketing teams work closely with our customers’ research and design personnel, reliability engineers and facilities maintenance engineers to demonstrate the benefits and capabilities of our asset protection solutions, refine our asset protection solutions based on changing customer needs and identify potential sales opportunities. We provide our asset protection solutions under well known, industry-recognized brand names including Physical Acoustics Corporation and Vibra-Metrics, as well as lesser-known regional, local or product specific brand names. We have started to promote the name Mistras using the tag line of “Delivering Asset Protection Solutions.” We divide our sales and marketing efforts into services sales, software and other products sales and marketing.
Services sales
In addition to our general and center of excellence managers and executives, our dedicated Services sales group employs 15 regional and business development managers and professionals, each of whom is responsible for educating our existing and potential customers about our asset protection solutions for a specific geographic region. The sales cycle for some of our larger services engagements is typically three to six months. We generally provide our services under one-to three-year contracts, but none of our services contracts legally obligate our customers to purchase from us on a going-forward basis. Historically, a majority of our total services revenues have been recurring because of the length of certain of our client relationships and the number of our technicians who work for extended and predictable periods at our customer locations.
Products & systems sales
Our Products and Systems sales group employs 10 corporate level sales managers and professionals, each of whom is responsible for educating our existing and potential customers about our diverse portfolio of asset protection solutions in a geographic region. This team is supported by experts and scientists who work globally to provide design, installation and other sales support for more specialized niche applications, as well as customer support after purchase. The sales cycle for our software and other products is typically three to 12 months. We generally provide our software under one-year renewable license agreements.
International sales
Our International sales group employs 14 sales managers and professionals, each of whom is responsible for educating our existing and potential customers about our asset protection solutions in the geographical areas outside the United States other than China and South Korea. The sales cycle for our asset protection solutions and the agreements under which we provide them in these areas are substantially similar to those of our other segments.
Marketing
Our marketing communication group focuses primarily on supporting our corporate, global sales and operations centers. with industry trade shows, seminars, graphic design, print and E–advertising, development of product data sheets, brochures, website maintenance, development and support, internal communications, research, and customer and internal newsletters.
22
Manufacturing
Our hardware products are manufactured in our Princeton Junction, New Jersey facility. This manufacturing facility is equipped with the latest surface mount manufacturing equipment and automated test equipment. Our Princeton Junction facility includes the capabilities and personnel to fully produce all of our AE products, NDT Automation Ultrasonic equipment and Vibra-Metrics vibration sensing products.
Intellectual property
Our success depends, in part, on our ability to maintain and protect our proprietary technology and to conduct our business without infringing on the proprietary rights of others. We utilize a combination of intellectual property safeguards, including patents, copyrights, trademarks and trade secrets, as well as employee and third-party confidentiality agreements, to protect our intellectual property.
As of August 1, 2010, we held eight patents in the United States, which will expire at various times between fiscal 2011 and 2023, and had no outstanding patent applications. Although we believe our existing patents have significant value, we currently do not principally rely on our patented technologies to provide our proprietary asset protection solutions. We periodically assess appropriate circumstances for seeking patent protection for those aspects of our technologies, designs, methodologies and processes that we believe provide significant competitive advantages. We have also licensed certain patent rights from third parties for new NDT technologies involving thermography and a method to measure wall thinning and geometric changes in boiler tubes. However, we do not significantly rely upon these licensed technologies in providing our asset protection solutions and the royalties we pay for these licenses are not material.
As of August 1, 2010, the primary trademarks and service marks that we held in the United States included Mistras, Physical Acoustics Corporation (PAC), and Controlled Vibrations Inc. Other trademarks or service marks that we utilize in localized markets or product advertising include PCMS, NOESIS, AEwin, AEwinPost, UTwin, UTIA, LST, Vibra-Metrics, MONPAC, PERFPAC, TANKPAC, VPAC, POWERPAC, Sensor Highway, Quality Services Laboratories Inc. (QSL) and NDT Automation.
Many elements of our asset protection solutions involve proprietary know-how, technology or data that are not covered by patents or patent applications because they are not patentable, or patents covering them would be difficult to enforce, including technical processes, equipment designs, algorithms and procedures. We believe that this proprietary know-how, technology and data is the most important component of our intellectual property assets used in our asset protection solutions, and is a primary differentiator of our asset protection solutions from those of our competitors. We rely on various trade secret protection techniques and agreements with our customers, service providers and vendors to protect these assets. All of our employees in our Products and Systems segment and certain of our other employees involved in the development of our intellectual property have entered into confidentiality and proprietary information agreements with us. These agreements require our employees not to use or disclose our confidential information, to assign to us all of the inventions, designs and technologies they develop during the course of employment with us, and otherwise address intellectual property protection issues. We also seek confidentiality agreements from our customers and business partners before we disclose any sensitive aspects of our asset protection solutions technology or business strategies. We are not currently involved in any material intellectual property claims.
Research and development
Our research and development is principally conducted by engineers and scientists at our Princeton Junction, New Jersey headquarters, and supplemented by other employees in the United States and throughout the world, including France, Greece, Japan, Russia and the United Kingdom, who have other primary responsibilities. Our total professional staff includes 30 employees who hold Ph.D.’s, and a significant number of employees who hold Level III certification, the highest level of certification from the American Society of Non-Destructive Testing.
We work with many of our customers on developing new products or applications for our technology. Research and development expenses are reflected on our consolidated statements of operations as research and engineering expenses. Our company-sponsored research and engineering expenses in the United States were approximately $2.4 million, $1.9 million, and $1.7 million for fiscal 2010, 2009 and 2008, respectively. While we have historically funded most of our research and development expenditures, we also receive customer-sponsored research and development funding. For example, in February 2009 the National Institute of Standards and Technology (NIST) awarded us and our university partners a $6.9 million research award under their new Technology Innovation Program (TIP) for the development and research of advanced technologies to enable monitoring and inspection of the structural health of bridges, roadways and water systems.
23
The Company also has a number of other paid research contracts throughout the world, including Greece, Brazil, France, the United Kingdom, Japan and the Netherlands, for various industries and applications, including testing of new composites, detecting crack propagation, mapping discontinuities and carbon defect characterization, development of new sensor, actuator, signal processing, wireless and communications technologies, as well as the development of permanently embedded inspection systems using acoustic emission and acousto-ultrasonics to provide continuous on-line in-service full coverage monitoring of critical structural components. Most of the projects are in the Company’s target markets; however, a few of the projects could lead to other future market opportunities.
Employees
Providing our asset protection solutions requires a highly skilled and technically proficient employee base. As of May 31, 2010, we had approximately 2,300 employees worldwide and approximately 2,000 of our employees were based within the United States, of which approximately 85% were hourly. Less than 10% of our employees in the United States are unionized. We believe that we have good relations with our employees.
Environmental matters
We are subject to numerous environmental, legal and regulatory requirements related to our operations worldwide. In the United States, these laws and regulations include, among others: the Comprehensive Environmental Response, Compensation, and Liability Act, the Resources Conservation and Recovery Act, the Clean Air Act, the Federal Water Pollution Control Act, the Toxic Substances Control Act, the Atomic Energy Act, the Energy Reorganization Act of 1974, as amended, and applicable state regulations.
In addition to the federal laws and regulations, states and other countries where we do business often have numerous environmental, legal and regulatory requirements by which we must abide. We evaluate and address the environmental impact of our operations by assessing properties in order to avoid future liabilities and comply with environmental, legal and regulatory requirements. Thus far, we are not involved in specific environmental litigation or claims, including the remediation of properties we own or have operated, as well as efforts to meet or correct compliance-related matters. We do not expect costs related to environmental matters to have a material adverse effect on our consolidated cash flows, financial position or results of operations.
|
RISK FACTORS
|
An investment in our common stock involves risk. You should carefully read and consider the risks described below which represent the major risks to our business, together with the other information contained in this Annual Report, including our financial statements and the notes thereto and “Management’s Discussion and Analysis of Financial Condition and Results of Operations,” before making an investment decision. The statements contained in this section constitute cautionary statements under the Private Securities Litigation Act of 1995. If any of these risks actually occur, our business, financial condition, results of operations and future growth prospects may be adversely affected. As a result, the trading price of our common stock would likely decline, and you may lose all or part of your investment.
Risks related to our business
Our operating results could be adversely affected by a reduction in business with our significant customers.
We derive a significant amount of revenues from a few customers. For instance, various divisions or business units of one of our customers were responsible for approximately 18%, 17% and 17% of our revenues for fiscal 2010, 2009 and 2008, respectively. Taken as a group, our top 10 customers were responsible for approximately 45%, 36% and 35% of our revenues for fiscal 2010, 2009 and 2008, respectively. Generally, our customers do not have an obligation to make purchases from us and may stop ordering our products and services or may terminate existing orders or contracts at any time with little or no financial penalty. The loss of any of our significant customers, any substantial decline in sales to these customers or any significant change in the timing or volume of purchases by our customers could result in lower revenues and could harm our business, financial condition or results of operations.
24
An accident or incident involving our asset protection solutions could expose us to claims, harm our reputation and adversely affect our ability to compete for business and, as a result, harm our operating performance.
We could be exposed to liabilities arising out of the solutions we provide. For instance, we furnish the results of our testing and inspections for use by our customers in their assessment of their assets, facilities, plants and other structures. If such results were to be incorrect or incomplete, whether as a result of poorly designed inspections, malfunctioning testing equipment or our employees’ failure to adequately test or properly record data, we could be subject to subject to claims. For example, one of our clients claimed one of our x-ray inspection crews had improperly recorded inspection data about a portion of its infrastructure, requiring us to provide a new team to inspect that infrastructure over a period of three months at our expense. Further, if an accident or incident involving a structure we are testing or have tested occurs and causes personal injuries to our personnel or third parties, or property damage, such as the collapse of a bridge or an explosion in a plant or facility, and particularly if these injuries or damages could have been prevented by our customers had we provided them with correct or complete results, we may face significant claims by injured persons or related parties and claims relating to any property damage or loss. Even if our results are correct and complete, we may face claims for such injuries or damage simply because we tested the structure or facility in question. For instance, we recently inspected a subset of welds made in a liquid storage tank farm under construction for a customer in order to determine if the welds were being made in accordance with applicable regulations. The welds we tested were specified by the contractor that made them. Weeks after our inspections were completed a weld in a tank cracked, resulting in the spill of hazardous material. The customer made a claim on its insurer, which in turn made claims against us, among others, for the clean-up costs, which in this case are not significant. Though we believe we did not test the weld that failed, if we are unable to prove this fact we may decide to or be compelled by a court to pay some of the clean-up costs. Our insurance coverage may not be adequate to cover the damages from any such claims, forcing us to bear these uninsured damages directly, which could harm our operating results and may result in additional expenses and possible loss of revenues. An accident or incident for which we are found partially or fully responsible, even if fully insured, may also result in negative publicity, which would harm our reputation among our customers and the public, cause us to lose existing and future contracts or make it more difficult for us to compete effectively, thereby significantly harming our operating performance. Such an accident or incident might also make it more expensive or impossible for us to insure against similar events in the future. Even unsuccessful claims relating to accidents could result in substantial costs, including litigation expenses, and diversion of our management resources.
If we are unable to attract and retain a sufficient number of trained engineers, scientists and other highly-skilled technicians at competitive wages, our operational performance may be harmed and our costs may increase.
We believe that our success depends, in part, upon our ability to attract, develop and retain a sufficient number of trained engineers, scientists and other highly-skilled, certified technicians at competitive wages. The demand for such employees is currently high, and we project that it may increase substantially in the future. Accordingly, we have experienced increases in our labor costs, particularly in our Services segment, but also, to a lesser extent, in our International segment. Many of the companies with which we compete for experienced personnel have comparatively greater name recognition and resources. In addition, in making employment decisions, job candidates often consider the value of the equity compensation they are to receive in connection with their employment. Volatility in the future market price of our stock may, therefore, adversely affect our ability to attract or retain key employees. Furthermore, the requirement to expense stock-based awards may discourage us from granting the size or type of stock-based awards that job candidates require to join our company. The markets for our products and services also require us to field personnel trained and certified in accordance with standards set by domestic or international standard-setting bodies, such as the American Society of Non-Destructive Testing. Because of the limited supply of these certified technicians, we expend substantial resources maintaining in-house training and certification programs. If we fail to attract sufficient new personnel or fail to motivate and retain our current personnel, our ability to perform under existing contracts and orders or to pursue new business may be harmed, causing us to lose customers and revenues, and the costs of performing such contracts and orders may increase, which would likely reduce our margins.
If we lose members of our senior management team upon whom we are dependent, we may not be able to manage our operations and achieve our strategic objectives.
Our future success depends to a considerable degree upon the availability, contributions, vision, skills, experience and effort of our senior management team. We do not maintain “key person” insurance on any of our employees other than Dr. Sotirios J. Vahaviolos, our Chairman, President and Chief Executive Officer. We currently have no employment agreements with members of our senior management team other than with Dr. Vahaviolos. Although we may enter into employment agreements with certain executive officers in the future, these agreements will likely not guarantee the services of the individual for a specified period of time. All of the future agreements with members of our senior management team are expected to provide that their employment is at-will and may be terminated by either us or the employee at any time and without notice. Although we do not have any reason to believe that we may lose the services of any of these persons in the foreseeable future, the loss of the services of any of these persons might impede our operations or the achievement of our strategic and financial objectives. The loss or interruption of the service of members of our senior management team could harm our business, financial condition and results of operations and could significantly reduce our ability to manage our operations and implement our strategy.
25
We operate in highly competitive markets and if we are unable to compete successfully, we could lose market share and revenues and our margins could decline.
We face strong competition from NDT and a variety of niche asset protection providers, both larger and smaller than we are. Many of our competitors have greater financial resources than we do and could focus their substantial financial resources to develop a competing business model or develop products or services that are more attractive to potential customers than what we offer. Some of our competitors are business units of companies substantially larger than us and have the ability to combine asset protection solutions into an integrated offering to customers who already purchase other types of products or services from them. Our competitors may offer asset protection solutions at prices below or without cost in order to improve their competitive positions. Smaller niche competitors with small customer bases may be very aggressive in their pricing in order to retain customers. These competitive factors could make it more difficult for us to attract and retain customers, can cause us to lower our prices and accept lower margins in order to compete, the impact of which can reduce our market share, revenues and profits.
Due to our dependency on customers in the oil and gas industry, we are susceptible to prolonged negative trends relating to this industry that could adversely affect our operating results.
Our customers in the oil and gas industry (including the petrochemical market) have accounted for a substantial portion of our historical revenues. Specifically, they accounted for approximately 63%, 58% and 50% of our revenues for fiscal 2010, 2009 and 2008, respectively. While we make efforts to expand our customer base into industries other than the oil and gas industry, we may not be successful in doing so. Our services are vital to the operators of plants and refineries, however economic slow downs in the oil and gas industry can result in cut backs in contracts for our services. If the oil and gas industry were to suffer a prolonged or significant downturn, our revenues, profits and cash flows may be reduced. While we continue to seek to expand our market presence in the power generation and transmission, and chemical processing industries, among others, these markets too are cyclical in nature and as such, are subject to economic downturns.
Our growth strategy includes acquisitions. We may not be able to identify suitable acquisition candidates or integrate acquired businesses successfully, which may inhibit our rate of growth, and any acquisitions that we do complete may expose us to a number of unanticipated operational and financial risks.
Our historical growth has depended, and our future growth is likely to continue to depend, to a certain extent, on our ability to make acquisitions and successfully integrate acquired businesses. We intend to continue to seek additional acquisition opportunities, both to expand into new markets and to enhance our position in existing markets globally. We may not be able to successfully identify suitable candidates, negotiate appropriate acquisition terms, obtain necessary financing on acceptable terms, complete proposed acquisitions, successfully integrate acquired businesses into our current operations or expand into new markets. Once integrated, acquired operations may not achieve levels of revenues, profitability or productivity comparable with those achieved by our current operations, or otherwise perform as expected.
Some of the risks associated with our acquisition strategy include:
|
●
|
unexpected loss of key personnel and customers of the acquired company;
|
|
●
|
making the acquired company’s financial and accounting standards consistent with our standards;
|
|
●
|
assumption of liability for risks and exposures (including environmental-related costs), some of which we may not discover during our due diligence; and
|
|
●
|
potential disruption of our ongoing business and distraction of management.
|
Our ability to undertake acquisitions is limited by covenants in our credit agreement and our financial resources, including available cash and borrowing capacity. Future acquisitions could result in potentially dilutive issuances of equity securities, the incurrence of substantial additional indebtedness and other expenses, impairment expenses related to goodwill and impairment or amortization expenses related to other intangible assets, any of which could harm our financial condition and results of operations. Although management intends to: (i) evaluate the risks inherent in any particular transaction, (ii) assume only risks it believes to be acceptable, and (iii) develop plans to mitigate such risks, there are no assurances that we will properly ascertain or accurately assess the extent of all such risks. Difficulties encountered with acquisitions may harm our business, financial condition and results of operations.
26
Catastrophic events, such as natural disasters, industrial accidents, epidemics, war and acts of terrorism, could disrupt our business or the business of our customers, which could significantly harm our operations, financial results and cash flow.
Our operations and those of our customers are susceptible to the occurrence of catastrophic events outside our control, ranging from severe weather conditions to acts of war and terrorism. Any such events could cause a serious business disruption that reduces our customers’ ability to or interest in purchasing our asset protection solutions, and have in the past resulted in order cancellations and delays because customer equipment, facilities or operations have been damaged, or are not operational or available. In April 2010, our largest customer suffered a catastrophic industrial accident in the Gulf of Mexico. Due to the scope of the accident, the possibility exists that this customer could exit some of its refining operations or suffer liquidity problems, either of which could adversely affect our business. A large portion of our customer base has operations in the Gulf of Mexico, which is subject to hurricanes in the first and second quarters of our fiscal year. Hurricane-related disruptions to our customers operations have adversely affected our revenues in the past. Such events in the future may result in substantial delays in the provision of solutions to our customers and the loss of valuable equipment. Any cancellations, delays or losses due to a catastrophic event may significantly reduce our revenues and harm our operating performance.
We face risks related to the current economic conditions.
The global economy continues to be fragile. Global financial markets continue to experience disruptions, including diminished liquidity and credit availability, declines in consumer confidence, modest economic growth, persistently high unemployment rates, volatility in interest and currency exchange rates and continued uncertainty about economic stability. There may be further deterioration and volatility in the global economy, the global financial markets and consumer confidence. We are unable to predict the likely duration and severity of the current global economic uncertainties or disruptions in the financial markets. The downturn has already resulted in certain of our customers canceling and delaying orders for our solutions, as well as some customers delaying payment for items billed, which reduced our gross margins and operating income in fiscal 2010. Although less frequent, we continue to experience pricing pressure on new contracts and renewals of existing contracts. We have also experienced a decline in our customers’ capital spending. In addition, current economic conditions have resulted in the reduced creditworthiness, inability to obtain sufficient financing, and bankruptcies of certain customers, increasing our potential exposure to bad debt. Further, with the recent uncertainty in the European financial markets, European governments have begun to consider significant austerity measures, which could lead to cancellations or delays of orders and thus, may reduce revenues and profitability.
If economic conditions deteriorate further, our business, financial condition and results of operations could be adversely affected. Although we believe we have adequate liquidity and capital resources to fund our operations as planned, in light of current market conditions, our inability to access the capital markets on favorable terms, or at all, may harm our financial performance. The inability to obtain adequate financing from debt or capital sources could force us to self-fund strategic initiatives or even forgo certain opportunities, which in turn could potentially harm our performance.
We expect to continue expanding and our success depends on how effectively we manage our growth.
We expect to experience significant growth in the number of our employees and the scope of our operations. To effectively manage our anticipated future growth, we must continue to implement and improve our managerial, operational, financial and reporting systems, expand our facilities and continue to recruit and train additional qualified personnel. We expect that all of these measures will require significant expenditures and will demand the attention of management. Failure to manage our growth effectively could lead us to over or under-invest in technology and operations, result in weaknesses in our infrastructure, systems or controls, give rise to operational mistakes, loss of business opportunities, the loss of employees and reduced productivity among remaining employees. Our expected growth could require significant capital expenditures and may divert financial resources from other projects, such as the development of new solutions. If our management is unable to effectively manage our expected growth, our expenses may increase more than expected, our revenues could decline or may grow more slowly than expected and we may be unable to implement our business strategy.
The success of our businesses depends, in part, on our ability to develop new asset protection solutions and increase the functionality of our current offerings.
The market for asset protection solutions is impacted by technological change, uncertain product lifecycles, shifts in customer demands and evolving industry standards and regulations. We may not be able to successfully develop and market new asset protection solutions that comply with present or emerging industry regulations and technology standards. Also, new regulations or technology standards could increase our cost of doing business.
From time to time, our customers have requested greater functionality in our solutions. As part of our strategy to enhance our asset protection solutions and grow our business, we continue to make substantial investments in the research and development of new technologies. We believe our future success will depend, in part, on our ability to continue to design new, competitive asset protection solutions, enhance our current solutions and provide new, value-added services. Developing new solutions will require continued investment, and we may experience unforeseen technological or operational challenges. In addition, our asset protection software is complex and can be expensive to develop, and new software and software enhancements can require long development and testing periods. If we are unable to develop new asset protection solutions or enhancements that meet our customers’ needs on a timely basis, we will likely lose opportunities to earn revenues and to gain customers or access to markets, and our business and results of operations will be adversely affected.
27
If our software produces inaccurate information or is incompatible with the systems used by our customers and makes us unable to successfully provide our solutions, it could lead to a loss of revenues and customers.
Our software is complex and, accordingly, may contain undetected errors or failures. Software defects or inaccurate data may cause incorrect recording, reporting or display of information related to our asset protection solutions. Any such failures, defects and inaccurate data may prevent us from successfully providing our asset protection solutions, which would result in lost revenues. Software defects or inaccurate data may lead to customer dissatisfaction and our customers may seek to hold us liable for any damages incurred. As a result, we could lose customers, our reputation may be harmed and our financial condition and results of operations would be materially adversely affected.
We currently serve a commercial, industrial and governmental customer base that uses a wide variety of constantly changing hardware, software solutions and operating systems. Our asset protection solutions need to interface with these non-standard systems in order to gather and assess data. Our business depends on the following factors, among others:
|
●
|
our ability to integrate our technology with new and existing hardware and software systems;
|
|
●
|
our ability to anticipate and support new standards, especially Internet-based standards; and
|
|
●
|
our ability to integrate additional software modules under development with our existing technology and operational processes.
|
If we are unable to adequately address any of these factors, our results of operations and prospects for growth and profitability would be harmed.
If we fail to successfully educate current and potential customers regarding the benefits of our asset protection solutions or the market for these solutions otherwise fails to develop, our ability to grow our business could be adversely impacted.
Our future success depends on continued and growing commercial acceptance of our asset protection solutions and our ability to obtain additional contracts. We anticipate that revenues related to our asset protection solutions will constitute a substantial portion of our revenues for the foreseeable future. If we are unable to educate our potential customers about the advantages our solutions have over competing products and services, or our current customers stop purchasing our asset protection solutions, our operating results could be significantly harmed. In addition, because the asset protection solutions industry is rapidly evolving, we could lose insight into trends that may be emerging, which would further harm our competitive position by making it difficult to predict and respond to customer needs. If the market for our asset protection solutions does not continue to develop, our ability to grow our business would be limited and we might not be able to maintain profitability.
The seasonal nature of our business reduces our revenues and profitability in our first and third fiscal quarters.
Our business is seasonal. Our first and third fiscal quarter revenues are typically lower than our revenues in the second and fourth fiscal quarters because demand for our asset protection solutions from the oil and gas as well as the fossil and nuclear power industries increases during their non-peak production periods. For instance, U.S. refineries’ non-peak periods are generally in our second fiscal quarter, when they are retooling to produce more heating oil for winter, and in our fourth fiscal quarter, when they are retooling to produce more gasoline for summer. As a result of these trends, we generally have reduced cash flows in our second and fourth fiscal quarters, which may require us to borrow under our credit agreement or otherwise, to discontinue planned operations, or to curtail our operations. In addition, most of our operating expenses, such as employee compensation and property rental expense, are relatively fixed over the short term. Moreover, our spending levels are based in part on our expectations regarding future revenues. As a result, if revenues for a particular quarter are below expectations, we would not be able to proportionately reduce operating expenses for that quarter without a substantial disruption to our business. We expect that the negative impact of seasonality on our first and third fiscal quarter revenues and profitability and second and fourth fiscal quarter cash flows will continue.
28
Growth in revenues from our Services segment or traditional NDT services relative to revenues from our Products and Systems and International segments, may reduce our overall gross profit margin.
Our gross profit margin on revenues from our Services segment has historically been lower than our gross profit margin on revenues from our other segments because our services have higher labor-related costs. For instance, the gross profit margin in our Services segment for fiscal 2010 was approximately 27%, while our gross profit margin in our Products and Systems segment and in our International segment was approximately 53% and 38%, respectively. Our overall gross profit margin was 31% during the same period. We expect to continue our efforts to increase the number of “evergreen” or “run and maintain” contracts at oil refineries. Often times, the services we provide at the beginning of these contracts are traditional NDT services. Until such time as we can understand the needs of each new “evergreen” plant and we can then make recommendations to provide our advanced NDT services, and thus improve our sales product mix, our margins may continue to decline. Our gross profit margin on traditional NDT services has historically been lower than our gross profit margin in our Services segment as a whole. As a result, we expect our overall gross profit margin will be lower in periods when revenues from our services, and particularly from traditional NDT services, has increased as a percentage of total revenues and will be higher in periods when revenues from our International or Products and Systems segments has increased as a percentage of total revenues. In fiscal 2010, the Service segment revenue growth was approximately 36% as compared to fiscal 2009, and approximately 84% of total revenues. Segment revenue growth for the Products and Systems segment and International segment was 9% and 6%, respectively. We expect this trend to continue and to the extent is does, our margins may decrease. Fluctuations in our gross profit margin may affect our level of profitability in any period, which may negatively affect the price of our common stock.
Our business, and the industries we currently serve, are currently subject to governmental regulation, and may become subject to modified or new government regulation that may negatively impact our ability to market our asset protection solutions.
We incur substantial costs in complying with various government regulations and licensing requirements. For example, the transportation and overnight storage of radioactive materials used in providing certain of our asset protection solutions is subject to regulation under federal and state laws and licensing requirements. Our Services segment is currently licensed to handle radioactive materials by the U.S. Nuclear Regulatory Commission (NRC) and 18 state regulatory agencies. If we allegedly fail to comply with these regulations, we may be investigated and incur significant legal expenses associated with such investigations, and if we are found to have violated these regulations, we may be fined or lose one or more of our licenses to perform further projects. While we are investigated, we may be required to suspend work on the projects associated with our alleged noncompliance, resulting in loss of profits or customers, and damage to our reputation. Many of our customers have strict requirements concerning safety or loss time occurrences. In the future, federal, state, provincial or local governmental agencies may seek to change current regulations or impose additional regulations on our business. Any modified or new government regulation applicable to our current or future asset protection solutions may negatively impact the marketing and provision of those solutions and increase our costs and the price of our solutions.
Additionally, greenhouse gases that result from human activities, including burning of fossil fuels, have been the focus of increased scientific and political scrutiny and are being subjected to various legal requirements. International agreements, national laws, state laws and various regulatory schemes limit or otherwise regulate emissions of greenhouse gases, and additional restrictions are under consideration by different governmental entities. We derive a significant amount of revenues and profits from such industries, including oil and gas, power generation and transmission, and chemicals processing. Such regulations could negatively impact our customers, which could negatively impact the market for the services and products we provide. This could materially adversely affect our business, financial condition, results of operations and cash flows.
We rely on certification of our NDT solutions by industry standards-setting bodies. We currently have International Organization for Standardization (ISO) 9001-2000 certifications for each of Mistras Services, Physical Acoustics Corporation (PAC), Physical Acoustics Limited, and Envirocoustics S.A. and we have ISO 14001:2004 certification for Mistras Services and Physical Acoustics South America. Physical Acoustics South America also has an OHSAS 18001 certification. In addition, we currently have Nadcap (formerly National Aerospace and Defense Contractors Accreditation Program) certification for certain of our locations in Massachusetts, Ohio and Washington. We continually review our NDT solutions for compliance with the requirements of industry specification standards and the Nadcap special processes quality requirements. However, if we fail to maintain our ISO or Nadcap certifications, our business may be harmed because our customers generally require that we have ISO and Nadcap certification before they purchase our NDT solutions.
29
An inability to protect our intellectual property could negatively affect our business and results of operations.
Our ability to compete effectively depends in part upon the maintenance and protection of the intellectual property related to our asset protection solutions. Patent protection is unavailable for certain aspects of the technology and operational processes important to our business. Any patent held by us or to be issued to us, or any of our pending patent applications, could be unenforceable, challenged, invalidated or circumvented. Some of our trademarks that are not in use may become available to others. To date, we have relied principally on copyright, trademark and trade secrecy laws, as well as confidentiality agreements and licensing arrangements, to establish and protect our intellectual property. However, we have not obtained confidentiality agreements from all of our customers and vendors. Although we have entered into confidentiality agreements with all of our employees in our Products and Systems segment and certain of our other employees involved in the development of our intellectual property, we cannot be certain that these agreements will be honored or enforceable. Some of our confidentiality agreements are not in writing, and some customers are subject to laws and regulations that require them to disclose information that we would otherwise seek to keep confidential. Although we do not transfer ownership of some of our more advanced asset protection products and systems and, instead, sell to our customers services using these products and systems, in part, in an effort to protect the intellectual property upon which they are based, this strategy may not be successful and our customers or third parties may reverse engineer or otherwise derive this intellectual property and use it without our authorization. Policing unauthorized use of our intellectual property is difficult and expensive. The steps that we have taken or may take might not prevent misappropriation of the intellectual property on which we rely. In addition, effective protection may be unavailable or limited in jurisdictions outside the United States, as the intellectual property laws of foreign countries sometimes offer less protection or have onerous filing requirements. From time to time, third parties may infringe our intellectual property rights. Litigation may be necessary to enforce or protect our rights or to determine the validity and scope of the rights of others. Any litigation could be unsuccessful, cause us to incur substantial costs, divert resources away from our daily operations and result in the impairment of our intellectual property. Failure to adequately enforce our rights could cause us to lose valuable rights in our intellectual property and may negatively affect our business.
We may be subject to damaging and disruptive intellectual property litigation related to allegations that our asset protection solutions infringe on the intellectual property of others, which could prevent us from offering those solutions.
Third-party patent applications and patents may be applicable to our asset protection solutions. As a result, third parties may in the future make infringement claims and other allegations that could subject us to intellectual property litigation relating to our solutions. Such litigation would be time consuming and expensive, divert attention and resources away from our daily operations, impede or prevent delivery of our solutions and require us to pay significant royalties, licensing fees and damages. In addition, parties making infringement and other claims may be able to obtain injunctive or other equitable relief that could effectively block our ability to provide our solutions and could cause us to pay substantial damages if we are found to be infringing on others’ intellectual property rights. In the event of a successful claim of infringement, we may need to seek one or more licenses from third parties in order to continue to offer the related solution, which may not be available at a reasonable cost, or at all.
We may require additional capital to support business growth, which might not be available.
We intend to continue making investments to support our business growth and may require additional funds to respond to business challenges or opportunities, including the need to develop new, or enhance our current, asset protection solutions, enhance our operating infrastructure or acquire complementary businesses and technologies. Accordingly, we may need to engage in equity or debt financings to secure additional funds. If we raise additional funds through further issuances of equity or convertible debt securities, our current stockholders could suffer significant dilution, and any new equity securities we issue could have rights, preferences and privileges superior to those of holders of our common stock. Any debt financing secured by us in the future could involve restrictive covenants relating to our capital-raising activities and other financial and operational matters, which may make it more difficult for us to obtain additional capital and to pursue business opportunities, including potential acquisitions. In addition, we may not be able to obtain additional financing on terms favorable to us, if at all. If we are unable to obtain adequate financing or financing on terms satisfactory to us when we require it, our ability to continue to support our business growth and to respond to business challenges could be significantly limited.
Our credit agreement contains financial and operating restrictions that may limit our access to credit. If we fail to comply with financial or other covenants in our credit agreement, we may be required to repay indebtedness to our existing lenders, which may harm our liquidity.
Provisions in our current credit agreement impose restrictions on our ability to, among other things:
|
●
|
create liens;
|
|
●
|
make strategic acquisitions;
|
|
●
|
make investments;
|
30
|
●
|
incur more debt;
|
|
●
|
merge or consolidate;
|
|
●
|
make dispositions of property;
|
|
●
|
pay dividends and make distributions;
|
|
●
|
enter into a new line of business;
|
|
●
|
enter into transactions with affiliates; and
|
|
●
|
enter into burdensome agreements.
|
Our credit agreement also contains financial covenants that require us to maintain compliance with specified financial ratios. At times in the past, we fell out of compliance with certain of these covenants and we may not be able to comply with such covenants in the future. Although prior instances of noncompliance were waived by our lenders, our failure to comply with these covenants in the future may result in the declaration of an event of default, which could prevent us from borrowing under our credit agreement. In addition to preventing additional borrowings under our credit agreement, an event of default, if not cured or waived, may result in the acceleration of the maturity of indebtedness outstanding, if any, under the agreement, which would require us to pay all amounts outstanding and, in addition, our lenders may require us to cash collateralize letters of credit issued thereunder. If an event of default occurs, we may not be able to cure it within any applicable cure period, if at all. If the maturity of our indebtedness is accelerated, we then may not have sufficient funds available for repayment or the ability to borrow or obtain sufficient funds to replace the accelerated indebtedness on terms acceptable to us, or at all.
We may become subject to commercial disputes or product liability claims, that could harm our business by distracting our management from the operation of our business, by increasing our expenses and, if we do not prevail, by subjecting us to potential monetary damages and other remedies.
We face potential liability for, among other things, contract, negligence and product liability claims related to our provision of asset protection solutions. For instance, our customers may assert that we have failed to perform under our agreements with them, or our customers or third parties may claim damages arising out of misuse of our products, the malfunctioning of our products due to design or manufacturing flaws, or the use of our products with components or systems not manufactured or sold by us. While we do carry product liability insurance, our coverage may not be sufficient to satisfy any liability resulting from product liability or other claims. Any of these claims or disputes could result in monetary damages and equitable or other remedies that could harm our financial position or operations. Even if we prevail in or settle these claims or disputes, they may distract our management from operating our business and the cost of defending or settling them could harm our operating results, financial position and cash flows.
We rely on a limited number of suppliers to provide us radioisotopes and certain electronic components and a material interruption in supply could prevent or limit our ability to fill orders for our products.
We depend upon a limited number of third-party suppliers for the radioisotopes and certain electronic components we use to provide certain advanced asset protection solutions. We also utilize other commercial isotope and electronic component manufacturers located in the United States and overseas. To date, we have been able to obtain the required radioisotopes and electronic components for our asset protection solutions without any significant delays or interruptions. If we lose any of these suppliers or experience delays in obtaining these materials, we may be required to find and enter into supply arrangements with one or more replacement suppliers. Obtaining alternative sources of supply could involve significant delays and other costs and these supply sources may not be available to us on reasonable terms or at all. Any disruption of materials could delay delivery of our products, which could adversely affect our business and financial results and result in lost or deferred sales.
Our revenue cycle can be lengthy, unpredictable and require significant employee time and financial resources with no assurances that we will realize revenues.
Our sales cycles are often long and unpredictable. Many of our current and potential customers have extended budgeting and procurement processes. We believe that they also tend to be risk averse and follow industry trends rather than be the first to purchase new products or services, which can extend the lead time for or prevent acceptance of new products or services. Accordingly, they may take longer to reach a decision to purchase our solutions. This extended sales process, which often lasts between three and six months, requires the dedication of significant time and financial resources, with no certainty of success or recovery of our related expenses. It is not unusual for our current and potential customers to go through the entire sales process and not make any purchases.
31
Any real or perceived internal or external electronic security breaches in connection with the use of our asset protection solutions could harm our reputation, inhibit market acceptance of our solutions and cause us to lose customers.
We and our customers use our asset protection solutions to compile and analyze sensitive or confidential customer-related information. In addition, some of our asset protection solutions allow us to remotely control and store equipment at commercial, institutional and industrial locations. Our asset protection solutions rely on the secure electronic transmission of proprietary data over the Internet or other networks. The occurrence or perception of security breaches in connection with our asset protection solutions or our customers’ concerns about Internet security or the security of our solutions, whether warranted or not, would likely harm our reputation or business, inhibit market acceptance of our asset protection solutions and cause us to lose customers, any of which would harm our financial condition and results of operations.
We may come into contact with sensitive consumer information or data when we perform installation, maintenance or testing functions for our customers. Even the perception that we have improperly handled sensitive, confidential information would have a negative effect on our business. If, in handling this information, we fail to comply with privacy or security laws, we could incur civil liability to government agencies, customers and individuals whose privacy is compromised. In addition, third parties may attempt to breach our security or inappropriately harm our asset protection solutions through computer viruses, electronic break-ins and other disruptions. If a breach is successful, confidential information may be improperly obtained, for which we may be subject to lawsuits and other liabilities.
Our international operations are subject to risks relating to non-U.S. operations.
In fiscal 2010, 2009 and 2008, we generated approximately 18%, 22% and 22% respectively, of our revenues outside the United States and we expect to increase our international presence over time. Our primary operations outside the United States are in Europe, Asia, Canada and South America. There are numerous risks inherent in doing business in international markets, including:
|
●
|
fluctuations in interest rates and currency exchange rates;
|
|
●
|
varying regional and geopolitical business conditions and demands;
|
|
●
|
compliance with applicable foreign regulations and licensing requirements, and U.S. regulation with respect to our business in other countries, including the Foreign Corrupt Practices Act;
|
|
●
|
the cost and uncertainty of obtaining data and creating solutions that are relevant to particular geographic markets;
|
|
●
|
the need to provide sufficient levels of technical support in different locations;
|
|
●
|
the complexity of maintaining effective policies and procedures in locations around the world;
|
|
●
|
the risks of divergent business expectations or difficulties in establishing joint ventures with foreign partners;
|
|
●
|
political instability and civil unrest;
|
|
●
|
restrictions or limitations on outsourcing contracts or services abroad;
|
|
●
|
restrictions or limitations on the repatriation of funds; and
|
|
●
|
potentially adverse tax consequences.
|
We are expanding our sales and marketing efforts in certain emerging markets, such as Brazil, Russia, India and China. Expanding our business into emerging markets may present additional risks beyond those associated with more developed international markets. For example, in China and Russia, we may encounter risks associated with the ongoing transition from state business ownership to privatization. In any emerging market, we may face the risks of working in cash-based economies, dealing with inconsistent government policies and encountering sudden currency revaluations.
32
Risks related to our common stock
We expect our quarterly revenues and operating results to fluctuate. If we fail to meet the expectations of market analysts or investors, the market price of our common stock could decline substantially.
Our quarterly operating results have fluctuated in the past and may do so in the future. Accordingly, we believe that period-to-period comparisons of our results of operations may be misleading. You should not rely upon the results of one quarter as an indication of future performance. Our revenues and operating results may fall below the expectations of securities analysts or investors in any future period. Our failure to meet these expectations may cause the market price of our common stock to decline, perhaps substantially.
Our quarterly revenues and operating results may vary depending on a number of factors, including:
|
●
|
revenue volume during the period;
|
|
●
|
development of new relationships and maintenance and enhancement of existing relationships with customers and strategic partners;
|
|
●
|
the termination of existing customer contracts;
|
|
●
|
demand for and acceptance of our asset protection solutions;
|
|
●
|
delays in the implementation and delivery of our asset protection solutions, which may impact the timing of our recognition of revenues;
|
|
●
|
delays or reductions in spending for asset protection solutions by our customers and potential customers;
|
|
●
|
the long lead time associated with securing new customer contracts;
|
|
●
|
changes in pricing for asset protection solutions;
|
|
●
|
effects of recent acquisitions;
|
|
●
|
fluctuations in currency exchange rates;
|
|
●
|
changes in the price or availability of materials used in our services; and
|
|
●
|
increased expenditures for sales and marketing, software development and other corporate activities.
|
In addition to the effect our operating results may have on the market price of our common stock, the market price of our common stock may also be influenced by many other factors, some of which are beyond our control, including:
|
●
|
announcements by us or our competitors of significant contracts or acquisitions;
|
|
●
|
liquidity of the market for our common stock;
|
|
●
|
changes in financial estimates or recommendations by analysts;
|
|
●
|
general economic and stock market conditions;
|
|
●
|
quarterly or annual earnings of other companies in our industry;
|
|
●
|
future sales of our common stock;
|
|
●
|
changes in accounting standards, policies, guidance, interpretations or principles; and
|
|
●
|
the other factors described in this Risk Factors section.
|
33
The stock markets have generally experienced extreme price and volume fluctuations. This volatility has had a significant impact on the market price of securities issued by many companies, including those in our industry. These changes frequently appear to occur without regard to the operating performance of these companies. The price of our common stock could fluctuate for reasons that have little or nothing to do with our company, and these fluctuations could materially reduce our stock price.
In the past, some companies that have had volatile market prices for their securities have been subject to class action or derivative lawsuits. The filing of a lawsuit against us, regardless of the outcome, could have a material adverse effect on our business, financial condition and results of operations, as it could result in substantial legal costs and a diversion of our management’s attention and resources.
A significant stockholder controls the direction of our business. The concentrated ownership of our common stock may prevent you and other stockholders from influencing significant corporate decisions.
Dr. Sotirios J. Vahaviolos, our Chairman, President and Chief Executive Officer, owns approximately 43% of our outstanding common stock. As a result, Dr. Vahaviolos effectively controls our Company and has the ability to exert substantial influence over all matters requiring approval by our stockholders, including the election and removal of directors, amendments to our certificate of incorporation, and any proposed merger, consolidation or sale of all or substantially all of our assets and other corporate transactions. This concentration of ownership could be disadvantageous to other stockholders with differing interests from Dr. Vahaviolos.
We currently have no plans to pay dividends on our common stock.
We have not declared or paid any cash dividends on our common stock to date, and we do not anticipate declaring or paying any dividends on our common stock in the foreseeable future. We currently intend to retain all available funds and any future earnings for use in the development, operation and growth of our business. In addition, our credit agreement prohibits us from paying dividends and future loan agreements may also prohibit the payment of dividends. Any future determination relating to our dividend policy will be at the discretion of our board of directors and will depend on our results of operations, financial condition, capital requirements, business opportunities, contractual restrictions and other factors deemed relevant. To the extent we do not pay dividends on our common stock, investors must look solely to stock appreciation for a return on their investment.
Shares eligible for future sale may cause the market price for our common stock to decline even if our business is doing well.
Future sales by us or by our existing stockholders of substantial amounts of our common stock in the public market, or the perception that these sales may occur, could cause the market price of our common stock to decline. This could also impair our ability to raise additional capital in the future through the sale of our equity securities. Under our second amended and restated certificate of incorporation, we are authorized to issue up to 200,000,000 shares of common stock, of which approximately 26,664,000 shares of common stock are outstanding as of August 1, 2010. In addition, the Company has approximately 2,960,000 shares of common stock underlying stock options that are outstanding as of August 1, 2010. We cannot predict the size of future issuances of our common stock or the effect, if any, that future sales and issuances of shares of our common stock, or the perception of such sales or issuances, would have on the market price of our common stock.
Provisions of our charter, bylaws and of Delaware law, as well as some of our employment arrangements, could discourage, delay or prevent a change of control of our company, which may adversely affect the market price of our common stock.
Certain provisions of our second amended and restated certificate of incorporation and amended and restated bylaws could discourage, delay or prevent a merger, acquisition, or other change of control that stockholders may consider favorable, including transactions in which you might otherwise receive a premium for your shares. These provisions also could limit the price that investors might be willing to pay in the future for shares of our common stock, thereby depressing the market price of our common stock. Stockholders who wish to participate in these transactions may not have the opportunity to do so. Furthermore, these provisions could prevent or frustrate attempts by our stockholders to replace or remove our management. These provisions:
|
●
|
allow the authorized number of directors to be changed only by resolution of our board of directors;
|
|
●
|
require that vacancies on the board of directors, including newly created directorships, be filled only by a majority vote of directors then in office;
|
34
|
●
|
authorize our board of directors to issue, without stockholder approval, preferred stock that, if issued, could operate as a “poison pill” to dilute the stock ownership of a potential hostile acquirer to prevent an acquisition that is not approved by our board of directors;
|
|
●
|
require that stockholder actions must be effected at a duly called stockholder meeting by prohibiting stockholder action by written consent;
|
|
●
|
prohibit cumulative voting in the election of directors, which would otherwise allow holders of less than a plurality of stock to elect some directors; and
|
|
●
|
establish advance notice requirements for stockholder nominations to our board of directors or for stockholder proposals that can be acted on at stockholder meetings and limit the right to call special meetings of stockholders to the Chairman of the Board, the Chief Executive Officer, the board of directors acting pursuant to a resolution adopted by a majority of directors or the Secretary upon the written request of stockholders entitled to cast not less than 35% of all the votes entitled to be cast at such meeting.
|
Some of our employment arrangements and stock option agreements provide for severance payments and accelerated vesting of benefits, including accelerated vesting of restricted stock and options, upon a change of control. These provisions may discourage or prevent a change of control.
In addition, because we are incorporated in Delaware, we are governed by the provisions of Section 203 of the Delaware General Corporation Law, which may, unless certain criteria are met, prohibit large stockholders, in particular those owning 15% or more of our outstanding voting stock, from merging or combining with us for a prescribed period of time.
Our internal controls over financial reporting will be subject to the standards required by Section 404 of the Sarbanes-Oxley Act, and failure to achieve and maintain effective internal controls over financial reporting in accordance with Section 404 of the Sarbanes-Oxley Act could have a material adverse effect on our business and stock price.
Our internal controls over financial reporting will be subject to the standards required by Section 404 of the Sarbanes-Oxley Act in the course of preparing our 2011 annual report on Form 10-K. We and our independent registered public accounting firm reported to our audit committee certain significant deficiencies related to the design and operating effectiveness of our internal controls over financial reporting. A significant deficiency is a deficiency, or a combination of deficiencies, in internal control over financial reporting that is less severe than a material weakness, yet important enough to merit attention by those responsible for oversight of the registrant’s financial reporting. During fiscal 2010, we increased our efforts to establish comprehensive documentation of our internal controls, and we now test these controls on a periodic basis in accordance with Section 404 of the Sarbanes-Oxley Act. Despite our efforts, we still have a number of significant deficiencies we need to address related to the design and operating effectiveness of our internal controls over financial reporting. We need further improvement in order to be in full compliance with Section 404 of the Sarbanes-Oxley Act. If the results of our additional efforts are not successful or we are not able to demonstrate that the design and operating effectiveness of our internal controls over financial reporting are in compliance with the requirements of Section 404, we and our independent registered public accounting firm may not be able to attest to the effectiveness of our internal controls over financial reporting. If we are unable to maintain adequate internal controls over financial reporting, we may be unable to report our financial information in a timely and reliable manner, may suffer adverse regulatory consequences or violations of applicable stock exchange listing rules and may breach the covenants under our credit facilities. There could also be a negative reaction in the financial markets due to a loss of investor confidence in us and the reliability of our financial statements, which could significantly harm our business.
|
UNRESOLVED STAFF COMMENTS
|
None.
|
PROPERTIES
|
As of May 31, 2010, we operated 72 offices in 15 countries, with our corporate headquarters located in Princeton Junction, New Jersey. Our headquarters in Princeton Junction is our primary location, where our manufacturing, research, and development is conducted. We lease most of our facilities, and as of May 31, 2010, owned properties located in Olds, Alberta; Monroe, North Carolina; Trainer, Pennsylvania; Houston and Pasadena, Texas; and Gillette, Wyoming.
35
|
LEGAL PROCEEDINGS
|
We are subject to periodic lawsuits, investigations and claims that arise in the ordinary course of business. See “Litigation” in Note 14 to our audited consolidated financial statements contained in Item 8. of this report for a description of legal proceedings involving us and our business, which is incorporated herein by reference.
|
SUBMISSION OF MATTERS TO A VOTE OF SECURITY HOLDERS EXECUTIVE OFFICERS
|
No matters were submitted to a vote of security holders during the fourth quarter of fiscal year ended May 31, 2010.
The following are our executive officers and other key employees as of May 31, 2010 and their background and experience:
|
Name
|
Age
|
Position
|
||
|
Sotirios J. Vahaviolos
|
64
|
Chairman, President, Chief Executive Officer and Director
|
||
|
Paul Peterik
|
60
|
Chief Financial Officer and Treasurer
|
||
|
Michael J. Lange
|
50
|
Group Executive Vice President, CEO Mistras Services, and Director
|
||
|
Dennis Bertolotti
|
50
|
President, Chief Operating Officer, Mistras Services
|
||
|
Mark F. Carlos
|
58
|
Group Executive Vice President, Products and Systems
|
||
|
Phillip T. Cole
|
57
|
Group Executive Vice President, International
|
||
|
Michael C. Keefe
|
53
|
Executive Vice President, General Counsel and Secretary
|
||
|
Ralph L. Genesi
|
55
|
Group Executive Vice President, Marketing and Sales
|
Sotirios J. Vahaviolos has served as our Chairman, President and Chief Executive Officer since he founded Mistras in 1978 under the name Physical Acoustics Corp. Prior to joining Mistras, Dr. Vahaviolos worked at AT&T Bell Laboratories. Dr. Vahaviolos received a BS in Electrical Engineering and graduated first in his class from Fairleigh Dickinson University and received a Master of Science (EE), Masters in Philosophy and a Ph.D.(EE) from the Columbia University School of Engineering. During Dr. Vahaviolos’ career in non-destructive testing, he has been elected Fellow of The Institute of Electrical and Electronics Engineers, a member of The American Society for Nondestructive Testing (ASNT) where he served as its President from 1992-1993 and its Chairman from 1993-1994, a member of Acoustic Emission Working Group (AEWG) and an honorary life member of the International Committee for Nondestructive Testing. Additionally, he was the recipient of ASNT’s Gold Medal in 2001 and AEWG’s Gold Medal in 2005. He was also one of the six founders of NDT Academia International in 2008.
Paul “Pete” Peterik joined Mistras in May 2005 as our Chief Financial Officer, a role he served until July 12, 2010, when Mistras appointed Francis T. Joyce as Chief Financial Officer to replace Mr. Peterik, who is retiring. Mr. Peterik in continuing with the Company for a transition period, which includes continuing to serve as the Company’s principal financial and accounting officer through the filing of this report. Mr. Peterik also served as our Secretary until Mr. Keefe assumed those duties in January 2010. Prior to joining Mistras, Mr. Peterik was the Chief Financial Officer of Integrated Leasing Corp., a leasing company serving the electronic payment processing industry, from August 2003 until the business was sold in January 2005. From November 2002 to August 2003, Mr. Peterik operated his own financial consulting business for start-up and mid-sized companies. From 1980 to 2002, Mr. Peterik was employed as chief financial officer or chief operating officer at various private and public companies. Mr. Peterik was employed with PricewaterhouseCoopers LLP for nine years from 1971 to 1980, where he attained the position of audit manager.
With Mr. Peterik’s retirement, Francis T. Joyce was appointed Executive Vice President, Chief Financial Officer and Treasurer. Mr. Joyce, age 57, most recently was the Chief Financial Officer of Macquarie Infrastructure Company LLC, a New York Stock Exchange infrastructure operation and investment company that provides services in the general aviation, bulk liquid storage, gas utility, district cooling and airport parking industries. Prior to Macquarie, Mr. Joyce served as Chief Financial Officer of IMAX Corporation, a NASDAQ company, from 2001 until 2006 and from 1998 to 2001, he served as Chief Financial Officer and Treasurer of TheGlobe.com. Mr. Joyce started his career in public accounting at KPMG in New York. Frank graduated from the University of Scranton with a Bachelor of Science in Accounting and from Fordham University Graduate School of Business with an MBA in Finance. Frank is a certified public accountant.
Michael J. Lange is Group Executive Vice President and Chief Executive Officer for Mistras Services. He joined Mistras when it acquired Quality Services Laboratories in November 2000. He was elected a Director in 2003. Mr. Lange is a well recognized authority in Radiography and has held an ASNT Level III Certificate for almost 20 years. Mr. Lange received an Associate of Science degree in NDT from the Spartan School of Aeronautics in 1979.
36
Dennis Bertolotti is the President and Chief Operating Officer, Mistras Services. Mr. Bertolotti has been with us since we acquired Conam Inspection Services in 2003, where Mr. Bertolotti was a Vice President at the time of the acquisition. Mr. Bertolotti has been in the NDT business for over 25 years, and previously held ASNT Level III certifications and various American Petroleum Institute certifications, and received his Associate of Science degree in NDT from Moraine Valley Community College in 1983. Mr. Bertolotti received a Bachelor of Science and MBA from Otterbein College.
Mark F. Carlos is Group Executive Vice President responsible for Products and Systems. Mr. Carlos joined Mistras at its founding in 1978. Prior to joining Mistras, Mr. Carlos worked at AT&T Bell Laboratories. Mr. Carlos received a Masters in Business Administration from Rider University and a Masters in Electrical Engineering from Columbia University. Mr. Carlos is an elected Fellow of ASNT and AEWG, and currently serves as the Chairman of the American Society for Testing and Materials’ NDT Standards Writing Committee E-07 and was the recipient of its prestigious Charles W. Briggs Award in 2007.
Phillip T. Cole is Group Executive Vice President, International, and Managing Director of Physical Acoustics Limited (PAL), our subsidiary based in England. Mr. Cole founded Dunegan UK in 1983, which was acquired by PAL in 1986. Mr. Cole obtained a master’s degree in physics and electronic engineering from Loughborough University. Mr. Cole began his career at TI Research in the U.K. where he focused on NDT electromagnetic-acoustic devices.
Michael C. Keefe is Executive Vice President, General Counsel and Secretary and also has responsibility for human resources, joining Mistras in December 2009. Most recently before Mistras, Mr. Keefe worked at International Fight League, a publicly-traded sports promotion company, initially as Executive Vice President, General Counsel and Corporate Secretary, then becoming the Chief Financial Officer, and eventually its President. Prior to that, Mr. Keefe served in various legal roles with Lucent Technologies and AT&T for 15 years, the last four as Vice President, Corporate and Securities Law and Assistant Secretary, and was in private practice at New Jersey’s largest law firm, McCarter & English, LLP. Before starting his legal career, Mr. Keefe was employed at PricewaterhouseCoopers LLP, and worked in accounting for seven years, becoming a certified public accountant. Mr. Keefe received a Bachelors of Science in Accounting from Seton Hall University and a J.D. from Seton Hall University School of Law, where he graduated first in his class.
Ralph L. Genesi is Group Executive Vice President, Marketing and Sales. He joined Mistras in March of 2009 with more than 25 years of executive management experience in marketing and sales as well as corporate profit and loss responsibility. Prior to joining Mistras, Mr. Genesi was President of Swantech, a division of the Curtiss Wright Corporation. Previously, he was Vice President and General Manager for Siemens AG-Power Generation Information Technology Business, responsible for energy trading, fleet operations & control solutions worldwide. He has also held positions as President-Americas Operations for Spectris Technologies Inc., a European holding company and Director, Global Market & Sales Development for Honeywell IAC. Mr. Genesi has an Electrical Engineering degree from Fairleigh Dickinson University.
Our executive officers are elected by, and serve at the discretion of, our board of directors. There are no family relationships among any of our directors or executive officers.
37
|
MARKET FOR REGISTRANT’S COMMON EQUITY, RELATED STOCKHOLDER MATTERS AND ISSUER PURCHASE OF EQUITY SECURITIES
|
MARKET FOR COMMON STOCK
Our common stock currently trades on the New York Stock Exchange (“NYSE”) under the ticker symbol “MG”. The following table sets forth for the periods indicated the range of high and low closing sale prices of our common stock. Trading of our common stock commenced on October 9, 2010, the first trading day after our initial public offering.
|
Year ended May 31, 2010
|
||||||||
|
High
|
Low
|
|||||||
|
Quarter ended August 31,
|
n/a | n/a | ||||||
|
Quarter ended November 30,
|
$ | 13.99 | $ | 11.45 | ||||
|
Quarter ended February 28,
|
$ | 15.06 | $ | 11.90 | ||||
|
Quarter ended May 31,
|
$ | 12.80 | $ | 9.85 | ||||
HOLDERS OF RECORD
As of August 1, 2010, there were approximately 23 holders of record of our Common Stock.
DIVIDENDS
No cash dividends have been paid on our Common Stock to date. We currently intend to retain our future earnings, if any, to finance the expansion of our business and do not expect to pay any cash dividends in the foreseeable future.
38
|
SELECTED FINANCIAL DATA
|
The following tables set forth our selected historical consolidated financial data for the periods indicated. The selected statement of operations and cash flow data for fiscal 2010, 2009 and 2008 and the selected balance sheet data as of May 31, 2010 and 2009 have been derived from our audited financial statements and related notes thereto included elsewhere in this Annual Report. The statement of operations and cash flow data for fiscal 2007 and fiscal 2006 and the selected balance sheet data as of May 31, 2007 and 2006 have been derived from our audited financial statements not included in this Annual Report. The information presented below should be read in conjunction with “Management’s Discussion and Analysis of Financial Condition and Results of Operations” and the audited financial statements and the notes thereto included elsewhere in this Annual Report.
|
For the years ended May 31,
|
||||||||||||||||||||
|
2010
|
2009
|
2008
|
2007
|
2006
|
||||||||||||||||
|
(in thousands, except share and per share data)
|
||||||||||||||||||||
|
Statement of Operations Data
|
||||||||||||||||||||
|
Revenues
|
$ | 272,128 | $ | 209,133 | $ | 152,268 | $ | 122,241 | $ | 93,741 | ||||||||||
|
Cost of revenues
|
178,480 | 131,167 | 90,590 | 75,702 | 55,908 | |||||||||||||||
|
Depreciation of products
|
10,510 | 8,700 | 6,847 | 4,666 | 3,013 | |||||||||||||||
|
Gross profit
|
83,138 | 69,266 | 54,831 | 41,873 | 34,820 | |||||||||||||||
|
Selling, general and administrative expenses
|
54,849 | 46,456 | 32,243 | 26,408 | 24,748 | |||||||||||||||
|
Research and engineering
|
2,402 | 1,949 | 1,654 | 703 | 660 | |||||||||||||||
|
Depreciation and amortization
|
4,673 | 3,936 | 4,576 | 4,025 | 4,165 | |||||||||||||||
|
Legal settlement
|
(297 | ) | 2,100 | — | — | — | ||||||||||||||
|
Acquisition related costs
|
614 | — | — | — | — | |||||||||||||||
|
Income from operations
|
20,897 | 14,825 | 16,358 | 10,737 | 5,247 | |||||||||||||||
|
Interest expense
|
3,531 | 4,614 | 3,531 | 4,482 | 4,225 | |||||||||||||||
|
Loss on extinguishment of long-term debt
|
387 | — | — | 460 | — | |||||||||||||||
|
Income before provision for income taxes and noncontrolling interest
|
16,979 | 10,211 | 12,827 | 5,795 | 1,022 | |||||||||||||||
|
Provision for income taxes
|
6,527 | 4,558 | 5,380 | 208 | 503 | |||||||||||||||
|
Income before noncontrolling interests
|
10,452 | 5,653 | 7,447 | 5,587 | 519 | |||||||||||||||
|
Net (income) attributable to noncontrolling interests
|
(23 | ) | (187 | ) | (8 | ) | (199 | ) | (17 | ) | ||||||||||
|
Net income attributable to Mistras Group, Inc.
|
10,429 | 5,466 | 7,439 | 5,388 | 502 | |||||||||||||||
|
Accretion of preferred stock
|
6,499 | (27,114 | ) | (32,872 | ) | (3,520 | ) | (2,922 | ) | |||||||||||
|
Net income (loss) attributable to common stockholders
|
$ | 16,928 | $ | (21,648 | ) | $ | (25,433 | ) | $ | 1,868 | $ | (2,420 | ) | |||||||
|
Weighted average common shares outstanding:
|
||||||||||||||||||||
|
Basic
|
21,744 | 13,000 | 13,000 | 12,888 | 12,702 | |||||||||||||||
|
Diluted
|
24,430 | 13,000 | 13,000 | 13,101 | 12,702 | |||||||||||||||
|
Earnings (loss) per common share:
|
||||||||||||||||||||
|
Basic
|
$ | 0.78 | $ | (1.67 | ) | $ | (1.96 | ) | $ | 0.14 | $ | (0.19 | ) | |||||||
|
Diluted
|
$ | 0.43 | $ | (1.67 | ) | $ | (1.96 | ) | $ | 0.14 | $ | (0.19 | ) | |||||||
|
Other Financial Data:
|
||||||||||||||||||||
|
Net cash provided by operating activities
|
$ | 18,987 | $ | 12,661 | $ | 12,851 | $ | 14,006 | $ | 6,208 | ||||||||||
|
Net cash used in investing activities
|
(16,534 | ) | (15,888 | ) | (19,446 | ) | (4,259 | ) | (2,387 | ) | ||||||||||
|
Net cash provided by (used in) financing activities
|
8,083 | 4,912 | 6,320 | (8,122 | ) | (2,654 | ) | |||||||||||||
|
EBITDA(1)
|
35,670 | 27,274 | 27,773 | 18,769 | 12,408 | |||||||||||||||
|
Adjusted EBITDA (1)
|
$ | 39,464 | $ | 31,122 | $ | 28,091 | $ | 19,229 | $ | 12,408 | ||||||||||
|
As of May 31,
|
||||||||||||||||||||
|
2010
|
2009
|
2008
|
2007
|
2006
|
||||||||||||||||
|
(in thousands, except share and per share data)
|
||||||||||||||||||||
|
Balance Sheet Data
|
||||||||||||||||||||
|
Cash and cash equivalents
|
$
|
16,037
|
$
|
5,668
|
$
|
3,555
|
$
|
3,767
|
$
|
1,976
|
||||||||||
|
Total assets
|
188,632
|
153,433
|
119,822
|
79,885
|
74,425
|
|||||||||||||||
|
Total long-term debt, including current portion
|
11,994
|
66,251
|
48,270
|
25,403
|
29,668
|
|||||||||||||||
|
Obligations under capital leases, including current portion
|
14,569
|
14,525
|
11,842
|
9,970
|
8,275
|
|||||||||||||||
|
Convertible redeemable preferred stock
|
—
|
90,983
|
63,869
|
30,995
|
26,575
|
|||||||||||||||
|
Total Mistras Group, Inc. stockholders’ equity (deficit)
|
$
|
130,286
|
$
|
(47,912
|
)
|
$
|
(24,475
|
)
|
$
|
903
|
$
|
(1,326
|
)
|
|||||||
|
Cash dividends per common share
|
—
|
—
|
—
|
—
|
—
|
|||||||||||||||
39
Our management uses Adjusted EBITDA as a measure of operating performance to assist in comparing performance from period to period on a consistent basis, as a measure for planning and forecasting overall expectations and for evaluating actual results against such expectations. Adjusted EBITDA is also used as a performance evaluation metric off which to base executive and employee incentive compensation programs.
We believe investors and other users of our financial statements benefit from the presentation of adjusted EBITDA in evaluating our operating performance because it provides an additional tool to compare our operating performance on a consistent basis and measure underlying trends and results in our business. Adjusted EBITDA removes the impact of certain items that management believes do not directly reflect our core operations. For instance, adjusted EBITDA generally excludes interest expense, taxes and depreciation, amortization, each of which can vary substantially from company to company depending upon accounting methods and the book value and age of assets, capital structure, capital investment cycles and the method by which assets were acquired. It also eliminates stock-based compensation, which is generally a non-cash expense and is excluded by management when evaluating the underlying performance of our business operations.
While adjusted EBITDA is a term and financial measurement commonly used by investors and securities analysts, it has limitations. As a non-GAAP measurement, adjusted EBITDA has no standard meaning and, therefore, may not be comparable with similar measurements for other companies. Adjusted EBITDA is generally limited as an analytical tool because it excludes charges and expenses we do incur as part of our operations. For example, adjusted EBITDA excludes taxes, but we generally incur significant U.S. federal, state and foreign income taxes each year and the provision for income taxes is a necessary cost. Adjusted EBITDA should not be considered in isolation or as a substitute for analyzing our results as reported under U.S. generally accepted accounting principles.
The following table provides a reconciliation of net income to EBITDA and adjusted EBITDA:
|
For the years ended May 31,
|
||||||||||||||||||||
|
2010
|
2009
|
2008
|
2007
|
2006
|
||||||||||||||||
|
(in thousands)
|
||||||||||||||||||||
|
Net income
|
$ | 10,429 | $ | 5,466 | $ | 7,439 | $ | 5,388 | $ | 502 | ||||||||||
|
Interest expense
|
3,531 | 4,614 | 3,531 | 4,482 | 4,225 | |||||||||||||||
|
Provision for income taxes
|
6,527 | 4,558 | 5,380 | 208 | 503 | |||||||||||||||
|
Depreciation and amortization
|
15,183 | 12,636 | 11,423 | 8,691 | 7,178 | |||||||||||||||
|
EBITDA
|
$ | 35,670 | $ | 27,274 | $ | 27,773 | $ | 18,769 | $ | 12,408 | ||||||||||
|
Legal settlement
|
(297 | ) | 2,100 | — | — | — | ||||||||||||||
|
Large customer bankruptcy
|
395 | 1,556 | — | — | — | |||||||||||||||
|
Stock compensation expense
|
2,695 | 192 | 318 | — | — | |||||||||||||||
|
Acquisition related costs
|
614 | — | — | — | — | |||||||||||||||
|
Loss on extinguishment of debt
|
387 | — | — | 460 | — | |||||||||||||||
|
Adjusted EBITDA
|
$ | 39,464 | $ | 31,122 | $ | 28,091 | $ | 19,229 | $ | 12,408 | ||||||||||
|
MANAGEMENTS DISCUSSION AND ANALYSIS OF FINANCIAL CONDITION AND RESULTS OF OPERATION
|
The following discussion and analysis of our financial condition and results of operations should be read in conjunction with “Selected Financial Data” and the Financial Statements and related disclosures included elsewhere in this Report. The following discussion may contain forward-looking statements. Such forward-looking statements include those that express plans, anticipation, intent, contingency, goals, targets or future development and/or otherwise are not statements of historical fact. These forward-looking statements are based on our current expectations and projections about future events and they are subject to risks and uncertainties known and unknown that could cause actual results and developments to differ materially from those expressed or implied in such statements.
In some cases, you can identify forward-looking statements by terminology, such as “goals,” or “expects,” “anticipates,” “intends,” “plans,” “believes,” “seeks,” “estimates,” or the negative of such terms or other similar expressions. You are urged not to place undue reliance on any such forward-looking statements, any of which may turn out to be wrong due to inaccurate assumptions, unknown risks, uncertainties or other factors. Factors that could cause or contribute to differences in results and outcomes from those in our forward-looking statements include, without limitation, those discussed elsewhere in this Report in Part I, Item 1A. “Risk Factors” and in Item 1 “Business—Forward-Looking Statements,” as well as those discussed in our other Securities and Exchange Commission (SEC) filings.
40
Overview
We are a leading global provider of technology-enabled asset protection solutions used to evaluate the structural integrity of critical energy, industrial and public infrastructure. We combine industry-leading products and technologies, expertise in mechanical integrity (MI) and non-destructive testing (NDT) services and proprietary data analysis software to deliver a comprehensive portfolio of customized solutions, ranging from routine inspections to complex, plant-wide asset integrity assessments and management. These mission critical solutions enhance our customers’ ability to extend the useful life of their assets, increase productivity, minimize repair costs, comply with governmental safety and environmental regulations, manage risk and avoid catastrophic disasters. Given the role our services play in ensuring the safe and efficient operation of infrastructure, we have historically provided a majority of our services to our customers on a regular, recurring basis. We serve a global customer base of companies with asset-intensive infrastructure, including companies in the oil and gas, fossil and nuclear power, public infrastructure, chemicals, aerospace and defense, transportation, primary metals and metalworking, pharmaceuticals and food processing industries. During fiscal 2010, we provided our asset protection solutions to approximately 4,800 customers. As of May 31, 2010, we had approximately 2,300 employees, including 30 Ph.D.’s and more than 100 other degreed engineers and highly-skilled, certified technicians, in 72 offices across 15 countries. We have established long-term relationships as a critical solutions provider to many leading companies in our target markets. Our current principal market is the oil and gas industry, which accounted for approximately 63%, 58% and 50% of our revenues for fiscal 2010, 2009 and 2008, respectively.
During the last several years, we have focused on introducing our advanced asset protection solutions to our customers using proprietary, technology-enabled software and testing instruments, including those developed by our Products and Systems segment. During this period, the demand for outsourced asset protection solutions has, in general, increased, creating demand from which our entire industry has benefited. We have experienced compounded annual growth rate (CAGR) for revenue of 31% over the last three fiscal years, including the impact of acquisitions and currency fluctuations. During the same period, revenues from our customers in the oil and gas market, historically our largest target market, had a CAGR of 40%. All of our other target markets, collectively, had a CAGR of 19%. We believe further growth can be realized in all of our target markets. Concurrent with this growth, we have worked to build our infrastructure to profitably absorb additional growth and have made a number of small acquisitions in an effort to leverage our fixed costs, grow our base of experienced personnel, expand our technical capabilities and increase our geographical reach.
We have increased our capabilities and the size of our customer base through the development of applied technologies and managed support services, organic growth and the successful and seamless integration of acquired companies. These acquisitions have provided us with additional products, technologies, resources and customers that have enhanced our sustainable competitive advantages over our competition.
The global economy continues to be fragile. Global financial markets continue to experience disruptions, including severely diminished liquidity and credit availability, declines in consumer confidence, declines in economic growth, persistently high unemployment rates, volatility in interest and currency exchange rates and continued uncertainty about economic stability. There may be further deterioration and volatility in the global economy, the global financial markets, and consumer confidence. The downturn has negatively impacted our profitability and may negatively impact our future results if it continues. However, we believe it also has allowed us to selectively hire new talented individuals that otherwise might not have been available to us, to acquire and develop new technology in order to aggressively expand our proprietary portfolio of customized solutions, and to make acquisitions of complementary businesses at reasonable valuations. We believe we will be able to derive additional revenues from these strategic investments with favorable gross margins in future periods, which we believe would at least in part offset any further negative revenue impact we incur from the economic downturn during those periods. Also, although certain of our customers have delayed or reduced the scope of turnaround projects and other large-scale inspection projects, they have historically seldom postponed such projects indefinitely, so we expect increased revenues if and when our customers request we complete these projects.
41
Basis of presentation
Consolidated results of operations
Our three segments are:
|
●
|
Services. This segment provides asset protection solutions in North and Central America with the largest concentration in the United States.
|
|
●
|
Products and Systems. This segment designs, manufactures, sells, installs and services our asset protection products and systems, including equipment and instrumentation, predominantly in the United States.
|
|
●
|
International. This segment offers services, products and systems similar to those of our other segments to global markets, principally in Europe, the Middle East, Africa, Asia and South America, but not to customers in China and South Korea, which are served by our Products and Systems segment.
|
General corporate services, including accounting, audit, legal, payroll, information technology, human resources and contract management, are provided to the segments and are reported as intersegment transactions within corporate and eliminations. Sales to the International segment from the Products and Systems segment and subsequent sales by the International segment of the same items are recorded and reflected in the operating performance of both segments. Additionally, engineering charges and royalty fees charged to the Services and International segments by the Products and Systems segment are reflected in the operating performance of each segment. All such intersegment transactions are eliminated in corporate and eliminations.
The accounting policies of the reportable segments are the same as those described in the summary of our significant accounting policies in Note 2 to our audited consolidated financial statements included elsewhere in this Annual Report. Segment income from operations is determined based on internal performance measures used by the Chief Executive Officer, the chief operating decision maker, to assess the performance of each business in a given period and to make decisions as to resource allocations. In connection with that assessment, the Chief Executive Officer may exclude items such as charges for stock-based compensation and certain other acquisition-related charges and balances, technology and product development costs, certain gains and losses from dispositions, and litigation settlements or other charges. Certain general and administrative costs such as human resources, information technology and training are allocated to the segments. Segment income from operations also excludes interest and other financial charges and income taxes. Corporate and other assets are comprised principally of cash, deposits, property, plant and equipment, domestic deferred taxes, deferred charges and other assets. Corporate loss from operations consists of depreciation on the corporate office facilities and equipment, administrative charges related to corporate personnel and other charges that cannot be readily identified for allocation to a particular segment.
Statement of operations overview
The following describes certain line items in our statement of operations and some of the factors that affect our operating results.
Revenues
Our revenues are generated by sales of our services, products and systems. The majority of our revenues are derived under time-and-materials contracts for specified asset protection services on a project-by-project basis. The duration of our projects vary depending on their scope. Some of our projects last from a few weeks to a few months, but the more significant projects can last for more than a year and can require long-term deployment of substantial personnel, equipment and resources. The start date of our projects can be postponed or delayed and the duration of our projects can be shortened or increased due to a variety of factors beyond our control. In addition to the timing of these projects and the seasonality of our business, the amount and origination of our revenues often vary from period to period. A percentage of our revenues are usually attributable to recurring work from our existing customers. Although our top ten customers are responsible for a large percentage of our revenues, we generate our revenues from most of these customers by providing asset protection solutions to a number of their business locations. Decisions regarding the purchase of our solutions by these customers are made either on a corporate basis or on a location-by-location basis. Also included in our revenues are software license fees and product sales, as well as an estimate for potential sales returns and customer allowances. Revenues under our time-and-materials services contracts are based on the hours of service we provide our customers at negotiated rates, plus any actual costs of materials and other direct expenses that we incur on the project, with little or no mark-up. Because these expenses, such as travel and lodging or subcontracted services, can change significantly from project to project, changes in our revenues may not be indicative of business trends.
Cost of revenues
Our cost of revenues includes our direct compensation and related benefits to support our sales, together with reimbursable costs, materials consumed or used in manufacturing our products and certain overhead costs, such as non-billable time, equipment rentals, fringe benefits and repair and maintenance.
42
Depreciation included in gross profit
Our depreciation represents the expense charge for our capitalized assets. Depending on the nature of the original item capitalized, these depreciation expenses are reported in one of two places in our statement of operations. Depreciation used in determining gross profit is directly related to our revenues and primarily relates to depreciation of equipment used for the delivery of our asset protection solutions and to a lesser extent depreciation of manufacturing equipment. We also have other depreciation primarily related to our corporate headquarters which is included in deriving our income from operations as discussed below.
Gross profit
Our gross profit equals our revenues less our cost of revenues and attributed depreciation. Our gross profit, both in absolute dollars and as a percentage of revenues, can vary based on our volume, sales mix, actual manufacturing costs and our utilization of labor. As a result, gross profit may vary from quarter to quarter. For instance, our gross profit can decline during holiday periods when we incur labor costs without any corresponding revenues. Under our time-and-materials contracts, we negotiate hourly billing rates and charge our clients based on the actual time that we expend on a project. Our profit margins on time-and-materials contracts fluctuate based on actual labor and overhead costs that we directly charge or allocate to contracts compared to negotiated billing rates.
In recent years, there has been an increasing demand for asset protection solutions and, until recently, a limited supply of certified technicians. Accordingly, we experienced increases in our cost of labor in our Services segment. The customers of our Services segment have been aware of these supply constraints and generally have, to some extent, accepted corresponding price increases for our services. However, in the current economic environment we have experienced certain pricing pressures from customers and we are uncertain whether our ability to increase prices for our services will continue. In our Products and Systems segment, our ability to increase prices for any product or system to offset associated cost increases is based principally on the extent to which its incorporates our proprietary technology. We believe our efforts to develop and offer our customers value-added proprietary solutions instead of commodity-type products help us, in part, to resist margin erosion. Our International segment offers services, products and systems similar to those of our other segments, so our ability to increase prices in this segment as costs increase is determined by the same factors affecting the pricing of our other segments, and the relative mix of services, products and systems it provides in the applicable period.
Selling, general and administrative expenses
Our selling, general and administrative expenses are comprised primarily of expenses of our sales and marketing operations, field location administrative costs and our corporate headquarters related to our executive, general management, finance, accounting and administrative functions and legal fees and expenses. These costs can vary based on our volume of business or as expenses are incurred to support corporate activities and initiatives such as training. The largest single category is salaries and related costs. In the near term, we expect these expenses to increase as we support the growth of our business and expand our sales and marketing efforts, improve our information processes and systems and implement the financial reporting, compliance and other infrastructure required for a public company. We also expect that our selling, general and administrative expenses will decline as a percentage of our revenues, particularly over the long term.
Research and engineering
Research and engineering expense consists primarily of engineering salaries and personnel-related costs and the cost of products, materials and outside services used in our process and product development activities primarily in our Products and Systems segment. Other research and development is conducted in our Services segment by various billable personnel and our management on a collaborative basis. These costs are not separated and are included in cost of revenues. Specific development costs on software are capitalized and amortized in our depreciation and amortization included in our income from operations. From time-to-time, we receive minor grants or contracts for paid research which are recorded in our revenues with the related costs included in cost of revenues. We expect to continue our investment in research and engineering activities and anticipate that our associated expense will increase in absolute terms in the future as we hire additional personnel and increase research and engineering activity. However, as a percentage of revenues, we expect research and engineering expense to decline over time.
Depreciation and amortization included in income from operations
Our depreciation and amortization used in deriving our income from operations represents the expense charge for our capitalized assets, and primarily relates to buildings and improvements, including our corporate headquarters, office furniture, equipment, and intangibles acquired as part of our acquisitions of other businesses. These intangible assets include, but are not limited to, non-competition agreements, customer lists and trade names. To the extent we ascribe value to identifiable intangible assets that have finite lives, we amortize those values over the estimated useful lives of those assets. Such amortization expense, although non-cash in the period expensed, directly impacts our results of operations. It is difficult to predict with any precision the amount of expense we may record relating to acquired intangible assets.
43
Income from operations
Our income from operations is our gross profit less our selling, general and administrative expenses, research and engineering and depreciation and amortization included in income from operations. We refer to our income from operations as a percentage of our revenues as our operating margin.
Interest expense
Our interest expense consists primarily of interest paid to our lenders under our credit agreement. Also included is the interest incurred on our capital leases and on subordinated notes issued as part of our acquisitions. We adjust the interest differential on our interest rate swap quarterly to reflect the difference from our current borrowing rate to the notional amount of our interest rate swap contracts.
Income taxes
Income tax expense varies as a function of pre-tax income and the level of non-deductible expenses, such as certain amounts of meals and entertainment expense, changes to deferred tax assets valuation allowances and other permanent differences. Prior to fiscal 2007, we had net operating loss carryforwards (NOLs) for federal and state purposes, but as a result of our pre-tax income in fiscal 2007, we used a majority of these NOLs. As of May 31, 2010 we had $2.0 million of NOLs available to offset state taxable income in future years. These state NOLs will expire, if not utilized, at varying dates beginning in 2011 depending on the laws of each state and as such, we have provided a valuation allowance of $0.2 million. Our effective income tax rate will be subject to many variables, including the absolute amount and future geographic distribution of our pre-tax income. We also plan to continue our acquisition strategy, and, as such, we anticipate that there will be variability in our effective tax rate from quarter to quarter and year to year, especially to the extent that our permanent differences increase or decrease. As a result of any of these factors, our future effective income tax rate may fluctuate significantly over the next few years.
Noncontrolling interest, net of taxes
The noncontrolling interest represents the ownership interests of other stockholders in our international subsidiaries, where 100% ownership is not permitted or de minimis local ownership is helpful for business purposes.
44
Consolidated results of operations
Fiscal 2010, 2009 and 2008
Our revenues, gross profit, income from operations and net income for fiscal 2010, 2009 and 2008 were as follows:
|
For the years ended May 31,
|
||||||||||||
|
2010
|
2009
|
2008
|
||||||||||
|
(in thousands, except share and per share data)
|
||||||||||||
|
Revenues
|
$ | 272,128 | $ | 209,133 | $ | 152,268 | ||||||
|
Gross profit
|
83,138 | 69,266 | 54,831 | |||||||||
|
Gross profit %
|
31 | % | 33 | % | 36 | % | ||||||
|
Income from operations
|
20,897 | 14,825 | 16,358 | |||||||||
|
Operating income as percentage of revenues
|
8 | % | 7 | % | 11 | % | ||||||
|
Interest expense
|
3,531 | 4,614 | 3,531 | |||||||||
|
Income before provision for income taxes and noncontrolling interest
|
16,979 | 10,211 | 12,827 | |||||||||
|
Provision for income taxes
|
6,527 | 4,558 | 5,380 | |||||||||
|
Income before noncontrolling interests
|
10,452 | 5,653 | 7,447 | |||||||||
|
(Income) attributable to noncontrolling interests
|
(23 | ) | (187 | ) | (8 | ) | ||||||
|
Net income attributable to Mistras Group, Inc.
|
10,429 | 5,466 | 7,439 | |||||||||
|
Net income attributable to Mistras Group, Inc. as a percentage of revenues
|
4 | % | 3 | % | 5 | % | ||||||
We estimated that our growth rates for fiscal 2010, 2009 and 2008, respectively, were as follows:
|
For the years ended May 31,
|
||||||||||||
|
2010
|
2009
|
2008
|
||||||||||
|
(in thousands, except share and per share data)
|
||||||||||||
|
Revenue growth
|
$ | 62,995 | $ | 56,865 | $ | 30,027 | ||||||
|
% Growth over prior year
|
30 | % | 37 | % | 25 | % | ||||||
|
Comprised of:
|
||||||||||||
|
% of organic growth
|
18 | % | 16 | % | 17 | % | ||||||
|
% of acquisition growth
|
12 | % | 23 | % | 6 | % | ||||||
|
% foreign exchange increase (decrease)
|
< 1
|
% | (2 | %) | 1 | % | ||||||
| 30 | % | 37 | % | 24 | % | |||||||
Fiscal 2010 compared to fiscal 2009
Revenues. Our revenues, by segment for fiscal 2010, 2009 and 2008, were as follows:
|
Years ended May 31,
|
||||||||||||
|
2010
|
2009
|
2008
|
||||||||||
|
Revenues (1)
|
||||||||||||
|
Services
|
$ | 227,782 | $ | 167,543 | $ | 116,027 | ||||||
|
Products and Systems
|
18,875 | 17,310 | 16,675 | |||||||||
|
International
|
30,920 | 29,165 | 23,727 | |||||||||
|
Corporate and eliminations
|
(5,449 | ) | (4,885 | ) | (4,161 | ) | ||||||
| $ | 272,128 | $ | 209,133 | $ | 152,268 | |||||||
| (1) | Revenues by operating segment includes intercompany transactions, which are eliminated in corporate and eliminations. |
45
Revenues increased $63.0 million, or 30%, for fiscal 2010 compared to fiscal 2009 as a result of growth in all our segments. For fiscal 2010 and fiscal 2009, we estimate that our organic growth rate, as compared to growth driven by acquisitions, was approximately 18% and 16%, respectively. In fiscal 2010, we estimate that all of our segments had organic growth, with the Services segments leading the way with 20%. Although growth was slower due to the lingering effects of the economy, especially as to capital spending patterns, our Products and Systems segment and our International segment each had organic growth of 9% and 7% respectively. This organic growth was the result of continued demand for our asset protection solutions, including growth from new and existing customers. In fiscal 2010, we estimate that growth from acquisitions was approximately $25.8 million, or 12%, compared to $33.6 million, or 23%, in fiscal 2009. We completed three acquisitions in fiscal 2010 compared to five acquisitions in fiscal 2009, and seven acquisitions in fiscal 2008, increasing our capabilities and adding to our base of qualified technicians.
Despite the prolonged downturn in the global economy, we continued to experience growth in many of our target markets in fiscal 2010 as compared to fiscal 2009. The largest dollar increase was attributable to customers in the oil and gas market which was achieved globally on several new and existing projects, including an increase in our portfolio of “run and maintain” contracts and new work obtained due to our acquisitions. Overall the oil and gas market provided approximately 63% and 58% of our total revenues for fiscal 2010 and 2009, respectively. Within this market, we provide services to refineries, as well as midstream and upstream customers, petrochemical and other industry segments. Refineries are currently the largest area of this market and represent approximately 39% of our total revenues. As of May 31, 2010, we serviced approximately 31% of the U.S. refineries and 57% of refineries producing 100,000 or more barrels per day, but this only represents approximately 6% of the world’s refineries. We also experienced high growth in several of our other target markets, including chemical, fossil and nuclear power. These increases were partially offset by declines in capital projects, turnaround work and reduced pipeline, aerospace and industrial parts inspection activity and the completion of certain projects as compared to fiscal 2009. Our top ten customers represented approximately 45% of our revenues for fiscal 2010 compared to 36% in fiscal 2009. Our largest customer accounted for approximately 18% and 17% of our revenues in fiscal 2010 and 2009, respectively. No other customer accounted for more than 7% of our revenues in fiscal 2010.
Gross profit. Our gross profit in total and its components as a percentage of revenues for fiscal 2010, 2009 and 2008 was as follows:
|
For the years ended May 31,
|
||||||||||||
|
2010
|
2009
|
2008
|
||||||||||
|
(in thousands, except share and per share data)
|
||||||||||||
|
Gross profit
|
$ | 83,138 | $ | 69,266 | $ | 54,831 | ||||||
|
Gross profit % comprised of:
|
||||||||||||
|
Revenues
|
100 | % | 100 | % | 100 | % | ||||||
|
Cost of revenues
|
65 | % | 63 | % | 60 | % | ||||||
|
Depreciation
|
4 | % | 4 | % | 4 | % | ||||||
|
Total
|
31 | % | 33 | % | 36 | % | ||||||
|
Gross profit % (decrease) increase from prior year
|
(2 | %) | (3 | %) | 2 | % | ||||||
Our gross profit, by segment for fiscal 2010, 2009 and 2008, was as follows:
|
Years ended May 31,
|
||||||||||||
|
2010
|
2009
|
2008
|
||||||||||
|
Gross profit
|
||||||||||||
|
Services
|
$ | 61,963 | $ | 48,480 | $ | 36,301 | ||||||
|
Products and Systems
|
9,915 | 8,476 | 8,829 | |||||||||
|
International
|
11,668 | 12,602 | 9,932 | |||||||||
|
Corporate and eliminations
|
(408 | ) | (292 | ) | (231 | ) | ||||||
| $ | 83,138 | $ | 69,266 | $ | 54,831 | |||||||
46
Our gross profit increased $13.9 million, or 20%, in fiscal 2010 compared to fiscal 2009. As a percentage of revenues, our gross profit was approximately 31% and 33% in fiscal 2010 and fiscal 2009, respectively. The non-depreciation portion of our cost of revenues as a percentage of revenues increased to approximately 65% in fiscal 2010 from approximately 63% in fiscal 2009. Depreciation expense included in determining gross profit for fiscal years 2010 and 2009 was $10.5 million, or 4% of revenues, and $8.7 million, or 4% of revenues, respectively.
Despite the increase in our fiscal 2010 revenues, our gross profit as a percentage of revenues declined to 31% in fiscal 2010 from 33% in fiscal 2009. Some of this decline resulted from our sales mix, since our Services segment generated the largest portion of the revenue increase and our gross margins on revenues from our Services segment are generally lower than that of our other segments. In addition, we increased our market share through new customer contracts and through acquisitions, which often leads to lower margins in the near term until such time as we can fully integrate these acquisitions into our business model and deliver a stronger mix of advanced asset protection solutions to our customers, which generally carry higher margins.
Another contributing factor was the continued economic downturn. We experienced revenue declines in high margin shop work in the aerospace and industrial markets. In addition, many of our existing customers, primarily refineries, requested and received pricing adjustments, which we granted to expand and preserve market share. During fiscal 2010 certain of our customers managed project activity and turnarounds differently than in the past, stopping or changing planned work schedules more abruptly. This created inefficiencies in the planning and utilization of labor. In fiscal 2010 we continued to develop several new specialties within our asset protection solutions by hiring and training new employees and creating “centers of excellence”, including centers for industrial tube and off-shore oil rig platform inspections and new pipeline construction. This investment in our technicians to gain future market share, however, contributes to non-billable labor until these markets develop.
Income from operations. Our income from operations, by segment for fiscal 2010, 2009 and 2008, was as follows:
|
Years ended May 31,
|
||||||||||||
|
2010
|
2009
|
2008
|
||||||||||
|
Income from operations
|
||||||||||||
|
Services
|
$ | 22,614 | $ | 13,681 | $ | 14,649 | ||||||
|
Products and Systems
|
2,572 | 1,664 | 2,723 | |||||||||
|
International
|
3,008 | 4,091 | 2,408 | |||||||||
|
Corporate and eliminations
|
(7,297 | ) | (4,611 | ) | (3,422 | ) | ||||||
| $ | 20,897 | $ | 14,825 | $ | 16,358 | |||||||
Our income from operations of $20.9 million for fiscal 2010 increased $6.1 million, or 41%, compared to fiscal 2009. As a percentage of revenues, our income from operations increased to 8% compared to 7% in fiscal 2009.
As a percentage of revenues, selling, general and administrative expenses for fiscal 2010 were 20% compared to 22% for fiscal 2009. Our selling, general and administrative expenses for fiscal 2010 increased approximately $8.4 million, or 18%, over fiscal 2009, primarily due to the cost of additional infrastructure to support our growth, including new locations obtained through our acquisitions. Our recent acquisitions accounted for approximately $4.2 million of this increase. Stock compensation costs increased approximately $2.4 million in fiscal 2010 over fiscal 2009. In addition, we increased our allowance for doubtful accounts by $0.4 million, net of estimated recoveries, related to the bankruptcy of one of our customers. Other increases in our selling, general and administrative expenses included higher compensation and benefit expenses over the previous year attributed to normal salary increases as well as our investment in additional management and corporate staff. A significant portion of these increases (as well as other increases in cost of revenues) supported our development of additional centers of excellence. Our professional fees also increased in fiscal 2010, which related primarily to increased costs associated with operating as a publicly traded company, including our continued efforts to comply with the Sarbanes-Oxley Act, as well as certain costs associated with our initial public offering in October 2009. Depreciation and amortization included in the determination of income from operations for fiscal 2010 and fiscal 2009 was $4.7 million, or 2% of revenues, and $3.9 million, or 2% of revenues, respectively.
Interest expense. Interest expense was $3.5 million and $4.6 million for fiscal 2010 and fiscal 2009, respectively. The $1.1 million decrease in fiscal 2010 interest expense related directly to our repayment of approximately $66.4 million in borrowings in October 2009, which was the primary use of the net proceeds we received from our initial public offering. In both years, we incurred additional expense related to the market rate adjustments to our interest rate swaps, as the fixed rate on these swaps was higher than market rates during both annual periods. The total interest expense adjustments for these swap arrangements for fiscal 2010 and fiscal 2009 was approximately $(0.5) million and $0.2 million, respectively.
47
Net income attributable to noncontrolling interests, net of taxes. The decrease in net income attributable to noncontrolling interests relates primarily to a decrease in net income from Diapac, our subsidiary in Russia offset by an increase in net income of our Brazilian subsidiary, PASA. In fiscal 2009, net income attributable to noncontrolling interests was primarily attributable $0.2 million in the minority interest is related to the increased profit, primarily from Diapac, our subsidiary in Russia.
Income taxes. Our effective income tax rate was approximately 38% for fiscal 2010 compared to approximately 45% for fiscal 2008. The decrease was primarily due to the impact of permanent tax differences and an adjustment to our liabilities related to uncertain tax provisions offset by higher state taxes and U.S. federal taxes on our foreign profits.
Net income. Our net income for fiscal 2010 of $10.4 million, or 4% of our revenues, was approximately $4.9 million higher than our net income for fiscal 2009, which was $5.5 million, or 3% of revenues. This increase in net income was primarily the result of our revenue growth and lower interest expense, offset by higher selling, general and administrative expense and research and engineering expenses. In addition, in fiscal 2009 we incurred expense of $2.1 million related to the settlement of a lawsuit.
Fiscal 2009 compared to fiscal 2008
Revenues. Revenues increased $56.9 million, or 37%, for fiscal 2009 compared to fiscal 2008 as a result of growth in all our segments. For fiscal 2009 and fiscal 2008, we estimate that our organic, as compared to acquisition-driven, growth rate was approximately 16% and 17%, respectively. In fiscal 2009, we estimate that all of our segments had organic growth, and that the Services and International segments had double digit organic growth rates. This organic growth was the result of continued demand for our asset protection solutions, including growth from new and existing customers, and did not result from any unusually large one-time projects. In fiscal 2009, we estimate that growth from acquisitions was approximately 23% compared to 6% in fiscal 2008, primarily because we acquired five NDT companies in fiscal 2009 and 7 NDT companies in 2008, increasing our capabilities and adding to our base of qualified technicians.
In the second half of fiscal 2009 we believe the economic downturn resulted in greater than usual reductions or delays in capital spending by our customers. Several anticipated regular maintenance projects as well as projects requiring intensive work during a temporary asset shutdown, or “turnaround” projects, were either reduced in scope or have been delayed until fiscal 2010 or later.
Despite the economic downturn, we experienced growth in many of our target markets in fiscal 2009 as compared to fiscal 2008. The largest dollar increase was attributable to customers in the oil and gas market, which accounted for approximately 58% of our total revenues. This growth was achieved globally on several new and existing projects. Overall this market provided 58% and 50% of our total revenues for fiscal 2009 and 2008, respectively. The remainder of the growth in our revenues was broadly distributed among customers in our other target markets, with the largest increases in this period attributable to customers in the chemical market, where we obtained a new long-term service contract, and in the industrial and manufacturing sector where we obtained new customers through our acquisitions. The most significant decrease in fiscal 2009 was in the electronics and transportation industries, but these industries together accounted for less than 2% of our total revenues in fiscal 2009. Our top ten customers represented 36% of our revenues for fiscal 2009 compared to 35% in fiscal 2008. One of these top ten customers filed for bankruptcy in January 2009. Our revenues from this customer were $6.4 million for fiscal 2009. Although we have increased our allowance for doubtful accounts receivable attributable to this long-term customer by approximately $1.6 million as a result of this bankruptcy, we continue to work for this customer under the protection of the bankruptcy court.
Gross profit. Our gross profit increased $14.4 million, or 26%, in fiscal 2009 compared to fiscal 2008. As a percentage of revenues, our gross profit was 33% and 36% in fiscal 2009 and fiscal 2008, respectively. The non-depreciation portion of our cost of revenues as a percentage of revenues increased to 63% in fiscal 2009 from 60% in fiscal 2008. Depreciation expense included in determining gross profit for fiscal years 2009 and 2008 was $8.7 million, or 4% of revenues, and $6.8 million, or 5% of revenues, respectively.
48
Despite the 37% increase in our fiscal 2009 revenues, our gross profit as a percentage of revenues declined to 33% in fiscal 2009 from 36% in fiscal 2008. Some of this decline resulted from our sales mix, since our Services segment generated the largest portion of the revenue increase and our gross margins on revenues from our Services segment are generally lower than that of our other segments. A large portion of this cost can be attributed to the economic downturn, because when our customers delay or reschedule projects, this delays our recognition of revenues from those projects while we continue to incur labor expenses. We also incurred the cost to hire and train employees in order to develop several new specialties within our asset protection solutions, or “centers of excellence”, including centers for industrial tube and off-shore oil rig platform riser inspections and new pipeline construction. In addition, our business was disrupted during September 2008 by Hurricane Ike and in our third fiscal quarter by strikes threatened by employees of several of our customers, which were subsequently resolved. As we anticipated, several of our recently acquired businesses had lower margins than we normally achieve and we would expect that these margins will improve as we fully integrate these acquired businesses into our business model. Our payroll costs, including workers’ compensation insurance, also increased during fiscal 2009, but unlike in fiscal 2008, we did not benefit from a $1.0 million adjustment, resulting from favorable claims experienced.
Income from operations. Our income from operations of $14.8 million for fiscal 2009 decreased $1.5 million, or 9%, compared to fiscal 2008. As a percentage of revenues, our income from operations was 7% in fiscal 2009, compared to 11% in fiscal 2008. In fiscal 2009, we increased our allowance for doubtful accounts by approximately $1.6 million to provide for estimated losses in connection with a large customer bankruptcy and incurred $2.1 million in expenses in connection with a lawsuit settlement. Without these charges, our fiscal 2009 income from operations would have been approximately 9% of revenues.
The percentage of total operating income for fiscal 2009 contributed by our segments was Services: 92%; Products and Systems: 11%; International: 28%; and Corporate and Eliminations: (31%). For fiscal 2008, the operating income contributed by our segments was: Services: 89%; Products and Systems: 17%; International: 15%; and Corporate and Eliminations: (21%).
As a percentage of revenues, selling, general and administrative expenses for fiscal 2009 were 23% compared to 22% for fiscal 2008. Our selling, general and administrative expenses for fiscal 2009 increased $14.2 million, or 43%, over fiscal 2008, primarily due to the cost of additional infrastructure to support our growth, including several new locations obtained through our acquisitions. Our recent acquisitions accounted for approximately $6.0 million of this increase. In addition, the $1.6 million increase in our allowance for doubtful accounts due to the bankruptcy of our customer was included in this expense category. Other increases in our selling, general and administrative expenses included higher compensation and benefit expenses over the previous year attributed to normal salary increases as well as our investment in additional management and corporate staff. A significant portion of these increases (as well as other increases in cost of revenues) supported our development of additional centers of excellence. Our professional fees were also higher as we incurred more expense in connection with the preparations necessary to operate as a publicly traded company. Depreciation and amortization included in the determination of income from operations for fiscal 2009 and fiscal 2008 was $3.9 million, or 2% of revenues, and $4.6 million, or 3% of revenues, respectively.
Interest expense. Interest expense was $4.6 million and $3.5 million for fiscal 2009 and fiscal 2008, respectively. The $1.1 million increase in fiscal 2009 interest expense was primarily due to increased borrowing for our acquisitions and purchases of equipment, as well as working capital requirements. For both years, we incurred additional expense related to the market rate adjustments to our interest rate swaps, as the fixed rate on these swaps was higher than market rates during both annual periods. The total interest expense adjustments for these swap arrangements for fiscal 2009 and fiscal 2008 were approximately $0.2 million and $0.6 million, respectively. On July 1, 2008, we borrowed $20.0 million to replenish our revolving line of credit and finance several acquisitions and on January 7, 2009, we increased our revolver by $5.0 million for a total of $20.0 million.
Minority Interest, net of taxes. The increase in fiscal 2009 of $0.2 million in minority interest, net of taxes is related to the increase in net income, primarily from Diapac, our subsidiary in Russia. For fiscal 2008, this amount primarily consisted of the net income of Envirocoustics A.B.E.E., which we first consolidated in fiscal 2006. We acquired this entity on April 25, 2007.
Income taxes. Our effective income tax rate was approximately 45% for fiscal 2009 compared to approximately 42% for fiscal 2008. The increase was primarily due to the impact of higher state taxes and US taxes on our foreign profits, net of other adjustments.
Net income. Our net income for fiscal 2009 of $5.5 million, or approximately 3% of our revenues, was $2.0 million lower than our net income for fiscal 2008, which was $7.4 million, or approximately 5% of revenues. This decrease in net income was primarily the result of the a decrease in gross profit and increase in other operating costs such our bad debt expense of $1.6 million and higher interest expense, depreciation and income tax expense. The $1.6 million increase in our allowance for doubtful accounts and $2.1 million incurred in connection with the lawsuit settlement, both of which we consider generally non-recurring, caused our net income to be lower by approximately 1% on an after-tax basis. Our net income in fiscal 2008 also benefited from a $1.0 million pre-tax adjustment.
Segment results for fiscal 2010, 2009 and 2008
Segment discussions that follow provide supplemental information regarding the significant factors contributing to the changes in results for each of our business segments.
49
Services segment
Selected financial information for the Services segment was as follows for fiscal 2010, 2009 and 2008:
|
Years ended May 31,
|
||||||||||||
|
2010
|
2009
|
2008
|
||||||||||
|
(in thousands)
|
||||||||||||
|
Services segment
|
||||||||||||
|
Revenues
|
$ | 227,782 | $ | 167,543 | $ | 116,027 | ||||||
|
Cost of revenues
|
$ | 157,007 | $ | 111,809 | $ | 73,914 | ||||||
|
Depreciation and amortization
|
8,812 | 7,254 | 5,812 | |||||||||
|
Gross profit
|
$ | 61,963 | $ | 48,480 | $ | 36,301 | ||||||
|
Gross profit as a % of segment revenue
|
27 | % | 29 | % | 31 | % | ||||||
|
Income from operations
|
$ | 22,614 | $ | 13,681 | $ | 14,649 | ||||||
|
Income from operations as % of segment revenue
|
10 | % | 8 | % | 13 | % | ||||||
|
Total depreciation and amortization
|
$ | 12,862 | $ | 10,603 | $ | 9,529 | ||||||
Revenues. Over the last three years, the largest increase in our total revenues was from our Services segment. Our Services segment revenues had a CAGR of 36% during this period with annual increases in fiscal 2010, 2009 and 2008 of $60.2 million, $51.5 million and $25.2 million, respectively. As a percentage of prior year segment revenues, these increases were approximately 36%, 44% and 28%, respectively. Our organic growth in this segment has averaged approximately 19% a year over this three-year period. In fiscal 2010, the organic growth in our Services segment was estimated to be approximately 20%. On average, over the past three fiscal years, customers in the oil and gas industry accounted for approximately 63% of the business of our Services segment and in fiscal 2010 customers in the oil and gas industry accounted for 68% of the segment revenues, primarily due several new multi-year contracts we entered into this year. The three-year CAGR from this target market has been approximately 44%. We also have experienced double digit CAGRs in most of our other target markets due to strong demand, the addition of new customers and revenues from existing customers. We continue to increase our revenues by providing existing customers different types of asset protection solutions.
In fiscal 2010, our Services revenues increased $60.2 million, or 36%, compared to fiscal 2009. We estimate $25.8 million of the increase in revenues are from acquisitions compared to $33.6 million in the prior year. The balance of the growth came from several new multi-year contracts, particularly in the form of “evergreen” accounts, as well as from other overall growth in the segment. Also contributing to our revenue growth was an increase in turnaround projects and other large-scale projects that had been postponed in the third and fourth quarters of fiscal 2009. Although less than 5% of our Service segment revenues, our PCMS software and our related Asset Integrity Management (“AIMS”) implementation services increased 72%. We expect continued growth in this market having secured several new AIMS projects. In several of our non-energy related markets, we did experience slowing in our revenue growth because of the continuation of the economic downturn. Across all markets, we experienced pricing pressure, especially on new business and existing contract renewals. While our customers are always price sensitive, the overall pressure from the current economic conditions has lessened from existing customers, but we expect continued price sensitivity on new business, as our competition attempts to gain market share. However, we believe that our market differentiation should help prevent any significant erosion of profitability.
In fiscal 2009, our Services revenues increased $51.5 million, or 44%, compared to fiscal 2008. We estimate $33.6 million of these revenues are from acquisitions compared to $7.3 million in the prior year. The balance of the growth came from new projects as well as from other overall growth in the segment. Our revenue growth was lessened as a result of the economic downturn, especially in our third and fourth fiscal quarters. We attribute this to an uncertain economy, a customer bankruptcy during the year, and threatened strikes by employees of several customer refineries that were subsequently resolved. In addition, many of our customers postponed holiday turnaround projects and other large-scale projects and as such, unlike most prior years, we did not have many large scale turnarounds in fiscal 2009. In addition, in September 2008 our operations in the Gulf Coast region were disrupted by Hurricane Ike.
Our top ten customers accounted for approximately 53%, 44% and 45% of our Services segment revenues during fiscal 2010, 2009 and 2008, respectively. As previously noted, one of our top ten customers in this segment had filed for bankruptcy in January 2009. During their reorganization under bankruptcy protection, we continued to provide services to this customer and have renewed the contract between us. Revenues from this customer represented 4% of revenues in our Services segment for each of fiscal 2010 and 2009, respectively.
50
Gross profit. During this three-year period, gross profit as a percentage of revenues in our Services segment has been approximately 27%, 29% and 31% for fiscal 2010, 2009 and 2008, respectively. Cost of our Services has been approximately 69%, 67% and 64% during respective fiscal period. Depreciation included in the determination of gross profit has been approximately 4%, 4% and 5% during each respective fiscal period. We continued to invest in additional field test equipment and fleet vehicles, which generate depreciation expense, to support our growth and reduce other operating costs, such as repairs and maintenance.
Our gross profit for fiscal 2010 was $62.0 million, or 27% as a percentage of revenue, an increase of $13.5 million over fiscal 2009. The decrease in gross profit percentage in fiscal 2010 however, relates to an increase in revenues from our new multi-year contracts that often start with providing traditional NDT services, which generally produce lower margins, until such time as we are engaged in a stronger mix of advanced asset protection solutions, which carry higher margins. This was coupled with an expansion of our new centers of excellence and training which represents our continued investment in our technicians and our ability to provide new NDT solution, but contributes to non-billable time. In addition, the integration of certain recently acquired businesses had lower margins than those normally achieved under our business model. In fiscal 2010, our depreciation increased $1.6 million, a 22% increase, and represents both new assets acquired and increased depreciation from our acquired businesses.
The pricing pressure noted above in the discussion of revenues, the mix of our revenues and intake of new traditional business, including start-up costs on new multi-year, contracts has led to lower profitability on our time and material billings. During fiscal 2010 certain of our customers managed project activity and turnarounds differently than in the past, stopping or changing planned work schedules more abruptly or frequently than in the past, which has created inefficiencies in the planning and utilization of labor. Compared to fiscal 2009, our complement of certified technicians and related fringe benefit costs, particularly healthcare costs, increased. However, we believe this increase in technical staff gives us the ability to further leverage our existing resources and related costs by through revenue growth.
Our gross profit for fiscal 2009 was $48.5 million, or 29% as a percentage of revenue, an increase of $12.2 million over fiscal 2008. The decrease in gross profit in fiscal 2009 over 2008 was caused by higher amounts of non-billable time that resulted from (i) our establishment of our new centers of excellence and training or (ii) represented lost billing opportunities related to the economic downturn. Several of our customers extended holiday shut-downs or delayed scheduled work, requiring us to pay our employees without any corresponding revenues. Additionally, Hurricane Ike negatively impacted our margins in the Gulf Coast as we lost revenues and incurred higher costs related to non-productive labor. In fiscal 2009, our depreciation increased $1.4 million or 25% and represents both new assets acquired and increased depreciation from our acquired businesses.
Income from operations. As a percentage of segment revenues, our income from operations was approximately 10%, 8% and 13% in fiscal 2010, 2009 and 2008, respectively.
Our segment income from operations was $22.6 million, $13.7 million, and $14.6 million for fiscal 2010, 2009 and 2008, respectively. Selling, general and administrative expenses in our Services segment for fiscal 2010, 2009 and 2008 were 15%, 18% and 16% of segment revenues, respectively.
In fiscal 2010, significantly higher segment revenues, coupled with decreases in legal settlement costs and bad debt expense were the primary drivers for the increase in our operating margin. Selling, general and administrative expenses in our Services segment for fiscal 2010 compared to fiscal 2009 increased $5.8 million, or 20%. Major increases in these expenses included approximately $5.4 million related to higher operating costs (primarily payroll expense and a corresponding increase in occupancy costs for rents and utilities) supporting our acquisitions and overall growth. In addition, we continued our investment in new training, safety and quality programs to support new customer offerings and infrastructure. These increases were offset by a net decrease of approximately $1.6 million in our provision for bad debt as in fiscal 2009 we had a large customer file for bankruptcy. Depreciation and amortization expense used in determining income from operations was $4.0 million, or 2% of segment revenues and $3.3 million, or 2% of segment revenues for fiscal 2010 and fiscal 2009, respectively.
In fiscal 2009, our higher cost of revenues, along with the additional $1.6 million allowance for doubtful accounts for a customer bankruptcy and a $2.1 million legal settlement, were the primary causes of the decrease in operating margin. Selling, general and administrative expenses in our Services segment for fiscal 2009 compared to fiscal 2008 increased $11.4 million, or 64%. In addition to a $2.0 million increase in our allowance for doubtful accounts, major increases in these expenses included approximately $6.0 million related to higher operating costs (primarily payroll expense and a corresponding increase in occupancy costs for rents and utilities) supporting our acquisitions. In addition, we hired new management and other personnel, and invested in new training, safety and quality programs to support new customer offerings and infrastructure, and we estimate this additional compensation and other expense accounted for another $1.5 million of the increase. Other expense increases for travel, lab support, supplies and other miscellaneous increases comprised the balance or $1.9 million of the net increase. Depreciation and amortization expense used in determining income from operations was $3.3 million, or 2% of revenues and $3.7 million, or 3% of revenues for fiscal 2009 and fiscal 2008, respectively.
51
Products and Systems segment
Selected financial information for the Products and Systems segment was as follows for fiscal 2010, 2009 and 2008:
|
Years ended May 31,
|
||||||||||||
|
2010
|
2009
|
2008
|
||||||||||
|
(in thousands)
|
||||||||||||
|
Products and Systems segment
|
||||||||||||
|
Revenues
|
$ | 18,875 | $ | 17,310 | $ | 16,675 | ||||||
|
Cost of revenues
|
8,290 | 7,994 | 7,137 | |||||||||
|
Depreciation and amortization
|
670 | 840 | 709 | |||||||||
|
Gross profit
|
$ | 9,915 | $ | 8,476 | $ | 8,829 | ||||||
|
Gross profit as a % of segment revenue
|
53 | % | 49 | % | 53 | % | ||||||
|
Income from operations
|
$ | 2,572 | $ | 1,664 | $ | 2,723 | ||||||
|
Income from operations as % of segment revenue
|
14 | % | 10 | % | 16 | % | ||||||
|
Total depreciation and amortization
|
$ | 887 | $ | 1,038 | $ | 1,017 | ||||||
Revenues. The Products and Systems segment also experienced growth in their revenues in the last three years. Revenues were $18.9 million, $17.3 million and $16.7 million for fiscal 2010, 2009 and 2008, respectively. In fiscal 2010, 2009 and 2008, the segment revenue growth was 9%, 4%, and 12%, respectively, a CAGR of 8% overall. The largest customer for this segment is our International segment, which distributes these products primarily to our European, and Asian and North African markets, or, to a lesser extent, uses the products in their field testing and engineering services. Other larger markets representing approximately 53% of total segment revenues have been other test and research laboratories, nuclear power and industrial companies, including aerospace companies.
In fiscal 2010, our Products and Systems revenues increased $1.6 million compared to fiscal 2009 due to an increase in acoustic emission revenues and several large NDT orders received during the year. We also continued our expansion of our sales distribution channels by hiring additional industry-focused sales representatives to continue to drive sales growth. Offsetting these increases in revenues were decreases in our vibrametrics and customer service product lines.
In fiscal 2009, our Products and Systems revenues increased $0.6 million compared to fiscal 2008 due to increases across many of our product lines, including our acoustic emission and vibration systems, as well as on-line monitoring systems. In addition, shipments to our North America, or NAFTA, customers’ international subsidiaries increased $1.6 million compared to the same period last year because of increased demand, primarily for our AE products and systems. Offsetting these increases in revenues was a $1.1 million decrease in revenues from direct sales to third-party international customers as compared to fiscal 2008, when the segment had a large system sale to such a customer. In this segment we had no concentration risk from any single customer since our largest customer represents less than 4.0% of our segment revenues.
Gross profit. Our segment gross profit for fiscal 2010, 2009 and 2008 was $9.9 million, $8.5 million, and $8.8 million, respectively. Our segment gross profit as a percentage of revenues for the same three years was 53%, 49%, and 53%, respectively. Depreciation expense used in determining gross profit for fiscal 2010, 2009 and 2008 was $0.7 million, or 4% of segment revenues, $0.8 million, or 5% of segment revenues, and $0.7 million, or 4% of revenues, respectively. The improvement in gross profit percentage was attributable to sales of higher margin products and several costs cutting initiatives implemented during the year. The gross profit in this segment can fluctuate depending on volume and product mix. For example, our ultrasonic NDT solutions require custom product engineering to automatically inspect a wide range of parts varying in size and shape. This may include a small part from a jet engine to a major component of a Boeing 787 jet. The inspection of these large components requires the fabrication of large structures to facilitate testing, for which we generally use subcontractors. The utilization of subcontractors for this work often yields lower gross margins.
52
For the majority of fiscal 2009, our segment gross margin was higher than the fiscal 2008. However, segment revenues in the fourth quarter of the year were 12% below the same quarter in fiscal 2008 due to the economic downturn, which reduced our margins for all of fiscal 2009. This was primarily due to our customers delaying or canceling sales orders, though requests for proposals from our customers remained at reasonable levels throughout the quarter.
Income from operations. Our segment income from operations for fiscal 2010, 2009 and 2008 was $2.6 million $1.7 million and $2.7 million, respectively. As a percentage of segment revenues, our operating income was 14%. 10% and 16% in fiscal 2010, 2009 and 2008, respectively. The improvement in gross profit was the principal driver of the operating income improvement. Our selling, general and administrative expenses in fiscal 2010 were 26% of segment revenues compared to 27% of revenues in fiscal 2009. For all periods, the depreciation and amortization expense in determining segment income from operations was approximately 1% in fiscal 2010 and 2009 respectively, and 2% in fiscal 2008.
Segment selling, general and administrative expenses, which after gross profit, are the largest determinant of our income from operations in fiscal 2010, 2009 and 2008, were $4.9 million, or 26% of segment revenues, $4.7 million, or 27% of segment revenues, and $4.1 million, or 26% of segment revenues, respectively. The largest increase in these costs can be attributed to increases in our sales force to better capture market opportunities in our target markets. Due to the time required for technical training of new sales personnel, we believe the financial benefit of these new hires have not yet matched our investment. Similarly, our research and engineering expenses have increased as a result of new hires, and were $2.3 million, $1.9 million and $1.7 million in fiscal 2010, 2009 and 2008, respectively. As a percentage of our Products and Systems segment sales, these costs have represented 12%, 11% and 10% for the three years, respectively.
International segment
Selected financial information for our International segment was as follows for fiscal 2010, 2009 and 2008:
|
Years ended May 31,
|
||||||||||||
|
2010
|
2009
|
2008
|
||||||||||
|
(in thousands)
|
||||||||||||
|
International segment
|
||||||||||||
|
Revenues
|
$ | 30,920 | $ | 29,165 | $ | 23,727 | ||||||
|
Cost of revenues
|
18,224 | 15,957 | 13,439 | |||||||||
|
Depreciation and amortization
|
1,028 | 606 | 356 | |||||||||
|
Gross profit
|
11,668 | 12,602 | 9,932 | |||||||||
|
Gross profit as a % of segment revenue
|
38 | % | 43 | % | 42 | % | ||||||
|
Income from operations
|
3,008 | 4,091 | 2,408 | |||||||||
|
Income from operations as % of segment revenue
|
10 | % | 14 | % | 10 | % | ||||||
|
Total depreciation and amortization
|
$ | 1,308 | $ | 900 | $ | 861 | ||||||
Revenues. Our International segment revenues for fiscal 2010, 2009 and 2008 were $30.9 million, $29.2 million and $23.7 million, respectively, and are subject to currency fluctuations. For the last three fiscal years, the segment revenues, including currency fluctuations, had a CAGR of 14%, with annual increases of 6%, 23% and 13% during fiscal 2010, 2009 and 2008, respectively. We estimate the organic segment growth during the fiscal 2010, fiscal 2009 and fiscal 2008 to be approximately 7%, 27%, and 6%, respectively. Revenues from customers in the oil and gas and chemicals markets have historically comprised at least 50% of our International segment revenues. Most of this business is centered in major oil refineries in Russia and Brazil. Other revenues are more widely distributed including infrastructure, industrial, manufacturing and other testing companies, research centers and universities.
Our International segment contributed $1.8 million to our revenue growth for fiscal 2010 compared to fiscal 2009. For fiscal 2010, we estimate the organic segment growth was approximately 7%. In fiscal 2010 we had no segment growth attributable to acquisitions. We estimate that the slowing of our organic segment growth continued from the second half of fiscal 2009 into the first half of fiscal 2010. However organic segment growth rebounded in the second half of fiscal 2010 to finish the year at 7%, $2.0 million of our overall segment growth was from services we provided to a major oil and gas customer in Brazil $1.5 million was from the United Kingdom, the Netherlands and India, offset by $1.0 million decrease in revenue from a large contract in Russia and a $0.7 million decrease in revenues in France.
53
Our International segment contributed $5.4 million to our revenue growth for fiscal 2009 compared to fiscal 2008. For fiscal 2009, we estimate the organic segment growth was approximately 27% and acquisition segment growth was approximately 9%. Currency fluctuations compared to fiscal year 2008 resulted in 12% less segment revenues. The overall decrease caused by the strengthening of the U.S. dollar was $2.9 million, most of this variance occurring in the last half of the fiscal year. As with our other segments, we estimate that our organic segment growth slowed in the third and fourth fiscal quarters, but was still approximately 7% in our fourth fiscal quarter. $2.2 million of our growth was from a new project for a refinery in Russia and $1.2 million was from the United Kingdom and The Netherlands, where a portion of the growth was attributable to an acquisition of a company specializing in tank inspections. All of our other foreign locations in this segment also had positive growth of revenues.
Gross profit. Our segment gross profit was $11.7 million, or 38% of segment revenues, $12.6 million, or 43% of segment revenues, and $9.9 million, or 42% of segment revenues in fiscal 2010, 2009 and 2008, respectively. As with our other segments, our gross profit is dependent on our product mix. For fiscal 2010, the decrease in gross profit relates to fewer overall acoustic emission product sales, which have a higher margin profile, an increase in more traditional NDT services, which carry lower margins, and an increase in reimbursable expenses, for which we receive only modest margins.
Income from operations. Our income from operations from our International segment for fiscal 2010, 2009 and 2008 was $3.0 million, $4.1 million and $2.4 million, respectively. As a percentage of segment revenues, our income from operations was 10%, 14% and 10% in fiscal 2010, 2009 and 2008, respectively. Our segment selling, general and administrative expenses, the largest factor, aside from gross profit, in determining income from operations for fiscal 2010, 2009 and 2008 were $8.3 million or 27% of segment revenues, $8.0 million, or 28% of segment revenues, and $6.8 million, or 29% of segment revenues, respectively. The overall decrease in our operating income from fiscal 2009 is primarily attributable to lower profitability at our Russian and French operations. The overall increase from fiscal 2008 is attributable to new segment expenses related to an acquisition made in Holland and additional hires and training costs in our South American operation. Foreign currency transaction gains and losses included in income from operations were $0.2 million and $0.2 million in fiscal 2010 and 2009 and were not significant in fiscal 2008.
Corporate and eliminations
The elimination in revenues and cost of revenues primarily relates to the elimination in consolidation of revenues from sales of our Products and Systems segment to the International segment. The other major item in the corporate and eliminations grouping are the general and administrative costs not allocated to the other segments. These costs primarily include those for non-segment management, accounting and auditing, acquisition transactional costs and stock compensation expense and certain other costs. As a percentage of our total revenues, these costs have generally remained constant over the last three fiscal years, consisting of 3%, 2%, and 2% of total revenues for fiscal 2010, 2009 and 2008, respectively. The increase in operating expenses in 2010, 2009 and 2008 primarily related to higher compensation and additional staff, audit and accounting fees and other general increases in expense at our corporate offices.
Liquidity and capital resources
Overview
We have primarily funded our operations through the issuance of preferred stock in a series of financings, bank borrowings, capital lease financing transactions and cash provided from operations. We have used these proceeds to fund our operations, develop our technology, expand our sales and marketing efforts to new markets and acquire small companies or assets, primarily to add certified technicians and enhance our capabilities and geographic reach. In October 2009, we raised approximately $74.0 million in net proceeds through our IPO, which we subsequently used to repay our bank borrowings under our credit facility and to increase our cash and cash equivalents. We believe that our existing cash and cash equivalents, our anticipated cash flows from operating activities, and our available borrowings under our credit agreement will be sufficient to meet our anticipated cash needs over the next 12 months.
54
Cash flows table
The following table summarizes our cash flows for fiscal 2010, 2009 and 2008:
|
Fiscal year
|
2010
|
2009
|
2008
|
|||||||||
|
(in thousands)
|
||||||||||||
|
Net cash provided by (used in):
|
||||||||||||
|
Operating Activities
|
$ | 18,987 | $ | 12,661 | $ | 12,851 | ||||||
|
Investing Activities
|
(16,534 | ) | (15,888 | ) | (19,446 | ) | ||||||
|
Financing Activities
|
8,083 | 4,912 | 6,320 | |||||||||
|
Effect of exchange rate changes on cash
|
(167 | ) | 428 | 63 | ||||||||
|
Net change in cash and cash equivalents
|
$ | 10,369 | $ | 2,113 | $ | (212 | ) | |||||
Cash flows from operating activities
Cash provided by our operating activities primarily consists of net income adjusted for certain non-cash items, such as depreciation and amortization, deferred taxes and bad debt expense along with the effect of changes in working capital and other activities.
Cash provided by our operating activities in fiscal 2010 was $19.0 million and consisted of $10.4 million of net income plus $18.3 million of non-cash items, consisting primarily of depreciation and amortization of $15.2 million and stock compensation of $2.7 million, less $9.8 million of net cash used for working capital purposes and other activities. Cash used for working capital and other activities in fiscal 2010 primarily reflected a $15.2 million increase in accounts receivable attributable to our increase in revenues, a $0.8 million increase in inventories, prepaid expenses and other current assets. These were partially offset by a $3.7 million increase in income taxes payable related to our increase in taxable net income, and an increase of $1.8 million in accounts payable which was a result of the overall growth in our operations.
Cash provided by our operating activities in fiscal 2009 was $12.7 million and consisted of $5.5 million of net income plus $15.4 million of non-cash items, consisting primarily of depreciation and amortization of $12.6 million and provision for doubtful accounts of $2.1 million, less $8.2 million of net cash used for working capital purposes and other activities. Cash used for working capital and other activities in fiscal 2009 primarily reflected a $8.8 million increase in accounts receivable attributable to our increase in revenues, a $1.1 million increase in prepaid expenses and other current assets due to an increase in estimated tax payments and a decrease in accounts payable of $2.2 million due primarily to the timing of payments to vendors. These were partially offset by a $6.0 million increase in accrued expenses and other current liabilities due to a $2.1 million accrual in connection with our fiscal 2009 legal settlement and the overall growth in our operations.
Cash flows from investing activities
Cash used in investing activities for fiscal 2010 was $16.5 million of which $14.7 million was used to acquire three services businesses. In connection with the acquisitions, we also incurred $5.7 million of seller notes payable and related obligations. Additionally, in fiscal 2010 we acquired $7.5 million in property and equipment, of which $1.9 million were cash purchases and $6.0 million were acquired through capital leases.
Cash used in investing activities for fiscal 2009 was $15.9 million of which $10.5 million was used to acquire four services businesses and one international business. In connection with the acquisitions, we also incurred $9.3 million of seller notes payable and related obligations. Additionally, in fiscal 2009 we acquired $12.9 million in property and equipment, of which $5.4 million were cash purchases and $7.5 million were acquired through capital leases.
Cash flows from financing activities
For fiscal 2010, net cash provided by financing activities was $8.1 million, an increase of $3.2 million from fiscal 2009. In October 2009, we completed our initial public offering where we sold 6,700,000 shares at a price of $12.50 per share in the offering. The net proceeds to the Company were approximately $74.0 million after deducting underwriters’ commissions and other expenses. The Company used approximately $66.6 million of the net proceeds to repay the outstanding principal balance of the term loan ($25.0 million), outstanding balance of the revolver ($41.4 million) and accrued interest thereon ($0.1 million) in October 14, 2010. Also, the Company made capital lease payments of $6.1 million during fiscal 2010.
55
For fiscal 2009, cash provided from financing activities was $4.9 million, which included $20.0 million in borrowings from long-term debt to finance five acquisitions and net borrowings of $2.4 million from our revolving credit facility to fund operations. During fiscal 2009 we made $12.3 million and $4.8 million in principal repayments on our long-term debt and capital leases, respectively. During fiscal 2009, we refinanced our existing term loan and revolver with a new credit facility comprised of a $25.0 million term loan and $55.0 million revolver, a portion of which ($2.0 million U.S. dollar equivalent) will be available to be borrowed in Canadian dollars. The proceeds were used to repay the outstanding indebtedness of our prior credit agreement and to fund two acquisitions that closed after the end of fiscal 2009.
Effect of exchange rate on changes in cash
For fiscal 2010, 2009 and 2008, exchange rate changes (decreased) increased our cash by $(0.2) million, $0.4 million and $0.1 million, respectively.
Cash balance and credit facility borrowings
As of May 31, 2010, we had cash and cash equivalents totaling $16.0 million and $55.0 million available to us under our current revolving credit facility. We finance our operations primarily through our net income, bank borrowings and capital lease financing. We believe these sources are sufficient to fund our capital expenditures, debt maturities and other business needs.
On July 22, 2009, we entered into our current credit agreement with Bank of America, N.A., JPMorgan Chase Bank, N.A., TD Bank, N.A. and Capital One, N.A., which provided for a $25.0 million term loan and a $55.0 million secured revolving credit facility. The proceeds from this transaction were used to repay the outstanding indebtedness from our former credit facility and to fund acquisitions.
In October 2009, we repaid the outstanding principal balance of the term loan and the outstanding balance of the revolving credit facility using the proceeds from our initial public offering. Credit extended under the term loan may not be re-borrowed under the current credit agreement. Credit extended under the revolving credit facility may re-borrowed at any time. Borrowings made under the revolving credit facility are payable on July 21, 2012. In December 2009, we signed an amendment to our current credit agreement that, among other things, adjusted certain affirmative and negative covenants including delivery of financial statements, the minimum consolidated debt service coverage ratio, the procedures for obtaining lender approval in acquisitions and the removal of the minimum EBITDA requirement.
Under the amended agreement, borrowings under the credit agreement bear interest at the LIBOR or base rate, at our option, plus an applicable LIBOR margin ranging from 1.75% to 3.25%, or base rate margin ranging from -0.50% to 0.50%, and a market disruption increase of between 0.0% and 1.0%, if the lenders determine it applicable.
The credit agreement also contains financial and other covenants limiting our ability to, among other things, create liens, make investments and certain capital expenditures, incur more indebtedness, merge or consolidate, acquire other companies, make dispositions of property, pay dividends and make distributions to stockholders, enter into a new line of business, enter into transactions with affiliates and enter into burdensome agreements. The agreement’s financial covenants require us to maintain a minimum debt service coverage ratio, and a funded debt leverage ratio, all as defined in the credit agreement. There is a provision in the credit facility that requires us to repay 25% of the immediately preceding fiscal year’s “free cash flow” if our ratio of “funded debt” to EBITDA, as defined in the credit agreement, is greater than a specified amount on or before October 1 each year.
As of May 31, 2010, we were in compliance with the terms of the credit agreement.
Liquidity and capital resources outlook
Future sources of cash
We expect our future sources of cash to include cash flow from operations, cash borrowed under our revolving credit facility and cash borrowed from leasing companies to purchase equipment and fleet service vehicles. Our revolving credit facility is available for cash advances required for working capital and for letters of credit to support our operations. To meet our short-and long-term liquidity requirements, we expect primarily to rely on cash generated from our operating activities. We are currently funding our acquisitions through our available cash, borrowings under our revolving credit facility and seller notes. We may also obtain capital through the issuance of debt or equity securities, or a combination of both.
56
Future uses of cash
We expect our future uses of cash will primarily be for acquisitions, international expansion, purchases or manufacture of field testing equipment to support growth, additional investments in technology and software products and the replacement of existing assets and equipment used in our operations. In June 2010, we purchased land costing approximately $0.9 million in Houston, Texas and expect to construct a new building that houses our regional headquarters in fiscal 2011. The current estimated construction costs are approximately $3.3 million, which we will likely finance. We often make purchases to support new sources of revenues, particularly in our Services segment, but generally only do so with a high degree of certainty about related customer orders and pricing. In addition, we have a certain amount of replacement equipment, including our fleet vehicles. We historically spend approximately 4% to 5% of our total revenues on capital expenditures, excluding acquisitions, and expect to fund these expenditures through a combination of cash and lease financing. Our cash capital expenditures, excluding acquisitions, for fiscal 2010, 2009 and 2008 were approximately 1%, 3% and 2% of revenues, respectively.
Our anticipated acquisitions may also require capital. For example, subsequent to May 31, 2010, we made two acquisitions with an initial cash outlay of approximately $5.3 million. In some cases, additional equipment will be needed to upgrade the capabilities of these acquired companies. In addition, our future acquisition and capital spending may increase as we aggressively pursue growth opportunities. Other investments in infrastructure, training and software may also be required to match our growth, but we plan to continue using a disciplined approach to building our business. In addition, we will use cash to fund our operating leases, capital leases and long-term debt repayment and various other obligations, including the commitments discussed in the table below, as they arise.
We will also use cash to support our working capital requirements for our operations, particularly in the event of further growth and due to the impacts of seasonality on our business. Our future working capital requirements will depend on many factors, including the rate of our revenue growth, our introduction of new solutions and enhancements to existing solutions and our expansion of sales and marketing and product development activities. To the extent that our cash and cash equivalents and future cash flows from operating activities are insufficient to fund our future activities, we may need to raise additional funds through bank credit arrangements or public or private equity or debt financings. We also may need to raise additional funds in the event we determine in the future to effect one or more acquisitions of businesses, technologies or products that will complement our existing operations. In the event additional funding is required, we may not be able to obtain bank credit arrangements or effect an equity or debt financing on terms acceptable to us or at all.
Contractual obligations
We generally do not enter into long-term minimum purchase commitments. Our principal commitments, in addition to those related to our long-term debt discussed below, consist of obligations under facility leases for office space and equipment leases.
The following table summarizes our outstanding contractual obligations as of May 31, 2010:
|
Total
|
Fiscal 2011
|
Fiscal 2012
|
Fiscal 2013
|
Fiscal 2014
|
Fiscal 2015
|
Beyond fiscal 2016
|
||||||||||||||||||||||
|
(in thousands)
|
||||||||||||||||||||||||||||
|
Long-term debt
|
$ | 11,994 | $ | 6,303 | $ | 3,264 | $ | 1,762 | $ | 322 | $ | 50 | $ | 293 | ||||||||||||||
|
Capital lease obligations (1)
|
16,349 | 6,193 | 4,519 | 2,815 | 2,128 | 694 | — | |||||||||||||||||||||
|
Operating lease obligations
|
8,272 | 2,837 | 2,085 | 1,673 | 1,066 | 605 | 6 | |||||||||||||||||||||
|
Contingent consideration obligations
|
1,850 | 587 | 839 | 339 | 85 | — | — | |||||||||||||||||||||
|
Total
|
$ | 38,465 | $ | 15,920 | $ | 10,707 | $ | 6,589 | $ | 3,601 | $ | 1,349 | $ | 299 | ||||||||||||||
(1) Includes estimated cash interest to be paid over the remaining terms of the leases.
Long-term debt listed in the table above consists primarily of seller notes payable in connection with our acquisitions.
In addition to the above, we have certain acquisition related contingent payments that may become payable if certain financial measures, as defined in each respective agreement, are achieved.
57
Off-balance sheet arrangements
During fiscal 2010, 2009 and 2008, we did not have any relationships with unconsolidated entities or financial partnerships, such as entities often referred to as structured finance or special purpose entities, which would have been established for the purpose of facilitating off-balance sheet arrangements or other contractually narrow or limited purposes.
Critical accounting policies and estimates
The preparation of financial statements requires that we make estimates and assumptions that affect the reported amounts of assets and liabilities and disclosure of contingent assets and liabilities at the date of financial statements and the reported amounts of revenues and expenses during the reporting period. Our more significant estimates include: the valuation of goodwill and intangible assets; the impairment of long-lived assets, allowances for doubtful accounts; foreign currency translation; derivative financial instruments; reserves for self-insured workers compensation and health benefits; and deferred income tax valuation allowances. We base our estimates on historical experience and on various other assumptions that we believe to be reasonable. We evaluate our estimates and assumptions on an ongoing basis. Our actual results may differ significantly from these estimates under different assumptions or conditions. There have been no material changes to these estimates for the periods presented in this Annual Report.
We believe that of our significant accounting policies, which are described below and in Note 2 to our audited consolidated financial statements included in this Item 8 of this Annual Report, the following accounting policies involve a greater degree of judgment and complexity. Accordingly, these are the policies we believe are the most critical to aid in fully understanding and evaluating our financial condition and results of operations.
Accounts receivable
Accounts receivable are stated net of an allowance for doubtful accounts and sales allowances. Outstanding accounts receivable balances are reviewed periodically, and allowances are provided at such time as management believes it is probable that such balances will not be collected within a reasonable period of time. We extend credit to our customers based upon credit evaluations in the normal course of business, primarily with 30-day terms. Bad debts are provided on the allowance method based on historical experience and management’s evaluation of outstanding accounts receivable. Accounts are written off when they are deemed uncollectible. The allowance for doubtful accounts was $1.6 million and $3.3 million as of May 31, 2010 and 2009, respectively.
Foreign currency translation
The financial position and results of operations of our foreign subsidiaries are measured using the their functional currency, which in all cases presently, is the local currency. There are a total of eight foreign subsidiaries operating in a currency other than the U.S. dollar. Assets and liabilities of the foreign subsidiaries are translated into the U.S. dollar at the exchange rates in effect at the balance sheet date. Income and expenses are translated at the average exchange rate during the year. Translation gains and losses are reported as a component of other comprehensive income for the period and included in accumulated other comprehensive income within stockholders’ equity.
We are at risk for changes in foreign currencies relative to the U.S. dollar. See “Quantitative and qualitative disclosures about market risk—Foreign currency risk.” We currently do not believe there are other outcomes that are reasonably likely to occur with regard to our translation process that would have a material impact on our fiscal 2010 and 2009 financial statements.
Long-lived assets, net outside of the U.S. totaled $11.2 million and $11.1 million as of May 31, 2010 and 2009, respectively.
Goodwill and intangible assets
Goodwill represents the excess of the purchase price over the fair market value of net assets of the acquired business at the date of acquisition. We test goodwill for impairment annually in our fiscal fourth quarter using a two-step process. The first step identifies potential impairment by comparing the fair value of our reporting units to their carrying value. If the fair value is less than the carrying value, the second step measures the amount of impairment, if any. The impairment loss is the amount by which the carrying amount of goodwill exceeds the implied fair value of that goodwill. For purposes of our goodwill impairment testing, we have identified our reporting units as our operating segments. Presently, only the Services segment and International segment, specifically Physical Acoustics Ltd., or PAL, a division within the International segment, have goodwill. The fair value of the reporting unit is determined using a market approach valuation model, specifically the quoted price method, and an income approach valuation model, specifically discounted cash flows. Our discounted cash flow analysis incorporates the following key assumptions: growth projections, our weighted average costs of capital, future capital expenditures and tax rates. There have been no significant changes in the assumptions and methodologies used for valuing goodwill since the prior year. There was $44.3 million and $38.6 million of goodwill at May 31, 2010 and 2009, respectively. The fair value of our reporting units significantly exceeds the carrying value of these reporting units for fiscal 2010 and 2009. Accordingly, there have been no impairments of goodwill. There were no impairment indicators present in the reporting units in fiscal 2010. A material negative change in our key assumptions would need to occur for our step one tests to indicate an impairment. Intangible assets are recorded at cost, with finite lives and are amortized on a straight-line basis over their estimated useful lives. We review intangible assets subject to amortization periodically to determine if any adverse condition exists or change in circumstances has occurred that would indicate impairment or change in useful life. If impairment exists, and it is determined that there is no recoverability, an impairment charge is recorded.
58
Impairment of long-lived assets
We perform a review of long-lived assets for impairment when events or changes in circumstances indicate the carrying value of such assets may not be recoverable. If an indication of impairment is present, the Company compares the estimated undiscounted future cash flows to be generated by the asset to its carrying amount. If the undiscounted future cash flows are less than the carrying amount of the asset, the Company records an impairment loss equal to the excess of the asset’s carrying amount over its fair value. The fair value is determined based on valuation techniques such as a discounted cash flow analysis or a comparison to fair values of similar assets. We had $40.0 million and $36.5 million in net property, plant and equipment as of May 31, 2010 and 2009, respectively, and did not record any impairment charges in the two fiscal years ended on those dates.
Derivative financial instruments
We recognize our derivatives as either assets or liabilities, and measure those instruments at fair value and recognize the changes in fair value of the derivative in net income or other comprehensive income, as appropriate. We hedge a portion of our variable rate interest payments on debt using interest rate swap contracts to convert variable payments into fixed payments. We do not apply hedge accounting to our interest rate swap contracts. Changes in the fair value of these instruments are reported as a component of interest expense. Derivative liabilities were $0.2 million and $0.7 million at May 31, 2010 and 2009, respectively.
Stock-based compensation
We measure the cost of employee services received in exchange for an award of equity instruments based upon the grant-date fair value of the award. We use the “straight-line” attribution method for allocating compensation costs and recognized the fair value of each stock option on a straight-line basis over the vesting period of the related awards.
We use the Black-Scholes option-pricing model to estimate the fair value of the stock-based awards as of the grant date. The Black-Scholes model, by its design, is highly complex and dependent upon key data inputs estimated by management. The primary inputs with the greatest degree of judgment are the expected term of stock-based awards and the estimated volatility of our common stock price. The Black-Scholes model is sensitive to changes in these two variables. We consider many factors in determining the expected term assumption, but the expected term of our stock options is generally determined using the mid-point between the vesting period and the end of the contractual term. Expected stock price volatility is typically based on the daily historical trading data for a period equal to the expected term. Because our historical trading data only dates back to October 8, 2009, the first trading date after our IPO, we have estimated expected volatility using an analysis of the stock price volatility of comparable companies in its industry. Prior to our IPO, the exercise price for each stock option equaled the grant date estimated fair market value of our common stock, as determined by our board of directors. Since our IPO, the exercise price of stock option grants is determined using the closing market price of our common stock on the date of grant.
Revenue recognition
Revenue recognition policies for the various sources of revenues are as follows:
Services
We predominantly derive revenues by providing our services on a time and material basis and recognize revenues when services are rendered. At the end of any reporting period, there may be earned but unbilled revenues that are accrued. Payments received in advance of revenue recognition are reflected as deferred revenues.
59
Software
Revenues from the sale of perpetual licenses are recognized upon the delivery and acceptance of the software. Revenues from term licenses are recognized ratably over the period of the license. Revenues from maintenance, unspecified upgrades and technical support are recognized ratably over the period such items are delivered. For multiple-element arrangement software contracts that include non-software elements, and where the software is essential to the functionality of the non-software elements (collectively referred to as software multiple-element arrangements), we apply the rules as noted below.
Products
Revenues from product sales are recognized when risk of loss and title passes to the customer, which is generally upon product delivery. The exceptions to this accounting treatment would be for multiple-element arrangements (defined below) or those situations where specialized installation or customer acceptance is required. Payments received in advance of revenue recognition are reflected as deferred revenues.
Percentage of completion
A portion of our revenues are generated from engineering and manufacturing of custom products under long-term contracts that may last from several months to several years, depending on the contract. Revenues from long-term contracts are recognized on the percentage-of-completion method of accounting. Under the percentage-of-completion method of accounting revenues are recognized as work is performed. The percentage of completion at any point in time is based on total costs or total labor dollars incurred to date in relation to the total estimated costs or total labor dollars estimated at completion. The percentage of completion is then applied to the total contract price to determine the amount of revenue to be recognized in the period. Application of the percentage-of-completion method of accounting requires the use of estimates of costs to be incurred for the performance of the contract. Contract costs include all direct materials, direct labor costs and those indirect costs related to contract performance, such as indirect labor, supplies, tools, repairs, and all costs associated with operation of equipment. The costs estimation process is based upon the professional knowledge and experience of our engineers, project managers and financial professionals. Factors that are considered in estimating the work to be completed include the availability and productivity of labor, the nature and complexity of the work to be performed, the effect of change orders, the availability of materials, the effect of any delays in our project performance and the recoverability of any claims. Whenever revisions of estimated contract costs and contract values indicate that the contract costs will exceed estimated revenues, thus creating a loss, a provision for the total estimated loss is recorded in that period.
Multiple-element arrangements
We occasionally enter into transactions that represent multiple-element arrangements, which may include any combination of services, software and hardware. Vendor-specific objective evidence is utilized to determine whether they can be separated into more than one unit of accounting. A multiple-element arrangement is separated into more than one unit of accounting if: (1) the delivered item has value on a standalone basis; and (2) there is objective and reliable evidence of the fair value of the undelivered items if the delivery or performance of the undelivered items is probable and within our control.
If these criteria are not met, then revenues are deferred until such criteria are met or until the period(s) over which the last undelivered element is delivered. If there is objective and reliable evidence of fair value for all units of accounting in an arrangement, the arrangement consideration is allocated to the separate units of accounting based on each unit’s relative fair value.
Income taxes
Income taxes are accounted for under the asset and liability method. This process requires that we assess temporary differences between the book and tax basis of assets resulting from differing treatment between book and tax of certain items, such as depreciation. Deferred income tax assets and liabilities are recognized based on the future tax consequences attributable to differences between the financial statement carrying amounts of existing assets and liabilities and their respective tax bases and tax credit carryforwards. Deferred income tax assets and liabilities are measured using enacted tax rates expected to apply to taxable income in the years in which those temporary differences are expected to be recovered or settled. The effect on deferred income tax assets and liabilities of a change in tax rates is recognized in income in the period that includes the enactment date. A valuation allowance is provided if it is more likely than not that some or all of the deferred income tax assets will not be realized. We consider all available evidence, both positive and negative, to determine whether, based on the weight of the evidence, a valuation allowance is needed. Evidence used includes information about our current financial position and our results of operations for the current and preceding years, as well as all currently available information about future years, including our anticipated future performance, the reversal of deferred tax liabilities and tax planning strategies. As of May 31, 2010 and 2009, we had net deferred income tax expense of $0.9 million and $0.1 million, respectively. We believe that it is more likely than not that we will have sufficient future taxable income to allow us to realize the benefits of the net deferred tax assets. We currently do not believe there are other outcomes that are reasonably likely to occur with regard to income taxes that would have a material impact on our fiscal 2010 and 2009 financial statements.
60
Recent accounting pronouncements
In January 2010, the FASB issued amendments to its fair value guidance which requires additional disclosures that include: 1) separate disclosures on significant transfers into and out of Level 3; 2) the amount of transfers between Level 1 and Level 2 and the reasons for such transfers; 3) lower level of disaggregation for fair value disclosures by class rather than by major category and 4) additional details on the valuation techniques and inputs used to determine Level 2 and Level 3 measurements. The Company has included these additional disclosures within the Company’s Annual Report on Form 10-K for the year ended May 31, 2010 and they did not have a significant impact on the financial statements of the Company.
In October 2009, the FASB issued guidance on revenue recognition related to multiple-element arrangements. This new guidance requires companies to allocate revenue in multiple-element arrangements based on an element’s estimated selling price if vendor-specific or other third party evidence of value is not available. This guidance is effective prospectively for revenue arrangements entered into or materially modified in fiscal years beginning on or after June 15, 2010. Early adoption is permitted retrospectively from the beginning of an entity’s fiscal year. The Company does not expect this will have a significant impact on the financial statements of the Company.
|
Quantitative and qualitative disclosures about market risk
|
Interest rate sensitivity
We had cash and cash equivalents of $16.0 million at May 31, 2010. These amounts are held for working capital purposes and were invested primarily in bank deposits, money market funds and short-term, interest-bearing, investment-grade securities. Due to the short-term nature of these investments, we believe that we do not have any material exposure to changes in the fair value of our investment portfolio as a result of changes in interest rates. Declines in interest rates, however, will reduce future investment income. If overall interest rates had fallen by 10% in fiscal 2010, our interest income would not have been materially affected.
We use interest rate swaps to manage our floating interest rate exposure. In fiscal 2007, we entered into two interest rate swap contracts whereby we would receive or pay an amount equal to the difference between a fixed rate and the quoted 90-day LIBOR rate on a quarterly basis. In November 2009, one of these contracts matured. At May 31, 2010, there remains one interest rate swap contract outstanding the significant terms of which and the amount we will pay above our contractual rates follows:
|
Contract date
|
Term
|
Notional Amount
|
Variable interest rate
|
Fixed interest rate
|
2010
|
2009
|
||||||||||||
|
November 20, 2006
|
4 years
|
$ | 8,000 |
LIBOR
|
5.17 | % | $ | (210 | ) | $ | (199 | ) | ||||||
|
November 30, 2006
|
3 years
|
8,000 |
LIBOR
|
5.05 | % | — | (517 | ) | ||||||||||
| $ | 16,000 | $ | (210 | ) | $ | (716 | ) | |||||||||||
Foreign currency risk
We have foreign currency exposure related to our operations in foreign locations. This foreign currency exposure, particularly the Euro, British Pound Sterling, Brazilian Real, Russian Ruble, Japanese Yen, Canadian Dollar and the Indian Rupee, arises primarily from the translation of our foreign subsidiaries’ financial statements into U.S. dollars. For example, a portion of our annual sales and operating costs are denominated in British pound sterling and we have exposure related to sales and operating costs increasing or decreasing based on changes in currency exchange rates. If the U.S. dollar increases in value against these foreign currencies, the value in U.S. dollars of the assets and liabilities originally recorded in these foreign currencies will decrease. Conversely, if the U.S. dollar decreases in value against these foreign currencies, the value in U.S. dollars of the assets and liabilities originally recorded in these foreign currencies will increase. Thus, increases and decreases in the value of the U.S. dollar relative to these foreign currencies have a direct impact on the value in U.S. dollars of our foreign currency denominated assets and liabilities, even if the value of these items has not changed in their original currency. We do not currently enter into forward exchange contracts to hedge exposures denominated in foreign currencies. A 10% change in the average U.S. dollar exchange rates for fiscal 2010 would cause a change in consolidated operating income of approximately $0.2 million. We may consider entering into hedging or forward exchange contracts in the future.
61
Fair value of financial instruments
We do not have material exposure to market risk with respect to investments, as our investments consist primarily of highly liquid investments purchased with a remaining maturity of three months or less. We do not use derivative financial instruments for speculative or trading purposes; however, this does not preclude our adoption of specific hedging strategies in the future.
Effects of inflation and changing prices
Our results of operations and financial condition have not been significantly affected by inflation and changing prices.
62
|
FINANCIAL STATEMENTS AND SUPPLEMENTARY DATA
|
On August 10, 2010, we issued a press release containing our financial results for the quarter and year ended May 31, 2010, which we furnished as an exhibit to a Current Report on Form 8-K prior to hosting a conference call on August 11, 2010. Subsequent to August 11, 2010, we made fourth quarter adjustments to our cost of revenues, depreciation and amortization, research and engineering, and selling general and administrative expenses, all of which impacted our tax provision. A portion of these adjustments related to prior fiscal periods; however, the adjustments were not material to any prior period. As a result, our fourth quarter net income is $5.3 million or $0.20 per diluted share, compared with net income of $4.9 million or $0.18 per diluted share, as reported on August 10, 2010. For the year ended May 31, 2010, our net income is $10.4 million or $0.43 per diluted share, compared with net income of $10.1 million or $0.41 per diluted share, as reported on August 10, 2010.
63
To the Board of Directors and Stockholders of
Mistras Group, Inc.:
In our opinion, the accompanying consolidated balance sheets and the related consolidated statements of operations, stockholders’ equity (deficit) and cash flows present fairly, in all material respects, the financial position of Mistras Group, Inc. and subsidiaries at May 31, 2010 and May 31, 2009, and the results of their operations and their cash flows for each of the three years in the period ended May 31, 2010 in conformity with accounting principles generally accepted in the United States of America. These financial statements are the responsibility of the Company’s management. Our responsibility is to express an opinion on these financial statements based on our audits. We conducted our audits of these statements in accordance with the standards of the Public Company Accounting Oversight Board (United States). Those standards require that we plan and perform the audit to obtain reasonable assurance about whether the financial statements are free of material misstatement. An audit includes examining, on a test basis, evidence supporting the amounts and disclosures in the financial statements, assessing the accounting principles used and significant estimates made by management, and evaluating the overall financial statement presentation. We believe that our audits provide a reasonable basis for our opinion.
|
/s/ PricewaterhouseCoopers LLP
|
|
|
PricewaterhouseCoopers LLP
|
|
|
New York, NY
|
|
|
August 16, 2010
|
64
May 31, 2010 and 2009
(in thousands, except share and per share data)
|
May 31, 2010
|
May 31, 2009
|
|||||||
|
ASSETS
|
||||||||
|
Current Assets
|
||||||||
|
Cash and cash equivalents
|
$ | 16,037 | $ | 5,668 | ||||
|
Accounts receivable, net
|
54,721 | 39,509 | ||||||
|
Inventories, net
|
8,736 | 8,554 | ||||||
|
Deferred income taxes
|
2,189 | 1,593 | ||||||
|
Prepaid expenses and other current assets
|
5,292 | 7,550 | ||||||
|
Total current assets
|
86,975 | 62,874 | ||||||
|
Property, plant and equipment, net
|
39,981 | 36,547 | ||||||
|
Intangible assets, net
|
16,088 | 11,949 | ||||||
|
Goodwill
|
44,315 | 38,642 | ||||||
|
Other assets
|
1,273 | 3,421 | ||||||
|
Total assets
|
$ | 188,632 | $ | 153,433 | ||||
|
LIABILITIES, PREFERRED STOCK AND EQUITY (DEFICIT)
|
||||||||
|
Current liabilities
|
||||||||
|
Current portion of long-term debt
|
$ | 6,303 | $ | 14,390 | ||||
|
Current portion of capital lease obligations
|
5,370 | 4,981 | ||||||
|
Accounts payable
|
4,640 | 2,797 | ||||||
|
Accrued expenses and other current liabilities
|
20,090 | 20,499 | ||||||
|
Income taxes payable
|
3,281 | 3,600 | ||||||
|
Total current liabilities
|
39,475 | 46,267 | ||||||
|
Long-term debt, net of current portion
|
5,691 | 51,861 | ||||||
|
Obligations under capital leases, net of current portion
|
9,199 | 9,544 | ||||||
|
Deferred income taxes
|
2,087 | 1,199 | ||||||
|
Other long-term liabilities
|
1,417 | 1,246 | ||||||
|
Total libilities
|
58,078 | 110,117 | ||||||
|
Commitments and contingencies (Notes 13 and 14)
|
||||||||
|
Preferred stock, 1,000,000 shares authorized
|
||||||||
|
Class B Convertible Redeemable Preferred Stock, $0.01 par value, 221,205 shares issued and outstanding as of May 31, 2009
|
— | 38,710 | ||||||
|
Class A Convertible Redeemable Preferred Stock, $0.01 par value, 298,701 shares issued and outstanding as of May 31, 2009
|
— | 52,273 | ||||||
|
Total preferred stock
|
— | 90,983 | ||||||
|
Equity (deficit)
|
||||||||
|
Common stock, $0.01 par value, 200,000,000 shares authorized, 26,663,528 shares issued and outstanding as of May 31, 2010 and 35,000,000 shares authorized, 13,000,000 shares issued and outstanding as of May 31, 2009
|
267 | 130 | ||||||
|
Additional paid-in capital
|
162,054 | 917 | ||||||
|
Accumulated deficit
|
(30,448 | ) | (47,376 | ) | ||||
|
Accumulated other comprehensive loss
|
(1,587 | ) | (1,583 | ) | ||||
|
Total Mistras Group, Inc. stockholders’ equity (deficit)
|
130,286 | (47,912 | ) | |||||
|
Noncontrolling interest
|
268 | 245 | ||||||
|
Total equity (deficit)
|
130,554 | (47,667 | ) | |||||
|
Total liabilities, preferred stock and equity (deficit)
|
$ | 188,632 | $ | 153,433 | ||||
The accompanying notes are an integral part of these consolidated financial statements.
65
Mistras Group, Inc. and Subsidiaries
Years ended May 31, 2010, 2009 and 2008
(in thousands, except share and per share data)
|
For the year ended May 31,
|
||||||||||||
|
2010
|
2009
|
2008
|
||||||||||
|
Revenues:
|
||||||||||||
|
Services
|
$ | 248,672 | $ | 190,637 | $ | 134,183 | ||||||
|
Products
|
23,456 | 18,496 | 18,085 | |||||||||
|
Total revenues
|
272,128 | 209,133 | 152,268 | |||||||||
|
Cost of Revenues:
|
||||||||||||
|
Cost of services
|
169,591 | 123,336 | 83,623 | |||||||||
|
Cost of goods sold
|
8,889 | 7,831 | 6,967 | |||||||||
|
Depreciation of services
|
9,840 | 7,860 | 6,167 | |||||||||
|
Depreciation of products
|
670 | 840 | 680 | |||||||||
|
Total cost of revenues
|
188,990 | 139,867 | 97,437 | |||||||||
|
Gross profit
|
83,138 | 69,266 | 54,831 | |||||||||
|
Selling, general and administrative expenses
|
54,849 | 46,456 | 32,243 | |||||||||
|
Research and engineering
|
2,402 | 1,949 | 1,654 | |||||||||
|
Depreciation and amortization
|
4,673 | 3,936 | 4,576 | |||||||||
|
Legal settlement
|
(297 | ) | 2,100 | — | ||||||||
|
Acquisition related costs
|
614 | — | — | |||||||||
|
Income from operations
|
20,897 | 14,825 | 16,358 | |||||||||
|
Other expenses
|
||||||||||||
|
Interest expense
|
3,531 | 4,614 | 3,531 | |||||||||
|
Loss on extinguishment of long-term debt
|
387 | — | — | |||||||||
|
Income before provision for income taxes and noncontrolling interest
|
16,979 | 10,211 | 12,827 | |||||||||
|
Provision for income taxes
|
6,527 | 4,558 | 5,380 | |||||||||
|
Net income
|
10,452 | 5,653 | 7,447 | |||||||||
|
Net income attributable to noncontrolling interests
|
(23 | ) | (187 | ) | (8 | ) | ||||||
|
Net income attributable to Mistras Group, Inc.
|
10,429 | 5,466 | 7,439 | |||||||||
|
Accretion of preferred stock
|
6,499 | (27,114 | ) | (32,872 | ) | |||||||
|
Net income (loss) attributable to common stockholders
|
$ | 16,928 | $ | (21,648 | ) | $ | (25,433 | ) | ||||
|
Earnings (loss) per common share:
|
||||||||||||
|
Basic
|
$ | 0.78 | $ | (1.67 | ) | $ | (1.96 | ) | ||||
|
Diluted
|
$ | 0.43 | $ | (1.67 | ) | $ | (1.96 | ) | ||||
|
Weighted average common shares outstanding:
|
||||||||||||
|
Basic
|
21,744 | 13,000 | 13,000 | |||||||||
|
Diluted
|
24,430 | 13,000 | 13,000 | |||||||||
The accompanying notes are an integral part of these consolidated financial statements.
66
Mistras Group, Inc. and Subsidiaries
Years ended May 31, 2010, 2009 and 2008
(in thousands)
| Additional paid-in capital |
Retained earnings (accumulated deficit) | Accumulated other comprehensive income (loss) | ||||||||||||||||||||||||||||||
|
Common Stock
|
Noncontrolling | Comprehensive | ||||||||||||||||||||||||||||||
|
Shares
|
Amount
|
Interest
|
Total
|
income (loss)
|
||||||||||||||||||||||||||||
|
Balance at May 31, 2007
|
13,000 | $ | 130 | $ | 407 | $ | 269 | $ | 97 | $ | 50 | $ | 953 | $ | — | |||||||||||||||||
|
Accretion of preferred stock
|
— | — | — | (32,872 | ) | — | — | (32,872 | ) | — | ||||||||||||||||||||||
|
Net income
|
— | — | — | 7,439 | — | 8 | 7,447 | 7,447 | ||||||||||||||||||||||||
|
Foreign currency translation adjustment
|
— | — | — | — | 301 | — | 301 | 301 | ||||||||||||||||||||||||
|
Stock compensation expense
|
— | — | 318 | — | — | — | 318 | — | ||||||||||||||||||||||||
|
Adoption of accounting pronouncement
|
— | — | — | (564 | ) | — | — | (564 | ) | — | ||||||||||||||||||||||
|
Exercise of stock options
|
— | — | — | — | — | — | — | — | ||||||||||||||||||||||||
|
Balance at May 31, 2008
|
13,000 | 130 | 725 | (25,728 | ) | 398 | 58 | (24,417 | ) | $ | 7,748 | |||||||||||||||||||||
|
Accretion of preferred stock
|
— | — | — | (27,114 | ) | — | — | (27,114 | ) | — | ||||||||||||||||||||||
|
Net income
|
— | — | — | 5,466 | — | 187 | 5,653 | 5,653 | ||||||||||||||||||||||||
|
Foreign currency translation adjustment
|
— | — | — | — | (1,981 | ) | — | (1,981 | ) | (1,981 | ) | |||||||||||||||||||||
|
Stock compensation
|
— | — | 192 | — | — | — | 192 | — | ||||||||||||||||||||||||
|
Balance at May 31, 2009
|
13,000 | 130 | 917 | (47,376 | ) | (1,583 | ) | 245 | (47,667 | ) | $ | 3,672 | ||||||||||||||||||||
|
Accretion of preferred stock
|
— | — | — | 6,499 | — | — | 6,499 | — | ||||||||||||||||||||||||
|
Issuance of common stock upon conversion of class A & B preferred stock
|
6,759 | 68 | 84,416 | — | — | — | 84,484 | — | ||||||||||||||||||||||||
|
Issuance of common stock from initial public offering, net
|
6,700 | 67 | 73,950 | — | — | — | 74,017 | — | ||||||||||||||||||||||||
|
Net income
|
— | — | — | 10,429 | — | 23 | 10,452 | 10,452 | ||||||||||||||||||||||||
|
Foreign currency translation adjustment
|
— | — | — | — | (4 | ) | — | (4 | ) | (4 | ) | |||||||||||||||||||||
|
Stock compensation
|
— | — | 2,695 | — | — | — | 2,695 | — | ||||||||||||||||||||||||
|
Exercise of stock options
|
204 | 2 | 76 | — | — | — | 78 | — | ||||||||||||||||||||||||
|
Balance at May 31, 2010
|
26,663 | $ | 267 | $ | 162,054 | $ | (30,448 | ) | $ | (1,587 | ) | $ | 268 | $ | 130,554 | $ | 10,448 | |||||||||||||||
The accompanying notes are an integral part of these consolidated financial statements.
67
Mistras Group, Inc. and Subsidiaries
Fiscal Years Ended May 31, 2010, 2009 and 2008
(in thousands)
|
For the year ended May 31,
|
||||||||||||
|
2010
|
2009
|
2008
|
||||||||||
|
Cash flows from operating activities
|
||||||||||||
|
Net income attributable to Mistras Group, Inc.
|
$ | 10,429 | $ | 5,466 | $ | 7,439 | ||||||
|
Adjustments to reconcile net income to net cash provided by operating activities
|
||||||||||||
|
Depreciation and amortization
|
15,183 | 12,636 | 11,423 | |||||||||
|
Deferred income taxes
|
907 | 146 | 329 | |||||||||
|
Provision for doubtful accounts
|
532 | 2,097 | 376 | |||||||||
|
Loss on extinguishment of long-term debt
|
387 | — | — | |||||||||
|
Loss (gain) on sale of assets disposed
|
196 | (34 | ) | (114 | ) | |||||||
|
Amortization of deferred financing costs
|
206 | 196 | 105 | |||||||||
|
Stock compensation expense
|
2,695 | 192 | 318 | |||||||||
|
Noncash interest rate swap
|
(506 | ) | 161 | 598 | ||||||||
|
Noncontrolling interest
|
23 | 187 | 8 | |||||||||
|
Unrealized foreign currency gain
|
(1,284 | ) | (213 | ) | — | |||||||
|
Changes in operating assets and liabilities, net of effect of acquisitions
|
||||||||||||
|
Accounts receivable
|
(15,213 | ) | (8,849 | ) | (9,226 | ) | ||||||
|
Inventories
|
(116 | ) | (887 | ) | (1,802 | ) | ||||||
|
Prepaid expenses and other current assets
|
(682 | ) | (1,119 | ) | (1,997 | ) | ||||||
|
Other assets
|
1,259 | (403 | ) | (990 | ) | |||||||
|
Accounts payable
|
1,806 | (2,225 | ) | 2,203 | ||||||||
|
Income taxes payable
|
3,748 | (1,442 | ) | 46 | ||||||||
|
Accrued expenses and other current liabilities
|
(583 | ) | 6,752 | 4,135 | ||||||||
|
Net cash provided by operating activities
|
18,987 | 12,661 | 12,851 | |||||||||
|
Cash flows from investing activities
|
||||||||||||
|
Purchase of property, plant and equipment
|
(1,947 | ) | (5,367 | ) | (3,718 | ) | ||||||
|
Purchase of intangible asset
|
(36 | ) | (346 | ) | (712 | ) | ||||||
|
Acquisition of businesses, net of cash acquired
|
(14,699 | ) | (10,464 | ) | (15,535 | ) | ||||||
|
Proceeds from sale of equipment
|
148 | 289 | 519 | |||||||||
|
Net cash used in investing activities
|
(16,534 | ) | (15,888 | ) | (19,446 | ) | ||||||
|
Cash flows from financing activities
|
||||||||||||
|
Repayment of capital lease obligations
|
(6,071 | ) | (4,825 | ) | (3,605 | ) | ||||||
|
Repayments of long-term debt
|
(68,942 | ) | (12,332 | ) | (3,219 | ) | ||||||
|
Net payments against revolver
|
(15,505 | ) | 2,360 | 13,144 | ||||||||
|
Proceeds from borrowings of long-term debt
|
25,000 | 20,000 | — | |||||||||
|
Debt issuance costs
|
(484 | ) | (291 | ) | — | |||||||
|
Net proceeds from issuance of common stock
|
74,007 | — | — | |||||||||
|
Proceeds from the exercise of stock options
|
78 | — | — | |||||||||
|
Net cash provided by financing activities
|
8,083 | 4,912 | 6,320 | |||||||||
|
Effect of exchange rate changes on cash and cash equivalents
|
(167 | ) | 428 | 63 | ||||||||
|
Net change in cash and cash equivalents
|
10,369 | 2,113 | (212 | ) | ||||||||
|
Cash and cash equivalents
|
||||||||||||
|
Beginning of period
|
5,668 | 3,555 | 3,767 | |||||||||
|
End of period
|
$ | 16,037 | $ | 5,668 | $ | 3,555 | ||||||
|
Supplemental disclosure of cash paid
|
||||||||||||
|
Interest
|
$ | 3,943 | $ | 4,031 | $ | 2,974 | ||||||
|
Income taxes
|
$ | 2,306 | $ | 6,510 | $ | 4,814 | ||||||
|
Noncash investing and financing
|
||||||||||||
|
Equipment acquired through capital lease obligations
|
$ | 5,986 | $ | 7,485 | $ | 5,021 | ||||||
|
Issuance of notes payable and other debt obligations primarily related to acquisitions
|
$ | 5,739 | $ | 9,289 | $ | 13,531 | ||||||
The accompanying notes are an integral part of these consolidated financial statements.
68
Mistras Group, Inc. and Subsidiaries
(tabular dollars in thousands, except per share data)
1. Description of business and basis of presentation
Description of business
Mistras Group, Inc. and subsidiaries (the “Company”) is a leading global provider of technology-enabled asset protection solutions used to evaluate the structural integrity of critical energy, industrial and public infrastructure. The Company combines industry-leading products and technologies, expertise in mechanical integrity (MI) and non-destructive testing (NDT) services and proprietary data analysis software to deliver a comprehensive portfolio of customized solutions, ranging from routine inspections to complex, plant-wide asset integrity assessments and management. These mission critical solutions enhance customers’ ability to extend the useful life of their assets, increase productivity, minimize repair costs, comply with governmental safety and environmental regulations, manage risk and avoid catastrophic disasters. Given the role the Company services play in ensuring the safe and efficient operation of infrastructure, the Company has historically provided a majority of its services to its customers on a regular, recurring basis. The Company serves a global customer base of companies with asset-intensive infrastructure, including companies in the oil and gas, fossil and nuclear power, public infrastructure, chemicals, aerospace and defense, transportation, primary metals and metalworking, pharmaceuticals and food processing industry.
Principles of consolidation
The accompanying consolidated financial statements include the accounts of Mistras Group, Inc. and its wholly or majority-owned subsidiaries: Quality Service Laboratories, Inc., CONAM Inspection & Engineering Services, Inc. (“Conam”) (merged into Mistras Group, Inc. on May 31, 2009), Cismis Springfield Corp., Mistras Group, S.A. (formerly Euro Physical Acoustics, S.A.), Nippon Physical Acoustics Ltd., Physical Acoustics South America, Diapac Company, Mistras Canada, Inc. and Physical Acoustics Ltd. and its wholly or majority-owned subsidiaries, Physical Acoustics India Private Ltd., Physical Acoustics B.V. and Envirocoustics A.B.E.E. (“Envac”). Where the Company’s ownership interest is less than 100%, the noncontrolling interests are reported in the accompanying consolidated balance sheets. The noncontrolling interest in net income, net of tax, is classified separately in the accompanying consolidated statements of operations.
All significant intercompany accounts and transactions have been eliminated in consolidation. All foreign subsidiaries’ reporting year ends are April 30, while Mistras Group and the domestic subsidiaries year ends are May 31. The effect of this difference in timing of reporting foreign operations on the consolidated results of operations and consolidated financial position is not significant.
Reclassification
Certain amounts previously reported for prior periods have been reclassified to conform to the current year presentation in the accompanying consolidated financial statements. Such reclassifications did not have a material effect on the Company’s financial condition or results of operations as previously reported.
2. Summary of significant accounting policies
Revenue recognition
Revenue recognition policies for the various sources of revenues are as follows:
Services
The Company predominantly derives revenues by providing its services on a time and material basis and recognizes revenues when services are rendered. At the end of any reporting period, there may be earned but unbilled revenues that are accrued. Payments received in advance of revenue recognition are reflected as deferred revenues.
69
Mistras Group, Inc. and Subsidiaries
Notes to Consolidated Financial Statements—(continued)
(tabular dollars in thousands, except per share data)
Software
Revenues from the sale of perpetual licenses are recognized upon the delivery and acceptance of the software. Revenues from term licenses are recognized ratably over the period of the license. Revenues from maintenance, unspecified upgrades and technical support are recognized ratably over the period such items are delivered. For multiple-element arrangement software contracts that include non-software elements, and where the software is essential to the functionality of the non-software elements (collectively referred to as software multiple-element arrangements), the Company applies the rules as noted below.
Products
Revenues from product sales are recognized when risk of loss and title passes to the customer, which is generally upon product delivery. The exceptions to this accounting treatment would be for multiple-element arrangements (described below) or those situations where specialized installation or customer acceptance is required. Payments received in advance of revenue recognition are reflected as deferred revenues.
Percentage of completion
A portion of the Company’s revenues are generated from engineering and manufacturing of custom products under long-term contracts that may last from several months to several years, depending on the contract. Revenues from long-term contracts are recognized on the percentage-of-completion method of accounting. Under the percentage-of-completion method of accounting revenues are recognized as work is performed. The percentage of completion at any point in time is based on total costs or total labor dollars incurred to date in relation to the total estimated costs or total labor dollars estimated at completion. The percentage of completion is then applied to the total contract price to determine the amount of revenue to be recognized in the period. Application of the percentage-of-completion method of accounting requires the use of estimates of costs to be incurred for the performance of the contract. Contract costs include all direct materials, direct labor costs and those indirect costs related to contract performance, such as indirect labor, supplies, tools, repairs, and all costs associated with operation of equipment. The costs estimation process is based upon the professional knowledge and experience of the Company’s engineers, project managers and financial professionals. Factors that are considered in estimating the work to be completed include the availability and productivity of labor, the nature and complexity of the work to be performed, the effect of change orders, the availability of materials, the effect of any delays in our project performance and the recoverability of any claims. Whenever revisions of estimated contract costs and contract values indicate that the contract costs will exceed estimated revenues, thus creating a loss, a provision for the total estimated loss is recorded in that period.
Multiple-element arrangements
The Company occasionally enters into transactions that represent multiple-element arrangements, which may include any combination of services, software, hardware and financing. Vendor-specific objective evidence is utilized to determine whether they can be separated into more than one unit of accounting. A multiple-element arrangement is separated into more than one unit of accounting if: (1) the delivered item has value on a standalone basis; and (2) there is objective and reliable evidence of the fair value of the undelivered items if the delivery or performance of the undelivered items is probable and in the control of the Company.
If these criteria are not met, then revenues are deferred until such criteria are met or until the period(s) over which the last undelivered element is delivered. If there is objective and reliable evidence of fair value for all units of accounting in an arrangement, the arrangement consideration is allocated to the separate units of accounting based on each unit’s relative fair value.
Use of estimates
The preparation of consolidated financial statements in conformity with accounting principles generally accepted in the United States of America requires management to make estimates and assumptions that affect the amounts reported in the accompanying consolidated financial statements. The more significant estimates include valuation of goodwill and intangible assets, useful lives of long-lived assets, allowances for doubtful accounts, inventory valuation, reserves for self-insured workers compensation and health benefits and provision for income taxes. Actual results could differ from those estimates.
70
Mistras Group, Inc. and Subsidiaries
Notes to Consolidated Financial Statements—(continued)
(tabular dollars in thousands, except per share data)
Cash and cash equivalents
The Company considers all highly liquid investments purchased with an original maturity of three months or less to be cash equivalents.
Accounts receivable
Accounts receivable are stated net of an allowance for doubtful accounts and sales allowances. Outstanding accounts receivable balances are reviewed periodically, and allowances are provided at such time that management believes it is probable that such balances will not be collected within a reasonable period of time. The Company extends credit to its customers based upon credit evaluations in the normal course of business, primarily with 30-day terms. Bad debts are provided for based on historical experience and management’s evaluation of outstanding accounts receivable. Accounts are written off when they are deemed uncollectible.
Inventories
Inventories are stated at the lower of cost, as determined by using the first-in, first-out method, or market. Work in process and finished goods inventory include material, direct labor, variable costs and overhead.
Software costs
Costs that are related to the conceptual formulation and design of licensed programs are expensed as research and engineering. For programs the Company licenses to customers, the Company capitalizes costs that are incurred to produce the finished product after technological feasibility has been established. The capitalized amounts are amortized using the straight-line basis over three years, which is the estimated life of the related software. The Company performs periodic reviews to ensure that unamortized program costs remain recoverable from future revenues. Costs to support or service these licensed programs are expensed as the costs are incurred.
The Company capitalizes certain costs that are incurred to purchase or to create and implement internal-use software, which includes software coding, installation, testing and data conversion. Capitalized costs are amortized on a straight-line basis over three years.
Property, plant and equipment
Property, plant and equipment are recorded at cost. Depreciation of property, plant and equipment is computed utilizing the straight-line method over the estimated useful lives of the assets. Amortization of leasehold improvements is computed utilizing the straight-line method over the shorter of the remaining lease term or estimated useful life. The cost and accumulated depreciation and amortization applicable to assets retired or otherwise disposed of are removed from the asset accounts and any gain or loss is included in the consolidated statement of operations. Repairs and maintenance costs are expensed as incurred.
Goodwill and intangible assets
Goodwill represents the excess of the purchase price over the fair value of net assets of the acquired business at the date of acquisition. The Company tests goodwill for impairment annually, in its fiscal fourth quarter, using a two-step process. The first step identifies potential impairment by comparing the fair value of the Company’s reporting units to its carrying value. If the fair value is less than the carrying value, the second step measures the amount of impairment, if any. The impairment loss is the amount by which the carrying amount of goodwill exceeds the implied fair value of that goodwill. There was no impairment of goodwill for the years ended May 31, 2010, 2009 and 2008.
Intangible assets are recorded at cost. Intangible assets with finite lives are amortized on a straight-line basis over their estimated useful lives.
71
Mistras Group, Inc. and Subsidiaries
Notes to Consolidated Financial Statements—(continued)
(tabular dollars in thousands, except per share data)
Impairment of long-lived assets
The Company reviews the recoverability of its long-lived assets on a periodic basis in order to identify business conditions which may indicate a possible impairment. The assessment for potential impairment is based primarily on the Company’s ability to recover the carrying value of its long-lived assets from expected future undiscounted cash flows. If the total expected future undiscounted cash flows are less than the carrying amount of the assets, a loss is recognized for the difference between fair value (computed based upon the expected future discounted cash flows) and the carrying value of the assets.
Shipping and handling costs
Shipping and handling costs are included in cost of revenues.
Taxes collected from customers
Taxes collected from customers and remitted to governmental authorities are presented in the consolidated statements of operations on a net basis.
Research and engineering
Research and product development costs are expensed as incurred.
Advertising, promotions and marketing
The costs for advertising, promotion and marketing programs are expensed as incurred and are included in selling, general and administrative expenses. Advertising expense was approximately $0.8 million, $0.5 million and $0.3 million for fiscal 2010, 2009 and 2008, respectively.
Fair value of financial instruments
The Company includes disclosure of fair value information about financial instruments, whether or not recognized in the balance sheet, for which it is practicable to estimate that fair value. The carrying amounts of cash and cash equivalents, accounts receivable, accounts payable and other current assets and liabilities approximate fair value based on the short-term nature of the accounts. The fair value of the Company’s debt and capital lease obligations at May 31, 2010 was approximately $1.2 million lower than carrying value. The Company estimated fair value using a discounted cash flow analysis using pricing for similar debt arrangements in an active market.
Foreign currency translation
The financial position and results of operations of the Company’s foreign subsidiaries are measured using their functional currency, which in all cases presently, is the local currency. Assets and liabilities of the foreign subsidiaries are translated into the U.S. dollar at the exchange rates in effect at the balance sheet date. Income and expenses are translated at the average exchange rate during the year. Translation gains and losses are reported as a component of other comprehensive income for the period and included in accumulated other comprehensive income within stockholders’ equity. Foreign currency transaction gains and losses are included in net income and were approximately $0.2 million and $0.2 million in fiscal 2010 and 2009, respectively and not significant in fiscal 2008.
Derivative financial instruments
The Company recognizes its derivatives as either assets or liabilities, measures those instruments at fair value and recognizes the changes in fair value of the derivative in net income or other comprehensive income, as appropriate. The Company has hedged a portion of the variable rate interest payments on debt using interest rate swap contracts to convert variable payments into fixed payments. The Company does not apply hedge accounting to its interest rate swap contracts. Changes in the fair value of these instruments are reported as a component of interest expense.
72
Mistras Group, Inc. and Subsidiaries
Notes to Consolidated Financial Statements—(continued)
(tabular dollars in thousands, except per share data)
Concentration of credit risks
Financial instruments that potentially subject the Company to concentrations of credit risk consist principally of cash and accounts receivable. At times, bank deposits may exceed the limits insured by the Federal Deposit Insurance Corporation. The Company believes it is not exposed to any significant credit risk related to the nonperformance of financial institutions.
The Company sells primarily to large companies, extends reasonably short collection terms, performs credit evaluations and does not require collateral. The Company maintains reserves for potential credit losses.
The Company has one major customer with multiple business units that accounted for 18%, 17%, and 17% of revenues for fiscal 2010, 2009 and 2008, respectively. Accounts receivable from this customer was approximately 10% and 18% of total accounts receivable, net at May 31, 2010 and 2009, respectively.
Self insurance
The Company is self insured for certain losses relating to workers compensation and health benefits claims. The Company maintains third-party excess insurance coverage for all workers compensation and health benefit claims in excess of approximately $0.3 million, to reduce its exposure from such claims. Self-insured losses are accrued when it is probable that an uninsured claim has been incurred but not reported and the amount of the loss can be reasonably estimated at the balance sheet date. Management monitors and reviews all claims and their related liabilities on an ongoing basis.
Stock-based compensation
The Company measures the cost of employee services received in exchange for an award of equity instruments based upon the grant-date fair value of the award. The Company uses the “straight-line” attribution method for allocating compensation costs and recognizes the fair value of each stock option on a straight-line basis over the vesting period of the related awards.
The Company uses the Black-Scholes option-pricing model to estimate the fair value of the stock-based awards as of the grant date. The Black-Scholes model, by its design, is highly complex and dependent upon key data inputs estimated by management. The primary data inputs with the greatest degree of judgment are the expected term of stock-based awards and the estimated volatility of the Company’s common stock price. The Black-Scholes model is sensitive to changes in these two variables. Since the Company’s initial public offering (“IPO”), the expected term of the Company’s stock options is generally determined using the mid-point between the vesting period and the end of the contractual term. Expected stock price volatility is typically based on the daily historical trading data for a period equal to the expected term. Because the Company’s historical trading data only dates back to October 8, 2009, the first trading date after its IPO, the Company has estimated expected volatility using an analysis of the stock price volatility of comparable peer companies. Prior to the Company’s IPO, the exercise price equaled the estimated fair market value of the Company’s common stock, as determined by its board of directors. Since the Company’s IPO, the exercise price of stock option grants is determined using the closing market price of the Company’s common stock on the date of grant.
The fair value of stock based awards was estimated at the date of grant using the Black-Scholes option-pricing model with the following range of assumptions for the years ended May 31, 2010, 2009 and 2008, respectively;
|
2010
|
2009
|
2008
|
|||||||
|
Dividend yield
|
0.0 | % | 0.0 | % | 0.0 | % | |||
|
Expected volatility
|
44 | % | 41 | % | 38 | % | |||
|
Risk-free interest rate
|
1.9%-3.0 | % | 3.3 | % | 5.0 | % | |||
|
Expected term (years)
|
4.0-6.3 | 4.0 | 4.0 | ||||||
73
Mistras Group, Inc. and Subsidiaries
Notes to Consolidated Financial Statements—(continued)
(tabular dollars in thousands, except per share data)
All stock-based awards granted to employees prior to June 1, 2006 were accounted for under the intrinsic value method and were fully vested as of May 31, 2008. The pro-forma effect on the Company’s net income for the year ended May 31, 2008 had the fair value method been utilized is as follows:
|
Year Ended
May 31, 2008
|
||||
|
Net income
|
$ | 7,439 | ||
|
Less: Share-based compensation expense under the fair value method, net of income taxes
|
239 | |||
|
Proforma net income
|
$ | 7,200 | ||
Income taxes
Income taxes are accounted for under the asset and liability method. Deferred income tax assets and liabilities are recognized for the future tax consequences attributable to differences between the financial statement carrying amounts of existing assets and liabilities and their respective tax bases and tax credit carry-forwards. Deferred income tax assets and liabilities are measured using enacted tax rates expected to apply to taxable income in the years in which those temporary differences are expected to be recovered or settled. The effect on deferred income tax assets and liabilities of a change in tax rates is recognized in income in the period that includes the enactment date. A valuation allowance is provided if it is more likely than not that some or all of the deferred income tax asset will not be realized.
Income tax accounting standards prescribe a minimum recognition threshold a tax position is required to meet before being recognized in the financial statements. These standards also provide guidance on de-recognition, measurement, and classification of amounts relating to uncertain tax positions, accounting for and disclosure of interest and penalties, accounting in interim periods and disclosures required. Interest and penalties are recognized as incurred within “provision for income taxes” in the consolidated statements of operations.
Comprehensive income
Comprehensive income is defined to include all changes in equity, except those resulting from investments by stockholders and distribution to stockholders, and is reported in the statement of stockholders’ equity (deficit). Included in the Company’s comprehensive income are net income and foreign currency translation adjustments.
Recent accounting pronouncements
In January 2010, the FASB issued amendments to its fair value guidance which requires additional disclosures that include: (i) separate disclosures on significant transfers into and out of Level 3; (ii) the amount of transfers between Level 1 and Level 2 and the reasons for such transfers; (iii) lower level of disaggregation for fair value disclosures by class rather than by major category and (iv) additional details on the valuation techniques and inputs used to determine Level 2 and Level 3 measurements. The Company has included these additional disclosures within this Annual Report on Form 10-K.
In October 2009, the FASB issued guidance on revenue recognition related to multiple-element arrangements. The new guidance requires companies to allocate revenue in multiple-element arrangements based on an element’s estimated selling price if vendor-specific or other third party evidence of value is not available. This guidance is effective prospectively for revenue arrangements entered into or materially modified in fiscal years beginning on or after June 15, 2010. Early adoption is permitted retrospectively from the beginning of an entity’s fiscal year. The Company does not expect this adoption will have a significant impact on the financial statements of the Company.
74
Mistras Group, Inc. and Subsidiaries
Notes to Consolidated Financial Statements—(continued)
(tabular dollars in thousands, except per share data)
3. Earnings per share
Basic earnings per share are computed by dividing net income by the weighted-average number of shares outstanding during the period. Diluted earnings per share are computed by dividing net income by the sum of (1) the weighted-average number of shares of common stock outstanding during the period, and (2) the dilutive effect of the assumed exercise of stock options using the treasury stock method. For the fiscal year ended May 31, 2010, the amount of net income (numerator) used in the computation of diluted earnings per share did not include preferred stock accretion as such accretion provided an anti-dilutive effect. With respect to the number of weighted-average shares outstanding (denominator), diluted shares reflects: i) the exercise of options to acquire common stock to the extent that the options’ exercise prices are less than the average market price of common shares during the period and ii) the conversion of the weighted average number of preferred shares outstanding during the period. For the fiscal years ended May 31, 2009 and 2008, there was no difference in the amount of net income (numerator) used in the computation of basic and diluted earnings per share. With respect to the number of weighted-average shares outstanding (denominator), diluted shares reflects only the exercise of options to acquire common stock to the extent that the options’ exercise prices are less than the average market price of common shares during the period.
The following table sets forth the computations of basic and diluted earnings (loss) per share:
|
For the years ended May 31,
|
||||||||||||
|
2010
|
2009
|
2008
|
||||||||||
|
Basic earnings (loss) per share
|
||||||||||||
|
Numerator:
|
||||||||||||
|
Net income (loss) attributable to common shareholders
|
$ | 16,928 | $ | (21,648 | ) | $ | (25,433 | ) | ||||
|
Denominator
|
||||||||||||
|
Weighted average common shares outstanding
|
21,744 | 13,000 | 13,000 | |||||||||
|
Basic earnings (loss) per share
|
$ | 0.78 | $ | (1.67 | ) | $ | (1.96 | ) | ||||
|
Diluted earnings (loss) per share:
|
||||||||||||
|
Numerator:
|
||||||||||||
|
Net income (loss) attributable to common shareholders
|
$ | 10,429 | $ | (21,648 | ) | $ | (25,433 | ) | ||||
|
Denominator
|
||||||||||||
|
Weighted average common shares outstanding
|
21,744 | 13,000 | 13,000 | |||||||||
|
Dilutive effect of stock options outstanding
|
298 | — | — | |||||||||
|
Dilutive effect of conversion of preferred shares
|
2,388 | |||||||||||
|
Total shares
|
24,430 | 13,000 | 13,000 | |||||||||
|
Diluted earnings (loss) per share
|
$ | 0.43 | $ | (1.67 | ) | $ | (1.96 | ) | ||||
The following weighted-average common shares and equivalents related to options outstanding under the Company’s stock option plans and the conversion of its outstanding preferred stock conversion were excluded from the computation of diluted earnings (loss) per share as the effect would have been anti-dilutive:
|
For the years ended May 31,
|
||||||||||||
|
2010
|
2009
|
2008
|
||||||||||
|
Common stock equivalents attributable to stock options outstanding
|
387 | 556 | 345 | |||||||||
|
Common stock equivalents attributable to conversion of preferred shares
|
— | 6,759 | 6,759 | |||||||||
|
Total shares
|
387 | 7,315 | 7,104 | |||||||||
75
Mistras Group, Inc. and Subsidiaries
Notes to Consolidated Financial Statements—(continued)
(tabular dollars in thousands, except per share data)
4. Accounts receivable and allowance for doubtful accounts
An allowance for doubtful accounts is provided against accounts receivable for amounts management believes may be uncollectible. Changes in the allowance for doubtful accounts are represented by the following:
|
2010
|
2009
|
2008
|
||||||||||
|
Balance, beginning of year
|
$ | 3,303 | $ | 1,332 | $ | 1,309 | ||||||
|
Increase due to acquistions
|
— | 43 | — | |||||||||
|
Provision for doubtful accounts
|
525 | 2,097 | 376 | |||||||||
|
Write-offs, net of recoveries
|
(2,180 | ) | (81 | ) | (353 | ) | ||||||
|
Foreign exchange valuation
|
13 | (88 | ) | — | ||||||||
|
Balance, end of year
|
$ | 1,661 | $ | 3,303 | $ | 1,332 | ||||||
In January 2009, a customer filed to reorganize under Chapter 11 of the U.S Bankruptcy Code. Total pre-petition accounts receivable from this customer as of May 31, 2010 was approximately $2.3 million. As of May 31, 2010, the Company wrote off approximately $2.0 million, or 84% of the pre-petition balance. This customer is expected to emerge from Chapter 11 during the Company’s fiscal year ending 2011.
5. Inventories
Inventories consist of the following at May 31, 2010 and 2009:
|
2010
|
2009
|
|||||||
|
Raw materials
|
$ | 2,564 | $ | 2,832 | ||||
|
Work in process
|
2,252 | 1,782 | ||||||
|
Finished goods
|
2,655 | 2,635 | ||||||
|
Supplies
|
1,265 | 1,305 | ||||||
| $ | 8,736 | $ | 8,554 | |||||
Inventories are net of reserves for slow-moving and obsolete inventory of approximately $0.9 million and $0.6 million at May 31, 2010 and 2009, respectively.
76
Mistras Group, Inc. and Subsidiaries
Notes to Consolidated Financial Statements—(continued)
(tabular dollars in thousands, except per share data)
6. Property, plant and equipment, net
Property, plant and equipment consist of the following at May 31, 2010 and 2009:
|
Useful Life
(Years)
|
2010
|
2009
|
||||||||||
|
Land
|
$ | 1,304 | $ | 1,295 | ||||||||
|
Building and improvements
|
30-40 | 10,240 | 9,836 | |||||||||
|
Office furniture and equipment
|
5-8 | 1,479 | 1,624 | |||||||||
|
Machinery and equipment
|
5-7 | 68,238 | 54,898 | |||||||||
| 81,261 | 67,653 | |||||||||||
|
Accumulated depreciation and amortization
|
41,280 | 31,106 | ||||||||||
| $ | 39,981 | $ | 36,547 | |||||||||
Depreciation and amortization expense was $10.9 million, $8.8 million and $7.3 million for the years ended May 31, 2010, 2009 and 2008, respectively.
7. Goodwill
The changes in the carrying amount of goodwill, substantially all of which relates to our Services segment (Note 20), at May 31, 2010 and 2009 are as follows:
|
2010
|
2009
|
|||||||
|
Balance, beginning of year
|
$ | 38,642 | $ | 28,627 | ||||
|
Goodwill acquired during the year
|
5,189 | 10,830 | ||||||
|
Post-acquisition adjustments
|
393 | (500 | ) | |||||
|
Foreign currency translation
|
91 | (315 | ) | |||||
|
Balance, end of year
|
$ | 44,315 | $ | 38,642 | ||||
8. Acquisitions
In recent years, the Company has made several acquisitions for strategic market expansion, including the addition of trained technical professionals. These acquisitions were not significant, individually or in the aggregate. Assets and liabilities of the acquired businesses are initially recorded based on their estimated fair value on the date of acquisition. The results of operations for each of the entities have been included in the consolidated financial statements from the respective dates of acquisition.
For acquisitions completed subsequent to June 1, 2009, the Company measures, at fair value as of the acquisition date, assets acquired, liabilities assumed, and any noncontrolling interest in the acquiree. The Company also recognizes contingent consideration at fair value as of the acquisition date, expenses acquisition-related costs as incurred and, as applicable, recognized in-process research and development costs as indefinite-lived intangible assets. In addition, any excess of the fair value of net assets acquired over purchase price and any subsequent changes in estimated contingencies are recognized in earnings. For acquisitions completed prior to June 1, 2009, the total purchase price was allocated to the assets and liabilities based on their fair values at the acquisition date.
77
Mistras Group, Inc. and Subsidiaries
Notes to Consolidated Financial Statements—(continued)
(tabular dollars in thousands, except per share data)
The Company made three acquisitions during Fiscal 2010, two of which were completed in July 2009, and one which was completed in November 2009. Revenues included in the 2010 Consolidated Statement of Operations from these acquisitions for the period subsequent to the closing of each respective transaction was approximately $24.7 million. On a pro forma basis from the beginning of fiscal 2010, revenues from these acquisitions would have been approximately $29.2 million. Operating income or other financial measures for these acquisitions both from the date of closing of each respective transaction and on a pro forma basis is impractical to estimate due to the integration of these entities post-acquisition.
|
2010
|
2009
|
2008
|
||||||||||
|
Number of entities
|
3 | 5 | 7 | |||||||||
|
Total cost:
|
||||||||||||
|
Cash paid
|
$ | 14,350 | $ | 10,464 | $ | 15,535 | ||||||
|
Subordinated notes issued
|
5,399 | 7,343 | 8,137 | |||||||||
|
Other consideration, primarily obligations under covenants not to compete
|
687 | 471 | 3,151 | |||||||||
|
Debt assumed
|
— | 1,475 | 1,175 | |||||||||
| 20,436 | 19,753 | 27,998 | ||||||||||
|
Current assets acquired
|
939 | 697 | 2,052 | |||||||||
|
Property, plant and equipment
|
5,124 | 4,244 | 3,369 | |||||||||
|
Deferred tax asset
|
1,067 | — | — | |||||||||
|
Intangibles, primarily customer lists
|
8,239 | 3,982 | 8,842 | |||||||||
|
Goodwill
|
5,067 | 10,830 | 13,735 | |||||||||
| $ | 20,436 | $ | 19,753 | $ | 27,998 | |||||||
Conditional consideration is contingent on the acquired entity achieving certain revenue and profit targets during calendar and fiscal years ending 2009 thru 2011. Upon achievement, conditional consideration payments may be made in accordance with each specific agreement in the form of direct payments or in the form of a note payable. The Company also entered into certain finite at-will employment, or consulting agreements with the owners or managers of these companies.
In addition to the above, the Company acquired a patent in 2008 that will be used in developing new product sales as well as be used by the Services segment. The purchase price for the patent and certain related inventory and equipment was approximately $0.7 million. In connection with this patent purchase, the Company is obligated for royalty payments on sales generated by the technology developed or licensed for six years until November 2013. No such payments were made in fiscal 2010, 2009 or 2008.
9. Intangible assets
The gross carrying amount and accumulated amortization of intangible assets at May 31, 2010 and 2009 are as follows:
|
2010
|
2009
|
|||||||||||||||||||||||||||
|
Useful Life
(Years)
|
Gross
Amount
|
Accumulated Amortization
|
Net Carrying Amount
|
Gross
Amount
|
Accumulated
Amortization
|
Net Carrying Amount
|
||||||||||||||||||||||
|
Software
|
3-5 | $ | 5,343 | $ | 4,166 | $ | 1,177 | $ | 5,230 | $ | 4,334 | $ | 896 | |||||||||||||||
|
Customer lists
|
5-7 | 27,191 | 14,256 | 12,935 | 19,541 | 11,869 | 7,672 | |||||||||||||||||||||
|
Coventants not to compete
|
2-5 | 7,075 | 5,709 | 1,366 | 6,471 | 4,425 | 2,046 | |||||||||||||||||||||
|
Other
|
2-5 | 3,704 | 3,094 | 610 | 3,312 | 1,977 | 1,335 | |||||||||||||||||||||
| $ | 43,313 | $ | 27,225 | $ | 16,088 | $ | 34,554 | $ | 22,605 | $ | 11,949 | |||||||||||||||||
78
Mistras Group, Inc. and Subsidiaries
Notes to Consolidated Financial Statements—(continued)
(tabular dollars in thousands, except per share data)
Amortization expense for the years ended May 31, 2010, 2009 and 2008 was $4.2 million, $3.8 million and $4.1 million, respectively, including amortization of software for the years ended May 31, 2010, 2009 and 2008 of $0.5 million, $0.7 million, and $0.6 million, respectively.
The following is the approximate amount of amortization expense in each of the years ending subsequent to May 31, 2010:
|
2011
|
$ | 4,078 | ||
|
2012
|
3,124 | |||
|
2013
|
2,671 | |||
|
2014
|
2,437 | |||
|
2015
|
2,241 | |||
|
Thereafter
|
1,537 | |||
|
Total
|
$ | 16,088 |
10. Accrued expenses and other current liabilities
Accrued expenses and other current liabilities consist of the following at May 31, 2010 and 2009:
|
2010
|
2009
|
|||||||
|
Accrued salaries, wages and related employee benefits
|
$ | 8,158 | $ | 5,992 | ||||
|
Other accrued expenses
|
2,739 | 6,111 | ||||||
|
Accrued worker compensation and health benefits
|
8,041 | 6,982 | ||||||
|
Deferred revenues
|
1,151 | 1,414 | ||||||
|
Total
|
$ | 20,089 | $ | 20,499 | ||||
11. Long-term debt
Long-term debt consists of the following at May 31, 2010 and 2009:
|
2010
|
2009
|
|||||||
|
Senior credit facility:
|
||||||||
|
Revolver
|
$ | — | $ | 15,505 | ||||
|
Term loans
|
— | 36,319 | ||||||
|
Notes payable
|
11,023 | 12,113 | ||||||
|
Other
|
971 | 2,314 | ||||||
| 11,994 | 66,251 | |||||||
|
Less: Current maturities
|
6,303 | 14,390 | ||||||
|
Long-term debt, net of current maturities
|
$ | 5,691 | $ | 51,861 | ||||
79
Mistras Group, Inc. and Subsidiaries
Notes to Consolidated Financial Statements—(continued)
(tabular dollars in thousands, except per share data)
Senior credit facility
On July 22, 2009, the Company entered into its current credit agreement with Bank of America, N.A., JPMorgan Chase Bank, N.A., TD Bank, N.A. and Capital One, N.A., which provided for a $25.0 million term loan and a $55.0 million secured revolving credit facility. The proceeds from this transaction were used to repay the outstanding indebtedness of the former credit facility and to fund acquisitions.
The outstanding principal balance of the term loan was subsequently repaid in October 2009 in connection with the Company’s IPO and may not be re-borrowed under the current credit agreement. The Company also repaid the outstanding balance of the revolving credit facility but may re-borrow the revolving credit facility at any time during the term of the agreement. Borrowings made under the revolving credit facility are payable on July 21, 2012. In December 2009, the Company signed an amendment to its current credit agreement that, among other things, adjusted certain affirmative and negative covenants including delivery of financial statements, the minimum consolidated debt service coverage ratio, the procedures for obtaining lender approval for acquisitions and the removal of the minimum EBITDA requirement.
Under the amended agreement, borrowings under the credit agreement bear interest at the LIBOR or base rate, at the Company’s option, plus an applicable LIBOR margin ranging from 1.75% to 3.25%, or base rate margin ranging from -0.50% to 0.50%, and a market disruption increase of between 0% and 1.0%, if the lenders determine its applicable.
Notes payable and other
In connection with acquisitions it has made through fiscal 2010, the Company issued subordinated notes payable to the sellers and assumed certain other notes payable. These notes generally mature three years from the date of acquisition with interest rates ranging from 3% to 7%. The Company has discounted these obligations to reflect a 5.5% to 10.0% imputed interest. Unamortized discount on the notes was approximately $0.3 million and $0.2 million as of May 31, 2010 and 2009, respectively. Amortization is recorded as interest expense in the consolidated statements of operations. Payments under these various acquisition obligations are made either monthly or quarterly.
Scheduled principal payments due under all borrowing agreements in each of the five years and thereafter subsequent to May 31, 2010 are as follows:
|
2011
|
$ | 6,303 | ||
|
2012
|
3,264 | |||
|
2013
|
1,762 | |||
|
2014
|
322 | |||
|
2015
|
50 | |||
|
Thereafter
|
293 | |||
|
Total
|
$ | 11,994 |
80
Mistras Group, Inc. and Subsidiaries
Notes to Consolidated Financial Statements—(continued)
(tabular dollars in thousands, except per share data)
12. Financial instruments
The Company hedged a portion of the variable rate interest payments on debt using interest rate swap contracts to convert variable payments into fixed payments. The Company does not apply hedge accounting to its interest rate swap contracts. Changes in the fair value of these instruments are reported as a component of interest expense. The Company repaid all of its variable rate debt in October 2009. In November 2009, an interest rate swap with a notional amount of $8.0 million matured. The Company has an additional interest rate swap that remains outstanding with a notional amount of $8.0 million and a fair value of ($210) thousand which is recorded in accrued expenses and other current liabilities in the consolidated balance sheet as of May 31, 2010. The following outlines the significant terms of the contracts at May 31, 2010 and 2009, respectively,:
|
Contract date
|
Term
|
Notional
Amount
|
Variable interest
rate
|
Fixed interest rate
|
2010
|
2009
|
||||||||||||||
|
November 20, 2006
|
4 years
|
$ | 8,000 |
LIBOR
|
5.17 | % | $ | (210 | ) | $ | (199 | ) | ||||||||
|
November 30, 2006
|
3 years
|
8,000 |
LIBOR
|
5.05 | % | — | (517 | ) | ||||||||||||
| $ | 16,000 | $ | (210 | ) | $ | (716 | ) | |||||||||||||
The Company classifies its interest rate swaps at fair value in the following categories:
|
Level 1—Quoted prices in active markets for identical assets or liabilities.
|
|
|
Level 2—Inputs other than quoted market prices in active markets that are observable for the asset or liability, either directly or indirectly, such as quoted prices for similar assets and liabilities in active markets; quoted prices for identical or similar assets or liabilities in markets that are not active; or other inputs that are observable or can be corroborated by observable market data by correlation or other means.
|
|
|
Level 3—Unobservable inputs that are supported by little or no market activity and that are significant to the fair value of the assets or liabilities.
|
The fair value of the Company’s interest rate swap liability, approximately $0.2 million at May 31, 2010, was determined using quoted prices in an active market and was classified as a Level 1 liability within the fair value hierarchy.
13. Obligations under capital leases
The Company leases certain office space, including its headquarters, and service equipment under capital leases, requiring monthly payments ranging from $1 thousand to $62 thousand, including effective interest rates that range from approximately 5% to 14% expiring through May 2015. The net book value of assets under capital lease obligations is $14.0 million and $15.6 million at May 31, 2010 and 2009, respectively.
Scheduled future minimum lease payments subsequent to May 31, 2010 are as follows:
|
2011
|
$ | 6,193 | ||
|
2012
|
4,519 | |||
|
2013
|
2,815 | |||
|
2014
|
2,128 | |||
|
2015
|
694 | |||
|
Thereafter
|
— | |||
|
Total Minimum Lease Payments
|
16,349 | |||
|
Less: amount representing interest
|
1,780 | |||
|
Present value of minimum lease payments
|
14,569 | |||
|
Less: current portion of obligations under capital leases
|
5,370 | |||
|
Obligations under capital leases, net of current portion
|
$ | 9,199 |
81
Mistras Group, Inc. and Subsidiaries
Notes to Consolidated Financial Statements—(continued)
(tabular dollars in thousands, except per share data)
14. Commitments and contingencies
Operating leases
The Company is party to various noncancelable lease agreements, primarily for its international and domestic office and lab space. Minimum future lease payments under noncancelable operating leases in each of the five years subsequent to May 31, 2010 are as follows:
|
2011
|
$ | 2,837 | ||
|
2012
|
2,085 | |||
|
2013
|
1,673 | |||
|
2014
|
1,066 | |||
|
2015
|
605 | |||
|
Thereafter
|
6 | |||
|
Total
|
$ | 8,272 |
Total rent expense was $3.2 million, $3.1 million, and $2.4 million for the years ended May 31, 2010, 2009 and 2008, respectively.
Litigation
The Company is subject to periodic lawsuits, investigations and claims that arise in the ordinary course of business. Although the Company cannot predict with certainty the ultimate resolution of lawsuits, investigations and claims asserted against it, the Company does not believe that any currently pending legal proceeding to which the Company is a party will have a material adverse effect on its business, results of operations, cash flows or financial condition, except as disclosed below. The costs of defense and amounts that may be recovered in such matters may be covered by insurance.
The Company is a defendant in two related purported class action lawsuits in California, based upon violations of California labor and employment law. The first case, Quiroz v. Mistras Group, Inc., et al, U.S. District Court, Central District of California (Case No. CV09-7146 PSG), was originally filed in California State court in September 2009, and was removed to Federal Court. This matter was a purported class action case on behalf of existing and former California employees of the Company and its subsidiaries for violation of various labor and employment laws, primarily for failure to pay wages timely and for having defective wage statements, as well as other claims, and is seeking penalties under the California Private Attorneys General Act. In March 2010, the plaintiff’s request to certify the case as a class action suit was denied. The Plaintiffs have sought to remand the case back to California State Court, but the Federal Court has retained jurisdiction.
The second case is Ballard v. Mistras Group, Inc., et al, U.S. District Court, Central District of California (Case No. 2:10-cv-03186 (PSG)), filed in late March 2010 in California State Court and removed to Federal court. This matter is also a purported class action case, based on substantially identical claims as the Quiroz case, and was filed by the same attorney representing the plaintiff in the Quiroz case, approximately two weeks after class action certification was denied in Quiroz. The plaintiff is attempting to remand this case back to California State Court and is seeking class action certification.
The Company has agreed to mediation for the Quiroz and Ballard cases together, which is currently scheduled for September 2010. The Company and the plaintiffs in Quiroz and Ballard, with the Judge’s approval, have delayed all further hearings on motions and other matters until after the mediation.
At the present time, the Company is unable to determine the likely outcome or reasonably estimate the amount or range of potential liability related to these cases, and accordingly, has not established any reserves for these matters. An unfavorable outcome in these matters could have a material adverse effect on our financial position and results of operations.
82
Mistras Group, Inc. and Subsidiaries
Notes to Consolidated Financial Statements—(continued)
(tabular dollars in thousands, except per share data)
Acquisition related
The Company is liable for contingent consideration in connection with its acquisitions (See Note 8).
15. Employee benefit plans
The Company provides a 401(k) savings plan for eligible U.S. based employees. Employee contributions are discretionary up to the IRS limits each year and catch up is allowed for employees 50 years of age or older. Under the 401(k) plan, employees become eligible to participate on the 1st day of the month after six months of continuous service. Under this plan, the Company matches 50% of the employee’s contributions up to 6% of the employee’s annual compensation, as defined by the plan. There is a five-year vesting schedule for the Company match. The Company’s contribution to the plan was approximately $1.4 million, $1.0 million and $0.8 million for the years ended May 31, 2010, 2009 and 2008, respectively.
The Company participates with other employers in contributing to a union plan, which covers certain U.S. based union employees. The plan is not administered by the Company and contributions are determined in accordance with provisions of a collective bargaining agreement. The Company’s contributions to the plan were approximately $0.5 million, $0.3 million, and $0.1 million for the years ended May 31, 2010, 2009 and 2008, respectively. The Company has benefit plans covering certain employees in selected foreign countries. Amounts charged to expense under these plans were not significant in any year.
16. Income taxes
Income before provision for income taxes is as follows:
|
For the years ended May 31,
|
||||||||||||
|
2010
|
2009
|
2008
|
||||||||||
|
Income before provision for income taxes from:
|
||||||||||||
|
U.S. operations
|
$ | 14,557 | $ | 6,426 | $ | 11,399 | ||||||
|
Foreign operations
|
2,422 | 3,785 | 1,428 | |||||||||
|
Earnings before income taxes
|
$ | 16,979 | $ | 10,211 | $ | 12,827 | ||||||
83
Mistras Group, Inc. and Subsidiaries
Notes to Consolidated Financial Statements—(continued)
(tabular dollars in thousands, except per share data)
The provision for income taxes consists of the following:
|
For the years ended May 31,
|
||||||||||||
|
2010
|
2009
|
2008
|
||||||||||
|
Current
|
||||||||||||
|
Federal
|
$ | 3,797 | $ | 2,079 | $ | 4,088 | ||||||
|
States and local
|
1,044 | 860 | 472 | |||||||||
|
Foreign
|
890 | 1,379 | 416 | |||||||||
|
Reserve for uncertain tax positions
|
(112 | ) | 94 | 75 | ||||||||
|
Total current
|
5,619 | 4,412 | 5,051 | |||||||||
|
Deferred
|
||||||||||||
|
Federal
|
883 | 275 | (71 | ) | ||||||||
|
States and local
|
453 | (12 | ) | 248 | ||||||||
|
Foreign
|
(230 | ) | (142 | ) | (33 | ) | ||||||
|
Total deferred
|
1,106 | 121 | 144 | |||||||||
|
Net change in valuation allowance
|
(198 | ) | 25 | 185 | ||||||||
|
Net deferred
|
908 | 146 | 329 | |||||||||
|
Provision for income taxes
|
$ | 6,527 | $ | 4,558 | $ | 5,380 | ||||||
The provision for income taxes differs from the amount computed by applying the statutory federal tax rate to income tax as follows:
|
For the years ended May 31,
|
||||||||||||||||||||||||
|
2010
|
2009
|
2008
|
||||||||||||||||||||||
|
Federal tax at statutory rate
|
$ | 5,943 | 35.0 | % | $ | 3,472 | 34.0 | % | $ | 4,489 | 35.0 | % | ||||||||||||
|
State taxes, net of federal benefit
|
987 | 5.8 | % | 560 | 5.5 | % | 468 | 3.7 | % | |||||||||||||||
|
Foreign tax at lower rates
|
(189 | ) | (1.1 | %) | (37 | ) | (0.4 | %) | (117 | ) | (0.9 | %) | ||||||||||||
|
Permanent differences
|
255 | 1.5 | % | 414 | 4.1 | % | 76 | 0.6 | % | |||||||||||||||
|
Other
|
(271 | ) | (1.6 | %) | 124 | 1.2 | % | 279 | 2.1 | % | ||||||||||||||
|
Change in valuation allowance
|
(198 | ) | (1.2 | %) | 25 | 0.2 | % | 185 | 1.4 | % | ||||||||||||||
|
Total provision for income taxes
|
$ | 6,527 | 38.4 | % | $ | 4,558 | 44.6 | % | $ | 5,380 | 41.9 | % | ||||||||||||
84
Mistras Group, Inc. and Subsidiaries
Notes to Consolidated Financial Statements—(continued)
(tabular dollars in thousands, except per share data)
Deferred income tax attributes resulting from differences between financial accounting amounts and income tax basis of assets and liabilities at May 31 are as follows:
|
For the years ended May 31,
|
||||||||||||
|
2010
|
2009
|
2008
|
||||||||||
|
Deferred income tax assets
|
||||||||||||
|
Allowance for doubtful accounts
|
$ | 539 | $ | 1,074 | $ | 386 | ||||||
|
Inventory
|
393 | 236 | 261 | |||||||||
|
Intangible assets
|
4,314 | 3,607 | 3,064 | |||||||||
|
Accrued expenses
|
1,848 | 451 | 536 | |||||||||
|
Net operating loss carryforward
|
595 | 442 | 285 | |||||||||
|
Capital lease obligation
|
998 | 1,187 | 1,372 | |||||||||
|
Other
|
219 | 472 | 413 | |||||||||
|
Deferred income tax assets
|
8,906 | 7,469 | 6,317 | |||||||||
|
Valuation allowance
|
(13 | ) | (210 | ) | (185 | ) | ||||||
|
Net deferred income tax assets
|
8,893 | 7,259 | 6,132 | |||||||||
|
Deferred income tax liabilities
|
||||||||||||
|
Property and equipment
|
(5,015 | ) | (3,419 | ) | (2,629 | ) | ||||||
|
Goodwill
|
(2,613 | ) | (2,658 | ) | (2,003 | ) | ||||||
|
Intangible assets
|
(277 | ) | — | (564 | ) | |||||||
|
Other
|
(886 | ) | (788 | ) | — | |||||||
|
Deferred income tax liabilities
|
(8,791 | ) | (6,865 | ) | (5,196 | ) | ||||||
|
Net deferred income taxes
|
$ | 102 | $ | 394 | $ | 936 | ||||||
At May 31, 2010, the Company has recorded a valuation allowance against certain foreign deferred income tax assets based on its assessment that the respective deferred income tax assets would not be realized as a result of losses incurred in 2009 and certain prior years. As of May 31, 2010, the Company has available state net operating losses of $2.0 million with expiration dates starting in 2011.
A reconciliation of the beginning and ending amounts of unrecognized tax benefits is as follows:
|
Balance at May 31, 2008
|
$ | 639 | ||
|
Additions for tax positions related to fiscal 2009
|
276 | |||
|
Additions for tax positions related to prior years
|
— | |||
|
Settlements
|
— | |||
|
Reductions related to the expiration of statutes of limitations
|
(182 | ) | ||
|
Balance at May 31, 2009
|
733 | |||
|
Additions for tax positions related to fiscal 2010
|
— | |||
|
Additions for tax positions related to prior years
|
204 | |||
|
Settlements
|
— | |||
|
Reductions related to the expiration of statutes of limitations
|
(316 | ) | ||
|
Balance at May 31, 2010
|
$ | 621 |
The Company has recorded the unrecognized tax benefits in Other Long-Term Liabilities in the consolidated balance sheets as of May 31, 2010 and 2009. All of the Company’s unrecognized tax benefits at May 31, 2010, if recognized, would favorably affect the effective tax rate. Interest and penalties related to unrecognized tax benefits are recorded in income tax expense and are not significant for the years ended May 31, 2010 and 2009.
85
Mistras Group, Inc. and Subsidiaries
Notes to Consolidated Financial Statements—(continued)
(tabular dollars in thousands, except per share data)
The Company has not recognized U.S. tax expense on its undistributed international earnings of approximately $1.8 million and $2.5 million for fiscal 2010 and 2009, respectively, since it intends to reinvest the earnings outside the United States for the foreseeable future. Any additional U.S. income taxes incurred would be reduced by available foreign tax credits. If the earnings of such foreign subsidiaries were not indefinitely reinvested, a deferred tax liability would have been required.
17. Stockholders’ equity
Common Stock
In October 2009, the Company completed its initial public offering of 10,000,000 shares of common stock at a price of $12.50 per share. The Company sold 6,700,000 shares. The Company received net proceeds of approximately $74.0 million from the offering. The Company used approximately $68.0 million of the net proceeds to repay the outstanding principal balance of the term loan ($25.0 million), outstanding balance of the revolver ($41.4 million) and accrued interest thereon ($0.1 million) in October 2009, as well as approximately $1.5 million to pay costs and expenses related to the offering. The remaining proceeds (approximately $6.0 million) was used for acquisitions and working capital purposes.
Dividends on common stock will be paid when, and if declared by the board of directors. Each holder of common stock is entitled to vote on all matters and is entitled to one vote for each share held.
Preferred stock
Prior to its IPO in October 2009, the Company completed several private placements of its Class A and Class B preferred stock. These preferred shares included various redemption and conversion features and were reported outside equity and adjusted to fair value, which represented their redemption value at each reporting date. Immediately prior to the IPO, the redemption value was reduced, resulting in an increase to retained earnings (deficit). All of the preferred shares outstanding as of the offering converted to common stock and all accretion recorded through the redemption price formula were credited to additional paid-in capital.
Stock options
In September 2009, the Company’s board of directors and shareholders adopted and approved the 2009 Long-Term Incentive Plan (the “2009 Plan”), which became effective upon the closing of the IPO. Awards may be in the form of stock options, restricted stock and other forms of stock-based incentives, including stock appreciation rights and deferred stock rights. The term of each incentive and non-qualified stock option is ten years. Vesting generally occurs over a period of four years, the expense for which is recorded on a straight-line basis over the requisite service period. As of May 31, 2010, there were approximately 2,286,000 shares reserved underlying options granted under the 2009 Plan and approximately 2,251,000 shares available for future grants under the 2009 Plan.
86
Mistras Group, Inc. and Subsidiaries
Notes to Consolidated Financial Statements—(continued)
(tabular dollars in thousands, except per share data)
Prior to the Company’s IPO in October 2009, the Company had two stock option plans: (i) the 1995 Incentive Stock Option and Restricted Stock Purchase Plan (the “1995 Plan”), and (ii) the 2007 Stock Option Plan (the “2007 Plan”). No additional awards may be granted from these two plans. The Company recognized stock-based compensation expense of approximately $2.6 million, $0.2 million, and $0.3 million for the years ended May 31, 2010, 2009 and 2008, respectively. As of May 31, 2010, there was approximately $10.3 million of unrecognized compensation costs, net of estimated forfeitures, related to stock-based awards which are expected to be recognized over a weighted average period of 3.2 years. The Company received cash proceeds from options exercised during the years ended May 31, 2010 of approximately $0.1 million. The aggregate intrinsic value of options exercised during the year ended May 31, 2010 was approximately $2.2 million. There were no stock option exercises during the years ended May 31, 2009 and 2008, respectively. A summary of the stock option activity and weighted average exercise prices follows (in thousands, except per share amounts):
|
For the years ended May 31,
|
||||||||||||||||||||||||
|
2010
|
2009
|
2008
|
||||||||||||||||||||||
|
Common
Stock
Options
|
Weighted
Average
Exercise
Price
|
Common
Stock
Options
|
Weighted
Average
Exercise
Price
|
Common
Stock
Options
|
Weighted
Average
Exercise
Price
|
|||||||||||||||||||
|
Outsanding at beginning of year:
|
940 | $ | 6.81 | 488 | $ | 3.44 | 247 | $ | 0.38 | |||||||||||||||
|
Granted
|
2,219 | $ | 13.48 | 452 | $ | 10.46 | 267 | $ | 6.53 | |||||||||||||||
|
Exercised
|
(205 | ) | $ | 0.38 | — | $ | — | — | $ | — | ||||||||||||||
|
Expired or forfeited
|
(29 | ) | $ | 9.54 | — | $ | — | (26 | ) | $ | 6.15 | |||||||||||||
|
Outstanding at end of year:
|
2,925 | $ | 12.29 | 940 | $ | 6.81 | 488 | $ | 3.44 | |||||||||||||||
|
Options exercisable at end of year
|
263 | 334 | 212 | |||||||||||||||||||||
|
Weighted average fair value (per share) of options granted during the period
|
$ | 5.10 | $ | 3.74 | $ | 2.39 | ||||||||||||||||||
A summary of stock options outstanding and exercisable as of May 31, 2010 is as follows (in thousands, except per share amounts):
|
Options Outstanding
|
Options Exercisable
|
||||||||||||||||||||
|
Range of Exercise Prices
|
Total
Options Outstanding
|
Weighted Average
Remaining
Life (Years)
|
Weighted Average
Exercise
Price
|
Number Exercisable
|
Weighted Average
Exercise
Price
|
||||||||||||||||
| $0.38 - $6.15 | 250 | 6.8 | $ | 5.18 | 146 | $ | 4.48 | ||||||||||||||
| $6.16 - 14.67 | 2,675 | 9.2 | $ | 12.96 | 117 | $ | 10.40 | ||||||||||||||
| 2,925 | 263 | ||||||||||||||||||||
|
Aggregate Intrinsic Value
|
$ | 2,418 | $ | 1,281 | |||||||||||||||||
As of May 31, 2010, there were approximately 2,925,000 options outstanding, net of estimated forfeitures, that had vested or are expected to vest. The weighted-average exercise price of these options was $12.29 per option; the weighted-average remaining contractual life of these options was 8.7 years; and the aggregate intrinsic value of these options was approximately $2.4 million.
19. Related party transactions
The Company leases its headquarters under a capital lease (Note 13) from a shareholder and officer of the Company requiring monthly payments through October 2014. Total rent payments made during fiscal 2010 were approximately $0.8 million.
87
Mistras Group, Inc. and Subsidiaries
Notes to Consolidated Financial Statements—(continued)
(tabular dollars in thousands, except per share data)
The Company has a lease for office space located in France, which is partly owned by a shareholder and officer, requiring monthly payment through January 2016. Total rent payment made during fiscal 2010 were approximately $0.2 million.
20. Segment disclosure
The Company’s three segments are:
|
●
|
Services. This segment provides asset protection solutions in North and Central America with the largest concentration in the United States.
|
|
●
|
Products and Systems. This segment designs, manufactures, sells, installs and services the Company’s asset protection products and systems, including equipment and instrumentation, predominantly in the United States.
|
|
●
|
International. This segment offers services, products and systems similar to those of our other segments to global markets, principally in Europe, the Middle East, Africa, Asia and South America, but not to customers in China and South Korea, which are served by our Products and Systems segment.
|
General corporate services, including accounting, audit, and contract management, are provided to the segments which are reported as intersegment transactions within corporate and eliminations. Sales to the International segment from the Products and Systems segment and subsequent sales by the International segment of the same items are recorded and reflected in the operating performance of both segments. Additionally, engineering charges and royalty fees charged to the Services and International segments by the Products and Systems segment are reflected in the operating performance of each segment. All such intersegment transactions are eliminated in corporate and eliminations.
The accounting policies of the reportable segments are the same as those described in the summary of significant accounting policies in Note 2. Segment income from operations is determined based on internal performance measures used by the Chief Executive Officer, the chief operating decision maker, to assess the performance of each business in a given period and to make decisions as to resource allocations. In connection with that assessment, the Chief Executive Officer may exclude items such as charges for stock-based compensation and certain other acquisition-related charges and balances, technology and product development costs, certain gains and losses from dispositions, and litigation settlements or other charges. Certain general and administrative costs such as human resources, information technology and training are allocated to the segments. Segment income from operations also excludes interest and other financial charges and income taxes. Corporate and other assets are comprised principally of cash, deposits, property, plant and equipment, domestic deferred taxes, deferred charges and other assets. Corporate loss from operations consists of depreciation on the corporate office facilities and equipment, administrative charges related to corporate personnel and other charges that cannot be readily identified for allocation to a particular segment.
Selected consolidated financial information by segment for the periods shown was as follows:
|
Years ended May 31,
|
||||||||||||
|
2010
|
2009
|
2008
|
||||||||||
|
Revenues (1)
|
||||||||||||
|
Services
|
$ | 227,782 | $ | 167,543 | $ | 116,027 | ||||||
|
Products and Systems
|
18,875 | 17,310 | 16,675 | |||||||||
|
International
|
30,920 | 29,165 | 23,727 | |||||||||
|
Corporate and eliminations
|
(5,449 | ) | (4,885 | ) | (4,161 | ) | ||||||
| $ | 272,128 | $ | 209,133 | $ | 152,268 | |||||||
88
Mistras Group, Inc. and Subsidiaries
Notes to Consolidated Financial Statements—(continued)
(tabular dollars in thousands, except per share data)
Revenues by operating segment includes intercompany transactions, which are eliminated in corporate and eliminations.
The Services segment had sales to other operating segments of $0.5 million, $0.1 million and $0.1 million for fiscal 2010, 2009 and 2008, respectively.
The Products and Systems segment had sales to other operating segments of $4.4 million, $3.9 million and $3.6 million for fiscal 2010, 2009 and 2008, respectively.
The International segment had sales to other operating segments of $0.6 million, $0.3 million and $0.2 million for fiscal 2010, 2009 and 2008, respectively.
|
Years ended May 31,
|
||||||||||||
|
2010
|
2009
|
2008
|
||||||||||
|
Gross profit
|
||||||||||||
|
Services
|
$ | 61,963 | $ | 48,480 | $ | 36,301 | ||||||
|
Products and Systems
|
9,915 | 8,476 | 8,829 | |||||||||
|
International
|
11,668 | 12,602 | 9,932 | |||||||||
|
Corporate and eliminations
|
(408 | ) | (292 | ) | (231 | ) | ||||||
| $ | 83,138 | $ | 69,266 | $ | 54,831 | |||||||
|
Years ended May 31,
|
||||||||||||
|
2010
|
2009
|
2008
|
||||||||||
|
Income from operations
|
||||||||||||
|
Services
|
$ | 22,614 | $ | 13,681 | $ | 14,649 | ||||||
|
Products and Systems
|
2,572 | 1,664 | 2,723 | |||||||||
|
International
|
3,008 | 4,091 | 2,408 | |||||||||
|
Corporate and eliminations
|
(7,297 | ) | (4,611 | ) | (3,422 | ) | ||||||
| $ | 20,897 | $ | 14,825 | $ | 16,358 | |||||||
Operating income by operating segment includes intercompany transactions, which are eliminated in corporate and eliminations.
|
Years ended May 31,
|
||||||||||||
|
2010
|
2009
|
2008
|
||||||||||
|
Depreciation and amortization
|
||||||||||||
|
Services
|
$ | 12,862 | $ | 10,603 | $ | 9,529 | ||||||
|
Products and Systems
|
887 | 1,038 | 1,017 | |||||||||
|
International
|
1,308 | 900 | 861 | |||||||||
|
Corporate and eliminations
|
126 | 95 | 16 | |||||||||
| $ | 15,183 | $ | 12,636 | $ | 11,423 | |||||||
89
Mistras Group, Inc. and Subsidiaries
Notes to Consolidated Financial Statements—(continued)
(tabular dollars in thousands, except per share data)
|
As of May 31,
|
||||||||
|
2010
|
2009
|
|||||||
|
Intangible assets, net
|
||||||||
|
Services
|
$ | 14,042 | $ | 9,686 | ||||
|
Products and Systems
|
1,016 | 1,127 | ||||||
|
International
|
504 | 710 | ||||||
|
Corporate and eliminations
|
526 | 426 | ||||||
| $ | 16,088 | $ | 11,949 | |||||
|
As of May 31,
|
||||||||
|
2010
|
2009
|
|||||||
|
Goodwill
|
||||||||
|
Services
|
$ | 42,804 | $ | 37,141 | ||||
|
Products and Systems
|
— | — | ||||||
|
International
|
1,511 | 1,501 | ||||||
|
Corporate and eliminations
|
— | — | ||||||
| $ | 44,315 | $ | 38,642 | |||||
|
As of May 31,
|
||||||||
|
2010
|
2009
|
|||||||
|
Long-lived assets
|
||||||||
|
Services
|
$ | 91,040 | $ | 75,197 | ||||
|
Products and Systems
|
3,837 | 4,553 | ||||||
|
International
|
4,957 | 5,137 | ||||||
|
Corporate and eliminations
|
550 | 2,717 | ||||||
| $ | 100,384 | $ | 87,604 | |||||
Fiscal 2010 capital expenditures for the Services segment, Products and Systems segment and International segment were approximately $6.0 million, $0.3 million, and $1.1 million, respectively.
|
As of May 31,
|
||||||||
|
2010
|
2009
|
|||||||
|
Total assets
|
||||||||
|
Services
|
$ | 148,462 | $ | 121,973 | ||||
|
Products and Systems
|
13,533 | 13,677 | ||||||
|
International
|
19,163 | 16,250 | ||||||
|
Corporate and eliminations
|
7,474 | 1,533 | ||||||
| $ | 188,632 | $ | 153,433 | |||||
90
Mistras Group, Inc. and Subsidiaries
Notes to Consolidated Financial Statements—(continued)
(tabular dollars in thousands, except per share data)
Revenues by geographic area
Net revenues by geographic area for the fiscal years ended May 31, 2010, 2009 and 2008 were as follows:
|
Years ended May 31,
|
||||||||||||
|
2010
|
2009
|
2008
|
||||||||||
|
Revenues
|
||||||||||||
|
United States
|
$ | 223,808 | $ | 162,815 | $ | 118,316 | ||||||
|
Other Americas
|
16,366 | 16,293 | 6,641 | |||||||||
|
Europe
|
20,454 | 20,692 | 16,914 | |||||||||
|
Asia-Pacific
|
11,500 | 9,333 | 10,397 | |||||||||
| $ | 272,128 | $ | 209,133 | $ | 152,268 | |||||||
No individual foreign country’s revenues or long-lived assets were material for disclosure purposes.
21. Subsequent event
Subsequent to the fiscal 2010, the Company acquired two unrelated entities to continue its strategic efforts in market expansion. The total cost of the acquisitions was approximately $6.9 million, of which approximately $5.3 million was paid in cash and the balance by the issuance of subordinated seller notes. The notes are payable over three years and bear interest at rates ranging from 0% to 3.5%. The Company is in the process of completing the preliminary purchase price allocations, which includes potential future contingent purchase price adjustments. In connection with the acquisitions, the Company has also entered into finite at-will consulting and employment agreements with certain sellers.
These acquisitions were not, individually or in the aggregate, significant.
In June 2010, the Company acquired land near Houston, Texas for the purposes of building a new regional headquarters. The cost of the land was approximately $0.9 million. While the Company has not yet entered into any agreements with respect to the construction of the new facility, the cost of construction is currently estimated at $3.3 million, which will likely be financed.
On July 12, 2010, Francis T. Joyce was appointed Executive Vice President, Chief Financial Officer and Treasurer of the Company, replacing the Company’s retiring CFO, Paul “Pete” Peterik. Mr. Peterik will remain with the Company for a period of time to assist with the transition.
91
Mistras Group, Inc. and Subsidiaries
Notes to Consolidated Financial Statements—(continued)
(tabular dollars in thousands, except per share data)
22. Selected quarterly financial information (unaudited)
The following is a summary of the quarterly results of operations for the years ended May 31, 2010 and 2009 (in thousands, except per share amounts):
|
Fiscal quarter ending
|
May 31,
2010
|
February 28,
2010
|
November 30,
2009
|
August 31,
2009
|
May 31,
2009
|
February 28,
2009
|
November 30,
2008
|
August 31,
2008
|
||||||||||||||||||||||||
|
(in thousands)
|
||||||||||||||||||||||||||||||||
|
Revenues
|
$ | 79,784 | $ | 64,356 | $ | 71,899 | $ | 56,089 | $ | 55,860 | $ | 47,001 | $ | 59,275 | $ | 46,997 | ||||||||||||||||
|
Cost of Revenues
|
51,780 | 43,984 | 46,248 | 36,468 | 35,358 | 31,607 | 35,676 | 28,526 | ||||||||||||||||||||||||
|
Depreciation
|
2,659 | 2,745 | 2,635 | 2,471 | 2,490 | 2,290 | 2,061 | 1,859 | ||||||||||||||||||||||||
|
Gross Profit
|
25,345 | 17,627 | 23,016 | 17,150 | 18,012 | 13,104 | 21,538 | 16,612 | ||||||||||||||||||||||||
|
Selling, general and administrative expense
|
13,920 | 14,110 | 13,686 | 13,133 | 12,464 | 11,943 | 11,153 | 10,896 | ||||||||||||||||||||||||
|
Research and engineering
|
884 | 586 | 449 | 483 | 521 | 484 | 481 | 463 | ||||||||||||||||||||||||
|
Depreciation and amortization
|
1,115 | 1,299 | 1,214 | 1,045 | 819 | 891 | 798 | 1,428 | ||||||||||||||||||||||||
|
Legal settlement
|
— | — | — | (297 | ) | (40 | ) | 89 | 1,915 | 136 | ||||||||||||||||||||||
|
Acquisition-related costs
|
614 | — | — | — | — | — | — | — | ||||||||||||||||||||||||
|
Income from operations
|
8,812 | 1,632 | 7,667 | 2,786 | 4,248 | (303 | ) | 7,191 | 3,689 | |||||||||||||||||||||||
|
Net income (loss)
|
$ | 5,278 | $ | 774 | $ | 3,562 | $ | 815 | $ | 1,502 | $ | (788 | ) | $ | 3,235 | $ | 1,517 | |||||||||||||||
In the fourth quarter ended May 31, 2010, the Company made adjustments to its cost of revenues, depreciation and amortization, research and engineering, and selling, general and administrative expenses, all of which impacted its tax provision. These adjustments related to prior quarterly and fiscal year periods; however, they were not material to any prior period. In total, these items increased net income by approximately $0.9 million. The quarterly tables and segment data presented in Note 20 were impacted as follows:
|
Adjustments — Fiscal Quarter Ended May 31, 2010
|
||||||||||||||||||||
|
Services1
|
Products and Systems2
|
International
|
Corporate and Eliminations3
|
Total
|
||||||||||||||||
|
Cost of Revenues
|
$ | 881 | $ | — | $ | — | $ | — | $ | 881 | ||||||||||
|
Depreciation
|
— | 130 | — | — | 130 | |||||||||||||||
|
Gross profit
|
881 | 130 | — | — | 1,011 | |||||||||||||||
|
Selling, general and administrative expenses
|
219 | — | — | 471 | 690 | |||||||||||||||
|
Research and Engineering
|
— | (260 | ) | — | — | (260 | ) | |||||||||||||
|
Depreciation and amortization
|
— | — | — | — | — | |||||||||||||||
|
Income from operations
|
$ | 1,100 | $ | (130 | ) | $ | — | $ | 471 | $ | 1,441 | |||||||||
|
Net income
|
$ | 887 | ||||||||||||||||||
|
1
|
Related to adjustments to the Company’s liability for workers’ compensation claims.
|
|
2
|
Related to adjustments to overhead estimates for internally developed software.
|
|
3
|
Related to a reclassification of prior period foreign currency transactions from accumulated other comprehensive income to net income.
|
92
|
Changes in and Disagreements with Accountants on Accounting and Financial Disclosure
|
None.
|
Controls and Procedures
|
Evaluation of Disclosure Controls and Procedures.
Under the supervision and with the participation of our senior management, including our chief executive officer and chief financial officer, we conducted an evaluation of the effectiveness of the design and operation of our disclosure controls and procedures, as defined in Rules 13a-15(e) and 15d-15(e) under the Securities Exchange Act of 1934, as amended (the “Exchange Act”), as of the end of the period covered by this Annual Report (the “Evaluation Date”). Based on this evaluation, our chief executive officer and chief financial officer concluded as of the Evaluation Date that our disclosure controls and procedures were effective such that the information relating to the Company, including consolidated subsidiaries, required to be disclosed in our Securities and Exchange Commission (“SEC”) reports (i) is recorded, processed, summarized and reported within the time periods specified in SEC rules and forms, and (ii) is accumulated and communicated to the Company’s management, including our chief executive officer and chief financial officer, as appropriate to allow timely decisions regarding required disclosure.
Internal Control over Financial Reporting
This annual report does not include a report of management’s assessment regarding internal control over financial reporting or an attestation report of the Company’s registered public accounting firm due to a transition period established by rules of the Securities and Exchange Commission for newly public companies.
Changes in Internal Control Over Financial Reporting
There have been no changes in our internal control over financial reporting during the quarterly period ended May 31, 2010 that have materially affected, or are reasonably likely to materially affect, our internal control over financial reporting.
|
Other Information
|
None.
|
DIRECTORS, EXECUTIVE OFFICERS AND CORPORATE GOVERNANCE
|
Directors
The information required by Item 10 is incorporated herein by reference to the information contained under the caption “Corporate Governance” in our definitive proxy statement related to the 2010 annual meeting of stockholders.
Executive Officers
The information concerning our executive officers required by this Item 10 is provided under the caption “Executive Officers of the Registrant” in Part I hereof.
Section 16(a) Beneficial Ownership Reporting Compliance
The information concerning Section 16(a) Beneficial Ownership Reporting Compliance by our directors and executive officers is incorporated by reference to the information contained under the caption “Section 16(a) Beneficial Ownership Reporting Compliance” in our definitive proxy statement related to the 2010 annual meeting of stockholders.
93
Code of Ethics
The information concerning our Code of Ethics is incorporated by reference to the information contained under the caption “Governance of the Company—in our definitive proxy statement related to the 2010 annual meeting of stockholders.
|
EXECUTIVE COMPENSATION
|
The information required by this Item 11 is incorporated by reference to the information contained in our definitive proxy statement related to the 2010 annual meeting of stockholders.
|
SECURITY OWNERSHIP OF CERTAIN BENEFICIAL OWNERS AND MANAGEMENT AND RELATED STOCKHOLDER MATTERS
|
The information required by Item 12 regarding Security Ownership of Certain Beneficial Owners and Manaagement and Related Stockholders is incorporated by reference to the information contained in our definitive proxy statement related to the 2010 annual meeting of stockholders.
Equity Compensation Plan Information
The following table provides certain information as of May 31, 2010 concerning the shares of our common stock that may be issued under existing equity compensation plans.
|
Plan Category
|
Number of Securities to be Issued Upon Exercise of Outstanding Options
|
Weighted Average Exercise Price of Outstanding Options
|
Number of Securities Remaining Available for Future Issuance Under Equity Compensation Plans
|
|||||||||
|
Equity Compensation Plans Approved by Security Holders (1)
|
2,294,900 | $ | 12.29 | 2,251,318 | ||||||||
|
Equity Compensation Plans Not Approved by Security Holders
|
— | — | — | |||||||||
|
Total
|
2,294,900 | 12.29 | 2,251,318 | |||||||||
| (1) | Includes all the Company’s plans: 1995 Incentive Stock Option and Restricted Stock Plan, 2007 Stock Option Plan and 2009 Long-Term Incentive Plan. |
|
CERTAIN RELATIONSHIPS AND RELATED TRANSACTIONS, AND DIRECTOR INDEPENDENCE
|
The information required by Item 13 is incorporated by reference to the information contained in our definitive proxy statement related to the 2010 annual meeting of stockholders.
|
PRINCIPAL ACCOUNTANT FEES AND SERVICES
|
The information required by Item 14 is incorporated by reference to the information contained in our definitive proxy statement related to the 2010 annual meeting of stockholders.
94
|
EXHIBITS AND FINANCIAL STATEMENT SCHEDULES
|
(a) DOCUMENTS FILED AS PART OF THIS REPORT
(1) The following financial statements are included:
|
Page
|
||
|
64
|
||
| 65 | ||
|
65
|
||
|
66
|
||
|
67
|
||
|
68
|
||
|
69
|
(2) Exhibits:
|
Exhibit No.
|
Description
|
|
|
3.1
|
Second Amended and Restated Certificate of Incorporation (filed as exhibit 3.1 to Registration Statement on Form S-1 (Amendment No. 4) filed on September 21, 2009 (Registration No. 333-151559) and incorporated herein by reference)
|
|
|
3.2
|
Amended and Restated Bylaws (filed as exhibit 3.2 to Registration Statement on Form S-1 (Amendment No. 4) filed on September 21, 2009 (Registration No. 333-151559) and incorporated herein by reference)
|
|
|
10.1
|
Form of Indemnification Agreement for directors and officers (filed as exhibit 10.1 to Registration Statement on Form S-1 (Amendment No. 4) filed on September 21, 2009 (Registration No. 333-151559) and incorporated herein by reference)
|
|
|
10.2
|
Amended and Restated Credit Agreement (filed as exhibit 10.2 to Registration Statement on Form S-1 (Amendment No. 4) filed on September 21, 2009 (Registration No. 333-151559) and incorporated herein by reference)
|
|
|
10.3
|
Second Amended and Restated Credit Agreement dated as of July 22, 2009 (filed as exhibit 10.3 to Registration Statement on Form S-1 (Amendment No. 5) filed on September 23, 2009 (Registration No. 333-151559) and incorporated herein by reference)
|
|
|
10.4
|
Amendment dated as of December 14, 2009, to the Second Amended and Restated Credit Agreement (filed as exhibit 10.1 to Current Report on Form 8-K filed December 18, 2009 and incorporated herein by reference)
|
|
|
10.5
|
Employment Agreement between the Company and Sotirios J. Vahaviolos (filed as exhibit 10.4 to Registration Statement on Form S-1 (Amendment No. 4) filed on September 21, 2009 (Registration No. 333-151559) and incorporated herein by reference)
|
|
|
10.6
|
1995 Incentive Stock Option and Restricted Stock Purchase Plan (filed as exhibit 99.1 to the Registration Statement on Form S-8 filed on February 3, 2010 (Registration No. 333-164688) and incorporated herein by reference)
|
|
|
10.7
|
2007 Stock Option Plan and form of Stock Option Agreement (filed as exhibit 10.5 to Registration Statement on Form S-1 (Amendment No. 4) filed on September 21, 2009 (Registration No. 333-151559) and incorporated herein by reference)
|
|
|
10.8
|
2009 Long-Term Incentive Plan (filed as exhibit 10.6 to Registration Statement on Form S-1 (Amendment No. 4) filed on September 21, 2009 (Registration No. 333-151559) and incorporated herein by reference).
|
95
|
10.9
|
Form of 2009 Long-Term Incentive Plan Stock Option Agreement (filed as exhibit 10.7 to Registration Statement on Form S-1 (Amendment No. 4) filed on September 21, 2009 (Registration No. 333-151559) and incorporated herein by reference)
|
|
|
10.10
|
Form of 2009 Long-Term Incentive Plan Restricted Stock Agreement (filed as exhibit 10.8 to Registration Statement on Form S-1 (Amendment No. 4) filed on September 21, 2009 (Registration No. 333-151559) and incorporated herein by reference)
|
|
|
21.1
|
Subsidiaries of the Registrant
|
|
|
23.1
|
Consent of PricewaterhouseCoopers LLP
|
|
|
24.1
|
Power of Attorney (included as part of the signature page to this report)
|
|
|
31.1
|
Certification of Chief Executive Officer pursuant to Rule 13a-14(a) under the Securities Exchange Act of 1934
|
|
|
31.2
|
Certification of Principal Financial Officer pursuant to Rule 13a-14(a) under the Securities Exchange Act of 1934
|
|
|
32.1
|
Certification pursuant to Section 906 of the Sarbanes-Oxley Act of 2002
|
|
| 32.2 |
Certification pursuant to Section 906 of the Sarbanes-Oxley Act of 2002
|
96
Pursuant to the requirements of Section 13 or 15(d) of the Securities Exchange Act of 1934, the registrant has duly caused this report to be signed on its behalf by the undersigned, thereunto duly authorized.
|
MISTRAS GROUP, INC.
|
|||
|
By:
|
/s/ SOTIRIOS VAHAVIOLOS
|
||
|
Sotirios Vahaviolos
|
|||
|
Chairman, President and Chief Executive Officer
|
|||
Date: August 16 , 2010
We, the undersigned directors and officers of Mistras Group, Inc., hereby severally constitute Sotirios J. Vahaviolos, Francis T. Joyce and Michael C. Keefe, and each of them singly, as our true and lawful attorneys with full power to each of them to sign for us, in our names in the capacities indicated below, any and all amendments to this Annual Report on Form 10-K filed with the Securities and Exchange Commission.
This power of attorney may only be revoked by a written document executed by the under signed that expressly revokes this power by referring to the date and subject hereof.
Pursuant to the requirements of the Securities Exchange Act of 1934, this report has been signed below by the following persons on behalf of the Registrant and in the capacities and on the dates indicated.
|
Signature
|
Title
|
Date
|
||
|
/s/ Sotirios J. Vahaviolos
|
Director, Chairman, President and Chief
|
August 16 , 2010
|
||
|
Sotirios J. Vahaviolos
|
Executive Officer (Principal Executive Officer)
|
|||
|
/s/ Paul Peterik
|
Principal Financial and Accounting Officer
|
August 16 , 2010
|
||
|
Paul Peterik
|
||||
|
/s/ Elizabeth A. Burgess
|
Director
|
August 16 , 2010
|
||
|
Elizabeth A. Burgess
|
||||
|
/s/ Daniel M. Dickinson
|
Director
|
August 16 , 2010
|
||
|
Daniel M. Dickinson
|
||||
|
/s/ James J. Forese
|
Director
|
August 16 , 2010
|
||
|
James J. Forese
|
||||
|
/s/ Richard H. Glanton
|
Director
|
August 16 , 2010
|
||
|
Richard H. Glanton
|
||||
|
/s/ Michael J. Lange
|
Director and Group Executive
|
August 16 , 2010
|
||
|
Michael J. Lange
|
Vice President, Services
|
|||
|
/s/ Manuel N. Stamatakis
|
Director
|
August 16 , 2010
|
||
|
Manuel N. Stamatakis
|
97