Attached files
| file | filename |
|---|---|
| EXCEL - IDEA: XBRL DOCUMENT - Mistras Group, Inc. | Financial_Report.xls |
| EX-32.1 - EX-32.1 - Mistras Group, Inc. | a14-14283_1ex32d1.htm |
| EX-32.2 - EX-32.2 - Mistras Group, Inc. | a14-14283_1ex32d2.htm |
| EX-21.1 - EX-21.1 - Mistras Group, Inc. | a14-14283_1ex21d1.htm |
| EX-23.2 - EX-23.2 - Mistras Group, Inc. | a14-14283_1ex23d2.htm |
| EX-31.2 - EX-31.2 - Mistras Group, Inc. | a14-14283_1ex31d2.htm |
| EX-10.11 - EX-10.11 - Mistras Group, Inc. | a14-14283_1ex10d11.htm |
| EX-23.1 - EX-23.1 - Mistras Group, Inc. | a14-14283_1ex23d1.htm |
| EX-10.12 - EX-10.12 - Mistras Group, Inc. | a14-14283_1ex10d12.htm |
| EX-31.1 - EX-31.1 - Mistras Group, Inc. | a14-14283_1ex31d1.htm |
| EX-10.13 - EX-10.13 - Mistras Group, Inc. | a14-14283_1ex10d13.htm |
UNITED STATES SECURITIES AND EXCHANGE COMMISSION
Washington, D.C. 20549
Form 10-K
ANNUAL REPORT PURSUANT TO SECTION 13 OR 15(d) OF THE
SECURITIES EXCHANGE ACT OF 1934
For the fiscal year ended May 31, 2014
Commission File Number 001-34481
Mistras Group, Inc.
(Exact name of registrant as specified in its charter)
|
Delaware |
|
22-3341267 |
|
(State or other jurisdiction of |
|
(I.R.S. Employer |
195 Clarksville Road
Princeton Junction, New Jersey 08550
(609) 716-4000
(Address, including zip code, and telephone number, including area code, of registrant’s principal executive offices)
Securities registered pursuant to Section 12(b) of the Act:
|
Title of each class |
|
Name of each exchange on which registered |
|
Common Stock, par value $.01 par value |
|
New York Stock Exchange |
Securities registered pursuant to Section 12(g) of the Act: None
Indicate by check mark whether the registrant is a well-known seasoned issuer, as defined in Rule 405 of the Securities Act of 1933. Yes o No x
Indicate by check mark if the registrant is not required to file reports pursuant to Section 13 or Section 15(d) of the Securities Exchange Act of 1934 (the “Exchange Act”). Yes o No x
Indicate by check mark whether the registrant (1) has filed all reports required to be filed by Section 13 or 15(d) of the Exchange Act during the preceding 12 months (or for such shorter period that the registrant was required to file such reports), and (2) has been subject to such filing requirements for the past 90 days. Yes x No o
Indicate by check mark whether the registrant has submitted electronically and posted on its corporate Web site, if any, every Interactive Data File required to be submitted and posted pursuant to Rule 405 of Regulation S-T during the preceding 12 months (or for such shorter period that the registrant was required to submit and post such files). Yes x No o
Indicate by check mark if disclosure of delinquent filers pursuant to Item 405 of Regulation S-K is not contained herein, and will not be contained, to the best of Registrant’s knowledge, in definitive proxy or information statements incorporated by reference in Part III of this Form 10-K or any amendment to this Form 10-K. o
Indicate by check mark whether the registrant is a large accelerated filer, an accelerated filer, a non-accelerated filer or a smaller reporting company. See the definitions of “large accelerated filer,” “accelerated filer” and “smaller reporting company” in Rule 12b-2 of the Exchange Act. (Check one):
|
Large accelerated filer o |
|
Accelerated filer x |
|
|
|
|
|
Non-accelerated filer o |
|
Smaller reporting company o |
Indicate by check mark whether the registrant is a shell company (as defined in Rule 12b-2 of the Exchange Act). Yes o No x
The aggregate market value of the voting and non-voting common stock held by non-affiliates of the Registrant as of November 30, 2013, based upon the closing price of the common stock as reported by New York Stock Exchange on such date was approximately $340.6 million.
As of August 1, 2014, a total of 28,456,303 shares of the Registrant’s common stock were outstanding.
DOCUMENTS INCORPORATED BY REFERENCE
Information required by Part III (Items 10, 11, 12, 13 and 14) is incorporated by reference to portions of the registrant’s definitive Proxy Statement for its 2014 Annual Meeting of Shareholders (the “Proxy Statement”), which is expected to be filed not later than 120 days after the registrant’s fiscal year ended May 31, 2014. Except as expressly incorporated by reference, the Proxy Statement shall not be deemed to be a part of this report on Form 10-K.
MISTRAS GROUP, INC.
ANNUAL REPORT ON FORM 10-K
FORWARD-LOOKING STATEMENTS
This Report on Form 10-K contains forward-looking statements regarding us and our business, financial condition, results of operations and prospects within the meaning of Section 27A of the Securities Act of 1933 (Securities Act), and Section 21E of the Securities Exchange Act of 1934 (Exchange Act). Such forward-looking statements include those that express plans, anticipation, intent, contingency, goals, targets or future development and/or otherwise are not statements of historical fact. These forward-looking statements are based on our current expectations and projections about future events and they are subject to risks and uncertainties known and unknown that could cause actual results and developments to differ materially from those expressed or implied in such statements.
In some cases, you can identify forward-looking statements by terminology, such as “goals,” “expects,” “anticipates,” “intends,” “plans,” “believes,” “seeks,” “estimates,” “may,” “could,” “should,” “would,” “predicts,” “appears,” “projects,” or the negative of such terms or other similar expressions. Factors that could cause or contribute to differences in results and outcomes from those in our forward-looking statements include, without limitation, those discussed elsewhere in this Report in Part I, Item 1A. “Risk Factors,” Part 2, Item 7, “Management’s Discussion and Analysis of Financial Condition and Results of Operations” and in this Item 1, as well as those discussed in our other Securities and Exchange Commission (SEC) filings. We undertake no obligation to (and expressly disclaim any obligation to) revise or update any forward-looking statements made herein whether as a result of new information, future events or otherwise. However, you should consult any further disclosures we may make on these or related topics in our reports on Form 8-K or Form 10-Q filed with the SEC.
The following discussions should be read in conjunction with the sections of this Report entitled “Management’s Discussion and Analysis of Financial Condition and Results of Operations” and “Risk Factors”.
Our Business
We offer our customers “one source for asset protection solutions” ® and are a leading global provider of technology-enabled asset protection solutions used to evaluate the structural integrity and reliability of critical energy, industrial and public infrastructure. We combine industry-leading products and technologies, expertise in mechanical integrity (MI), Non-Destructive Testing (NDT), Destructive Testing (DT) and predictive maintenance (PdM) services, process and fixed asset engineering and consulting services, proprietary data analysis and our world class enterprise inspection database management and analysis software-PCMS to deliver a comprehensive portfolio of customized solutions, ranging from routine inspections to complex, plant-wide asset integrity management and assessments. These mission critical solutions enhance our customers’ ability to comply with governmental safety and environmental regulations, extend the useful life of their assets, increase productivity, minimize repair costs, manage risk and avoid catastrophic disasters. Given the role our solutions play in ensuring the safe and efficient operation of infrastructure, we have historically provided a majority of our services to our customers on a regular, recurring basis. We serve a global customer base of companies with asset-intensive infrastructure, including companies in the oil and gas (downstream, midstream, upstream and petrochemical), power generation (natural gas, fossil, nuclear, alternative, renewable, and transmission and distribution), public infrastructure, chemicals, commercial aerospace and defense, transportation, primary metals and metalworking, pharmaceutical/biotechnology and food processing industries and research and engineering institutions. As of May 31, 2014, we had approximately 5,300 employees, including approximately 40 Ph.D.’s and 150 other degreed engineers and certified Level III technicians, in approximately 105 offices across 16 countries. We have established long-term relationships as a critical solutions provider to many of the leading companies in our target markets.
Our asset protection solutions continuously evolve over time as we combine the disciplines of NDT, DT, PdM, MI, engineering & consulting services and data analysis and enterprise inspection data management software to provide value to our customers. The foundation of our business is NDT, which is the examination of assets without impacting current and future usefulness or impairing the integrity of these assets. The ability to inspect infrastructure assets and not interfere with their operating performance makes NDT a highly attractive alternative to many traditional intrusive inspection techniques, which may require dismantling equipment or shutting down a plant, mill or site. Our MI services are a systematic engineering-based approach to developing best practices for ensuring the on-going integrity and safety of equipment and industrial facilities. MI services involve conducting an inventory of infrastructure assets, developing and implementing inspection and maintenance procedures, training personnel in executing these procedures and managing inspections, testing and assessments of customer assets. By assisting customers in implementing MI programs we enable them to identify gaps between existing and desired practices, find and track deficiencies and degradations to be corrected and establish quality assurance standards for fabrication, engineering and installation of infrastructure assets. We believe our MI services improve plant safety and reliability and regulatory compliance, and in so doing reduce maintenance costs. Our solutions
also incorporate comprehensive Risk Based Inspection (RBI) data analysis from our proprietary asset protection software to provide customers with detailed, integrated and cost-effective solutions that rate the risks of alternative maintenance approaches and recommend actions in accordance with consensus industry codes and standards and help to establish and support key performance indicators (KPI’s) to ensure continued safe and economic operations.
We differentiate ourselves by delivering these solutions under our “One Source” umbrella, utilizing a proven systematic method that creates a closed loop life cycle for addressing continuous asset protection and improvement. Under this business model, customers outsource their inspection to us on a “run and maintain” basis. As a global asset protection leader, we provide a comprehensive range of solutions that includes:
· traditional and advanced outsourced NDT services conducted by our technicians, mechanical integrity assessments, above-ground storage tank inspection, pipeline inspection and American Petroleum Institute (API) visual inspections and PdM program development;
· destructive testing (DT) is a definitive discipline in material testing, taking specimens through to mechanical failure while examining a host of factors. Hardness, stiffness and strength are a few key indicators drawn from destructive tests per customer specifications. DT is a strength of our subsidiary, Mistras-GMA in Germany, which specializes in an array of destructive testing applications utilized throughout the materials selection and approval process in the aerospace, automotive, chemical, oil & gas and power generation industries.
· advanced asset protection solutions, in most cases involving proprietary acoustic emission (AE), digital radiography, infrared, wireless and/or automated ultrasonic inspections and sensors, which are operated by our highly trained technicians;
· a proprietary and customized portfolio of software products for testing and analyzing data captured in real-time by our technicians and sensors, including advanced features such as pattern recognition and neural networks;
· enterprise software and relational databases to store and analyze inspection data, comparing it to prior operations and testing of similar assets, industrial standards and specific risk conditions, such as use with highly flammable or corrosive materials, and developing asset integrity management plans based on risk-based inspection that specify an optimal schedule for the testing, maintenance and retirement of assets;
· on-line monitoring systems that provide secure web-based remote or on-site asset inspection, real-time reports and analysis of plant or enterprise-wide structural integrity data, comparison of integrity data to our library of historical inspection data and analysis to better assess structural integrity and provide alerts for and prioritize future inspections and maintenance; and
· in-house testing services: Mistras’ in-house inspection services provide cost-effective, efficient solutions that improve the integrity and lifespan of critical assets featuring a dynamic suite of testing and inspection services. With a network of 15 in-house laboratories, Mistras provides a one-stop shop for traditional (NDT), advanced non-destructive testing (ANDT), and destructive testing (DT) of materials and fabricated structures by offering a complete inspection package — from preparation and production all the way to post-processing. These capabilities are available through our state-of-the-art testing equipment and expertise in our grid of in-house testing laboratories across the U.S.A., Canada and Europe.
· full range of engineering consulting services to the downstream and renewable energy sectors that includes plant operations support covering both process and equipment technologies; project planning, management and execution; expert testimony and technical training.
Our labs hold a wide variety of certifications that allow them to perform inspections to meet or exceed stringent regulatory requirements, such as: NADCAP, AS9100/ISO-9001, FAA Repair Station and ITAR/EAR. With these certifications comes a comprehensive range of approvals from Prime Contractors, the military, and internationally renowned products and systems manufactures from aerospace to nuclear energy; transportation to petrochemical industries.
We offer our customers a customized package of services, products and systems, or our enterprise software and other niche high-value products on a stand-alone basis. For example, customers can purchase most of our sensors and accompanying software to integrate with their own systems, or they can purchase a complete turn-key solution, including installation, monitoring and assessment services. Importantly, however, we do not sell certain of our advanced and proprietary software and other products as stand-alone offerings; instead, we embed them in our comprehensive service offerings to protect our investment in intellectual property while providing an added value which generates a substantial source of recurring revenues.
We generated revenues of $623.5 million, $529.3 million and $436.9 million, net income of $22.5 million, $11.6 million and $21.4 million, and adjusted EBITDA of $70.3 million, $68.3 million and $65.2 million for fiscal 2014, 2013 and 2012, respectively. An
explanation of adjusted EBITDA and a reconciliation of these amounts to net income are set forth in Item 7, “Management’s Discussion and Analysis of Financial Condition and Results of Operations”. For fiscal 2014, we generated approximately 71% of our revenues from our Services segment. Our revenues are diversified, with our top ten customers accounting for approximately 38%, 34% and 39% of our revenues during fiscal 2014, 2013 and 2012, respectively.
Asset Protection Industry Overview
Asset protection is a large and rapidly growing industry that consists of NDT inspection, DT inspection, PdM and MI services and inspection data management and analysis. NDT plays a crucial role in assuring the operational and structural integrity and reliability of critical infrastructure without compromising the usefulness of the tested materials or equipment. The evolution of NDT services, in combination with broader industry trends, including increased asset utilization and aging of infrastructure, the desire by companies to extend the useful life of their existing infrastructure, new construction projects, enhanced government regulation and the shortage of certified NDT professionals, have made NDT an integral and increasingly outsourced part of many asset-intensive industries. Well-publicized industrial and public infrastructure failures and accidents such as the Deepwater Horizon oil spill in the Gulf of Mexico and the I-35W Mississippi River bridge collapse in Minnesota continues to raise the level of safety and environmental awareness of regulators, and owners and operators are recognizing the benefits that asset protection solutions can provide.
Historically, NDT solutions predominantly used qualitative testing methods aimed primarily at detecting defects in the tested materials. This methodology, which we categorize as “traditional NDT,” is typically labor intensive and, as a result, considerably dependent upon the availability and skill level of the certified technicians, engineers and scientists performing the inspection services. The traditional NDT market has been highly fragmented, with a significant number of small vendors providing inspection services to divisions of companies or local governments situated in close proximity to the vendor’s field inspection engineers and technicians. The current trend, however, is for customers to look for a select few vendors capable of providing a wider spectrum of asset protection solutions for global infrastructure that we call “one source”. This shift in underlying demand, which began in the early 1990s, has contributed to a transition from traditional NDT solutions to more advanced solutions that employ automated digital sensor technologies and accompanying enterprise software, allowing for the effective capture, storage, analysis and reporting of inspection and engineering results electronically and in digital formats. These advanced techniques, taken together with advances in wired and wireless communication and information technologies, have further enabled the development of remote monitoring systems, asset-management and predictive maintenance capabilities and other data analytics and management. We believe that as advanced asset protection solutions continue to gain acceptance among asset-intensive organizations, those vendors offering broad, complete and integrated solutions, scalable operations and a global footprint will have a distinct competitive advantage. Moreover, we believe that vendors that are able to effectively deliver both advanced solutions and data analytics, by virtue of their access to customers’ data, create a significant barrier to entry for competitors, and lead the opportunity to create significant recurring revenues.
We believe the following represent key dynamics driving the growth of the asset protection industry:
· Extending the Useful Life of Aging Infrastructure. The prohibitive cost and challenge of building new infrastructure has resulted in the significant aging of existing infrastructure and caused companies to seek ways to extend the useful life of existing assets. For example, due to the significant cost associated with constructing new refineries, stringent environmental regulations which have increased the costs of managing them and difficulty in finding suitable locations on which to build them, no major new refineries have been constructed in the United States since 1976. Another example is in the area of power transmission and distribution. The Smart Grid initiative in the United States is causing increased loading on aging transformers that are more than 40 years old in many cases. The need to test and monitor these units to ensure their reliability until replacement is instrumental in support of a reliable Smart Grid network. Because aging infrastructure requires relatively higher levels of maintenance and repair in comparison to new infrastructure, as well as more frequent, extensive and ongoing testing, companies and public authorities are increasing spending to ensure the operational and structural integrity of existing infrastructure.
· Outsourcing of Non-Core Activities and Technical Resource Constraints. The increasing sophistication and automation of NDT programs, together with a decreasing supply of skilled professionals and stricter and increasing governmental regulations, has caused many companies and public authorities to outsource NDT and other services rather than recruit and train such capabilities internally. Owners and operators of infrastructure are increasingly contracting with third party providers that have the necessary technical product portfolio, engineering expertise, technical workforce and proven track record of results-oriented performance to effectively meet their increasing requirements.
· Increasing Asset and Capacity Utilization. Due to high energy prices, the availability of new and inexpensive sources of raw materials, high repair and replacement costs and the limited construction of new infrastructure, existing infrastructure in some of our target markets is being used at higher capacities, causing increased stress and fatigue that accelerate deterioration. These higher prices and costs also motivate our customers to complete repairs, maintenance, replacements and upgrades more quickly. For example, increasing demand for refined petroleum products, combined with high plant
utilization rates, is driving refineries to upgrade facilities to make them more efficient and expand capacity. In order to sustain high capacity utilization rates, customers are increasingly using asset protection solutions to efficiently ensure the integrity and safety of their assets. Implementation of asset protection solutions can also lead to increased productivity as a result of reduced maintenance-related downtime.
· Increasing Corrosion from Low-Quality Inputs. High commodities prices and increasing energy demands have led to the use of lower grade raw materials and feedstock used in refinery and power generation processes. These lower grade raw materials and feedstock, especially in the case of the refining process involving petroleum with higher sulfur content, can rapidly corrode the infrastructure with which they come into contact, which in turn increases the need for asset protection solutions to identify such corrosion and enable infrastructure owners to proactively combat the problems caused by such corrosion.
· Increasing Use of Advanced Materials. Customers in our target markets are increasingly utilizing advanced materials, such as composites, and other unique technologies in the manufacturing and construction of new infrastructure and aerospace applications. As a result, they require advanced testing, assessment and maintenance technologies to inspect and to protect these assets, since many of these advanced materials cannot be tested using traditional NDT techniques. We believe that demand for NDT solutions will increase as companies and public authorities continue to use these advanced materials, not only during the operating phase of the lifecycle of their assets, but also during the design, manufacturing and quality control phases and are more frequently integrating and embedding sensors directly into the end product in support of total life cycle asset management.
· Meeting Safety Regulations. Owners and operators of infrastructure assets increasingly face strict government regulations and safety requirements. Failure to meet these standards can result in significant financial liabilities, increased scrutiny by Occupational Safety and Health Administration (OSHA) and other regulators, higher insurance premiums and tarnished corporate brand value. There have been several industrial accidents, including explosions and fires, in recent years. These accidents created significant damage to the reputation of refineries and coupled with concern by owners, led OSHA to strengthen process safety enforcement standards with the implementation of the National Emphasis Program (NEP) that also extends to chemical plants for compliance with applicable regulations. As a result, these owners and operators are seeking highly reliable asset protection suppliers with a proven track record of providing asset protection services, products and systems to assist them in meeting these increasingly stringent regulations.
· Expanding Addressable End-Markets. Advances in NDT sensor technology and asset protection software based systems, and the continued emergence of new technologies, are creating increased demand for asset protection solutions in applications where existing techniques were previously ineffective. Further, we expect increased demand in relatively new markets, such as the pharmaceutical and food processing industries, where infrastructure is now beginning to age to a point where significant maintenance may be required.
· Expanding Addressable Geographies. We believe that a substantial driver of incremental demand will come from international markets, including Canada, Asia, Europe and Latin America. Specifically, as companies and governments in these markets build and maintain infrastructure and applications that require the use of asset protection solutions, we believe demand for our solutions will increase.
We believe that the market available to us will continue to grow as a result of macro-market trends, including aging infrastructure, use of more advanced materials, such as composites, and the increasing outsourcing of asset protection solutions by companies who historically performed these services using internal resources.
Our Target Markets
Overview
Mistras operates in a highly competitive, but fragmented market. Our primary competitors are divisions of large companies, and many of our other competitors are small independent local companies, limited to a specific product or technology and focused on a niche market or geographic region. We focus our strategic sales, marketing and product development efforts on a range of infrastructure-intensive based industries and governmental authorities. In general, our largest markets in broad terms are energy-related infrastructure where we perform fitness for service inspection and engineering based services on fixed and rotating assets.
There are strong economic indicators that continue to drive our business, especially in the USA domestic markets as indicated by the Energy Information Administration (EIA);
· There is greater upside uncertainty than downside uncertainty in oil and natural gas production; higher production could spur even more industrial growth and lower the use of imported petroleum
· Growing domestic production of natural gas and oil continues to reshape the U.S. energy economy, largely as a result of rising production from tight formations, but the effect could vary substantially depending on expectations about resources and technology.
· Industrial production expands over the next 10 to 15 years as the competitive advantage of low natural gas prices provides a boost to the industrial sector with increasing natural gas use.
The EIA projects domestic crude oil production will increase to 8.5 million barrels per day in 2014 and to 9.3 million barrels per day in 2015. The 2015 forecast would mark the highest annual average level of production since 1972.
From a global perspective the trends are also positive showing a significant increase in the demand for energy. The following represent the expected level of energy investment needs to the year 2035 to meet those demands as released in the 2014 World Energy Investment Outlook from the International Energy Agency (IEA).
· Almost 70% of energy supply investment today is related to fossil fuels, whether in the extraction of oil, gas or coal, their transport to consumers, their transformation along the way (e.g. from crude to refined oil products), or the construction of fossil-fuel fired power plants.
· More than $1.6 trillion is being invested each year in order to provide the world’s consumer with energy, a figure that has more than doubled in real terms since 2000, and an additional $130 billion was spent in 2013 on improving end-use energy efficiency above 2012 levels.
· Almost $1.0 trillion of current energy supply investment is for primary fuel supply, mainly for oil and natural gas, and around $650 billion is in the power sector. Spending on renewable energy sources has risen sharply since 2000 to reach $250 billion in the first half of 2014, 15% of the total.
· Over the period to 2035, the investment required each year to meet the world’s energy needs rises steadily towards $2.0 trillion and annual spending on energy efficiency increases to $550 billion. This means the cumulative global investment of more than $48 trillion.
· Energy supply investment is dominated by the needs of the power sector ($16.4 trillion), followed by oil ($13.7 trillion) and gas ($8.8 trillion). More than half of this is needed just to maintain energy supply at today’s levels.
Our largest market is energy-related infrastructure. We focus our sales, marketing and product development efforts on a range of infrastructure-intensive industries and governmental authorities. With our portfolio of asset protection services, products and systems, we can effectively serve our customer base throughout the lifecycle of their assets, beginning at the design stage, through the construction and maintenance phase and, as necessary, through the decommissioning of their infrastructure.
The increase in world energy demand and prices from 2003 to 2013, combined with concerns about the environmental consequences of greenhouse gas emissions, has led to renewed interest in alternatives to traditional fossil fuels—particularly with the discovery of large shale gas reserves, which are considered by some as a clean energy alternative, has driven the increase in the use of natural gas to fuel gas turbines in combined cycle power generation plants.
Long-term prospects continue to improve for generation from both nuclear and renewable energy sources—supported by government incentives, demand and by higher fossil fuel prices.
Electricity from coal-fired generation, mainly in global emerging markets, is also expected to increase, making coal still the second fastest-growing source for electricity generation. The outlook for coal could be altered substantially by additional constraints and any future legislation that would reduce or limit the release of greenhouse gas emissions related to fossil fuels. There is a progressive shift from traditional gas energy to unconventional gas energy sources.
Revenue by Target Market
The following chart represents the percentage of consolidated revenues we generated from our various markets for fiscal 2014:
Mistras Revenues by Target Market
(Fiscal 2014)
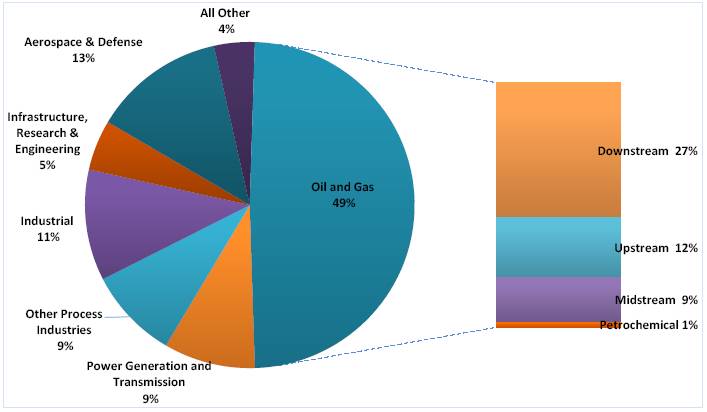
Oil and Gas
Because oil, gas, and coal will continue to be the primary energy sources during this time, the energy industry will have to continue increasing the supply of these fuels to meet this increasing demand. In addition, there were approximately 640 active and 300 inactive crude oil refineries in the world, with 143 refineries operating in the United States. Fluctuating high energy prices are driving consistently high utilization rates at these facilities. With aging infrastructure and growing capacity constraints, asset protection continues to grow as an indispensable tool in maintenance planning, quality control and prevention of catastrophic failure in refineries and petrochemical plants. Recent high oil and lower fossil fuel input prices have placed additional pressure on industry participants to increase capacity, focus on production efficiency and cost reductions and shorten shut-down time or “turnarounds.” Asset protection solutions are used for both off-stream inspections, or inspection when the tested infrastructure is shut-down, and increasingly, on-stream inspections, or inspection when the tested infrastructure is operating at normal levels. While we expect off-stream inspection of vessels and piping during a plant shut-down or turnaround to remain a routine practice by companies in these industries, we expect the areas of greatest future growth to occur as a result of on-stream inspections and monitoring of facilities, such as offshore platforms, transport systems and oil and gas pipeline transmission lines, because of the substantial opportunity costs of shutting them down. On-stream inspection enables companies to avoid the costs associated with shutdowns during testing while enabling the economic and safety advantages of advanced planning or predictive maintenance.
Power Generation and Transmission
Asset protection in the power industry has traditionally been associated with the inspection of high-energy, critical steam piping, boilers, rotating equipment, and various other plant components, utility aerial man-lift devices, large transformer testing and various other applications for nuclear and fossil-fuel based power plants. We believe that in recent years the use of asset protection solutions has grown rapidly in this industry due to the aging of critical power generation and transmission infrastructure. For instance, the average age of a nuclear power plant in the United States is over 30 years. Also driving this segment is the large conversion of tradition coal plant to cleaner burning and more efficient natural gas fired power plants. Furthermore, global demand for power generation and transmission has grown rapidly and is expected to continue, primarily as a result of the energy needs of emerging economies such as China and India. The areas of traditional power generation and transmission on which that we focus our efforts on are natural gas, fossil, nuclear, alternative, renewable, and wind.
Process Industries
The process industries, or industries in which raw materials are treated or prepared in a series of stages, include chemicals, pharmaceuticals, food processing, paper and pulp and metals and mining, have a need for our products and services. As with oil and gas processing facilities, chemical processing facilities require significant spending on maintenance and monitoring. Given their aging infrastructure and high utilization requirements, growing capacity constraints and increasing capital costs, we believe asset protection solutions will continue to grow in importance in maintenance planning, quality and cost control and prevention of catastrophic failure in the chemicals industry. Although the pharmaceuticals and food processing industries have historically not employed asset protection solutions as much as other industries, these industries may increase the use of asset protection solutions throughout their manufacturing and other processes.
Public Infrastructure, Research and Engineering
We believe that high profile infrastructure catastrophes, such as the collapse of the I-35W Mississippi River Bridge in Minneapolis and others since, have caused public authorities to more actively seek ways to prevent similar events from occurring. Public authorities tasked with the construction of new, and maintenance of existing, public infrastructure, including bridges and highways, increasingly use asset protection solutions to test and inspect these assets. Importantly, these authorities now employ asset protection solutions throughout the life of these assets, from their original design and construction, with the use of embedded sensing devices to enable on-line monitoring, through ongoing maintenance requirements. With more than 151,000 bridges in the United States — almost 25 percent — classified as structurally deficient or functionally obsolete by the Federal Highway Agency (FHWA), the need for structural health monitoring has never been greater. An immediate “cost-beneficial” investment aimed at replacing or repairing deficient bridges may cost as much as $70 billion, according to the U.S. Department of Transportation.
This is a target market for our application technology and experience. Over the last ten years, we have provided testing and health monitoring on hundreds of bridges and structures worldwide, among which include some of the largest and well-known bridges in the United Kingdom, California, Pennsylvania and the greater New York metropolitan area. Commencing in fiscal 2011, we provided a continuous on-line Structural Health Monitoring System to the California Department of Transportation that monitored structural integrity of the San Francisco Oakland Bay Bridge while a new bridge was being contracted in parallel to it. We continue to provide these monitoring services on iconic bridges worldwide. We continue to develop products today that incorporate low power energy electronic technology as a result of a $6.9 million project awarded to us and several universities in 2009 under the National Institute of Standards and Technology (NIST) Innovation Program that was intended to bring a transformational impact in the area of civil infrastructure structural health monitoring using affordable self-powered wireless sensors, data collectors and energy harvesting products.
The use of asset protection solutions within the transportation industry is primarily focused in the automotive and rail segments. Within the automotive segment, manufacturers use asset protection solutions throughout the entire design and development process, including the inspection of raw material inputs, during in-process manufacturing and, finally, during end-product testing and analysis. Although asset protection technologies have been utilized in the automobile industry for a number of decades, we believe growth in this market will increase as automobile manufacturers begin to outsource their asset protection requirements and take advantage of new technologies that enable them to more thoroughly inspect their products throughout the manufacturing process, reduce costs and shorten time to market. Within the rail subdivision, asset protection solutions are used primarily to test rails and passenger and tank cars.
Aerospace and Defense
The operational safety, reliability, structural integrity and maintenance of aircraft and associated products is critical to the aerospace and defense industries. Industry participants increasingly use asset protection solutions to perform inspections upon delivery, and also periodically employ asset protection solutions during the operational service of aircraft, using advanced ultrasonic immersion systems or digital radiography in order to precisely detect structural defects. Industry participants also use asset protection solutions for the inspection of advanced composites found in new classes of aircraft, x-ray of critical engine components, ultrasonic fatigue testing of complete aircraft structures, corrosion detection and on-board monitoring of landing gear and other critical components. We expect increased demand for our solutions including our destructive testing business from the aerospace industry to result from wider use of these advanced composites and distributed on-line sensor networks and other embedded analytical applications built into the structure of assets to enable real-time performance monitoring and condition-based maintenance. We serve this rapidly growing target market by providing our state of the art fully integrated inspection systems to original equipment manufacturers (OEMs). For the OEM that prefers to outsource this inspection we provide a full range of in-house services through our four regional facilities that combined have eighteen immersion inspection tank systems and two gantry systems. These facilities have obtained numerous accreditations and certifications required to meet the stringent inspection criteria that this industry demands.
Industrial
The quality control requirements driven by the need for zero to low defect component tolerance within automated robotic intensive industries such as automotive, consumer electronics and medical industries, serve as key drivers for the recent growth of NDT technologies, such as ultrasonics and radiography. We expect that increasingly stringent quality control requirements and competitive forces will drive the demand for more costly finishing and polishing which, in turn, may promote greater use of NDT throughout the production lifecycle.
Our Competitive Strengths
We believe the following competitive strengths contribute to our being a leading provider of asset protection solutions and will allow us to further capitalize on growth opportunities in our industry:
· One Source Provider for Asset Protection Solutions® Worldwide. We believe we have the most comprehensive portfolio of proprietary and integrated asset protection solutions, including inspection and engineering services, products and systems worldwide, which positions us to be the leading single source provider for a customer’s asset protection requirements. Through our network of approximately 105 offices and independent representatives in 16 countries around the world, we offer an extensive portfolio of solutions that enables our customers to consolidate all their inspection and maintenance requirements and the associated data storage and analytics on a single system that spans the customers’ entire enterprise.
· Long-Standing Trusted Provider to a Diversified and Growing Customer Base. By providing critical and reliable NDT services, products and systems for more than 30 years and expanding our asset protection solutions, we have become a trusted partner to a large and growing customer base across numerous infrastructure-intensive industries globally. Our customers include some of the largest and most well-recognized firms in the oil and gas, chemicals, fossil and nuclear power, and aerospace and defense industries as well as some of the largest public authorities.
· Repository of Customer-Specific Inspection Data. Our enterprise data management and analysis software - PCMS, enables us to capture, warehouse, manage and analyze our customers’ testing and inspection data in a centralized relational database. As a result, we have accumulated large amounts of proprietary process data and information that allows us to provide our customers with value-added services, such as benchmarking, risk based inspection, reliability centered maintenance solutions including predictive maintenance, inspection scheduling, data analytics and regulatory compliance.
· Proprietary Products, Software and Technology Packages. We have developed systems that have become the cornerstone of several high value-added unique NDT applications, such as those used for the testing of above-ground storage tanks (the TANKPAC technology package). These proprietary products allow us to efficiently and effectively provide highly valued solutions to our customers’ complex applications, resulting in a significant competitive advantage. In addition to the proprietary products and systems that we sell to customers on a stand-alone basis, we also develop a range of proprietary sensors, instruments, systems and software used exclusively by our Services segment.
· Deep Domain Knowledge and Extensive Industry Experience. We are an industry leader in developing advanced asset protection solutions, including acoustic emission testing for non-intrusive on-line monitoring of storage tanks and pressure vessels, bridges and transformers, portable corrosion mapping, ultrasonic testing (UT) systems, on-line plant asset integrity management with sensor fusion, enterprise software solutions for plant-wide and fleet-wide inspection data archiving and management, advanced and thick composites inspection and ultrasonic phased array inspection of thick wall boilers.
· Collaborating with Our Customers. Our asset protection solutions have historically been designed in response to our customers’ unique performance specifications and are supported by our proprietary technologies. Important technology packages, such as TANKPAC for tank floor corrosion detection, Acoustic Turbine Monitoring System — ACTMS and products such as VPAC for through valve leak testing, were developed in close cooperation and partnership with key Mistras customers. Our sales and engineering teams work closely with our customers’ research and design staff during the design phase in order to incorporate our products into specified infrastructure projects, as well as with facilities maintenance personnel to ensure that we are able to provide the asset protection solutions necessary to meet these customers’ changing demands.
· Experienced Management Team. Our management team has a track record of leadership in NDT, DT, PdM and engineering services, averaging over 20 years’ experience in the industry. These individuals also have extensive experience in growing businesses organically and in acquiring and integrating companies, which we believe is important to facilitate future growth
in the fragmented asset protection industry. In addition, our senior managers are supported by highly experienced project managers who are responsible for delivering our solutions to customers.
Our Growth Strategy
Our growth strategy emphasizes the following key elements:
· Continue to Develop Technology-Enabled Asset Protection Services, Products, Software and Systems. We intend to maintain and enhance our technological leadership by continuing to invest in the internal development of new services, products, software and systems. Our highly trained team of Ph.D.’s, engineers, application software developers and certified technicians has been instrumental in developing numerous significant asset protection standards. We believe their knowledge base will continue to enable us to innovate a wide range of new asset protection solutions.
· Increase Revenues from Our Existing Customers. Many of our customers are multinational corporations with asset protection requirements from multiple divisions at multiple locations across the globe. Currently, we believe we capture a relatively small portion of their overall expenditures on these solutions. We believe our superior services, products and systems, combined with the trend of outsourcing asset protection solutions to a small number of trusted service providers, position us to significantly expand both the number of divisions and locations that we serve as well as the types of solutions we provide. We strive to be the preferred global partner for our customers and aim to become the single source provider for their asset protection solution requirements.
· Add New Customers in Existing Target Markets. Our current customer base represents a small fraction of the total number of companies in most of our target markets with asset protection requirements. Our scale, scope of products and services and expertise in creating technology-enabled solutions have allowed us to build a reputation for high-quality and have increased customer awareness about us and our asset protection solutions. We intend to leverage our reputation and solutions offerings to win new customers within our existing target markets, especially as asset protection solutions are adopted internationally. We intend to continue to leverage our competitive strengths to win new business as customers in our existing target markets continue to seek a single source and trusted provider of advanced asset protection solutions.
· Expand Our Customer Base into New End Markets. We believe we have significant opportunities to expand our customer base in relatively new end markets, including the maritime shipping, nuclear, wind turbine and other alternative energy and natural gas transportation industries and the market for public infrastructure, such as highways and bridges. The expansion of our addressable markets is being driven by the increased recognition and adoption of asset protection services, products and systems, and new NDT technologies enabling further applications in industries such as healthcare and compressed and liquefied natural gas transportation, and the aging of infrastructure, such as construction and loading cranes and ports, to the point where visual inspection has proven inadequate and new asset protection solutions are required. We expect to continue to expand our global sales organization, grow our inspection data management and data mining services and find new high-value applications, such as embedding our sensor technology in assembly lines for electronics and distributed sensor networks for aerospace applications. As companies in these emerging end markets realize the benefits of our asset protection solutions, we expect to expand our leadership position by addressing customer needs and winning new business.
· Continue to Capitalize on Acquisitions. We intend to continue employing a disciplined acquisition strategy to broaden, complement and enhance our product and service offerings, add new customers and certified personnel, expand our sales channels, supplement our internal development efforts and accelerate our expected growth. We believe the market for asset protection solutions is highly fragmented with a large number of potential acquisition opportunities. We have a proven ability to integrate complementary businesses, as demonstrated by the success of our past acquisitions, which have often contributed entirely new products and services that have added to our revenues and profitability. In addition, we often sell our advanced asset protection solutions to customers of companies we acquired that had previously relied on traditional NDT solutions. Importantly, we believe we have improved the operational performance and profitability of our acquired businesses by successfully integrating and selling a comprehensive suite of solutions to the customers of these acquired businesses.
Our Segments
The Company has three operating segments:
· Services. This segment provides asset protection solutions predominantly in North America with the largest concentration in the United States along with a growing Canadian services business, consisting primarily of non-destructive testing, and
inspection and engineering services that are used to evaluate the structural integrity and reliability of critical energy, industrial and public infrastructure.
· Products and Systems. This segment designs, manufactures, sells, installs and services our asset protection products and systems, including equipment and instrumentation, predominantly in the United States.
· International. This segment offers services, products and systems similar to those of our Services and Products and Systems segments to global markets, principally in Europe, the Middle East, Africa, Asia and South America, but not to customers in China and South Korea, which are served by our Products and Systems segment.
For discussion of segment revenues, operating results and other financial information, including geographic areas in which we recorded revenues, see “Management’s Discussion and Analysis of Financial Condition and Results of Operations” in Item 7, as well as Note 20 - Segment Disclosure in the consolidated financial statements in Item 8 of this Report.
Our Solutions
We offer our customers “one source for asset protection solutions” ® and are a leading global provider of technology-enabled asset protection solutions used to evaluate the structural integrity and reliability of critical energy, industrial and public infrastructure. We combine industry-leading products and technologies, expertise in mechanical integrity (MI), Non-Destructive Testing (NDT), Destructive Testing (DT) and predictive maintenance (PdM) services, process and fixed asset engineering and consulting services, and our world class enterprise inspection database management and analysis software —PCMS, to deliver a comprehensive portfolio of customized solutions, ranging from routine inspections to complex, plant-wide asset integrity management and assessments. We deliver our solutions through a combination of services and products and systems.
Our Services
Our Services segment provides a range of testing and inspection services to a diversified customer base across energy-related, industrial and public infrastructure industries. We either deploy our services directly at the customer’s location or through our own extensive network of field testing facilities. Our global footprint allows us to provide asset protection solutions through local offices in close proximity to our customers, permitting us to keep response time and travel, living and per diem costs to a minimum, while maximizing our ability to develop meaningful, collaborative customer relationships. Examples of our comprehensive portfolio of services include: testing components of new construction as they are built or assembled; providing corrosion monitoring data to help customers determine whether to repair or retire infrastructure; providing material analysis to ensure the integrity of infrastructure components; and supplying non-invasive on-stream techniques that enable our customers to pinpoint potential problem areas prior to failure. In addition, we also provide services to assist in the planning and scheduling of resources for repairs and maintenance activities. Our experienced inspection professionals perform these services, supported by our advanced proprietary software and hardware products. Examples of our services are discussed below.
Traditional NDT Services
Our certified personnel provide a range of traditional inspection services. For example, our visual inspectors provide comprehensive assessments of the condition of our customers’ plant equipment during capital construction projects and maintenance shutdowns. Of the broad set of traditional NDT techniques that we provide, several lend themselves to integration with our other offerings and often serve as the initial entry point to more advanced customer engagements. For example, we provide a comprehensive program for the inspection of above-ground storage tanks designed to meet stringent industry standards for the inspection, repair, alteration and reconstruction of oil and petrochemical storage tanks. This program includes magnetic flux exclusion for the rapid detection of floor plate corrosion, advanced ultrasonic systems and leak detection of floor defects, remote ultrasonic crawlers for shell and roof inspections and trained, certified inspectors for visual inspection and documentation.
Advanced NDT Services
In addition to traditional NDT services, we provide a broad range of proprietary advanced NDT services that we offer on a stand-alone basis or in combination with software solutions such as our proprietary enterprise inspection data management and plant condition monitoring software and systems (PCMS). We also provide on-line monitoring capabilities and other solutions that enable the delivery of accurate and real-time information to our customers. Our advanced NDT services require more complex equipment and more skilled inspection professionals to operate this equipment and interpret test results. Some of the technologies and techniques we use include:
· Automated ultrasonic testing
· Guided Ultrasonic Long wave testing
· Infrared thermography and inspection
· Phased array ultrasonic testing
· Acoustic emission testing
· Automated Ultrasonic Phased Array Inspection
· Predictive Maintenance (PdM)
· Reliability Centered Maintenance services (RCM)
· Fitness for Service (FFS) engineering services
· Internal Rotating Inspection System (IRIS)
· Wireless on-line data acquisition
· On-line plant asset integrity monitoring
· Risk-based inspection (RBI)
· Computed and Digital radiography
· Sensor fusion (multi-sensor data integration)
· Ground Penetrating Radar
· Line Scanning Thermography (LST)
· Professional Rope Access teams
· Large Structure Inspection (LSI)
· Wireless Ultrasonic Sensors
Mechanical Integrity Services
We provide a broad range of MI services that enable our customers to meet stringent regulatory requirements. These services increase plant safety, minimize unscheduled downtime and allow our customers to plan for, repair and replace critical components and systems before failure occurs. Our services are designed to complement a comprehensive predictive and preventative inspection and maintenance program that we can provide for our customers in addition to the MI services. Customers of our MI services have, in many instances, also licensed our PCMS software, which allows for the storage and analysis of data captured by our testing and inspection products and services, and implemented this solution to complement our inspection services.
As a result of the information captured by PCMS and our risk-based inspection software module we are able to provide a professional service known as “Mechanical Integrity Gap Analysis” for process facilities. Our Mechanical Integrity Gap Analysis service offers insight into the level of plant readiness, how best to manage and monitor the integrity of process facility assets, and how to extend the useful lives of such assets. Our Mechanical Integrity Gap Analysis service also assists customers in benchmarking and managing their infrastructure through key performance indicators and other metrics.
Destructive Testing Services
We provide a wide range of Destructive testing (DT) services. Hardness, stiffness and strength are a few key indicators drawn from destructive tests per customer specifications. DT is a strength of our subsidiary, Mistras-GMA in Germany, which specializes in an array of destructive testing applications utilized throughout the materials selection and approval process in the aerospace, automotive, chemical, oil & gas and power generation industries. Example testing includes:
· Mechanical tests — Materials, specimens and even composites are subjected to increasing levels of tension, compression, shear and peeling until failure. There are a number of variations of mechanical testing in which adding temperature, strain, unidirectional load or shear can provide useful results
· Physical/Chemical — Used to examine specific material and thermal characteristics as well as chemical compositions, including differential scanning calorimetry (DSC), high performance liquid chromatography, fiber volume content and fourier transformation infrared spectroscopy (FTIR)
· Materialography — Gives an insight into the geometries of structural composites, which presents an inside track with regards to determining failure mechanisms and asset lifespan expectations.
Our Products and Systems
Acoustic Emission (AE) Products
We are a leader in the design and manufacture of AE sensors, instruments and turn-key systems used for the monitoring and testing of materials, pressure components, processes and structures. Though we principally sell our products as a system, which includes a
combination of sensors, an amplifier, signal processing electronics, knowledge-based software and decision and feedback electronics, we can also sell these as individual components to certain customers that have the in-house expertise to perform their own services. Our sensors “listen” to structures and materials to detect real-time AE activity and to determine the presence of active corrosion or structural flaws in the inspected materials. Such components include pressure vessels, storage tanks, heat exchangers, piping, turbine blades and reactors.
In addition, we provide leak monitoring and detection systems used in diverse applications, including the detection and location of both gaseous and liquid leaks in valves, vessels, pipelines, boilers and tanks. AE leak monitoring and detection, when applied in a systematic preventive maintenance program, has proven to substantially reduce costs by eliminating the need for visual valve inspection and unscheduled down-time. In addition, the U.S. Environmental Protection Agency (EPA) requirements regarding fugitive emissions such as the new 40 CFR Part 98 Subpart W regulation for gas monitoring, helps drive the market for this leak detection equipment.
Ultrasonic (UT) Systems
We design, manufacture and market a complete line of ultrasonic equipment. While AE technology detects flaws and pinpoints their location, our UT technology has the ability to size defects in three-dimensional geometric representations. Our line of UT systems include our line of Automated UT scanners, our unique portable UT handheld and tablet systems with motion control to run our many inspection scanners, and our immersion systems including small bench top units to large UT systems over 55 feet long and large production unit gantry systems.
Vibration Sensors and Systems
We design, manufacture and market a broad portfolio of vibration sensing products under our Vibra-Metrics brand name. These include a full line of accelerometers (vibration sensors), on-line condition-based management systems, data delivery systems and a comprehensive assortment of ancillary support products.
Radiography Systems
We provide a wide array of digital radiographic systems to solve specific industrial problems, including Computed Radiography (CR), Real-Time Radiography (RTR), Direct Radiography (DR), and Computed Tomography (CT). Digital Radiography is one of the newest forms of radiographic imaging. Thickness profiles of piping systems, both insulated and un-insulated, are performed using computed radiography, while large production runs of smaller parts are inspected using direct radiography. Real time radiography is utilized for large “real time” inspections of insulated piping systems looking for areas of pipe degradation.
Technology Solutions
In order to address some of the more common problems faced by our customers, we have developed a number of robust technology solutions. These packages generally allow more rapid and effective testing of infrastructure because they minimize the need for service professionals to customize and integrate asset protection solutions with the infrastructure and interpret test results. These packaged solutions use proprietary and specialized testing procedures and hardware, advanced pattern recognition, neural network software and databases to compare test results against our prior testing data or national and international structural integrity standards. One such package is our ACTMS (Acoustic Combustion Turbine Monitoring System), an on-line system to detect stator blade cracks in gas turbines. Others include TANKPAC for tank inspections and POWERPAC for monitoring discharges in critical power grid transformers.
Software Solutions
Our software solutions are designed to meet the demands of our customers inspection data management, risk management, data analysis and asset integrity management requirements. We address these requirements using best in class database management systems and applying enterprise based inspection and data management applications. We apply our comprehensive portfolio of customized Acoustic Emission and Ultrasonic application-specific software products to cover a broad range of materials testing and analysis methods, for neural networks, pattern recognition, wavelet analysis and moment tensor analysis. Some of the key software solutions we offer include:
· PCMS enterprise software: asset protection and reliability
Our PCMS application is an enterprise software system that allows for the collection, storage and analysis of data as captured by our testing and inspection products and services and convert it to valuable information for our plant personnel and by plant management using our enterprise information dashboards. PCMS allows our customers to design and develop asset integrity management plans that include:
· optimal systematic testing schedules for their infrastructure based on real-time data captured by our sensors;
· alerts that notify customers when to perform special testing services on suspect areas, enabling them to identify and resolve flaws on a timely basis by using our PCMS risk-based inspection (RBI) software module; and
· schedules for the maintenance and retirement of assets.
PCMS also offers advantages by allowing the information it develops and stores to be organized, linked and synchronized with enterprise software systems such as SAP and IBM’s Maximo. We believe PCMS is one of the more widely used process condition management software systems in the world. We estimate that more than 40% of U.S. refineries, by capacity, currently use PCMS. This provides us not only with recurring maintenance and support fees, but also marketing opportunities for additional software, asset integrity management and other asset protection solutions. PCMS has also been chosen and installed by leading midstream pipeline energy companies and major energy companies in Canada and Europe.
· Advanced Data Analysis Pattern Recognition and Neural Networks Software (NOESIS), which enables our AE experts to develop automated remote monitoring systems for our customers.
· AE Software Platform (AEwin and AEwinPost), a Windows-based real time applications software for detection, processing and analysis, which locates the general location of flaws on or in our customers’ structures.
· Loose Parts Monitoring Software (LPMS), which is a software program for monitoring, detecting and evaluating metallic loose parts in nuclear reactor coolant systems in accordance with strict industry standards.
· Automated UT and Imaging Analysis Software (UTwin and UTIA), which is a software platform for analyzing ultrasonic inspection data and visualizing and identifying the location and size of potential flaws.
Engineering Services
In addition to software and advanced technologies, Mistras also provides professional engineering services that is organized under our Asset Integrity Management Services (AIMS) group. Asset Integrity Management refers to the management system that enables plant owners to maintain the integrity of its assets in a Fit for Service condition for the desired life of the assets. A sound AIMS program incorporates various aspects of equipment design, maintenance, inspection programs and operations in order to maximize the return generated from the assets based on their safe and efficient operation. The biggest benefit of a functional AIMS program is the ability to run more smoothly and more efficiently. Services includes Engineering Fitness for Service, Finite Element Analysis and other fixed equipment mechanical engineering studies on an as needed basis. These studies provide critical data to plant operators in aiding in run, repair or replace decisions. In some cases, FFS studies are used to determine if a plant can operate the asset in a reduced capacity until the next shut down period. In this case, Mistras normally prescribes On-line Monitoring using Acoustic Emission technology to determine if the anomaly is propagating.
An example of our professional engineering support capabilities include:
· Plant operations support
· Process technologies
· Equipment technologies
· Project planning, management, and execution
· Facilities planning studies
· Engineering design
· Fractionation/thermodynamics support
· Safety reviews
· Environmental support
· Plant operations improvement
· Plant optimization evaluations
· Profitability studies
· Start-Up assistance
· Licensing support
· Expert testimony
· Technical training
On-line Monitoring
Our on-line monitoring offerings combine all of our asset protection services, products and systems. We provide temporary, periodic and continuous monitoring of static infrastructures such as bridges, pipes, and transformers, as well as dynamic or rotating assets such as pumps, motors, gearboxes, steam and gas turbines. Temporary monitoring is typically used when there is a known defect or problem and the condition needs to be monitored until repaired or new equipment can be placed in service. Periodic monitoring, or “walk around” monitoring, is used as a preventative maintenance tool to take machine and device readings, on a periodic basis, to observe any change in the assets’ condition such as increased vibration or unusual heat buildup and dissipation. Continuous monitoring is applied “24/7” on critical assets to observe the earliest onset of a defect and to track its progression to avoid catastrophic failure.
Customers
We provide our asset protection solutions to a global customer base of diverse companies primarily in our target markets. We have one customer which accounted for approximately 11% and 16% of our total revenues for fiscal 2013 and 2012, respectively. Our relationship with that customer is comprised of separate contracts for non-destructive testing and inspection services with multiple affiliated entities within their broad organization. We conduct business with various divisions or affiliates of the organization through numerous contracts covering many segments of its business including downstream (refinery), midstream (pipelines) and upstream (exploration). These contracts are typically negotiated locally with the specific location, are of varying lengths, have different start and end dates and differ in terms of the scope of work and nature of services provided. Most contracts are based on time and materials. No customer accounted for 10% or more of our revenue in fiscal 2014 and other than as noted, no customer accounted for more than 10% of our revenues in fiscal 2013, or 2012.
Geographic Areas
We conduct our business in approximately 16 different countries. Our revenues are primarily derived from our U.S. and European operations. See Note 20 — Segment Disclosure to the consolidated financial statements in this report for further disclosure of our revenues, long-lived assets and other financial information regarding our international operations.
Seasonality
Our business is seasonal. This seasonality relates primarily to our Services segment. Our first and third fiscal quarter revenues for our Services segment are typically lower than our revenues in the second and fourth fiscal quarters because demand for our asset protection solutions from the oil and gas as well as the fossil and nuclear power industries increases during their non-peak production periods. Because we are increasing our work in the second and fourth fiscal quarters, our cash flows are lower in those quarters than in our first and third quarters, as collections of receivables lag behind revenues. For instance, U.S. refineries’ non-peak periods are generally in our second fiscal quarter, when they are retooling to produce more heating oil for winter, and in our fourth fiscal quarter, when they are retooling to produce more gasoline for summer. Our quarterly Services segment revenues for fiscal 2014, as a percentage of total Services revenues for fiscal 2014, were 22% (first quarter), 25% (second quarter), 24% (third quarter), and 29% (fourth quarter). We expect that the impact of seasonality will continue.
Competition
We operate in a highly competitive, but fragmented, market. We are a “pure play” asset protection company meaning that we provide only Services and Products & Systems for asset protection supported applications and are not diluted with non-core services which could create a conflict of interest with our customers. Our primary competitors are divisions of large companies, and many of our other competitors are small companies, limited to a specific product or technology and focused on a niche market or geographic region. We believe that none of our competitors currently provides the full range of asset protection and NDT products, enterprise software (PCMS) and the traditional and advanced services solutions that we offer. Our competition with respect to NDT services include the Acuren division of Rockwood Service Corporation, SGS Group, the TCM division of Team, Inc. and APPLUS RTD. Our competition with respect to our PCMS software includes UltraPIPE, a division of Siemens, Lloyd’s Register Capstone, Inc. and Meridium Systems. Our competition with respect to our ultrasonic and radiography products are GE Inspection Technologies and Olympus NDT. In the traditional NDT market, we believe the principal competitive factors include project management, availability of qualified personnel, execution, price, reputation and quality. In the advanced NDT market, reputation, quality and size are more significant competitive factors than price. We believe that the NDT market has significant barriers to entry which would make it difficult for new competitors to enter the market. These barriers include: (1) having to acquire or develop advanced NDT services, products and systems technologies, which in our case occurred over many years of customer engagements and at significant internal research and development expense, (2) complex regulations and safety codes that require significant industry experience, (3) license requirements and evolved quality and safety programs, (4) costly and time-consuming certification processes, (5) capital requirements and (6) emphasis by large customers on size and critical mass, length of relationship and past service record.
Centers of Excellence
Another differentiator in our business model is the formation of our Centers of Excellence (COEs), which we consider to be incubators of inspection technology. The COEs are focused around target applications in our key market segments. They are supported by subject matter experts that will engage in strategic sales opportunities offering customers value-added solutions using advanced technologies and methods providing oversight, management and consultation. The COEs have a blueprint for their areas that can be replicated throughout the world by delivering procedures, equipment, reports, certifications, etc. insuring a standardized approach to implementation yielding higher margin business.
Sales and Marketing
We sell our asset protection solutions through our experienced and highly trained direct sales and marketing teams within all of our offices worldwide. In addition, our project and laboratory managers as well as our management are trained on our solutions and often are the source of sales leads and customer contacts. Our direct sales and marketing teams work closely with our customers’ research and design personnel, reliability engineers and facilities maintenance engineers to demonstrate the benefits and capabilities of our asset protection solutions, refine our asset protection solutions based on changing market and customer needs and identify potential sales opportunities. We divide our sales and marketing efforts into services sales, products and systems sales and marketing and utilize a robust CRM system to collect, manage and collaborate customer information with our teams globally.
Manufacturing
Most of our hardware products are manufactured in our Princeton Junction, New Jersey facility. Our Princeton Junction facility includes the capabilities and personnel to fully produce all of our AE products, NDT Automation Ultrasonic equipment and Vibra-Metrics vibration sensing products and systems. We recently expanded our manufacturing facilities to handle the assembly and
manufacturing of our larger UT systems due to growth in this segment. Certain other hardware is manufactured by a third party and then loaded by us with our proprietary software.
We also design and manufacture automated ultrasonic systems and scanners in France as a result of the acquisition of Eurosonic in Vitrolles, France during fiscal 2012. This facility is the headquarters of our European Products and Systems division.
Intellectual Property
Our success depends, in part, on our ability to maintain and protect our proprietary technology and to conduct our business without infringing on the proprietary rights of others. We utilize a combination of intellectual property safeguards, including patents, copyrights, trademarks and trade secrets, as well as employee and third-party confidentiality agreements, to protect our intellectual property.
As of May 31, 2014, we held 6 patents (by direct ownership or exclusive licensing), all in the United States, which will expire at various times between fiscal 2017 and 2026, and license certain other patents. However, we do not principally rely on these patents or licenses to provide our proprietary asset protection solutions. Our trademarks and service marks provide us and our products and services with a certain amount of brand recognition in our markets. However, we do not consider any single patent, trademark or service mark material to our financial condition or results of operations.
As of May 31, 2014, the primary trademarks and service marks that we held in the United States included Mistras® and our stylized globe design. Other trademarks or service marks that we utilize in localized markets or product advertising include PCMS, Physical Acoustics Corporation and the PAC logo, Ropeworks, NOESIS, Pocket AE®, Pocket UT®, AEwin®, AEwinPost, UTwin®, UTIA, LST, Vibra-Metrics®, Field CAL®, MONPAC, PERFPAC, TANKPAC® , Valve-Squeak®,VPAC, POWERPAC, Sensor Highway, Quality Services Laboratories Inc. (QSL), NDT Automation, and One Source for Asset Projection Solutions®.
Many elements of our asset protection solutions involve proprietary know-how, technology or data that are not covered by patents or patent applications because they are not patentable, or patents covering them would be difficult to enforce, including technical processes, equipment designs, algorithms and procedures. We believe that this proprietary know-how, technology and data is the most important component of our intellectual property assets used in our asset protection solutions, and is a primary differentiator of our asset protection solutions from those of our competitors. We rely on various trade secret protection techniques and agreements with our customers, service providers and vendors to protect these assets. All of our employees are subject to confidentiality requirements through our employee handbook. In addition, employees in our Products and Systems segment and our other employees involved in the development of our intellectual property have entered into confidentiality and proprietary information agreements with us. Our employee handbook and these agreements require our employees not to use or disclose our confidential information, to assign to us all of the inventions, designs and technologies they develop during the course of employment with us, and otherwise address intellectual property protection issues. We also seek confidentiality agreements from our customers and business partners before we disclose any sensitive aspects of our asset protection solutions technology or business strategies. We are not currently involved in any material intellectual property claims.
Research and Development
Our research and development is principally conducted by engineers and scientists at our Princeton Junction, New Jersey headquarters, and supplemented by other employees in the United States and throughout the world, including France, Greece, Japan, Russia and the United Kingdom, who have other primary responsibilities. Our total professional staff includes approximately 40 employees who hold Ph.D.’s and over 150 engineers and employees who hold Level III certification, the highest level of certification from the American Society of Non-Destructive Testing.
We work with customers to develop new products or applications for our technology. Research and development expenses are reflected on our consolidated statements of income as research and engineering expenses. Our company-sponsored research and engineering expenses were approximately $3.0 million, $2.4 million and $2.1 million for fiscal 2014, 2013 and 2012, respectively. While we have historically funded most of our research and development expenditures, from time to time we also receive customer-sponsored research and development funding. For example, in February 2009, the National Institute of Standards and Technology (NIST) awarded us and our university partners a $6.9 million research award under their new Technology Innovation Program (TIP) for the development and research of advanced technologies to enable monitoring and inspection of the structural health of bridges, roadways and water systems.
We have a number of other paid research contracts throughout the world, including Greece, Brazil, France, the United Kingdom, Japan and the Netherlands, for various industries and applications, including testing of new composites, detecting crack propagation, mapping discontinuities and carbon defect characterization, development of new sensor, actuator, signal processing, wireless and communications technologies, as well as the development of permanently embedded inspection systems using acoustic emission and
acousto-ultrasonics to provide continuous on-line in-service full coverage monitoring of critical structural components. Most of the projects are in our target markets; however, a few of the projects could lead to other future market opportunities.
Employees
Providing our asset protection solutions requires a highly-skilled and technically proficient employee base. As of May 31, 2014, we had approximately 5,300 employees worldwide and approximately 67% of our employees were based within the United States. Approximately 10% of our employees in the United States are unionized. We believe that we have good relations with our employees.
Environmental Matters
We are subject to numerous environmental, legal and regulatory requirements related to our operations worldwide. In the United States, these laws and regulations include, among others: the Comprehensive Environmental Response, Compensation, and Liability Act, the Resources Conservation and Recovery Act, the Clean Air Act, the Federal Water Pollution Control Act, the Toxic Substances Control Act, the Atomic Energy Act, the Energy Reorganization Act of 1974, and applicable regulations. In addition to the federal laws and regulations, states and other countries where we do business often have numerous environmental, legal and regulatory requirements by which we must abide. We evaluate and address the environmental impact of our operations by assessing properties in order to avoid future liabilities and comply with environmental, legal and regulatory requirements.
See “Legal Proceedings” in Item 3 of this report for an environmental matter involving us, which is incorporated herein by reference.
Our Website and Available Information
Our website address is www.mistrasgroup.com. We file reports with the SEC, including Quarterly Reports on Form 10-Q, Annual Reports on Form 10-K, Current Reports on Form 8-K and Proxy Statements. All of the materials we file with or furnish to the SEC are available free of charge on our website at http://investors.mistrasgroup.com/sec.cfm, as soon as reasonably practicable after having been electronically submitted to the SEC. Information contained on or connected to our website is not incorporated by reference into this Annual Report on Form 10-K and should not be considered part of this report or any other filing with the SEC. All of our SEC filings are also available at the SEC’s website at www.sec.gov. In addition, materials we file with the SEC may be read and copied at the SEC’s Public Reference Room at 100 F Street, NE, Washington, DC 20549. The public may obtain information on the operation of the Public Reference Rom by calling the SEC at 1-800-SEC-0330.
Executive Officers
The following are our executive officers and other key employees as of May 31, 2014 and their background and experience:
|
Name |
|
Age |
|
Position |
|
Sotirios J. Vahaviolos |
|
68 |
|
Chairman, President, Chief Executive Officer and Director |
|
Dennis Bertolotti |
|
54 |
|
President, Chief Operating Officer, Services |
|
Mark F. Carlos |
|
62 |
|
Group Executive Vice President, Products and Systems |
|
Ralph L. Genesi |
|
59 |
|
Group Executive Vice President, Marketing and Sales |
|
Michael C. Keefe |
|
57 |
|
Executive Vice President, General Counsel and Secretary |
|
Michael J. Lange |
|
54 |
|
Group Executive Vice President, Services, and Director |
|
Jonathan H. Wolk |
|
53 |
|
Executive Vice President, Chief Financial Officer and Treasurer |
Sotirios J. Vahaviolos has been our Chairman, President and Chief Executive Officer since he founded Mistras in 1978 under the name Physical Acoustics Corporation. Prior to joining Mistras, Dr. Vahaviolos worked at AT&T Bell Laboratories. Dr. Vahaviolos received a B.S. in Electrical Engineering and graduated first in his engineering class from Fairleigh Dickinson University and received Masters Degrees in Electrical Engineering and Philosophy and a Ph.D. (EE) from the Columbia University School of Engineering. During Dr. Vahaviolos’ career in non-destructive testing, he has been elected Fellow of The Institute of Electrical and Electronics Engineers, a member of The American Society for Nondestructive Testing (ASNT) where he served as its President from 1992-1993 and its Chairman from 1993-1994, a member of Acoustic Emission Working Group (AEWG) and an honorary life member of the International Committee for Nondestructive Testing. Additionally, he was the recipient of ASNT’s Gold Medal in 2001 and AEWG’s Gold Medal in 2005. He was also one of the six founders of NDT Academia International in 2008 headquartered in Brescia, Italy.
Dennis Bertolotti is the President and Chief Operating Officer, Services. Mr. Bertolotti has been with us since we acquired Conam Inspection Services in 2003, where Mr. Bertolotti was a Vice President at the time of the acquisition. Mr. Bertolotti has been in the NDT business for over 29 years, and previously held ASNT Level III certifications and various American Petroleum Institute, or API,
certifications, and received his Associate of Science degree in NDT from Moraine Valley Community College in 1983. Mr. Bertolotti has also received a Bachelor of Science and MBA from Otterbein College.
Mark F. Carlos is our Group Executive Vice President, Products and Systems, having joined Mistras at its founding in 1978. Prior to joining Mistras, Mr. Carlos worked at AT&T Bell Laboratories. Mr. Carlos received a MBA from Rider University and a Masters in Electrical Engineering from Columbia University. Mr. Carlos is an elected Fellow of ASNT and AEWG, and currently serves as the Chairman of the American Society for Testing and Materials’ NDT Standards Writing Committee E-07 and was the recipient of its prestigious Charles W. Briggs Award in 2007.
Ralph L. Genesi is Group Executive Vice President, Marketing and Sales. He joined Mistras in March of 2009 with more than 25 years of executive management experience in marketing and sales as well as corporate profit and loss responsibility. Prior to joining Mistras, Mr. Genesi was President of Swantech Inc., a division of the Curtiss Wright Corporation from 2005 until 2009. From 2001 until 2005, Mr. Genesi was with Siemens AG, where he was Vice President and General Manager for the Siemens Power Generation Information Technology Business, responsible for energy trading, fleet operations and control solutions worldwide. Prior to that Mr. Genesi held positions as President-Americas Operations for Spectris Technologies Inc., a European holding company and Director, Global Market & Sales Development for Honeywell’s Industrial Automation & Controls business. Mr. Genesi has an Electrical Engineering degree from Fairleigh Dickinson University.
Michael C. Keefe is Executive Vice President, General Counsel and Secretary, joining Mistras in December 2009. Most recently before Mistras, Mr. Keefe worked at International Fight League, a publicly-traded sports promotion company, from 2007 until 2009, initially as Executive Vice President, General Counsel and Corporate Secretary, then becoming the Chief Financial Officer, and eventually its President. From 1990 until 2006, Mr. Keefe served in various legal roles with Lucent Technologies and AT&T, the last four years as Vice President, Corporate and Securities Law and Assistant Secretary, and prior to that was in private practice at McCarter & English, LLP. Before starting his legal career, Mr. Keefe was employed at PricewaterhouseCoopers LLP, and worked in accounting for seven years, becoming a certified public accountant. Mr. Keefe received a BS in Business Administration (Accounting) from Seton Hall University and a J.D. from Seton Hall University School of Law.
Michael J. Lange is Group Executive Vice President, Services having joined Mistras when we acquired Quality Services Laboratories in November 2000, and was elected a Director in 2003. Mr. Lange is a well-recognized authority in Radiography and has held an ASNT Level III Certificate for almost 20 years. Mr. Lange received an Associate of Science degree in NDT from the Spartan School of Aeronautics in 1979.
Jonathan H. Wolk joined us as our Executive Vice President, Chief Financial Officer and Treasurer in November 2013. Prior to joining Mistras, he served as Senior Vice President, Chief Financial Officer and Secretary of American Woodmark Corporation from 2004 until August 2013. Prior to American Woodmark, he served as the Chief Financial Officer and Treasurer of Tradecard, Inc., from 2000 to 2004, and was the global controller of GE Capital Real Estate from 1998 to 2000. Mr. Wolk started his career in public accounting at KPMG, received his B.S. in accounting from State University of New York-Albany and is a certified public accountant.
Our executive officers are elected by, and serve at the discretion of, our board of directors. There are no family relationships among any of our directors or executive officers.
This section describes the major risks to us, our business and our common stock. You should carefully read and consider the risks described below, together with the other information contained in this Annual Report, including our financial statements and the notes thereto and “Management’s Discussion and Analysis of Financial Condition and Results of Operations” before making an investment decision. The statements contained in this section constitute cautionary statements under the Private Securities Litigation Reform Act of 1995. If any of these risks actually occur, our business, financial condition, results of operations and future growth prospects may be adversely affected. As a result, the trading price of our common stock would likely decline, and you may lose all or part of your investment. You should understand that it is not possible to predict or identify all risk factors that could impact us. Accordingly, you should not consider the following to be a complete discussion of all risks and uncertainties.
Risks Related to Our Business
Our growth strategy includes acquisitions. We may not be able to identify suitable acquisition candidates or integrate acquired businesses successfully, which may adversely impact our results. Furthermore, acquisitions that we do complete could expose us to a number of unanticipated operational and financial risks.
A significant factor in our growth has been and will continue to be based upon our ability to make acquisitions and successfully integrate these acquired businesses. We intend to continue to seek additional acquisition opportunities, both to expand into new
markets and to enhance our position in existing markets globally. This strategy has provided us with many benefits and has helped fuel our growth, but also carries with it many risks. Some of the risks associated with our acquisition strategy include:
· Whether we successfully identify suitable acquisition candidates, negotiate appropriate acquisition terms, and complete proposed acquisitions
· Whether we can successfully integrate acquired businesses into our current operations, including our accounting, internal control and information technology systems, marketing and other key infrastructure
· Whether we can adequately capture opportunities that an acquired business may offer, including the expansion into new markets in which we have no prior experience
· Whether we value an acquired business properly when determining the purchase price, terms and whether we are able to achieve the returns on the investment we expected
· Whether an acquired business can achieve levels of revenues, profitability, productivity or cost savings we expected
· Whether an acquired business is compatible with our culture and philosophy of doing business
· Unexpected loss of key personnel and customers of an acquired business;
· The assumption of liabilities and risks (including environmental-related costs) of an acquired business, some of which may not be unanticipated
· Potential disruption of our ongoing business and distraction of management and other personnel of us and the acquired business resulting from the efforts to acquire then integrate an acquired business
Our ability to undertake acquisitions is limited by our financial resources, including available cash and borrowing capacity. Future acquisitions could result in potentially dilutive issuances of equity securities, the incurrence of substantial additional indebtedness and other expenses, any of which could adversely impact our financial condition and results of operations. Although management intends to: (i) evaluate the risks inherent in any particular transaction, (ii) assume only risks it believes to be acceptable, and (iii) develop plans to mitigate such risks, there are no assurances that we will properly ascertain or accurately assess the extent of all such risks. Difficulties encountered with acquisitions may adversely impact our business, financial condition and results of operations.
In addition, we have a significant amount of goodwill and other intangible assets on our balance sheet as a result of our acquisitions. This will increase as we complete more acquisitions. If our acquisitions do not perform as planned and we do not realize the benefits and profitability we expect, we could incur significant write-downs and impairment charges to our earnings due to the impairment of the goodwill and other intangible assets we have acquired.
Our international operations are subject to risks relating to non-U.S. operations.
In fiscal 2014, 2013 and 2012, we generated approximately 32%, 31% and 19% of our revenues outside the United States, respectively. We expect to increase our international presence over time. In addition, we expect our international business to become much more service oriented than in the past, resulting in many more employees outside the United States. Our primary operations outside the United States are in Canada, Germany, Brazil, the United Kingdom, and France. We also have operations in Russia, the Netherlands, India and Japan. There are numerous risks inherent in doing business in international markets, including:
· fluctuations in currency exchange rates and interest rates;
· varying regional and geopolitical business and economic conditions and demands;
· compliance with applicable foreign regulations and licensing requirements, and U.S. laws and regulation with respect to our business in other countries, including export controls and the Foreign Corrupt Practices Act;
· the cost and uncertainty of obtaining data and creating solutions that are relevant to particular geographic markets;
· the need to provide sufficient levels of technical support in different locations;
· the complexity of maintaining effective policies and procedures in locations around the world;
· political instability and civil unrest;
· restrictions or limitations on outsourcing contracts or services abroad;
· restrictions or limitations on the repatriation of funds; and
· potentially adverse tax consequences.
We are expanding our sales and marketing efforts in certain emerging markets, such as Brazil, Russia, India and China. Expanding our business into emerging markets may present additional risks beyond those associated with more developed international markets. For example, in China and Russia, we may encounter risks associated with the ongoing transition from state business ownership to privatization. In any emerging market, we may face the risks of working in cash-based economies, dealing with inconsistent government policies and encountering sudden currency revaluations.
Due to our dependency on customers in the oil and gas industry, we are susceptible to prolonged negative trends relating to this industry that could adversely affect our operating results.
Our customers in the oil and gas industry (including the petrochemical market) have accounted for a substantial portion of our historical revenues. Specifically, they accounted for approximately 49%, 50% and 54% of our revenues for fiscal 2014, 2013 and 2012, respectively. We have expanded our customer base into industries other than the oil and gas industry, but we still receive a majority of our revenues from this industry. While our services are vital to the operators of plants and refineries, economic slowdowns or reduction in prices in the oil and gas industry can result in cut backs in contracts for our services. If the oil and gas industry were to suffer a prolonged or significant downturn, our revenues, profits and cash flows may be reduced. While we continue to expand our market presence in the power generation and transmission, and chemical processing industries, among others, these markets are also cyclical in nature and as such, are subject to economic downturns.
We expect to continue expanding and our success depends on how effectively we manage our growth.
We expect to continue experiencing significant growth in the number of employees and the scope of our operations. To effectively manage our anticipated future growth, we must continue to implement and improve our managerial, operational, financial and reporting systems, expand our facilities and continue to recruit and train additional qualified personnel. We expect that all of these measures will require significant expenditures and will demand the attention of management. Failure to manage our growth effectively could lead us to over or under-invest in technology and operations, result in weaknesses in our infrastructure, systems or controls, give rise to operational mistakes, loss of business opportunities, the loss of employees and reduced productivity among remaining employees. Our expected growth could require significant capital expenditures and may divert financial resources from other projects, such as the development of new solutions. If our management is unable to effectively manage our expected growth, our expenses may increase more than expected, our profit margins may suffer, our revenues could decline or may grow more slowly than expected and we may be unable to implement our business strategy as anticipated.
Our operating results could be adversely affected by a reduction in business with our significant customers.
We derive a significant amount of revenues from a few customers. For instance, various divisions or business units of our largest customer were responsible for approximately 11% and 16% of our revenues for fiscal 2013 and 2012, respectively. Taken as a group, our top ten customers were responsible for approximately 38%, 34% and 39% of our revenues for fiscal 2014, 2013 and 2012, respectively. This concentration pertains almost exclusively to our Services segment, which accounted for more than 70% of our revenues for the last three fiscal years. Generally, our customers do not have an obligation to make purchases from us and may stop ordering our products and services or may terminate existing orders or contracts at any time with little or no financial penalty. The loss of any of our significant customers, any substantial decline in sales to these customers or any significant change in the timing or volume of purchases by our customers could result in lower revenues and could harm our business, financial condition or results of operations.
An accident or incident involving our asset protection solutions could expose us to claims, harm our reputation and adversely affect our ability to compete for business and, as a result, harm our operating performance.
We could be exposed to liabilities arising out of the solutions we provide. For instance, we furnish the results of our testing and inspections for use by our customers in their assessment of their assets, facilities, plants and other structures. If such results were to be
incorrect or incomplete, as a result of, for instance, poorly designed inspections, malfunctioning testing equipment or our employees’ failure to adequately test or properly record data, we could be subject to claims. Further, if an accident or incident involving a structure we tested occurs and causes personal injuries or property damage, such as the collapse of a bridge or an explosion in a facility, and particularly if these injuries or damages could have been prevented by our customers had we provided them with correct or complete results, we may face significant claims relating to personal injury, property damage or other losses. Even if our results are correct and complete, we may face claims for such injuries or damage simply because we tested the structure or facility in question. While we do have insurance, our insurance coverage may not be adequate to cover the damages from any such claims, forcing us to bear these uninsured damages directly, which could harm our operating results and may result in additional expenses and possible loss of revenues. An accident or incident for which we are found partially or fully responsible, even if fully insured, may also result in negative publicity, which would harm our reputation among our customers and the public, cause us to lose existing and future contracts or make it more difficult for us to compete effectively, thereby significantly harming our operating performance. In addition, the occurrence of an accident or incident might also make it more expensive or extremely difficult for us to insure against similar events in the future.
Many of the sites at which we work are inherently dangerous workplaces. If we fail to maintain a safe work environment, we may incur losses and lose business.
Many of our customers, particularly in the oil and gas and chemical industries, require their inspectors and other contractors working at their facilities to have good safety records because of the inherent danger at these sites. If our employees are injured at the work place, we will incur costs for the injuries and lost productivity. In addition, safety records are impacted by the number and amount of workplace incidents involving a contractor’s employees. If our safety record is not within the levels required by our customers, or compares unfavorably to our competitors, we could lose business, be prevented from working at certain facilities or suffer other adverse consequences, all of which could negatively impact our business, revenues, reputation and profitability.
Substantially all of our computer and communications hardware is located at a single facility, the failure of which would harm our business and results of operations.
Substantially all of our computer and communications hardware is located at a single facility. We are in the process of upgrading our back-up recovery and business continuity plans, should a disaster strike our primary data center or some other significant event occurs, so that we can continue operating without a material interruption of business or loss of key functions such as information processing, customer billing and financial reporting. However, until we complete these improvements, should a natural disaster or some other event occur that damages our data center or significantly disrupts its operation, such as human error, fire, flood, power loss, telecommunications failure, break-ins, terrorist attacks, acts of war and similar events, we could suffer loss of business and interruption of key functions and capabilities that could materially reduce our revenues or profitability and harm our business performance.
If we are unable to attract and retain a sufficient number of trained certified technicians, engineers and scientists at competitive wages, our operational performance may be harmed and our costs may increase.
We believe that our success depends, in part, upon our ability to attract, develop and retain a sufficient number of trained certified technicians, engineers and scientists at competitive wages. The demand for such employees is currently high, and we project that it will continue in the future. Accordingly, we have experienced increases in our labor costs, particularly in our Services segment, but also, to a lesser extent, in our International segment. Some of the companies with which we compete for experienced personnel have comparatively greater name recognition and resources. The markets for our products and services also require us to use personnel trained and certified in accordance with standards set by domestic or international standard-setting bodies, such as the American Society of Non-Destructive Testing or the American Petroleum Institute. Because of the limited supply of these certified technicians, we expend substantial resources maintaining in-house training and certification programs. If we fail to attract sufficient new personnel or fail to motivate and retain our current personnel, our ability to perform under existing contracts and orders or to pursue new business may be harmed, preventing us from growing our business or causing us to lose customers and revenues, and the costs of performing such contracts and orders may increase, which would likely reduce our margins.
We operate in highly competitive markets and if we are unable to compete successfully, we could lose market share and revenues and our margins could decline.
We face strong competition from NDT and a variety of niche asset protection providers, both larger and smaller than we are. Some of our competitors have greater financial resources than we do and could focus their substantial financial resources to develop a competing business model or develop products or services that are more attractive to potential customers than what we offer. Some of our competitors are business units of companies substantially larger than us and have the ability to combine asset protection solutions into an integrated offering to customers who already purchase other types of products or services from them. Our competitors may
offer asset protection solutions at prices below or without cost in order to improve their competitive positions. Smaller niche competitors with small customer bases may be very aggressive in their pricing in order to retain customers. These competitive factors make it more difficult for us to attract and retain customers, or can cause us to lower our prices and accept lower margins in order to compete, the impact of any of which can reduce our market share, revenues and profits.
Events such as natural disasters, industrial accidents, epidemics, war and acts of terrorism, and adverse weather conditions could disrupt our business or the business of our customers, which could significantly harm our operations, financial results and cash flow.
Our operations and those of our customers are susceptible to the occurrence of catastrophic events outside our control, ranging from severe weather conditions to acts of war and terrorism. Any such events could cause a serious business disruption that reduces our customers’ ability to or interest in purchasing our asset protection solutions, and have in the past resulted in order cancellations and delays because customer equipment, facilities or operations have been damaged, or are not then operational or available. A large portion of our customer base has operations in the Gulf of Mexico, which is subject to hurricanes in the first and second quarters of our fiscal year. Hurricane-related disruptions to our customers’ operations have adversely affected our revenues in the past. Such events in the future may result in substantial delays in the provision of solutions to our customers and the loss of valuable equipment. In addition, our third quarter fiscal results can be adversely impacted by severe winter weather conditions, which can result in lost work days and temporary closures of customer facilities or outdoor projects. Any cancellations, delays or losses due to such events may significantly reduce our revenues and harm our operating performance.
If we lose members of our senior management team upon whom we are dependent, we may be less effective in managing our operations and may have more difficulty achieving our strategic objectives.
Our future success depends to a considerable degree upon the availability, contributions, vision, skills, experience and effort of our senior management team. We do not maintain “key person” insurance on any of our employees other than Dr. Sotirios J. Vahaviolos, our Chairman, President and Chief Executive Officer. We currently have no employment agreements with members of our senior management team other than with Dr. Vahaviolos. Although we may enter into employment agreements with certain executive officers in the future, these agreements will likely not guarantee the services of the individual for a specified period of time. Although we do not have any reason to believe that we may lose the services of any of these persons in the foreseeable future, the loss of the services of any of these persons might impede our operations or the achievement of our strategic and financial objectives. The loss or interruption of the service of any of the members of our senior management team could harm our business, financial condition and results of operations and could significantly reduce our ability to manage our operations and implement our strategy.
Deteriorations in economic conditions in certain markets or other factors may cause us to recognize impairment charges for our goodwill.
As of May 31, 2014, the carrying amount of our goodwill was approximately $131 million, of which approximately $44 million relates to our International segment. A significant portion of our international operations are concentrated in Europe and Brazil. The economic environments in Europe and Brazil were difficult in 2013. As a result of a contraction in the Brazilian economy (specifically in the oil and gas industry), in 2013 we recognized goodwill impairment in our Brazil reporting unit of approximately $9.9 million. Significant deterioration in industry or economic conditions in which we operate, disruptions to our business, not effectively integrating acquired businesses, or other factors, may cause further impairment charges to goodwill in future periods.
The success of our businesses depends, in part, on our ability to develop new asset protection solutions, increase the functionality of our current offerings and meet the needs and demands of our customers.
The market for asset protection solutions is impacted by technological change, uncertain product lifecycles, shifts in customer demands and evolving industry standards and regulations. We may not be able to successfully develop and market new asset protection solutions that comply with present or emerging industry regulations and technology standards. Also, new regulations or technology standards could increase our cost of doing business.
From time to time, our customers have requested greater functionality in our solutions. As part of our strategy to enhance our asset protection solutions and grow our business, we continue to make investments in the research and development of new technologies. We believe our future success will depend, in part, on our ability to continue to design new, competitive and broader asset protection solutions, enhance our current solutions and provide new, value-added services. Developing new solutions will require continued investment, and we may experience unforeseen technological or operational challenges. In addition, our asset protection software is complex and can be expensive to develop, and new software and software enhancements can require long development and testing periods. If we are unable to develop new asset protection solutions or enhancements that meet market demands on a timely basis, we
may experience a loss of customers or otherwise be likely to lose opportunities to earn revenues and to gain customers or access to markets, and our business and results of operations will be adversely affected.
Even if we develop new solutions, if our customers, or potential customers, do not see the value our solutions have over competing products and services, our operating results could be adversely impacted. In addition, because the asset protection solutions industry is rapidly evolving, we could lose insight into trends that may be emerging, which would further harm our competitive position by making it difficult to predict and respond to customer needs. If the market for our asset protection solutions does not continue to develop, our ability to grow our business would be limited and we might not be able to maintain profitability. If we cannot convince our customers of the advantages and value of our advanced NDT services we could lose large contracts or suffer lower profit margin.
If our software or system produces inaccurate information or are incompatible with the systems used by our customers and make us unable to successfully provide our solutions, it could lead to a loss of revenues and customers.
Our software and systems are complex and, accordingly, may contain undetected errors or failures. Software or system defects or inaccurate data may cause incorrect recording, reporting or display of information related to our asset protection solutions. Any such failures, defects and inaccurate data may prevent us from successfully providing our asset protection solutions, which would result in lost revenues. Software or system defects or inaccurate data may lead to customer dissatisfaction and our customers may seek to hold us liable for any damages incurred. As a result, we could lose customers, our reputation may be harmed and our financial condition and results of operations could be materially adversely affected.
We currently serve a commercial, industrial and governmental customer base that uses a wide variety of constantly changing hardware, software solutions and operating systems. Our asset protection solutions need to interface with these non-standard systems in order to gather and assess data. Our business depends on the following factors, among others:
· our ability to integrate our technology with new and existing hardware and software systems;
· our ability to anticipate and support new standards, especially Internet-based standards; and
· our ability to integrate additional software modules under development with our existing technology and operational processes.
If we are unable to adequately address any of these factors, our results of operations and prospects for growth and profitability would be adversely impacted.
The seasonal nature of our business reduces our revenues and profitability in our first and third fiscal quarters.
Our business, primarily in our Services segment, is seasonal. Our first and third fiscal quarter revenues for our Services segment are typically lower than our revenues in the second and fourth fiscal quarters because demand for our asset protection solutions from the oil and gas as well as the fossil and nuclear power industries increases during their non-peak production periods. For instance, U.S. refineries’ non-peak periods are generally in our second fiscal quarter, when they are retooling to produce more heating oil for winter, and in our fourth fiscal quarter, when they are retooling to produce more gasoline for summer. As a result of these trends, we generally have reduced cash flows in our second and fourth fiscal quarters, as collections of receivables lag behind revenues, possibly requiring us to borrow under our credit agreement. In addition, most of our operating expenses, such as employee compensation and property rental expense, are relatively fixed over the short term. Moreover, our spending levels are based in part on our expectations regarding future revenues. As a result, if revenues for a particular quarter are below expectations, we may not be able to proportionately reduce operating expenses for that quarter. We expect that the impact of seasonality will continue.
Growth in revenues from our service offerings, particularly traditional NDT services, relative to revenues from the sale of our products and systems may reduce our overall gross profit margin.
Our gross profit margin on revenues from our services offerings, particularly traditional NDT services, has historically been lower than our gross profit margin on revenues from our products and systems for numerous reasons. For instance, the gross profit margin in our Services segment for fiscal 2014 was approximately 26%, while our gross profit margin in our Products and Systems segment was approximately 43%. Our overall gross profit margin was approximately 28% during the same period. We expect to continue our efforts to increase the number of “evergreen” or “run and maintain” contracts at oil refineries. The services we provide at the beginning of these contracts are primarily traditional NDT services. Until such time as we can understand the needs of each new “evergreen” plant and we can then make recommendations to provide our advanced NDT services, and thus improve our service mix, our margins may be negatively impacted. As a result, we expect our overall gross profit margin will be lower in periods when
revenues from our services, and particularly from traditional NDT services, has increased as a percentage of total revenues and will be higher in periods when revenues from our advanced NDT services and our products and systems have increased as a percentage of total revenues. We expect the trend toward more traditional NDT services to continue and to the extent it does, our margins may decrease or remain flat. In addition, service offerings have become a larger portion of our International segment revenues than in the past, a trend we expect to continue, and this increased service revenue will be lower margin traditional NDT services. As a result, the gross profit margin in our International segment has decreased from 32% in 2012 to 25% in 2013 and 28% in 2014. These factors will create more pressure on margins. Fluctuations in our gross profit margin may affect our level of profitability in any period.
Our business, and the industries we currently serve, are currently subject to governmental regulation, and may become subject to modified or new government regulation that may negatively impact our ability to market our asset protection solutions.
We incur substantial costs in complying with various government regulations and licensing requirements. For example, the transportation and overnight storage of radioactive materials used in providing certain of our asset protection solutions such as radiography are subject to regulation under federal and state laws and licensing requirements. Our Services segment is currently licensed to handle radioactive materials by the U.S. Nuclear Regulatory Commission (NRC) and over 20 state regulatory agencies. If we allegedly fail to comply with these regulations, we may be investigated and incur significant legal expenses associated with such investigations, and if we are found to have violated these regulations, we may be fined or lose one or more of our licenses or permits, which would prevent or restrict our ability to provide radiography services. In addition, while we are investigated, we may be required to suspend work on the projects associated with our alleged noncompliance, resulting in loss of profits or customers, and damage to our reputation. Many of our customers have strict requirements concerning safety or loss time occurrences and if we are unable to meet these requirements it could result in lost revenues. In the future, federal, state, provincial or local governmental agencies may seek to change current regulations or impose additional regulations on our business. Any modified or new government regulation applicable to our current or future asset protection solutions may negatively impact the marketing and provision of those solutions and increase our costs and the price of our solutions.
Additionally, greenhouse gases that result from human activities, including burning of fossil fuels, have been the focus of increased scientific and political scrutiny and are being subjected to various legal requirements. International agreements, national laws, state laws and various regulatory schemes limit or otherwise regulate emissions of greenhouse gases, and additional restrictions are under consideration by different governmental entities. We derive a significant amount of revenues and profits from such industries, including oil and gas, power generation and transmission, and chemicals processing. Such regulations could negatively impact our customers, which could negatively impact the market for the services and products we provide. This could materially adversely affect our business, financial condition, results of operations and cash flows.
We rely on certification of our NDT solutions by industry standards-setting bodies. We and/or our subsidiaries currently have International Organization for Standardization (ISO) 9001:2008 certification, ISO 14001:2004 certification and OHSAS 18001:2007 certification. In addition, we currently have Nadcap (formerly National Aerospace and Defense Contractors Accreditation Program) and similar certifications for certain of our locations. We continually review our NDT solutions for compliance with the requirements of industry specification standards and the Nadcap special processes quality requirements. However, if we fail to maintain our ISO, Nadcap or other certifications, our business may be harmed because our customers generally require that we have these certification before they purchase our NDT solutions.
Protecting our intellectual property is important to our business and results of operations.
Our ability to compete effectively depends in part upon the maintenance and protection of the intellectual property related to our asset protection solutions. Patent protection is unavailable for certain aspects of the technology and operational processes important to our business. Any patent or patent applications held by us or to be issued to us, could be unenforceable, challenged, invalidated or circumvented. Some of our trademarks that are not in use may become available to others. To date, we have relied principally on copyright, trademark and trade secrecy laws, as well as confidentiality agreements and licensing arrangements, to establish and protect our intellectual property. However, we have not obtained confidentiality agreements from all of our customers and vendors. Although we obligate all of our employees to confidentiality, we cannot be certain that these obligations will be honored or enforceable.
Some of our customers are subject to laws and regulations that require them to disclose information that we would otherwise seek to keep confidential. We do not transfer ownership of some of our more advanced asset protection products and systems and, instead, sell to our customers’ services using these products and systems. We do this, in part, to protect the intellectual property upon which these products and systems are based, but this strategy may not be successful and our customers or third parties may reverse engineer or otherwise derive this intellectual property and use it without our authorization. Policing unauthorized use of our intellectual property is difficult and expensive. The steps that we have taken or may take might not prevent misappropriation of the intellectual property on which we rely. In addition, effective protection may be unavailable or limited in jurisdictions outside the United States, as the intellectual property laws of foreign countries sometimes offer less protection or have onerous filing requirements. From time to time,
third parties may infringe our intellectual property rights. Litigation may be necessary to enforce or protect our rights or to determine the validity and scope of the rights of others. Any litigation could be unsuccessful, cause us to incur substantial costs, divert resources away from our daily operations and result in the impairment of our intellectual property. Failure to adequately enforce our rights could cause us to lose valuable rights in our intellectual property and may negatively affect our business.
We may be subject to intellectual property litigation from third parties regarding our asset protection solutions.
Third-party patent applications, patents, copyrights and trademarks may be applicable to our asset protection solutions. As a result, third parties may in the future make infringement claims and other allegations that could subject us to intellectual property litigation relating to our solutions. Such litigation would be time consuming and expensive, divert attention and resources away from our daily operations, impede or prevent delivery of our solutions and require us to pay significant royalties, licensing fees and damages. In addition, parties making infringement and other claims may be able to obtain injunctive or other equitable relief that could effectively block our ability to provide our solutions and could cause us to pay substantial damages if we are found to be infringing on others’ intellectual property rights. If a third party has a successful claim of infringement, we may need to seek one or more licenses from third parties in order to continue to offer the related solution, which may not be available at a reasonable cost, or at all.
We may require additional capital to support business growth, which might not be available.
We intend to continue making investments to support our business growth and may require additional funds to respond to business challenges or opportunities, including the need to develop new, or enhance our current, asset protection solutions, enhance our operating infrastructure or acquire businesses and technologies. Accordingly, we may need to engage in equity or debt financings to secure additional funds. If we raise additional funds through further issuances of equity or convertible debt securities, our current stockholders could suffer significant dilution, and any new equity securities we issue could have rights, preferences and privileges superior to those of holders of our common stock. While our current bank financing is meeting our current need, any debt financing secured by us in the future could involve restrictive covenants relating to our capital-raising activities and other financial and operational matters, which may make it more difficult for us to obtain additional capital and to pursue business opportunities, including potential acquisitions. In addition, no assurance can be given that adequate or acceptable financing will be available to us, in which case we may not be able to grow our business or respond to business challenges.
Our credit agreement contains financial and operating restrictions that may limit our access to credit. If we fail to comply with financial or other covenants in our credit agreement, we may be required to repay indebtedness to our existing lenders, which may harm our liquidity.
Our credit agreement contains financial covenants that require us to maintain compliance with specified financial ratios. If we fail to comply with these covenants, the lenders could prevent us from borrowing under our credit agreement, require us to pay all amounts outstanding, require that we cash collateralize letters of credit issued under the credit agreement and restrict us from making acquisitions. If the maturity of our indebtedness is accelerated, we then may not have sufficient funds available for repayment or the ability to borrow or obtain sufficient funds to replace the accelerated indebtedness on terms acceptable to us, or at all.
Our current credit agreement also imposes restrictions on our ability to engage in certain activities, such as creating liens, making certain investments, incurring more debt, disposing of certain property, paying dividends and making distributions and entering into a new line of business. While these restrictions have not impeded our business operations to date, if our plans change, these restrictions could be burdensome or require that we pay fees to have the restrictions waived.
Any real or perceived internal or external electronic security breaches in connection with the use of our asset protection solutions could harm our reputation, inhibit market acceptance of our solutions and cause us to lose customers.
We and our customers use our asset protection solutions to compile and analyze sensitive or confidential customer-related information. In addition, some of our asset protection solutions allow us to remotely control and store data from equipment at commercial, institutional and industrial locations. Our asset protection solutions rely on the secure electronic transmission of proprietary data over the Internet or other networks. The occurrence or perception of security breaches in connection with our asset protection solutions or our customers’ concerns about Internet security or the security of our solutions, whether warranted or not, would likely harm our reputation or business, inhibit market acceptance of our asset protection solutions and cause us to lose customers, any of which would harm our financial condition and results of operations.
We may come into contact with sensitive information or data when we perform installation, maintenance or testing functions for our customers. Even the perception that we have improperly handled sensitive, confidential information would have a negative effect on our business. If, in handling this information, we fail to comply with privacy or security laws, we could incur civil liability to government agencies, customers and individuals whose privacy is compromised. In addition, third parties may attempt to breach our
security or inappropriately harm our asset protection solutions through computer viruses, electronic break-ins and other disruptions. If a breach is successful, confidential information may be improperly obtained, for which we may be subject to lawsuits and other liabilities.
Risks Related to Our Common Stock
Our stock price could fluctuate for numerous reasons, including variations in our results.
Our quarterly operating results have fluctuated in the past and may do so in the future. Accordingly, we believe that period-to-period comparisons of our results of operations may be the best indicators of our business. You should not rely upon the results of one quarter as an indication of future performance. Our revenues and operating results may fall below the expectations of securities analysts or investors in any future period. Our failure to meet these expectations may cause the market price of our common stock to decline, perhaps substantially. Our quarterly revenues and operating results may vary depending on a number of factors, including those listed previously under “Risks Related to Our Business.” In addition, the price of our common stock is subject to general economic, market, industry, and competitive conditions, the risk factors discussed below and numerous other conditions outside of our control.
A significant stockholder controls the direction of our business. The concentrated ownership of our common stock may prevent other stockholders from influencing significant corporate decisions.
Dr. Sotirios J. Vahaviolos, our Chairman, President and Chief Executive Officer, owns approximately 44% of our outstanding common stock. As a result, Dr. Vahaviolos effectively controls our Company and has the ability to exert substantial influence over all matters requiring approval by our shareholders, including the election and removal of directors, amendments to our certificate of incorporation, and any proposed merger, consolidation or sale of all or substantially all of our assets and other corporate transactions. This concentration of ownership could be disadvantageous to other shareholders with differing interests from Dr. Vahaviolos.
We currently have no plans to pay dividends on our common stock.
We have not declared or paid any cash dividends on our common stock to date, and we do not anticipate declaring or paying any dividends on our common stock in the foreseeable future. To the extent we do not pay dividends on our common stock, investors must look solely to stock appreciation for a return on their investment.
Shares eligible for future sale may cause the market price for our common stock to decline even if our business is doing well.
Future sales by us or by our existing shareholders of substantial amounts of our common stock in the public market, or the perception that these sales may occur, could cause the market price of our common stock to decline. This could also impair our ability to raise additional capital in the future through the sale of our equity securities. Under our second amended and restated certificate of incorporation, we are authorized to issue up to 200,000,000 shares of common stock, of which approximately 28,456,000 shares of common stock were outstanding as of August 1, 2014. In addition, we have approximately 3,403,000 shares of common stock reserved for issuance related to stock options and restricted stock units that were outstanding as of August 1, 2014. We cannot predict the size of future issuances of our common stock or the effect, if any, that future sales and issuances of shares of our common stock, or the perception of such sales or issuances, would have on the market price of our common stock.
Provisions of our charter, bylaws and of Delaware law could discourage, delay or prevent a change of control of our company, which may adversely affect the market price of our common stock.
Certain provisions of our second amended and restated certificate of incorporation and amended and restated bylaws could discourage, delay or prevent a merger, acquisition, or other change of control that stockholders may consider favorable, including transactions in which our stockholders might otherwise receive a premium for their shares. These provisions also could limit the price that investors might be willing to pay in the future for shares of our common stock, thereby depressing the market price of our common stock. Stockholders who wish to participate in these transactions may not have the opportunity to do so. Furthermore, these provisions could prevent or frustrate attempts by our stockholders to replace or remove our management. These provisions:
· allow the authorized number of directors to be changed only by resolution of our board of directors;
· require that vacancies on the board of directors, including newly created directorships, be filled only by a majority vote of directors then in office;
· authorize our board of directors to issue, without stockholder approval, preferred stock that, if issued, could operate as a “poison pill” to dilute the stock ownership of a potential hostile acquirer to prevent an acquisition that is not approved by our board of directors;
· require that stockholder actions must be effected at a duly called stockholder meeting by prohibiting stockholder action by written consent;
· prohibit cumulative voting in the election of directors, which would otherwise allow holders of less than a plurality of stock to elect some directors; and
· establish advance notice requirements for stockholder nominations to our board of directors or for stockholder proposals that can be acted on at stockholder meetings and limit the right to call special meetings of stockholders to the Chairman of the Board, the Chief Executive Officer, the board of directors acting pursuant to a resolution adopted by a majority of directors or the Secretary upon the written request of stockholders entitled to cast not less than 35% of all the votes entitled to be cast at such meeting.
In addition, because we are incorporated in Delaware, we are governed by the provisions of Section 203 of the Delaware General Corporation Law, which may, unless certain criteria are met, prohibit large stockholders, in particular those owning 15% or more of our outstanding voting stock, from merging or combining with us for a prescribed period of time.
ITEM 1B. UNRESOLVED STAFF COMMENTS
None.
As of May 31, 2014, we operated approximately 105 offices in 16 countries, with our corporate headquarters located in Princeton Junction, New Jersey. Our headquarters in Princeton Junction is our primary location, where most of our manufacturing and research and development is conducted. While we lease most of our facilities, as of May 31, 2014, we owned properties located in Olds, Alberta; Monroe, North Carolina; Trainer, Pennsylvania; LaPonte, Texas; Burlington, Washington; Gillette, Wyoming; and Jonquiere, Quebec. These properties, as well as approximately 75 offices throughout North America (including Canada), are utilized by our Services segment. Our Products and Systems segment’s primary location is in our Princeton Junction, NJ facility. Our International segment has approximately 40 offices including locations in Belgium, Brazil, France, Germany, Greece, India, Japan, the Netherlands, Russia and the United Kingdom. We believe that all of our facilities are well maintained and are suitable and adequate for our current needs.
We are subject to periodic lawsuits, investigations and claims that arise in the ordinary course of business. See “Litigation” in Note 18 — Commitments and Contingencies to our audited consolidated financial statements contained in Item 8 of this report for a description of legal proceedings involving us and our business, which is incorporated herein by reference.
In early 2012, we received notice of a governmental investigation concerning an environmental incident which occurred in February 2011, outside on the premises of our Cudahy, California facility, where we provide in-house or shop inspection and nondestructive testing at the Cudahy premises. On February 11, 2011, while liquid hazardous waste was being pumped into the tanker truck of an unaffiliated certified hazardous waste transporter at the Cudahy facility, a chemical reaction occurred that caused an emission of a vapor cloud. No human injury or property damage was reported or appears to have been caused as a result of the incident. On January 13, 2012, when we received grand jury subpoenas from the U.S. Attorney’s Office for the Central District of California in connection with an Environmental Protection Agency criminal investigation. The subpoena requested documents and information relating to, among other things, our handling, identification, storage and disposal of hazardous waste, training records, corporate environmental policies, and analytical results of the tests concerning the hazardous materials involved in the incident. We were informed by the U.S. Attorney’s Office for the Central District of California soon thereafter that we are a target of a criminal investigation into potential violations of the Resource Conservation and Recovery Act. The violations are alleged to be related to purportedly improper storage and labeling of hazardous waste at the Cudahy facility. This U.S. Attorney’s Office also raised a concern about a possible obstruction of justice issue involving the conduct of one or more of our employees at this facility. We have produced
documents in response to the subpoena, and are aware that at least one of our employees testified before the grand jury, but to our knowledge, this matter has been dormant since April 2012.
While we cannot predict the ultimate outcome of this matter, based on our internal investigation to date, we do not believe the outcome will have a material effect on our financial condition or results of operations.
ITEM 4. MINE SAFETY DISCLOSURES
None.
ITEM 5. MARKET FOR REGISTRANT’S COMMON EQUITY, RELATED STOCKHOLDER MATTERS AND ISSUER PURCHASE OF EQUITY SECURITIES
Market for Common Stock
Our common stock currently trades on the New York Stock Exchange (NYSE) under the ticker symbol “MG”. The following table sets forth for the periods indicated the range of high and low sales prices of our common stock.
|
|
|
Year ended May 31, 2014 |
|
Year ended May 31, 2013 |
| ||||||||
|
|
|
High |
|
Low |
|
High |
|
Low |
| ||||
|
|
|
|
|
|
|
|
|
|
| ||||
|
Quarter ended August 31, |
|
$ |
22.37 |
|
$ |
16.60 |
|
$ |
26.98 |
|
$ |
19.28 |
|
|
Quarter ended November 30, |
|
$ |
20.33 |
|
$ |
15.99 |
|
$ |
24.26 |
|
$ |
19.05 |
|
|
Quarter ended February 28, |
|
$ |
25.23 |
|
$ |
19.40 |
|
$ |
25.35 |
|
$ |
19.97 |
|
|
Quarter ended May 31, |
|
$ |
24.29 |
|
$ |
20.42 |
|
$ |
24.50 |
|
$ |
18.15 |
|
Holders of Record
As of August 1, 2014, there were approximately 15 holders of record of our Common Stock. The number of record holders was determined from the records of our transfer agent and does not include beneficial owners of common stock whose shares are held in the names of various security brokers, dealers, and registered clearing agencies. The transfer agent of our common stock is American Stock Transfer & Trust Company, 6201 15th Avenue, Brooklyn, New York 11219.
Dividends
No cash dividends have been paid on our Common Stock to date. We currently intend to retain our future earnings, if any, to finance the expansion of our business and do not expect to pay any cash dividends in the foreseeable future.
Purchases of Equity Securities
The following sets forth the shares of our common stock we acquired during the fourth quarter of fiscal 2014 pursuant to the surrender of shares by employees to satisfy tax withholding obligations in connection with the vesting of restricted stock units.
|
Fiscal Quarter |
|
Total Number of |
|
Average Price Paid |
| |
|
May 31, 2014 |
|
90 |
|
$ |
22.50 |
|
ITEM 6. SELECTED FINANCIAL DATA
The following table presents selected financial data for each of the last five fiscal years. This selected financial data should be read in conjunction with “Management’s Discussion and Analysis of Financial Condition and Results of Operations” in Item 7 and the audited consolidated financial statements and the notes thereto in Item 8 in this Annual Report.
|
|
|
For the year ended May 31, |
| |||||||||||||
|
|
|
2014 |
|
2013 |
|
2012 |
|
2011 |
|
2010 |
| |||||
|
|
|
($ in thousands, except share and per share data) |
| |||||||||||||
|
Statement of Income Data |
|
|
|
|
|
|
|
|
|
|
| |||||
|
Revenues |
|
$ |
623,447 |
|
$ |
529,282 |
|
$ |
436,875 |
|
$ |
338,589 |
|
$ |
272,128 |
|
|
Gross profit |
|
172,943 |
|
148,371 |
|
129,690 |
|
103,403 |
|
83,138 |
| |||||
|
Income from operations |
|
38,295 |
|
27,554 |
|
36,098 |
|
29,611 |
|
20,897 |
| |||||
|
Net income attributable to common shareholders |
|
$ |
22,518 |
|
$ |
11,646 |
|
$ |
21,353 |
|
$ |
16,431 |
|
$ |
16,928 |
|
|
|
|
|
|
|
|
|
|
|
|
|
| |||||
|
Per Share Information: |
|
|
|
|
|
|
|
|
|
|
| |||||
|
Weighted average common shares outstanding: |
|
|
|
|
|
|
|
|
|
|
| |||||
|
Basic |
|
28,365 |
|
28,141 |
|
27,839 |
|
26,724 |
|
21,744 |
| |||||
|
Diluted |
|
29,324 |
|
29,106 |
|
28,685 |
|
26,933 |
|
24,430 |
| |||||
|
Earnings (loss) per common share: |
|
|
|
|
|
|
|
|
|
|
| |||||
|
Basic |
|
$ |
0.79 |
|
$ |
0.41 |
|
$ |
0.77 |
|
$ |
0.61 |
|
$ |
0.78 |
|
|
Diluted |
|
$ |
0.77 |
|
$ |
0.40 |
|
$ |
0.74 |
|
$ |
0.61 |
|
$ |
0.43 |
|
|
|
|
|
|
|
|
|
|
|
|
|
| |||||
|
Balance Sheet Data |
|
|
|
|
|
|
|
|
|
|
| |||||
|
Cash and cash equivalents |
|
$ |
10,020 |
|
$ |
7,802 |
|
$ |
8,410 |
|
$ |
10,879 |
|
$ |
16,037 |
|
|
Total assets |
|
443,972 |
|
377,997 |
|
329,816 |
|
248,637 |
|
189,939 |
| |||||
|
Total long-term debt, including current portion |
|
76,648 |
|
60,267 |
|
40,229 |
|
21,851 |
|
13,301 |
| |||||
|
Obligations under capital leases, including current portion |
|
20,915 |
|
17,689 |
|
19,045 |
|
15,476 |
|
14,569 |
| |||||
|
Total Mistras Group, Inc. stockholders’ equity |
|
$ |
242,104 |
|
$ |
210,053 |
|
$ |
193,012 |
|
$ |
167,157 |
|
$ |
130,286 |
|
|
|
|
|
|
|
|
|
|
|
|
|
| |||||
|
Cash Flow Data: |
|
|
|
|
|
|
|
|
|
|
| |||||
|
Net cash provided by operating activities |
|
$ |
36,873 |
|
$ |
43,503 |
|
$ |
31,402 |
|
$ |
25,254 |
|
$ |
18,987 |
|
|
Net cash used in investing activities |
|
(38,005 |
) |
(45,479 |
) |
(37,512 |
) |
(36,478 |
) |
(16,534 |
) | |||||
|
Net cash provided by financing activities |
|
3,262 |
|
1,144 |
|
2,009 |
|
5,344 |
|
8,083 |
| |||||
ITEM 7. MANAGEMENT’S DISCUSSION AND ANALYSIS OF FINANCIAL CONDITION AND RESULTS OF OPERATION
The following Management’s Discussion and Analysis (“MD&A”) provides a narrative of our results of operations for the years ended May 31, 2014, 2013 and 2012, respectively, and our financial position as of May 31, 2014 and 2013, respectively. The MD&A should be read together with our consolidated financial statements and related notes included in Item 8 in this Annual Report on Form 10-K. In this annual report, our fiscal years, which end on May 31, are identified according to the calendar year in which they end (e.g., the fiscal year ended May 31, 2014 is referred to as “fiscal 2014”), and unless otherwise specified or the context otherwise requires, “Mistras,” “the Company,” “we,” “us” and “our” refer to Mistras Group, Inc. and its consolidated subsidiaries. The MD&A includes the following sections:
· Forward-Looking Statements
· Overview
· Consolidated Results of Operations
· Segment Results of Operations
· Liquidity and Capital Resources
· Critical Accounting Estimates
· Recent Accounting Pronouncements
Forward-Looking Statements
This report on Form 10-K contains forward-looking statements within the meaning of Section 27A of the Securities Act of 1933 (Securities Act), and Section 21E of the Securities Exchange Act of 1934 (Exchange Act). Such forward-looking statements include those that express plans, anticipation, intent, contingency, goals, targets or future development and/or otherwise are not statements of historical fact. See “Forward-Looking Statements” at the beginning if Item 1 of this Report.
Overview
We offer our customers “one source for asset protection solutions” ® and are a leading global provider of technology-enabled asset protection solutions used to evaluate the structural integrity and reliability of critical energy, industrial and public infrastructure. We combine industry-leading products and technologies, expertise in mechanical integrity (MI), Non-Destructive Testing (NDT), Destructive Testing (DT) and predictive maintenance (PdM) services, process and fixed asset engineering and consulting services, proprietary data analysis and its world class enterprise inspection database management and analysis software-PCMS to deliver a comprehensive portfolio of customized solutions, ranging from routine inspections to complex, plant-wide asset integrity management and assessments. These mission critical solutions enhance our customers’ ability to comply with governmental safety and environmental regulations, extend the useful life of their assets, increase productivity, minimize repair costs, manage risk and avoid catastrophic disasters. Our operations consist of three reportable segments: Services, International and Products and Systems.
· Services provides asset protection solutions in North America with the largest concentration in the United States along with a growing Canadian services business, consisting primarily of non-destructive testing and inspection services that are used to evaluate the structural integrity and reliability of critical energy, industrial and public infrastructure.
· International offers services, products and systems similar to those of the other segments to global markets, principally in Europe, the Middle East, Africa, Asia and South America, but not to customers in China and South Korea, which are served by the Products and Systems segment. South America consists of our Brazil operations.
· Products and Systems designs, manufactures, sells, installs and services the Company’s asset protection products and systems, including equipment and instrumentation, predominantly in the United States.
Given the role our solutions play in ensuring the safe and efficient operation of infrastructure, we have historically provided a majority of our services to our customers on a regular, recurring basis. We serve a global customer base of companies with asset-intensive infrastructure, including companies in the oil and gas (downstream, midstream, upstream and petrochemical), natural gas, fossil and nuclear power, transmission and distribution, alternative and renewable energy, public infrastructure, chemicals, aerospace and defense, transportation, primary metals and metalworking, pharmaceutical/biotechnology, food processing industries and research and engineering institutions. As of May 31, 2014, we had approximately 5,300 employees, including approximately 40 Ph.D.’s and 150 other degreed engineers and certified Level III technicians, in approximately 105 offices across 16 countries. We have established long-term relationships as a critical solutions provider to many of the leading companies in our target markets.
For the last several years, we have focused on introducing our advanced asset protection solutions to our customers using proprietary, technology-enabled software and testing instruments, including those developed by our Products and Systems segment. During this period, the demand for outsourced asset protection solutions, in general, has increased, creating demand from which our entire industry has benefited. We believe continued growth can be realized in all of our target markets. Concurrent with this growth, we have worked to build our infrastructure to profitably absorb additional growth and have made a number of acquisitions in an effort to leverage our fixed costs, grow our base of experienced, certified personnel, expand our product and technical capabilities and increase our geographical reach.
We have increased our capabilities and the size of our customer base through the development of applied technologies and managed support services, organic growth and the integration of acquired companies. These acquisitions have provided us with additional products, technologies, resources and customers that we believe will enhance our advantages over our competition.
The global economy continues to be fragile. Global financial markets continue to experience uncertainty, including tight liquidity and credit availability, relatively low consumer confidence, slow economic growth, persistently high unemployment rates and volatile currency exchange rates. However, we believe these conditions have allowed us to selectively hire new talented individuals that otherwise might not have been available to us, to acquire and develop new technologies in order to aggressively expand our proprietary portfolio of customized solutions, and to make acquisitions of complementary businesses at reasonable valuations.
Consolidated Results of Operations
The following table summarizes our consolidated statements of operations for fiscal 2014, 2013 and 2012:
|
|
|
For the year ended May 31, |
| |||||||
|
|
|
2014 |
|
2013 |
|
2012 |
| |||
|
|
|
($ in thousands) |
| |||||||
|
Revenues |
|
$ |
623,447 |
|
$ |
529,282 |
|
$ |
436,875 |
|
|
Gross profit |
|
172,943 |
|
148,371 |
|
129,690 |
| |||
|
Gross profit as a % of Revenue |
|
28 |
% |
28 |
% |
30 |
% | |||
|
Total operating expenses |
|
134,648 |
|
120,817 |
|
93,592 |
| |||
|
Operating expenses as a % of Revenue |
|
22 |
% |
23 |
% |
21 |
% | |||
|
Income from operations |
|
38,295 |
|
27,554 |
|
36,098 |
| |||
|
Income from operations as a % of Revenue |
|
6 |
% |
5 |
% |
8 |
% | |||
|
Interest expense |
|
3,192 |
|
3,288 |
|
3,132 |
| |||
|
Gain on extinguishment of long-term debt |
|
— |
|
— |
|
(671 |
) | |||
|
Income before provision for income taxes |
|
35,103 |
|
24,266 |
|
33,637 |
| |||
|
Provision for income taxes |
|
12,528 |
|
12,627 |
|
12,291 |
| |||
|
Net income |
|
22,575 |
|
11,639 |
|
21,346 |
| |||
|
Less: net (income) loss attributable to noncontrolling interests, net of taxes |
|
(57 |
) |
7 |
|
7 |
| |||
|
Net income attributable to Mistras Group, Inc. |
|
$ |
22,518 |
|
$ |
11,646 |
|
$ |
21,353 |
|
Our EBITDA and Adjusted EBITDA, non-GAAP measures explained below, for the years ended May 31, 2014, 2013 and 2012:
|
|
|
For the year ended May 31, |
| |||||||
|
|
|
2014 |
|
2013 |
|
2012 |
| |||
|
|
|
|
|
($ in thousands) |
|
|
| |||
|
Net income attributable to Mistras Group, Inc. |
|
$ |
22,518 |
|
$ |
11,646 |
|
$ |
21,353 |
|
|
Interest expense |
|
3,192 |
|
3,288 |
|
3,132 |
| |||
|
Provision for income taxes |
|
12,528 |
|
12,627 |
|
12,291 |
| |||
|
Depreciation and amortization |
|
28,429 |
|
26,647 |
|
22,024 |
| |||
|
EBITDA |
|
$ |
66,667 |
|
$ |
54,208 |
|
$ |
58,800 |
|
|
Share-based compensation expense |
|
6,261 |
|
6,285 |
|
5,097 |
| |||
|
Acquisition-related expense, net |
|
(2,657 |
) |
(2,141 |
) |
1,980 |
| |||
|
Goodwill impairment |
|
— |
|
9,938 |
|
|
| |||
|
Gain on extinguishment of debt |
|
— |
|
— |
|
(671 |
) | |||
|
Adjusted EBITDA |
|
$ |
70,271 |
|
$ |
68,290 |
|
$ |
65,206 |
|
Note about Non-GAAP Measures
EBITDA and Adjusted EBITDA are performance measures used by management that are not calculated in accordance with U.S. generally accepted accounting principles (GAAP). EBITDA is defined in this Report as net income attributable to Mistras Group, Inc. plus: interest expense, provision for income taxes and depreciation and amortization. Adjusted EBITDA is defined in this Report as net income attributable to Mistras Group, Inc. plus: interest expense, provision for income taxes, depreciation and amortization, share-based compensation expense, and certain acquisition-related costs (including transaction due diligence costs and adjustments to the fair value of contingent consideration) and certain non-recurring items (which items are listed in the reconciliation table above).
Our management uses EBITDA and Adjusted EBITDA as a measure of operating performance to assist in comparing performance from period to period on a consistent basis, as a measure for planning and forecasting overall expectations and for evaluating actual results against such expectations. Adjusted EBITDA is also used as a performance evaluation metric for our executive and employee incentive compensation programs.
Later in this report, the non-GAAP financial performance measures “Segment and Total Company Income from Operations before Acquisition-Related Expense (Benefit), net” is used, with tables reconciling the measures to financial measures under GAAP. These non-GAAP measures exclude from the GAAP measures income from operations (a) transaction expenses related to acquisitions, such as professional fees and due diligence costs and (b) the net changes in the fair value of acquisition-related contingent consideration liabilities. These items have been excluded from the GAAP measures because these expenses and credits are not related to the Company’s or Segment’s core business operations and are related solely to the Company’s or Segment’s acquisition activities. Changes in the fair value of acquisition-related contingent consideration liabilities can be a net expense or credit in any given period, and fluctuate based upon the then current value of cash consideration the Company expects to pay in the future for prior acquisitions, without impacting cash generated from the Company’s business operations.
We believe investors and other users of our financial statements benefit from the presentation of EBITDA, Adjusted EBITDA and “Segment and Total Company Income from Operations before Acquisition-Related Expense (Benefit), net” in evaluating our operating performance because it provides additional tools to compare our operating performance on a consistent basis and measure underlying trends and results in our business. EBITDA and Adjusted EBITDA remove the impact of certain items that management believes do not directly reflect our core operations. For instance, Adjusted EBITDA generally excludes interest expense, taxes and depreciation and amortization, each of which can vary substantially from company to company depending upon accounting methods and the book value and age of assets, capital structure, capital investment cycles and the method by which assets were acquired. It also eliminates share-based compensation, which is a non-cash expense and is excluded by management when evaluating the underlying performance of our business operations. Similarly, we believe that Segment and Total Company Income from Operations before Acquisition-Related Expense (Benefit), net, provides investors with useful information and more meaningful period over period comparisons by identifying and excluding these acquisition-related costs so that the performance of the core business operations can be identified and compared.
While Adjusted EBITDA is a term and financial measurement commonly used by investors and securities analysts, it has limitations. As a non-GAAP measurement, Adjusted EBITDA has no standard meaning and, therefore, may not be comparable with similar
measurements for other companies. Adjusted EBITDA is generally limited as an analytical tool because it excludes charges and expenses we do incur as part of our operations. For example, Adjusted EBITDA excludes income taxes, but we generally incur significant U.S. federal, state and foreign income taxes each year and the provision for income taxes is a necessary cost. EBITDA and Adjusted EBITDA should not be considered in isolation or as a substitute for analyzing our results as reported under U.S. generally accepted accounting principles. In addition, acquisitions are a part of our growth strategy, and therefore acquisition-related items are a necessary cost of the Company’s business. Segment and Total Company Income from Operations before Acquisition-Related Expense (Benefit), net, are not metrics used to determine incentive compensation for executives or employees.
Revenues
Our revenues by segment for fiscal 2014, 2013 and 2012 were as follows:
|
|
|
For the year ended May 31, |
| |||||||
|
|
|
2014 |
|
2013 |
|
2012 |
| |||
|
|
|
($ in thousands) |
| |||||||
|
Revenues |
|
|
|
|
|
|
| |||
|
Services |
|
$ |
443,229 |
|
$ |
380,851 |
|
$ |
349,793 |
|
|
International |
|
161,395 |
|
126,840 |
|
59,466 |
| |||
|
Products and Systems |
|
33,544 |
|
33,301 |
|
40,083 |
| |||
|
Corporate and eliminations |
|
(14,721 |
) |
(11,710 |
) |
(12,467 |
) | |||
|
|
|
$ |
623,447 |
|
$ |
529,282 |
|
$ |
436,875 |
|
Our growth rates for fiscal 2014, 2013 and 2012 were as follows:
|
|
|
For the year ended May 31, |
| |||||||
|
|
|
2014 |
|
2013 |
|
2012 |
| |||
|
|
|
($ in thousands) |
| |||||||
|
Revenue growth |
|
$ |
94,165 |
|
$ |
92,407 |
|
$ |
98,286 |
|
|
% Growth over prior year |
|
17.8 |
% |
21.2 |
% |
29.0 |
% | |||
|
|
|
|
|
|
|
|
| |||
|
Comprised of: |
|
|
|
|
|
|
| |||
|
% of organic growth |
|
8.5 |
% |
3.1 |
% |
15.6 |
% | |||
|
% of acquisition growth |
|
9.0 |
% |
18.7 |
% |
13.2 |
% | |||
|
% foreign exchange increase (decrease) |
|
0.3 |
% |
(0.6 |
)% |
0.2 |
% | |||
|
|
|
17.8 |
% |
21.2 |
% |
29.0 |
% | |||
Fiscal 2014
Our fiscal 2014 revenue was $623.5 million, an increase of $94.2 million or 18% compared to fiscal 2013 primarily as a result of growth in our Service and International segments. We estimate that our organic growth rate was approximately 9% in fiscal 2014 and growth from acquisitions was also 9%. In fiscal 2014, we estimate that organic growth by segment was approximately 12% for our Services segment, 3% for our International segment and 1% for our Products and Systems segment. We completed the acquisition of six companies in fiscal 2014 compared to three companies in fiscal 2013. We estimate our growth from acquisitions was approximately 5% for our Services segment and 23% for our International segment.
We continued to experience growth in many of our target markets in fiscal 2014. Our largest target market was oil and gas which represented approximately 49% and 50% of revenues in fiscal 2014 and 2013, respectively. Oil and gas revenues grew by 15% in fiscal 2014, led by growth in the downstream section of the industry. We also experienced growth in several of our other target markets outside of oil and gas, including aerospace and defense, power generation, industrial, process industries which include chemical and pharmaceutical, and infrastructure. Taken as a group, revenues for all target markets other than oil and gas grew approximately 20% over the prior year. Our top ten customers represented approximately 38% of our revenues for fiscal 2014 compared to 34% in fiscal 2013. No customer accounted for 10% or more of our revenues in fiscal 2014.
Fiscal 2013
Our fiscal 2013 revenue was $529.3 million, an increase of $92.4 million or 21% compared to fiscal 2012, primarily as a result of growth in our Service and International segments. We estimate that our organic growth rate, as compared to growth driven by acquisitions, was approximately 3% and 16% in fiscal 2013 and 2012, respectively. In fiscal 2013, we estimate that organic growth by segment was approximately 6% for our Services segment, 2% for our International segment and (24%) for our Products and Systems segment, where a large non-recurring military order was shipped in 2012. In fiscal 2013, we estimate that growth from acquisitions was approximately $81.7 million, or approximately 19%, compared to approximately $44.6 million, or approximately 13%, in fiscal 2012. We completed the acquisition of three companies in fiscal 2013 compared to eleven companies in fiscal 2012.
We continued to experience growth in many of our target markets in fiscal 2013. Our largest target market was oil and gas which represented approximately 50% and 54% of revenues in fiscal 2013 and 2012, respectively. Oil and gas revenues grew by 11% in fiscal 2013, led by growth in the midstream section of the industry. We also experienced growth in several of our other target markets outside of oil and gas, including aerospace and defense, industrial, process industries which include chemical and pharmaceutical, power generation, and infrastructure markets. Taken as a group, revenues for all target markets other than oil and gas grew approximately 34% over the prior year. Our top ten customers represented approximately 34% of our revenues for fiscal 2013 compared to 39% in fiscal 2012. Our largest customer in both periods accounted for approximately 11% and 16% of our revenues in fiscal 2013 and 2012, respectively. No other customer accounted for 10% or more of our revenues in fiscal 2013 or 2012.
Gross Profit. Our gross profit by segment for fiscal 2014, 2013 and 2012 was as follows:
|
|
|
For the year ended May 31, |
| |||||||
|
|
|
2014 |
|
2013 |
|
2012 |
| |||
|
|
|
($ in thousands) |
| |||||||
|
Gross profit |
|
|
|
|
|
|
| |||
|
Services |
|
$ |
114,182 |
|
$ |
98,907 |
|
$ |
94,413 |
|
|
International |
|
44,893 |
|
32,319 |
|
19,106 |
| |||
|
Products and Systems |
|
14,495 |
|
16,947 |
|
18,578 |
| |||
|
Corporate and eliminations |
|
(627 |
) |
198 |
|
(2,407 |
) | |||
|
|
|
$ |
172,943 |
|
$ |
148,371 |
|
$ |
129,690 |
|
Fiscal 2014
Gross profit increased $24.6 million, or 17% in fiscal 2014 compared to fiscal 2013. As a percentage of revenues, our gross profit was approximately 28% in both fiscal 2014 and 2013.
The slight 2014 decrease of 30 basis points in gross profit as a percentage of revenues was primarily attributable to several events that impacted the Company during its third quarter (“Q3 Items”), including bad weather conditions in North America that affected our customers and our entire industry, as well as costs to prepare to serve a large new customer in Alaska and an important new contract with a major integrated energy company with significant operations in the Canadian oil sands region. Additionally, the Company incurred staffing costs which preceded revenues pertaining to market share gains in France. The cumulative adverse impact of these Q3 Items aggregated approximately $3 million, approximately $2 million of which reduced gross profit and the remainder increased operating expenses during fiscal 2014. In addition, Advanced NDT services decreased as a percentage of total revenue to 14% of our Services segment revenues in fiscal 2014 compared to approximately 15% in fiscal 2013.
Fiscal 2013
Gross profit increased $18.7 million, or 14% in fiscal 2013 compared to fiscal 2012. As a percentage of revenues, gross profit was approximately 28% in fiscal 2013 and 30% in 2012.
The 170 basis point decrease in gross profit as a percentage of revenues was primarily attributable to several international acquisitions made during fiscal 2013 that reduced the International Segment’s gross margin rate from 32% in fiscal 2012 to 25% in fiscal 2013.
Income from Operations. The following table shows a reconciliation of the segment income from operations before acquisition-related (benefit) expense, net, to income from operations for fiscal 2014, 2013 and 2012:
|
|
|
For the year ended May 31, |
| |||||||
|
|
|
2014 |
|
2013 |
|
2012 |
| |||
|
|
|
($ in thousands) |
| |||||||
|
Services: |
|
|
|
|
|
|
| |||
|
Income from operations before acquisition-related expense, net |
|
$ |
44,846 |
|
$ |
41,750 |
|
$ |
40,506 |
|
|
Acquisition-related expense, net |
|
1,625 |
|
1,425 |
|
574 |
| |||
|
Income from operations |
|
43,221 |
|
40,325 |
|
39,932 |
| |||
|
|
|
|
|
|
|
|
| |||
|
International: |
|
|
|
|
|
|
| |||
|
Income from operations before acquisition-related (benefit) expense, net and goodwill impairment |
|
$ |
6,786 |
|
$ |
2,596 |
|
$ |
3,944 |
|
|
Acquisition-related (benefit) expense, net and goodwill impairment |
|
(3,452 |
) |
10,842 |
|
682 |
| |||
|
Income from operations |
|
10,238 |
|
(8,246 |
) |
3,262 |
| |||
|
|
|
|
|
|
|
|
| |||
|
Products and Systems: |
|
|
|
|
|
|
| |||
|
Income from operations before acquisition-related (benefit), net |
|
$ |
1,517 |
|
$ |
4,883 |
|
$ |
7,648 |
|
|
Acquisition-related (benefit), net |
|
(1,035 |
) |
(2,403 |
) |
(623 |
) | |||
|
Income from operations |
|
2,552 |
|
7,286 |
|
8,271 |
| |||
|
|
|
|
|
|
|
|
| |||
|
Corporate and Eliminations: |
|
|
|
|
|
|
| |||
|
Income from operations before acquisition-related expense (benefit), net |
|
$ |
(17,511 |
) |
$ |
(13,878 |
) |
$ |
(14,020 |
) |
|
Acquisition-related expense (benefit), net |
|
205 |
|
(2,067 |
) |
1,347 |
| |||
|
Income from operations |
|
(17,716 |
) |
(11,811 |
) |
(15,367 |
) | |||
|
|
|
|
|
|
|
|
| |||
|
Total Company |
|
|
|
|
|
|
| |||
|
Income from operations before acquisition-related (benefit) expense, net and goodwill impairment |
|
$ |
35,638 |
|
$ |
35,351 |
|
$ |
38,078 |
|
|
Acquisition-related (benefit) expense, net and goodwill impairment |
|
$ |
(2,657 |
) |
$ |
7,797 |
|
$ |
1,980 |
|
|
Income from operations |
|
$ |
38,295 |
|
$ |
27,554 |
|
$ |
36,098 |
|
Fiscal 2014
Income from operations, exclusive of acquisition-related items, but inclusive of the impact of the Q3 Items, was $35.6 million for fiscal 2014, a $0.3 million increased compared to fiscal 2013, which also excluded a goodwill impairment charge. As a percentage of revenues, our income from operations excluding acquisition-related items was approximately 6% and 7% in fiscal 2014 and fiscal 2013, respectively.
Operating expenses for fiscal 2014 increased $13.8 million, or 11%. Excluding acquisition related expense, operating expenses increased $24.3 million, or 21% during fiscal 2014. Operating expenses related to acquisitions accounted for $8.7 million of the total increase, while compensation and benefits increased $7.3 million due to normal compensation increases, incentive compensation and additional management and corporate staff to support growth. Depreciation and amortization expense increased by $1.8 million compared to fiscal 2013, while research and engineering expense increased by $0.5 million.
Our acquisition-related expense, net for fiscal 2014 decreased by $0.5 million, primarily attributed to adjustments to the estimated fair value of certain acquisition-related contingent consideration liabilities. The adjustments to the estimated fair value of certain acquisition-related contingent consideration liabilities in fiscal 2014 resulted in an increase to income from operations of $3.9 million. This was offset by approximately $1.3 million related to professional fees and other expenses in connection with our fiscal 2014 acquisition activity.
Fiscal 2013
Income from operations decreased $8.5 million, or 24% compared to fiscal 2012. The decrease was primarily due a goodwill impairment charge in the fourth quarter of fiscal 2013 which is further discussed in Note 8 — Goodwill to our consolidated financial
statements. As a percentage of revenues, our income from operations was approximately 5% and 8% in fiscal 2013 and fiscal 2012, respectively.
Operating expenses for fiscal 2013 increased $27.2 million, or 29%. Acquisitions accounted for approximately $16.2 million of the increase, while compensation and benefit expenses rose by $3.3 million driven by normal compensation increases, including incentive compensation, as well as additional management and corporate staff to support growth. Depreciation and amortization rose by $2.3 million.
Our acquisition-related expense, net for fiscal 2013 decreased by $4.1 million, which was attributed to adjustments to the estimated fair value of certain acquisition-related contingent consideration liabilities. The fiscal 2013 acquisition-related benefit of ($2.1) million consisted of adjustments to the estimated fair value of certain acquisition-related contingent consideration liabilities of $3.7 million, offset by $1.6 million related to professional fees and other expenses in connection with our fiscal 2013 acquisition activity.
Interest Expense
Interest expense was $3.2 million in fiscal 2014, $3.3 million in fiscal 2013 and $3.1 million in fiscal 2012. The small changes primarily related to small changes in our effective interest rate and our average borrowings outstanding under our revolver agreement.
Income Taxes
Our effective income tax rate was approximately 36% for fiscal 2014 compared to 52% for fiscal 2013. The effective tax rate for fiscal 2013 was significantly impacted by the goodwill impairment charge that is not deductible for tax purposes. Excluding the impact of the impairment charge, our annual effective rate was approximately 37% for fiscal 2013. The decrease is primarily due to higher foreign income which is taxed at lower rates, offset by the impact of acquisition contingent consideration.
Segment Results of Operations
Services Segment
Selected financial information for the Services segment was as follows for fiscal 2014, 2013 and 2012:
|
|
|
For the years ended May 31, |
| |||||||
|
|
|
2014 |
|
2013 |
|
2012 |
| |||
|
|
|
($ in thousands) |
| |||||||
|
Services segment |
|
|
|
|
|
|
| |||
|
Revenues |
|
$ |
443,229 |
|
$ |
380,851 |
|
$ |
349,793 |
|
|
|
|
|
|
|
|
|
| |||
|
Gross profit |
|
$ |
114,182 |
|
$ |
98,907 |
|
$ |
94,413 |
|
|
as a % of segment revenue |
|
26 |
% |
26 |
% |
27 |
% | |||
|
|
|
|
|
|
|
|
| |||
|
Operating Expenses |
|
$ |
70,961 |
|
$ |
58,582 |
|
$ |
54,481 |
|
|
|
|
|
|
|
|
|
| |||
|
Income from operations |
|
$ |
43,221 |
|
$ |
40,325 |
|
$ |
39,932 |
|
|
as % of segment revenue |
|
10 |
% |
11 |
% |
11 |
% | |||
|
|
|
|
|
|
|
|
| |||
|
Income from operations before acquisition-related expense, net |
|
$ |
44,846 |
|
$ |
41,750 |
|
$ |
40,506 |
|
|
as % of segment revenue |
|
10 |
% |
11 |
% |
12 |
% | |||
|
|
|
|
|
|
|
|
| |||
|
Total depreciation and amortization |
|
$ |
17,794 |
|
$ |
18,296 |
|
$ |
17,763 |
|
Revenues
In fiscal 2014, our Services revenues increased $62.4 million, or 16% compared to fiscal 2013. The increase was attributable to organic growth of approximately 12% and growth from acquisitions of approximately 5%. The industries primarily contributing to growth were oil and gas, industrial and chemical, and power generation. Customers in the oil and gas industry accounted for approximately 62% of our Services segment revenues in fiscal 2014. We experienced growth in most of our other target markets due
to strong demand, the addition of new customers and increased revenues from existing customers. We increased revenues to existing customers by increasing our penetration on existing service offerings and providing different types of asset protection solutions. Our top ten customers accounted for approximately 48% and 44% of our Services segment revenues during fiscal 2014 and 2013, respectively. Revenues from our two largest customers represented approximately 11% and 10%, respectively, of our revenues for our Services segment in fiscal 2014. Revenues from these two customers as well as most of our larger oil and gas customers, are generated from numerous contracts at multiple sites.
In fiscal 2013, our Services revenues increased $31.1 million, or 9% compared to fiscal 2012. The increase was attributable to organic growth of approximately 6% and growth from acquisitions of approximately 3%. The industries primarily contributing to growth were oil and gas, and industrial and chemical. Customers in the oil and gas industry accounted for approximately 62% of our Services segment revenues in fiscal 2013 and 2012, respectively. One customer represented approximately 15% of our revenues for our Services segment in fiscal 2013.
Gross Profit
Our Services segment gross profit margin was 26% of segment revenues in both fiscal years 2014 and 2013. Services gross profit increased by $15.3 million or 15% over fiscal 2013. The 20 basis point decrease in our segment gross profit margin was driven by the Q3 Items, which more than offset other improvements.
Our Services segment gross profit margin was 27% of segment revenues in fiscal 2012. The 100 basis point decrease that occurred during fiscal 2013 was attributed primarily to a lower mix of advanced services margins and higher unbillable direct labor.
Income from Operations
Services segment income from operations was $43.2 million in fiscal 2014, an increase of $2.9 million or 7% compared to fiscal 2013. Our operating income as a percentage of segment revenues was approximately 10% in fiscal 2014.
Segment operating expenses rose by $12.4 million in fiscal 2014, or 21%. Operating expenses related to acquisitions drove approximately $3.4 million of the increase, while increased staffing levels and occupancy costs to support U.S and Canadian growth were $5.3 million and $1.5 million, respectively.
Services segment income from operations was $40.3 million in fiscal 2013, an increase of $0.4 million or 1% compared to fiscal 2012. Income from operations as a percentage of segment revenues was approximately 11% in fiscal 2013, excluding acquisition-related expense.
Operating expenses in our Services segment increased $4.1 million or 8% during fiscal 2013. Operating expenses related to acquisitions accounted for approximately $1.8 million of the increase, while compensation and benefit expenses rose by $2.1 million to support increased staffing.
International Segment
Selected financial information for our International segment was as follows for fiscal 2014, 2013 and 2012:
|
|
|
For the years ended May 31, |
| |||||||
|
|
|
2014 |
|
2013 |
|
2012 |
| |||
|
|
|
($ in thousands) |
| |||||||
|
International segment |
|
|
|
|
|
|
| |||
|
Revenues |
|
$ |
161,395 |
|
126,840 |
|
59,466 |
| ||
|
|
|
|
|
|
|
|
| |||
|
Gross profit |
|
$ |
44,893 |
|
32,319 |
|
19,106 |
| ||
|
as % of segment revenue |
|
28 |
% |
25 |
% |
32 |
% | |||
|
|
|
|
|
|
|
|
| |||
|
Operating Expenses |
|
$ |
34,655 |
|
$ |
40,565 |
|
$ |
15,844 |
|
|
|
|
|
|
|
|
|
| |||
|
Income (loss) from operations |
|
$ |
10,238 |
|
$ |
(8,246 |
) |
3,262 |
| |
|
as % of segment revenue |
|
6 |
% |
(7 |
)% |
5 |
% | |||
|
|
|
|
|
|
|
|
| |||
|
Income from operations before acquisition-related expense, net |
|
$ |
6,786 |
|
$ |
2,596 |
|
$ |
3,944 |
|
|
as % of segment revenue |
|
4 |
% |
2 |
% |
7 |
% | |||
|
|
|
|
|
|
|
|
| |||
|
Total depreciation and amortization |
|
$ |
8,065 |
|
$ |
6,200 |
|
$ |
2,342 |
|
Revenues
Our International segment revenues rose by $34.6 million, or 27% during fiscal 2014. Acquisition growth was 23%, driven by the year-over-year growth from two acquisitions made during fiscal 2013, while organic growth was 3%, driven by the addition of new contracts and increased demand for our services and products with existing customers. Our largest customer concentrations in our International segment in fiscal 2014 were aerospace and defense (38%), industrials (15%) and oil and gas (15%).
International segment revenues increased $67.4 million, or 113% during fiscal 2013 due entirely to acquisition growth. Fiscal 2013 organic growth was approximately 2% due to the addition of new contracts and increased demand for our services and products with existing customers. Our largest customer concentrations in our International segment in fiscal 2013 were aerospace and defense (28%), industrials (21%) and oil and gas (18%).
Gross Profit
International segment gross profit for fiscal 2014 was $44.9 million, or 28% of segment revenues, an increase of $12.6 million or 39% compared to fiscal 2013. The increase in gross profit margin was primarily attributable to several large product sales which typically have higher margins.
Our International segment gross profit for fiscal 2013 was $32.3 million, or 25% of segment revenues, an increase of $13.2 million when compared to fiscal 2012, which was $19.1 million, or 32% of segment revenues. The decrease in gross profit margin was driven by acquisitions made during fiscal 2013 and 2012, driven by integration costs and a shift to lower margin business.
Income (loss) from Operations
International segments income from operations was $10.2 million in fiscal 2014 compared to a loss from operations of $8.2 million in fiscal 2013. The fiscal 2013 loss from operations was primarily due to a goodwill impairment charge in our Brazil operations which is further described in Note 8 — Goodwill to our consolidated financial statements. Income from operations in fiscal 2014 was $6.8 million, excluding acquisition-related items, compared with $2.6 million in fiscal 2013. As a percentage of segment revenues, our income from operations, adjusted for the impairment charge and acquisition-related items, was 4% in fiscal 2014 and 2% in fiscal 2013.
Segment operating expenses were $34.7 million and $40.6 million in fiscal 2014 and 2013, respectively. Excluding the impairment charge and acquisition-related items, segment operating expenses in fiscal 2014 and 2013 were $38.1 million and $29.7 million, respectively. Operating expense, adjusted for the impairment charge and acquisition-related items, increased $8.4 million, primarily attributable to the 2013 acquisitions.
In fiscal 2013, our International segment recognized a loss from operations of $8.2 million compared income from operations of $3.3 million in fiscal 2012. The fiscal 2013 loss from operations was primarily due to the goodwill impairment charge in our Brazil
operations. Excluding the goodwill impairment charge and acquisition-related items, income from operations from our International segment was $2.6 million for fiscal 2013, a $1.3 million decrease from fiscal 2012. This reduction was driven by integration costs of our fiscal 2013 acquistions and a decline in profitability experienced by our Brazilian operations.
Products and Systems Segment
Selected financial information for the Products and Systems segment was as follows for fiscal 2014, 2013 and 2012:
|
|
|
For the years ended May 31, |
| |||||||
|
|
|
2014 |
|
2013 |
|
2012 |
| |||
|
|
|
($ in thousands) |
| |||||||
|
Products and Systems segment |
|
|
|
|
|
|
| |||
|
Revenues |
|
$ |
33,544 |
|
$ |
33,301 |
|
$ |
40,083 |
|
|
|
|
|
|
|
|
|
| |||
|
Gross profit |
|
$ |
14,495 |
|
$ |
16,947 |
|
$ |
18,578 |
|
|
as % of segment revenue |
|
43 |
% |
51 |
% |
46 |
% | |||
|
|
|
|
|
|
|
|
| |||
|
Operating Expenses |
|
$ |
11,943 |
|
$ |
9,661 |
|
$ |
10,307 |
|
|
|
|
|
|
|
|
|
| |||
|
Income from operations |
|
$ |
2,552 |
|
$ |
7,286 |
|
$ |
8,271 |
|
|
as % of segment revenue |
|
8 |
% |
22 |
% |
21 |
% | |||
|
|
|
|
|
|
|
|
| |||
|
Income from operations before acquisition-related expense, net |
|
$ |
1,517 |
|
$ |
4,883 |
|
$ |
7,648 |
|
|
as % of segment revenue |
|
5 |
% |
15 |
% |
19 |
% | |||
|
|
|
|
|
|
|
|
| |||
|
Total depreciation and amortization |
|
$ |
2,373 |
|
$ |
2,229 |
|
$ |
1,831 |
|
Revenues
Products and Systems segment revenues for fiscal 2014 were $33.5 million, an increase of $0.2 million or 1% compared to fiscal 2013. The increase in revenue is a result of the sale of several digital radiography systems to a customer in the aerospace industry offset by lower sales in our Acoustic Emission and Boiler Leak Detection product lines.
Products and Systems segment revenues decreased $6.8 million or 17% in fiscal 2013. The decrease in revenue was driven by a large non-recurring military order that occurred during fiscal 2012 as well as lower sales in the Acoustic Emission product line. These decreases were offset in part by the expansion of our Boiler Leak Detection product line.
Gross Profit
Products and Systems segment gross profit decreased by $2.5 million, or 14% compared to fiscal 2013. As a percentage of segment revenues, our gross profit margin was approximately 43% and 51% in fiscal 2014 and 2013, respectively. The gross profit margin decrease of 770 basis points in fiscal 2014 was attributable to an adverse sales mix of revenues, as sales of ultrasonic NDT solutions requiring more custom product engineering and large components increased during fiscal 2014.
Products and Systems segment gross profit decreased $1.6 million, or 9% in fiscal 2013 compared to fiscal 2012. As a percentage of segment revenues, our gross profit margin was approximately 51% and 46% in fiscal 2013 and 2012, respectively. The gross profit margin percentage decrease of 450 basis points in fiscal 2013 was attributable to the absence of the non-recurring military order from fiscal 2012.
Income from Operations
Products and Systems income from operations for fiscal 2014 decreased $4.7 million, or 65% compared to fiscal 2013. Excluding acquisition-related items, income from operations declined by $3.4 million in fiscal 2014, or 69% compared to fiscal 2013. Excluding acquisition-related items, our operating income as a percentage of segment revenues was approximately 5% in fiscal 2014 and 15% in fiscal 2013.
Products and Systems segment operating expenses increased by $2.3 million during fiscal 2014. Excluding acquisition-related expenses, segment operating expenses in fiscal 2014 increased by $0.9 million or 8% compared to fiscal 2013. The increase was
primarily attributed to higher research and engineering expenses of $0.5 million and higher compensation and benefit expenses of $0.4 million. Research and engineering expenses represented approximately 9% and 7% of our Products and Systems segment revenues for fiscal 2014 and fiscal 2013, respectively.
Our income from operations from our Products and Systems segment of $7.3 million for fiscal 2013 decreased $1.0 million, or 12% compared to fiscal 2012. Excluding acquisition-related items, income from operations was $4.9 million in fiscal 2013, a decrease of $2.8 million or 36% compared to $7.6 million in fiscal 2013. Excluding acquisition-related items, our operating income as a percentage of segment revenues was approximately 15% in fiscal 2013 and 19% in fiscal 2012.
Segment operating expenses were $9.7 million in fiscal 2013, and $10.3 million in fiscal 2012. Excluding acquisition-related expenses, segment operating expenses in fiscal 2013 were $12.1 million an increase of $1.1 million or 10% compared to $10.9 million in fiscal 2012. The largest increase in these costs was attributed to an acquisition, which accounted for $0.9 million of operating expenses in fiscal 2013. Research and engineering expenses increased 19% to $2.4 million in fiscal 2013 compared to $2.1 million in fiscal 2012. These costs represented approximately 7% and 5% of Products and Systems segment revenues for fiscal 2013 and fiscal 2012, respectively.
Corporate and Eliminations
The elimination of revenues and cost of revenues primarily relates to the elimination in consolidation of revenues from sales of our Products and Systems segment to our International and Services segments. The other major item in the Corporate and eliminations grouping are the general and administrative costs not allocated to the other segments. These costs primarily include those for non-segment management, accounting and auditing, legal, human resources, acquisition transactional costs, and certain other costs. As a percentage of our total revenues, these costs have generally remained consistent over the last three fiscal years, consisting of approximately 3% of total revenues for each of the fiscal years ended 2014, 2013 and 2012, respectively. The increase in operating expenses in fiscal 2014 and 2013 primarily related to higher compensation and additional staff to support our growth and other increases in general expenses at our corporate offices.
Liquidity and Capital Resources
Overview
We have funded our operations through cash provided from operations, bank borrowings, stock offerings and capital lease financing transactions. We have used these proceeds to fund our operations, develop our technology, expand our sales and marketing efforts to new markets and acquire small companies or assets, primarily to add certified technicians and enhance our capabilities and geographic reach. We believe that our existing cash and cash equivalents, our anticipated cash flows from operating activities, and our available borrowings under our credit agreement will be sufficient to meet our anticipated cash needs over the next 12 months.
Cash Flows Table
The following table summarizes our cash flows for fiscal 2014, 2013 and 2012:
|
Fiscal year |
|
2014 |
|
2013 |
|
2012 |
| |||
|
($ in thousands) |
|
|
|
|
|
|
| |||
|
Net cash provided by (used in): |
|
|
|
|
|
|
| |||
|
Operating Activities |
|
$ |
36,873 |
|
$ |
43,503 |
|
$ |
31,402 |
|
|
Investing Activities |
|
(38,005 |
) |
(45,479 |
) |
(37,512 |
) | |||
|
Financing Activities |
|
3,262 |
|
1,144 |
|
2,009 |
| |||
|
Effect of exchange rate changes on cash |
|
88 |
|
224 |
|
1,632 |
| |||
|
Net change in cash and cash equivalents |
|
$ |
2,218 |
|
$ |
(608 |
) |
$ |
(2,469 |
) |
Cash Flows from Operating Activities
Cash provided by our operating activities in fiscal 2014 was $36.9 million, a decrease of $6.6 million over the prior fiscal year. Operating cash flow from net income excluding non-cash expenses rose by approximately $3.8 million in 2014. However, changes in operating assets used an incremental $10.4 million in cash during fiscal 2014. The incremental cash use was driven primarily by
growth in accounts receivable of approximately $28.6 million that was driven by increased sales. A net increase in cash provided by increased accounts payable and accrued expenses of approximately $20.0 million partially offset the growth in accounts receivable.
Cash provided by our operating activities in fiscal 2013 was $43.5 million, an increase of $12.1 million over the prior fiscal year. Positive operating cash flow was primarily attributable to our net income excluding depreciation, amortization and other non-cash items of $53.2 million offset by $9.7 million of cash utilized to fund an increase in our working capital, which primarily related to an increase in accrued expenses and payables, partially offset by a decrease in trade accounts receivable.
Cash Flows from Investing Activities
Net cash used in investing in activities was $38.0 million in fiscal 2014, principally to fund acquisitions of $21.9 million, net of cash acquired and capital expenditures of $16.9 million.
Net cash used in investing in activities was $45.5 million in fiscal 2013, principally to fund acquisitions of $33.1 million, net of cash acquired and capital expenditures of $12.5 million.
Cash Flows from Financing Activities
Net cash provided by financing activities in fiscal 2014 was $3.3 million, a decrease of $2.1 million from fiscal 2013. Net cash provided by financing activities related primarily to net borrowings under our revolving credit facility of $21.6 million, offset by repayments of our long-term debt and capital lease obligations of $8.8 million and $8.1 million, respectively.
Net cash provided by financing activities in fiscal 2013 was $1.1 million, a decrease of $0.9 million from fiscal 2012. Net cash provided by financing activities related primarily to net borrowings under our revolving credit facility of $14.6 million, offset by repayments of our capital lease obligations and long-term debt of $7.0 million and $5.1 million, respectively.
Effect of Exchange Rate on Changes in Cash
For fiscal 2014, 2013 and 2012, exchange rate changes increased our cash by $0.1 million, $0.2 million and $1.6 million, respectively.
Cash Balance and Credit Facility Borrowings
As of May 31, 2014, we had cash and cash equivalents totaling $10.0 million and available borrowing capacity of up to $60.4 million under our credit agreement (as defined below). There were borrowings of $61.1 million and a total of $3.5 million of letters of credit outstanding under the existing agreement as of May 31, 2014. We finance our operations primarily through our existing cash balances, cash collected from operations, bank borrowings and capital lease financing. We believe these sources are sufficient to fund our operations for the foreseeable future.
In December 2011, we entered into a Third Amended and Restated Credit Agreement (Credit Agreement), with Bank of America, N.A., as agent for the lenders and a lender, and JPMorgan Chase Bank, N.A., Keybank National Association and TD Bank, N.A., as lenders. The Credit Agreement provides us with a $125 million revolving line of credit, which, under certain circumstances, can be increased to $150 million. The Credit Agreement has a maturity date of December 20, 2016 and permits us to borrow up to $30 million in non-US dollar currencies and to use up to $10 million of the credit limit for the issuance of letters of credit. Loans under the Credit Agreement bear interest at LIBOR plus an applicable LIBOR margin ranging from 1% to 2%, or a base rate margin less a margin of 0.25% to 1.25%, at our option, or based upon our Funded Debt Leverage Ratio. Funded Debt Leverage Ratio is generally the ratio of (1) all outstanding indebtedness for borrowed money and other interest-bearing indebtedness as of the date of determination to (2) EBITDA (which is (a) net income, less (b) income (or plus loss) from discontinued operations and extraordinary items, plus (c) income tax expenses, plus (d) interest expense, plus (e) depreciation, depletion, and amortization (including non-cash loss on retirement of assets), plus (f) stock compensation expense, less (g) cash expense related to stock compensation, plus or minus certain other adjustments) for the period of four consecutive fiscal quarters immediately preceding the date of determination. We have the benefit of the lowest margin if our Funded Debt Leverage Ratio is equal to or less than 0.5 to 1, and the margin increases as the ratio increases, to the maximum margin if the ratio is greater than 2.5 to 1. We will also bear additional costs for market disruption, regulatory changes effecting the lenders’ funding costs, and default pricing of an additional 2% interest rate margin if the Funded Debt Leverage Ratio exceeds 3.0 to 1. Amounts borrowed under our Credit Agreement are secured by liens on substantially all of our assets.
The Credit Agreement contains financial covenants requiring that we maintain a Funded Debt Leverage Ratio of less than 3.0 to 1 and an Interest Coverage Ratio of at least 3.0 to 1. Interest Coverage Ratio means the ratio, as of any date of determination, of (a) EBITDA for the 12 month period immediately preceding the date of determination, to (b) all interest, premium payments, debt discount, fees, charges and related expenses of us and our subsidiaries in connection with borrowed money (including capitalized interest) or in connection with the deferred purchase price of assets, in each case to the extent treated as interest in accordance with GAAP, paid during the 12 month period immediately preceding the date of determination. The Credit Agreement also limits our ability to, among other things, create liens, make investments, incur more indebtedness, merge or consolidate, make dispositions of property, pay dividends and make distributions to stockholders, enter into a new line of business, enter into transactions with affiliates and enter into burdensome agreements. The Credit Agreement does not limit our ability to acquire other businesses or companies except that the acquired business or company must be in our line of business, we must be in compliance with the financial covenants on a pro forma basis after taking into account the acquisition, and, if the acquired business is a separate subsidiary, in certain circumstances the lenders will receive the benefit of a guaranty of the subsidiary and liens on its assets and a pledge of its stock.
As of May 31, 2014, we were in compliance with the terms of the credit agreement, and we will continuously monitor our compliance with the covenants contained in our credit agreement.
Liquidity and Capital Resources Outlook
Future Sources of Cash
We expect our future sources of cash to include cash flow generated from our operating activities and borrowings under our revolving credit facility. Our revolving credit facility is available for cash advances required for working capital and for letters of credit to support our operations. We are currently funding our acquisitions through our available cash, borrowings under our revolving credit facility and seller notes. We have an effective shelf registration statement with the SEC for the issuance of up to approximately $64.2 million of securities, including shares of common and preferred stock, debt securities, warrants and units. Accordingly, we may also seek to obtain capital through the issuance of debt or equity securities, or a combination of both. As of August 1, 2014, there were outstanding borrowings of approximately $65.8 million and approximately $4.0 million letters of credit outstanding under our under credit agreement.
Future Uses of Cash
We expect our future uses of cash will primarily be for acquisitions, international expansion, purchases or manufacture of field testing equipment to support growth, additional investments in technology and software products and the replacement of existing assets and equipment used in our operations. We often make purchases to support new sources of revenues, particularly in our Services segment. In addition, we will need to fund a certain amount of replacement equipment, including our fleet vehicles. We historically spend approximately 3% to 4% of our total revenues on capital expenditures, excluding acquisitions, and expect to fund these expenditures through a combination of cash and lease financing. Our cash capital expenditures, excluding acquisitions, for fiscal 2014, 2013 and 2012 were approximately 3%, 2% and 2% of revenues, respectively.
Our future acquisitions may also require capital. We acquired six companies in fiscal 2014 and three companies in fiscal 2013, with an initial cash outlay of $57.2 million. In some cases, additional equipment will be needed to upgrade the capabilities of these acquired companies. In addition, our future acquisition and capital spending may increase as we pursue growth opportunities. Other investments in infrastructure, training and software may also be required to match our growth, but we plan to continue using a disciplined approach to building our business. In addition, we will use cash to fund our operating leases, capital leases and long-term debt repayments and various other obligations as they arise.
We also expect to use cash to support our working capital requirements for our operations, particularly in the event of further growth and due to the impacts of seasonality on our business. Our future working capital requirements will depend on many factors, including the rate of our revenue growth, our introduction of new solutions and enhancements to existing solutions and our expansion of sales and marketing and product development activities. To the extent that our cash and cash equivalents and future cash flows from operating activities are insufficient to fund our future activities, we may need to raise additional funds through bank credit arrangements, public or private equity financings, or debt financings. We also may need to raise additional funds in the event we determine in the future to effect one or more acquisitions of businesses, technologies or products that will complement our existing operations. In the event additional funding is required, we may not be able to obtain bank credit arrangements or effect an equity or debt financing on terms acceptable to us or at all.
Contractual Obligations
We generally do not enter into long-term minimum purchase commitments. Our principal commitments, in addition to those related to our long-term debt discussed below, consist of obligations under facility leases for office space and equipment leases and contingent consideration obligations in connection with our acquisitions.
The following table summarizes our outstanding contractual obligations as of May 31, 2014:
|
($ in thousands) |
|
Total |
|
Fiscal |
|
Fiscal |
|
Fiscal |
|
Fiscal |
|
Fiscal |
|
2020 & |
| |||||||
|
Long-term debt (1) |
|
$ |
76,648 |
|
$ |
8,058 |
|
$ |
5,901 |
|
$ |
62,182 |
|
$ |
140 |
|
$ |
335 |
|
$ |
32 |
|
|
Capital lease obligations (2) |
|
22,227 |
|
8,246 |
|
6,256 |
|
4,161 |
|
2,448 |
|
994 |
|
122 |
| |||||||
|
Operating lease obligations |
|
33,364 |
|
8,141 |
|
6,317 |
|
5,027 |
|
3,689 |
|
3,401 |
|
6,789 |
| |||||||
|
Contingent consideration obligations |
|
14,146 |
|
4,770 |
|
4,464 |
|
2,671 |
|
2,241 |
|
— |
|
— |
| |||||||
|
Total |
|
$ |
146,385 |
|
$ |
29,215 |
|
$ |
22,938 |
|
$ |
74,041 |
|
$ |
8,518 |
|
$ |
4,730 |
|
$ |
6,943 |
|
(1) Consists primarily of borrowings from our senior credit facility and seller notes payable in connection with our acquisitions and includes the current portion outstanding.
(2) Includes estimated cash interest to be paid over the remaining terms of the leases.
(3) Consists of payments deemed reasonably likely to occur in connection with our acquisitions
Off-Balance Sheet Arrangements
During fiscal 2014, 2013 and 2012, we did not have any relationships with unconsolidated entities or financial partnerships, such as entities often referred to as structured finance or special purpose entities, which would have been established for the purpose of facilitating off-balance sheet arrangements or other contractually narrow or limited purposes.
Critical Accounting Policies and Estimates
The preparation of financial statements in accordance with generally accepted accounting principles requires that we make estimates and assumptions that affect the reported amounts of assets and liabilities and disclosure of contingent assets and liabilities at the date of financial statements and the reported amounts of revenues and expenses during the reporting period. The accounting policies that we believe require more significant estimates and assumptions include: revenue recognition, valuations of accounts receivable, long-lived assets, goodwill, and deferred tax assets and uncertain tax positions. We base our estimates and assumptions on historical experience, known or expected trends and various other assumptions that we believe to be reasonable. As future events and their effects cannot be determined with precision, actual results could differ significantly from these estimates, which may cause our future results to be significantly affected.
We believe that the following critical accounting policies comprise the more significant estimates and assumptions used in the preparation of our consolidated financial statements.
Revenue Recognition
Revenue is generally recognized when persuasive evidence of an arrangement exists, services have been rendered or products have been delivered, the fee is fixed or determinable, and collectability is reasonably assured, as summarized below.
Services
Revenue is primarily derived from providing services on a time and material basis. Service arrangements generally consist of inspection professionals working under contract for a fixed period of time or on a specific customer project. Revenue is generally recognized when the service is performed in accordance with terms of each customer arrangement, upon completion of the earnings process and when collection is reasonably assured. At the end of any reporting period, revenue is accrued for services that have been earned which have not yet been billed. Reimbursable costs, including those related to travel and out-of-pocket expenses, are included in revenue, and equivalent amounts of reimbursable costs are included in cost of services.
Products and Systems
Sales of products and systems are recorded when the sales price is fixed and determinable and the risks and rewards of ownership are transferred (generally upon shipment) and when collectability is reasonably assured.
These arrangements generally contain multiple elements or deliverables, such as hardware, software (that is essential to the functionality of the hardware) and related services. We recognize revenue for delivered elements as separate units of accounting, when the delivered elements have standalone value, uncertainties regarding customer acceptance are resolved and there are no refund or return rights for the delivered elements. We establish the selling prices for each deliverable based on our vendor-specific objective evidence (“VSOE”), if available, third-party evidence, if VSOE is not available, or estimated selling price (“ESP”) if neither VSOE nor third-party evidence is available. We establish VSOE of selling price using the price charged for a deliverable when sold separately and, in rare instances, using the price established by management having the relevant authority. Third-party evidence of selling price is established by evaluating largely similar and interchangeable competitor products or services in standalone sales to similarly situated customers. We determine ESP by considering internal factors such as margin objectives, pricing practices and controls, customer segment pricing strategies and the product life cycle. Consideration is also given to market conditions such as competitor pricing strategies and industry technology life cycles. When determining ESP, we apply management judgment to establish margin objectives and pricing strategies and to evaluate market conditions and product life cycles. Changes in the aforementioned factors may result in a different allocation of revenue to the deliverables in multiple element arrangements and therefore may change the pattern and timing of revenue recognition for these elements, but will not change the total revenue recognized for the arrangement.
A portion of our revenue is generated from engineering and manufacturing of custom products under long-term contracts that may last from several months to several years, depending on the contract. Revenues from long-term contracts are recognized on the percentage-of-completion method of accounting. Under the percentage-of-completion method of accounting revenues are recognized as work is performed. The percentage of completion at any point in time is generally based on total costs or total labor dollars incurred to date in relation to the total estimated costs or total labor dollars estimated at completion. The percentage of completion is then applied to the total contract revenue to determine the amount of revenue to be recognized in the period. Application of the percentage-of-completion method of accounting requires the use of estimates of costs to be incurred for the performance of the contract. Contract costs include all direct materials, direct labor costs and those indirect costs related to contract performance, such as indirect labor, supplies, tools, repairs, and all costs associated with operation of equipment. The cost estimation process is based upon the professional knowledge and experience of our engineers, project managers and financial professionals. Factors that are considered in estimating the work to be completed include the availability and productivity of labor, the nature and complexity of the work to be performed, the effect of change orders, the availability of materials, the effect of any delays in our project performance and the recoverability of any claims. Whenever revisions of estimated contract costs and contract values indicate that the contract costs will exceed estimated revenues, thus creating a loss, a provision for the total estimated loss is recorded in that period.
Accounts Receivable
Accounts receivable arise from services provided or products and systems sold to the Company’s customers. The Company records an allowance for doubtful accounts to provide for losses on accounts receivable due to a customer’s inability to pay. The allowance is typically estimated based on an analysis of the historical rate of credit losses or write-offs, specific concerns and known or expected trends. Such analysis is inherently subjective. The Company’s earnings will be impacted in the future to the extent that actual credit loss experience differs from amounts estimated. Changes in the financial condition of the Company’s customers or adverse developments in negotiations or legal proceedings to obtain payment could result in the actual loss exceeding the estimated allowance.
Long-Lived Assets
We perform a review of long-lived assets for impairment when events or changes in circumstances indicate the carrying value of such assets may not be recoverable. If an indication of impairment is present, we compare the estimated undiscounted future cash flows to be generated by the asset to its carrying amount. If the undiscounted future cash flows are less than the carrying amount of the asset, we record an impairment loss equal to the excess of the asset’s carrying amount over its fair value. We estimate fair value based on valuation techniques such as a discounted cash flow analysis or a comparison to fair values of similar assets. As of May 31, 2014 and 2013, we had $77.8 million and $68.4 million in net property, plant and equipment, respectively, and $57.9 million and $52.4 million in intangible assets, net, respectively. There were no long-lived asset impairment charges recorded during the years ended May 31, 2014, 2013 or 2012.
Long-lived assets, net, outside of the U.S. totaled $124.8 million and $113.4 million as of May 31, 2014 and 2013, respectively.
Goodwill
Goodwill represents the excess purchase price of acquired businesses over the fair values attributed to underlying net tangible assets and identifiable intangible assets. We test the carrying value of goodwill for impairment at a “reporting unit” level (which for the Company is represented by (i) our Services segment, (ii) our Products and Systems segment, and (iii) the European component and (iv) Brazilian component of our International segment), using a two-step approach, annually as of March 1, or whenever an event occurs or circumstances change that would more likely than not reduce the fair value of a reporting unit below its carrying amount. If the fair value of a reporting unit is less than its carrying value, this is an indicator that the goodwill assigned to that reporting unit may
be impaired. In this case, a second step is performed to allocate the fair value of the reporting unit to the assets and liabilities of the reporting unit as if it had just been acquired in a business combination, and as if the purchase price was equivalent to the fair value of the reporting unit. The excess of the fair value of the reporting unit over the amounts assigned to its assets and liabilities is referred to as the implied fair value of goodwill. The implied fair value of the reporting unit’s goodwill is then compared to the actual carrying value of goodwill. If the implied fair value is less than the carrying value, we would be required to recognize an impairment loss for that excess. We consider the income and market approaches to estimating the fair value of our reporting units, which requires significant judgment in evaluation of, among other things, economic and industry trends, estimated future cash flows, discount rates and other factors.
As of May 31, 2014, the carrying amount of our goodwill was approximately $130.5 million, of which approximately $43.6 million relates to our International segment. A significant portion of our international operations are concentrated in our Europe and Brazil reporting units. The economic environments in Europe and Brazil were difficult in 2013, with signs of recovery especially in Europe in fiscal 2014. As a result of a contraction in the Brazilian economy (specifically in the oil and gas industry), in the fourth quarter of fiscal 2013 we recognized goodwill impairment in our Brazil reporting unit of approximately $9.9 million. Significant deterioration in industry or economic trends, disruptions to our business, inability to effectively integrate acquired businesses, or other factors, may cause further impairment charges to goodwill in future periods. We believe that the estimated fair values of each of our reporting units were substantially in excess of their respective carrying amounts as of May 31, 2014.
Income Taxes
Income taxes are accounted for under the asset and liability method. This process requires that we assess temporary differences between the book and tax basis of assets resulting from differing treatment between book and tax of certain items, such as depreciation. Deferred income tax assets and liabilities are recognized based on the future tax consequences attributable to differences between the financial statement carrying amounts of existing assets and liabilities and their respective tax bases and tax credit carryforwards. Deferred income tax assets and liabilities are measured using enacted tax rates expected to apply to taxable income in the years in which those temporary differences are expected to be recovered or settled. The effect on deferred income tax assets and liabilities of a change in tax rates is recognized in income in the period that includes the enactment date.
A valuation allowance is provided if it is more likely than not that some or all of the deferred income tax assets will not be realized. We consider all available evidence, both positive and negative, to determine whether, based on the weight of the evidence, a valuation allowance is needed. Evidence used includes information about our current financial position and our results of operations for the current and preceding years, as well as all currently available information about future years, including our anticipated future performance, the reversal of deferred tax liabilities and tax planning strategies.
As of May 31, 2014 and 2013, we had a net deferred income tax benefit of $0.5 million and $1.4 million, respectively. With the exception of certain state and foreign deferred tax assets, we believe that it is more likely than not that we will have sufficient future taxable income to allow us to realize the benefits of our deferred tax assets. As of May 31, 2014 the Company had Federal net operating loss carry forwards (NOL’s) in the amount of approximately $0.4 million which may be utilized subject to limitation under Internal Revenue code section 382. In addition, as of May 31, 2014 the Company had state and foreign net operating loss carry forwards (NOLs) available to offset future income of $2.6 million and $11.0 million, respectively. The deferred tax asset related to these NOL’s is approximately $3.7 million. The Company maintains a valuation allowance of approximately $2.6 million at May 31, 2014 of which approximately $1.9 million relates to our state and foreign NOL’s.
Our effective income tax rate was approximately 36%, 52% and 37% for fiscal 2014, 2013 and 2012, respectively. Excluding the goodwill impairment charge in fiscal 2013, our effective income tax rate was approximately 37% for fiscal 2013. Income tax expense varies as a function of pre-tax income and the level of non-deductible expenses, such as certain amounts of meals and entertainment expense, valuation allowances, and other permanent differences. It is also affected by discrete items that may occur in any given year, but are not consistent from year to year. Our effective income tax rate may fluctuate significantly over the next few years due to many variables including the amount and future geographic distribution of our pre-tax income, changes resulting from our acquisition strategy, and increases or decreases in our permanent differences.
Recent Accounting Pronouncements
On May 28, 2014, the FASB issued ASU No. 2014-09, Revenue from Contracts with Customers, which requires an entity to recognize the amount of revenue to which it expects to be entitled for the transfer of promised goods or services to customers. The ASU will replace most existing revenue recognition guidance in U.S. GAAP when it becomes effective. The new standard is effective for the Company on January 1, 2017. Early application is not permitted. The standard permits the use of either the retrospective or cumulative effect transition method. The Company is evaluating the effect that ASU 2014-09 will have on its consolidated financial statements
and related disclosures. The Company has not yet selected a transition method nor has it determined the effect of the standard on its ongoing financial reporting.
In February 2013, the Financial Accounting Standards Board (FASB) issued Accounting Standard Update (ASU) 2013-02, Reporting of Amounts Reclassified Out of Accumulated Other Comprehensive Income, which expands the disclosure requirements for amounts reclassified out of accumulated other comprehensive income. The update requires an entity to present either parenthetically on the face of the financial statement where net income is presented or in the notes to the financial statements, the effect of significant items reclassified in their entirety from accumulated other comprehensive income and identification of the respective line items effecting net income for instances when reclassification is required under GAAP. For items that are not required by GAAP to be reclassified in their entirety to net income, an entity is required to cross-reference to other disclosures as required by GAAP. The update does not change the current requirements for reporting net income or other comprehensive income in financial statements and is effective for annual and interim reporting periods beginning after December 15, 2012. The adoption of this pronouncement did not have a material impact on the Company’s consolidated financial statements.
In July 2012, the FASB issued ASU 2012-02, Intangibles — Goodwill and Other (Topic 350): Testing Indefinite-Lived Intangible Assets for Impairment, that is intended to reduce the cost and complexity of the impairment test for indefinite-lived intangible assets by providing an entity with the option to first assess qualitatively whether it is necessary to perform the quantitative impairment test that is currently in place. An entity would not be required to quantitatively calculate the fair value of an indefinite-lived intangible asset unless the entity determines that it is more likely than not that its fair value is less than its carrying amount. ASU 2012-02 is effective for annual and interim impairment test beginning after September 15, 2012. The adoption of this pronouncement did not have a material impact on the Company’s consolidated financial statements.
ITEM 7A. Quantitative and Qualitative Disclosures About Market Risk
Interest Rate Sensitivity
The company’s investment portfolio primarily includes cash equivalents for which the market values are not significantly affected by changes in interest rates. Our interest rate risk results primarily from our variable rate indebtedness under our credit facility, which is influenced by movements in short-term rates. Borrowings under our $125.0 million revolving credit facility are based on an LIBOR, plus an additional margin based on our Funded Debt Leverage Ratio. Based on the amount of variable rate debt, $61.1 million at May 31, 2014, an increase in interest rates by one hundred basis points from our current rate would increase annual interest expense by approximately $0.6 million.
Foreign Currency Risk
We have foreign currency exposure related to our operations in foreign locations. This foreign currency exposure, particularly the Euro, British Pound Sterling, Brazilian Real, Russian Ruble, Japanese Yen, Canadian Dollar and the Indian Rupee, arises primarily from the translation of our foreign subsidiaries’ financial statements into U.S. Dollars. For example, a portion of our annual sales and operating costs are denominated in British Pound Sterling and we have exposure related to sales and operating costs increasing or decreasing based on changes in currency exchange rates. If the U.S. Dollar increases in value against these foreign currencies, the value in U.S. Dollars of the assets and liabilities originally recorded in these foreign currencies will decrease. Conversely, if the U.S. Dollar decreases in value against these foreign currencies, the value in U.S. Dollars of the assets and liabilities originally recorded in these foreign currencies will increase. Thus, increases and decreases in the value of the U.S. Dollar relative to these foreign currencies have a direct impact on the value in U.S. Dollars of our foreign currency denominated assets and liabilities, even if the value of these items has not changed in their original currency. We do not currently enter into forward exchange contracts to hedge exposures denominated in foreign currencies. An unfavorable 10% change in the average U.S. Dollar exchange rates for fiscal 2014 would cause an increase in consolidated operating income of approximately $1.0 million and a favorable 10% change would cause a decrease of approximately $1.2 million. We may consider entering into hedging or forward exchange contracts in the future, as sales in international currencies increase due to an increase in our International segment.
Fair Value of Financial Instruments
We do not have material exposure to market risk with respect to investments, as our investments consist primarily of highly liquid investments purchased with a remaining maturity of three months or less. We do not use derivative financial instruments for speculative or trading purposes; however, this does not preclude our adoption of specific hedging strategies in the future.
Effects of Inflation and Changing Prices
Our results of operations and financial condition have not been significantly affected by inflation and changing prices.
ITEM 8. FINANCIAL STATEMENTS AND SUPPLEMENTARY DATA
Report of Independent Registered Public Accounting Firm
The Board of Directors and Stockholders
Mistras Group, Inc.:
We have audited the accompanying consolidated balance sheets of Mistras Group, Inc. and subsidiaries (the Company) as of May 31, 2014 and 2013, and the related consolidated statements of income, comprehensive income, equity, and cash flows for the years then ended. We also have audited the Company’s internal control over financial reporting as of May 31, 2014, based on criteria established in Internal Control — Integrated Framework issued by the Committee of Sponsoring Organizations of the Treadway Commission (COSO) in September 1992. The Company’s management is responsible for these consolidated financial statements, for maintaining effective internal control over financial reporting, and for its assertion of the effectiveness of internal control over financial reporting, included in the accompanying Management’s Report on Internal Control over Financial Reporting. Our responsibility is to express an opinion on these consolidated financial statements and an opinion on the Company’s internal control over financial reporting based on our audits.
We conducted our audits in accordance with the standards of the Public Company Accounting Oversight Board (United States). Those standards require that we plan and perform the audits to obtain reasonable assurance about whether the financial statements are free of material misstatement and whether effective internal control over financial reporting was maintained in all material respects. Our audits of the consolidated financial statements included examining, on a test basis, evidence supporting the amounts and disclosures in the financial statements, assessing the accounting principles used and significant estimates made by management, as well as evaluating the overall financial statement presentation. Our audit of internal control over financial reporting included obtaining an understanding of internal control over financial reporting, assessing the risk that a material weakness exists, and testing and evaluating the design and operating effectiveness of internal control based on the assessed risk. Our audits also included performing such other procedures as we considered necessary in the circumstances. We believe that our audits provide a reasonable basis for our opinions.
A company’s internal control over financial reporting is a process effected by those charged with governance, management, and other personnel, designed to provide reasonable assurance regarding the reliability of financial reporting and the preparation of financial statements for external purposes in accordance with generally accepted accounting principles. A company’s internal control over financial reporting includes those policies and procedures that (1) pertain to the maintenance of records that, in reasonable detail, accurately and fairly reflect the transactions and dispositions of the assets of the company; (2) provide reasonable assurance that transactions are recorded as necessary to permit preparation of financial statements in accordance with generally accepted accounting principles, and that receipts and expenditures of the company are being made only in accordance with authorizations of management and directors of the company; and (3) provide reasonable assurance regarding prevention or timely detection of unauthorized acquisition, use, or disposition of the company’s assets that could have a material effect on the financial statements.
Because of its inherent limitations, internal control over financial reporting may not prevent or detect and correct misstatements. Also, projections of any evaluation of effectiveness to future periods are subject to the risk that controls may become inadequate because of changes in conditions, or that the degree of compliance with the policies or procedures may deteriorate.
In our opinion, the consolidated financial statements referred to above present fairly, in all material respects, the financial position of Mistras Group, Inc. and subsidiaries as of May 31, 2014 and 2013, and the results of their operations and their cash flows for the years then ended, in conformity with U.S. generally accepted accounting principles. Also in our opinion, the Company maintained, in all material respects, effective internal control over financial reporting as of May 31, 2014, based on criteria established in Internal Control — Integrated Framework issued by the Committee of Sponsoring Organizations of the Treadway Commission in September 1992.
/s/ KPMG LLP
New York, New York
August 8, 2014
Report of Independent Registered Public Accounting Firm
To the Board of Directors and Stockholders of Mistras Group, Inc.:
In our opinion, the consolidated statements of income, comprehensive income, equity and cash flows for the year ended May 31, 2012 present fairly, in all material respects, the results of operations and cash flows of Mistras Group, Inc. and its subsidiaries for the year ended May 31, 2012, in conformity with accounting principles generally accepted in the United States of America. These financial statements are the responsibility of the Company’s management. Our responsibility is to express an opinion on these financial statements based on our audit. We conducted our audit of these statements in accordance with the standards of the Public Company Accounting Oversight Board (United States). Those standards require that we plan and perform the audit to obtain reasonable assurance about whether the financial statements are free of material misstatement. An audit includes examining, on a test basis, evidence supporting the amounts and disclosures in the financial statements, assessing the accounting principles used and significant estimates made by management, and evaluating the overall financial statement presentation. We believe that our audit provides a reasonable basis for our opinion.
/s/ PricewaterhouseCoopers, LLP
New York, New York
August 8, 2014
Mistras Group, Inc. and Subsidiaries
(in thousands, except share and per share data)
|
|
|
May 31, |
| ||||
|
|
|
2014 |
|
2013 |
| ||
|
ASSETS |
|
|
|
|
| ||
|
Current Assets |
|
|
|
|
| ||
|
Cash and cash equivalents |
|
$ |
10,020 |
|
$ |
7,802 |
|
|
Accounts receivable, net |
|
137,824 |
|
108,554 |
| ||
|
Inventories |
|
11,376 |
|
12,504 |
| ||
|
Deferred income taxes |
|
3,283 |
|
3,293 |
| ||
|
Prepaid expenses and other current assets |
|
12,626 |
|
8,156 |
| ||
|
Total current assets |
|
175,129 |
|
140,309 |
| ||
|
Property, plant and equipment, net |
|
77,811 |
|
68,419 |
| ||
|
Intangible assets, net |
|
57,875 |
|
52,428 |
| ||
|
Goodwill |
|
130,516 |
|
115,270 |
| ||
|
Deferred income taxes |
|
1,344 |
|
665 |
| ||
|
Other assets |
|
1,297 |
|
906 |
| ||
|
Total assets |
|
$ |
443,972 |
|
$ |
377,997 |
|
|
|
|
|
|
|
| ||
|
LIABILITIES AND EQUITY |
|
|
|
|
| ||
|
Current Liabilities |
|
|
|
|
| ||
|
Accounts payable |
|
$ |
14,978 |
|
$ |
8,490 |
|
|
Accrued expenses and other current liabilities |
|
54,650 |
|
47,839 |
| ||
|
Current portion of long-term debt |
|
8,058 |
|
7,418 |
| ||
|
Current portion of capital lease obligations |
|
7,251 |
|
6,766 |
| ||
|
Income taxes payable |
|
1,854 |
|
1,703 |
| ||
|
Total current liabilities |
|
86,791 |
|
72,216 |
| ||
|
Long-term debt, net of current portion |
|
68,590 |
|
52,849 |
| ||
|
Obligations under capital leases, net of current portion |
|
13,664 |
|
10,923 |
| ||
|
Deferred income taxes |
|
15,521 |
|
12,951 |
| ||
|
Other long-term liabilities |
|
17,014 |
|
18,778 |
| ||
|
Total liabilities |
|
201,580 |
|
167,717 |
| ||
|
|
|
|
|
|
| ||
|
Commitments and contingencies |
|
|
|
|
| ||
|
|
|
|
|
|
| ||
|
Equity |
|
|
|
|
| ||
|
Preferred stock, 10,000,000 shares authorized |
|
— |
|
— |
| ||
|
Common stock, $0.01 par value, 200,000,000 shares authorized, 28,455,781 and 28,210,862 shares issued and outstanding as of May 31, 2014 and May 31, 2013, respectively |
|
284 |
|
282 |
| ||
|
Additional paid-in capital |
|
201,831 |
|
195,241 |
| ||
|
Retained earnings |
|
41,500 |
|
18,982 |
| ||
|
Accumulated other comprehensive loss |
|
(1,511 |
) |
(4,452 |
) | ||
|
Total Mistras Group, Inc. stockholders’ equity |
|
242,104 |
|
210,053 |
| ||
|
Noncontrolling interests |
|
288 |
|
227 |
| ||
|
Total equity |
|
242,392 |
|
210,280 |
| ||
|
Total liabilities and equity |
|
$ |
443,972 |
|
$ |
377,997 |
|
The accompanying notes are an integral part of these consolidated financial statements.
Mistras Group, Inc. and Subsidiaries
Consolidated Statements of Income
(in thousands, except per share data)
|
|
|
For the year ended May 31, |
| |||||||
|
|
|
2014 |
|
2013 |
|
2012 |
| |||
|
Revenues: |
|
|
|
|
|
|
| |||
|
Services |
|
$ |
582,916 |
|
$ |
487,268 |
|
$ |
394,035 |
|
|
Products and systems |
|
40,531 |
|
42,014 |
|
42,840 |
| |||
|
Total revenues |
|
623,447 |
|
529,282 |
|
436,875 |
| |||
|
Cost of revenues: |
|
|
|
|
|
|
| |||
|
Cost of services |
|
415,970 |
|
346,769 |
|
271,676 |
| |||
|
Cost of products and systems sold |
|
16,725 |
|
16,276 |
|
19,940 |
| |||
|
Depreciation related to services |
|
16,734 |
|
16,963 |
|
14,929 |
| |||
|
Depreciation related to products and systems |
|
1,075 |
|
903 |
|
640 |
| |||
|
Total cost of revenues |
|
450,504 |
|
380,911 |
|
307,185 |
| |||
|
Gross profit |
|
172,943 |
|
148,371 |
|
129,690 |
| |||
|
|
|
|
|
|
|
|
| |||
|
Selling, general and administrative expenses |
|
123,690 |
|
101,792 |
|
83,098 |
| |||
|
Research and engineering |
|
2,995 |
|
2,447 |
|
2,059 |
| |||
|
Depreciation and amortization |
|
10,620 |
|
8,781 |
|
6,455 |
| |||
|
Acquisition-related expense, net |
|
(2,657 |
) |
(2,141 |
) |
1,980 |
| |||
|
Goodwill impairment |
|
— |
|
9,938 |
|
— |
| |||
|
Income from operations |
|
38,295 |
|
27,554 |
|
36,098 |
| |||
|
Other expenses: |
|
|
|
|
|
|
| |||
|
Interest expense |
|
3,192 |
|
3,288 |
|
3,132 |
| |||
|
Gain on extinguishment of long-term debt |
|
— |
|
— |
|
(671 |
) | |||
|
Income before provision for income taxes |
|
35,103 |
|
24,266 |
|
33,637 |
| |||
|
Provision for income taxes |
|
12,528 |
|
12,627 |
|
12,291 |
| |||
|
Net income |
|
22,575 |
|
11,639 |
|
21,346 |
| |||
|
Less: net (income) loss attributable to noncontrolling interests, net of taxes |
|
(57 |
) |
7 |
|
7 |
| |||
|
Net income attributable to Mistras Group, Inc. |
|
22,518 |
|
11,646 |
|
21,353 |
| |||
|
Earnings per common share |
|
|
|
|
|
|
| |||
|
Basic |
|
$ |
0.79 |
|
$ |
0.41 |
|
$ |
0.77 |
|
|
Diluted |
|
$ |
0.77 |
|
$ |
0.40 |
|
$ |
0.74 |
|
|
Weighted average common shares outstanding: |
|
|
|
|
|
|
| |||
|
Basic |
|
28,365 |
|
28,141 |
|
27,839 |
| |||
|
Diluted |
|
29,324 |
|
29,106 |
|
28,685 |
| |||
The accompanying notes are an integral part of these consolidated financial statements.
Mistras Group, Inc. and Subsidiaries
Consolidated Statements of Comprehensive Income
(in thousands)
|
|
|
For the year ended May 31, |
| |||||||
|
|
|
2014 |
|
2013 |
|
2012 |
| |||
|
Net income |
|
$ |
22,575 |
|
$ |
11,639 |
|
$ |
21,346 |
|
|
|
|
|
|
|
|
|
| |||
|
Other comprehensive (loss) income: |
|
|
|
|
|
|
| |||
|
Foreign currency translation adjustments |
|
2,941 |
|
(1,407 |
) |
(3,361 |
) | |||
|
Comprehensive income |
|
25,516 |
|
10,232 |
|
17,985 |
| |||
|
Less: net income attributable to noncontrolling interests |
|
(57 |
) |
7 |
|
7 |
| |||
|
Foreign currency translation adjustments |
|
(4 |
) |
2 |
|
11 |
| |||
|
Comprehensive income attributable to Mistras Group, Inc. |
|
$ |
25,455 |
|
$ |
10,241 |
|
$ |
18,003 |
|
The accompanying notes are an integral part of these consolidated financial statements.
Mistras Group, Inc. and Subsidiaries
Consolidated Statements of Equity
(in thousands)
|
|
|
Common Stock |
|
Additional |
|
Retained |
|
Accumulated |
|
Total |
|
Noncontrolling |
|
|
| |||||||||
|
|
|
Shares |
|
Amount |
|
capital |
|
deficit) |
|
income (loss) |
|
Equity |
|
Interest |
|
Total Equity |
| |||||||
|
|
|
|
|
|
|
|
|
|
|
|
|
|
|
|
|
|
| |||||||
|
Balance at May 31, 2011 |
|
27,667 |
|
$ |
277 |
|
$ |
180,594 |
|
$ |
(14,017 |
) |
$ |
303 |
|
$ |
167,157 |
|
$ |
329 |
|
$ |
167,486 |
|
|
|
|
|
|
|
|
|
|
|
|
|
|
|
|
|
|
|
| |||||||
|
Net income |
|
— |
|
— |
|
— |
|
21,353 |
|
— |
|
21,353 |
|
(7 |
) |
21,346 |
| |||||||
|
Other comprehensive loss, net of tax |
|
— |
|
— |
|
— |
|
— |
|
(3,350 |
) |
(3,350 |
) |
(11 |
) |
(3,361 |
) | |||||||
|
Share-based payments |
|
16 |
|
— |
|
5,097 |
|
— |
|
— |
|
5,097 |
|
— |
|
5,097 |
| |||||||
|
Net settlement on vesting of restricted stock units |
|
36 |
|
— |
|
(283 |
) |
— |
|
|
|
(283 |
) |
— |
|
(283 |
) | |||||||
|
Excess tax benefit from share-based payment compensation |
|
— |
|
— |
|
554 |
|
— |
|
— |
|
554 |
|
— |
|
554 |
| |||||||
|
Exercise of stock options |
|
307 |
|
3 |
|
2,481 |
|
— |
|
— |
|
2,484 |
|
— |
|
2,484 |
| |||||||
|
Noncontrolling interest in subsidiary |
|
— |
|
— |
|
— |
|
— |
|
— |
|
— |
|
(75 |
) |
(75 |
) | |||||||
|
Balance at May 31, 2012 |
|
28,026 |
|
$ |
280 |
|
$ |
188,443 |
|
$ |
7,336 |
|
$ |
(3,047 |
) |
$ |
193,012 |
|
$ |
236 |
|
$ |
193,248 |
|
|
|
|
|
|
|
|
|
|
|
|
|
|
|
|
|
|
|
| |||||||
|
Net income |
|
— |
|
— |
|
— |
|
11,646 |
|
— |
|
11,646 |
|
(7 |
) |
11,639 |
| |||||||
|
Other comprehensive income, net of tax |
|
— |
|
— |
|
— |
|
— |
|
(1,405 |
) |
(1,405 |
) |
(2 |
) |
(1,407 |
) | |||||||
|
Share-based payments |
|
15 |
|
— |
|
6,285 |
|
— |
|
— |
|
6,285 |
|
— |
|
6,285 |
| |||||||
|
Net settlement on vesting of restricted stock units |
|
85 |
|
1 |
|
(810 |
) |
— |
|
— |
|
(809 |
) |
— |
|
(809 |
) | |||||||
|
Excess tax benefit from share-based payment compensation |
|
— |
|
— |
|
495 |
|
— |
|
— |
|
495 |
|
— |
|
495 |
| |||||||
|
Exercise of stock options |
|
85 |
|
1 |
|
828 |
|
— |
|
— |
|
829 |
|
— |
|
829 |
| |||||||
|
Balance at May 31, 2013 |
|
28,211 |
|
$ |
282 |
|
$ |
195,241 |
|
$ |
18,982 |
|
$ |
(4,452 |
) |
$ |
210,053 |
|
$ |
227 |
|
$ |
210,280 |
|
|
|
|
|
|
|
|
|
|
|
|
|
|
|
|
|
|
|
| |||||||
|
Net income |
|
— |
|
— |
|
— |
|
22,518 |
|
— |
|
22,518 |
|
57 |
|
22,575 |
| |||||||
|
Other comprehensive income, net of tax |
|
— |
|
— |
|
— |
|
— |
|
2,941 |
|
2,941 |
|
4 |
|
2,945 |
| |||||||
|
Share-based payments |
|
19 |
|
— |
|
6,261 |
|
— |
|
— |
|
6,261 |
|
— |
|
6,261 |
| |||||||
|
Net settlement on vesting of restricted stock units |
|
123 |
|
1 |
|
(1,007 |
) |
— |
|
— |
|
(1,006 |
) |
— |
|
(1,006 |
) | |||||||
|
Excess tax benefit from share-based payment compensation |
|
— |
|
— |
|
340 |
|
— |
|
— |
|
340 |
|
— |
|
340 |
| |||||||
|
Exercise of stock options |
|
103 |
|
1 |
|
996 |
|
— |
|
— |
|
997 |
|
— |
|
997 |
| |||||||
|
Balance at May 31, 2014 |
|
28,456 |
|
$ |
284 |
|
$ |
201,831 |
|
$ |
41,500 |
|
$ |
(1,511 |
) |
$ |
242,104 |
|
$ |
288 |
|
$ |
242,392 |
|
The accompanying notes are an integral part of these consolidated financial statements.
Mistras Group, Inc. and Subsidiaries
Consolidated Statements of Cash Flows
(in thousands)
|
|
|
For the year ended May 31, |
| |||||||
|
|
|
2014 |
|
2013 |
|
2012 |
| |||
|
|
|
|
|
|
|
|
| |||
|
Cash flows from operating activities |
|
|
|
|
|
|
| |||
|
Net income |
|
$ |
22,575 |
|
$ |
11,639 |
|
$ |
21,346 |
|
|
Adjustments to reconcile net income to net cash provided by operating activities |
|
|
|
|
|
|
| |||
|
Depreciation and amortization |
|
28,429 |
|
26,647 |
|
22,024 |
| |||
|
Deferred income taxes |
|
(621 |
) |
(1,732 |
) |
(984 |
) | |||
|
Share-based compensation expense |
|
6,261 |
|
6,285 |
|
5,097 |
| |||
|
Goodwill impairment |
|
— |
|
9,938 |
|
— |
| |||
|
Fair value adjustments to contingent consideration |
|
(3,937 |
) |
(3,727 |
) |
174 |
| |||
|
Other |
|
617 |
|
472 |
|
(643 |
) | |||
|
Changes in operating assets and liabilities, net of effect of acquisitions |
|
|
|
|
|
|
| |||
|
Accounts receivable |
|
(23,857 |
) |
4,772 |
|
(18,030 |
) | |||
|
Inventories |
|
1,203 |
|
525 |
|
(1,708 |
) | |||
|
Prepaid expenses and other current assets |
|
(4,059 |
) |
(1,042 |
) |
(1,503 |
) | |||
|
Other assets |
|
36 |
|
462 |
|
(8 |
) | |||
|
Accounts payable |
|
6,125 |
|
(5,478 |
) |
3,149 |
| |||
|
Accrued expenses and other liabilities |
|
4,532 |
|
(3,832 |
) |
5,524 |
| |||
|
Income taxes payable |
|
(431 |
) |
(1,426 |
) |
(3,036 |
) | |||
|
Net cash provided by operating activities |
|
36,873 |
|
43,503 |
|
31,402 |
| |||
|
Cash flows from investing activities |
|
|
|
|
|
|
| |||
|
Purchase of property, plant and equipment |
|
(16,871 |
) |
(12,530 |
) |
(9,592 |
) | |||
|
Purchase of intangible assets |
|
(708 |
) |
(993 |
) |
(813 |
) | |||
|
Acquisition of businesses, net of cash acquired |
|
(21,924 |
) |
(33,122 |
) |
(29,216 |
) | |||
|
Proceeds from sale of equipment |
|
1,498 |
|
1,166 |
|
2,109 |
| |||
|
Net cash used in investing activities |
|
(38,005 |
) |
(45,479 |
) |
(37,512 |
) | |||
|
Cash flows from financing activities |
|
|
|
|
|
|
| |||
|
Repayment of capital lease obligations |
|
(8,139 |
) |
(6,972 |
) |
(6,984 |
) | |||
|
Repayment of long-term debt |
|
(8,830 |
) |
(5,075 |
) |
(12,346 |
) | |||
|
Net repayments of former revolver |
|
— |
|
— |
|
(3,850 |
) | |||
|
Net borrowings from current revolver |
|
21,580 |
|
14,568 |
|
25,000 |
| |||
|
Net repayments from other short-term borrowings |
|
— |
|
— |
|
(1,868 |
) | |||
|
Payment of financing costs |
|
— |
|
— |
|
(623 |
) | |||
|
Purchase of remaining noncontrolling interest in subsidiary |
|
— |
|
— |
|
(75 |
) | |||
|
Payment of contingent consideration for business acquisitions |
|
(1,678 |
) |
(1,892 |
) |
— |
| |||
|
Taxes paid related to net share settlement of equity awards |
|
(1,007 |
) |
(809 |
) |
(283 |
) | |||
|
Excess tax benefit from share-based payment compensation |
|
340 |
|
495 |
|
554 |
| |||
|
Proceeds from the exercise of stock options |
|
996 |
|
829 |
|
2,484 |
| |||
|
Net cash provided by financing activities |
|
3,262 |
|
1,144 |
|
2,009 |
| |||
|
Effect of exchange rate changes on cash and cash equivalents |
|
88 |
|
224 |
|
1,632 |
| |||
|
Net change in cash and cash equivalents |
|
2,218 |
|
(608 |
) |
(2,469 |
) | |||
|
Cash and cash equivalents: |
|
|
|
|
|
|
| |||
|
Beginning of period |
|
7,802 |
|
8,410 |
|
10,879 |
| |||
|
End of period |
|
$ |
10,020 |
|
$ |
7,802 |
|
$ |
8,410 |
|
|
Supplemental disclosure of cash paid |
|
|
|
|
|
|
| |||
|
Interest |
|
$ |
3,271 |
|
$ |
3,144 |
|
$ |
2,749 |
|
|
Income taxes |
|
$ |
12,920 |
|
$ |
15,639 |
|
$ |
14,871 |
|
|
Noncash investing and financing |
|
|
|
|
|
|
| |||
|
Equipment acquired through capital lease obligations |
|
$ |
11,031 |
|
$ |
3,886 |
|
$ |
9,504 |
|
|
Issuance of notes payable and other debt obligations primarily related to acquisitions |
|
$ |
336 |
|
$ |
7,715 |
|
$ |
3,340 |
|
The accompanying notes are an integral part of these consolidated financial statements.
Mistras Group, Inc. and Subsidiaries
Notes to Consolidated Financial Statements
(tabular dollars in thousands, except share and per share data)
1. Description of Business and Basis of Presentation
Description of Business
Mistras Group, Inc. and subsidiaries (the Company) is a leading “one source” global provider of technology-enabled asset protection solutions used to evaluate the structural integrity and reliability of critical energy, industrial and public infrastructure. The Company combines industry-leading products and technologies, expertise in mechanical integrity (MI) and non-destructive testing (NDT) services and proprietary data analysis software to deliver a comprehensive portfolio of customized solutions, ranging from routine inspections to complex, plant-wide asset integrity assessments and management. These mission critical solutions enhance customers’ ability to extend the useful life of their assets, increase productivity, minimize repair costs, comply with governmental safety and environmental regulations, manage risk and avoid catastrophic disasters. The Company serves a global customer base of companies with asset-intensive infrastructure, including companies in the oil and gas, fossil and nuclear power, alternative and renewable energy, public infrastructure, chemicals, aerospace and defense, transportation, primary metals and metalworking, pharmaceuticals and food processing industries.
Principles of Consolidation
The accompanying consolidated financial statements include the accounts of Mistras Group, Inc. and its wholly and majority-owned subsidiaries. Where the Company’s ownership interest is less than 100%, the noncontrolling interests are reported in stockholders’ equity in the accompanying consolidated balance sheets. The noncontrolling interests in net income, net of tax, is classified separately in the accompanying consolidated statements of income.
All significant intercompany accounts and transactions have been eliminated in consolidation. Mistras Group, Inc.’s and its subsidiaries’ fiscal years end on May 31 except for the subsidiaries in the International segment, which end on April 30. Accordingly, the Company’s International segment subsidiaries are consolidated on a one-month lag. Therefore, in the quarter and year of acquisition, results of acquired subsidiaries in the International segment are generally included in consolidated results for one less month than the actual number of months from the acquisition date to the end of the reporting period. Management does not believe that any events occurred during the one-month lag period that would have a material effect on the Company’s consolidated financial statements. Reference to a fiscal year means the fiscal year ended May 31.
Reclassifications
Certain amounts in prior periods have been reclassified to conform to the current year presentation. Such reclassifications did not have a material effect on the Company’s financial condition or results of operations as previously reported.
2. Summary of Significant Accounting Policies
Revenue Recognition
Revenue is generally recognized when persuasive evidence of an arrangement exists, services have been rendered or products have been delivered, the fee is fixed or determinable, and collectability is reasonably assured. The following revenue recognition policies define the manner in which we account for specific transaction types:
Services
Revenue is primarily derived from providing services on a time and material basis. Service arrangements generally consist of inspection professionals working under contract for a fixed period of time or on a specific customer project. Revenue is generally recognized when the service is performed in accordance with terms of each customer arrangement, upon completion of the earnings process and when collection is reasonably assured. At the end of any reporting period, revenue is accrued for services that have been earned which have not yet been billed. Reimbursable costs, including those related to travel and out-of-pocket expenses, are included in revenue, and equivalent amounts of reimbursable costs are included in cost of services.
Products and Systems
Sales of products and systems are recorded when the sales price is fixed and determinable and the risks and rewards of ownership are transferred (generally upon shipment) and when collectability is reasonably assured.
These arrangements generally contain multiple elements or deliverables, such as hardware software (that is essential to the functionality of the hardware) and related services. The Company recognizes revenue for delivered elements as separate units of accounting, when the delivered elements have standalone value, uncertainties regarding customer acceptance are resolved and there
are no refund or return rights for the delivered elements. The Company establishes the selling prices for each deliverable based on its, vendor-specific objective evidence (“VSOE”), if available, third-party evidence, if VSOE is not available, or estimated selling price (“ESP”) if neither VSOE nor third-party evidence is available. The Company establishes VSOE of selling price using the price charged for a deliverable when sold separately and, in rare instances, using the price established by management having the relevant authority. Third-party evidence of selling price is established by evaluating largely similar and interchangeable competitor products or services in standalone sales to similarly situated customers. The Company determines ESP, by considering Internal factors such as margin objectives, pricing practices and controls, customer segment pricing strategies and the product life cycle. Consideration is also given to market conditions such as competitor pricing strategies and Industry technology life cycles. When determining ESP, the Company applies management judgment to establish margin objectives and pricing strategies and to evaluate market conditions and product life cycles. Changes in the aforementioned factors may result in a different allocation of revenue to the deliverables in multiple element arrangements and therefore may change the pattern and timing of revenue recognition for these elements, but will not change the total revenue recognized for the arrangement.
A portion of the Company’s revenue is generated from engineering and manufacturing of custom products under long-term contracts that may last from several months to several years, depending on the contract. Revenues from long-term contracts are recognized on the percentage-of-completion method of accounting. Under the percentage-of-completion method of accounting revenues are recognized as work is performed. The percentage of completion at any point in time is generally based on total costs or total labor dollars incurred to date in relation to the total estimated costs or total labor dollars estimated at completion. The percentage of completion is then applied to the total contract revenue to determine the amount of revenue to be recognized in the period. Application of the percentage-of-completion method of accounting requires the use of estimates of costs to be incurred for the performance of the contract. Contract costs include all direct materials, direct labor costs and those indirect costs related to contract performance, such as indirect labor, supplies, tools, repairs, and all costs associated with operation of equipment. The cost estimation process is based upon the professional knowledge and experience of our engineers, project managers and financial professionals. Factors that are considered in estimating the work to be completed include the availability and productivity of labor, the nature and complexity of the work to be performed, the effect of change orders, the availability of materials, the effect of any delays in our project performance and the recoverability of any claims. Whenever revisions of estimated contract costs and contract values indicate that the contract costs will exceed estimated revenues, thus creating a loss, a provision for the total estimated loss is recorded in that period.
Use of Estimates
The preparation of financial statements in accordance with generally accepted accounting principles requires that the Company make estimates and assumptions that affect the reported amounts of assets, liabilities, revenue and expenses and disclosure of contingent assets and liabilities at the date of financial statements. The accounting policies that the Company believes require more significant estimates and assumptions include: revenue recognition, valuations of accounts receivable, long lived assets, goodwill, and deferred tax assets and uncertain tax positions. The Company bases its estimates and assumptions on historical experience, known or expected trends and various other assumptions that it believes to be reasonable. As future events and their effects cannot be determined with precision, actual results could differ significantly from these estimates, which may cause the Company’s future results to be significantly affected.
Cash and Cash Equivalents
The Company considers all highly liquid investments purchased with an original maturity of three months or less to be cash equivalents.
Accounts Receivable
Accounts receivable are stated net of an allowance for doubtful accounts and sales allowances. Outstanding accounts receivable balances are reviewed periodically, and allowances are provided at such time that management believes it is probable that such balances will not be collected within a reasonable period of time. The Company extends credit to its customers based upon credit evaluations in the normal course of business, primarily with 30-day terms. Bad debts are provided for based on historical experience and management’s evaluation of outstanding accounts receivable. Accounts are generally written off when they are deemed uncollectible.
Inventories
Inventories are stated at the lower of cost, as determined by using the first-in, first-out method, or market. Work in process and finished goods inventory include material, direct labor, variable costs and overhead.
Software Costs
Costs that are related to the conceptual formulation and design of licensed software are expensed as research and engineering. For software the Company licenses to customers, the Company capitalizes costs that are incurred between the date technological feasibility has been established and the date that the product becomes available for sale. Capitalized amounts are amortized
over three years, which is the estimated life of the related software. The Company performs periodic reviews to ensure that unamortized program costs remain recoverable from future revenues. Costs to support or service these licensed programs are expensed as the costs are incurred.
The Company capitalizes certain costs that are incurred to purchase or to create and implement internal-use software, which includes software coding, installation and testing. Capitalized costs are amortized on a straight-line basis over three years, the estimated useful life of the software.
Property, Plant and Equipment
Property, plant and equipment are recorded at cost. Depreciation of property, plant and equipment is computed utilizing the straight-line method over the estimated useful lives of the assets. Amortization of leasehold improvements is computed utilizing the straight-line method over the shorter of the remaining lease term or estimated useful life. Repairs and maintenance costs are expensed as incurred.
Goodwill
Goodwill represents the excess of the purchase price of acquired businesses over the fair values attributed to underlying net tangible assets and identifiable intangible assets. We test the carrying value of goodwill for impairment at a “reporting unit” level (which for the Company is represented by (i) our Services segment, (ii) our Products and Systems segment, and (iii) the European component and (iv) Brazilian component of our International segment), using a two-step approach, annually as of March 1, or whenever an event occurs or circumstances change that would more likely than not reduce the fair value of a reporting unit below its carrying amount. If the fair value of a reporting unit is less than its carrying value, this is an indicator that the goodwill assigned to that reporting unit may be impaired. In this case, a second step is performed to allocate the fair value of the reporting unit to the assets and liabilities of the reporting unit as if it had just been acquired in a business combination, and as if the purchase price was equivalent to the fair value of the reporting unit. The excess of the fair value of the reporting unit over the amounts assigned to its assets and liabilities is referred to as the implied fair value of goodwill. The implied fair value of the reporting unit’s goodwill is then compared to the actual carrying value of goodwill. If the implied fair value is less than the carrying value, we would be required to recognize an impairment loss for that excess. We consider the income and market approaches to estimating the fair value of our reporting units, which requires significant judgment in evaluation of, among other things, economic and industry trends, estimated future cash flows, discount rates and other factors.
As of May 31, 2014, the carrying amount of our goodwill was approximately $130.5 million, of which approximately $43.6 million relates to our International segment. A significant portion of our international operations are concentrated in our Europe and Brazil reporting units. The economic environments in Europe and Brazil were difficult in 2013, with signs of recovery especially in Europe in fiscal 2014. As a result of a contraction in the Brazilian economy (specifically in the oil and gas industry), in the fourth quarter of fiscal 2013 we recognized goodwill impairment in our Brazil reporting unit of approximately $9.9 million. Significant deterioration in industry or economic trends, disruptions to our business, inability to effectively integrate acquired businesses, or other factors, may cause further impairment charges to goodwill in future periods.
Impairment of Long-lived Assets
The Company reviews the recoverability of its long-lived assets on a periodic basis in order to identify indicators of a possible impairment. The assessment for potential impairment is based primarily on the Company’s ability to recover the carrying value of its long-lived assets from expected future undiscounted cash flows. If the total expected future undiscounted cash flows are less than the carrying amount of the assets, a loss is recognized for the difference between fair value (computed based upon the expected future discounted cash flows) and the carrying value of the assets.
Shipping and Handling Costs
Shipping and handling costs are included in cost of revenues.
Taxes Collected from Customers
Taxes collected from customers and remitted to governmental authorities are presented in the consolidated statements of income on a net basis.
Research and Engineering
Research and product development costs are expensed as incurred.
Advertising, Promotions and Marketing
The costs for advertising, promotion and marketing programs are expensed as incurred and are included in selling, general and administrative expenses. Advertising expense was approximately $1.8 million, $1.7 million and $1.1 million for fiscal 2014, 2013 and 2012, respectively.
Fair Value of Financial Instruments
The carrying amounts of cash and cash equivalents, accounts receivable, accounts payable and other financial current assets and liabilities approximate fair value based on the short-term nature of the items. The carrying value of long-term debt approximates fair value due to the variable-rate structure of the debt. The fair value of the Company’s notes payable and capital lease obligations approximate their carrying amounts as those obligations bear interest at rates which management believes would currently be available to the Company for similar obligations.
Foreign Currency Translation
The financial position and results of operations of the Company’s foreign subsidiaries are measured using their functional currencies, which, is their local currency. Assets and liabilities of foreign subsidiaries are translated into the U.S. Dollar at the exchange rates in effect at the balance sheet date. Income and expenses are translated at the average exchange rate during the period. Translation gains and losses are reported as a component of other comprehensive income for the period and included in accumulated other comprehensive income within stockholders’ equity.
Foreign currency (gains) and losses arising from transactions denominated in currencies other than the functional currency are included in net income reported in SG&A expenses and were approximately $0.1 million, $0.1 million and ($0.5) million in fiscal 2014, 2013 and 2012, respectively.
Derivative Financial Instruments
The Company recognizes its derivatives as either assets or liabilities, measures those instruments at fair value and recognizes the changes in fair value of the derivative in net income or other comprehensive income, as appropriate. Prior to fiscal 2013, the Company hedged a portion of its variable rate interest payments on debt using interest rate swap contracts to convert variable payments into fixed payments. The Company did not apply hedge accounting to their interest rate swap contracts. Changes in the fair value of these instruments were reported as a component of interest expense. As of May 31, 2014 and 2013, the Company had no outstanding interest rate swap contracts.
Concentrations of Credit Risk
Financial instruments that potentially subject the Company to concentrations of credit risk consist principally of cash and cash equivalents and accounts receivable. At times, cash deposits may exceed the limits insured by the Federal Deposit Insurance Corporation. The Company believes it is not exposed to any significant credit risk or risk of nonperformance of financial institutions.
The Company has one customer which accounted for 11% and 16% of revenues for fiscal 2013 and 2012, respectively. Accounts receivable from this customer was approximately 9% of total accounts receivable, net, at May 31, 2013. Our relationship with this customer comprised of separate contracts for non-destructive testing and inspection services with multiple affiliated entities within their broad organization. These contracts are typically negotiated locally with the specific location, are of varying lengths, have different start and end dates and differ in terms of the scope of work and nature of services provided. Most contracts are based on time and materials.
Self-Insurance
The Company is self-insured for certain losses relating to workers’ compensation and health benefits claims. The Company maintains third-party excess insurance coverage for all workers compensation and health benefit claims in excess of approximately $0.3 million to reduce its exposure from such claims. Self-insured losses are accrued when it is probable that an uninsured claim has been incurred but not reported and the amount of the loss can be reasonably estimated at the balance sheet date.
Share-based Compensation
We measure the value of services received from employees and directors in exchange for an award of an equity instrument based on the grant-date Fair Value of the award. The computed value is recognized as a non-cash cost on a straight-line basis over the period
the individual provides services, which is typically the vesting period of the award with the exception of awards containing an internal performance measure which is recognized on a straight-line basis over the vesting period subject to the probability of meeting the performance requirements and adjusted for the number of shares expected to be earned. As share-based compensation expense is based on awards ultimately expected to vest, the amount of expense has been reduced for estimated forfeitures. The cost of these awards is recorded in selling, general and administrative expense in the company’s consolidated statements of income.
There were no stock options granted in fiscal 2014 and 2013. The following table presents the assumptions used in the Black-Scholes option-pricing model during fiscal 2012 for awards made to employees:
|
Dividend yield |
|
0.0 |
% |
|
Expected volatility |
|
37 |
% |
|
Risk-free interest rate |
|
1.1 |
% |
|
Expected term (years) |
|
6.25 |
|
In fiscal 2014, the company granted performance restricted stock units containing service, performance and market conditions to the Company’s executive and certain other senior officers. These units have requisite service periods of three years and have no dividend rights. The performance condition is compounded annual growth rate for adjusted earnings per share, as defined in the plan agreement, which accounts for 75% of the awards. The grant-date fair value was used to value the awards related to the performance condition. The market condition is a relative total shareholder return (“TSR”) which accounts for 25% of the awards. The following table presents the assumptions used in a Monte Carlo simulation model to value the TSR components of the grants issued in fiscal 2014:
|
Dividend yield |
|
0.0 |
% |
|
Expected volatility |
|
38 |
% |
|
Risk-free interest rate |
|
0.7 |
% |
|
Expected term (years) |
|
2.6 |
|
Income Taxes
Income taxes are accounted for under the asset and liability method. Deferred income tax assets and liabilities are recognized for the future tax consequences attributable to differences between the financial statement carrying amounts of existing assets and liabilities and their respective tax bases and tax credit carry-forwards. Deferred income tax assets and liabilities are measured using enacted tax rates expected to apply to taxable income in the years in which those temporary differences are expected to be recovered or settled. The effect on deferred income tax assets and liabilities of a change in tax rates is recognized in income in the period that includes the enactment date. A valuation allowance is provided if it is more likely than not that some or all of a deferred income tax asset will not be realized. Financial accounting standards prescribe a minimum recognition threshold a tax position is required to meet before being recognized in the financial statements. These standards also provide guidance on de-recognition, measurement, and classification of amounts relating to uncertain tax positions, accounting for and disclosure of interest and penalties, accounting in interim periods and disclosures required. Interest and penalties related to unrecognized tax positions are recognized as incurred within “provision for income taxes” in the consolidated statements of income.
3. Earnings per Share
Basic earnings per share is computed by dividing net income attributable to common shareholders by the weighted average number of shares outstanding during the period. Diluted earnings per share is computed by dividing net income attributable to common shareholders by the sum of (1) the weighted average number of shares of common stock outstanding during the period, and (2) the dilutive effect of assumed conversion of equity awards using the treasury stock method. With respect to the number of weighted average shares outstanding (denominator), diluted shares reflects: (i) only the exercise of options to acquire common stock to the extent that the options’ exercise prices are less than the average market price of common shares during the period and (ii) the pro forma vesting of restricted stock units.
The following table sets forth the computations of basic and diluted earnings per share:
|
|
|
For the year ended May 31, |
| |||||||
|
|
|
2014 |
|
2013 |
|
2012 |
| |||
|
Basic earnings per share |
|
|
|
|
|
|
| |||
|
Numerator: |
|
|
|
|
|
|
| |||
|
Net income attributable to Mistras Group, Inc. |
|
$ |
22,518 |
|
$ |
11,646 |
|
$ |
21,353 |
|
|
Denominator |
|
|
|
|
|
|
| |||
|
Weighted average common shares outstanding |
|
28,365 |
|
28,141 |
|
27,839 |
| |||
|
Basic earnings per share |
|
$ |
0.79 |
|
$ |
0.41 |
|
$ |
0.77 |
|
|
|
|
|
|
|
|
|
| |||
|
Diluted earnings per share: |
|
|
|
|
|
|
| |||
|
Numerator: |
|
|
|
|
|
|
| |||
|
Net income attributable to Mistras Group, Inc. |
|
$ |
22,518 |
|
$ |
11,646 |
|
$ |
21,353 |
|
|
Denominator |
|
|
|
|
|
|
| |||
|
Weighted average common shares outstanding |
|
28,365 |
|
28,141 |
|
27,839 |
| |||
|
Dilutive effect of stock options outstanding |
|
775 |
|
804 |
|
737 |
| |||
|
Dilutive effect of restricted stock units outstanding |
|
184 |
|
161 |
|
109 |
| |||
|
|
|
29,324 |
|
29,106 |
|
28,685 |
| |||
|
Diluted earnings per share |
|
$ |
0.77 |
|
$ |
0.40 |
|
$ |
0.74 |
|
The following potential common shares were excluded from the computation of diluted earnings per share, as the effect would have been anti-dilutive:
|
|
|
For the year ended May 31, |
| ||||
|
|
|
2014 |
|
2013 |
|
2012 |
|
|
|
|
|
|
|
|
|
|
|
Potential common stock attributable to stock options outstanding |
|
5 |
|
5 |
|
5 |
|
|
Potential common stock attributable to performance awards outstanding |
|
121 |
|
— |
|
— |
|
|
Total |
|
126 |
|
5 |
|
5 |
|
4. Accounts Receivable, net
Accounts receivable consist of the following:
|
|
|
May 31, |
| ||||
|
|
|
2014 |
|
2013 |
| ||
|
|
|
|
|
|
| ||
|
Trade accounts receivable |
|
$ |
140,120 |
|
$ |
110,438 |
|
|
Allowance for doubtful accounts |
|
(2,296 |
) |
(1,884 |
) | ||
|
Accounts receivable, net |
|
$ |
137,824 |
|
$ |
108,554 |
|
The Company had $16.9 million and $8.1 million of unbilled revenues accrued for fiscal 2014 and 2013, respectively. Unbilled revenues for fiscal 2014 are expected to be billed in the first quarter fiscal 2014.
5. Inventories
Inventories consist of the following:
|
|
|
May 31, |
| ||||
|
|
|
2014 |
|
2013 |
| ||
|
|
|
|
|
|
| ||
|
Raw materials |
|
$ |
3,663 |
|
$ |
3,332 |
|
|
Work in progress |
|
2,069 |
|
2,310 |
| ||
|
Finished goods |
|
3,462 |
|
4,355 |
| ||
|
Services-related consumable supplies |
|
2,182 |
|
2,507 |
| ||
|
Inventory |
|
$ |
11,376 |
|
$ |
12,504 |
|
6. Property, Plant and Equipment, net
Property, plant and equipment consist of the following:
|
|
|
May 31, |
| ||||||
|
|
|
Useful Life |
|
2014 |
|
2013 |
| ||
|
|
|
(Years) |
|
|
|
|
| ||
|
Land |
|
|
|
$ |
1,938 |
|
$ |
1,943 |
|
|
Building and improvements |
|
30-40 |
|
22,983 |
|
20,973 |
| ||
|
Office furniture and equipment |
|
5-8 |
|
7,169 |
|
7,244 |
| ||
|
Machinery and equipment |
|
5-7 |
|
144,798 |
|
119,862 |
| ||
|
|
|
|
|
|
|
|
| ||
|
|
|
|
|
176,888 |
|
150,022 |
| ||
|
Accumulated depreciation and amortization |
|
|
|
(99,077 |
) |
(81,603 |
) | ||
|
Property, plant and equipment, net |
|
|
|
$ |
77,811 |
|
$ |
68,419 |
|
Depreciation expense was approximately $19.2 million, $18.9 million and $16.4 million for the years ended May 31, 2014, 2013 and 2012, respectively.
7. Acquisitions
During fiscal 2014, the Company completed the acquisition of six companies. Five of these companies are intended to complement the service offerings within the Services segment. The other company, located in Russia, is intended to complement the service offerings within the International segment and to continue its market expansion strategy. In these acquisitions, the Company acquired 100% of the common stock or certain assets of each acquiree in exchange for aggregate consideration of approximately $22.3 million in cash and accounted for such transactions in accordance with the acquisition method of accounting for business combinations. In addition to the cash consideration related to these acquisitions, the Company accrued a liability of approximately $4.0 million, which represents the estimated fair value of contingent consideration expected to be payable in the event that the acquired companies achieve specific performance metrics during various periods over the next three years of operations. The estimated total potential contingent consideration for these acquisitions ranges from zero to $6.2 million as of May 31, 2014.
During fiscal 2013, the Company completed the acquisition of three asset protection companies specializing in destructive and non-destructive services and inspection, and in-house component inspection. Two of these companies are intended to complement the service offerings within the International segment and to expand Mistras’ footprint in Europe. The other company, located in Canada, is intended to complement the service offerings within the Services segment. In these acquisitions, the Company acquired 100% of the common stock of each acquiree in exchange for an aggregate of approximately $35.0 million in cash and $7.7 million in notes payable over three years and accounted for such transactions in accordance with the acquisition method of accounting for business combinations. In addition to the cash and debt consideration related to these acquisitions, the Company accrued a liability of approximately $8.3 million, which represents the estimated fair value of contingent consideration expected to be payable in the event that the acquired companies achieve specific performance metrics over the next five years of operations.
The Company completed the acquisition of eleven companies during fiscal 2012. These acquisitions were for asset protection companies specializing in advanced ultrasonic inspection, NDT services and inspection, ultrasonic testing (UT) and acoustic emission (AE) products and systems, and in-house component inspection. These companies were acquired to complement the service and product offerings within the Services, Products and Systems, and International segments. Seven of the acquired companies have been integrated into the International segment; three of the acquired companies have been integrated into the Services segment; and one of the acquired companies has been integrated into the Products segment. The aggregate consideration totaled approximately $30.5 million in cash and $3.3 million in notes payable. In addition to the cash and debt consideration related to the acquisitions completed in fiscal 2012, the Company accrued a liability of approximately $8.5 million, which represents the estimated fair value of contingent consideration expected to be payable in the event that certain of the acquired companies achieve specific performance metrics over the next four years of operations.
Assets and liabilities of the acquired businesses were included in the consolidated balance sheets as of May 31, 2014 based on their estimated fair value on the date of acquisition as determined in a purchase price allocation, using available information and making assumptions management believes are reasonable. The results of operations of each of the acquisitions completed in fiscal 2013 are included in each respective operating segment’s results of operations from the date of acquisition. The Company’s allocation of purchase price for these acquisitions is included in the table below. The following table summarizes the estimated fair value of the assets acquired and liabilities assumed at the date of acquisition for fiscal 2014:
|
|
|
2014 |
|
2013 |
|
2012 |
| ||
|
|
|
|
|
|
|
|
| ||
|
Number of entities |
|
6 |
|
3 |
|
11 |
| ||
|
|
|
|
|
|
|
|
| ||
|
Cash paid |
|
$ |
22,272 |
|
$ |
34,968 |
|
30,453 |
|
|
Subordinated notes issued |
|
— |
|
7,715 |
|
3,348 |
| ||
|
Contingent consideration |
|
3,967 |
|
8,330 |
|
10,625 |
| ||
|
|
|
|
|
|
|
|
| ||
|
Consideration paid |
|
$ |
26,239 |
|
$ |
51,013 |
|
44,426 |
|
|
|
|
|
|
|
|
|
| ||
|
Current net assets |
|
3,133 |
|
761 |
|
(5,773 |
) | ||
|
Debt and other long-term liabilities |
|
(2,226 |
) |
(4,540 |
) |
(9,106 |
) | ||
|
Property, plant and equipment |
|
1,566 |
|
8,945 |
|
14,260 |
| ||
|
Deferred tax liability |
|
(2,248 |
) |
(7,654 |
) |
(1,746 |
) | ||
|
Intangibles |
|
12,993 |
|
25,491 |
|
11,934 |
| ||
|
Goodwill |
|
13,021 |
|
28,010 |
|
34,857 |
| ||
|
Net assets acquired |
|
$ |
26,239 |
|
$ |
51,013 |
|
44,426 |
|
The amortization period for intangible assets acquired ranges from two to twelve years. The Company recorded approximately $13.0 million and $28.0 million of goodwill in connection with its fiscal 2014 and 2013 acquisitions, respectively, reflecting the strategic fit and revenue and earnings growth potential of these businesses. The goodwill recorded in fiscal 2014 and 2013 relates primarily to the acquisition of the common stock of the acquiree, which is generally not deductible for tax purposes.
We are continuing our review of our fair value estimate of assets acquired and liabilities assumed for two entities disclosed above. This process will conclude as soon as we finalize information regarding facts and circumstances that existed as of the acquisition date. Goodwill and intangibles for these two entities totaled $0.8 million and $2.2 million, respectively. This measurement period will not exceed one year from the acquisition date.
Revenue included in the consolidated statement of operations for fiscal 2014 from these acquisitions for the period subsequent to the closing of each transaction was approximately $16.3 million. Aggregate income from operations included in the consolidated statement of operations for fiscal 2014 from these acquisitions for the period subsequent to the closing of each transaction was approximately $1.2 million. As these acquisitions are not significant to the Company’s fiscal 2014 results, no unaudited pro forma financial information has been included in this report.
In the course of its acquisition activities, the Company incurs costs in connection with due diligence, professional fees, and other expenses. Additionally, the Company adjusts the fair value of certain acquisition-related contingent consideration liabilities on a quarterly basis. These amounts are recorded as acquisition-related expense, net, on the consolidated statements of income and were as follows for fiscal 2014, 2013 and 2012:
|
|
|
For the years ended May 31, |
| |||||||
|
|
|
2014 |
|
2013 |
|
2012 |
| |||
|
|
|
|
|
|
|
|
| |||
|
Due dilgence, professional fees and other transaction costs |
|
$ |
1,280 |
|
$ |
1,586 |
|
$ |
1,806 |
|
|
Adjustments to fair value of contingent consideration liabilities |
|
$ |
(3,937 |
) |
$ |
(3,727 |
) |
$ |
174 |
|
|
Acquisition-related expense, net |
|
$ |
(2,657 |
) |
$ |
(2,141 |
) |
$ |
1,980 |
|
The Company’s contingent consideration liabilities are recorded on the balance sheet in accrued expenses and other liabilities.
8. Goodwill
The changes in the carrying amount of goodwill by segment is shown below:
|
|
|
Services |
|
International |
|
Products |
|
Total |
| ||||
|
|
|
|
|
|
|
|
|
|
| ||||
|
Balance at May 31, 2012 |
|
$ |
58,746 |
|
$ |
24,481 |
|
$ |
13,592 |
|
$ |
96,819 |
|
|
Goodwill acquired during the year |
|
2,126 |
|
25,884 |
|
— |
|
28,010 |
| ||||
|
Adjustments to preliminary purchase price allocations |
|
516 |
|
780 |
|
(395 |
) |
901 |
| ||||
|
Goodwill impairment |
|
— |
|
(9,938 |
) |
— |
|
(9,938 |
) | ||||
|
Foreign currency translation |
|
(103 |
) |
(419 |
) |
— |
|
(522 |
) | ||||
|
Balance at May 31, 2013 |
|
$ |
61,285 |
|
$ |
40,788 |
|
$ |
13,197 |
|
$ |
115,270 |
|
|
Goodwill acquired during the year |
|
15,558 |
|
232 |
|
— |
|
15,790 |
| ||||
|
Adjustments to preliminary purchase price allocations |
|
(2,769 |
) |
440 |
|
— |
|
(2,329 |
) | ||||
|
Foreign currency translation |
|
(307 |
) |
2,092 |
|
— |
|
1,785 |
| ||||
|
Balance at May 31, 2014 |
|
$ |
73,767 |
|
$ |
43,552 |
|
$ |
13,197 |
|
$ |
130,516 |
|
In the fourth quarter of fiscal 2013, as a result of a contraction in the Brazil economy, the Company experienced reduced demand for inspection services and a decline in recent and projected operating results. As a result of the completion of step one of the impairment analysis, the Company concluded that, as of March 1, 2013, the fair value of the Brazil reporting unit was below its respective carrying value and the step two analysis was performed. The Company recorded a goodwill impairment charge in the amount of $9.9 million related to Brazil which is reflected in the International segment in fiscal 2013.
9. Intangible Assets
The gross carrying amount and accumulated amortization of intangible assets are as follows:
|
|
|
|
|
May 31, |
| ||||||||||||||||
|
|
|
|
|
2014 |
|
2013 |
| ||||||||||||||
|
|
|
Useful Life |
|
Gross |
|
Accumulated |
|
Net |
|
Gross |
|
Accumulated |
|
Net |
| ||||||
|
|
|
|
|
|
|
|
|
|
|
|
|
|
|
|
| ||||||
|
Customer relationships |
|
5-12 |
|
$ |
82,395 |
|
$ |
(34,636 |
) |
$ |
47,759 |
|
$ |
69,901 |
|
$ |
(27,422 |
) |
$ |
42,479 |
|
|
Software/Technology |
|
3-15 |
|
15,328 |
|
(9,172 |
) |
6,156 |
|
14,336 |
|
(7,629 |
) |
6,707 |
| ||||||
|
Covenants not to compete |
|
2-5 |
|
9,471 |
|
(7,882 |
) |
1,589 |
|
8,069 |
|
(7,523 |
) |
546 |
| ||||||
|
Other |
|
2-5 |
|
5,869 |
|
(3,498 |
) |
2,371 |
|
5,932 |
|
(3,236 |
) |
2,696 |
| ||||||
|
Total |
|
|
|
$ |
113,063 |
|
$ |
(55,188 |
) |
$ |
57,875 |
|
$ |
98,238 |
|
$ |
(45,810 |
) |
$ |
52,428 |
|
Amortization expense for the years ended May 31, 2014, 2013 and 2012 was approximately $9.2 million, $7.7 million and $5.6 million, respectively, including amortization of software/technology for the years ended May 31, 2014, 2013 and 2012 of $0.9 million, $0.6 million and $0.3 million, respectively.
Amortization expense in each of the five years and thereafter subsequent to May 31, 2014 related to the Company’s intangible assets is expected to be as follows:
|
|
|
Expected |
| |
|
|
|
|
| |
|
2015 |
|
$ |
10,523 |
|
|
2016 |
|
9,085 |
| |
|
2017 |
|
7,371 |
| |
|
2018 |
|
5,913 |
| |
|
2019 |
|
4,883 |
| |
|
Thereafter |
|
20,100 |
| |
|
Total |
|
$ |
57,875 |
|
10. Accrued Expenses and Other Current Liabilities
Accrued expenses and other current liabilities consist of the following:
|
|
|
May 31, |
| ||||
|
|
|
2014 |
|
2013 |
| ||
|
|
|
|
|
|
| ||
|
Accrued salaries, wages and related employee benefits |
|
$ |
26,236 |
|
$ |
23,662 |
|
|
Contingent consideration |
|
4,778 |
|
5,144 |
| ||
|
Accrued worker compensation and health benefits |
|
3,661 |
|
3,667 |
| ||
|
Deferred revenues |
|
2,659 |
|
2,623 |
| ||
|
Other accrued expenses |
|
17,316 |
|
12,743 |
| ||
|
Total accrued expenses and other liabilities |
|
$ |
54,650 |
|
$ |
47,839 |
|
11. Long-Term Debt
Long-term debt consists of the following:
|
|
|
May 31, |
| ||||
|
|
|
2014 |
|
2013 |
| ||
|
|
|
|
|
|
| ||
|
Senior credit facility |
|
$ |
61,148 |
|
$ |
39,567 |
|
|
Notes payable |
|
10,512 |
|
15,740 |
| ||
|
Other |
|
4,988 |
|
4,960 |
| ||
|
Total debt |
|
76,648 |
|
60,267 |
| ||
|
Less: Current maturities |
|
(8,058 |
) |
(7,418 |
) | ||
|
Long-term debt, net of current maturities |
|
$ |
68,590 |
|
$ |
52,849 |
|
Senior Credit Facility
In December 2011, the Company entered into a Third Amended and Restated Credit Agreement (Credit Agreement) with Bank of America, N.A., as agent for the lenders and a lender, and JPMorgan Chase Bank, N.A., Keybank National Association and TD Bank, N.A., as lenders. The Credit Agreement provides the Company with a $125.0 million revolving line of credit, which, under certain circumstances, can be increased to $150.0 million. The Credit Agreement has a maturity date of December 20, 2016. The Company may borrow up to $30.0 million in non-U.S. Dollar currencies and use up to $10.0 million of the credit limit for the issuance of letters of credit. As of May 31, 2014, the Company had borrowings of $61.1 million and a total of $3.5 million of letters of credit outstanding under the Credit Agreement.
Loans under the Credit Agreement bear interest at LIBOR plus an applicable LIBOR margin ranging from 1% to 2%, or a base rate less a margin of 0.25% to 1.25%, at the option of the Company, or based upon the Company’s Funded Debt Leverage Ratio. Funded Debt Leverage Ratio is generally the ratio of (1) all outstanding indebtedness for borrowed money and other interest-bearing indebtedness as of the date of determination to (2) EBITDA (which is (a) net income, less (b) income (or plus loss) from discontinued
operations and extraordinary items, plus (c) income tax expenses, plus (d) interest expense, plus (e) depreciation, depletion, and amortization (including non-cash loss on retirement of assets), plus (f) stock compensation expense, less (g) cash expense related to stock compensation, plus or minus certain other adjustments) for the period of four consecutive fiscal quarters immediately preceding the date of determination. The Company has the benefit of the lowest margin if its Funded Debt Leverage Ratio is equal to or less than 0.5 to 1, and the margin increases as the ratio increases, to the maximum margin if the ratio is greater than 2.5 to 1. The Company will also bear additional costs for market disruption, regulatory changes effecting the lenders’ funding costs, and default pricing of an additional 2% interest rate margin if the Funded Debt Leverage Ratio exceeds 3.0 to 1. Amounts borrowed under the Credit Agreement are secured by liens on substantially all of the assets of the Company.
The Credit Agreement contains financial covenants requiring that the Company maintain a Funded Debt Leverage Ratio of less than 3.0 to 1 and an Interest Coverage Ratio of at least 3.0 to 1. Interest Coverage Ratio means the ratio, as of any date of determination, of (a) EBITDA for the 12 month period immediately preceding the date of determination, to (b) all interest, premium payments, debt discount, fees, charges and related expenses of the Company and its subsidiaries in connection with borrowed money (including capitalized interest) or in connection with the deferred purchase price of assets, in each case to the extent treated as interest in accordance with GAAP, paid during the 12 month period immediately preceding the date of determination. The Credit Agreement also limits the Company’s ability to, among other things, create liens, make investments, incur more indebtedness, merge or consolidate, make dispositions of property, pay dividends and make distributions to stockholders, enter into a new line of business, enter into transactions with affiliates and enter into burdensome agreements. The Credit Agreement does not limit the Company’s ability to acquire other businesses or companies except that the acquired business or company must be in its line of business, the Company must be in compliance with the financial covenants on a pro forma basis after taking into account the acquisition, and, if the acquired business is a separate subsidiary, in certain circumstances the lenders will receive the benefit of a guaranty of the subsidiary and liens on its assets and a pledge of its stock.
As of May 31, 2014, we were in compliance with the terms of the credit agreement, and we will continuously monitor our compliance with the covenants contained in our credit agreement.
Notes Payable and Other Debt
In connection with acquisitions through fiscal 2014, the Company issued subordinated notes payable to the sellers. The maturity of these notes range from three to five years from the date of acquisition with stated interest rates ranging from 0% to 4%. The Company has discounted these obligations to reflect a 2% to 4% market interest. Unamortized discount on the notes was de minimus as of May 31, 2014 and 2013, respectively. Amortization is recorded as interest expense in the consolidated statements of income.
Scheduled principal payments due under all borrowing agreements in each of the five years and thereafter subsequent to May 31, 2014 are as follows:
|
2015 |
|
$ |
8,058 |
|
|
2016 |
|
5,901 |
| |
|
2017 |
|
62,182 |
| |
|
2018 |
|
140 |
| |
|
2019 |
|
335 |
| |
|
Thereafter |
|
32 |
| |
|
Total |
|
$ |
76,648 |
|
12. Fair Value Measurements
The Company performs fair value measurements in accordance with the guidance provided by ASC 820, Fair Value Measurements and Disclosures. ASC 820 defines fair value as the price that would be received to sell an asset or paid to transfer a liability in an orderly transaction between market participants at the measurement date. It also establishes a three level hierarchy that prioritizes the inputs used to measure fair value. The three levels of the hierarchy are defined as follows:
Level 1 — Inputs are unadjusted quoted prices in active markets for identical assets or liabilities that the Company has the ability to access at the measurement date.
Level 2 — Observable inputs other than quoted prices included in Level 1, including quoted prices for similar assets or liabilities in active markets, quoted prices for identical assets or liabilities in inactive markets, inputs other than quoted prices that are observable for the asset or liability and inputs derived principally from or corroborated by observable market data.
Level 3 — Unobservable inputs reflecting the Company’s own assumptions about inputs that market participants would use in pricing the asset or liability based on the best information available.
In accordance with the fair value hierarchy described above, the following table shows the fair value of the Company’s financial liabilities that are required to be remeasured at fair value on a recurring basis:
|
|
|
May 31, 2014 |
| ||||||||||
|
|
|
Level 1 |
|
Level 2 |
|
Level 3 |
|
Total |
| ||||
|
|
|
|
|
|
|
|
|
|
| ||||
|
Liabilities: |
|
|
|
|
|
|
|
|
| ||||
|
Contingent consideration |
|
$ |
— |
|
$ |
— |
|
$ |
14,145 |
|
$ |
14,145 |
|
|
Total Liabilities |
|
$ |
— |
|
$ |
— |
|
$ |
14,145 |
|
$ |
14,145 |
|
|
|
|
May 31, 2013 |
| ||||||||||
|
|
|
Level 1 |
|
Level 2 |
|
Level 3 |
|
Total |
| ||||
|
|
|
|
|
|
|
|
|
|
| ||||
|
Liabilities: |
|
|
|
|
|
|
|
|
| ||||
|
Contingent consideration |
|
$ |
— |
|
$ |
— |
|
$ |
15,438 |
|
$ |
15,438 |
|
|
Total Liabilities |
|
$ |
— |
|
$ |
— |
|
$ |
15,438 |
|
$ |
15,438 |
|
The fair value of contingent consideration liabilities that was classified as Level 3 in the table above was estimated using a discounted cash flow technique with significant inputs that are not observable in the market and thus represents a Level 3 fair value measurement as defined in ASC 820. The significant inputs in the Level 3 measurement not supported by market activity include the probability assessments of expected future cash flows related to the acquisitions, appropriately discounted considering the uncertainties associated with the obligation, and as calculated in accordance with the terms of the acquisition agreements.
13. Share-Based Compensation
The Company has share-based incentive awards outstanding to our eligible employees and Directors under two employee stock ownership plans: (i) the 2007 Stock Option Plan (the 2007 Plan), and (ii) the 2009 Long-Term Incentive Plan (the 2009 Plan). No further awards may be granted under the 2007 Plan, although awards granted under the 2007 Plan remain outstanding in accordance with their terms. Awards granted under the 2009 Plan may be in the form of stock options, restricted stock units and other forms of share-based incentives, including performance restricted stock units, stock appreciation rights and deferred stock rights. The 2009 Plan allows for the grant of awards of up to approximately 2,286,000 shares of common stock, of which approximately 765,000 shares were available for future grants as of May 31, 2014. As of May 31, 2014, there was an aggregate of approximately 2,352,000 stock options outstanding and approximately 1,050,000 unvested restricted stock units outstanding under the 2009 Plan, the 2007 Plan, and the 1995 Plan.
Stock Options
For the fiscal years ended May 31, 2014, 2013 and 2012, the Company recognized share-based compensation expense related to stock option awards of approximately $0.7 million, $3.1 million and $3.2 million, respectively. As of May 31, 2014, there was less than $0.1 million of unrecognized compensation costs, net of estimated forfeitures, related to stock option awards, which are expected to be recognized over a remaining weighted average period of 1.8 years. Cash proceeds from, and the intrinsic value of, stock options exercised during the years ended May 31, 2014, 2013 and 2012 were as follows:
|
|
|
For the year ended May 31, |
| |||||||
|
|
|
2014 |
|
2013 |
|
2012 |
| |||
|
|
|
|
|
|
|
|
| |||
|
Cash proceeds from options exercised |
|
$ |
996 |
|
$ |
829 |
|
$ |
2,484 |
|
|
Aggregate intrinsic value of options exercised |
|
1,247 |
|
1,012 |
|
4,439 |
| |||
A summary of the stock option activity, weighted average exercise prices, options outstanding and exercisable as of May 31, 2014 is as follows (in thousands, except per share amounts):
|
|
|
For the year ended May 31, |
| |||||||||||||
|
|
|
2014 |
|
2013 |
|
2012 |
| |||||||||
|
|
|
Common |
|
Weighted |
|
Common |
|
Weighted |
|
Common |
|
Weighted |
| |||
|
|
|
|
|
|
|
|
|
|
|
|
|
|
| |||
|
Outstanding at beginning of year: |
|
2,464 |
|
$ |
12.93 |
|
2,549 |
|
$ |
12.82 |
|
2,867 |
|
$ |
12.27 |
|
|
Granted |
|
— |
|
$ |
— |
|
— |
|
$ |
— |
|
5 |
|
$ |
22.35 |
|
|
Exercised |
|
(103 |
) |
$ |
9.67 |
|
(85 |
) |
$ |
9.66 |
|
(307 |
) |
$ |
8.07 |
|
|
Expired or forfeited |
|
(9 |
) |
$ |
10.03 |
|
— |
|
$ |
— |
|
(16 |
) |
$ |
7.69 |
|
|
Outstanding at end of year: |
|
2,352 |
|
$ |
13.09 |
|
2,464 |
|
$ |
12.93 |
|
2,549 |
|
$ |
12.82 |
|
|
|
|
|
|
For the year ended May 31, 2014 |
| ||||||||||
|
|
|
|
|
Options Outstanding |
|
Options Exercisable |
| ||||||||
|
Range of Exercise Prices |
|
Total |
|
Weighted |
|
Weighted |
|
Number |
|
Weighted |
| ||||
|
|
|
|
|
|
|
|
|
|
|
|
| ||||
|
$6.15-$13.08 |
|
257 |
|
4.4 |
|
$ |
9.87 |
|
257 |
|
$ |
9.87 |
| ||
|
$13.46-$22.35 |
|
2,095 |
|
5.2 |
|
$ |
13.48 |
|
2,092 |
|
$ |
13.47 |
| ||
|
|
|
2,352 |
|
|
|
|
|
2,349 |
|
|
| ||||
|
|
|
|
|
|
|
|
|
|
|
|
| ||||
|
Aggregate Intrinsic Value |
|
$ |
22,749 |
|
|
|
|
|
$ |
22,748 |
|
|
| ||
Restricted Stock Unit Awards
The Company recognized approximately $4.0 million, $2.9 million and $1.9 million in share-based compensation expense related to restricted stock unit awards during the fiscal years ended May 31, 2014, 2013 and 2012, respectively. As of May 31, 2014, there were approximately $8.6 million of unrecognized compensation costs, net of estimated forfeitures, related to restricted stock unit awards, which are expected to be recognized over a remaining weighted average period of 2.3 years.
During the years ended May 31, 2014 and 2013, the Company granted approximately 19,000 and 13,000 shares, respectively, of fully-vested common stock to its five non-employee directors, in connection with its non-employee director compensation plan. These shares had a grant date fair value of approximately $0.4 million and $0.3 million, respectively, which is included in the share-based compensation expense recorded during the years ended May 31, 2014 and 2013.
During the years ended May 31, 2014 and 2013, approximately 178,000 and 123,000 restricted stock units vested. The fair value of these units was $3.3 million and $1.9 million, respectively. Upon vesting, restricted stock units are generally net share-settled to cover the required withholding tax and the remaining amount is converted into an equivalent number of shares of common stock.
Performance Restricted Stock Units
In fiscal 2014, the company granted performance restricted stock units to its executive and certain other senior officers. These units have requisite service periods of three years and have no dividend rights. Compensation expense related to performance restricted stock units was $1.2 million for the year ended May 31, 2014. At May 31, 2014, there was $7.4 million of total unrecognized compensation costs related to approximately 423,000 nonvested performance restricted stock units. These costs are expected to be recognized over a weighted-average period of approximately 2.3 years. The actual payout of these units will vary based on the Company’s performance over the three-year period based on pre-established targets over the period and a market condition modifier based on total shareholder return compared to an industry peer group. The actual payout under these awards may exceed an
executive’s target payout; however, compensation cost initially recognized assumes that the target payout level will be achieved and may be adjusted for subsequent changes in the expected outcome of the performance-related condition.
14. Income Taxes
Income before provision for income taxes is as follows:
|
|
|
For the year ended May 31, |
| |||||||
|
|
|
2014 |
|
2013 |
|
2012 |
| |||
|
|
|
|
|
|
|
|
| |||
|
Income before provision for income taxes from: |
|
|
|
|
|
|
| |||
|
U.S. operations |
|
$ |
25,433 |
|
$ |
29,573 |
|
$ |
27,951 |
|
|
Foreign operations |
|
9,670 |
|
(5,307 |
) |
5,686 |
| |||
|
Earnings before income taxes |
|
$ |
35,103 |
|
$ |
24,266 |
|
$ |
33,637 |
|
The provision for income taxes consists of the following:
|
|
|
For the year ended May 31, |
| |||||||
|
|
|
2014 |
|
2013 |
|
2012 |
| |||
|
|
|
|
|
|
|
|
| |||
|
Current |
|
|
|
|
|
|
| |||
|
Federal |
|
$ |
8,836 |
|
$ |
9,035 |
|
$ |
8,792 |
|
|
States and local |
|
1,689 |
|
1,673 |
|
1,762 |
| |||
|
Foreign |
|
2,484 |
|
3,118 |
|
2,042 |
| |||
|
Reserve for uncertain tax positions |
|
59 |
|
206 |
|
47 |
| |||
|
Total current |
|
13,068 |
|
14,032 |
|
12,643 |
| |||
|
Deferred |
|
|
|
|
|
|
| |||
|
Federal |
|
(53 |
) |
5 |
|
216 |
| |||
|
States and local |
|
395 |
|
134 |
|
105 |
| |||
|
Foreign |
|
(967 |
) |
246 |
|
(359 |
) | |||
|
Total deferred |
|
(625 |
) |
385 |
|
(38 |
) | |||
|
Net change in valuation allowance |
|
85 |
|
(1,790 |
) |
(314 |
) | |||
|
Net deferred |
|
(540 |
) |
(1,405 |
) |
(352 |
) | |||
|
Provision for income taxes |
|
$ |
12,528 |
|
$ |
12,627 |
|
$ |
12,291 |
|
The provision for income taxes differs from the amount computed by applying the statutory federal tax rate to income tax as follows:
|
|
|
For the year ended May 31, |
| |||||||||||||
|
|
|
2014 |
|
2013 |
|
2012 |
| |||||||||
|
|
|
|
|
|
|
|
|
|
|
|
|
|
| |||
|
Federal tax at statutory rate |
|
$ |
12,286 |
|
35.0 |
% |
$ |
8,493 |
|
35.0 |
% |
$ |
11,773 |
|
35.0 |
% |
|
State taxes, net of federal benefit |
|
1,355 |
|
3.9 |
% |
1,174 |
|
4.8 |
% |
1,213 |
|
3.6 |
% | |||
|
Foreign tax |
|
(1,868 |
) |
(5.3 |
)% |
1,744 |
|
7.2 |
% |
(307 |
) |
(0.9 |
)% | |||
|
Contingent consideration |
|
24 |
|
0.1 |
% |
(1,156 |
) |
(4.8 |
)% |
(370 |
) |
(1.1 |
)% | |||
|
Permanent differences |
|
531 |
|
1.5 |
% |
498 |
|
2.1 |
% |
272 |
|
0.8 |
% | |||
|
Goodwill impairment |
|
— |
|
0.0 |
% |
3,478 |
|
14.3 |
% |
— |
|
0.0 |
% | |||
|
Other |
|
115 |
|
0.3 |
% |
186 |
|
0.8 |
% |
24 |
|
0.0 |
% | |||
|
Change in valuation allowance |
|
85 |
|
0.2 |
% |
(1,790 |
) |
(7.4 |
)% |
(314 |
) |
(0.9 |
)% | |||
|
Total provision for income taxes |
|
$ |
12,528 |
|
35.7 |
% |
$ |
12,627 |
|
52.0 |
% |
$ |
12,291 |
|
36.5 |
% |
Deferred income tax attributes resulting from differences between financial accounting amounts and income tax basis of assets and liabilities are as follows:
|
|
|
May 31, |
| ||||
|
|
|
2014 |
|
2013 |
| ||
|
|
|
|
|
|
| ||
|
Deferred income tax assets |
|
|
|
|
| ||
|
Allowance for doubtful accounts |
|
$ |
777 |
|
$ |
745 |
|
|
Inventory |
|
726 |
|
637 |
| ||
|
Intangible assets |
|
3,316 |
|
5,220 |
| ||
|
Accrued expenses |
|
2,580 |
|
2,505 |
| ||
|
Net operating loss carryforward |
|
3,745 |
|
3,314 |
| ||
|
Capital lease obligation |
|
44 |
|
452 |
| ||
|
Deferred stock based compensation |
|
5,739 |
|
4,690 |
| ||
|
Other |
|
108 |
|
37 |
| ||
|
Deferred income tax assets |
|
17,035 |
|
17,600 |
| ||
|
Valuation allowance |
|
(2,553 |
) |
(2,701 |
) | ||
|
Net deferred income tax assets |
|
14,482 |
|
14,899 |
| ||
|
Deferred income tax liabilities |
|
|
|
|
| ||
|
Property and equipment |
|
(6,821 |
) |
(7,142 |
) | ||
|
Goodwill |
|
(9,423 |
) |
(7,390 |
) | ||
|
Intangible assets |
|
(9,057 |
) |
(9,277 |
) | ||
|
Other |
|
(80 |
) |
(83 |
) | ||
|
Deferred income tax liabilities |
|
(25,381 |
) |
(23,892 |
) | ||
|
Net deferred income taxes |
|
$ |
(10,899 |
) |
$ |
(8,993 |
) |
Management assesses the available positive and negative evidence to estimate if sufficient future taxable income will be generated to use the existing deferred tax assets. Evidence used includes information about the Company’s current financial position and results of operations for the current and preceding years, as well as available information about future years, the reversal of deferred tax liabilities and tax planning strategies. On the basis of this evaluation, as of May 31, 2014, a valuation allowance of $2.6 million has been recorded to reduce the deferred tax assets to an amount that will more likely than not be realized.
As of May 31, 2014, the Company has available state net operating losses of approximately $0.4 million with expiration dates starting in fiscal 2026, and state net operating losses of $2.6 million with expiration dates starting in fiscal 2015. In addition, the company has net operating losses in certain foreign jurisdictions of approximately $11.0 million some of which have unlimited life and others expire beginning in fiscal 2019.
The following table summarizes the changes in the Company’s gross unrecognized tax benefits, excluding interest and penalties:
|
|
|
For the year ended May 31, |
| |||||||
|
|
|
2014 |
|
2013 |
|
2012 |
| |||
|
Balance at June 1 |
|
$ |
1,061 |
|
$ |
971 |
|
$ |
375 |
|
|
Additions for tax positions related to the current fiscal year |
|
36 |
|
31 |
|
24 |
| |||
|
Additions for tax positions related to prior years |
|
— |
|
93 |
|
44 |
| |||
|
Decreases for tax positions related to prior years |
|
(10 |
) |
— |
|
(22 |
) | |||
|
Current year acquisitions |
|
63 |
|
— |
|
561 |
| |||
|
Impact of foreign exchange fluctuation |
|
(52 |
) |
(24 |
) |
— |
| |||
|
Settlements |
|
(48 |
) |
(4 |
) |
— |
| |||
|
Reductions related to the expiration of statutes of limitations |
|
(34 |
) |
(6 |
) |
(11 |
) | |||
|
Balance at May 31 |
|
$ |
1,016 |
|
$ |
1,061 |
|
$ |
971 |
|
The Company has recorded the unrecognized tax benefits in other long-term liabilities in the consolidated balance sheets as of May 31, 2014, 2013 and 2012. As of May 31, 2014, 2013 and 2012, there were approximately $1.4 million, $1.4 million and $1.2 million of unrecognized tax benefits, respectively, including penalties and interest that if recognized would favorably affect the
effective tax rate. Interest and penalties related to unrecognized tax benefits are recorded in income tax expense and are not significant for the years ending May 31, 2014, 2013 and 2012. The Company anticipates a decrease to its unrecognized tax benefits of approximately $0.1 million excluding interest and penalties within the next 12 months.
The Company is subject to taxation in the United States and various states and foreign jurisdictions. The Company is no longer subject to U.S. federal income tax examinations for years ending before May 31, 2012 and generally is no longer subject to state, local or foreign income tax examinations by tax authorities for years ending before May 31, 2010.
The Company has not recognized U.S. taxes on the earnings of its undistributed international subsidiaries since it intends to indefinitely reinvest the earnings outside the United States. Net income (loss) of foreign subsidiaries was $8.0 million and ($6.9) million for fiscal 2014 and 2013, respectively. We have recognized no deferred tax liability for the remittance of such earnings to the U.S. since it is our intention to utilize those earnings in the foreign operations. Determination of the amount of any unrecognized deferred income tax liability on this temporary difference is not practicable because of the complexities of the hypothetical calculation.
15. Employee Benefit Plans
The Company provides a 401(k) savings plan for eligible U.S. based employees. Employee contributions are discretionary up to the IRS limits each year and catch up contributions are allowed for employees 50 years of age or older. Under the 401(k) plan, employees become eligible to participate on the first day of the month after six months of continuous service. Under this plan, the Company matches 50% of the employee’s contributions up to 6% of the employee’s annual compensation, as defined by the plan. There is a five-year vesting schedule for the Company match. The Company’s contribution to the plan was approximately $2.5 million, $2.3 million and $2.1 million for the years ended May 31, 2014, 2013 and 2012, respectively.
The Company participates with other employers in contributing to a union plan, which covers certain U.S. based union employees. The plan is not administered by the Company and contributions are determined in accordance with provisions of a collective bargaining agreement. The Company’s contributions to the plan were less than $0.1 million in each of the years ended May 31, 2014, 2013 and 2012. The Company has benefit plans covering certain employees in selected foreign countries. Amounts charged to expense under these plans were not significant in any year.
16. Related Party Transactions
The Company leases its headquarters under a capital lease from a shareholder and officer of the Company requiring monthly payments through October 2014. Total rent payments made during fiscal 2014 were approximately $0.9 million. See Note 17 — Obligations under Capital Leases for further detail related to capital leases. On August 1, 2014 the Company extended its lease at its headquarters requiring monthly payments through October 2024.
The Company has a lease for office space located in France, which is partly owned by a shareholder and officer, requiring monthly payments through January 2016. Total rent payments made during fiscal 2014 were approximately $0.2 million.
The Company has a lease for office space located in Brazil, which is partly owned by a shareholder and officer, requiring monthly payments through fiscal 2024. Total rent payments made during fiscal 2014 were approximately $0.1 million.
17. Obligations under Capital Leases
The Company leases certain office space, including its headquarters, and service equipment under capital leases, requiring monthly payments ranging from less than $1 thousand to $72 thousand, including effective interest rates that range from approximately 3% to 9% expiring through May 2019. The net book value of assets under capital lease obligations was $18.1 million and $16.1 million at May 31, 2014 and 2013, respectively.
Scheduled future minimum lease payments subsequent to May 31, 2014 are as follows:
|
2015 |
|
$ |
8,246 |
|
|
2016 |
|
6,256 |
| |
|
2017 |
|
4,161 |
| |
|
2018 |
|
2,448 |
| |
|
2019 |
|
994 |
| |
|
Thereafter |
|
122 |
| |
|
Total minimum lease payments |
|
22,227 |
| |
|
Less: amount representing interest |
|
(1,312 |
) | |
|
Present value of minimum lease payments |
|
20,915 |
| |
|
Less: current portion of obligations under capital leases |
|
(7,251 |
) | |
|
Obligations under capital leases, net of current portion |
|
$ |
13,664 |
|
18. Commitments and Contingencies
Operating Leases
The Company is party to various noncancelable lease agreements, primarily for its international and domestic office and lab space. Future minimum lease payments under noncancelable operating leases in each of the five years and thereafter subsequent to May 31, 2014 are as follows:
|
2015 |
|
$ |
8,141 |
|
|
2016 |
|
6,317 |
| |
|
2017 |
|
5,027 |
| |
|
2018 |
|
3,689 |
| |
|
2019 |
|
3,401 |
| |
|
Thereafter |
|
6,789 |
| |
|
Total |
|
$ |
33,364 |
|
Total rent expense was $9.5 million, $7.2 million and $5.4 million for the years ended May 31, 2014, 2013 and 2012, respectively.
Litigation
The Company is subject to periodic lawsuits, investigations and claims that arise in the ordinary course of business. Although the Company cannot predict with certainty the ultimate resolution of lawsuits, investigations and claims asserted against it, the Company does not believe that any currently pending legal proceeding to which the Company is a party will have a material adverse effect on its business, results of operations, cash flows or financial condition. The costs of defense and amounts that may be recovered in such matters may be covered by insurance.
In January 2012, the Company received notice of a governmental investigation concerning an environmental incident which occurred in February 2011 outside on the premises of its Cudahy, California location. No human injury or property damage was reported or appears to have been caused as a result of this incident, while management cannot predict the ultimate outcome of this matter, based on its internal investigation to date, the Company does not believe the outcome will have a material effect on its financial condition or results of operations.
During fiscal 2012 and 2013, the Company performed radiography work on the construction of pipeline projects in Georgia. The Company has received notice that the owner of the pipeline projects contends that certain of the x-ray images the Company’s technicians prepared regarding the project did not meet the code quality interpretation standards required by API (American Petroleum Institute) 1103. The projects owner is claiming damages as a result of the alleged quality defects of the Company’s x-ray images. No lawsuit has been filed at this time. The Company is currently unable to determine the likely outcome or reasonably estimate the amount or range of potential liability related to this matter, and accordingly, has not established any reserves for this matter.
The Company has also received a notice from an insurance company of a chemical plant alleging that the Company is liable due to faulty inspections for all or part of $46 million of damages paid by the insurance company as a result of an explosion at the facility. The Company believes it was not involved in inspecting the portion of the plant where the explosion occurred and therefore has no liability for the claim. Accordingly, the Company has not established a reserve for this matter.
Acquisition-related contingencies
The Company is liable for contingent consideration in connection with certain of its acquisitions. As of May 31, 2014, total potential acquisition-related contingent consideration ranged from zero to $27.9 million and would be payable upon the achievement of specific performance metrics by certain of the acquired companies over the next three years of operations. See Note 7 - Acquisitions for further discussion of the Company’s acquisitions.
19. Subsequent Events
Subsequent to May 31, 2014, the Company completed an acquisition of an asset protection businesses located in Quebec, Canada. Subsequent to April 30, 2014, our International Segment completed an acquisition of an asset inspection business located in the United Kingdom. The Company’s cash outlay for these acquisitions was $3.9 million plus $0.5 million of notes payable. In addition to the cash consideration, the acquisition in Quebec provides for contingent consideration to be earned based upon the acquired company achieving specific performance metrics over the next three years of operation. The Company is in the process of completing the preliminary purchase price allocations. These acquisitions were not significant and no pro forma information has been included.
20. Segment Disclosure
The Company’s three operating segments are:
· Services. This segment provides asset protection solutions predominantly in North America with the largest concentration in the United States along with a growing Canadian services business, consisting primarily of non-destructive testing, and inspection and engineering services that are used to evaluate the structural integrity and reliability of critical energy, industrial and public infrastructure.
· Products and Systems. This segment designs, manufactures, sells, installs and services the Company’s asset protection products and systems, including equipment and instrumentation, predominantly in the United States.
· International. This segment offers services, products and systems similar to those of the Company’s other segments to global markets, principally in Europe, the Middle East, Africa, Asia and South America, but not to customers in China and South Korea, which are served by the Products and Systems segment.
Costs incurred for general corporate services, including accounting, audit, legal, and certain other costs, that are provided to the segments are reported within Corporate and eliminations. Sales to the International segment from the Products and Systems segment and subsequent sales by the International segment of the same items are recorded and reflected in the operating performance of both segments. Additionally, engineering charges and royalty fees charged to the Services and International segments by the Products and Systems segment are reflected in the operating performance of each segment. All such intersegment transactions are eliminated in the Company’s consolidated financial reporting.
The accounting policies of the reportable segments are the same as those described in Note 2 — Summary of Significant Accounting Policies. Segment income from operations is determined based on internal performance measures used by the Chief Executive Officer, who is the chief operating decision maker, to assess the performance of each business in a given period and to make decisions as to resource allocations. In connection with that assessment, the Chief Executive Officer may exclude matters such as charges for share-based compensation and certain other acquisition-related charges and balances, technology and product development costs, certain gains and losses from dispositions, and litigation settlements or other charges. Certain general and administrative costs such as human resources, information technology and training are allocated to the segments. Segment income from operations also excludes interest and other financial charges and income taxes. Corporate and other assets are comprised principally of cash, deposits, property, plant and equipment, domestic deferred taxes, deferred charges and other assets. Corporate loss from operations consists of depreciation on the corporate office facilities and equipment, administrative charges related to corporate personnel and other charges that cannot be readily identified for allocation to a particular segment.
Selected financial information by segment for the periods shown was as follows:
|
|
|
For the year ended May 31, |
| |||||||
|
|
|
2014 |
|
2013 |
|
2012 |
| |||
|
Revenues |
|
|
|
|
|
|
| |||
|
Services |
|
$ |
443,229 |
|
$ |
380,851 |
|
$ |
349,793 |
|
|
International |
|
161,395 |
|
126,840 |
|
59,466 |
| |||
|
Products and Systems |
|
33,544 |
|
33,301 |
|
40,083 |
| |||
|
Corporate and eliminations |
|
(14,721 |
) |
(11,710 |
) |
(12,467 |
) | |||
|
|
|
$ |
623,447 |
|
$ |
529,282 |
|
$ |
436,875 |
|
|
|
|
For the year ended May 31, |
| |||||||
|
|
|
2014 |
|
2013 |
|
2012 |
| |||
|
Gross profit |
|
|
|
|
|
|
| |||
|
Services |
|
$ |
114,182 |
|
$ |
98,907 |
|
$ |
94,413 |
|
|
International |
|
44,893 |
|
32,319 |
|
19,106 |
| |||
|
Products and Systems |
|
14,495 |
|
16,947 |
|
18,578 |
| |||
|
Corporate and eliminations |
|
(627 |
) |
198 |
|
(2,407 |
) | |||
|
|
|
$ |
172,943 |
|
$ |
148,371 |
|
$ |
129,690 |
|
|
|
|
For the year ended May 31, |
| |||||||
|
|
|
2014 |
|
2013 |
|
2012 |
| |||
|
Income from operations |
|
|
|
|
|
|
| |||
|
Services |
|
$ |
43,221 |
|
$ |
40,325 |
|
$ |
39,932 |
|
|
International |
|
10,238 |
|
(8,246 |
) |
3,262 |
| |||
|
Products and Systems |
|
2,552 |
|
7,286 |
|
8,271 |
| |||
|
Corporate and eliminations |
|
(17,716 |
) |
(11,811 |
) |
(15,367 |
) | |||
|
|
|
$ |
38,295 |
|
$ |
27,554 |
|
$ |
36,098 |
|
Income (loss) from operations by operating segment includes intercompany transactions, which are eliminated in Corporate and eliminations.
|
|
|
For the year ended May 31, |
| |||||||
|
|
|
2014 |
|
2013 |
|
2012 |
| |||
|
Depreciation and amortization |
|
|
|
|
|
|
| |||
|
Services |
|
$ |
17,794 |
|
$ |
18,296 |
|
$ |
17,763 |
|
|
International |
|
8,065 |
|
6,200 |
|
2,342 |
| |||
|
Products and Systems |
|
2,373 |
|
2,229 |
|
1,831 |
| |||
|
Corporate and eliminations |
|
197 |
|
(78 |
) |
88 |
| |||
|
|
|
$ |
28,429 |
|
$ |
26,647 |
|
$ |
22,024 |
|
|
|
|
May 31, |
| ||||
|
|
|
2014 |
|
2013 |
| ||
|
Intangible assets, net |
|
|
|
|
| ||
|
Services |
|
$ |
22,440 |
|
$ |
14,527 |
|
|
International |
|
26,898 |
|
27,520 |
| ||
|
Products and Systems |
|
8,310 |
|
9,600 |
| ||
|
Corporate and eliminations |
|
227 |
|
781 |
| ||
|
|
|
$ |
57,875 |
|
$ |
52,428 |
|
|
|
|
May 31, |
| ||||
|
|
|
2014 |
|
2013 |
| ||
|
Total assets |
|
|
|
|
| ||
|
Services |
|
$ |
249,378 |
|
$ |
200,326 |
|
|
International |
|
155,571 |
|
139,445 |
| ||
|
Products and Systems |
|
38,041 |
|
37,948 |
| ||
|
Corporate and eliminations |
|
982 |
|
278 |
| ||
|
|
|
$ |
443,972 |
|
$ |
377,997 |
|
Revenue and long-lived assets by geographic area was as follows:
|
|
|
For the year ended May 31, |
| |||||||
|
|
|
2014 |
|
2013 |
|
2012 |
| |||
|
Revenue |
|
|
|
|
|
|
| |||
|
United States |
|
$ |
403,001 |
|
$ |
347,423 |
|
$ |
336,081 |
|
|
Other Americas |
|
55,120 |
|
55,379 |
|
40,337 |
| |||
|
Europe |
|
143,931 |
|
106,416 |
|
42,820 |
| |||
|
Asia-Pacific |
|
21,395 |
|
20,064 |
|
17,637 |
| |||
|
|
|
$ |
623,447 |
|
$ |
529,282 |
|
$ |
436,875 |
|
|
|
|
May 31, |
| ||||
|
|
|
2014 |
|
2013 |
| ||
|
Long-lived assets |
|
|
|
|
| ||
|
United States |
|
$ |
141,447 |
|
$ |
122,727 |
|
|
Other Americas |
|
33,515 |
|
28,148 |
| ||
|
Europe |
|
90,194 |
|
85,171 |
| ||
|
Asia-Pacific |
|
1,046 |
|
71 |
| ||
|
|
|
$ |
266,202 |
|
$ |
236,117 |
|
21. Selected Quarterly Financial Information (unaudited)
The following is a summary of the quarterly results of operations for the years ended May 31, 2014 and 2013:
|
Fiscal quarter ended |
|
May 31, |
|
February 28, |
|
November 30, |
|
August 31, |
|
May 31, |
|
February 28, |
|
November 30, |
|
August 31, |
| ||||||||
|
|
|
|
|
|
|
|
|
|
|
|
|
|
|
|
|
|
| ||||||||
|
Revenues |
|
$ |
179,127 |
|
$ |
151,727 |
|
$ |
156,755 |
|
$ |
135,838 |
|
$ |
144,505 |
|
$ |
133,661 |
|
$ |
137,729 |
|
$ |
113,387 |
|
|
Gross Profit |
|
46,389 |
|
39,300 |
|
47,977 |
|
39,277 |
|
38,543 |
|
34,206 |
|
41,905 |
|
33,717 |
| ||||||||
|
Income from operations |
|
10,468 |
|
3,000 |
|
15,252 |
|
9,575 |
|
(881 |
) |
4,982 |
|
15,747 |
|
7,706 |
| ||||||||
|
Net income attributable to Mistras Group, Inc. |
|
$ |
6,419 |
|
$ |
1,201 |
|
$ |
9,257 |
|
$ |
5,641 |
|
$ |
(4,549 |
) |
$ |
2,751 |
|
$ |
9,163 |
|
$ |
4,281 |
|
|
Earnings per common share: |
|
|
|
|
|
|
|
|
|
|
|
|
|
|
|
|
| ||||||||
|
Basic |
|
0.23 |
|
0.04 |
|
0.33 |
|
0.20 |
|
(0.16 |
) |
0.10 |
|
0.33 |
|
0.15 |
| ||||||||
|
Diluted |
|
0.22 |
|
0.04 |
|
0.32 |
|
0.19 |
|
(0.16 |
) |
0.11 |
|
0.32 |
|
0.15 |
| ||||||||
Item 9. Changes in and Disagreements with Accountants on Accounting and Financial Disclosure
None.
Item 9A. Controls and Procedures
Evaluation of Disclosure Controls and Procedures
Pursuant to Rule 13a-15(b) under the Exchange Act, our management carried out an evaluation, under the supervision and with the participation of our Chief Executive Officer and our Executive Vice President and Chief Financial Officer, of the effectiveness of the design and operation of our disclosure controls (as defined in Rule 13a-15(e) of the Exchange Act) and procedures. Based upon that evaluation, our Chief Executive Officer and our Executive Vice President and Chief Financial Officer concluded that, as of May 31, 2014, our disclosure controls and procedures were effective.
Management’s Report on Internal Control Over Financial Reporting
Our management is responsible for establishing and maintaining adequate internal control over financial reporting, as defined in Rules 13a-15(f) and 15d-15(f) under the Securities Exchange Act of 1934, as amended (the Exchange Act). Our internal control over financial reporting is a process designed by, or under the supervision of, our Chairman, President and Chief Executive Officer and our Executive Vice President and Chief Financial Officer and Treasurer, and effected by the Company’s board of directors, management and other personnel to provide reasonable assurance regarding the reliability of financial reporting and the preparation of financial statements for external purposes in accordance with generally accepted accounting principles.
Because of its inherent limitations, internal control over financial reporting may not prevent or detect misstatements. Also, projections of any evaluation of effectiveness to future periods are subject to the risk that controls may become inadequate because of changes in conditions, or that the degree of compliance with policies or procedures may deteriorate.
Our management assessed the effectiveness of our internal control over financial reporting as of May 31, 2014. In making this assessment, management used the criteria set forth by the Committee of Sponsoring Organizations of the Treadway Commission (COSO) in the original Internal Control — Integrated Framework issued in 1992. Based on that assessment, our management concluded that, as of May 31, 2014, our internal control over financial reporting was effective.
The effectiveness of the Company’s internal control over financial reporting as of May 31, 2014, has been audited by KPMG LLP, an independent registered public accounting firm, as stated in their report which appears herein.
Changes in Internal Control over Financial Reporting
There have been no changes in our internal control over financial reporting during the year ended May 31, 2014 that materially affected, or are reasonably likely to materially affect, our internal control over financial reporting.
None.
ITEM 10. DIRECTORS, EXECUTIVE OFFICERS AND CORPORATE GOVERNANCE
Directors
The information required by Item 10 is incorporated herein by reference to the information contained in our definitive proxy statement related to the 2014 annual shareholders meeting. The information concerning our executive officers required by this Item 10 is provided under the caption “Executive Officers of the Registrant” in Part I hereof.
ITEM 11. EXECUTIVE COMPENSATION
The information required by this Item 11 is incorporated by reference to the information contained in our definitive proxy statement related to the 2014 annual shareholders meeting.
ITEM 12. SECURITY OWNERSHIP OF CERTAIN BENEFICIAL OWNERS AND MANAGEMENT AND RELATED STOCKHOLDER MATTERS
The information required by Item 12 regarding Security Ownership of Certain Beneficial Owners and Management and Related Stockholders is incorporated by reference to the information contained in our definitive proxy statement related to the 2014 annual meeting of shareholders.
Equity Compensation Plan Information
The following table provides certain information as of May 31, 2014 concerning the shares of our common stock that may be issued under existing equity compensation plans.
|
Plan Category |
|
Number of Securities |
|
Weighted Average |
|
Number of Securities |
| |
|
|
|
(in thousands, except exercise price data) |
| |||||
|
|
|
|
|
|
|
|
| |
|
Equity Compensation Plans Approved by Security Holders (1) |
|
2,351 |
|
$ |
13.09 |
|
765 |
|
|
|
|
|
|
|
|
|
| |
|
Equity Compensation Plans Not Approved by Security Holders |
|
— |
|
— |
|
— |
| |
|
|
|
|
|
|
|
|
| |
|
Total |
|
2,351 |
|
$ |
13.09 |
|
765 |
|
(1) Includes all the Company’s plans: 1995 Incentive Stock Option and Restricted Stock Plan, 2007 Stock Option Plan and 2009 Long-Term Incentive Plan.
ITEM 13. CERTAIN RELATIONSHIPS AND RELATED TRANSACTIONS, AND DIRECTOR INDEPENDENCE
The information required by Item 13 is incorporated by reference to the information contained in our definitive proxy statement related to the 2014 annual shareholders meeting.
ITEM 14. PRINCIPAL ACCOUNTANT FEES AND SERVICES
The information required by Item 14 is incorporated by reference to the information contained in our definitive proxy statement related to the 2014 annual shareholders meeting.
ITEM 15. EXHIBITS AND FINANCIAL STATEMENT SCHEDULES
(1) The following financial statements are filed herewith in Item 8 of Part II above:
(2) Financial Statement Schedules
All other schedules are omitted because of the absence of conditions under which they are required or because the required information is given in the financial statements or notes thereto.
(3) Exhibits
|
Exhibit No. |
|
Description |
|
3.1 |
|
Second Amended and Restated Certificate of Incorporation (filed as exhibit 3.1 to Registration Statement on Form S-1 (Amendment No. 4) filed on September 21, 2009 (Registration No. 333-151559) and incorporated herein by reference) |
|
|
|
|
|
3.2 |
|
Amended and Restated Bylaws (filed as exhibit 3.2 to Registration Statement on Form S-1 (Amendment No. 4) |
|
|
|
filed on September 21, 2009 (Registration No. 333-151559) and incorporated herein by reference) |
|
|
|
|
|
4.1 |
|
Specimen certificate evidencing shares of common stock (filed as exhibit 4.1 to Registration Statement on Form S-1 (Amendment No. 5) filed on September 23, 2009 (Registration No. 333-151559) and incorporated herein by reference. |
|
|
|
|
|
10.1 |
|
Third Amended and Restated Credit Agreement dated December 21, 2011 (filed as exhibit 10.1 to Quarterly Report on Form 10-Q filed April 9, 2012 and incorporated herein by reference) |
|
|
|
|
|
10.2 |
|
Form of Indemnification Agreement for directors and officers (filed as exhibit 10.1 to Registration Statement on Form S-1 (Amendment No. 4) filed on September 21, 2009 (Registration No. 333-151559) and incorporated herein by reference) |
|
|
|
|
|
10.3† |
|
Employment Agreement between the Company and Sotirios J. Vahaviolos (filed as exhibit 10.4 to Registration Statement on Form S-1 (Amendment No. 4) filed on September 21, 2009 (Registration No. 333-151559) and incorporated herein by reference) |
|
|
|
|
|
10.4† |
|
Amendment, dated July 14, 2010 to Employment Agreement, between the Company and Sotirios J. Vahaviolos (filed as exhibit 10.1 to Quarterly Report on Form 10-Q filed on October 14, 2010 and incorporated herein by reference) |
|
|
|
|
|
10.5† |
|
Amendment No. 2, dated January 24, 2014, to Employment Agreement between the Company and Sotirios J. |
|
|
|
Vahaviolos (filed as exhibit 10.1 to Quarterly Report on Form 10-Q filed on April 9, 2014 and incorporated herein by reference) |
|
|
|
|
|
10.6† |
|
2007 Stock Option Plan and form of Stock Option Agreement (filed as exhibit 10.5 to Registration Statement on Form S-1 (Amendment No. 4) filed on September 21, 2009 (Registration No. 333-151559) and incorporated herein by reference) |
|
|
|
|
|
10.7† |
|
2009 Long-Term Incentive Plan (filed as exhibit 10.6 to Registration Statement on Form S-1 (Amendment No. 4) filed on September 21, 2009 (Registration No. 333-151559) and incorporated herein by reference). |
|
|
|
|
|
10.8† |
|
Form of 2009 Long-Term Incentive Plan Stock Option Agreement (filed as exhibit 10.7 to Registration Statement on Form S-1 (Amendment No. 4) filed on September 21, 2009 (Registration No. 333-151559) and incorporated herein by reference) |
|
|
|
|
|
10.09† |
|
Form of 2009 Long-Term Incentive Plan Restricted Stock Agreement (filed as exhibit 10.8 to Registration Statement on Form S-1 (Amendment No. 4) filed on September 21, 2009 (Registration No. 333-151559) and incorporated herein by reference) |
|
|
|
|
|
10.10† |
|
Form of Restricted Stock Unit Certificate for awards under 2009 Long-Term Incentive Plan (filed as exhibit 10.1 to Quarterly Report on Form 10-Q filed on January 13, 2011 and incorporated herein by reference) |
|
|
|
|
|
10.11†** |
|
Form of performance share unit awards letter under 2009 Long-Term Incentive Plan |
|
|
|
|
|
10.12†* |
|
Mistras Group Severance Plan as amended (April 2014) |
|
|
|
|
|
10.13†* |
|
Description of Compensation for Non-Employee Directors (Fiscal 2015) |
|
|
|
|
|
21.1* |
|
Subsidiaries of the Registrant |
|
|
|
|
|
23.1* |
|
Consent of KPMG LLP |
|
|
|
|
|
23.2* |
|
Consent of PricewaterhouseCoopers LLP |
|
|
|
|
|
24.1* |
|
Power of Attorney (included as part of the signature page to this report) |
|
|
|
|
|
31.1* |
|
Certification of Chief Executive Officer pursuant to Rule 13a-14(a) under the Securities Exchange Act of 1934 |
|
31.2* |
|
Certification of Chief Financial Officer pursuant to Rule 13a-14(a) under the Securities Exchange Act of 1934 |
|
|
|
|
|
32.1** |
|
Certification pursuant to Section 906 of the Sarbanes-Oxley Act of 2002 |
|
|
|
|
|
32.2** |
|
Certification pursuant to Section 906 of the Sarbanes-Oxley Act of 2002 |
|
|
|
|
|
101.INS*** |
|
XBRL Instance Document |
|
101.SCH*** |
|
XBRL Schema Document |
|
|
|
|
|
101.CAL*** |
|
XBRL Calculation Linkbase Document |
|
101.LAB |
|
XBRL Labels Linkbase Document |
|
|
|
|
|
101.PRE*** |
|
XBRL Presentation Linkbase Document |
|
101.DEF*** |
|
XBRL Definition Linkbase Document |
† Indicates a management contract or any compensatory plan, contract, or arrangement.
* Filed herewith.
** Furnished herewith.
*** Users of this data are advised that, pursuant to Rule 406T of Regulation S-T, these interactive data files are deemed not filed or part of a registration statement or prospectus for purposes of Sections 11 or 12 of the Securities Act of 1933 or Section 18 of the Securities Exchange Act of 1934 and otherwise are not subject to liability under these sections.
Pursuant to the requirements of Section 13 or 15(d) of the Securities Exchange Act of 1934, the registrant has duly caused this report to be signed on its behalf by the undersigned, thereunto duly authorized.
|
|
MISTRAS GROUP, INC. | |
|
|
By: |
/s/ SOTIRIOS J. VAHAVIOLOS |
|
|
Sotirios J. Vahaviolos | |
|
|
Chairman, President and Chief Executive Officer | |
Date: August 8, 2014
We, the undersigned directors and officers of Mistras Group, Inc., hereby severally constitute Sotirios J. Vahaviolos, Jonathan H. Wolk and Michael C. Keefe, and each of them singly, as our true and lawful attorneys with full power to each of them to sign for us, in our names in the capacities indicated below, any and all amendments to this Annual Report on Form 10-K filed with the Securities and Exchange Commission.
This power of attorney may only be revoked by a written document executed by the undersigned that expressly revokes this power by referring to the date and subject hereof.
Pursuant to the requirements of the Securities Exchange Act of 1934, this report has been signed below by the following persons on behalf of the Registrant and in the capacities and on the dates indicated.
|
Signature |
|
Title |
|
Date |
|
|
|
|
|
|
|
/s/Sotirios J. Vahaviolos |
|
Chairman, President and Chief Executive |
|
August 8, 2014 |
|
Sotirios J. Vahaviolos |
|
Officer (Principal Executive Officer) |
|
|
|
|
|
and Director |
|
|
|
|
|
|
|
|
|
/s/ Jonathan H. Wolk |
|
Executive Vice President, Chief Financial |
|
August 8, 2014 |
|
Jonathan H. Wolk |
|
Officer and Treasurer (Principal Financial and |
|
|
|
|
|
Accounting Officer) |
|
|
|
|
|
|
|
|
|
/s/Daniel M. Dickinson |
|
Director |
|
August 8, 2014 |
|
Daniel M. Dickinson |
|
|
|
|
|
|
|
|
|
|
|
/s/ James J. Forese |
|
Director |
|
August 8, 2014 |
|
James J. Forese |
|
|
|
|
|
|
|
|
|
|
|
/s/ Richard H. Glanton |
|
Director |
|
August 8, 2014 |
|
Richard H. Glanton |
|
|
|
|
|
|
|
|
|
|
|
/s/Ellen T. Ruff |
|
Director |
|
August 8, 2014 |
|
Ellen T. Ruff |
|
|
|
|
|
|
|
|
|
|
|
/s/ Michael J. Lange |
|
Director |
|
August 8, 2014 |
|
Michael J. Lange |
|
|
|
|
|
|
|
|
|
|
|
/s/Manuel N. Stamatakis |
|
Director |
|
August 8, 2014 |
|
Manuel N. Stamatakis |
|
|
|
|