Attached files
| file | filename |
|---|---|
| 8-K - FORM 8-K - NORFOLK SOUTHERN CORP | d8k.htm |
| EX-99.1 - CONFERENCE CALL TRANSCRIPT DATED JULY 27, 2010 - NORFOLK SOUTHERN CORP | dex991.htm |
 Second Quarter 2010 Results
Donald W. Seale
Executive Vice President
and Chief Marketing Officer
Exhibit 99.2 |
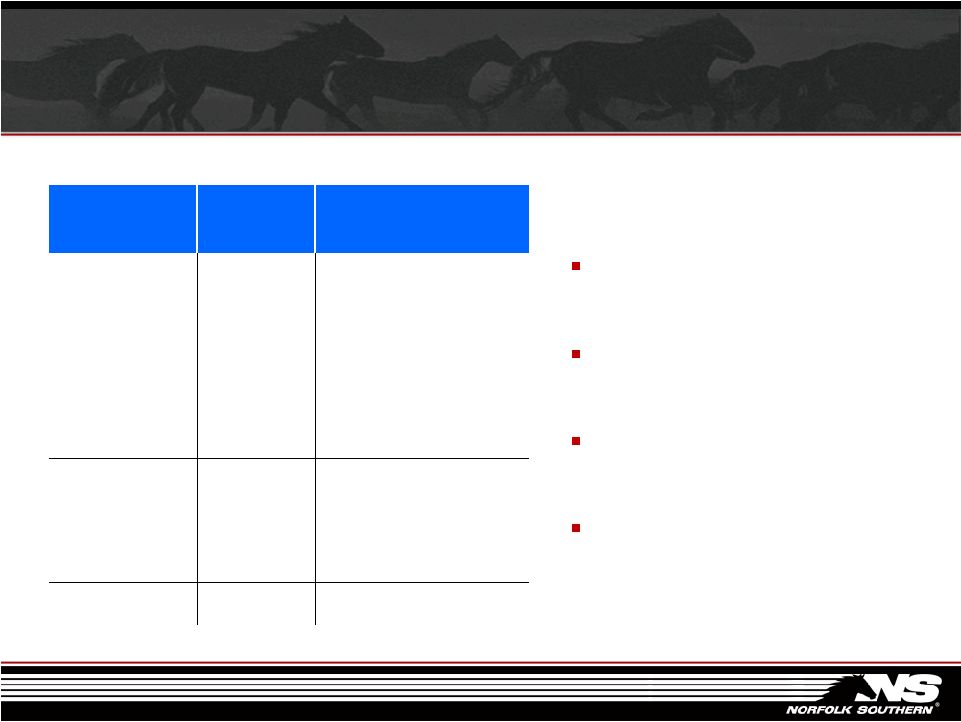
 Railway Operating Revenue
Second Quarter 2010 vs. 2009
Total -
$2.4 Billion
Up $573 million, 31% vs. 2Q 2009
Volume
$404
Revenue Per Unit
$169
Total Change
$573
Merchandise
$1,283
+31%
Coal
$696
+36%
Intermodal
$451
+23% |
 Revenue Per Unit
Second Quarter 2010 vs. 2009
Automotive -
legacy contract
renegotiation & extended hauls
Coal –
Improved export and
utility yield
Agriculture -
decline due to
shorter haul business
Paper –
lower RPU due to truck
competition and increased
shorter haul traffic
2Q 2010
vs. 2Q 2009
Rev/Unit
Abs.
% Chg.
Agriculture
$2,103
($22)
(1%)
MetCon
$1,586
$126
9%
Chemicals
$3,158
$111
4%
Paper
$2,142
($97)
(4%)
Automotive
$2,277
$479
27%
Merchandise
$2,166
$73
3%
Intermodal
$616
$16
3%
Coal
$1,765
$227
15%
Total
$1,413
$98
7% |
 Railway Volume
Second Quarter 2010 vs. 2009
•
Improving economy & weak
comparisons
to
2
nd
quarter
2009
•
Strong project growth
•
Metals/Construction, Paper,
Chemicals & Intermodal
produce 52 week high
loadings
2Q 2010
Units
Abs.
% Chg.
Agriculture
152,951
17,914
13%
MetCon
175,389
58,190
50%
Paper
85,250
11,173
15%
Chemicals
105,933
25,432
32%
Automotive
72,547
11,695
19%
Merchandise
592,070
124,404
27%
Intermodal
733,324
120,559
20%
Coal
394,415
62,504
19%
Total
1,719,809
307,467
22%
vs. 2Q 2009 |
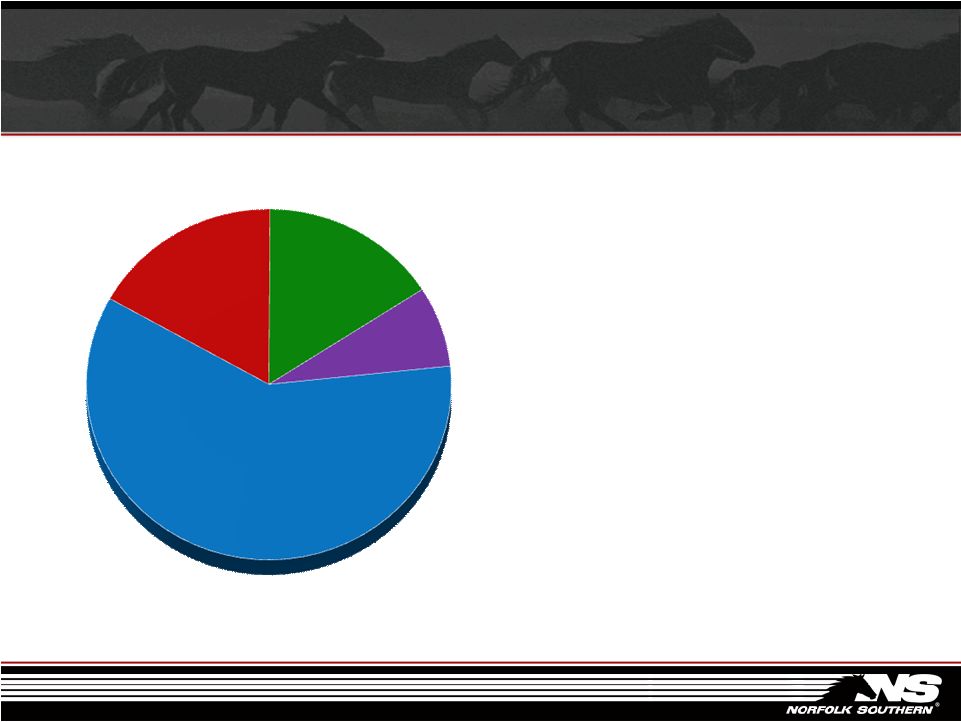
 Merchandise Volume
Second Quarter 2010 vs. 2009
•
Total Merchandise volume up
27%
•
Metals/Construction volume driven
by increased steel demand, new
business, and energy related
construction materials
•
Chemicals markets growth from
increased production of basic
chemicals & project growth
•
Automotive volume growth led by
increased vehicle production &
new Northeast business
Chemicals
105,933
+32%
Automotive
72,547
+19%
Paper
85,250
+15%
Agriculture
152,951
+13%
Metals/Construction
175,389
+50% |
 Merchandise Volume
Second Quarter 2010 vs. 2009
•
Agriculture growth driven by
increased corn, ethanol and
fertilizer shipments
•
Paper & Forest volume increase in
pulpboard and lumber
Chemicals
105,933
+32%
Automotive
72,547
+19%
Paper
85,250
+15%
Agriculture
152,951
+13%
Metals/Construction
175,389
+50% |
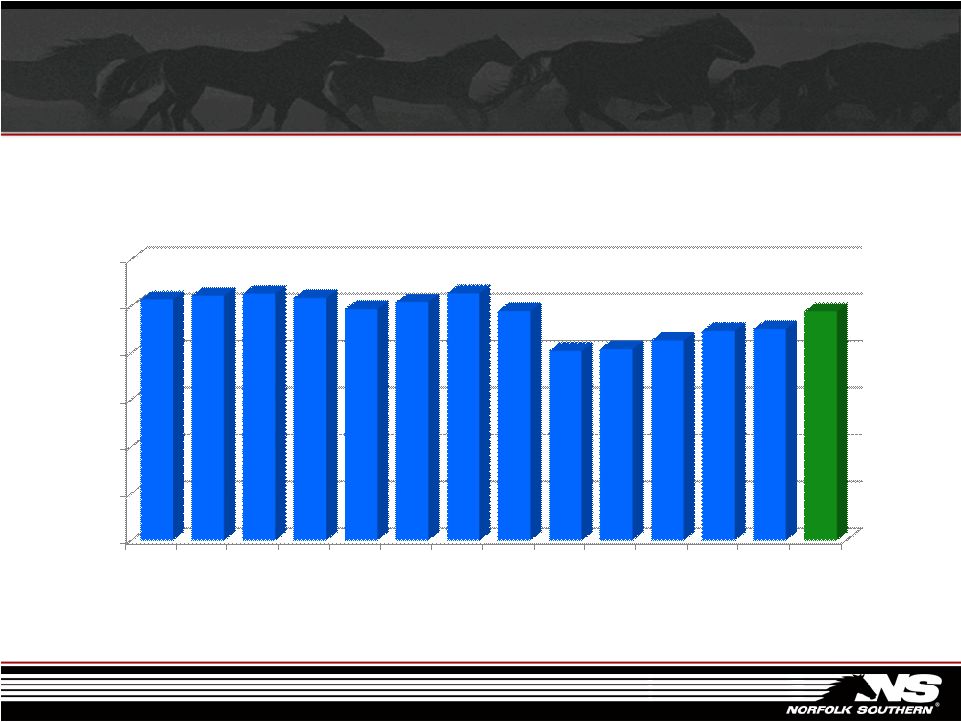
 Merchandise Volume
First Quarter 2007 –
Second Quarter 2010
0
100,000
200,000
300,000
400,000
500,000
600,000
700,000
800,000
1Q
2007
2Q
2007
3Q
2007
4Q
2007
1Q
2008
2Q
2008
3Q
2008
4Q
2008
1Q
2009
2Q
2009
3Q
2009
4Q
2009
1Q
2010
2Q
2010
Merchandise Carloads
+27% |
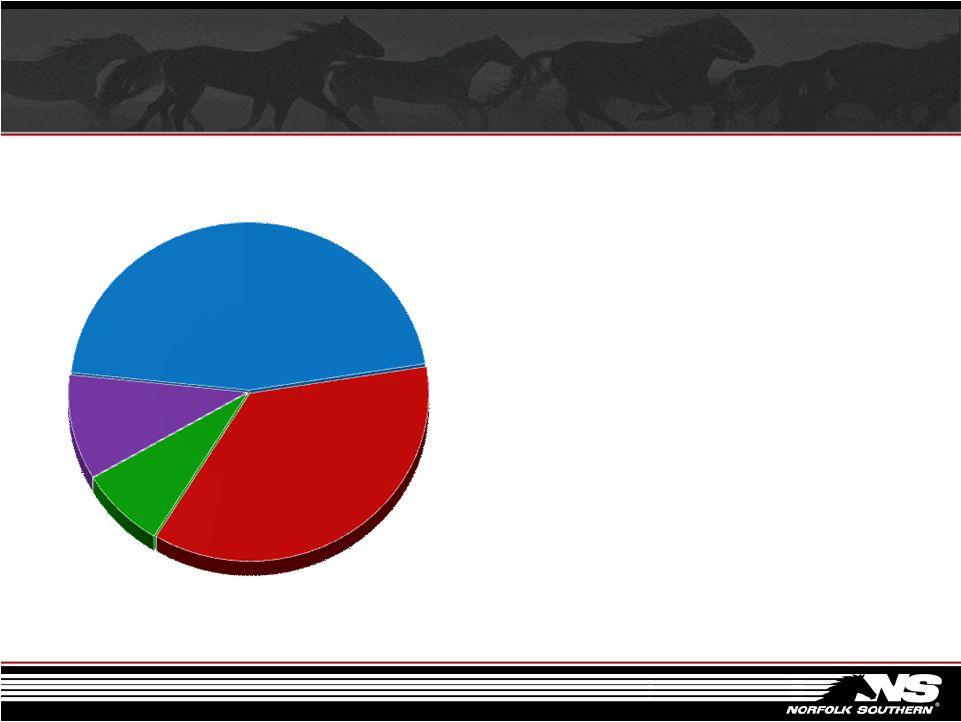 Intermodal Volume
Second Quarter 2010 vs. 2009
•
Total Intermodal volume up 20%
•
Domestic volume up 32%, led by
truckload diversions
•
International volume up 10%,
driven by improving global
demand
•
Premium volume up 19%, driven
by new LTL and truckload
services
Premium
57,140
+19%
Triple Crown
74,051
+7%
Domestic
335,900
+32%
International
266,233
+10% |
 Intermodal Volume
First Quarter 2007 –
Second Quarter 2010
0
150,000
300,000
450,000
600,000
750,000
900,000
1Q
2007
2Q
2007
3Q
2007
4Q
2007
1Q
2008
2Q
2008
3Q
2008
4Q
2008
1Q
2009
2Q
2009
3Q
2009
4Q
2009
1Q
2010
2Q
2010
Intermodal Units
+20% |
 Chicago
Cincinnati
Columbus
Pritchard
Roanoke
Norfolk
Detroit
Heartland Corridor
Existing Terminals
New Terminals
•
First Double Stack Train in September, 2010
•
Saves up to 233 miles off current routes
•
Early
2
nd
Morning
service
from
Norfolk
to
Columbus
•
Late
2
nd
Morning
service
from
Norfolk
to
Chicago |
 Coal
Volume Second Quarter 2010 vs. 2009
•
Total Coal volume up 19%
•
Strong growth in met coal to
export and domestic markets
•
Growth in northern utility volume
offset by weakness in the south
•
Recovery in industrial coal
shipments
Utility
257,349
(4%)
Export
61,557
+177%
Metallurgical
55,852
+125%
Industrial
17,780
+11% |
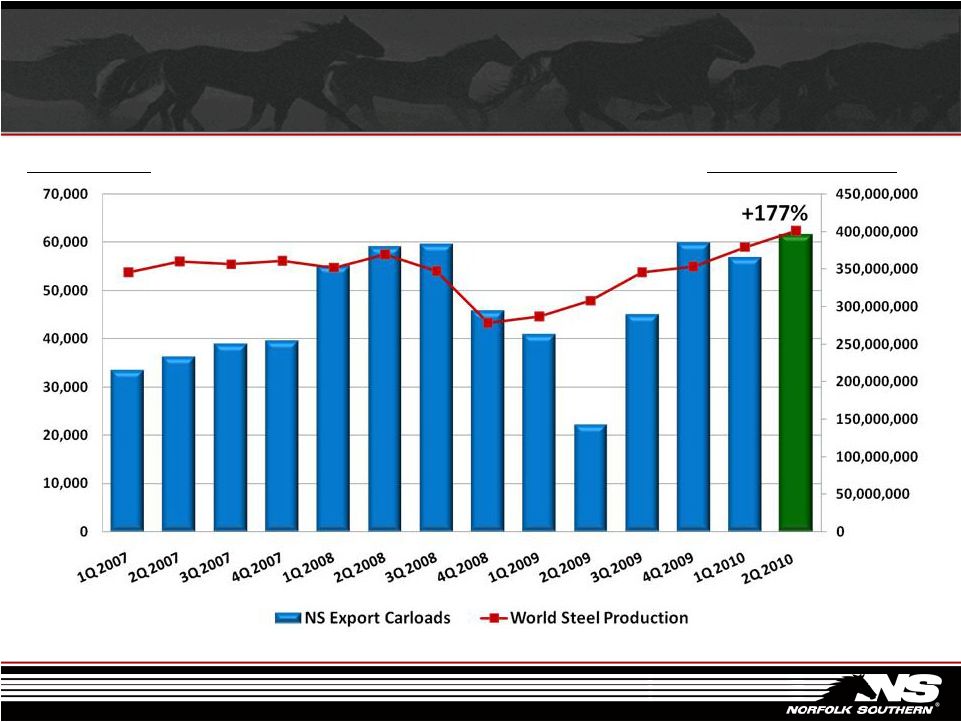 Source: World Steel Association Crude Steel Production Statistics, NS Comparison
Report Export Coal Volume & World Steel Production
First Quarter 2007 –
Second Quarter 2010
NS Export Carloads
World
Steel
Production
-
Tons |
 Source: World Steel Association Crude Steel Production Statistics, NS Comparison
Report Domestic Metallurgical Coal Volume & Domestic
Steel Production –
First Quarter 2007 –
Second Quarter 2010
NS Domestic Met Carloads
Domestic
Steel
Production
-
Tons
+125% |
 Utility Coal Volume & Coal Stockpiles
2007 -
2010
Sources: EVA, EEI
Utility Carloads (000) & Coal Stocks (MMT)
% Change in GWh
vs. Previous Year |
 Outlook –
Business Portfolio |
 Outlook Summary
Continued growth in core
markets
Strong project growth and
new business
Continued revenue per
unit improvement
1Q 2009 –
2Q 2010 Units
1Q 2009
2Q 2009
3Q 2009
4Q 2009
1Q 2010
2Q 2010
1,455,567
1,412,342
1,522,215
1,567,133
1,582,861
1,719,809 |
 Second Quarter 2010 Results
Mark Manion
Executive Vice President
and Chief Operating Officer |
 Rail
Industry Safety 6 Months 2010 Preliminary
(Injury Ratio per 200,000 Employee-Hours) |
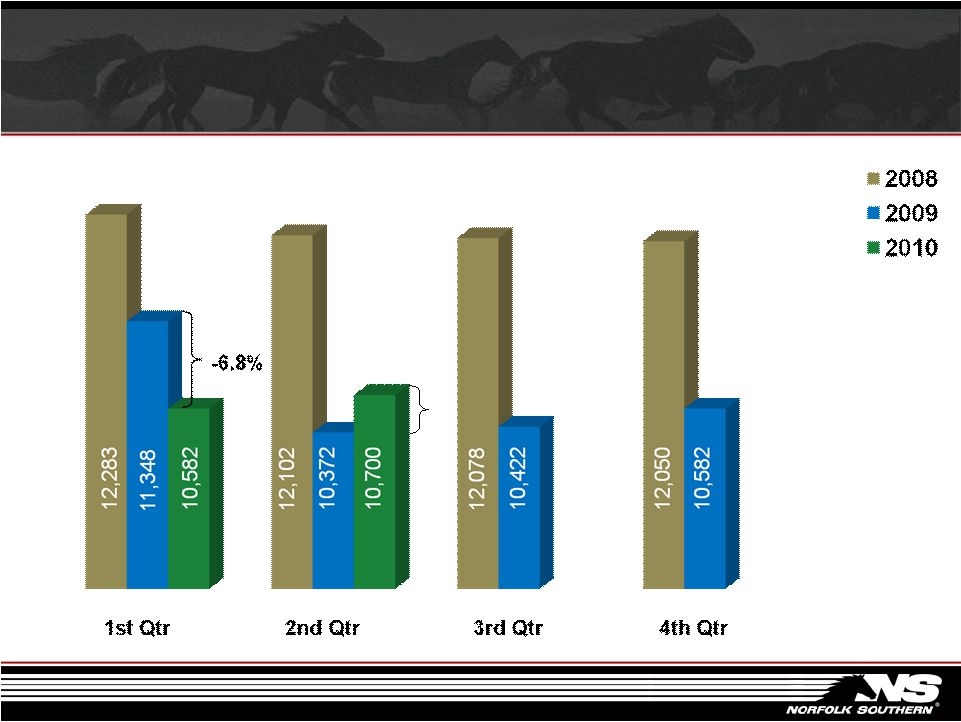
 Road
& Yard Crew Starts By Quarters 2008 -
2010
-1.1% |
 Train
& Engine Employees By Quarters 2008 -
2010
3.2% |
 Composite Service Performance
By Quarters 2008 -
2010
Change from Prior Year: |
 Productivity Scorecard
2Q 2010 vs. 2Q 2009
•
Carload Volume
22%
•
Crew Starts
10%
•
Railroad Employees
0%
•
GTMs per Employee
24%
•
GTMs per Gallon
5%
•
GTMs per Train Hour
3%
•
Car Hire Days per Carload
4% |
 Second Quarter 2010 Results
James A. Squires
Executive Vice President Finance
and Chief Financial Officer |
 Operating Results
Second Quarter 2010 vs. 2009 ($ Millions)
2
Second Qtr
Second Qtr
Favorable
(Unfavorable)
2010
2009
$
%
Railway Operating Revenues
$
2,430
$
1,857
$
573
31% |
 Operating Results
Second Quarter 2010 vs. 2009 ($ Millions)
3
Second Qtr
Second Qtr
Favorable
(Unfavorable)
2010
2009
$
%
Railway Operating Revenues
$
2,430
$
1,857
$
573
31%
Railway Operating Expenses
1,697
1,389
(308)
(22%)
Income from Railway Operations
$
733
$
468
$
265
57%
Railway Operating Ratio
69.8
74.8
5.0
7% |
 Railway Operating Expense Analysis
Second Quarter 2010 vs. 2009 ($ Millions)
4
Net Increase
$308 Million / 22%
-
$3
+ $105
+ $119
Depreciation
+ $40
+ $47
Materials
and Other
Purchased
Services
and Rents
Fuel
Compensation
and Benefits |
 Compensation and Benefits Analysis
Second Quarter 2010 vs. 2009 ($ Millions)
5
Increase
Incentive and Stock-Based Compensation
$
41
Volume-Related Payroll
29
Wage Rates
20
Medical Benefits (Active and Retiree)
18
Other
11
Total Increase
$
119 |
 Railway Operating Expense Analysis
Second Quarter 2010 vs. 2009 ($ Millions)
6
Net Increase
$308 Million / 22%
-
$3
+ $105
+ $119
Depreciation
+ $40
+ $47
Materials
and Other
Purchased
Services
and Rents
Fuel
Compensation
and Benefits |
 Fuel
Expense Analysis Second Quarter 2010 vs. 2009 ($ Millions)
7
$258
+ $25
+ $80
$153 |
 Railway Operating Expense Analysis
Second Quarter 2010 vs. 2009 ($ Millions)
8
Net Increase
$308 Million / 22%
-
$3
+ $105
+ $119
Depreciation
+ $40
+ $47
Materials
and Other
Purchased
Services
and Rents
Fuel
Compensation
and Benefits |
 Railway Operating Expense Analysis
Second Quarter 2010 vs. 2009 ($ Millions)
9
Net Increase
$308 Million / 22%
-
$3
+ $105
+ $119
Depreciation
+ $40
+ $47
Materials
and Other
Purchased
Services
and Rents
Fuel
Compensation
and Benefits |
 Other
Income - Net
Second Quarter 2010 vs. 2009 ($ Millions)
10
Second Qtr
Second Qtr
Favorable
(Unfavorable)
2010
2009
$
%
Corporate-Owned Life Insurance
$
(5)
$
7
$
(12)
(171%)
Interest on Tax Deficiencies
(2)
5
(7)
(140%)
All Other
24
24
--
--%
Other Income -
Net
$
17
$
36
$
(19)
(53%)
Interest Expense on Debt
$
115
$
113
$
(2)
(2%) |
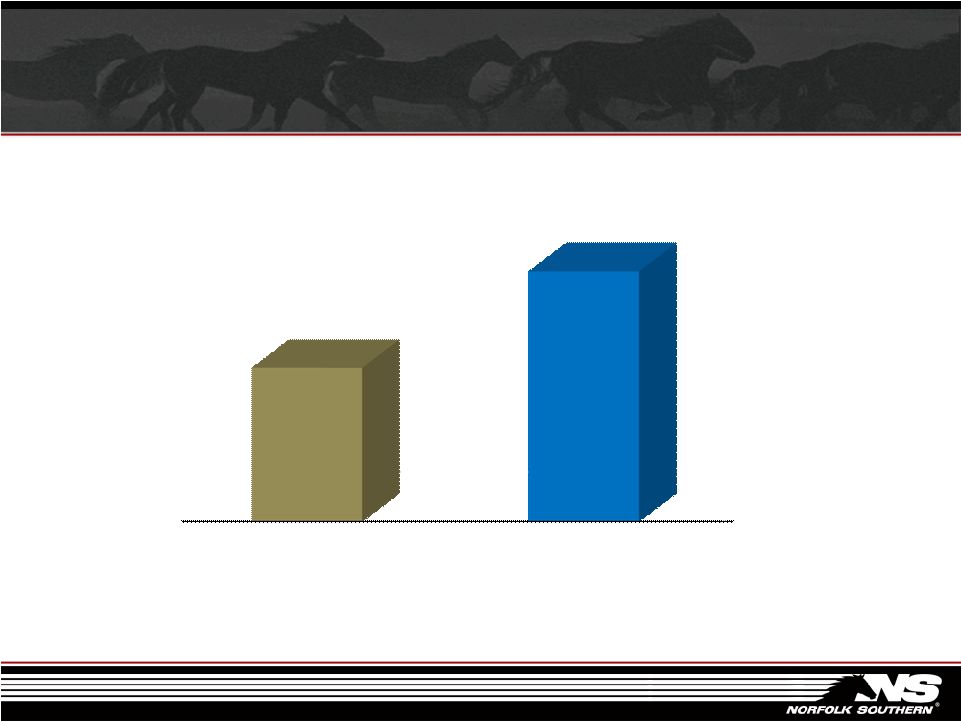 Income Before Income Taxes
Second Quarter ($ Millions)
11
Change vs.
Prior Period: + 62%
$391
$635
2009
2010 |
 Income Taxes
Second Quarter ($ Millions)
12
Change vs.
Prior Period: + 69%
$144
$243
2009
2010 |
 Net
Income and Diluted Earnings per Share Second Quarter ($ Millions except per
share) Net Income
13
$247
Diluted Earnings per Share
$392
$1.04
$0.66
Change vs. Prior Period:
+ 59%
Change vs. Prior Period:
+ 58%
2009
2010
2009
2010 |
 Cash
Flows First Six Months 2010 vs. 2009 ($ Millions)
14
*Please see reconciliation to GAAP posted on our web site.
2010
2009
Cash Provided by Operating Activities
$
1,382
$
643
Capital Expenditures
(569)
(566)
*Free Cash Flow
$
813
$
77
Dividends
$
252
$
250
Share Repurchases
$
114
$
--
Cash and Cash Equivalents at June 30
$
855
$
722 |