Attached files

Financial Update
Andrew W. Evans
Executive Vice President & CFO
Andrew W. Evans
Executive Vice President & CFO

2
2010 Analyst Meeting
Forward-Looking Statements
Certain expectations and projections regarding our future performance referenced in this presentation, in other reports or statements we file with the SEC or otherwise release to the public,
and on our website, are forward-looking statements. Senior officers and other employees may also make verbal statements to analysts, investors, regulators, the media and others that are
forward-looking. Forward-looking statements involve matters that are not historical facts, such as statements regarding our future operations, prospects, strategies, financial condition,
economic performance (including growth and earnings), industry conditions and demand for our products and services. Because these statements involve anticipated events or conditions,
forward-looking statements often include words such as "anticipate," "assume," "believe," "can," "could," "estimate," "expect," "forecast," "future," "goal," "indicate," "intend," "may,"
"outlook," "plan," "potential," "predict," "project," "seek," "should," "target," "would," or similar expressions. Our expectations are not guarantees and are based on currently available
competitive, financial and economic data along with our operating plans. While we believe our expectations are reasonable in view of the currently available information, our expectations
are subject to future events, risks and uncertainties, and there are several factors - many beyond our control - that could cause results to differ significantly from our expectations.
Such events, risks and uncertainties include, but are not limited to, changes in price, supply and demand for natural gas and related products; the impact of changes in state and federal
legislation and regulation including changes related to climate change; actions taken by government agencies on rates and other matters; concentration of credit risk; utility and energy
industry consolidation; the impact on cost and timeliness of construction projects by government and other approvals, development project delays, adequacy of supply of diversified
vendors, unexpected change in project costs, including the cost of funds to finance these projects; the impact of acquisitions and divestitures; direct or indirect effects on our business,
financial condition or liquidity resulting from a change in our credit ratings or the credit ratings of our counterparties or competitors; interest rate fluctuations; financial market conditions,
including recent disruptions in the capital markets and lending environment and the current economic downturn; general economic conditions; uncertainties about environmental issues and
the related impact of such issues; the impact of changes in weather, including climate change, on the temperature-sensitive portions of our business; the impact of natural disasters such
as hurricanes on the supply and price of natural gas; acts of war or terrorism; and other factors which are provided in detail in our filings with the Securities and Exchange Commission.
Forward-looking statements are only as of the date they are made, and we do not undertake to update these statements to reflect subsequent changes.
Supplemental Information
Company management evaluates segment financial performance based on earnings before interest and taxes (EBIT), which includes the effects of corporate expense allocations and on
operating margin. EBIT is a non-GAAP (accounting principles generally accepted in the United States of America) financial measure that includes operating income, other income and
expenses. Items that are not included in EBIT are financing costs, including debt and interest expense and income taxes. The company evaluates each of these items on a consolidated
level and believes EBIT is a useful measurement of our performance because it provides information that can be used to evaluate the effectiveness of our businesses from an operational
perspective, exclusive of the costs to finance those activities and exclusive of income taxes, neither of which is directly relevant to the efficiency of those operations.
Operating margin is a non-GAAP measure calculated as operating revenues minus cost of gas, excluding operation and maintenance expense, depreciation and amortization, and taxes
other than income taxes. These items are included in the company's calculation of operating income. The company believes operating margin is a better indicator than operating revenues
of the contribution resulting from customer growth, since cost of gas is generally passed directly through to customers.
EBIT and operating margin should not be considered as alternatives to, or more meaningful indicators of, the company's operating performance than operating income or net income
attributable to AGL Resources Inc. as determined in accordance with GAAP. In addition, the company's EBIT and operating margin may not be comparable to similarly titled measures of
another company.
attributable to AGL Resources Inc. as determined in accordance with GAAP. In addition, the company's EBIT and operating margin may not be comparable to similarly titled measures of
another company.
Reconciliations of non-GAAP financial measures referenced in this presentation are available on the company’s Web site at www.aglresources.com.
Cautionary Statements and Supplemental Information

3
2010 Analyst Meeting
Earnings Growth (diluted EPS)
(2002 - 2009 compound annual growth rate = 6.8%)
2010 earnings guidance is in the range of
$2.95 to $3.05 per diluted share
$2.95 to $3.05 per diluted share
Long-Term Earnings Track Record

4
2010 Analyst Meeting
EBIT by Segment
$ millions
|
|
2007
|
2008
|
2009
|
2010E*
|
|
Distribution Operations
|
$338
|
$329
|
$326
|
$348
|
|
Retail Energy Operations(1)
|
$113
|
$77
|
$105
|
$94
|
|
Wholesale Services
|
$34
|
$60
|
$47
|
$57
|
|
Energy Investments
|
$15
|
$19
|
$12
|
$11
|
|
Corporate
|
$(7)
|
$(1)
|
$(5)
|
$(6)
|
|
|
|
|
|
|
|
Earnings Per Diluted Share
|
$2.72
|
$2.84
|
$2.88
|
$2.95 - $3.05
|
(1) Retail Energy Operations segment includes EBIT related to SouthStar at the 100% level. AGL Resources owned a 70%
interest during 2007, 2008 and 2009, and received an approximate 75% share of the earnings each year (except in Ohio and
Florida, which were 70%). Effective January 1, 2010, AGL owns 85% of the joint venture partnership and receives 85% of its
earnings. The total earnings per diluted share for AGL Resources represented here reflects these sharing levels in each year.
* Segment EBIT expectations based upon midpoint of diluted EPS guidance range.
2010 Outlook - Segment EBIT

5
2010 Analyst Meeting
Earnings Diversification
6
2010 Analyst Meeting
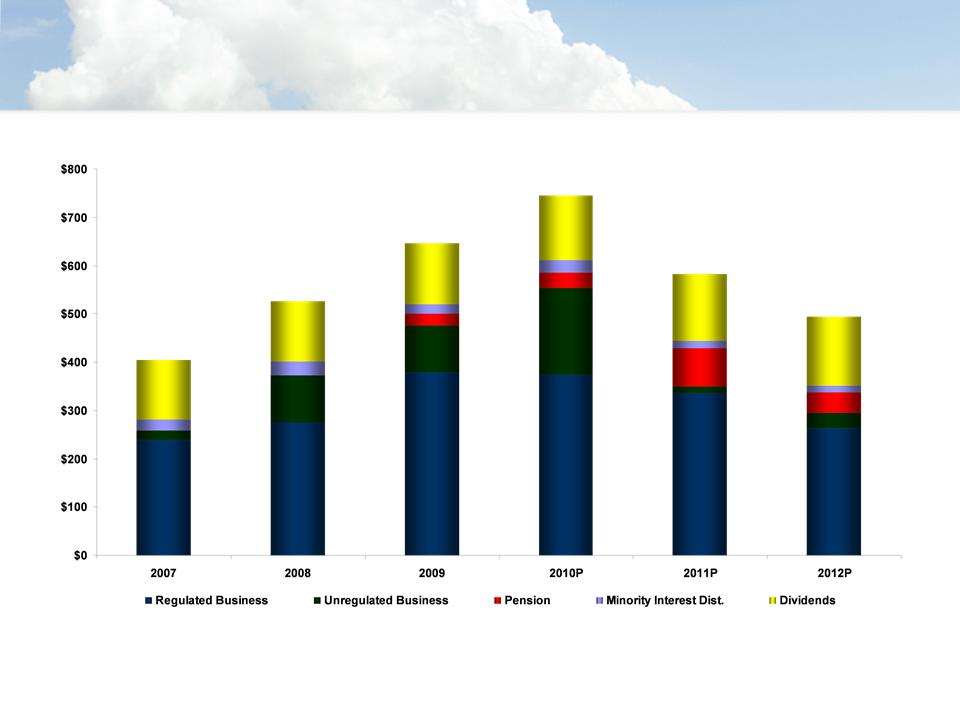
Capital Expenditures and Cash Distribution
In Millions
Note: Assumes dividend growth of $0.04 per share in 2011. Dividend increases are determined at the discretion of the Board of Directors.

7
2010 Analyst Meeting
Note: Excludes capital lease obligations and commercial paper balances.
Debt Maturity Schedule

8
2010 Analyst Meeting
Financing Activity
• Issued $300 million senior notes in August 2009 at 5.25%
• 2010 plan consists of refinancing:
– $1.0 billion Credit Facility, maturing August 2011
– $161 million Letter of Credit enhancements for the Pivotal Utility
Holdings revenue bonds, maturing June 2010 and September 2010
Holdings revenue bonds, maturing June 2010 and September 2010
– $300 million senior notes maturing January 2011
• Continue to have good access to the commercial paper market
and our peak working capital projections are well within our
current capacity
and our peak working capital projections are well within our
current capacity

9
2010 Analyst Meeting
We have strong investment-grade credit ratings and stable outlooks
from each of the rating agencies.
from each of the rating agencies.
Strong Investment-Grade Ratings

10
2010 Analyst Meeting
Management and the Board of Directors have demonstrated a
commitment to dividend growth and have established a strong track
record of regular dividend increases
commitment to dividend growth and have established a strong track
record of regular dividend increases
8-Year CAGR = 6.3%
Payout Ratio 59% 55% 50% 52% 54% 60% 59% 60% 59%*
* Based on midpoint of 2010 earnings guidance range.
Dividends declared
Commitment to Dividend Growth

11
2010 Analyst Meeting
2010 Focus
• Successful execution of regulatory strategy is critical
• Deliver on current capital project commitments
• Make prudent capital investments, with a bias toward regulated
projects with virtually no recovery lag
projects with virtually no recovery lag
• Continue to achieve consistent, modest growth in retail and
wholesale businesses
wholesale businesses
• Continue an aggressive focus on cost control throughout the
business
business
• Maintain strong balance sheet and liquidity profile