Attached files
| file | filename |
|---|---|
| EX-31.1 - EXHIBIT 31.1 - Diversified Restaurant Holdings, Inc. | c98386exv31w1.htm |
| EX-32.2 - EXHIBIT 32.2 - Diversified Restaurant Holdings, Inc. | c98386exv32w2.htm |
| EX-31.2 - EXHIBIT 31.2 - Diversified Restaurant Holdings, Inc. | c98386exv31w2.htm |
| EX-32.1 - EXHIBIT 32.1 - Diversified Restaurant Holdings, Inc. | c98386exv32w1.htm |
| EX-10.24 - EXHIBIT 10.24 - Diversified Restaurant Holdings, Inc. | c98386exv10w24.htm |
Table of Contents
U.S. SECURITIES AND EXCHANGE COMMISSION
Washington, D.C. 20549
FORM 10-K
| þ | ANNUAL REPORT UNDER SECTION 13 OR 15(d) OF THE SECURITIES EXCHANGE ACT OF 1934 |
For the fiscal year ended December 27, 2009
| o | TRANSITION REPORT PURSUANT TO SECTION 13 OR 15(d) OF THE SECURITIES EXCHANGE ACT OF 1934 |
For the transition period from to
Commission File No. 000-53577
DIVERSIFIED RESTAURANT HOLDINGS, INC.
(Exact name of small business issuer as specified in its charter)
| Nevada | 03-0606420 | |
| (State of other jurisdiction of Incorporation or organization) |
(I.R.S. Employer Identification No.) | |
| 27680 Franklin Rd. Southfield, MI |
48034 | |
| (Address of principal executive offices) | (Zip code) |
Registrant’s telephone number, including area code:
(248) 223-9160
(248) 223-9160
Securities registered under Section 12(b) of the Exchange Act:
None.
Securities registered under Section 12(g) of the Exchange Act:
Common Stock, $.0001 par value per share
(Title of Class)
Indicate by check mark if the registrant is a well-known seasoned issuer, as defined in Rule 405 of
the Securities Act. Yes o No þ
Indicate by check mark if the registrant is not required to file reports pursuant to Section 13 or
Section 15(d) of the Act. Yes o No þ
Indicate by check mark whether the registrant (1) has filed all reports required to be filed by
Section 13 or 15(d) of the Securities Exchange Act of 1934 during the preceding 12 months (or for
such shorter period that the registrant was required to file such reports), and (2) has been
subject to such filing requirements for the past 90 days. Yes þ No o
Indicate by check mark whether the registrant has submitted electronically and posted on its
corporate Web site, if any, every Interactive Data File required to be submitted and posted
pursuant to Rule 405 of Regulation S-T during the preceding 12 months (or for such shorter period
that the registrant was required to submit and post such files). Yes o No o
Indicate by check mark if disclosure of delinquent filers pursuant to Item 405 of Regulation S-K
(§229.405) is not contained herein, and will not be contained, to the best of registrant’s
knowledge, in definitive proxy or information statements incorporated by reference in Part III of
this Form 10-K or any amendment to this Form 10-K. þ
Indicate by check mark whether the registrant is a large accelerated filer, an accelerated filer, a
non-accelerated filer, or a smaller reporting company. See the definitions of “large accelerated
filer,” “accelerated filer” and “smaller reporting company” in Rule 12b-2 of the Exchange Act.
(Check one):
| Large accelerated filer o | Accelerated filer o | Non-accelerated filer o | Smaller reporting company þ | |||
| (Do not check if a smaller reporting company) |
||||||
Indicate by checkmark whether the registrant is a shell company (as defined in Rule 12b-2 of the
Act). Yes o No þ
State the aggregate market value of the voting and non-voting common equity held by non-affiliates
computed by reference to the price at which the common equity was last sold, or the average bid and
asked prices of such common equity, as of the last business day of the registrant’s most recently
completed second fiscal quarter.
5,806,521 common shares @ $5.25* = $30,484,235.25
* Average of bid and ask closing prices on June 30, 2009.
APPLICABLE ONLY TO REGISTRANTS INVOLVED IN BANKRUPTCY PROCEEDINGS DURING
THE PRECEDING FIVE YEARS
THE PRECEDING FIVE YEARS
Indicate by check mark whether the registrant has filed all documents and reports required to be
filed by Section 12, 13, or 15(d) of the Securities Exchange Act of 1934 subsequent to the
distribution of securities under a plan confirmed by a court.
Yes o No o
Yes o No o
(APPLICABLE ONLY TO CORPORATE REGISTRANTS)
Indicate the number of shares outstanding of each of the registrant’s classes of common stock, as
of the latest practicable date.
18,876,000 common shares issued and outstanding as of March 26, 2010
DOCUMENTS INCORPORATED BY REFERENCE:
Portions of the Proxy Statement of the Issuer for its June 3, 2010 Annual Meeting of Shareholders
are incorporated by reference into Part III of this Annual Report.
TABLE OF CONTENTS
| Page | ||||||||
| 1 | ||||||||
| 1 | ||||||||
| 10 | ||||||||
| 16 | ||||||||
| 17 | ||||||||
| 17 | ||||||||
| 17 | ||||||||
| 17 | ||||||||
| 18 | ||||||||
| 18 | ||||||||
| 18 | ||||||||
| 18 | ||||||||
| 19 | ||||||||
| 19 | ||||||||
| 20 | ||||||||
| 20 | ||||||||
| 20 | ||||||||
| 20 | ||||||||
| 20 | ||||||||
| 20 | ||||||||
| 20 | ||||||||
| 21 | ||||||||
| 21 | ||||||||
| Exhibit 10.24 | ||||||||
| Exhibit 31.1 | ||||||||
| Exhibit 31.2 | ||||||||
| Exhibit 32.1 | ||||||||
| Exhibit 32.2 | ||||||||
Table of Contents
PART I
The Registrant, Diversified Restaurant Holdings, Inc. and its subsidiaries are referred to in
this Annual Report on Form 10-K (“Annual Report”) as “Diversified”, “DRH”, “Company”, or in the
nominative “we” or “us” or the possessive
“our.”
Cautionary Statement Regarding Forward Looking Information
Certain statements contained in this Annual Report are “forward-looking statements” within the
meaning of the U.S. Private Securities Litigation Reform Act of 1995. All forward-looking
statements involve risks and uncertainties. All statements contained herein that are not clearly
historical in nature are forward-looking, and the word “anticipate,” “believe,” “expect,”
“estimate,” “project,” and similar expressions are generally intended to identify forward looking
statements. Any forward looking statement contained herein, in press releases, written statements
or other documents filed with the Securities and Exchange Commission, or in DRH’s communications
and discussions with investors and analysts in the normal course of business through meetings,
webcasts, phone calls and conference calls, regarding expectations with respect to sales, earnings,
cash flows, operating efficiencies, store openings, acquisitions, franchise sales, commodity
pricing, labor costs, or developments with respect to litigation or litigation costs are subject to
known and unknown risks, uncertainties and contingencies. Many of these risks, uncertainties, and
contingencies are beyond our control, and may cause actual results, performance or achievements to
differ materially from anticipated results, performance or achievements. Factors that might affect
such forward-looking statements include, among other things:
| • | Overall economic and business conditions; |
||
| • | The success of our marketing and other initiatives to attract customers; |
||
| • | Customer preferences; |
||
| • | Competitive factors in the restaurant industry; |
||
| • | Changes in tax requirements (including tax rate changes, new tax laws and revised tax
law interpretations); |
||
| • | Fluctuations in costs of commodities; |
||
| • | The internal and external costs of compliance with laws and regulations such as Section
404 of the Sarbanes-Oxley Act of 2002; and |
||
| • | Litigation against the Company. |
ITEM 1. BUSINESS
Introduction
Diversified Restaurant Holdings, Inc. is a leading Buffalo Wild Wings® (“BWW”)
franchisee that is rapidly expanding through organic growth and acquisitions. It operates 16
Buffalo Wild Wings restaurants: 11 in Michigan and five in Florida. DRH also created its own
unique, full-service restaurant concept: Bagger Dave’s Legendary Burgers and Fries®,
which falls within the fast-casual dining segment and was launched in January 2008. As of
February 22, 2010, we owned and operated three Bagger Dave’s® restaurants in Southeast Michigan
with the most recent store opening on February 21, 2010. We also have Franchise Disclosure
Documents filed in Michigan, Indiana and Ohio and one filing pending in Illinois for our Bagger
Dave’s concept.
Diversified Restaurant Holdings, Inc. was formed as a holding company on September 25, 2006 under
the laws of the State of Nevada. We own all the stock in three wholly-owned, Michigan corporate
subsidiaries that were formed in March 2007: AMC Group, Inc., AMC Wings, Inc., and AMC Burgers,
Inc. AMC Group, Inc. operates as a management company and provides management services for all
restaurants owned by AMC Wings, AMC Burgers and affiliates. AMC Wings, Inc. owns all restaurants
developed under the Buffalo Wild Wing concept. AMC Burgers, Inc. owns all restaurants developed
under the Bagger Dave’s concept. AMC Burgers, Inc. also owns Bagger Dave’s Franchising
Corporation, which will be the franchisor for the Bagger Dave’s concept.
1
Table of Contents
We are located at 27680 Franklin Road, Southfield, Michigan, 48034. Our telephone number is (248)
223-9160. We can also be found on the internet at
www.diversifiedrestaurantholdings.com and
www.baggerdaves.com.
At the end of 2009, we converted to a 52/53 week fiscal year ending the last Sunday in December.
Our 2009 fiscal year ended December 27, 2009 and had 361 operating days. Our 2008 and 2007 fiscal
years ended December 31 of each year, and had 366 and 365 operating days, respectively.
Recent Acquisition
On February 1, 2010, subsequent to the end of fiscal year 2009, we exercised our option to acquire
nine Buffalo Wild Wings® Grill & Bar locations in Michigan and Florida from affiliates
of the Company for $3.1 million. Previously, DRH had a service agreement between AMC Group, Inc.
and Stallion, LLC, our affiliated restaurants’ cooperative management company, to manage and
operate the nine affiliated Buffalo Wild Wings restaurants. The Service Agreement called for AMC
Group, Inc. to collect from Stallion, LLC a service fee up to 8.00% of the gross revenue of each
restaurant under management. We received the right to exercise the purchase option as part of our
initial public offering in August 2008. The acquisition of these restaurants was financed through
six-year promissory notes that bear interest at 6% per year issued by the Company in favor of the
sellers.
The acquired BWW Michigan stores are in Sterling Heights, Fenton, Novi, Clinton Township, Ferndale
and Warren, while the Florida stores are in Brandon, Fish Hawk Ranch and Sarasota. The stores
range in age from 4 years to 10 years. In 2009, these restaurants generated $24.4 million in
revenue, and we received management and advertising fee revenue of $1.7 million. The acquisition
of the affiliated Buffalo Wild Wings locations allows us to fully realize the economic benefits
associated with these nine BWW stores in 2010 and beyond.
Background
We were founded by T. Michael Ansley, our President and CEO, in late 2004 as an operating center
for seven Buffalo Wild Wings locations that Mr. Ansley owned and operated as a franchisee. Mr.
Ansley opened our first affiliated BWW in December 1999, and since then has received numerous
awards from BWW, including:
| • | 2000 Operator of the Year |
||
| • | 2003 Highest Annual Restaurant Sales (Novi, Michigan) |
||
| • | 2004 Jimmy Disbrow Founder’s Award |
||
| • | 2004 Scott Lowery Franchise Development Award |
||
| • | 2004 Highest Annual Restaurant Sales (Novi, Michigan) |
||
| • | 2005 Highest Annual Restaurant Sales (Novi, Michigan) |
||
| • | 2006 Highest Annual Restaurant Sales (Novi, Michigan) |
In September 2007, Mr. Ansley was awarded Franchisee of the Year by the International Franchise
Association (“IFA”). The IFA’s membership consists of over 10,000 franchisees and 1,300 franchisor
companies and its mission is to protect, enhance and promote franchising.
DRH was formed in 2006 to provide the framework and financial flexibility to grow both as a
franchisee of BWW and to develop and grow our unique Bagger Dave’s Legendary Burgers and
Fries® restaurant concept.
We originated the Bagger Dave’s® concept with our first store opening in January 2008 in Berkeley,
Michigan, followed later that year with our second store in Ann Arbor, Michigan. We just opened
our third store in February 2010 which is located in Novi, Michigan.
2
Table of Contents
As of December 27, 2009, we operated 16 Buffalo Wild Wings in Michigan and in Florida.
| Buffalo Wild Wings Restaurants | Owned | Managed | Planned | Total | ||||||||||||
2006 |
9 | 9 | ||||||||||||||
2007 |
2 | 9 | 11 | |||||||||||||
2008 |
6 | 9 | 15 | |||||||||||||
2009 |
7 | 9 | 16 | |||||||||||||
2010 |
16 | * | 0 | 2 | 18 | |||||||||||
| * | Includes acquisition of nine affiliated stores on February 1, 2010 |
As of December 27, 2009 we were operating two Bagger Dave’s Legendary Burgers and Fries®.
| Bagger Dave’s Restaurants | Owned | Planned | Total | |||||||||
2008 |
2 | 2 | ||||||||||
2009 |
2 | 2 | ||||||||||
2010 |
3 | * | 3 | |||||||||
| * | Includes most-recent store
opened on February 21, 2010 |
Restaurant Concepts
Buffalo Wild Wings
We are a franchisee for Buffalo Wild Wings, Inc. (NASDAQ: BWLD), which as of December 27, 2009,
reported 652 Buffalo Wild Wing Grill & Bar® restaurants in 42 states that were either directly owned or
franchised.
The restaurants combine elements of both quick casual and casual dining styles, both of which are
part of a growing industry. The restaurants feature boldly-flavored, crave-able menu items in a
neighborhood atmosphere with an extensive multi-media system, full bar and open layout that creates
a distinctive dining experience for sports fans and families alike. The restaurants are
differentiated by the social environment created and the connection created among the restaurant
staff, guests and the local community. The inviting and energetic environment of the restaurants
is complemented by furnishings that can easily be rearranged to accommodate parties of various
sizes. Guests have the option of watching various sporting events on projection screens or up to
40 additional televisions, playing Buzztime Trivia (formerly NTN Trivia) or playing video games.
Typically, each of our BWW restaurants have 50 television displays that range in size from 27
inches to 108 inches that are generally tuned to various sporting events, especially sporting
events of primary interest in the local community.
Buffalo Wild Wings® restaurants have widespread appeal and have won dozens of “Best Wings” and
“Best Sports Bar” awards across the country. The BWW menu is competitively priced between the
quick casual and casual dining segments, featuring traditional chicken wings, boneless wings, and
other items including chicken tenders, Wild Flatbreads™, popcorn shrimp, specialty hamburgers and
sandwiches, wraps, Buffalito® soft tacos, appetizers and salads. The made-to-order menu items are
greatly enhanced by the bold flavor profile of BWW’s 14 signature sauces, which range in flavor
from Sweet BBQ™ to Blazin’®. The restaurants offer approximately 20 domestic and imported beers,
wines and liquor. The award-winning food and memorable experience drives guest visits and loyalty.
Our typical BWW restaurant derives approximately 75% of its revenues from food and 25% of its
revenue from alcohol sales, primarily draft beer.
Bagger Dave’s Legendary Burgers & Fries®
Bagger Dave’s Legendary Burgers and Fries is our first initiative to diversify our operations by
developing our own brand. The concept is focused on providing the best burgers available. Made
from a never-frozen, premium beef blend, we believe our guests will be craving our beef and turkey
burgers after their first bite. We have created a warm, inviting, and entertaining atmosphere
through friendly and memorable guest service, historical community photos that decorate the walls
and an electric train that runs above the dining room and bar areas.
3
Table of Contents
Bagger Dave’s® offers a full-service restaurant and bar at a fast casual price point for
friends and families in a casual, comfortable, smoke-free atmosphere. The menu features freshly
made burgers accompanied by more than 30 toppings from which to choose, fresh-cut fries, and
hand-dipped milkshakes. Signature items include Sloppy Dave’s BBQ™, Train Wreck
Burger™, and Bagger Dave’s Amazingly Delicious Turkey Black Bean Chili™. The guiding
principal of the Bagger Dave’s brand is genuine simplicity. The burgers are made from a USDA fresh
premium ground beef blend with no trimmings or Michigan fresh ground turkey. The burgers come in
the “Regular” (two patties) or “Small” (one patty) versions on fresh buns. Customers can choose
from burger “Legends” including
the Train Wreck Burger™, the Blues Burger™ and Sloppy Dave’s BBQ™ or guests have the freedom to
“Create Your Own Legend” which allows you to totally customize your burger choosing from a variety
of buns and more than 30 toppings, including custom house-made sauces presenting bold and exciting
new flavors. In addition, burger toppings include various cheeses, bacon, egg, guacamole and a
variety of complimentary toppings — sautéed mushrooms and onions, barbecue sauce, steak sauce and
other standard condiments.
Beyond legendary burgers, Bagger Dave’s offers our Amazingly Delicious Turkey Black Bean Chili, a
Veggie Black Bean burger, a grilled cheese sandwich, a BLT sandwich, salads and fresh-cut fries.
The fries are cut in-house from Idaho potatoes and cooked in canola oil using a seven-step
Belgian-style process producing a fry reminiscent of those served at community fairs. We also
offer Dave’s Sweet Potato Chips™, a Bagger Dave’s specialty using fresh cut premium sweet potatoes
from North Carolina. Customers can choose from our own signature dipping sauces of
honey/cinnamon/sea salt mix (especially good on the sweet potato chips) or honey mustard.
To reinforce the Bagger Dave’s name and brand, our burgers, sandwiches and fries/chips are served
in natural (brown) bags with our logo stamped prominently thereon and set in a cake tin.
Bagger Dave’s also offers hand dipped ice cream and milkshakes with a variety of free mix-ins.
We recently introduced a breakfast menu at the Novi location, which opened in February 2010, so it
will have a three-part service day. The breakfast menu includes the freedom to create a legendary
breakfast sandwich with the “Build Your Own Breakfast Sandwich” option offered with fresh,
high-quality branded English muffins and the many options for toppings and sauces available for the
“Create Your Own Legend.”
We believe our tagline captures it all: “Bagger Dave’s®. Legendary Tastes. Unforgettable
Experience. “More information on Bagger Dave’s® can be found on our website:
www.baggerdaves.com.
Growth Strategy
We firmly believe that a happy employee translates into a happy guest. A happy guest drives repeat
sales and word-of-mouth marketing — two key factors that are fundamental to same store sales growth
strategy. We believe that our core expertise is in the site selection, development, management,
quality guest service and operation of fast casual restaurants. We plan to grow by increasing the
number of restaurants in each of the two concepts we currently offer and by developing or acquiring
additional concepts that can be expanded profitably.
We are an experienced operator of 16 franchised Buffalo Wild Wings® (BWW) restaurants. We
currently operate eleven Buffalo Wild Wings Grill & Bar restaurants in Michigan (one in the
Northern Lower Peninsula and ten in the greater Detroit Metropolitan areas of Oakland, Macomb and
Genesee counties) and five in the Tampa/Sarasota, Florida region. We have a development agreement
with the franchisor of Buffalo Wild Wing restaurants to open an additional 22 Buffalo Wild Wing
restaurants by 2017. Twelve (12) of those restaurants are planned to be located in Michigan and
ten (10) of those restaurants are planned to be located in the Tampa, Florida region. We plan to
open two Buffalo Wild Wings restaurants in 2010. We plan to open one store in June of this year in
Marquette, Michigan and expect to open the second later in the year in Chesterfield, Michigan. We
expect to open additional stores if optimal locations are found and appropriate financing can be
secured.
In 2008, we established a new restaurant concept, Bagger Dave’s Legendary Burgers and Fries®. We
had two restaurants that began operations in 2008 and, on February 21, 2010, we opened our third
restaurant in Novi, Michigan. If our Bagger Dave’s® concept proves to be successful, as it has
with the first two stores, we plan to grow throughout the upper Midwest and, ultimately,
nationally. We believe that with the three stores currently
operating and the planned opening of a fourth store, we can demonstrate proof of concept and begin
franchising the Bagger Dave’s concept. We currently have Franchise Disclosure Documents filed in
Michigan, Indiana and Ohio and one pending in Illinois. Our plan is to continue to develop and
grow this concept as we concurrently expand our Buffalo Wild Wings franchises in Michigan and
Florida. We expect to maintain a 1.5 to 1 ratio of corporate-owned Bagger Dave’s to franchised
operations.
4
Table of Contents
Store Locations and Expansion Plans
Affiliated Buffalo Wild Wings Restaurants under Management in 2009 (Purchased Effective February 1,
2010)
| Approximate | Remodeled/ | |||||||||
| Population in | Planned | |||||||||
| Five-mile | Remodeling | |||||||||
| Opened | Location | Location Characteristics | Radius | or upgrade | ||||||
December 1999
|
Sterling Heights, MI | 6,542 square feet. Located directly in front of an AMC 30 cinema in a shopping center anchored by Walmart situated along the M-59 corridor. | 228,000 | July 2005, freshening is scheduled in 2010 | ||||||
April 2001
|
Fenton, MI | 6,105 square feet. Located in growing community off of U.S. Highway 23, just 45 minutes from Metropolitan Detroit. | 40,000 | July 2006, Gen. 4.1 remodel in 2011 | ||||||
June 2002
|
Novi, MI* *Ranked number one in sales by Buffalo Wild Wings Inc. in 2003, 2004, 2005, and 2006 |
6,815 square feet. Located in an outdoor lifestyle entertainment center facing 1-96, beside a 20 screen Emagine cinema complex in a growing, young-affluent suburb northwest of Detroit in Oakland County. | 145,000 | Gen. 4.1 remodel in June 2007 | ||||||
December 2003
|
Clinton Township, MI | 6,600 square feet. Stand alone restaurant located directly across the street from a Meijer Super Center in the heart of Macomb County, just north of Detroit. | 303,000 | Feb. 2009 | ||||||
June 2004
|
Brandon, FL | 6,600 square feet. Stand alone location at the end of the Cross-town Expressway in Brandon, Florida, just east of Tampa. | 198,000 | June 2009 | ||||||
March 2005
|
Ferndale, MI** **Consistently ranks in top 25 national Buffalo Wild Wing system-wide sales |
7,400 square feet. Located on Nine Mile Road, just north of Detroit in rejuvenated downtown Ferndale near the I-75 and I-696 interchange in the heart of Metropolitan Detroit. | 459,000 | June 2010 | ||||||
September 2005
|
Riverview (Fish Hawk Ranch, FL |
6,400 square feet. Located a mile from a community with about 6,700 new homes. Two potential new developments may add up to 6,400 more homes over the next several years once the economy in Florida recovers. | 127,000 | 2011 freshening | ||||||
March 2006
|
Sarasota, FL | 6,500 square feet. Located on Clark Road in Sarasota, the main artery out to Siesta Key. The location is the anchor end cap position in a small shopping center that features Moe’s, Atlanta Bread and other restaurants. | 138,000 | Feb. 2009 | ||||||
July 2006
|
Warren, MI*** ***Since opening ranks in top 25 Buffalo Wild Wing system-wide sales |
6,800 square feet. Located directly across from the General Motors Technology Center which employs over 22,000 people in this northern Detroit suburb. | 331,000 | 2011 freshening | ||||||
5
Table of Contents
Company-Owned Buffalo Wild Wings® Restaurants Operated in 2009
| Approximate | Remodeled/ | |||||||||
| Population in | Planned | |||||||||
| Five-mile | Remodeling | |||||||||
| Opened | Location | Location Characteristics | Radius | or Upgrade | ||||||
August 2007
|
North Port, FL | 6,400 square feet. Located in an end cap position of a shopping center anchored by a Super Walmart and Home Depot at Tamiami Trail (U.S. Route 41) and Sumter Road. | 63,000 | New | ||||||
August 2007
|
Riverview, FL | 6,400 square feet. Located in an end cap position of a shopping center anchored by a Sweet Bay (grocery store) and Office Max on Big Bend Road at U.S. 301 just off I-75. Other tenants include Five Guy’s Famous Burgers and Fries, Panera Bread, Fifth Third Bank, and Panda Express among several others. | 66,000 | New | ||||||
March 2008
|
Grand Blanc, MI | 6,000 square feet. Located in an out building directly in front of a new 14 screen movie theater with an IMAX theater (NCG Trillium Cinema). A Target, JCPenney and many other specialty shops are proposed for this shopping center which is about a mile off of I-75 just south of Flint, MI near Genesys Hospital (employs 3,000). | 56,000 | New | ||||||
August 2008
|
Petoskey, MI | 6,200 square feet. Located in an end cap position in a Lowe’s-anchored shopping center, near an adjacent Walmart, Home Depot, Cinema and new $160 million Victory Casino. | 14,000 Tourism | New | ||||||
July 2008
|
Troy, MI | 7,500 square feet. Located on Big Beaver Road at John R Road in a densely populated suburb of Detroit. The Troy Sports Complex anchors the center with 4 NHL size hockey rinks for recreational activities and leagues. Also in the center is Starbucks, Einstein Bagels, Olga’s Kitchen, Verizon Wireless, Kroger and many more. | 258,000 | New | ||||||
December 2008
|
Flint, MI | 6,400 square feet. Located in an end cap position in a strip mall anchored by TJ Maxx and Hobby Lobby and directly across the street from the Genesee Valley Center, a large regional indoor mall with Sears, Macy’s and JCPenney. | 105,000 | New | ||||||
July 2009
|
Port Huron, MI | 6,500 square feet. Located on M-25, a main thoroughfare just North of Port Huron, MI in an end cap position in a strip mall directly across the street from the Birchwood Mall, a large regional indoor mall with Sears, Macy’s, Target and JC Penny as anchors. There is also a 10 screen movie theater at the mall. | 49,000 | New | ||||||
6
Table of Contents
BWW Restaurants under Development — Planned Opening in 2010
We plan to open two Buffalo Wild Wing® restaurants in 2010, the first in Marquette, Michigan and
the second in Chesterfield Township, Michigan. We plan to fund the startup of these restaurants
through our current capital resources and by loans from either existing lending sources or other
suitable funding sources. These loans will be recorded as liabilities on our balance sheet and the
furniture, equipment and leasehold improvements will be
recorded as capital assets on the balance sheet of each separate affiliated legal entity that owns
the restaurant. The financial statements of these wholly-owned subsidiaries will be combined with
our balance sheet on a consolidated basis for reporting purposes. We are also looking for
opportunities to open a third Buffalo Wild Wings location in 2010.
Company-Owned Bagger Dave’s® Restaurants in 2009 and Early 2010
| Approximate | ||||||||
| Population in | ||||||||
| Five-mile | ||||||||
| Opened | Location | Location Characteristics | Radius | |||||
January 2008
|
Berkley, MI | 3,472 square feet. Located on Coolidge Highway near Twelve Mile Rd. in a stand-alone location. One of the densest areas in Metro Detroit, with approximately 16,000 residents within one mile. Nearby is William Beaumont Hospital, which employs close to 12,000 employees. | 331,000 | |||||
August 2008
|
Ann Arbor, MI | 3,800 square feet. Located in shopping center on Eisenhower Blvd. near Ann Arbor-Saline Rd. across from a new Whole Foods and an REI. One mile from University of Michigan stadium and 1/2 mile from large, popular shopping mall. High performing Panera Bread anchors the center. | 150,000 | |||||
February 2010
|
Novi, MI | 4,200 square feet. Located on an end cap position with patio space in the Novi Town Center shopping complex at the corner of Grand River Ave. and Novi Road. This is a high traffic center that includes Potbelly, Biggby Coffee, AT&T Cellular, Pei Wei and Bonefish restaurant. This restaurant also offers a newly designed breakfast service option. | 150,000 | |||||
Bagger Dave’s® Restaurants — Future Development
Management continuously searches for premium locations suitable to new restaurant development and
may open a fourth Bagger Dave’s in 2010 if the appropriate location and funding can be secured.
Site Selection
We conduct extensive analysis to determine the location of each new restaurant. Proximity to
businesses (office buildings, movie theaters, manufacturing plants, hospitals, etc) and leveraging
high-traffic venues are a key success criteria for our business.
We prefer a strong end-cap position in a well-anchored shopping center or life style entertainment
center. Movie theaters are also a major traffic driver for the Buffalo Wild Wings Grill & Bar®
concept. Three of our locations are
directly beside or in front of movie theaters. However, we do not rule out freestanding locations
if the opportunity meets certain economic criteria. We operate two stand-alone building locations
at this time.
7
Table of Contents
With our Bagger Dave’s Legendary Burgers & Fries®, we have applied similar criteria with a focus on
lunch and breakfast traffic opportunities. Designed to be a smaller, family-oriented restaurant
with an English pub type atmosphere the signature food item is the “Create Your Own Legend” burger
and breakfast sandwich that can be built with a wide array of toppings and our own signature
sauces.
Restaurant Operations
We believe that high quality restaurant management, valuing our employees, and providing fast,
friendly service to our guests will be the keys to our continued success.
Management and Staffing. When a restaurant is opened, we imbed our core values: cleanliness,
service and organization. Extraordinary efforts are devoted to ensuring that all stores exemplify
these ideals, making it a part of our corporate culture. Our restaurants are generally staffed
with one manager and between two and four assistant managers. The manager has responsibility for day-to-day
operations and is responsible for maintaining the standards of quality and performance we have
established. We have regional managers to supervise the operation of our restaurants including the
continuing development of each restaurant’s management team. Through regular visits to the
restaurants, the regional managers ensure adherence to all aspects of our concept, strategy and
standards of quality. We also have Secret Shoppers that regularly visit our restaurants and
provide customer satisfaction scores which each restaurant is graded on monthly.
Training and Development. Successful restaurant operations, customer satisfaction, quality and
cleanliness begin with the employee — a key component of our strategy. Consequently, we pride
ourselves on well organized training and very competitive incentive programs, many of which we
believe are unparalleled in the restaurant industry.
Aside from very competitive base salaries and benefits, management in incentivized with a strong
performance-based bonus program. We also provide group health insurance and tuition reimbursement
programs.
We emphasize growth from within the organization as much as possible, giving our employees the
opportunity to develop and advance. This philosophy helps build a strong loyal management team
with, we believe, better employee retention than our competitors. However, when necessary, we will
hire from the outside, but we will only hire candidates that meet or exceed our stringent criteria.
Restaurants. We typically operate BWW restaurants of around 6,000 square feet in size based on our
assessment of the population and opportunity in the area. We have a continuous capital improvement
plan for our restaurants and plan major renovations every 5 years. Nine of our 16 Buffalo Wild
Wing® restaurants are current with Generation 4.1 design criteria, three will be freshened-up in
2010 and one is scheduled for a Buffalo Wild Wings® Generation 4.1 upgrade in 2011. The
improvements will include high definition flat screen televisions and projectors. We also attempt
to increase seating capacity whenever possible.
Bagger Dave’s® will have a typical footprint of approximately 3,500 to 4,500 square feet plus an
outside seating area where feasible. We plan to establish this concept in the Detroit Metropolitan
market and then expand it throughout the Midwest, with an ultimate goal of possibly franchising the
concept nationally. We have added breakfast at our newest store that opened in February 2010 and
plan to offer a breakfast menu at our other locations as well. We can add breakfast with limited
impact on hourly labor costs and only 12-15 additional food items. With the exception of coffee
equipment, no additional kitchen equipment investment is required.
Metrics. We use several metrics to evaluate and improve each restaurant’s performance that
include: sales growth, ticket times, table turns, guest satisfaction, secret shopper scores, Guest
Experience Management (GEM) scores obtained through guest feedback via the internet, hourly labor
cost, and cost of sales (COS).
Purchasing and Quality
Our purchasing operations for the BWW restaurants is primarily through channels established by
Buffalo Wild Wings corporate operations. We do, however, negotiate directly with most of these
channels as to price and delivery terms. Where we purchase directly, we seek to obtain the highest
quality ingredients, products and supplies from reliable sources at competitive prices. For Bagger
Dave’s, we have been able to leverage our BWW purchasing power and develop supply sources at a more
reasonable cost than would be expected for a smaller restaurant concept.
8
Table of Contents
To maximize our purchasing efficiencies, our centralized purchasing staff typically negotiates
fixed-price contracts (usually for a one-year period) or, where appropriate, commodity-price based
contracts.
Marketing and Advertising
In 2009, we spent an approximately 2% of all restaurant sales on marketing efforts. Charitable
donations in our communities and developing local public relations is a major component of our
marketing efforts. We support programs that build traffic at the grass roots level. During 2009,
we participated in numerous local store marketing events for both Buffalo Wild Wings and Bagger
Dave’s throughout the communities that we service.
Buffalo Wild Wings®. We pay a marketing fee to Buffalo Wild Wings equal to 3% of revenue. Also the
restaurants that are located in the Metropolitan Detroit, Michigan market contribute approximately 0.5%
of revenue to the regional cooperative of franchisees, which is included in our 2% annual marketing
budget. We have established the BWW restaurants we manage in the Michigan and Florida markets
through coordinated local store marketing efforts and operating strengths that focus on the guest
experience. We constantly strive to improve our operational efficiency with comprehensive training
designed to enhance the service level to our guests, in order to increase location sales and the
corresponding service fee revenue. Our BWW locations have also benefited from increasing brand
awareness of Buffalo Wild Wings, which is supported by national advertising on ESPN and CBS during
key sports seasons, such as football and the March Madness NCAA basketball tournaments.
Our Buffalo Wild Wings stores participated in more than 30 local events in 2009 including the Oak
Apple Run (Royal Oak, Michigan), the Woodward Dream Cruise (Ferndale, Michigan), the Boys and Girls
Club Walk (Royal Oak, Michigan), the Children’s Leukemia Walk (in Milford and Petoskey, Michigan),
Sterling Fest (in Sterling Heights, Michigan), SudsFest (in Tampa, Florida), the Taste of Brandon
(Brandon, Florida) and the Sarasota Pumpkin Festival (Sarasota, Florida). In addition, we sponsored
more than 50 sports teams and held more than 80 fundraising nights, raising more than $8,000 for
local non-profit organizations.
Bagger Dave’s®. The advertising and marketing plan for developing the Bagger Dave’s® brand relies
on local media, specials, promotions and community events. We are also building our marketing
reach with our current guests through such efforts as an email and social media platforms. We
strongly believe that a large part of Bagger Dave’s® growth has been accomplished through
word-of-mouth.
Bagger Dave’s participated in more than 10 events in the communities we service including the Oak
Apple Run (Royal Oak, Michigan), the Woodward Dream Cruise (Ferndale, Michigan), the Boys and Girls
Club Walk (Royal
Oak, Michigan), the Children’s Leukemia Walk (in Milford, Michigan). Bagger Dave’s also sponsored
local sports teams and held various fundraising nights at their locations.
Information Technology
We believe that technology can help to provide a competitive advantage and enable our strategy for
growth through efficient restaurant operations, information analysis and ease and speed of guest
service. We have an integrated information system that manages the flow of information from each
restaurant to the corporate offices. The systems are designed for improving operating
efficiencies, enable rapid analysis of marketing and financial information, and reduce
administrative time. We are equipping our Bagger Dave’s restaurants with the ability for guests to
order on line and pick up their order at their convenience.
Competition
Competition in the restaurant industry is intense. Because the nature of our restaurant concepts
are “fast casual,” we compete with both national casual dining chains, such as Applebee’s, T.G.I.
Friday’s and Chili’s, as well as national fast food chains, such as McDonald’s, Burger King and
Arby’s, and local chains and independently-operated restaurants. Competition in the casual dining
and fast food segments of the restaurant industry is expected to remain intense with respect to
price, service, location, concept and the type and quality of food. There is also intense
competition for real estate sites, qualified management personnel and hourly restaurant staff.
Many of our competitors have been in existence longer than we have and they may be better
established in markets where we are currently or may be located in the future. Further, many of
these competitors have greater financial and other resources and more established market presence.
Accordingly, we must plan to continually evolve our restaurants, maintain high quality standards
and treat our guests in a manner that encourages them to return. We have an advantage with the
Buffalo Wild Wings restaurants because as they grow their brand and expand nationally, it helps our
marketing efforts. With the Bagger Dave’s concept, we focus on the underdeveloped, mid-range price
point sector of the restaurant industry, bracketed on the low end by Wendy’s and at the upper end
by Red Robin. Our pricing communicates value to the guest in a comfortable, welcoming atmosphere
providing full-service, unlike many competitors in the fast-casual segment.
9
Table of Contents
Employees
As of December 27, 2009, we had 413 employees consisting of 395 employees at our restaurants and 18
employees at our corporate offices. None of our employees are covered by a collective bargaining
agreement. We strive to promote from within and provide highly competitive wages and benefits. We
value our employees and their input and believe this philosophy contributes to a low turnover
ratio, even at the hourly wage level, relative to industry standards.
Trademarks, Service Marks and Trade Secrets
Our domestically-registered trademarks and service marks include, among others, Bagger Dave’s
Legendary Burgers & Fries®, Sloppy Dave’s BBQ®, Train Wreck
Burger®, Bagger Dave’s Amazingly Delicious Turkey Black Bean Chili™, and Dave’s Sweet
Potato Chips™. We place considerable value on our trademarks, service marks and trade secrets and
believe they are important to our brand-building efforts and the marketing of our Bagger Dave’s®
restaurant concept. We intend to actively enforce and defend our intellectual property, however,
we cannot predict whether the steps taken by us to protect our proprietary rights will be adequate
to prevent misappropriation of these rights or the use by others of restaurant features based upon
or similar to our concepts.
Although we believe we have sufficient protections concerning our trademarks and service marks, we
may face claims of infringement that could interfere with our efforts to market our brands.
The Buffalo Wild Wings® registered service mark is owned by Buffalo Wild Wings, Inc.
Available Information
We are subject to the informational reporting requirements of the Securities Exchange Act of 1934
and, therefore, we file periodic reports, proxy statements and other information with the
Securities and Exchange Commission (the “SEC”). The SEC maintains an Internet website
(www.sec.gov) that contains reports, proxy statements and other information for registrants that
file electronically. Additionally, such reports may be read and copied at the Public Reference
Room of the SEC at 100 F Street NE, Washington, D.C. 20549.
We
maintain a corporate Internet website at
www.diversifiedrestaurantholdings.com. On our website,
we make available, free of charge, certain key documents that we have filed with the SEC, including
our Annual Reports on Form 10-K, Quarterly Reports on Form 10-Q, and Proxy Materials related to our
Annual Meeting of Shareholders. Our website also features a hyperlink to a portion of the SEC’s
website where all of the reports we have filed with or furnished to the SEC may be accessed free of
charge. None of the other information found on our website is incorporated into this Annual Report
or any other report we file with, or furnish to, the SEC.
ITEM 1A. RISK FACTORS
The following risk factors could affect our business, financial condition and/or results of
operations. These risk factors should be considered in connection with evaluating the
forward-looking statements contained in this Annual Report because they could cause the actual
results and conditions to differ materially from those projected in our forward-looking statements.
Before you buy our common stock, you should know that investing in our common stock involves
risks, including the risks described below. The risks that are highlighted below are not the only
ones we face. If the adverse effects referred to in any of these risks actually occur, our
business, financial condition or operations could be adversely affected. In that case, the trading
price of our common stock could decline, and our stockholders may lose all or part of their
investment.
We May Not Be Able To Manage Our Growth
Our Company’s expansion strategy will depend upon our ability to open and operate additional
restaurants profitably. The opening of new restaurants will depend on a number of factors, many of
which are beyond our control. These factors include, among others, the availability of management,
restaurant staff and other personnel, the cost and availability of suitable restaurant locations,
cost effective and timely planning, design and build-out of restaurants, acceptable leasing or
financial terms, acceptable financing and securing required governmental permits. Although we have
formulated our business plans and expansion strategies based on certain assumptions, we anticipate
that, as with most business ventures, we will be subject to changing conditions. Our assessments
regarding timing and the opening of new restaurants as well as a variety of other factors may not
prove to be correct, and/or such new restaurants may not be operated profitably.
10
Table of Contents
Uncertainty of Market Acceptance
In the course of expansion of our concepts, we will enter new markets in which we may have limited
operating experience. There can be no assurance that we will be able to achieve success in our new
markets or in our new
stores. New restaurants typically require several months of operation before achieving normal
profitability. When we enter highly competitive new markets or territories in which we have not yet
established a market presence, the adverse effects on revenue and profit margins may be greater and
more prolonged than anticipated.
Competition
The food service industry is intensely competitive. Because of the nature of our concept as “fast
casual,” we will compete with national casual dining chains, such as Applebee’s, T.G.I. Friday’s
and Chili’s, national fast food chains, such as McDonald’s, Burger King and Arby’s, as well as
local chains and independently-operated restaurants. Competition in the casual dining and fast food
segments of the restaurant industry is expected to remain intense with respect to price, service,
location, concept and the type and quality of food. There is also intense competition for real
estate sites, qualified management personnel and hourly restaurant staff. Some of our competitors
have been in existence longer than we have and they may be better established in markets where we
are currently or may be located in the future. Further, many of these competitors have greater
financial and other resources and a more established market presence than we have.
Government Regulations
The restaurant industry is subject to numerous federal, state and local governmental regulations,
including those relating to the preparation and sale of food and alcoholic beverages, sanitation,
public health, fire codes, zoning and building requirements. Termination of the liquor license for
any restaurant would adversely affect the revenues of that restaurant and the failure to obtain
such licenses would adversely affect our expansion plans. We are also subject to laws governing our
relationships with employees, including benefit, wage and hour laws, and laws and regulations
relating to workers’ compensation insurance rates, unemployment and other taxes, working and safety
conditions and citizenship or immigration status. If legislation is enacted to remove the tip
credit (the difference between minimum wage and tipped employee minimum wage), our cost of labor
would increase dramatically and adversely affect our profits. In certain states we may be subject
to “dram-shop” statutes, which generally provide that a person injured by an intoxicated person has
the right to recover damages from an establishment that wrongfully served alcoholic beverages to
the intoxicated person. While we carry liquor liability coverage, a judgment against us under a
dram shop statute in excess of our insurance coverage, or any inability to continue to obtain such
insurance coverage at reasonable costs, could have a material adverse effect on us. Failure to
comply with any of these regulations or increases in the minimum wage rate, employee benefit costs
or other costs associated with employees, could adversely affect us.
Unionization of the Hourly Work Force
The possible enactment of the Employee Free Choice Act (EFCA) could have a material impact on our
business. This proposed “card check” legislation would eliminate our Team Members’ fundamental
right to a private ballot election in deciding whether or not to join a union. If the law resulted
in the unionization of our workforce, it would increase our costs significantly and reduce our
ability to generate a profit.
Certain Factors Affecting the Restaurant Industry
The restaurant industry is affected by national, regional and local economic conditions, changing
consumer tastes and spending priorities, health concerns and trends, demographic trends, traffic
patterns and the type, number and location of competing restaurants. Multi-unit chains such as ours
can also be adversely affected by publicity
resulting from food quality, illness, injury or other health concerns or operating issues stemming
from one restaurant or a limited number of restaurants. Dependence on fresh produce and meats also
subjects us to the risk that shortages or interruptions in supply, particularly of chicken wings
and ground beef, caused by unfavorable weather or other conditions, could adversely affect the
availability, quality or cost of food supplies. In addition, factors such as inflation, increased
food, labor and employee benefit costs, and the availability of qualified management and hourly
employees may also adversely affect the restaurant industry in general and our restaurants in
particular. We may be the subject of litigation based on discrimination, personal injury and other
claims. None of the foregoing factors can be predicted with any degree of certainty and any one or
more of these factors could have a material adverse effect on our financial condition and results
of operations. Our continued success will depend in part on our ability to identify and respond
appropriately to changing conditions.
11
Table of Contents
Need For Additional Financing
We currently plan to open between two (2) and four (4) new restaurants in 2010. The Company
anticipates that cash from operations, equipment leasing, lender based financing and landlord
construction contributions (when available) will be sufficient to fund our expansion plans for
2010. These estimates may prove to be inaccurate. Availability of credit may be limited due to the
unstable U.S. economy and tighter restrictions placed on traditional lending sources. To continue
our expansion at the same or a higher level, we anticipate that additional funding will be
necessary. We may not be able to obtain such additional financing or we may not be able to obtain
it on favorable terms.
Dependence on Key Personnel
Our ability to develop and market our products and to maintain a competitive position depends, in
large part, on our ability to attract and retain qualified personnel. There can be no assurance
that we will be able to attract and retain such personnel. In particular, we are presently
dependent upon the services of T. Michael Ansley, David G. Burke and Jason T. Curtis. We do not
have employment agreements with any of our employees. Our inability to retain the full-time
services of any of these people or attract other qualified individuals could have an adverse effect
on us, and there would likely be a difficult transition period in finding replacements for any of
them.
Trademarks, Service Marks and Trade Secrets
We place considerable value on our trademarks, service marks and trade secrets. We intend to
actively enforce and defend our intellectual property. We may not be successful in enforcing our
intellectual property rights. Our intellectual property may not have the value we believe it holds
and may be determined to violate or infringe the property rights of others if our rights are
challenged. Any of the foregoing adverse results could materially and negatively impact our
financial condition and operations.
Adverse Effect of Undesignated Stock and Anti-Takeover Provisions
Our authorized capital includes 10,000,000 shares of “blank check” preferred stock. Accordingly,
our Board of Directors has the authority to issue any or all of the shares of preferred stock,
including the authority to establish one or more series, and to fix the powers, preferences, rights
and limitations of such class or series, without seeking stockholder approval. Further, as a Nevada
corporation, the Company is subject to provisions of the Nevada Business Corporations Act (“NBCA”)
regarding “control share acquisitions” and “business combinations.” In the future, we may consider
adopting anti-takeover measures. The authority of the Board to issue undesignated stock and the
anti-takeover provisions of the NBCA, as well as any future anti-takeover measures adopted by us,
may, in
certain circumstances, delay, deter or prevent takeover attempts and other changes in our control
which is not approved by management and the Board of Directors. As a result, our stockholders may
lose opportunities to dispose of their shares at favorable prices generally available in takeover
attempts or that may be available under a merger proposal and the market price, voting and other
rights of the holders of Common Stock may also be affected. See “Description of Securities.”
No Assurance of Profitability
We may experience operating losses as we develop and implement our business plan. As a result, we
may not be able to achieve or maintain profitability.
Possible Issuance of Additional Shares without Stockholder Approval Could Dilute Stockholders
As of the date of this Annual Report, we have an aggregate of 18,876,000 shares of common stock
outstanding. In addition, our directors have a total of 144,000 options to purchase shares of
common stock at $2.50 per share,. Of these options, 94,000 are fully vested as of the date of this
Annual Report and 50,000 will vest on July 30, 2010. Although there are currently no other
material plans, agreements, commitments or undertakings with respect to the issuance of additional
shares of common stock or securities convertible into any such shares, if any shares are issued in
the future, they would further dilute the percentage ownership of our common stock held by our
stockholders.
12
Table of Contents
Penny Stock Regulations Could Inhibit the Trading Of Our Stock in the Secondary Market
The SEC has adopted rules that regulate broker-dealer practices in connection with transactions in
“penny stocks”. Penny stocks generally are equity securities with a price of less than $5.00 (other
than securities registered on certain national securities exchanges or quoted on the NASDAQ system,
provided that current price and volume information with respect to transactions in such securities
is furnished by the exchange or system). Prior to a transaction in a penny stock, a broker-dealer
is required to:
| • | deliver a standardized risk disclosure document prepared by the SEC that provides
information about penny stocks and the nature and level of risks in the penny stock market; |
||
| • | provide the customer with current bid and offer quotations for the penny stock; |
||
| • | explain the compensation of the broker-dealer and its salesperson in the transaction; |
||
| • | provide monthly account statements showing the market value of each penny stock held in
the customer’s account; and |
||
| • | make a special written acknowledgment that the penny stock is a suitable investment for
the purchaser and receive the purchaser’s written agreement to the transaction. |
These requirements may have the effect of reducing the level of trading activity in the secondary
market for a stock that becomes subject to the penny stock rules. If our share price drops below
$5.00, our shares could be subject to the penny stock rules. As such, investors might find it more
difficult to sell their shares.
Legal Actions Could Have an Adverse Affect on Us
We could face legal action from a franchisor, government agency, employee or customer. Many state
and federal laws govern our industry and if we fail to comply with these laws we could be liable
for damages or penalties. Further, we may face litigation from customers alleging that we were
responsible for some illness or injury they suffered at or after a visit to our restaurants, or
that we have problems with food quality or operations. We may also face litigation resulting from
employer-employee relations, including age discrimination, sexual harassment, gender discrimination
or local, state and federal labor law violations as an example. Expensive litigation may adversely
affect both our revenue and profits.
An Increase in the Cost of Our Food Products Could Adversely Affect Our Operating Results
Our primary food products are fresh chicken wings and ground beef. Any
material increase in the cost of fresh chicken wings or ground beef could adversely affect
operating results. Our cost of sales could be significantly affected by increases in the cost of
fresh chicken wings and ground beef, which can result from a number of factors, including
seasonality, increases in the cost of grain, disease and other factors that affect availability,
and greater international demand for domestic chicken and beef products. We also depend on our
franchisor, as it relates to chicken wings, to negotiate prices and deliver product to us at a
reasonable cost. Chicken wing prices averaged $1.69 per pound in 2009, $0.44 per pound higher than
the average of $1.25 in 2008. Our franchisor’s chicken wing purchase contract expired after the
March 2008 quarter and we are currently buying product at the spot rate. Wing costs averaged $2.02
per pound in January and February, 2010. This increase will negatively impact our profits in the
first quarter of 2010.
Failure to Gain Acceptance in Florida Could Have a Negative Impact on Our Operations
The Buffalo Wild Wings concept may not gain acceptance in the Florida market. If we fail to gain
acceptance in the Florida market, this could impede our financial performance.
The Bagger Dave’s Concept May Not Be Accepted
The Bagger Dave’s concept developed by us may not be accepted. If the public does not accept the
Bagger Dave’s concept, this would have a severe negative impact on our financial performance.
13
Table of Contents
If We Are Unable To Open New Restaurants in a Timely Manner, We May Suffer Negative Consequences
If we are unable to successfully open new restaurants in a timely manner, our revenue growth rate
and profits may be adversely affected. We must open restaurants in a timely and profitable manner
to successfully expand our business. In the past we have experienced delays in restaurant openings
and we may face similar delays in the future. These delays may trigger financial penalties by the
franchisor as provided in Area Development Agreements. These delays may not meet market
expectations, which may negatively affect our stock price. Further, future restaurants may not meet
operating results similar to those of existing locations. Our ability to expand successfully will
depend on the following factors:
| • | Locating and securing quality locations in new and existing markets; |
||
| • | Negotiating acceptable leases or purchase agreements; |
||
| • | Securing acceptable financing for new locations; |
||
| • | Cost effective designs by us and franchisors; |
||
| • | Timely planning and build-out of restaurants; |
||
| • | Obtaining and maintaining required local, state and federal government approvals and
permits related to construction of the restaurants and the sale of food and alcoholic
beverages; |
||
| • | Creating brand awareness in new markets; and |
||
| • | General economic conditions. |
The Opening of Other Restaurants Close To Our Existing Restaurants May Reduce Our Operating
Performance
New restaurants added to our existing markets, whether by us, other franchisees or the franchisor
may take sales away from our restaurants. We intend to open restaurants in our existing markets and
this may impact revenues earned by our existing restaurants. Also, the franchisor or other
franchisees could open restaurants in neighboring territories that may affect the sales of our
existing restaurants as well. These activities may reduce overall operational performance.
Actions by the Franchisor Could Negatively Affect Our Business and Operating Results
Our BWW restaurant business depends in part on decisions made by our franchisor. For example,
these decisions affect marketing and product costs. Business decisions made by our franchisor could
adversely impact our operating performance.
Compliance with the Sarbanes-Oxley Act May Be Costly
As we move forward, we may have to continue to implement accounting
procedures to comply with the Sarbanes-Oxley Act of 2002. These procedures may require us to incur
substantial audit and internal control related expenses in the future.
If We Fail To Attract and Retain Qualified Employees, We Will Be Unable To Operate Effectively
The success of our restaurants depends on our ability to attract, motivate and retain a sufficient
number of qualified restaurant employees, including managers, kitchen staff and wait staff. We may
not be able to attract and retain qualified personnel to operate and manage our restaurants. Our
inability to recruit and retain these individuals may delay the planned openings of new restaurants
and increase turnover at existing restaurants. This could impact our expansion strategy and lead to
higher labor costs, which would negatively impact our operating results. Further, the loss of any
or our key executive officers would likely adversely impact our performance.
14
Table of Contents
Changes in Consumer Preferences or Discretionary Consumer Spending Could Negatively Impact Our
Business
The success of our business depends, in part, upon the popularity of both Buffalo, New York-style
chicken wings and hamburgers. We also depend on trends of consumers eating away from home more
often. Shifts away from these current trends could impact our sales negatively. These shifts may
include consumer dietary changes as they avoid foods with high cholesterol, fat or carbohydrate
content, which are offered on our menus. Negative publicity related to these issues could also
impact our financial performance. Smoking bans by state or local governments could adversely affect
our performance as well. Michigan has enacted a smoking ban which goes into effect May 1, 2010.
Economic conditions could affect consumer discretionary spending, which could impact the amount of
money they have to spend in our restaurants, again negatively impacting our revenue and profits.
We Are Susceptible To Adverse Trends and Economic Conditions in Michigan and Florida
The Michigan economy is tied to a large degree to the automotive industry. This area is susceptible
to strikes, industry lay-offs and general economic contraction, which could negatively affect
customer counts and consumer discretionary spending, and which in turn would adversely impact our
revenue and profits. The Florida economy is heavily tied to the real estate market. Any continued
decline in the residential real estate market may have a negative impact on our individual customer
base, whether through loss of value or lack of new construction jobs, and may result in decreased
sales at our Florida locations.
We Could Be Adversely Impacted By Weather in Florida
Our locations in Florida are and will be located in the Tampa, Sarasota and Bradenton markets along
the Gulf of Mexico. This area is prone to tropical storm and hurricane conditions and the impact
from such storms could cause substantial damage to one or more restaurants and this could
negatively impact our financial performance. Further, future property insurance deductibles and
premiums could negatively impact our profits.
Our Ability to Raise Capital In The Future May Be Limited, Which Could Adversely Impact Our
Business
Changes in our operating plans, acceleration of our expansion plans, lower than anticipated sales,
increased expenses or other events, including those described in this section, may cause us to seek
additional debt or equity financing. Such financing may not be available on acceptable terms, or at
all, and our failure to raise capital when needed could negatively impact our growth and other
plans as well as our financial condition and results of operations. Additional equity financing, if
available may be dilutive to the holders of our common stock and may involve significant cash
payment obligations and covenants and/or financial ratios that restrict our ability to operate and
expand.
Our Current Insurance May Not Provide Adequate Levels of Coverage against Claims
We currently maintain insurance that is customary and required in our franchise agreements and
leases. However, there are types of losses we may incur that cannot be insured against or that we
believe are not economically reasonable to insure against, such as losses due to natural disasters
or terrorism. Such damages from loses may cause direct economic impact to us and our restaurants.
Improper
Food Handling May Adversely Affect Our Business
There are health risks associated with eating improperly handled or prepared food items. Negative
publicity resulting from improper handling of food items may adversely affect our sales and impact
our revenue and profits negatively. Although we carry insurance for these types of events, the
coverage may not be sufficient and we may sustain losses.
Risks of Continuing Losses and Financial Covenant Violations
There can be no assurances that in the future the Company will be in compliance with all covenants
of its current or future debt agreements or that its lenders would waive any violations of such
covenants. Non-compliance with debt covenants by the Company could have a material adverse effect
on the Company’s business, results of operations and financial condition.
15
Table of Contents
ITEM 2. PROPERTIES
We do not own any real property for use in our operations or otherwise. We do rent space from third
parties on the terms described more specifically below:
| Monthly | ||||||||||
| Location | Landlord | Rent | Lease Ends | Options | ||||||
Company Headquarters
21751 W. Eleven Mile Rd Ste 208 Southfield, MI 48076 |
David M. Tisdale & Company | $ | 3,835 | 4/30/2010 | none | |||||
AMC North Port, Inc.
4301 Aiden Lane North Port, FL 34286 |
North Port Gateway, LLC | $ | 6,129 | 8/5/2017 | Two 5 year Options | |||||
AMC Riverview, Inc.
10605 Big Bend Road Riverview, FL 33569 |
Shoppes of Southbay, LLC | $ | 9,600 | 8/27/2017 | Two 5 year Options | |||||
Berkley Burgers, Inc.
2972 Coolidge Ave. Berkley, MI 48072 |
TM Apple, LLC (affiliate) | $ | 6,306 | 1/13/2023 | Three 5 year Options | |||||
AMC Grand Blanc, Inc.
8251 Trillium Circle #102 Grand Blanc, MI 48439 |
Trillium Circle, LLC | $ | 10,282 | 3/16/2018 | Two 5 year Options | |||||
AMC Troy, Inc.
1873 East Big Beaver Rd. Troy, MI 48083 |
Troy Sports Center, LLC | $ | 13,750 | 9/1/2018 | Two 5 year Options | |||||
AMC Petoskey, Inc.
2180 Anderson Rd. #150 Petoskey, MI 49770 |
Terra Management Company | $ | 9,042 | 8/9/2018 | Two 5 year Options | |||||
Ann Arbor Burgers, Inc.
859 W. Eisenhower Parkway Ann Arbor, MI 48103 |
8600 Associates Limited Partnership | $ | 6,899 | 6/28/2018 | Two 5 year Options | |||||
AMC Flint, Inc.
3192 S. Linden Road Flint, MI 48507 |
Ramco Gershenson Properties Trust | $ | 4,800 | 12/21/2018 | Three 5 year Options | |||||
AMC Port Huron, Inc.
4355 24th Avenue, Suite 1 Port Huron, MI 48059 |
Port Builders, Inc. et al | $ | 6,500 | 6/1/2019 | Three 5 year Options | |||||
Berkley Burgers, Inc. is the only subsidiary renting from an affiliate. (See Certain
Relationships and Related Transactions and Director Independence)
The Company currently has no policy with respect to investments or interests in real estate
mortgages, securities or interests in persons primarily engaged in real estate activities.
16
Table of Contents
ITEM 3. LEGAL PROCEEDINGS
Occasionally, we are a defendant in litigation arising in the ordinary course of our business,
including claims arising from personal injuries, contract claims, dram shop claims, employment
related claims and claims from guests or employees alleging injury, illness or other food quality,
health or operational concerns. To date, none of these types of litigation, most of which are
typically covered by insurance, has had a material effect on us. We have insured and continue to
insure against most of these types of claims. A judgment on any claim not covered by or in excess
of our insurance coverage could adversely affect our financial condition or results of operations.
ITEM 4. SUBMISSION OF MATTERS TO A VOTE OF SECURITY HOLDERS
None.
PART II
ITEM 5. MARKET FOR REGISTRANT’S COMMON EQUITY, RELATED STOCKHOLDER MATTERS AND ISSUER
PURCHASES OF EQUITY SECURITIES |
||
Market Information. The Company’s common stock is traded on the OTC Bulletin Board under the symbol
DFRH; however, trading in our stock is very limited, and there are no assurances that this trading
market will expand or even continue. Our stock was granted a trading symbol on October 6, 2008 and
during the quarter ending December 27, 2009, the range of bid prices was $4.00 to $5.40. These bid
prices reflect inter-dealer prices, without retail mark
ups or mark downs or commissions and may not represent actual transactions. The Company’s transfer
agent is Fidelity Transfer Company, 8915 S. 700 E, Suite 102, Sandy, Utah 84070.
Holders. As of March 26, 2010, there were approximately 123 record holders of 18,876,000 shares of
the Company’s common stock.
Dividend Policy. We have not declared or paid any cash dividends on our common stock and we do not
intend to declare or pay any cash dividend in the foreseeable future. The payment of dividends, if
any, is within the discretion of our Board of Directors and will depend on our earnings, if any,
our capital requirements and financial condition and such other factors as our Board of Directors
may consider.
Securities Authorized for Issuance Under Equity Compensation. We have not authorized the issuance
of any of our securities in connection with any form of equity compensation plan.
Recent Sales of Unregistered Securities. During the fourth quarter of 2009, the twelve warrant
holders listed below exercised warrants to purchase the Company’s common stock. The warrants were
originally granted in connection with a private placement made by the Company in November 2006
prior to registration. These sales were similarly made pursuant to a private placement exemption
from registration. Each of the warrants was exercised at the exercise price of $1.00 per share of
our common stock for the consideration and on the date listed below:
| Shares of Common | ||||||||
| Investor | Date of Purchase | Stock Acquired | Consideration Paid | |||||
Eric Samuelson
|
November 30, 2009 | 150,000 | Surrender and forgiveness of $150,000 note granted to Mr. Samuelson by the Company in exchange for loan from Mr. Samuleson to the Company of $142,500 | |||||
David Ligotti
|
November 30, 2009 | 100,000 | Surrender and forgiveness of $100,000 note granted to Mr. Ligotti by the Company in exchange for loan from Mr. Ligotti to the Company of $95,000 | |||||
17
Table of Contents
| Shares of Common | ||||||||
| Investor | Date of Purchase | Stock Acquired | Consideration Paid | |||||
Gregory Stevens
|
November 30, 2009 | 100,000 | Surrender and forgiveness of $100,000 note granted to Mr. Stevens by the Company in exchange for loan from Mr. Stevens to the Company of $95,000 | |||||
John Bowling
|
December 30, 2009 | 100,000 | $100,000 cash | |||||
John R. Burke
|
November 27, 2009 and December 30, 2009 (50,000 ea) | 100,000 | $100,000 cash | |||||
Bruce Stewart
|
November 24, 2009 | 50,000 | $50,000 cash | |||||
Norma Stewart
|
November 24, 2009 | 50,000 | $50,000 cash | |||||
Edie Dopking
|
December 8, 2009 | 50,000 | $50,000 cash | |||||
Kenneth Bush
|
December 30, 2009 | 25,000 | $25,000 cash | |||||
John Eric Bush
|
December 30, 2009 | 25,000 | $25,000 cash | |||||
Steve Waddle
|
December 30, 2009 | 25,000 | $25,000 cash | |||||
Larry Timmons
|
December 30, 2009 | 25,000 | $25,000 cash | |||||
On July 30, 2007, each member of the Board of Directors was granted 30,000 stock options that vest
ratably over three years and expire after six years. The option price is $2.50 per share. As of
March 26, 2010, Directors with 20,000 vested and unexercised options include T. Michael Ansley,
Gregory Stevens, David G. Burke and David Ligotti. Director Jay Alan Dusenberry exercised his
option to purchase 6,000 shares of our common stock at $2.50 per share on October 12, 2009 pursuant
to a private placement exemption. Mr. Dusenberry has 14,000 vested and unexercised options as of
March 26, 2010.
ITEM 6. SELECTED FINANCIAL DATA
Not Applicable.
ITEM 7. MANAGEMENT’S DISCUSSION AND ANALYSIS OF FINANCIAL CONDITION AND RESULTS OF OPERATION
Management’s Discussion and Analysis of Financial Condition and Results of Operation included at
pages F-1 through F-9 of this Annual Report is incorporated herein by reference.
ITEM 7A. QUANTITATIVE AND QUALITATIVE DISCLOSURES ABOUT MARKET RISK
Not Applicable.
ITEM 8. CONSOLIDATED FINANCIAL STATEMENTS AND SUPPLEMENTARY DATA
The Consolidated Financial Statements, Notes to Consolidated Financial Statements and the Reports
of Independent Registered Accounting Firm included at pages F-10 through F-32 of this Annual Report
are incorporated herein by reference.
18
Table of Contents
ITEM 9. CHANGES IN AND DISAGREEMENTS WITH ACCOUNTANTS ON ACCOUNTING AND FINANCIAL DISCLOSURE
The Audit Committee of the Board of Directors of Diversified Restaurant Holdings, Inc. annually
considers and recommends to the Board the selection of independent public accountants. On April 21,
2009 after an evaluation process as recommended by DRH’s Audit Committee, the Board of Directors
appointed Silberstein Ungar, PLLC (“SU”, formerly known as Maddox Ungar Silberstein, PLLC) as DRH’s
independent auditors for the 2009 fiscal year, replacing Rehmann Robson, PC (“Rehmann”).
This action effectively dismissed Rehmann as the Company’s independent auditor for the fiscal year
that commenced on January 1, 2009. The report of Rehmann on the Company’s consolidated financial
statements for the year ended December 31, 2008 did not contain an adverse opinion or a disclaimer
of opinion and was not qualified or modified as to uncertainty, audit scope, or accounting
principles.
For the year December 31, 2008, there were no disagreements with Rehmann on any matter of
accounting principles or practices, financial statement disclosure or auditing scope or procedure,
which disagreements if not resolved to Rehmann’s satisfaction would have caused them to make
reference to the subject matter of the disagreement in connection with their reports
For the years ended December 31, 2008 and prior, neither the Company nor anyone on the Company’s
behalf consulted SU with respect to the application of accounting principles to a specified
transaction, either completed or proposed, or the type of audit opinion that might be rendered on
the Company’s Consolidated Financial Statements, or any other matters or reportable events as
defined in Item 304(a)(2)(i) and (ii) of Regulation S-K.
ITEM 9A(T). CONTROLS AND PROCEDURES
As of December 27, 2009, an evaluation was performed under the supervision of and with the
participation of our management, including our principal executive and principal financial
officers, of the effectiveness of the design and operation of our disclosure controls and
procedures. Based on that evaluation, our management, including our Principal executive and
principal financial officers, concluded that our disclosure controls and procedures were effective
as of December 27, 2009.
There have been no significant changes in our internal controls over financial reporting during the
quarter ended December 27, 2009, that have materially affected, or are reasonably likely to
materially affect, our internal control over financial reporting.
Our management is responsible for establishing and maintaining adequate internal control over
financial reporting, as such term is defined in Exchange Act Rules 13a-15(f). There are inherent
limitations in the effectiveness of any
system of internal control. Accordingly, even an effective system of internal control can provide
only reasonable assurance with respect to financial statement preparation.
Under the supervision and with the participation of our management, including our principal
executive and principal financial officers, we conducted an evaluation of the effectiveness of our
internal control over financial reporting as of December 27, 2009. This evaluation was based on
criteria for effective internal control over financial reporting described in Internal Control -
Integrated Framework issued by the Committee of Sponsoring Organizations of the Treadway
Commission. Based on our evaluation under the framework in Internal Control — Integrated
Framework, our management concluded that our internal control over financial reporting was
effective as of December 27, 2009. Refer to page F-12 for management’s report.
This Annual Report does not include an attestation report of the company’s registered public
accounting firm regarding internal control over financial reporting. Management’s report was not
subject to attestation by the company’s registered public accounting firm pursuant to temporary
rules of the Securities and Exchange Commission that permit the company to provide only
management’s report in this Annual Report.
19
Table of Contents
Changes in Internal Control Over Financial Reporting
There were no changes in the Company’s internal control over financial reporting during the quarter
ended December 27, 2009 that have materially affected, or are reasonably likely to materially
affect the Company’s internal control over financial reporting.
ITEM 9B. OTHER INFORMATION
None.
PART III
ITEM 10. DIRECTORS, EXECUTIVE OFFICERS AND CORPORATE GOVERNANCE
The information presented under the captions “Election of Directors,” “Executive Officers,”
“Section 16(a) Beneficial Ownership Reporting Compliance” and “Corporate Governance — Code of
Ethics” in the definitive Proxy Statement of the Company for our June 3, 2010 Annual Meeting of
Shareholders (the “Proxy Statement”), a copy of which will be filed with the Securities and
Exchange Commission on or before April 26, 2010, is incorporated herein by reference.
ITEM 11. EXECUTIVE COMPENSATION
The information presented under the captions “Executive Compensation,” “Corporate Governance -
Compensation Committee Interlocks and Insider Participation” and “Compensation Committee Report” in
the Proxy Statement is incorporated herein by reference.
ITEM 12. SECURITY OWNERSHIP OF CERTAIN BENEFICIAL OWNERS AND MANAGEMENT AND RELATED STOCKHOLDER
MATTERS
The information presented under the caption “Stock Ownership of Certain Beneficial Owners and
Management” in the Proxy Statement is incorporated herein by reference.
ITEM 13. CERTAIN RELATIONSHIPS AND RELATED TRANSACTIONS, AND DIRECTOR INDEPENDENCE
The information presented under the captions “Transactions with Related Persons” and “Corporate
Governance — Director Independence” in the Proxy Statement is incorporated herein by reference.
ITEM 14. PRINCIPAL ACCOUNTANT FEES AND SERVICES
The information presented under the caption “Principal Accountant Fees and Services” in the
Proxy Statement is incorporated herein by reference.
20
Table of Contents
PART IV
ITEM 15. EXHIBITS AND FINANCIAL STATEMENT SCHEDULES
(a) (1) Financial Statements. The following financial statements and report of independent
registered public accounting firms of Diversified Restaurant Holdings and its subsidiaries are
filed as part of this report:
Report of Independent Registered Public Accounting Firm dated March 25, 2010 — Silberstein
Ungar, PLLC |
|||
Report of Independent
Registered Public Accounting Firm dated March 30, 2009 — Rehmann
Robson, P.C. |
|||
Consolidated Balance Sheets — December 27, 2009 and December 31, 2008 |
|||
Consolidated Statements of Operations |
|||
Consolidated Statement of Stockholders’ Equity |
|||
Consolidated Statements of Cash Flows |
|||
Notes to Consolidated Financial Statements |
|||
The consolidated financial statements, the notes to the consolidated financial statements,
and the reports of independent registered public accounting firm listed above are
incorporated by reference in Item 8 of this report. |
|||
| (2) | Financial Statement Schedules |
||
Not applicable |
(b) Exhibits:
Index to Exhibits
| EXHIBIT NO. | EXHIBIT DESCRIPTION | |||
| 3.1 | Certificate of Incorporation is incorporated by reference to
our registration statement on Form SB-2 (SEC File Number
333-145316), as filed with the Securities and Exchange
Commission on August 10, 2007. |
|||
| 3.2 | Amended and Restated Certificate of Incorporation is
incorporated by reference to our registration statement on
Form SB-2 (SEC File Number 333-145316), as filed with the
Securities and Exchange Commission on August 10, 2007. |
|||
| 3.3 | By-laws are incorporated by reference to our registration
statement on Form SB-2 (SEC File Number 333-145316), as filed
with the Securities and Exchange Commission on August 10,
2007. |
|||
| 4.0 | Stock Certificate is incorporated by reference to our
registration statement on Form SB-2 (SEC File Number
333-145316), as filed with the Securities and Exchange
Commission on August 10, 2007. |
|||
| 10.1 | Buffalo Wild Wings Retail Center Lease dated December 7, 2009
between our subsidiary, AMC Marquette, Inc., and Centrup
Hospitality, LLC is incorporated by reference to exhibit 10 of
our Form 8-K filed December 11, 2009. |
|||
21
Table of Contents
| EXHIBIT NO. | EXHIBIT DESCRIPTION | |||
| 10.2 | Buffalo Wild Wings Retail Center Lease dated December 2, 2009
between our subsidiary, AMC Chesterfield, Inc., and
Chesterfield Development Company, LLC is incorporated by
reference to exhibit 10 for our Form 8-K filed December 7,
2009. |
|||
| 10.3 | Buffalo Wild Wings Franchise Agreement dated October 20, 2009
between our subsidiary, AMC Marquette, Inc., and Buffalo Wild
Wings International, Inc. is incorporated by reference to
exhibit 10.1 of our Form 8-K filed October 26, 2009. |
|||
| 10.4 | Buffalo Wild Wings Franchise Agreement dated October 20, 2009
between our subsidiary, AMC Chesterfield, Inc., and Buffalo
Wild Wings International, Inc. is incorporated by reference to
exhibit 10.2 of our Form 8-K filed October 26, 2009. |
|||
| 10.5 | Master Lease Agreement dated September 9, 2009 between our
subsidiary, Troy Burgers, Inc., and Novi Town Center
Investors, LLC is incorporated by reference to exhibit 10 of
our Form 8-K filed September 10, 2009. |
|||
| 10.6 | Master Lease Agreement dated February 12, 2009 between our
subsidiary, AMC Flint, Inc., and CoActiv Capital Partners,
Inc. is incorporated by reference to exhibit 10 of our Form
8-K filed February 17, 2009. |
|||
| 10.7 | Buffalo Wild Wings Amendment to Area Development Agreement
dated December 10, 2008 between our subsidiary, AMC Wings,
Inc., and Buffalo Wild Wings International, Inc. is
incorporated by reference to exhibit 10.1 of our Form 8-K
filed December 15, 2008. |
|||
| 10.8 | Loan and Security Agreement dated June 12, 2008 between our
subsidiary, AMC Troy, Inc., and Charter One Bank is
incorporated by reference to exhibit 10.1 of our Form 8-K
filed July 29, 2008. |
|||
| 10.9 | Term Note dated June 12, 2008 between our subsidiary, AMC
Troy, Inc., and Charter One Bank is incorporated by reference
to exhibit 10.2 of our Form 8-K filed July 29, 2008. |
|||
| 10.10 | Loan and Security Agreement dated June 25, 2008 between our
subsidiary, AMC Petoskey, Inc., and Charter One Bank is
incorporated by reference to exhibit 10.1 of our Form 8-K
filed July 29, 2008. |
|||
| 10.11 | Term Note dated June 25, 2008 between our subsidiary, AMC
Petoskey, Inc., and Charter One Bank is incorporated by
reference to exhibit 10.2 of our Form 8-K filed July 29, 2008. |
|||
| 10.12 | Buffalo Wild Wings Franchise Agreement dated July 1, 2008
between our subsidiary, AMC Port Huron, Inc., and Buffalo Wild
Wings International, Inc. is incorporated by reference to
exhibit 10 of our form 8-K filed July 8, 2008. |
|||
| 10.13 | Buffalo Wild Wings Franchise Agreement dated July 1, 2008
between our subsidiary, AMC Flint, Inc., and Buffalo Wild
Wings International, Inc. is incorporated by reference to
exhibit 10 of our form 8-K filed July 8, 2008. |
|||
| 10.14 | Commercial Security Agreement dated June 20, 2008 between our
subsidiary, Ann Arbor Burger, Inc., and Home City Federal Bank
of Springfield is incorporated by reference to exhibit 10.1 of
our form 8-K filed July 7, 2008. |
|||
| 10.15 | Promissory Note dated June 20, 2008 between our subsidiary,
Ann Arbor Burger, Inc., and Home City Federal Bank of
Springfield is incorporated by reference to exhibit 10.2 of
our form 8-K filed July 7, 2008. |
|||
| 10.16 | Line of Credit Agreement dated June 30, 2008 between our
subsidiary, Ann Arbor Burger, Inc., and Home City Federal Bank
of Springfield is incorporated by reference to exhibit 10.3 of
our form 8-K filed July 7, 2008. |
|||
22
Table of Contents
| EXHIBIT NO. | EXHIBIT DESCRIPTION | |||
| 10.17 | Retail Center Lease dated June 30, 2008 between our
subsidiary, AMC Port Huron, Inc., and Port Builders, Inc.,
Walter Sparling and Mary L. Sparling is incorporated by
reference to exhibit 10 of our form 8-K filed July 7, 2008. |
|||
| 10.18 | Retail Center Lease dated June 30, 2008 between our
subsidiary, AMC Flint, Inc., and Ramco-Gershenson Properties,
L.P. is incorporated by reference to exhibit 10 of our form
8-K filed July 7, 2008. |
|||
| 10.19 | Loan and Security Agreement dated June 25, 2008 between our
subsidiary, AMC Petoskey, Inc., and Charter One Bank is
incorporated by reference to exhibit 10.1 of our form 8-K
filed June 30, 2008. |
|||
| 10.20 | Term Note dated June 25, 2008 between our subsidiary, AMC
Petoskey, Inc., and Charter One Bank is incorporated by
reference to exhibit 10.2 of our form 8-K filed June 30, 2008. |
|||
| 10.21 | Loan and Security Agreement dated June 12, 2008 between our
subsidiary, AMC Troy, Inc., and Charter One Bank is
incorporated by reference to exhibit 10.1 of our form 8-K
filed June 18, 2008. |
|||
| 10.22 | Term Note dated June 12, 2008 between our subsidiary, AMC
Troy, Inc., and Charter One Bank is incorporated by reference
to exhibit 10.2 of our form 8-K filed June 18, 2008. |
|||
| 10.23 | Form of Offering Escrow Agreement dated November 1, 2007
between our Company and RBS Citizens, N.A. is incorporated by
reference to exhibit 10.1 of our form SB-2/A filed October 23,
2007. |
|||
| 10.24 | Form of Stock Option Agreement, dated July 30, 2007, entered
into by and between the Company and Directors Gregory Stevens,
T. Michael Ansley, Jay Alan Dusenberry, Jason T. Curtis and
David Ligotti |
|||
| 14 | Code of Ethics is incorporated by reference to our Form 10-K
for the fiscal year ended December 31, 2008, as filed with the
Securities and Exchange Commission on March 31, 2009 |
|||
| 31.1 | Certification of the Company’s Principal Executive Officer
pursuant to Section 302 of the Sarbanes-Oxley Act of 2002,
with respect to the registrant’s Annual Report on Form 10-K
for the year ended December 27, 2009. |
|||
| 31.2 | Certification of the Company’s Principal Financial Officer
pursuant to Section 302 of the Sarbanes-Oxley Act of 2002,
with respect to the registrant’s Annual Report on Form 10-K
for the year ended December 27, 2009. |
|||
| 32.1 | Certification of the Company’s Principal Executive Officer
pursuant to 18 U.S.C. Section 1350, as adopted pursuant to
Section 906 of the Sarbanes Oxley Act of 2002. |
|||
| 32.2 | Certification of the Company’s Principal Financial Officer
pursuant to 18 U.S.C. Section 1350, as adopted pursuant to
Section 906 of the Sarbanes Oxley Act of 2002. |
|||
23
Table of Contents
Pursuant to the requirements of Section 13 or 15(d) of the Securities Exchange Act of 1934, the
registrant has duly caused this report to be signed on its behalf by the undersigned, thereunto
duly authorized.
Dated: March 26, 2009
| DIVERSIFIED RESTAURANT HOLDINGS, INC. | ||||
| By: | /s/ T. Michael Ansley | |||
| T. Michael Ansley | ||||
| President, Chief Executive Officer, Director and Chairman of the Board |
||||
In accordance with the Securities Exchange Act of 1934, this report has been signed below by the
following persons on behalf of the registrant and in the capacities and on the dates indicated.
| Signatures | ||
/s/ T. Michael Ansley
|
Dated: March 26, 2010 | |
President, Chief Executive Officer, Director and
Chairman of the Board |
||
/s/ David G. Burke
|
Dated: March 26, 2010 | |
Treasurer, Chief Financial Officer, Director |
||
/s/ Jason T. Curtis
|
Dated: March 26, 2010 | |
Chief Operating Officer |
||
/s/ Jay Alan Dusenberry
|
Dated: March 26, 2010 | |
Secretary, Director |
||
/s/ David Ligotti
|
Dated: March 26, 2010 | |
Director |
||
/s/ Gregory J. Stevens
|
Dated: March 26, 2010 | |
Director |
24
Table of Contents
DIVERSIFIED RESTAURANT HOLDINGS, INC.
FINANCIAL INFORMATION
December 27, 2009 and December 31, 2008
December 27, 2009 and December 31, 2008
Table of Contents
CONTENTS
| F-1 | ||||
| F-10 | ||||
| F-11 | ||||
| F-12 | ||||
CONSOLIDATED FINANCIAL STATEMENTS |
||||
| F-13 | ||||
| F-14 | ||||
| F-15 | ||||
| F-16 | ||||
| F-17 | ||||
Table of Contents
MANAGEMENT’S DISCUSSION AND ANALYSIS OF FINANCIAL CONDITION AND RESULTS OF OPERATION
The following discussion and analysis of our financial condition and results of operations
should be read in conjunction with our consolidated financial statements and related notes included
at pages F-13 through F-32 below.
Overview
The poor economic climate of 2009, including historical lows in consumer confidence and record
unemployment, put downward pressure on guests’ discretionary spending and impacted restaurant sales
industry wide. This macroeconomic environment presented some extreme challenges for us.
Nonetheless, during 2009, we significantly improved our year-to-year performance as our new stores
matured their operations and gained traction on the experience curve.
Despite the recession and the impact the decline in the automotive sector has had on the
Michigan economy, our Michigan BWW operations remained relatively strong with above average unit
level revenue compared with the entire Buffalo Wild Wings system.
We completed our first full year of operations with our two Bagger Dave’s restaurants in 2009
and have been extremely pleased with the Ann Arbor store, which has a prime location. The Berkeley
store is not well situated for a lunch crowd, but nonetheless has performed fairly well in this
economy with primarily a dinner crowd, albeit not to our original expectations. We opened a third
Bagger Dave’s® store in February 2010 in Novi Michigan. The Novi location has performed
exceptionally well during its initial month of operation, surpassing our expectations and realizing
average weekly sales of $30,200, more than double the average weekly sales of our Berkley location.
We consider the initial four weeks of operation to be a “honeymoon” period and expect that sales
will slow somewhat during the ensuing weeks and months.
With regard to both our BWW and Bagger Dave’s restaurants, we have not built up a
representative store base that allows for comparable store sales that provides meaningful
comparisons because we have been growing rapidly and our restaurants are still relatively new. As
a result, we tend to focus on the trend in average weekly sales and especially on operating
margins. We consider a restaurant’s results to become comparable to its prior period after its
initial 16 months of operation. This provides for the “honeymoon” period, or the initial surge of
business associated with a new opening. We had only two restaurants of the nine we owned in 2009
that are comparable. The nine restaurants that we managed all have comparable sales status that
however, will not be reflected in our financials until fiscal 2010 since they were acquired on
February 1, 2010.
Despite these positive developments, the impact of the recession on our stores restricted our
ability to achieve the expected margin levels of our business model. Specifically, our two Florida
BWW restaurants are not yet fully performing to our expectations. The cost of maintaining our
Florida operations is generally higher than our costs for equivalent operations in Michigan,
primarily due to higher labor and insurance costs. We were successful this year in negotiating
rent reductions in both Florida locations, thereby improving their cost structure. Our Florida
locations were affected by the collapse in the Florida residential real estate market and the
subsequent impact on the Florida economy. During the expansion cycle in Florida real estate, the
more attractive Tampa locations were difficult to penetrate with cost-effective building sites, and
therefore, we elected at that time to establish stores in outer suburban areas that were planned
for growth. However, much of that anticipated growth has yet to materialize leaving our locations
with a customer base that is smaller than we anticipated.
We also have somewhat of a competitive disadvantage in Florida due to lower brand recognition
as Buffalo Wild Wings is relatively new to that market. Buffalo Wild Wings faces numerous
competitors in Florida that include Tampa-based Beef O’Brady’s and Clearwater-founded Hooter’s.
Other competitors include Ker’s Wing House, Ale House, and several other local sports bar concepts
that offer Buffalo, New York style chicken wings. Due to Buffalo Wild Wings® rapid expansion and
brand building national advertising efforts, we believe that our marketing disadvantage is
beginning to diminish.
We view our Florida territory as viable and a significant growth opportunity. However, future
development will be focused on young professional and college oriented areas of Tampa and St.
Petersburg utilizing a much smaller footprint for new restaurants. We hope to take advantage of
the declining commercial real estate market to capture new locations at more favorable lease terms
to us than would normally be available and capitalize on the growing awareness of Buffalo Wild
Wings® nationally.
F-1
Table of Contents
Results of Operation
Operating results for fiscal years 2009, 2008, and 2007 are expressed in dollars and as a
percentage of revenue in the following table.
| December 27 | December 31 | December 31 | ||||||||||||||||||||||
| 2009 | % | 2008 | % | 2007 | % | |||||||||||||||||||
Revenue |
||||||||||||||||||||||||
Food and beverage sales |
$ | 17,317,996 | 91 | % | $ | 9,783,391 | 84 | % | $ | 1,680,334 | 49 | % | ||||||||||||
Management and advertising fees |
1,744,505 | 9 | % | 1,803,173 | 16 | % | 1,726,834 | 51 | % | |||||||||||||||
Total revenue |
19,062,501 | 100 | % | 11,586,564 | 100 | % | 3,407,168 | 100 | % | |||||||||||||||
Operating expenses |
||||||||||||||||||||||||
Compensation costs |
5,724,053 | 30 | % | 4,007,685 | 35 | % | 1,356,632 | 40 | % | |||||||||||||||
Food and beverage costs |
5,325,825 | 28 | % | 2,930,445 | 25 | % | 481,651 | 14 | % | |||||||||||||||
General and administrative |
4,693,219 | 25 | % | 3,319,582 | 29 | % | 1,545,105 | 45 | % | |||||||||||||||
Occupancy |
1,132,364 | 6 | % | 740,745 | 6 | % | 139,590 | 4 | % | |||||||||||||||
Depreciation and amortization |
1,203,337 | 6 | % | 877,206 | 8 | % | 112,643 | 3 | % | |||||||||||||||
Total operating expenses |
18,078,798 | 95 | % | 11,875,663 | 102 | % | 3,635,621 | 107 | % | |||||||||||||||
Income from operations |
983,703 | 5 | % | (289,099 | ) | -2 | % | (228,453) | -7 | % | ||||||||||||||
Interest expense |
445,820 | 2 | % | 289,681 | 3 | % | 64,722 | 2 | % | |||||||||||||||
Other (income)/expense, net |
(80,706 | ) | 0 | % | 264,982 | 2 | % | (16,932 | ) | 0 | % | |||||||||||||
Income (loss) before income taxes |
618,589 | 3 | % | (843,762 | ) | -7 | % | (276,243) | -8 | % | ||||||||||||||
Income tax benefit (provision) |
(252,064 | ) | -1 | % | 520,777 | 4 | % | 79,181 | 2 | % | ||||||||||||||
Net (loss) income |
$ | 366,525 | 2 | % | $ | (322,985 | ) | -3 | % | $ | (197,062 | ) | -6 | % | ||||||||||
Fiscal Year 2009 ended December 27, 2009 compared with Fiscal Year 2008 ended December 31,
2008
Revenue. The following table includes a comparison of the components of our revenue from
Fiscal 2009 and 2008.
| December 27 | December 31 | $ | % | |||||||||||||
| 2009 | 2008 | Change | Change | |||||||||||||
Revenue |
||||||||||||||||
Food and beverage sales |
$ | 17,317,996 | $ | 9,783,391 | $ | 7,534,605 | 77.0 | % | ||||||||
Management and advertising fees |
1,744,505 | 1,803,173 | (58,668 | ) | -3.3 | % | ||||||||||
Total revenue |
$ | 19,062,501 | $ | 11,586,564 | $ | 7,475,937 | 64.5 | % | ||||||||
Total revenue increased 64.5% as food and beverage sales growth of $7.5 million more than
offset the decline in management and advertising fees. Food and beverage sales growth was
primarily the result of having full year sales for four BWW and two Bagger Dave’s restaurants that
opened in 2008. We also opened one new BWW location in 2009.
The decline in management and advertising fees was the result of overall decline in sales from
the nine BWW restaurants that were under management in 2009.
F-2
Table of Contents
| % | % | |||||||||||||||||||||||
| December 27 | December 31 | $ | % | revenue | revenue | |||||||||||||||||||
| 2009 | 2008 | Change | Change | 2009 | 2008 | |||||||||||||||||||
Operating expenses |
||||||||||||||||||||||||
Compensation costs |
$ | 5,724,053 | $ | 4,007,685 | $ | 1,716,368 | 43 | % | 30 | % | 35 | % | ||||||||||||
Food and beverage costs |
5,325,825 | 2,930,445 | 2,395,380 | 82 | % | 28 | % | 25 | % | |||||||||||||||
General and administrative |
4,693,219 | 3,319,582 | 1,373,637 | 41 | % | 25 | % | 29 | % | |||||||||||||||
Occupancy |
1,132,364 | 740,745 | 391,619 | 53 | % | 6 | % | 6 | % | |||||||||||||||
Depreciation and
amortization |
1,203,337 | 877,206 | 326,131 | 37 | % | 6 | % | 8 | % | |||||||||||||||
Total operating expenses |
$ | 18,078,798 | $ | 11,875,663 | $ | 6,203,135 | 52 | % | 95 | % | 102 | % | ||||||||||||
Compensation Costs. Compensation costs increased 42.8% in 2009 due to the full-year operation of 6
new restaurants. As a percentage of revenue, compensation costs improved to 30% in 2009 compared
with 35% in 2008 as efficiencies in the new restaurants were attained. Labor costs tend to improve
as new stores mature and the experience-level of staff expands.
Food and Beverage Costs. Food and beverage costs increased over 80% both as a result of
higher sales, but also due to higher chicken wing costs that offset declines in other food items.
As a percentage of revenue, food and beverage costs increased to 28% in 2009 compared with 25% in
2008. On average, chicken wings per pound were $1.69 in 2009 compared with $1.25 in 2008. Chicken
wings represent approximately 21% of total sales.
General and Administrative Costs. The $1.4 million increase in general and administrative
(G&A) expenses in 2009 reflected higher costs associated with a greater number of owned restaurants
for the full year such as royalty fees, advertising, services for multi-media equipment, as well as
higher legal fees and investor relations costs. These increases were somewhat offset by tight cost
control efforts. G&A expenses, as a percentage of total revenue, decreased to 25% compared with
29%. This decrease was primarily attributable to there being fewer new restaurant openings in 2009
and the associated costs related to an opening.
Occupancy Costs and Depreciation and Amortization. Higher occupancy costs reflect the new
stores opened during 2008 and operating for the full year 2009. As a percentage of revenue,
occupancy costs remained flat at 6%. Depreciation expense was higher due to increased property and
equipment values with the new stores, but was down 2% as a percentage of revenue as the new
restaurants grew sales.
Interest Expense and Other (Income)/Expense, net. Interest expense increased to $0.4 million
in 2009 from $0.3 million in 2008. This increase was primarily due to increased borrowings on
various credit facilities used to fund the new store openings in 2008. Other expense was down
mostly as a result of the impact of the mark to market valuation liability decreasing in 2009.
Income Taxes. Our effective tax rate for 2009 was 41%. In 2008, we recorded a tax benefit as
a result of the net operating loss. We expect that our tax rate in 2010 will be similar to that of
2009.
Year ended December 31, 2008 compared with the year ended December 31, 2007.
| December 27 | December 31 | $ | % | |||||||||||||
| 2009 | 2008 | Change | Change | |||||||||||||
Revenue |
||||||||||||||||
Food and beverage sales |
$ | 9,783,391 | $ | 1,680,334 | $ | 8,103,057 | 482.2 | % | ||||||||
Management and advertising fees |
1,803,173 | 1,726,834 | 76,339 | 4.4 | % | |||||||||||
Total revenue |
$ | 11,586,564 | $ | 3,407,168 | $ | 8,179,396 | 64.5 | % | ||||||||
F-3
Table of Contents
Revenue. Total revenue increased $8.2 million or 240%, during the fiscal year 2008 to
$11.6 million from $3.4 million for 2007. This improvement was a result of sales from six Company
owned restaurants that were opened during the year. Also, two Company-owned BWW restaurants that
were opened in August 2007 had full year contributions in 2008. Same store sales from the
affiliated restaurants, on which management fees are collected by Diversified Restaurant Holdings’
subsidiary, AMC Group, Inc., were down 0.6% in the year ended December 31, 2008 compared to the
same period in 2007.
| % | % | |||||||||||||||||||||||
| December 31 | December 31 | $ | % | revenue | revenue | |||||||||||||||||||
| 2008 | 2007 | Change | Change | 2008 | 2007 | |||||||||||||||||||
Operating expenses |
||||||||||||||||||||||||
Compensation costs |
4,007,685 | 1,356,632 | $ | 2,651,053 | 195.4 | % | 35 | % | 40 | % | ||||||||||||||
Food and beverage costs |
2,930,445 | 481,651 | $ | 2,448,794 | 508.4 | % | 25 | % | 14 | % | ||||||||||||||
General and administrative |
3,319,582 | 1,545,105 | $ | 1,774,477 | 114.8 | % | 29 | % | 45 | % | ||||||||||||||
Occupancy |
740,745 | 139,590 | $ | 601,155 | 430.7 | % | 6 | % | 4 | % | ||||||||||||||
Depreciation and
amortization |
877,206 | 112,643 | $ | 764,563 | 678.7 | % | 8 | % | 3 | % | ||||||||||||||
Total operating expenses |
$ | 11,875,663 | $ | 3,635,621 | $ | 8,240,042 | 226.6 | % | 102 | % | 107 | % | ||||||||||||
Food and Beverage Costs. Food and beverage costs increased to $2.9 million in 2008 from
$0.5 million in 2007. The increase in food and beverage costs reflected the additional six stores
opened during 2008. As a percentage of sales, food and beverage costs was 30% in 2008 versus 31%
in 2007. The 2008 decrease was largely due to favorable cost of chicken wings in 2008.
Compensation costs. Our payroll costs increased $2.7 million, or 195%, to $4.0 million from
$1.4 million for 2008 compared with 2007. The increase was due primarily to the additional payroll
from the aforementioned six new Company-owned restaurants opened in 2008. As a percentage of
sales, labor and benefit costs were 30% in 2008 compared with 39% in 2007.
General and Administrative Costs. General and administrative costs increased $1.8 million or
115%, to $3.3 million from $1.5 million for 2008 compared with 2007. This increase was due to the
additional expenses from the aforementioned new restaurants opened in 2008. As a percentage of
total operating expenses, G &A dropped to 28% in 2008 from 43% in 2007.
Occupancy Costs and Depreciation and Amortization. Occupancy expense increased 431% or $0.6
million from $0.1 million in 2007 to $0.7 million in 2008. Depreciation and amortization expense
increased 679% or $0.8 million from $0.1 million in 2007 to $0.9 million in 2008. The increase in
both of these cost categories is directly related to the opening of the five restaurants in 2008.
Interest Expense. Interest expense increased $0.2 million, or 348%, to $0.3 million for 2008
from $64,722 in 2007. The increase reflects the cost of the debt incurred to open eight
restaurants since August of 2007.
Other (Income) and Expense, net. Other expense increased $0.3 million to $0.3 million for
2008 from other income of $16,932 for 2007. The increase in other expenses was primarily due to
recognition of a $0.3 million mark to market on interest rate swap arrangement valuations, which
were entered into during 2008. There was also stock option expense recorded of $32,312 in 2008
compared with $13,671 in 2007.
Income Taxes. For the year ended December 31, 2008, there was an income tax benefit recorded
in the amount of $0.5 million compared with an income tax benefit of $79,181 recorded for 2007.
This increase in recorded tax benefit predominately reflected the recording of a deferred federal
tax benefit due to the net operating loss.
F-4
Table of Contents
Fiscal 2010 Outlook
The acquisition of our affiliate stores on February 1, 2010 allows us to fully capture the
economic benefits of those stores in 2010 and beyond. The following table depicts on a pro forma
basis how our financials would have been reported had we owned the stores in 2009.
| GAAP Reported | Pro Forma* | |||||||
| December 27 | December 27 | |||||||
| 2009 | 2009 | |||||||
Revenue |
||||||||
Management and advertising fees |
$ | 1,744,505 | $ | — | ||||
Food and beverage sales |
17,317,996 | 41,754,515 | ||||||
Total revenue |
19,062,501 | 41,754,515 | ||||||
Operating expenses |
||||||||
Compensation costs |
5,724,053 | 11,470,244 | ||||||
Food and beverage costs |
5,325,825 | 13,029,103 | ||||||
General and administrative |
4,693,219 | 9,892,359 | ||||||
Occupancy |
1,132,364 | 2,935,363 | ||||||
Depreciation and amortization |
1,203,337 | 2,363,748 | ||||||
Total operating expenses |
18,078,798 | 39,690,817 | ||||||
Income from operations |
983,703 | 2,063,698 | ||||||
Interest expense |
445,820 | 778,612 | ||||||
Other (income)/expense, net |
80,706 | (161,426 | ) | |||||
(Loss) income before income taxes |
618,589 | 1,446,512 | ||||||
Income tax benefit (provision) |
(252,064 | ) | (252,064 | ) | ||||
Net (loss) income |
$ | 366,525 | $ | 1,194,448 | ||||
| * | Pro Forma presentation represents financial results
as they would be presented
if they included the nine BWW restaurants acquired on February 1, 2010 utilizing
financial information through December 31, 2009 for the acquired restaurants. |
As a result of the acquisition, we expect that 2010 financial results will compare very
favorably with 2009 financial results.
On February 21, 2010, we opened our third Bagger Dave’s restaurant at, we believe, a very
prime end-cap location in a busy shopping and entertainment area of Novi, MI. We plan to open two
BWW restaurants during 2010. One is planned for Marquette, MI and is expected to open in June this
year. The other will open later in the year in Chesterfield Township, MI. If we are able to
secure sufficient funding and good locations, we may also open two additional restaurants in 2010,
one each of Bagger Dave’s and BWW.
Our capital expenditures for 2010, excluding the two undetermined new stores, are expected to
be in the range of $2.9 million to $3.2 million of which approximately $2.5 million to $2.8 million
will be used to fund new stores and the remainder is planned for restaurant upgrades and
maintenance. We expect to remodel 2 stores in 2010.
Historically our average investment in a new BWW restaurant, net of opening expenses has been
in the range of $1 million to $1.3 million. Our average investment to open a new Bagger Dave’s,
which has a smaller footprint than a BWW store, has been approximately $0.75 million to $0.9
million.
F-5
Table of Contents
Liquidity and Capital Resources
General
One of our corporate objectives is to maintain a solid balance sheet and the financial
strength to achieve our growth initiatives, enhance our competitiveness, and build market awareness
of our restaurants while allowing for a prudent level of financial flexibility to manage the risks
and uncertainties inherent in our business.
The following table presents a summary of our net cash provided by (used in) operating,
investing and financing activities:
| Fiscal Year | ||||||||||||
| December 27 | December 31 | December 31 | ||||||||||
| 2009 | 2008 | 2007 | ||||||||||
Net cash provided by operating activities |
$ | 1,750,613 | $ | 494,609 | $ | 75,859 | ||||||
Net cash used in investing activities |
(388,454 | ) | (5,361,403 | ) | (3,414,157 | ) | ||||||
Net cash (used) provided by financing activities |
(855,506 | ) | 4,724,931 | 2,543,951 | ||||||||
Net (decrease) increase in cash and cash equivalents |
$ | 515,653 | $ | 141,863 | $ | (794,347 | ) | |||||
Cash flows generated from operating activities provide us with a significant source of
liquidity, which we use to expand the number of restaurants we operate and maintain and upgrade our
existing restaurants. Net cash provided by operating activities in 2009 was $1.7 million compared
with $0.5 million in 2008. The increase primarily was the result of the greater number of
restaurants operating in 2009 resulting in improved profitability.
The following table provides a summary of our key liquidity measures.
| Fiscal Year | ||||||||||||
| December 27 | December 31 | December 31 | ||||||||||
| 2009 | 2008 | 2007 | ||||||||||
Cash and investments |
$ | 649,518 | $ | 133,865 | $ | 275,728 | ||||||
Net working capital |
(887,013 | ) | (1,727,700 | ) | (75,865 | ) | ||||||
Current Ratio |
.57:1.0 | .30:1.0 | .86:1.0 | |||||||||
In general, we are a strong cash generating business and are comfortable with the degree of
leverage that we use to operate and grow the business. We do not have significant receivables or
inventory. We are able to operate with a working capital deficit because:
| • | restaurant operations are primarily conducted on a cash basis; |
||
| • | rapid turnover results in a limited investment in inventories; and |
||
| • | cash from sales is usually received before liabilities for food, supplies and
payroll become due. |
We believe cash generated from operations and availability of credit (traditional or
sale-leaseback) will provide sufficient cash availability to cover our anticipated working capital
needs. We consider all available financing options to ensure we have sufficient liquidity and
financial flexibility to fund our growth.
Debt Outstanding.
At December 27, 2009, we had $4.6 million in long-term debt, net of the current portion due,
down from $5.0 million at the end of 2008. We did not have an available line of credit for our
operations at year-end as we manage our working capital requirements with cash from operations.
The total debt represents the term loans for each restaurant when established. Further details
regarding the loans and payment requirements can be found at Note 5 to the consolidated financial
statements.
F-6
Table of Contents
Off Balance Sheet Arrangements
We have an off balance sheet arrangement between TMA Enterprises of Novi, Inc., a Buffalo Wild
Wings unit that was managed in 2009 by AMC Group, Inc., one of our wholly owned subsidiaries. On
April 5, 2007, TMA Enterprises of Novi, Inc. entered into a loan for $719,950. That loan was used
to refinance the existing debt of $369,950 and it provided an additional $350,000 to help finance a
five-year remodel of that restaurant. The principal outstanding at December 27, 2009 was $503,407.
AMC Group, Inc. is a guarantor of this debt.
There is also an off balance sheet arrangement that exists between TMA Enterprises of
Ferndale, LLC, a Buffalo Wild Wings unit managed by AMC Group, Inc. in 2009, and DRH and four of
its wholly-owned subsidiaries. On August 10, 2007, TMA Enterprises of Ferndale, LLC entered into a
loan for $720,404. That loan was used to refinance the existing debt of $704,419 and it provided
$15,985 additional cash for operations. The outstanding principal as of December 27, 2009 was
$520,968. DRH and its wholly-owned subsidiaries, AMC Burgers, Inc., AMC Wings, Inc., AMC Grand
Blanc Inc. and AMC Petoskey, Inc. are guarantors of this debt.
An off balance sheet arrangement exists between Flyer Enterprises, Inc., a Buffalo Wild Wings
unit managed by AMC Group, Inc. and DRH and five of its wholly-owned subsidiaries. On February 12,
2008, Flyer Enterprises, Inc. entered into a loan for $223,622. The loan was used to refinance
existing debt. The principal outstanding at December 27, 2009 was $156,375. DRH and its
subsidiaries, AMC Group, Inc., AMC Wings, Inc., AMC Grand Blanc Inc., AMC Troy, Inc. and AMC
Petoskey, Inc. are guarantors of this debt.
An off balance sheet arrangement was created in March 2009 between Anker, Inc., Bearcat
Enterprises, Inc., MCA Enterprises, Inc., Buckeye Group, LLC, Buckeye Group II, LLC (all Buffalo
Wild Wings units managed by AMC Group, Inc. in 2009, and owned by DRH effective February 1, 2010)
and Ansley Group, LLC (related party landlord of an affiliated restaurant) and AMC Group, Inc. a
wholly owned subsidiary of DRH. On March 27, 2009, the Company agreed to its subsidiary, AMC
Group, Inc., becoming a guarantor for the related parties mentioned above in exchange for covenant
waivers for AMC North Port, Inc. and AMC Riverview, Inc. (wholly-owned subsidiaries). The
approximate aggregate principal outstanding for the six entities was $2,546,322 as of December 27,
2009.
Contractual Obligations and Commitments
The following table summarized the amount of payments due under specified contractual
obligations as of December 27, 2009.
| Payments Due by Period | ||||||||||||||||||||
| Less than 1 | 1-3 | 3-5 | More than 5 | |||||||||||||||||
| (in thousands) | Total | year | years | years | years | |||||||||||||||
Long-term debt obligations |
$ | 5,298 | $ | 1,307 | $ | 1,956 | $ | 1,789 | $ | 246 | ||||||||||
Capital lease obligations |
822 | 260 | 518 | 43 | — | |||||||||||||||
Operating lease obligations |
9,274 | 925 | 1,950 | 2,121 | 4,278 | |||||||||||||||
Total contractual obligations |
$ | 15,394 | $ | 2,492 | $ | 4,424 | $ | 3,953 | $ | 4,524 | ||||||||||
The Company has no material minimum purchase commitments with its vendors that extend
beyond a year. See Notes 5, 8 and 9 to the Consolidated Financial Statements for details of
contractual obligations.
Area Development Agreement
The Company was assigned from a related entity an “Area Development Agreement” with Buffalo
Wild Wings to open 23 Buffalo Wild Wings restaurants by October 1, 2016 within the designated
“development territory”, as defined by the agreement. Failure to develop restaurants in accordance
with the schedule detailed in the agreement could lead to potential penalties of $50,000 for each
undeveloped restaurant and loss of rights to development territory.
F-7
Table of Contents
On December 10, 2008, Diversified Restaurant Holdings, Inc., through its wholly owned
subsidiary, AMC Wings, Inc., entered into an amendment to its Area Development Agreement (the
“Amended Agreement”) with Buffalo Wild Wings International, Inc. The Amended Agreement expanded
our exclusive franchise territory in Michigan and extended by one year the time frame for
completion of our obligations under the initial terms of the Area Development Agreement.
The Amended Agreement includes the right to develop an additional nine (9) Buffalo Wild Wings
Restaurants, which increases to thirty-two (32) the total number of Buffalo Wild Wings Restaurants
we have a right to develop. Under the Amended Agreement, we have paid to Buffalo Wild Wings
International, as Franchisor, a development fee of $31,250. Franchise fees for the nine (9)
additional restaurants will be $12,500 each. We have until November 1, 2017 to complete our
development obligations under the Amended Agreement.
As of December 27, 2009, ten (10) of these restaurants had been opened for business. Three
(3) of the restaurants opened under this agreement are affiliated and seven (7) are Company owned.
The other six (6) affiliated restaurants were opened prior to the Area Development Agreement.
Exercise of Options to Purchase Managed Restaurants
We had an option to purchase the nine affiliated BWW restaurants we currently manage on the
second anniversary of the completion of the Initial Public Offering. The original date for the
exercise of the option was August 1, 2010,
but that date was accelerated to February 1, 2010 at which time we did exercise the purchase option
and acquired the nine stores for $3.1 million. The acquisition was financed by the sellers.
The impact of the acquisition to our financial statements is reflected in the section “Fiscal
2010 Outlook”.
Capital Leases
The Company entered into two equipment leases in 2009 to finance equipment and furniture
purchases at its Flint and Port Huron BWW restaurants. The Flint lease of $427,953 requires
monthly payments of approximately $10,854 and matures in January 2013. The Port Huron equipment
lease of $430,877 requires monthly payments of approximately $10,778 and matures in May 2013. See
Note 9 in the footnotes to the consolidated financial statements for more detail.
We obtained equipment lease financing for the Bagger Dave’s Novi location in February 2010.
The lease of $250,000 requires monthly payments of approximately $8,115 and matures in February
2013.
Effect of Inflation
Although since our inception we have not operated in a period of high inflation, our
profitability is dependent, among other things, on our ability to anticipate and react to changes
in the costs of key operating resources including food and other raw materials, labor, energy and
other supplies and services and the impact of inflation can be significant. There has been
volatility in certain commodities we purchase, such as chicken wings in this last year. We are
able to somewhat offset the effects of increasing costs through improved purchasing practices,
efficiencies, economies of scale and, if prudent, price increases. Whether we are able and/or
choose to offset the effect of inflation will determine to what, if any, extent inflation affects
our operations. During 2010, the inflationary price of chicken wings had an impact to margins that
was somewhat offset by deflated prices in some other commodities and a marketing emphasis on other
products.
Seasonality
Our business can be subject to seasonal fluctuations especially for those stores with patio
seating. The BWW restaurants are primarily impacted by the sports seasons. Football, basketball
and hockey seasons tend to be our strongest. Holidays, severe weather, such as hurricanes,
thunderstorms or blizzards, may impact restaurant sales in some of the markets where we operate.
As a result, financial results for any particular quarter may not be indicative of what a full
fiscal year’s results may be.
Michigan is instituting a smoking ban effective May 1, 2010. Although our Bagger Dave’s®
restaurants are all non-smoking, the BWW restaurants are not and this could negatively impact our
sales performance. We expect a concerted sales effort and restaurant staff and management
incentive program to help offset the potential effect.
F-8
Table of Contents
Critical Accounting Policies and Use of Estimates
In the ordinary course of business, we have made a number of estimates and assumptions in the
preparation of our consolidated financial statements in conformity with accounting principles
generally accepted in the United States of America. Actual results could differ significantly from
those estimates under different assumptions and conditions. We constantly reevaluate these
significant factors and make adjustments where facts and circumstances dictate.
The Company believes the following accounting policies represent critical accounting policies.
Critical accounting policies are those that are both most important to the portrayal of a
company’s financial condition and results and require management’s most difficult, subjective or
complex judgments, often as a result of the need to make estimates about the effect of matters that
are inherently uncertain and may change in subsequent periods. We discuss our significant
accounting policies in Note 1 to the Company’s consolidated financial statements, including those
that do not require management to make difficult, subjective or complex judgments or estimates.
Property and Equipment
We record all property and equipment at cost less accumulated depreciation and we select
useful lives that reflect the actual economic lives of the underlying assets. We amortize
leasehold improvements over the shorter of the useful life of the asset or the related lease term.
We calculate depreciation using the straight-line method for consolidated financial statement
purposes. We capitalize improvements and expense repairs and maintenance costs as incurred. We are
often required to exercise judgment in our decision whether to capitalize an asset or expense an
expenditure that is for maintenance and repairs. Our judgments may produce materially different
amounts of repair and maintenance or depreciation expense if different assumptions were used.
We perform an asset impairment analysis on an annual basis of property and equipment related
to our restaurant locations. We also perform these tests when we experience a “triggering” event
such as a major change in a location’s operating environment, or other event that might impact our
ability to recover our asset investment. This process requires the use of estimates and assumptions
which are subject to a high degree of judgment. Our analysis indicated that we did not need to
record any impairment charges during 2009 and 2008 and thus none were recorded. If these
assumptions or circumstances change in the future, we may be required to record impairment charges
for these assets.
Deferred Tax Asset
The Company records deferred tax assets for the value of benefits expected to be realized from
the utilization of state and federal net operating loss carryforwards. We periodically review these
assets for realizability based upon expected taxable income in the applicable taxing jurisdictions.
To the extent we believe some portion of the benefit may not be realizable, an estimate of the
unrealized portion is made and an allowance is recorded. At December 27, 2009 and December 31,
2008, we had no valuation allowance as we believe we will generate sufficient taxable income in the
future to realize the benefits of our deferred tax assets. This belief is based upon the Company’s
option to purchase the nine affiliated restaurants currently managed by DRH. Realization of these
deferred tax assets is dependent upon generating sufficient taxable income prior to expiration of
any net operating loss carryforwards. Although realization is not assured, management believes it
is more likely than not that the remaining, recorded deferred tax assets will be realized. If the
ultimate realization of these deferred tax assets is significantly different from our expectations,
the value of its deferred tax assets could be materially overstated.
Impact of Recent Accounting Pronouncements
See Note 1 of Notes to Consolidated Financial Statements for a summary of new accounting
pronouncements.
F-9
Table of Contents
REPORT OF INDEPENDENT REGISTERED PUBLIC ACCOUNTING FIRM
Silberstein Ungar, PLLC
CPAs and Business Advisors
phone (248) 203-0080
fax (248) 281-0940
30600 Telegraph Road, Suite 2175
Bingham Farms, MI 48025
www.sucpas.com
fax (248) 281-0940
30600 Telegraph Road, Suite 2175
Bingham Farms, MI 48025
www.sucpas.com
To the Board of Directors
Diversified Restaurant Holdings, Inc.
Southfield, MI
Diversified Restaurant Holdings, Inc.
Southfield, MI
We have audited the accompanying consolidated balance sheet of Diversified
Restaurant Holdings, Inc. and Subsidiaries as of December 27, 2009 and the related
statements of operations, changes in stockholders’ equity, and cash flows for the
year then ended. These consolidated financial statements are the responsibility of
the Company’s management. Our responsibility is to express an opinion on these
consolidated financial statements based on our audit. The consolidated financial
statements of Diversified Restaurant Holdings, Inc. and Subsidiaries as of December
31, 2008 were audited by other auditors whose report dated March 30, 2009 expressed
an unqualified opinion on those statements.
We conducted our audit in accordance with the standards of the Public Company
Accounting Oversight Board (United States). Those standards require that we plan
and perform the audit to obtain reasonable assurance about whether the consolidated
financial statements are free of material misstatement. The Company has determined
that it is not required to have, nor were we engaged to perform, an audit of its
internal control over financial reporting. Our audit included consideration of
internal control over financial reporting as a basis for designing audit procedures
that are appropriate in the circumstances, but not for the purpose of expressing an
opinion on the effectiveness of the Company’s internal control over financial
reporting. Accordingly, we express no such opinion. An audit includes examining
on a test basis, evidence supporting the amounts and disclosures in the
consolidated financial statements. An audit also includes assessing the accounting
principles used and significant estimates made by management, as well as evaluating
the overall financial statement presentation. We believe that our audit provides a
reasonable basis for our opinion.
In our opinion, the consolidated financial statements referred to above present
fairly, in all material respects, the consolidated financial position of
Diversified Restaurant Holdings, Inc. and Subsidiaries as of December 27, 2009 and
the results of its operations and cash flows for the year then ended, in conformity
with accounting principles generally accepted in the United States of America.
/s/ Silberstein Ungar, PLLC
Bingham Farms, Michigan
March 25, 2010
March 25, 2010

F-10
Table of Contents
REPORT OF INDEPENDENT REGISTERED PUBLIC ACCOUNTING FIRM
Board of Directors and Stockholders
Diversified Restaurant Holdings, Inc.
Southfield, Michigan
Diversified Restaurant Holdings, Inc.
Southfield, Michigan
We have audited the accompanying consolidated balance sheet of Diversified Restaurant Holdings,
Inc. and Subsidiaries (“the Company”) as of December 31, 2008, and the related consolidated
statements of operations, stockholders’ equity and cash flows for the year then ended. These
consolidated financial statements are the responsibility of the Company’s management. Our
responsibility is to express an opinion on these consolidated financial statements based on our
audit.
We conducted our audit in accordance with the standards of the Public Company Accounting Oversight
Board (United States). Those standards require that we plan and perform the audit to obtain
reasonable assurance about whether the consolidated financial statements are free of material
misstatement. An audit includes examining, on a test basis, evidence supporting the amounts and
disclosures in the consolidated financial statements. An audit also includes assessing the
accounting principles used and significant estimates made by management, as well as evaluating the
overall financial statement presentation. We believe that our audit provides a reasonable basis
for our opinion.
In our opinion, the consolidated financial statements referred to above present fairly, in all
material respects, the consolidated financial position of Diversified Restaurant Holdings, Inc. and
Subsidiaries as of December 31, 2008, and the consolidated results of their operations and their
cash flows for the year then ended in conformity with accounting principles generally accepted in
the United States of America.
/s/
Rehmann Robson, P.C.
Troy, Michigan
March 30, 2009
March 30, 2009
F-11
Table of Contents
REPORT BY DIVERSIFIED RESTAURANT HOLDINGS, INC.’S MANAGEMENT
ON INTERNAL CONTROL OVER FINANCIAL REPORTING
ON INTERNAL CONTROL OVER FINANCIAL REPORTING
Management is responsible for establishing and maintaining an effective system of internal
control over financial reporting presented in conformity with generally accepted accounting
principles. There are inherent limitations in the effectiveness of any system of internal control.
Accordingly, even an effective system of internal control can provide only reasonable assurance
with respect to financial statement preparation.
Management assessed the Company’s system of internal control over financial reporting that is
designed to produce reliable financial statements in conformity with generally accepted accounting
principles as of December 27, 2009. This assessment was based on criteria for effective internal
control over financial reporting described in Internal Control
— Integrated Framework issued by the
Committee of Sponsoring Organizations of the Treadway Commission. Based on this assessment,
management believes that, as of December 27, 2009, Diversified Restaurant Holdings, Inc. maintained
effective control over financial reporting presented in conformity with generally accepted
accounting principles based on those criteria.
Our report is not subject to attestation by the company’s registered public accounting firm
pursuant to temporary rules of the Securities and Exchange Commission that permit the company to
provide only management’s report.
Diversified Restaurant Holdings, Inc.
/s/ T. Michael Ansley
T. Michael Ansley
Chairman of the Board, President and Chief Executive Officer
T. Michael Ansley
Chairman of the Board, President and Chief Executive Officer
F-12
Table of Contents
DIVERSIFIED RESTAURANT HOLDINGS, INC. AND SUBSIDIARIES
CONSOLIDATED BALANCE SHEETS
| December 27 | December 31 | |||||||
| 2009 | 2008 | |||||||
ASSETS |
||||||||
Current assets |
||||||||
Cash and cash equivalents |
$ | 649,518 | $ | 133,865 | ||||
Accounts receivable — related party |
254,540 | 192,889 | ||||||
Inventory |
125,332 | 157,882 | ||||||
Prepaid assets |
103,452 | 52,440 | ||||||
Accounts
receivable — other |
11,219 | 192,000 | ||||||
Other assets |
49,280 | 20,000 | ||||||
Total current assets |
1,193,341 | 749,076 | ||||||
Property and equipment, net (Note 2) |
7,866,149 | 7,817,254 | ||||||
Intangible assets, net (Note 3) |
411,983 | 406,982 | ||||||
Deferred income taxes |
246,754 | 599,957 | ||||||
Total assets |
$ | 9,718,227 | $ | 9,573,269 | ||||
LIABILITIES AND STOCKHOLDERS’ EQUITY |
||||||||
Current liabilities |
||||||||
Current portion of long-term debt |
$ | 1,402,742 | $ | 1,454,867 | ||||
Accounts payable |
293,984 | 660,353 | ||||||
Accrued liabilities |
329,355 | 305,302 | ||||||
Deferred rent |
54,273 | 56,254 | ||||||
Total current liabilities |
2,080,354 | 2,476,776 | ||||||
Accrued rent |
253,625 | 113,909 | ||||||
Deferred rent |
422,068 | 474,690 | ||||||
Other liabilities — interest rate swap |
167,559 | 253,792 | ||||||
Long-term debt, less current portion (Notes 4 and 5) |
4,601,909 | 5,025,227 | ||||||
Total liabilities |
7,525,515 | 8,344,394 | ||||||
Commitments and contingencies (Notes 4, 5, 7, 8, 9 and 10) |
||||||||
Stockholders’ equity (Note 6) |
||||||||
Common stock — $0.0001 par value; 100,000,000 shares
authorized, 18,626,000 and 18,070,000 respectfully
shares issued and outstanding |
1,863 | 1,807 | ||||||
Additional paid-in capital |
2,356,155 | 1,758,899 | ||||||
Accumulated deficit |
(165,306 | ) | (531,831 | ) | ||||
Total stockholders’ equity |
2,192,712 | 1,228,875 | ||||||
Total liabilities and stockholders’ equity |
$ | 9,718,227 | $ | 9,573,269 | ||||
The accompanying notes are an integral part of these consolidated financial statements
F-13
Table of Contents
DIVERSIFIED RESTAURANT HOLDINGS, INC. AND SUBSIDIARIES
CONSOLIDATED STATEMENTS OF OPERATIONS
| December 27 | December 31 | |||||||
| 2009 | 2008 | |||||||
Revenue |
||||||||
Food and beverage sales |
$ | 17,317,996 | $ | 9,783,391 | ||||
Management and advertising fees |
1,744,505 | 1,803,173 | ||||||
Total revenue |
19,062,501 | 11,586,564 | ||||||
Operating expenses |
||||||||
Compensation costs |
5,724,053 | 4,007,685 | ||||||
Food and beverage costs |
5,325,825 | 2,930,445 | ||||||
General and administrative |
4,693,219 | 3,319,582 | ||||||
Occupancy |
1,132,364 | 740,745 | ||||||
Depreciation and amortization |
1,203,337 | 877,206 | ||||||
Total operating expenses |
18,078,798 | 11,875,663 | ||||||
Income (loss) from operations |
983,703 | (289,099 | ) | |||||
Interest expense |
445,820 | 289,681 | ||||||
Other (income) expense, net |
(80,706 | ) | 264,982 | |||||
Income (loss) before income taxes |
618,589 | (843,762 | ) | |||||
Income tax (provision) benefit |
(252,064 | ) | 520,777 | |||||
Net income (loss) |
$ | 366,525 | $ | (322,985 | ) | |||
Basic earnings (loss) per share — as reported |
$ | 0.020 | $ | (0.018 | ) | |||
Fully
diluted earnings (loss) per share — as reported |
$ | 0.013 | $ | (0.018 | ) | |||
Weighted average number of common shares
outstanding |
||||||||
Basic |
18,114,909 | 17,988,525 | ||||||
Diluted |
29,020,000 | N/A | ||||||
The accompanying notes are an integral part of these consolidated financial statements
F-14
Table of Contents
DIVERSIFIED RESTAURANT HOLDINGS, INC. AND SUBSIDIARIES
CONSOLIDATED STATEMENT OF STOCKHOLDERS’ EQUITY
| Additional | Total | |||||||||||||||||||
| Common Stock | Paid-in | Accumulated | Stockholders’ | |||||||||||||||||
| Shares | Amount | Capital | Deficit | Equity | ||||||||||||||||
Balances — January 1, 2008 |
17,930,000 | $ | 1,793 | $ | 991,603 | $ | (208,846 | ) | $ | 784,550 | ||||||||||
Proceeds from the issuance
of common stock |
140,000 | 14 | 734,984 | — | 734,998 | |||||||||||||||
Share-based compensation
(Note 6) |
— | 32,312 | — | 32,312 | ||||||||||||||||
Net loss |
— | — | (322,985 | ) | (322,985 | ) | ||||||||||||||
Balances — December 31, 2008 |
18,070,000 | 1,807 | 1,758,899 | (531,831 | ) | 1,228,875 | ||||||||||||||
Share-based compensation
(Note 6) |
32,312 | 32,312 | ||||||||||||||||||
Exercise of employee stock
options (Note 6) |
6,000 | 1 | 14,999 | 15,000 | ||||||||||||||||
Shares issued for warrants
exercised at $1.00 per
share (Note 6) |
550,000 | 55 | 549,945 | 550,000 | ||||||||||||||||
Net income |
366,525 | 366,525 | ||||||||||||||||||
Balances — December 27, 2009 |
18,626,000 | $ | 1,863 | $ | 2,356,155 | $ | (165,306 | ) | $ | 2,192,712 | ||||||||||
The accompanying notes are an integral part of these consolidated financial statements
F-15
Table of Contents
DIVERSIFIED RESTAURANT HOLDINGS, INC. AND SUBSIDIARIES
CONSOLIDATED STATEMENTS OF CASH FLOWS
| December 27 | December 31 | |||||||
| 2009 | 2008 | |||||||
Cash flows from operating activities |
||||||||
Net income (loss) |
$ | 366,525 | $ | (322,985 | ) | |||
Adjustments to reconcile net income (loss) to
net cash provided by operating activities |
||||||||
Depreciation and amortization |
1,203,337 | 877,206 | ||||||
Loss on disposal of property and equipment |
1,261 | |||||||
Share-based compensation |
32,312 | 32,312 | ||||||
Deferred income tax benefit |
353,203 | (520,777 | ) | |||||
Changes in operating assets and liabilities that
provided (used) cash |
||||||||
Accounts receivable — related party |
(61,651 | ) | (62,460 | ) | ||||
Accounts payable |
(366,369 | ) | 448,346 | |||||
Inventory |
32,550 | (122,132 | ) | |||||
Prepaid assets |
(51,012 | ) | (24,356 | ) | ||||
Accounts receivable — other |
180,781 | (192,000 | ) | |||||
Intangible assets |
(11,210 | ) | (308,537 | ) | ||||
Other assets |
(29,280 | ) | (16,730 | ) | ||||
Accrued liabilities |
24,053 | 233,865 | ||||||
Accrued rent |
139,716 | 61,803 | ||||||
Deferred rent |
(54,603 | ) | 411,054 | |||||
Net cash provided by operating activities |
1,759,613 | 494,609 | ||||||
Cash flows used in investing activities |
||||||||
Purchases of property and equipment |
(388,454 | ) | (5,361,403 | ) | ||||
Cash from financing activities |
||||||||
Proceeds from issuance of notes payable — related party |
14,583 | — | ||||||
Proceeds from issuance of long term debt |
250,000 | 4,404,897 | ||||||
Repayment of notes payable — related party |
(451,513 | ) | (12,000 | ) | ||||
Repayments of long-term debt |
(1,233,576 | ) | (402,964 | ) | ||||
Proceeds from issuance of common stock |
565,000 | 734,998 | ||||||
Net cash (used) provided by financing activities |
(855,506 | ) | 4,724,931 | |||||
Net increase (decrease) in cash and cash equivalents |
515,653 | (141,863 | ) | |||||
Cash and cash equivalents, beginning of year |
133,865 | 275,728 | ||||||
Cash and cash equivalents, end of year |
$ | 649,518 | $ | 133,865 | ||||
Supplemental schedule of non-cash investing and financing
activities: |
||||||||
Capital expenditures funded by capital lease borrowings |
$ | 858,779 | $ | — | ||||
The accompanying notes are an integral part of these consolidated financial statements
F-16
Table of Contents
DIVERSIFIED RESTAURANT HOLDINGS, INC. AND SUBSIDIARIES
NOTES TO CONSOLIDATED FINANCIAL STATEMENTS
DECEMBER 27, 2009 and DECEMBER 31, 2008
DECEMBER 27, 2009 and DECEMBER 31, 2008
1. BUSINESS AND SUMMARY OF SIGNIFICANT ACCOUNTING POLICIES
Nature of Business
Diversified Restaurant Holdings, Inc. (DRH) was formed September 25, 2006. DRH and its three
wholly-owned subsidiaries AMC Group, Inc, (AMC), AMC Wings, Inc. (WINGS), and AMC Burgers, Inc.
(BURGERS) (collectively, the “Company”), develop, own, and operate, as well as render management
and marketing services for, Buffalo Wild Wings restaurants located throughout Michigan and Florida
and the Company’s own restaurant concept, Bagger Dave’s Legendary Burgers and Fries (Bagger
Dave’s), as detailed below.
The following organizational chart outlines the corporate structure of the Company and its
subsidiaries, all of which are wholly-owned by the Company. A brief textual description of the
entities follows the organizational chart. DRH is incorporated in the State of Nevada. All other
entities are incorporated in the State of Michigan.
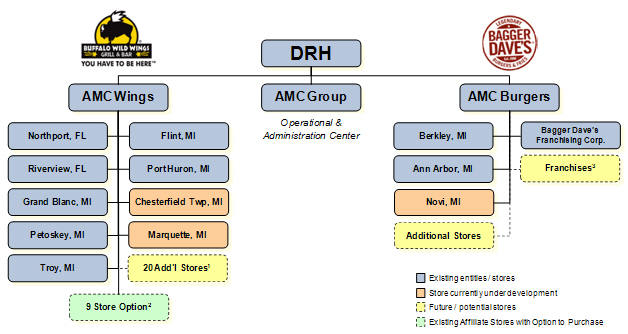
F-17
Table of Contents
DIVERSIFIED RESTAURANT HOLDINGS, INC. AND SUBSIDIARIES
NOTES TO CONSOLIDATED FINANCIAL STATEMENTS
DECEMBER 27, 2009 and DECEMBER 31, 2008
NOTES TO CONSOLIDATED FINANCIAL STATEMENTS
DECEMBER 27, 2009 and DECEMBER 31, 2008
AMC, formed on March 28, 2007, serves as the operational and administrative center for the Company.
AMC renders management and marketing services to WINGS and BURGERS and their subsidiaries and nine
Buffalo Wild Wings restaurants affiliated with the Company through common ownership and management
control but not required to be consolidated for financial reporting purposes. Services rendered by
AMC include marketing, restaurant operations, restaurant management consultation, the hiring and
training of management and staff, and other management services reasonably required in the ordinary
course of restaurant operations.
WINGS was formed on March 12, 2007 to hold Buffalo Wild Wings restaurants developed by the
Company. WINGS, through its subsidiaries, holds seven Buffalo Wild Wings restaurants currently in
operation. Each of WINGS’ subsidiaries is named for the location of the restaurant it holds. The
subsidiaries that hold restaurants currently in operation are:
| Date of | ||||
| Subsidiary | Restaurant Opening | |||
AMC North Port, Inc. |
August 2007 | |||
AMC Riverview, Inc. |
August 2007 | |||
AMC Grand Blanc, Inc. |
March 2008 | |||
AMC Troy, Inc. |
July 2008 | |||
AMC Petoskey, Inc. |
August 2008 | |||
AMC Flint, Inc. |
December 2008 | |||
AMC Port Huron, Inc. |
June 2009 | |||
The Company has also executed franchise agreements with Buffalo Wild Wings International, Inc.
to open two more restaurants in 2010, one in Chesterfield Township, Michigan and the other in
Marquette, Michigan. These restaurants will be held by AMC Chesterfield, Inc. and AMC Marquette,
Inc., respectively. The Company is economically dependent on retaining its franchise rights with
Buffalo Wild Wings, Inc. Each of the franchise agreements has a specific expiration date ranging
from September 28, 2026 through October 20, 2029, depending on the date that each was executed and
its initial term. The franchise agreements are renewable at the option of the franchisor and are
generally renewable if the franchisee has complied with the franchise agreement. The Company is in
compliance with the terms of these agreements at December 27, 2009. The Company is under contract
with Buffalo Wild Wings, International, Inc. to open 20 additional stores by 2017. The Company
held an option to purchase the nine (9) affiliated restaurants that are currently managed by AMC.
The Company exercised this option in 2010.
BURGERS was formed on March 12, 2007 to own the Company’s Bagger Dave’s restaurants, a new
fast casual dining concept developed by the Company. BURGERS’ subsidiaries Ann Arbor Burgers, Inc.
and Berkley Burgers, Inc. own restaurants currently in operation in Ann Arbor, Michigan and
Berkley, Michigan, respectively. BURGERS’ subsidiary, Troy Burgers, Inc., will open in the first
quarter 2010. BURGERS also has a wholly-owned subsidiary named Bagger Dave’s Franchising
Corporation that was formed to act as the franchisor for the Bagger Dave’s Legendary Burgers and
Fries concept. We have filed for rights to franchise in Michigan, Ohio and Indiana, but have not
yet franchised any Bagger Dave’s restaurants.
We follow accounting standards set by the Financial Accounting Standards Board, commonly
referred to as the “FASB.” The FASB sets generally accepted accounting principles (GAAP) that we
follow to ensure we consistently report our financial condition, results of operations and cash
flows. References to GAAP issued by the FASB in these footnotes are to the FASB Accounting
Standards Codification,™ sometimes referred to as the Codification or ASC. The FASB finalized the
Codification effective for periods ending on or after September 15, 2009. Prior FASB standards
like FASB Statement No. 13, Accounting for Leases, are no longer being issued by the FASB. For
further discussion of the Codification, see “FASB Codification Discussion” in Management’s
Discussion and
Analysis of Financial Condition and Results of Operations (commonly referred to as MD&A) elsewhere
in this report.
F-18
Table of Contents
DIVERSIFIED RESTAURANT HOLDINGS, INC. AND SUBSIDIARIES
NOTES TO CONSOLIDATED FINANCIAL STATEMENTS
DECEMBER 27, 2009 and DECEMBER 31, 2008
NOTES TO CONSOLIDATED FINANCIAL STATEMENTS
DECEMBER 27, 2009 and DECEMBER 31, 2008
Principles of Consolidation
The consolidated financial statements include the accounts of DRH and its wholly owned
subsidiaries AMC, WINGS and its subsidiaries, and BURGERS and its subsidiaries.
All significant intercompany accounts and transactions have been eliminated upon
consolidation.
Fiscal Year
During 2009, the Company changed its fiscal year to utilize a 52- or 53-week accounting period
that ends on the last Sunday in December. Consequently, fiscal year 2009 ended December 27, 2009
comprising 51 weeks and three days. Prior to 2009, the Company reported on a calendar year basis,
and accordingly fiscal year 2008 ended December 31, 2008 comprising 52 weeks and 2 days.
Segment Reporting
The Company has determined that it does not have any separately reportable business segments
at December 27, 2009 and December 31, 2008.
Cash and Cash Equivalents
Cash and cash equivalents consist of cash on hand and demand deposits in banks. The Company
considers all highly liquid investments purchased with original maturities of three months or less
to be cash equivalents. The Company, at times throughout the year, may in the ordinary course of
business maintain cash balances in excess of federally insured limits. Management does not believe
the Company is exposed to any unusual risks on such deposits.
Revenue Recognition
Management and advertising fees are calculated by applying a percentage as stipulated in a
management services agreement to managed restaurant revenues. Revenues derived from management and
advertising fees are recognized in the period in which they are earned, which is the period in
which the management services are rendered. Revenues from food and beverage sales are recognized
and generally collected at the point-of-sale.
Accounts
Receivable — Related Party
Accounts receivable are stated at the amount management expects to collect from outstanding
balances. Balances that are outstanding after management has used reasonable collection efforts
are written off with a corresponding charge to bad debt expense. The balances at December 27, 2009
and December 31, 2008 relate principally to management and advertising fees charged to and
intercompany transactions with the related Buffalo Wild Wings restaurants that are managed by AMC
and arise in the ordinary course of business (see Note 4). Management does not believe any
allowances for doubtful accounts are necessary at December 27, 2009 or December 31, 2008.
Accounting for Gift Cards
The Company records the net increase or decrease in Buffalo Wild Wings gift card sales versus
gift card redemptions to the gift card liability account on a monthly basis. The gift card
processor deducts gift card sales dollars from each restaurant’s bank account weekly and deposits
gift card redemption dollars weekly. Under this centralized system, any breakage would be recorded
by Blazin Wings, Inc., a subsidiary of Buffalo Wild Wings, Inc., and be subject to the breakage
laws in the State of Minnesota.
The Company records the net increase or decrease in Bagger Dave’s gift card sales versus gift
card redemptions to the gift card liability account on a monthly basis. Michigan law states that
gift cards cannot expire and any post-sale fees cannot be assessed until five (5) years after the
date of gift card purchase by consumer.
At this time, there is no breakage for the Company to record.
F-19
Table of Contents
DIVERSIFIED RESTAURANT HOLDINGS, INC. AND SUBSIDIARIES
NOTES TO CONSOLIDATED FINANCIAL STATEMENTS
DECEMBER 27, 2009 and DECEMBER 31, 2008
NOTES TO CONSOLIDATED FINANCIAL STATEMENTS
DECEMBER 27, 2009 and DECEMBER 31, 2008
The liability is included in accrued liabilities in the consolidated balance sheets. As of
December 27, 2009, the Company’s gift card liability was approximately $19,961, compared to
approximately $68,456 at December 31, 2008.
Lease Accounting
Certain operating leases provide for minimum annual payments that increase over the life of
the lease. The aggregate minimum annual payments are expensed on a straight-line basis beginning
when we take possession of the property and extending over the term of the related lease. The
amount by which straight-line rent exceeds actual lease payment requirements in the early years of
the lease is accrued as deferred rent and reduced in later years when the actual cash payment
requirements exceed the straight-line expense. The Company also accounts, in its straight-line
computation, for the effect of any “rental holidays” or “tenant incentives”.
Inventory
Inventory, which consists mainly of food and beverage products, is valued at the lower of cost
determined on the first-in, first-out basis, or market.
Prepaid Expenses and Other Assets
Prepaid expenses consist principally of prepaid insurance and are recognized ratably as
operating expense over the period covered by the unexpired premium. Other assets consist
principally of franchise fees, trademarks and loan fees, which are deferred and amortized to
operating expense on a straight line basis over the term of the related underlying agreements,
which are as follows:
Franchise fees |
10 to 20 years | |
Trademarks |
15 years | |
Loan fees |
2 to 7 years (loan term) |
Liquor licenses are deemed to have an indefinite life. Management annually reviews these
assets to determine whether carrying values have been impaired. During the period ended December
27, 2009, no impairments relating to intangible assets with finite or infinite lives were
recognized.
Property and Equipment
Property and equipment are stated at cost. Major improvements and renewals are capitalized,
while ordinary maintenance and repairs are expensed. Management annually reviews these assets to
determine whether carrying values have been impaired.
The Company capitalizes as restaurant construction-in-progress costs incurred in connection
with the design, build out and furnishing of its owned restaurants. Such costs consist principally
of leasehold improvements, directly related costs such as architectural and design fees,
construction period interest (when applicable) and equipment, furniture and fixtures not yet placed
in service.
Depreciation and Amortization
Depreciation on non-restaurant equipment, furniture and fixtures is computed using the
straight-line method over the estimated useful lives of the related assets which range from five to
seven years. Depreciation on restaurant equipment, furniture and fixtures is computed on the
straight-line method over the estimated useful lives of the related assets, which range from five
to seven years. Restaurant leasehold improvements are amortized over the shorter of the lease term
or the useful life of the related improvement. Restaurant construction-in-progress is not
amortized or depreciated until the related assets are placed into service.
Advertising
Advertising expenses are recognized in the period in which they are incurred. Advertising
expense was approximately $555,890 and $572,551 for the fiscal year ended December 27, 2009 and the
year ended December 31, 2008, respectively.
F-20
Table of Contents
DIVERSIFIED RESTAURANT HOLDINGS, INC. AND SUBSIDIARIES
NOTES TO CONSOLIDATED FINANCIAL STATEMENTS
DECEMBER 27, 2009 and DECEMBER 31, 2008
NOTES TO CONSOLIDATED FINANCIAL STATEMENTS
DECEMBER 27, 2009 and DECEMBER 31, 2008
Income Taxes
Deferred income tax assets and liabilities are computed for differences between the financial
statement and tax bases of assets and liabilities that will result in taxable or deductible amounts
in the future, based on enacted tax laws and rates applicable to the periods in which the
differences are expected to affect taxable income. Valuation allowances are established when
necessary to reduce deferred tax assets to the amount expected to be realized. Income tax expense
is the tax payable or refundable for the period plus or minus the change during the period in
deferred tax assets and liabilities.
Earnings (Loss) Per Share
Earnings (loss) per share are calculated under the provisions of FASB ASC 260, Earnings per
Share. ASC 260 requires a dual presentation of “basic” and “diluted” earnings per share on the face
of the income statement. “Diluted” reflects the potential dilution of all common stock equivalents
except in cases where the effect would be anti-dilutive.
Concentration Risks
Approximately 9% and 16% of the Company’s revenues during the fiscal year ended December 27,
2009 and the year ended December 31, 2008, respectively, are generated from the management of
Buffalo Wild Wings restaurants located in Michigan and Florida, which are related under common
ownership and management control (see Note 4). Approximately 83% and 68% of food and beverage
sales came from restaurants located in Michigan during the twelve month period ended December 27,
2009 and the year ended December 31, 2008, respectively.
Use of Estimates
The preparation of consolidated financial statements in conformity with generally accepted
accounting principles requires management to make estimates and assumptions that affect the
reported amounts of assets and liabilities and disclosure of contingent assets and liabilities at
the date of the consolidated financial statements and the reported amounts of income and expenses
during the reporting period. Actual results could differ from those estimates.
Financial Instrument
The Company utilizes interest rate swap agreements with a bank to fix interest rates on a
portion of the Company’s portfolio of variable rate debt which reduces exposure to interest rate
fluctuations. The Company does not use any other types of derivative financial instruments to
hedge such exposures, nor does it use derivatives for speculative purposes.
The Company records the fair value of their interest rate swaps on the balance sheet in other
assets or other liabilities depending on the fair value of the swaps. The terms of the agreements
match those of the underlying debt and therefore are classified as non-current. Fair value
adjustments are recorded each period in other income or other expense on the statement of
operations. The notional value of interest rate swap agreements in place at December 27, 2009 and
December 31, 2008 were approximately $2,492,000 and $2,900,000, respectively. The expiration dates
of these agreements are consistent with debt instruments as described in Note 5.
Recent Accounting Pronouncements
In May 2009, the FASB issued SFAS 165 (ASC 855-10) entitled “Subsequent Events”. Companies
are now required to disclose the date through which subsequent events have been evaluated by
management. Public entities (as defined) must conduct the evaluation as of the date the financial
statements are issued, and provide disclosure that such date was used for this evaluation. SFAS 165
(ASC 855-10) provides that financial statements are considered “issued” when they are widely
distributed for general use and reliance in a form and format that complies with GAAP. SFAS 165
(ASC 855-10) is effective for interim and annual periods ending after June 15, 2009 and must be
applied prospectively. The adoption of SFAS 165 (ASC 855-10) during the quarter ended September 30,
2009 did not have a significant effect on the Company’s financial statements as of that date or for
the quarter or year-to-date period then ended.
F-21
Table of Contents
DIVERSIFIED RESTAURANT HOLDINGS, INC. AND SUBSIDIARIES
NOTES TO CONSOLIDATED FINANCIAL STATEMENTS
DECEMBER 27, 2009 and DECEMBER 31, 2008
NOTES TO CONSOLIDATED FINANCIAL STATEMENTS
DECEMBER 27, 2009 and DECEMBER 31, 2008
In June 2009, the FASB issued SFAS 168, The FASB Accounting Standards Codification and the
Hierarchy of Generally Accepted Accounting Principles. (“SFAS 168” or ASC 105-10) SFAS 168 (ASC
105-10) establishes the Codification as the sole source of authoritative accounting principles
recognized by the FASB to be applied by all nongovernmental entities in the preparation of
financial statements in conformity with GAAP. SFAS 168 (ASC 105-10) was prospectively effective for
financial statements issued for fiscal years ending on or after September 15, 2009 and interim
periods within those fiscal years. The adoption of SFAS 168 (ASC 105-10) on July 1, 2009 did not
impact the Company’s results of operations or financial condition. The Codification did not change
GAAP, however, it did change the way GAAP is organized and presented.
As a result, these changes impact how companies reference GAAP in their financial statements
and in their significant accounting policies. The Company implemented the Codification in this
Report by providing references to the Codification topics alongside references to the corresponding
standards.
With the exception of the pronouncements noted above, no other accounting standards or
interpretations issued or recently adopted are expected to have a material impact on the Company’s
financial position, operations or cash flows.
Reclassifications
Certain reclassifications have been made to the prior year consolidated financial statements to
conform to the current year’s presentation.
2. PROPERTY AND EQUIPMENT, NET
Property and equipment are comprised of the following assets:
| December 27 | December 31 | |||||||
| 2009 | 2008 | |||||||
Equipment |
$ | 3,008,670 | $ | 2,613,488 | ||||
Furniture and fixtures |
831,313 | 767,979 | ||||||
Leasehold improvements |
6,087,233 | 5,401,301 | ||||||
Restaurant construction-in-progress |
126,804 | 27,410 | ||||||
Total |
10,054,020 | 8,810,178 | ||||||
Less accumulated depreciation |
2,187,871 | 992,924 | ||||||
Property and equipment, net |
$ | 7,866,149 | $ | 7,817,254 | ||||
3. INTANGIBLES
Intangible assets are comprised of the following:
| December 27 | December 31 | |||||||
| 2009 | 2008 | |||||||
Amortized Intangibles |
||||||||
Franchise Fees |
$ | 141,250 | $ | 131,250 | ||||
Trademark |
2,500 | 2,500 | ||||||
Loan Fees |
15,691 | 15,691 | ||||||
Total |
159,441 | 149,441 | ||||||
Less accumulated amortization |
11,818 | 5,609 | ||||||
Amortized Intangibles, net |
147,623 | 143,832 | ||||||
Unamortized Intangibles |
||||||||
Liquor Licenses |
264,360 | 263,150 | ||||||
Total Intangibles, net |
$ | 411,983 | $ | 406,982 | ||||
F-22
Table of Contents
DIVERSIFIED RESTAURANT HOLDINGS, INC. AND SUBSIDIARIES
NOTES TO CONSOLIDATED FINANCIAL STATEMENTS
DECEMBER 27, 2009 and DECEMBER 31, 2008
NOTES TO CONSOLIDATED FINANCIAL STATEMENTS
DECEMBER 27, 2009 and DECEMBER 31, 2008
Amortization expense for the fiscal year ended December 27, 2009 and the year ended December
31, 2008 was $6,210 and $4,448, respectively. Based on the current intangible assets and their
estimated useful lives, amortization expense for fiscal 2010, 2011, 2012, 2013 and 2014 is
projected to total approximately $6,300 per year.
4. RELATED PARTY TRANSACTIONS
Fees for monthly accounting and financial statement compilation services are paid to an entity
owned by a Director and stockholder of the Company. Fees paid during the fiscal year ended
December 27, 2009 and the year ended December 31, 2008 were $87,057 and $78,100, respectively.
Management and advertising fees are earned from restaurants affiliated with the Company
through common ownership and management control. Fees earned during the fiscal year ended December
27, 2009 and the year ended December 31, 2008 totaled $1,744,505 and $1,803,173, respectively.
Accounts receivable arising from such billed fees were $128,473 and $140,034 at December 27, 2009
and December 31, 2008, respectively. Accounts receivable from related parties also includes
amounts due from properties under common ownership and control that are included in the Company’s
Michigan Business Tax filing, representing tax benefits realized by these related parties from
offsetting state income tax that would be due on an individual basis with tax losses from the
Company (see Note 7). This amounts to $118,567 as of December 27, 2009. The remainder of accounts
receivable — related party, at December 27, 2009 consists of amounts due to DRH from managed
restaurants for other fees paid on their behalf.
The Company is a guarantor of debt of nine entities that are affiliated through common
ownership and management control. Under the terms of the guarantees, the Company’s maximum
liability is equal to the unpaid principal and any unpaid interest. There are currently no
separate agreements that provide recourse for the Company to recover any amounts from third parties
should the Company be required to pay any amounts or otherwise perform under the guarantees, and
there are no assets held either as collateral or by third parties, that, under the guarantees, the
Company could liquidate to recover all or a portion of any amounts required to be paid under the
guarantees. The event or circumstance that would require the Company to perform under the
guarantee is an “event of default”. An “event of default” is defined in the related note
agreements principally as a) default of any liability, obligation, or covenant with a bank,
including failure to pay, b) failure to maintain adequate collateral security value, or c) default
of any material liability or obligation to another party. As of December 27, 2009, the carrying
amount of the underlying debt obligations of the related entities was, in aggregate, approximately
$2,938,000 and the Company’s guarantee extends for the full term of the debt agreements, the last
of which expires in 2019. This amount is also the maximum potential amount of future payments the
Company could be required to make under the guarantees. As noted above, the Company and the
related entities for which it has provided the guarantees operate under common ownership and
management control and, in accordance with FASB ASC 460, Guarantees, the initial recognition and
measurement provisions of ASC 460 do not apply. At December 27, 2009, payments on the debt
obligations were current.
Long term debt (Note 5) contains two promissory notes in the amount of $100,000 each, along
with accrued interest, due to two of DRH’s stockholders. The notes bear interest at a rate of 3.2%
per annum and are being repaid over a two-year period that commenced January 2009 in monthly
installments of approximately $4,444 each.
Long term debt (Note 5) also includes a promissory note to a DRH stockholder in the amount of
$250,000. The note is a demand note that does not require principal or interest payments.
Interest is accrued at 8.00% and is compounded quarterly. The Company has 180 days from the date
of demand to pay the principal and accrued interest.
See financial statement Note 8 for related party lease transactions.
F-23
Table of Contents
DIVERSIFIED RESTAURANT HOLDINGS, INC. AND SUBSIDIARIES
NOTES TO CONSOLIDATED FINANCIAL STATEMENTS
DECEMBER 27, 2009 and DECEMBER 31, 2008
NOTES TO CONSOLIDATED FINANCIAL STATEMENTS
DECEMBER 27, 2009 and DECEMBER 31, 2008
5. LONG TERM DEBT
Long-term debt consists of the following obligations:
| December 27 | December 31 | |||||||
| 2009 | 2008 | |||||||
Note payable to a bank secured by the
property and equipment of AMC Grand Blanc,
Inc. as well as corporate and personal
guarantees of DRH, certain stockholders,
and various related parties. The agreement
calls for interest only payments through
February 2009 with monthly principal and
interest payments of approximately $15,000
for the period beginning March 2009 through
maturity in February 2011. Interest is
charged based on the one month London
InterBank Offered Rate (“LIBOR”) plus 2.5%
(effective annual rate of approximately
2.73% at December 27, 2009). |
$ | 206,396 | $ | 349,915 | ||||
Note payable to a bank secured by the
property and equipment of AMC Grand Blanc,
Inc. as well as corporate and personal
guarantees of DRH, certain stockholders,
and various related parties. Scheduled
monthly principal and interest payments are
approximately $11,800 through maturity in
February 2015. Interest is charged based
on a swap arrangement designed to yield a
fixed annual rate of approximately 6.05%. |
634,081 | 735,829 | ||||||
Note payable to a bank secured by the
property and equipment of AMC Petoskey,
Inc. as well as corporate and personal
guarantees of DRH, certain stockholders,
and various related parties. The agreement
calls for interest only payments through
February 2009 with monthly principal and
interest payments of approximately $14,800
for the period beginning March 2009 through
maturity in February 2011. Interest is
charged based on the one month LIBOR rate
plus 2.5% (effective annual rate of
approximately 2.73% at December 27, 2009). |
201,510 | 345,445 | ||||||
Note payable to a bank secured by the
property and equipment of AMC Petoskey,
Inc. as well as corporate and personal
guarantees of DRH, certain stockholders,
and various related parties. The agreement
calls for payments of principal and
interest of approximately $12,200 for the
period beginning July 2008 through maturity
in June 2015. Interest is charged based on
a swap arrangement designed to yield a
fixed annual rate of approximately 6.98%. |
661,651 | 757,153 | ||||||
Note payable to a bank secured by the
property and equipment of Berkley Burgers,
Inc. as well as corporate and personal
guarantees of DRH, certain stockholders,
and various related parties. Scheduled
monthly principal and interest payments are
approximately $6,900 including annual
interest charged based on a swap
arrangement designed to yield a fixed
annual rate of approximately 6.95%. The
note matures in November 2014. |
361,129 | 417,051 | ||||||
F-24
Table of Contents
DIVERSIFIED RESTAURANT HOLDINGS, INC. AND SUBSIDIARIES
NOTES TO CONSOLIDATED FINANCIAL STATEMENTS
DECEMBER 27, 2009 and DECEMBER 31, 2008
NOTES TO CONSOLIDATED FINANCIAL STATEMENTS
DECEMBER 27, 2009 and DECEMBER 31, 2008
| December 27 | December 31 | |||||||
| 2009 | 2008 | |||||||
Note payable to a bank secured by the
property and equipment of AMC Troy, Inc. as
well as corporate and personal guarantees
of DRH, certain stockholders, and various
related parties. The agreement calls for
monthly payments of principal and interest
of approximately $15,600 for the period
beginning July 2008 through maturity in
June 2015. Interest is charged based on a
swap arrangement designed to yield a fixed
annual rate of approximately 7.28%. |
835,442 | 955,417 | ||||||
Note payable to a bank secured by the
property and equipment of AMC Troy, Inc. as
well as corporate and personal guarantees
of DRH, certain stockholders, and various
related parties. The agreement calls for a
line of credit up to $476,348, and interest
only payments through February 2009 with
monthly principal and interest payments of
approximately $8,600 for the period
beginning March 2009 through maturity in
February 2014. Interest is charged based
on the one month LIBOR plus 2.75%
(effective annual rate of approximately
2.98% at December 27, 2009). |
396,957 | 476,348 | ||||||
Note payable to a bank secured by the
property and equipment of AMC North Port,
Inc. as well as corporate and personal
guarantees of DRH, certain stockholders,
and various related parties. Scheduled
monthly principal and interest payments are
approximately $12,400 with annual interest
charged at 9.15%. The note matures in
November 2014. |
604,373 | 696,707 | ||||||
Note payable to a bank secured by the
property and equipment of AMC Riverview,
Inc. as well as corporate and personal
guarantees of DRH, certain stockholders,
and various related parties. Scheduled
monthly principal and interest payments are
approximately $12,200 with annual interest
charged at 8.67%. The note matures in
December 2014. |
611,531 | 704,449 | ||||||
Note payable to a bank secured by generally
all assets of Ann Arbor Burgers, Inc. as
well as personal guarantees of certain
stockholders, and various related parties.
Scheduled monthly principal and interest
payments are approximately $7,669.
Interest is charged at a fixed annual rate
of approximately 7.50%. The note matures
in December 2015. |
443,537 | 500,000 | ||||||
Obligation under capital leases (see note 9) |
693,196 | — | ||||||
Notes payable – related parties (see note 4) |
354,848 | 541,780 | ||||||
Total long-term debt |
$ | 6,004,651 | $ | 6,480,094 | ||||
Less current portion |
1,402,742 | 1,454,867 | ||||||
Long-term debt, net of current portion |
$ | 4,601,909 | $ | 5,025,227 | ||||
F-25
Table of Contents
DIVERSIFIED RESTAURANT HOLDINGS, INC. AND SUBSIDIARIES
NOTES TO CONSOLIDATED FINANCIAL STATEMENTS
DECEMBER 27, 2009 and DECEMBER 31, 2008
NOTES TO CONSOLIDATED FINANCIAL STATEMENTS
DECEMBER 27, 2009 and DECEMBER 31, 2008
Scheduled principal maturities of long-term debt for each of the five years succeeding
December 27, 2009 and thereafter are summarized as follows:
| Year | Amount | |||
2010 |
$ | 1,402,742 | ||
2011 |
1,076,968 | |||
2012 |
1,101,832 | |||
2013 |
952,990 | |||
2014 |
867,819 | |||
Thereafter |
602,300 | |||
Total |
$ | 6,004,651 | ||
Interest expense was $445,820 and $289,681 (including related party interest expense of
$22,624 in 2009 and $9,316 in 2008 — see Note 4) in the fiscal year ended December 27, 2009 and the
year ended December 31, 2008, respectively.
The above agreements contain various customary financial covenants generally based on the
performance of the specific borrowing entity and other related entities. The more significant
covenants consist of a minimum global debt service ratio, maximum global funded indebtedness to
EBITDA ratio and a Corporate Fixed Charge Coverage Ratio.
6. CAPITAL STOCK (INCLUDING PURCHASE WARRANTS AND OPTIONS)
On July 30, 2007, DRH granted options for the purchase of 150,000 shares of common stock to
the directors of the Company. These options vest ratably over a three year period and expire nine
years from issuance. Once vested, the options can be exercised at a price of $2.50 per share.
Stock option expense of $32,312 and $32,312, as determined using the Black-Scholes model, was
recognized during the fiscal year ended December 27, 2009 and the year ended December 31, 2008,
respectively, as compensation cost in the consolidated statements of operations and as additional
paid-in capital on the consolidated statement of stockholders’ equity to reflect the fair value of
shares vested as of December 27, 2009. The fair value of unvested shares, as determined using the
Black-Scholes model, is $18,899 as of December 27, 2009. The fair value of the unvested shares
will be amortized ratably over the remaining vesting term. The valuation methodology used an
assumed term based upon the stated term of three years, a risk-free rate of return represented by
the U.S. Treasury Bond rate and volatility factor of 0 based on the concept of minimum value as
defined in FASB ASC 718, Compensation–Stock Compensation. A dividend yield of 0% was used because
the Company has never paid a dividend and does not anticipate paying dividends in the reasonably
foreseeable future.
In October 2009, one member of the Board of Directors exercised 6,000 vested options at a
price of $2.50 per share.
On November 30, 2006, pursuant to a private placement, DRH issued warrants to purchase 800,000
common shares at a purchase price of $1 per share. These warrants vest over a three year period
from the issuance date and expire three years after issuance. The fair value of these warrants,
which totaled approximately $145,000 as determined using the Black-Scholes model, was recognized as
an offering cost in 2006. The valuation methodology used an assumed term based upon the stated
term of three years, a risk-free rate of return represented by the U.S. Treasury Bond rate and
volatility factor of 0 based on the concept of minimum value as defined in FASB ASC 505-50, Equity
Based Payments to Non-employees. A dividend yield of 0% was used because the Company has never
paid a dividend and does not anticipate paying dividends in the reasonably foreseeable future. An
extension of time to exercise warrants until December 31, 2009 was approved by resolution of the
disinterested directors of the Company. As of December 27, 2009, 550,000 warrants were exercised
at the option price of $1.
In the third quarter of 2008, the Company issued 140,000 common shares in exchange for
approximately $735,000 raised in connection with its initial public offering.
At December 27, 2009, 144,000 shares of authorized common stock are reserved for issuance to
provide for the exercise of the Company’s stock options.
F-26
Table of Contents
DIVERSIFIED RESTAURANT HOLDINGS, INC. AND SUBSIDIARIES
NOTES TO CONSOLIDATED FINANCIAL STATEMENTS
DECEMBER 27, 2009 and DECEMBER 31, 2008
NOTES TO CONSOLIDATED FINANCIAL STATEMENTS
DECEMBER 27, 2009 and DECEMBER 31, 2008
The Company has authorized 10,000,000 shares of preferred stock at a par value of $0.0001. No
preferred shares are issued or outstanding as of December 27, 2009. Any preferences, rights,
voting powers, restrictions, dividend limitations, qualifications, and terms and conditions of
redemption shall be set forth and adopted by a board of directors’ resolution prior to issuance of
any series of preferred stock.
7. INCOME TAXES
The (provision) benefit for income taxes consists of the following components for the fiscal
year ended December 27, 2009 and the year ended December 31, 2008:
| 2009 | 2008 | |||||||
Federal |
||||||||
Current |
$ | — | $ | — | ||||
Deferred |
(194,480 | ) | 361,839 | |||||
State |
||||||||
Current |
(17,427 | ) | — | |||||
Deferred |
(40,157 | ) | 158,938 | |||||
Income Tax (Provision) Benefit |
$ | (252,064 | ) | $ | 520,777 | |||
The (provision) benefit for income taxes is different from that which would be obtained by
applying the statutory federal income tax rate to loss before income taxes. The items causing this
difference are as follows:
| 2009 | 2008 | |||||||
Income tax (provision) benefit at federal statutory rate |
$ | (207,455 | ) | $ | 291,114 | |||
State income tax (provision) benefit |
(57,585 | ) | 158,938 | |||||
Permanent differences |
(32,111 | ) | (20,967 | ) | ||||
Tax credits |
93,500 | 59,920 | ||||||
Other |
(48,413 | ) | 31,772 | |||||
Income tax (provision) benefit |
$ | (252,064 | ) | $ | 520,777 | |||
Deferred income taxes reflect the net tax effects of temporary differences between the
carrying amounts of assets and liabilities for financial reporting purposes and the amounts used
for income tax purposes. The Company expects the deferred tax assets to be fully realizable within
the next several years. Significant components of the Company’s deferred income tax liabilities and
assets are summarized as follows:
| 2009 | 2008 | |||||||
Deferred tax assets: |
||||||||
Net operating loss carry forwards |
$ | 954,370 | $ | 1,028,689 | ||||
Deferred rent expense |
78,998 | 38,699 | ||||||
Start-up costs |
104,327 | 77,292 | ||||||
Tax credit carry-forwards |
164,366 | 69,260 | ||||||
Swap loss recognized for book |
56,970 | 86,289 | ||||||
Other — including state deferred tax assets |
193,781 | 270,244 | ||||||
Total deferred assets |
1,552,812 | 1,570,473 | ||||||
Deferred tax liabilities: |
||||||||
Other — including state deferred tax assets |
146,325 | 87,188 | ||||||
Tax depreciation in excess of book |
1,159,733 | 883,328 | ||||||
Total deferred tax liabilities: |
1,306,058 | 970,516 | ||||||
Net deferred income tax assets |
$ | 246,754 | $ | 599,957 | ||||
F-27
Table of Contents
DIVERSIFIED RESTAURANT HOLDINGS, INC. AND SUBSIDIARIES
NOTES TO CONSOLIDATED FINANCIAL STATEMENTS
DECEMBER 27, 2009 and DECEMBER 31, 2008
NOTES TO CONSOLIDATED FINANCIAL STATEMENTS
DECEMBER 27, 2009 and DECEMBER 31, 2008
If deemed necessary by management, the Company establishes valuation allowances in accordance
with the provisions of FASB ASC 740, Income Taxes. Management continually reviews realizability of
deferred tax assets and the Company recognizes these benefits only as reassessment indicates that
it is more likely than not that such tax benefits will be realized.
The Company expects to use net operating loss and general business tax credit carry-forwards
before their 20 year expiration. This belief is based upon the Company’s option to purchase the
nine affiliated restaurants currently managed by DRH. Net operating loss carry-forwards of
$273,141 and $2,533,830 will expire in 2029 and 2028, respectively. General business tax credits of
$93,500, $59,722 and $11,144 will expire in 2029, 2028 and 2027, respectively.
On January 1, 2007, the Company adopted the provisions of FASB ASC 740 regarding the
accounting for uncertainty in income taxes. There was no impact on the Company’s consolidated
financial statements upon adoption.
The Company classifies all interest and penalties as income tax expense. There are no accrued
interest amounts or penalties related to uncertain tax positions as of December 27, 2009.
In July 2007, the State of Michigan signed into law the Michigan Business Tax Act (“MBTA”),
replacing the Michigan Single Business Tax with a business income tax and a modified gross receipts
tax. This new tax took effect January 1, 2008, and, because the MBTA is based or derived from
income-based measures, the provisions of FASB ASC 740, Income Taxes, apply as of the enactment
date. The law, as amended, established a deduction to the business income tax base if temporary
differences associated with certain assets results in a net deferred tax liability as of December
31, 2007 (the year of enactment of this new tax). This deduction has a carry-forward period to at
least tax year 2029. This benefit amounts to $33,762.
The Company is a member of a unitary group with other parties related by common ownership
according to the provisions of the Michigan Business Tax Act. This group will file a single tax
return for all members. An allocation of the current and deferred MBT incurred by the unitary group
has been made based on an estimate of MBT attributable to the Company and has been reflected as
state income tax expense in the accompanying consolidated financial statements consistent with the
provisions of ASC 740.
The Company files income tax returns in the United States federal jurisdiction and various
state jurisdictions.
8. OPERATING LEASES (INCLUDING RELATED PARTY)
The Company leases its current office facilities under a lease which expires April 30, 2010.
The agreement requires rent to be paid in monthly installments of $3,835.
The Company renegotiated its lease for AMC Northport, Inc. Effective March 1, 2009, the base
rent is approximately $6,129, reduced from approximately $12,267, through February, 2011. For
consideration of the above rent modification, Diversified Restaurant Holdings, Inc. agrees to
guarantee the rent for a period of five years beginning March 1, 2009. The lease contains two (2)
five-year options to extend.
The Company renegotiated its lease for AMC Riverview, Inc. Effective April 1, 2009; the base
rent has been reduced to approximately $9,600 from approximately $12,800 through March, 2010. The
lease contains two (2) five-year options to extend.
F-28
Table of Contents
DIVERSIFIED RESTAURANT HOLDINGS, INC. AND SUBSIDIARIES
NOTES TO CONSOLIDATED FINANCIAL STATEMENTS
DECEMBER 27, 2009 and DECEMBER 31, 2008
NOTES TO CONSOLIDATED FINANCIAL STATEMENTS
DECEMBER 27, 2009 and DECEMBER 31, 2008
Berkley Burgers, Inc. has signed a lease for restaurant space from an entity related through
common ownership. The 15-year lease commenced in February 2008 and requires monthly payments of
approximately $6,300. This lease contains three (3) five-year options to extend.
AMC Grand Blanc, Inc. lease payments commenced March 2008 and require monthly payments of
approximately $10,300. The 10-year lease expires in 2018. This lease contains two (2) five-year
options to extend.
AMC Troy, Inc. and Ann Arbor Burgers, Inc. lease payments commenced in August 2008. Both
leases have ten year terms expiring in 2018 and monthly payments of approximately $13,750 and
$6,890, respectively. Each lease contains two (2) five-year options to extend.
AMC Petoskey, Inc.’s lease commenced in August 2008 under a 10 year term expiring in 2018.
Monthly lease payments of approximately $9,000 began in September 2009. This lease contains two
(2) five-year options to extend.
AMC Flint, Inc.’s lease commenced in December 2008 under a 10 year term expiring in 2018. The
lease requires monthly payments of approximately $4,800. This lease contains three (3) five-year
options to extend.
AMC Port Huron, Inc.’s lease commenced in June 2009 under a 10 year term expiring in 2019.
The lease requires monthly payments of approximately $6,500. This lease contains three (3)
five-year options to extend.
Troy Burgers, Inc. signed a lease for restaurant space in Novi, MI; the site of the third
Bagger Dave’s restaurant. The lease is not expected to commence until the first quarter of 2010.
The lease term is 10 years with two (2) five-year options to extend. Monthly lease payments will
be approximately $7,000 per month.
Total rent expense was $951,760 and $636,131 for the fiscal year ended December 27, 2009 and
the year ended December 31, 2008, respectively. Of these amounts, $83,488 and $76,351 for the
fiscal year ended December 27, 2009 and the year ended December 31, 2008, respectively, were paid
to a related party.
Scheduled future minimum lease payments for each of the five years and thereafter for
non-cancelable operating leases with initial or remaining lease terms in excess of one year at
December 27, 2009 are summarized as follows:
| Year | Amount | |||
2010 |
$ | 925,113 | ||
2011 |
953,115 | |||
2012 |
997,349 | |||
2013 |
1,046,209 | |||
2014 |
1,074,534 | |||
Thereafter |
4,277,584 | |||
Total |
$ | 9,273,904 | ||
9. CAPITAL LEASES
In January 2009, the Company entered into an agreement to sell and immediately lease back
various equipment and furniture at its Flint location. The lease requires 48 monthly payments of
approximately $10,854, including applicable taxes, with an option to purchase the assets under
lease for $100 at the conclusion of the lease. This transaction is reflected in the consolidated
financial statements as a capital lease with the assets recorded at their purchase price of
$427,902 and depreciated as purchased furniture and equipment, and the lease obligation is included
in long term debt at its present value.
In May 2009, the Company entered into an agreement to sell and immediately lease back various
equipment and furniture at its Port Huron location. The lease requires 48 monthly payments of
approximately $10,778, excluding applicable taxes, with an option to purchase the assets under
lease for $100 at the conclusion of the lease. This transaction is reflected in the consolidated
financial statements as a capital lease with the assets recorded at their purchase price of
$430,877 plus $31,041 of sales tax paid upfront and depreciated as purchased furniture and
equipment, and the lease obligation is included in long term debt at its present value.
F-29
Table of Contents
DIVERSIFIED RESTAURANT HOLDINGS, INC. AND SUBSIDIARIES
NOTES TO CONSOLIDATED FINANCIAL STATEMENTS
DECEMBER 27, 2009 and DECEMBER 31, 2008
NOTES TO CONSOLIDATED FINANCIAL STATEMENTS
DECEMBER 27, 2009 and DECEMBER 31, 2008
The following is a schedule by years of future minimum lease payments under the capital lease
together with the present value of the net minimum lease payments as of the date of the lease:
| Year | Amount | |||
2010 |
$ | 259,585 | ||
2011 |
259,585 | |||
2012 |
259,585 | |||
2013 |
43,112 | |||
2014 |
— | |||
Total minimum lease payments |
821,867 | |||
Less amount representing interest |
128,671 | |||
Present value of minimum lease payments |
$ | 693,196 | ||
10. COMMITMENTS AND CONTINGENCIES
The Company has management service agreements in place with nine Buffalo Wild Wings
restaurants located in Michigan and Florida. These management service agreements contain an option
that allows WINGS to purchase each restaurant for a price equal to a factor of twice the average
earnings before interest, taxes, depreciation, and amortization of the restaurant for the previous
three fiscal years less long term debt. This option may be exercised by the subsidiary up to and
including thirty days following the two-year anniversary date of the Company’s initial public
offering completed by the Company. The two year anniversary will occur on August 1, 2010. The
Company plans to exercise the option early and purchase the nine restaurants on February 1, 2010.
Such exercise has always been part of the Company’s strategic plan.
The Company assumed from a related entity an “Area Development Agreement” with Buffalo Wild
Wings, Inc. in which the Company undertakes to open 23 Buffalo Wild Wings restaurants within their
designated “development territory”, as defined by the agreement, by October 1, 2016. On December
12, 2008, this agreement was amended adding 9 additional restaurants and extending the date of
fulfillment to March 1, 2017. Failure to develop restaurants in accordance with the schedule
detailed in the agreement could lead to potential penalties of $50,000 for each undeveloped
restaurant, payment of the initial franchise fees for each undeveloped restaurant and loss of
rights to development territory. As of December 27, 2009, of the 32 restaurants required to be
opened, ten of these restaurants had been opened for business, seven of which are Company owned.
The Company is required to pay Buffalo Wild Wings, Inc. royalties (5% of net sales) and
advertising fund contributions (3% of net sales) for the term of the individual franchise
agreements. The Company incurred $775,098 and $424,411 in royalty expense in the fiscal year ended
December 27, 2009 and the year ended December 31, 2008 respectively. Advertising fund contribution
expenses were $459,087 and $244,561 in the fiscal year ended December 27, 2009 and the year ended
December 31, 2008, respectively.
The Company is required by its various Buffalo Wild Wings, Inc. franchise agreements to
modernize the restaurants during the term of the agreement. The individual agreements generally
require improvements between the fifth year and the tenth year to meet the most current design
model that Buffalo Wild Wings, Inc. has approved. The modernization costs can range from
approximately $50,000 to approximately $500,000 depending on the individual restaurant’s needs.
The Company is subject to ordinary, routine, legal proceedings, as well as demands, claims and
threatened litigation, which arise in the ordinary course of its business. The ultimate outcome of
any litigation is uncertain. While unfavorable outcomes could have adverse effects on the
Company’s business, results of operations and financial condition, management believes that the
Company is adequately insured and does not believe that any pending or threatened proceedings would
adversely impact the Company’s results of operations, cash flows or financial condition.
AMC Group, Inc., a wholly owned subsidiary of DRH, became a guarantor to an operating lease at
one of our Affiliated restaurants. The guarantee began April 1, 2009 and continues for four years.
The amount guaranteed is $115,733 in year 1, $136,533 in year 2 and $147,200 in years 3 and 4.
F-30
Table of Contents
DIVERSIFIED RESTAURANT HOLDINGS, INC. AND SUBSIDIARIES
NOTES TO CONSOLIDATED FINANCIAL STATEMENTS
DECEMBER 27, 2009 and DECEMBER 31, 2008
NOTES TO CONSOLIDATED FINANCIAL STATEMENTS
DECEMBER 27, 2009 and DECEMBER 31, 2008
11. SUPPLEMENTAL CASH FLOWS INFORMATION
Other Cash Flows Information
Cash paid for interest was $445,820 and $289,681 during the fiscal year ended December 27,
2009 and the year ended December 31, 2008, respectively.
Cash paid for income taxes was $0 and $0 during the fiscal year ended December 27, 2009 and
the fiscal year ended December 31, 2008, respectively.
Supplemental Schedule of Non-Cash Investing and Financing Activities
Capital expenditures of $858,779 were funded by capital lease borrowing during the fiscal year
ended December 27, 2009.
12. FAIR VALUE OF FINANCIAL INSTRUMENTS
As of December 27, 2009 and December 31, 2008, our financial instruments consisted of cash
equivalents, accounts receivable, accounts payable and debt. The fair value of cash equivalents,
accounts receivable, accounts payable and short term debt approximate their carrying value, due to
their short-term nature. Also, the fair value of Notes Payable — Related Parties approximates the
carrying value due to their short term maturities. As of December 27, 2009, our total debt, less
related party debt, was approximately $5.6 million and had a fair value of approximately $5.7
million. As of December 31, 2008, our total debt was approximately $5.9 million and had a fair
value of approximately $5.2 million. The Company estimates the fair value of its fixed-rate debt
using discounted cash flow analysis based on the Company’s incremental borrowing rate.
There was no impact for adoption of FASB ASC 820, Fair Value Measurements and Disclosures, to
the consolidated financial statements as of September 30, 2009. ASC 820 requires fair value
measurement to be classified and disclosed in one of the following three categories:
| • | Level 1: Unadjusted quoted prices in active markets that are accessible at the
measurement date for identical, unrestricted assets or liabilities. |
||
| • | Level 2: Quoted prices in markets that are not active or inputs which are observable,
either directly or indirectly, for substantially the full term of the asset or liability. |
||
| • | Level 3: Prices or valuation techniques that require inputs that are both significant to
the fair value measurement and unobservable (i.e., supported by little or no market
activity). |
Interest rate swaps held by the Company for risk management purposes are not actively traded.
The Company measures the fair value using broker quotes which are generally based on market
observable inputs including yield curves and the value associated with counterparty credit risk.
The interest rate swaps discussed in Notes 1 and 5 fall into the Level 2 category under the
guidance of ASC 820. The fair market value of the interest rate swaps as of December 27, 2009 was a
liability of $167,559, which is recorded in other liabilities on the consolidated balance sheet.
The fair value of the interest rate swaps at December 31, 2008 was a liability of $253,792.
Unrealized gain associated with interest rate swap positions in existence at December 27, 2009,
which are reflected in the statement of operations, totaled $86,233 for the fiscal year ended
December 27, 2009 and are included in other income/loss.
F-31
Table of Contents
DIVERSIFIED RESTAURANT HOLDINGS, INC. AND SUBSIDIARIES
NOTES TO CONSOLIDATED FINANCIAL STATEMENTS
DECEMBER 27, 2009 and DECEMBER 31, 2008
NOTES TO CONSOLIDATED FINANCIAL STATEMENTS
DECEMBER 27, 2009 and DECEMBER 31, 2008
13. SUBSEQUENT EVENTS
Subsequent to December 27, 2009, the Company acquired the nine affiliated Buffalo Wild Wings
restaurants it managed. On February 1, 2010, WINGS purchased each restaurant. Under the terms of
the Purchase Agreements, the purchase price for each of the Affiliated Restaurants was determined
by multiplying each company’s average annual earnings before interest, taxes, depreciation and
amortization (“EBITDA”), for the previous three (3) fiscal years (2007, 2008 and 2009) by two, and
subtracting the long-term debt of such company. Two of the Affiliated Restaurants did not have a
positive purchase price under the above formula. As a result, the purchase price for those
entities was set at $1.00 per membership interest percentage. The total purchase price for these
nine restaurants was $3,134,790. The acquisition of the Affiliated Restaurants was approved by
resolution of the disinterested directors of the Company, who determined that the acquisition terms
were at least as favorable as those that could be obtained
through arms-length negotiations with an unrelated party. The Company has paid the purchase price
for each of the Affiliated Restaurants to each selling shareholder by issuing an unsecured
promissory note for the pro rata value of the equity interest in the Affiliated Restaurants. The
promissory notes bear interest at 6% per year, mature on February 1, 2016, and are payable in
quarterly installments, with principal and interest fully amortized over six years.
Subsequent to December 27, 2009, and prior to January 1, 2010, the remaining 250,000 private
placement warrants were exercised at the option price of $1.
Subsequent to December 27, 2009, the Company opened its third Bagger Dave’s location in Novi,
MI. Troy Burgers, Inc. opened to the public on February 21, 2010.
Subsequent to December 27, 2009, the Company relocated its general offices to 27680 Franklin
Road, Southfield, MI, 48034. Effective March 1, 2010, the Company will occupy 5,340 square feet of
office space for a period of fifty-one (51) months with two (2) two-year options. Rent payments
begin May 1, 2010 at $4,450 per month.
Subsequent to December 27, 2009, the Company entered into an agreement to sell and immediately
lease back various equipment and furniture at its Novi Bagger Dave’s location. The lease requires
thirty-six (36) monthly payments of approximately $8,155 with an option to purchase the assets
under lease for $1 at the conclusion of the lease. This transaction will be reflected in the
consolidated financial statements as a capital lease with the assets recorded at their purchase
price of $250,000 and depreciated as purchased furniture and equipment and the lease obligation
will be included in long term debt at its present value.
The Company evaluated subsequent events for potential recognition and/or disclosure through
March 25, 2010, the date the consolidated financial statements were issued.
* * * * *
F-32