Attached files
U.S. SECURITIES AND EXCHANGE COMMISSION
Washington, D.C. 20549
FORM 10-Q
[X] QUARTERLY REPORT PURSUANT TO SECTION 13 OR 15(d) OF THE SECURITIES
EXCHANGE ACT OF 1934
For the quarterly period ended March 27, 2011
[_] TRANSITION REPORT PURSUANT TO SECTION 13 OR 15(d) OF THE SECURITIES
EXCHANGE ACT OF 1934
For the transition period from
DIVERSIFIED RESTAURANT HOLDINGS, INC.
(Exact name of registrant as specified in its charter)
|
Nevada
|
03-0606420
|
|
|
(State or other jurisdiction
of incorporation
or formation)
|
(I.R.S. employer
identification number)
|
27680 Franklin Road
Southfield, Michigan 48034
(Address of principal executive offices)
Issuer's telephone number: (248) 223-9160
Issuer's facsimile number: (248) 223-9165
No change
(Former name, former address and former
fiscal year, if changed since last report)
Indicate by check mark whether the registrant (1) has filed all reports required to be filed by Section 13 or 15(d) of the Securities Exchange Act of 1934 during the preceding 12 months (or for such shorter period that the registrant was required to file such reports), and (2) has been subject to such filing requirements for the past 90 days. Yes [X] No [ ]
Indicate by check mark whether the registrant is a shell company (as defined in Rule 12b-2 of the Exchange Act). Yes [ ] No [X]
APPLICABLE ONLY TO ISSUERS INVOLVED IN BANKRUPTCY PROCEEDINGS DURING THE PRECEDING FIVE YEARS
Indicate by check mark whether the registrant has filed all documents and reports required to be filed by Sections 12, 13 or 15(d) of the Securities Exchange Act of 1934 subsequent to the distribution of securities under a plan confirmed by a court. Yes [ ] No [ ]
APPLICABLE ONLY TO CORPORATE ISSUERS
Indicate the number of shares outstanding of each of the issuer's classes of common stock, as of the latest practicable date: 18,876,000 shares of $.0001 par value common stock outstanding as of May 16, 2011.
Indicate by check mark whether the registrant is a large accelerated filer, an accelerated filer, a non-accelerated filer, or a smaller reporting company. See the definitions of "large accelerated filer," "accelerated filer" and "smaller reporting company" in Rule 12b-2 of the Exchange Act. (Check one):
Large Accelerated Filer [ ] Accelerated Filer [ ]
Non-Accelerated Filer [ ] Smaller reporting company [X]
(Do not check if a smaller reporting company)
INDEX
|
PART I. FINANCIAL INFORMATION
|
1
|
|
Item 1. Financial Statements
|
1
|
|
Consolidated Balance Sheets
|
1
|
|
Consolidated Statements of Operations
|
2
|
|
Consolidated Statements of Stockholders' Equity (Deficit)
|
3
|
|
Consolidated Statements of Cash Flows
|
4
|
|
Notes to Interim Consolidated Financial Statements
|
5
|
|
Item 2. Management's Discussion and Analysis of Financial Condition and Results of Operations
|
17
|
|
Item 3. Quantitative and Qualitative Disclosure About Market Risks
|
23
|
|
Item 4. Controls and Procedures
|
23
|
|
PART II. OTHER INFORMATION
|
23
|
|
Item 1. Legal Proceedings
|
23
|
|
Item 1A. Risk Factors
|
24
|
|
Item 2. Unregistered Sales of Equity Securities and Use of Proceeds
|
24
|
|
Item 3. Defaults Upon Senior Securities
|
24
|
|
Item 5. Other Information
|
24
|
|
Item 6. Exhibits
|
24
|
i
PART I. FINANCIAL INFORMATION
Item 1. Financial Statements
|
DIVERSIFIED RESTAURANT HOLDINGS, INC. AND SUBSIDIARIES
|
||||||||
|
CONSOLIDATED BALANCE SHEETS (UNAUDITED)
|
||||||||
|
March 27
|
December 26
|
|||||||
|
ASSETS
|
2011
|
2010
|
||||||
|
Current assets
|
||||||||
|
Cash and cash equivalents
|
$ | 2,138,893 | $ | 1,358,381 | ||||
|
Accounts receivable
|
57,307 | - | ||||||
|
Inventory
|
379,784 | 339,059 | ||||||
|
Prepaid assets
|
126,706 | 209,708 | ||||||
|
Other current assets
|
- | 43,348 | ||||||
|
Total current assets
|
2,702,690 | 1,950,496 | ||||||
|
Property and equipment, net - restricted assets of VIE
|
1,480,437 | 1,487,993 | ||||||
|
Property and equipment, net
|
19,029,639 | 17,252,599 | ||||||
|
Intangible assets, net
|
1,043,601 | 975,461 | ||||||
|
Other long-term assets
|
69,791 | 80,099 | ||||||
|
Deferred income taxes
|
330,463 | 607,744 | ||||||
|
Total assets
|
24,656,621 | 22,354,392 | ||||||
|
LIABILITIES AND STOCKHOLDERS' EQUITY (DEFICIT)
|
||||||||
|
Current liabilities
|
||||||||
|
Current portion of long-term debt (including VIE debt of $89,414)
|
2,249,197 | 1,947,676 | ||||||
|
Accounts payable
|
1,215,998 | 1,388,397 | ||||||
|
Accrued liabilities
|
1,463,588 | 1,089,112 | ||||||
|
Deferred rent
|
159,257 | 127,075 | ||||||
|
Total current liabilities
|
5,088,040 | 4,552,260 | ||||||
|
Deferred rent
|
1,700,458 | 1,622,943 | ||||||
|
Other liabilities - interest rate swap
|
373,021 | 367,181 | ||||||
|
Long-term debt, less current portion (including VIE debt of $1,207,084 and $1,229,437, respectively)
|
16,884,565 | 15,936,193 | ||||||
|
Total liabilities
|
24,046,084 | 22,478,577 | ||||||
|
Commitments and contingencies (Notes 5, 9, and 11)
|
||||||||
|
Stockholders' equity (deficit)
|
||||||||
|
Common stock - $0.0001 par value; 100,000,000 shares authorized, 18,876,000
|
||||||||
|
shares issued and outstanding
|
1,888 | 1,888 | ||||||
|
Additional paid-in capital
|
2,653,285 | 2,631,304 | ||||||
|
Retained earnings (accumulated deficit)
|
(2,381,776 | ) | (3,096,017 | ) | ||||
|
Total DRH stockholders' equity (deficit)
|
273,397 | (462,825 | ) | |||||
|
Noncontrolling interest in VIE
|
337,140 | 338,640 | ||||||
|
Total stockholders' equity (deficit)
|
610,537 | (124,185 | ) | |||||
|
Total liabilities and stockholders' equity
|
$ | 24,656,621 | $ | 22,354,392 | ||||
The accompanying notes are an integral part of these interim consolidated financial statments
1
|
DIVERSIFIED RESTAURANT HOLDINGS, INC. AND SUBSIDIARIES
|
||||||||
|
CONSOLIDATED STATEMENTS OF OPERATIONS (UNAUDITED)
|
|
Three Months Ended
|
||||||||
|
March 27
|
March 28
|
|||||||
|
2011
|
2010
|
|||||||
|
Revenue
|
||||||||
|
Food and beverage sales
|
$ | 15,094,616 | $ | 10,715,878 | ||||
|
Total revenue
|
15,094,616 | 10,715,878 | ||||||
|
Operating expenses
|
||||||||
|
Compensation costs
|
4,226,553 | 3,036,997 | ||||||
|
Food and beverage costs
|
4,251,632 | 3,337,262 | ||||||
|
General and administrative
|
3,406,055 | 2,455,467 | ||||||
|
Pre-opening
|
254,136 | 105,258 | ||||||
|
Occupancy
|
796,534 | 765,650 | ||||||
|
Depreciation and amortization
|
775,361 | 604,889 | ||||||
|
Total operating expenses
|
13,710,271 | 10,305,523 | ||||||
|
Operating profit
|
1,384,345 | 410,355 | ||||||
|
Change in fair value of derivative instruments
|
(5,840 | ) | (470 | ) | ||||
|
Interest expense
|
(286,810 | ) | (169,263 | ) | ||||
|
Other income (expense), net
|
(28,966 | ) | 17,221 | |||||
|
Income before income taxes
|
1,062,729 | 257,843 | ||||||
|
Income tax provision
|
309,988 | 122,576 | ||||||
|
Net income
|
$ | 752,741 | $ | 135,267 | ||||
|
Less: Net income attributable to noncontrolling interest
|
$ | (38,500 | ) | 0 | ||||
|
Net income attributable to DRH
|
$ | 714,241 | $ | 135,267 | ||||
|
Basic earnings per share - as reported
|
$ | 0.04 | $ | 0.01 | ||||
|
Fully diluted earnings per share - as reported
|
$ | 0.04 | $ | 0.01 | ||||
|
Weighted average number of common shares
|
||||||||
|
outstanding
|
||||||||
|
Basic
|
18,876,000 | 18,870,505 | ||||||
|
Diluted
|
19,063,203 | 18,952,979 | ||||||
The accompanying notes are an integral part of these interim consolidated financial statements
2
|
DIVERSIFIED RESTAURANT HOLDINGS, INC. AND SUBSIDIARIES
|
||||||||||||||||||||||||
|
CONSOLIDATED STATEMENTS OF STOCKHOLDERS' EQUITY (DEFICIT) (UNAUDITED)
|
|
Retained
|
Accumulated
|
Total | ||||||||||||||||||||||||||
|
Additional
|
Earnings
|
Other
|
Stockholders'
|
|||||||||||||||||||||||||
|
Common Stock
|
Paid-in
|
(Accumulated
|
Comprehensive
|
Noncontrolling
|
Equity | |||||||||||||||||||||||
|
Shares
|
Amount
|
Capital
|
Deficit)
|
Income (Loss)
|
Interest
|
(Deficit)
|
||||||||||||||||||||||
|
Balances - December 26, 2010, as previously reported
|
18,876,000 | $ | 1,888 | $ | 2,631,304 | $ | (2,728,836 | ) | $ | (367,181 | ) | $ | - | $ | (462,825 | ) | ||||||||||||
|
Reclassification of fair value of interest rate swap (see Note 2)
|
- | - | - | (367,181 | ) | 367,181 | - | - | ||||||||||||||||||||
| Initial consolidation of VIE | - | - | - | - | - | 338,640 | 338,640 | |||||||||||||||||||||
|
Balances - December 26, 2010, as adjusted
|
18,876,000 | 1,888 | 2,631,304 | (3,096,017 | ) | - | 338,640 | (124,185 | ) | |||||||||||||||||||
|
Share-based compensation
|
- | - | 21,981 | - | - | - | 21,981 | |||||||||||||||||||||
|
Net income
|
- | - | - | 714,241 | - | 38,500 | 752,741 | |||||||||||||||||||||
|
Distributions
|
- | - | - | - | - | (40,000 | ) | (40,000 | ) | |||||||||||||||||||
|
Balances - March 27, 2011
|
18,876,000 | $ | 1,888 | $ | 2,653,285 | $ | (2,381,776 | ) | $ | - | $ | 337,140 | $ | 610,537 | ||||||||||||||
The accompanying notes are an integral part of these interim consolidated financial statements
3
|
DIVERSIFIED RESTAURANT HOLDINGS, INC. AND SUBSIDIARIES
|
||||||||
|
CONSOLIDATED STATEMENTS OF CASH FLOWS (UNAUDITED)
|
||||||||
|
Three Months Ended
|
||||||||
|
March 27
|
March 28
|
|||||||
|
2011
|
2010
|
|||||||
|
Cash flows from operating activities
|
||||||||
|
Net income
|
$ | 752,741 | $ | 135,267 | ||||
|
Adjustments to reconcile net income to
|
||||||||
|
net cash provided by operating activities
|
||||||||
|
Depreciation and amortization
|
775,361 | 570,013 | ||||||
|
Loss on disposal of property and equipment
|
23,875 | 34,875 | ||||||
|
Share-based compensation
|
21,981 | 8,078 | ||||||
|
Deferred income tax (provision) benefit
|
277,281 | (39,629 | ) | |||||
|
Changes in operating assets and liabilities that
|
||||||||
|
provided (used) cash
|
||||||||
|
Accounts receivable
|
(57,307 | ) | 376,675 | |||||
|
Inventory
|
(40,725 | ) | 5,131 | |||||
|
Prepaid assets
|
83,002 | 50,743 | ||||||
|
Other current assets
|
43,348 | 9,926 | ||||||
|
Intangible assets
|
(77,866 | ) | (73,117 | ) | ||||
|
Other long-term assets
|
10,308 | 33,688 | ||||||
|
Accounts payable
|
(172,399 | ) | (116,083 | ) | ||||
|
Accrued liabilities
|
374,476 | 117,101 | ||||||
|
Deferred rent
|
109,697 | 32,390 | ||||||
|
Net cash provided by operating activities
|
2,123,773 | 1,145,058 | ||||||
|
Cash flows from investing activities
|
||||||||
|
Purchases of property and equipment
|
(2,558,994 | ) | (607,877 | ) | ||||
|
Net cash used in investing activities
|
(2,558,994 | ) | (607,877 | ) | ||||
|
Cash flows from financing activities
|
||||||||
|
Proceeds from issuance of long-term debt
|
1,740,906 | 236,198 | ||||||
|
Repayments of long-term debt
|
(491,013 | ) | (771,329 | ) | ||||
|
Proceeds from issuance of common stock
|
- | 250,000 | ||||||
|
Change in fair value of derivative instruments
|
5,840 | 470 | ||||||
|
Distributions
|
(40,000 | ) | (552,861 | ) | ||||
|
Net cash provided by (used in) financing activities
|
1,215,733 | (837,522 | ) | |||||
|
Net increase (decrease) in cash and cash equivalents
|
780,512 | (300,341 | ) | |||||
|
Cash and cash equivalents, beginning of period
|
1,358,381 | 1,594,362 | ||||||
|
Cash and cash equivalents, end of period
|
$ | 2,138,893 | $ | 1,294,021 | ||||
The accompanying notes are an integral part of these interim consolidated financial statements
4
DIVERSIFIED RESTAURANT HOLDINGS, INC. AND SUBSIDIARIES
NOTES TO INTERIM CONSOLIDATED FINANCIAL STATEMENTS
1. BUSINESS AND SUMMARY OF SIGNIFICANT ACCOUNTING POLICIES
Nature of Business
Diversified Restaurant Holdings, Inc. (“DRH”) was formed on September 25, 2006. DRH and its wholly-owned subsidiaries, including AMC Group, Inc, (“AMC”), AMC Wings, Inc. (“WINGS”), and AMC Burgers, Inc. (“BURGERS”) develop, own, and operate Buffalo Wild Wings (“BWW”) restaurants located throughout Michigan and Florida and its own restaurant concept, Bagger Dave's Legendary Burger Tavern (“Bagger Dave's”), as detailed below.
The following organizational chart outlines the corporate structure of DRH and its wholly-owned subsidiaries. A brief textual description of the entities follows the organizational chart. DRH is incorporated in the State of Nevada. All other entities are incorporated or organized in the State of Michigan.
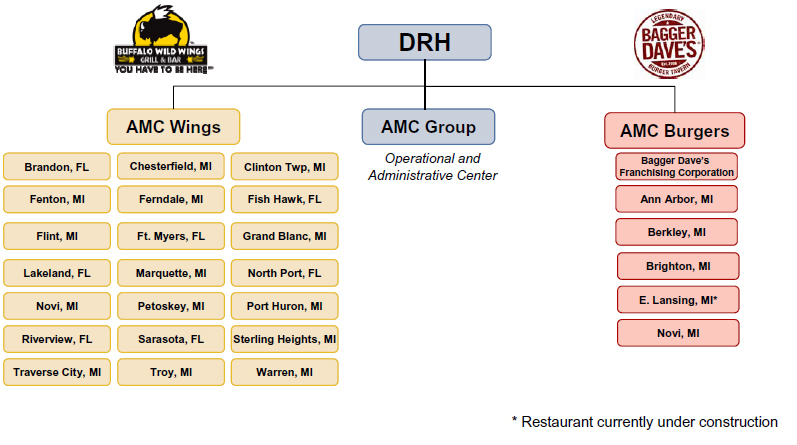
AMC was formed on March 28, 2007 and serves as the operational and administrative center for DRH. AMC renders management and advertising services to WINGS and its subsidiaries and BURGERS and its subsidiaries. Services rendered by AMC include marketing, restaurant operations, restaurant management consultation, hiring and training of management and staff, and other management services reasonably required in the ordinary course of restaurant operations.
WINGS was formed on March 12, 2007 and serves as a holding company for its BWW restaurants. WINGS, through its subsidiaries, holds 21 BWW restaurants that are currently in operation. WINGS also executed franchise agreements with Buffalo Wild Wings, Inc. (“BWWI”) to open an additional restaurant in Bradenton, Florida, which will be held in the WINGS portfolio under the name of AMC Sarasota, Inc.
5
WINGS is economically dependent on retaining its franchise rights with BWWI. The franchise agreements have specific initial term expiration dates ranging from October 23, 2011 through March 25, 2031, depending on the date each was executed and its initial term. The franchise agreements are renewable at the option of the franchisor and are generally renewable if the franchisee has complied with the franchise agreement. When factoring in any applicable renewals, the franchise agreements have specific expiration dates ranging from January 29, 2019 through March 25, 2046. WINGS is in compliance with the terms of these agreements at March 27, 2011. The Company is under contract with BWWI to enter into 17 additional franchise agreements by 2017 (see Note 11 for details). WINGS held an option to purchase the nine affiliated restaurants that were managed by AMC, which it exercised on February 1, 2010 (see Note 3 for details).
BURGERS was formed on March 12, 2007 to own the Bagger Dave's restaurants, a full-service, ultra-casual dining concept developed by the Company. BURGERS' subsidiaries, Berkley Burgers, Inc., Ann Arbor Burgers, Inc., Troy Burgers, Inc., and Brighton Burgers, Inc. own restaurants currently in operation in Berkley, Ann Arbor, Novi, and Brighton, Michigan, respectively. A location in E. Lansing, Michigan is currently under construction and is scheduled to open in the third quarter of 2011. BURGERS also has a wholly-owned subsidiary named Bagger Dave’s Franchising Corporation that was formed to act as the franchisor for the Bagger Dave’s concept. We have filed for rights to franchise in Michigan, Ohio, Indiana, Illinois, Wisconsin, and Kentucky but have not yet franchised any Bagger Dave's restaurants.
Principles of Consolidation
The consolidated financial statements include the accounts of DRH, its wholly-owned subsidiaries, and Ansley Group, LLC (collectively, the "Company"), a real estate entity under common control which is consolidated in accordance with Financial Accounting Standards Board ("FASB") guidance related to variable interest entities. All significant intercompany accounts and transactions have been eliminated upon consolidation.
We consolidate all variable-interest entities (VIEs) where we are the primary beneficiary. For VIEs, we assess whether we are the primary beneficiary as prescribed by the accounting guidance on the consolidation of VIEs. The primary beneficiary of a VIE is the party that has the power to direct the activities that most significantly impact the performance of the entity and the obligation to absorb losses or the right to receive benefits that could potentially be significant to the entity. We adopted the consolidation of variable-interest entities guidance issued in June 2009 effective January 1, 2011. We consolidated Ansley Group, LLC because we lease and maintain substantially all of its assets to operate our Clinton Township, Michigan BWW restaurant and we guarantee all of its debt.
Basis of Presentation
The consolidated financial statements as of March 27, 2011 and December 26, 2010, and for the three-month period ended March 27, 2011 and March 28, 2010, have been prepared by the Company pursuant to accounting principles generally accepted in the United States of America (“GAAP”) and the rules and regulations of the Securities and Exchange Commission (“SEC”). The financial information as of March 27, 2011 and for the three-month periods ended March 27, 2011 and March 28, 2010 is unaudited, but, in the opinion of management, reflects all adjustments and accruals necessary for a fair presentation of the financial position, results of operations, and cash flows for the interim periods.
Except as described in Note 2 to the consolidated financial statements, the financial information as of December 26, 2010 is derived from our audited consolidated financial statements and notes thereto for the fiscal year ended December 26, 2010, which is included in Item 8 in the Fiscal 2010 Annual Report on Form 10-K/A, Amendment No. 1, and should be read in conjunction with such financial statements.
The results of operations for the three-month period ended March 27, 2011 are not necessarily indicative of the results of operations that may be achieved for the entire year ending December 25, 2011.
Fiscal Year
The Company utilizes a 52- or 53-week accounting period that ends on the last Sunday in December. Consequently, fiscal year 2010 ended on December 26, 2010, comprising 52 weeks. This quarterly report on Form 10-Q is for the three-month period ended March 27, 2011, comprising 13 weeks.
6
Concentration Risks
Approximately 76% and 80% of the Company's revenues during the three months ended March 27, 2011 and March 28, 2010 are generated from food and beverage sales from restaurants located in Michigan.
Use of Estimates
The preparation of consolidated financial statements in conformity with GAAP requires management to make estimates and assumptions that affect the reported amounts of assets and liabilities and disclosure of contingent assets and liabilities at the date of the consolidated financial statements and the reported amounts of income and expenses during the reporting period. Actual results could differ from those estimates.
Financial Instrument
The Company utilizes interest rate swap agreements with a bank to fix interest rates on a portion of the Company's portfolio of variable rate debt, which reduces exposure to interest rate fluctuations. The Company does not use any other types of derivative financial instruments to hedge such exposures, nor does it use derivatives for speculative purposes.
On May 5, 2010, the Company entered into a $15 million dollar debt facility with RBS Citizens Bank, N.A. (“RBS”), as further described in Note 6, in which $6 million is in the form of a development line of credit (of which $1.4 million and $2.9 million were subsequently termed out and affixed to a fixed-rate swap arrangement) and $9 million is a senior secured term loan with a fixed-rate swap arrangement.
These interest rate swap agreements do not qualify for hedge accounting. As such, the Company records the change in the fair value of the swap agreements in change in fair value of derivative instruments on the consolidated statements of operations.
The Company records the fair value of its interest rate swaps on the balance sheet in other assets or other liabilities depending on the fair value of the swaps. The notional value of interest rate swap agreements in place at March 27, 2011 and December 26, 2010 was approximately $12.4 million and $9.8 ,million, respectively. The increase in the swap liability balance is the result of a $2.9 million interest rate swap entered into in March of 2011.
Recent Accounting Pronouncements
There were no accounting standards or interpretations issued or recently adopted that are expected to have a material impact on the Company’s financial position, operations, or cash flows.
Reclassifications
Certain reclassifications have been made to the prior year consolidated financial statements to conform to the current year's presentation.
7
2. STAFF ACCOUNTING BULLETIN NO. 108
During the three months ended March 27, 2011, the Company identified an error related to its 2010 accounting for its interest rate swap agreements. The Company has determined that its interest rate swap agreements effective May 2010 and September 2010 did not qualify for hedge accounting and, as a result, the 2010 change in the fair value of the swap agreements of $367,181 should have been reflected in the consolidated statement of operations as change in fair value of derivative instruments instead of in the consolidated statement of stockholders’ equity.
In addition, during the three months ended March 27, 2011, the Company determined that, as a result of its August 2010 guarantee of the mortgage obligations of Ansley Group, LLC, the Company should have consolidated Ansley Group, LLC into its financial statements as of and for the year ended December 26, 2010 in accordance with FASB guidance related to consolidating variable interest entities.
The Company assessed the materiality of these errors on its December 26, 2010 financial statements in accordance with the SEC’s Staff Accounting Bulletin (“SAB”) No. 99 and concluded that the errors were not material to that period. The Company also concluded that, had the errors been adjusted within its financial statements for the three months ended March 27, 2011, the impact of such adjustments would have been material to its financial statements for the period then ended and it expects the errors may be material to its full year 2011 results. In accordance with SAB No. 108, Considering the Effects of Prior Year Misstatements when Quantifying Misstatements in Current Year Financial Statements, the December 26, 2010 balance sheet has been revised to correct these errors.
The Company will make adjustments as appropriate to the corresponding quarterly and annual financial statements the next time it files those statements. The impact of the errors on the December 26, 2010 balance sheet is as follows:
|
Previously
Reported
|
Adjustment
|
As
Adjusted
|
||||||||||
|
Cash and cash equivalents
|
1,305,031 | 53,350 | 1,358,381 | |||||||||
|
Property and equipment, net - restricted assets of VIE
|
- | 1,487,993 | 1,487,993 | |||||||||
|
Other long-term assets
|
63,539 | 16,560 | 80,099 | |||||||||
|
Current portion of long-term debt
|
1,858,262 | 89,414 | 1,947,676 | |||||||||
|
Deferred rent (long-term)
|
1,722,531 | (99,588 | ) | 1,622,943 | ||||||||
|
Long-term debt, less current portion
|
14,706,756 | 1,229,437 | 15,936,193 | |||||||||
|
Retained earnings (accumulated deficit)
|
(2,728,836 | ) | (367,181 | ) | (3,096,017 | ) | ||||||
|
Accumulated other comprehensive income (loss)
|
(367,181 | ) | 367,181 | - | ||||||||
|
Noncontrolling interest in VIE
|
- | 338,640 | 338,640 | |||||||||
The Company's SAB 99 evaluation considered that the interest rate swap has no impact on the liability that was already recorded, would not impact 2010 results from operations, is non-cash in nature and is not material given the Company's overall volume of activity in 2010. Regarding consolidation of the Ansley Group, LLC the impact on the 2010 statement of operations would be insignificant and the 2010 balance sheet impact, disclosed in the table above, is not material given that the restaurant's operating results related to the assets that should have been consolidated were already included in operations and the potential debt obligation was previously disclosed. In the aggregate, the Company does not believe it is probable that the view of a reasonable investor would be changed by the correction in 2010 of these items.
8
3. SIGNIFICANT BUSINESS TRANSACTIONS
On February 1, 2010, the Company, through its WINGS subsidiary, acquired nine affiliated BWW restaurants it previously managed (“Affiliates Acquisition”). The Affiliates Acquisition was approved by resolution of the disinterested directors of the Company, who determined that the acquisition terms were at least as favorable as those that could be obtained through arms-length negotiations with an unrelated party. The Company paid the purchase price for each of the affiliated restaurants to each selling shareholder by issuing an unsecured promissory note for the pro-rata value of the equity interest in the affiliated restaurants. The promissory notes bear interest at 6% per year, mature on February 1, 2016, and are payable in quarterly installments, with principal and interest fully amortized over six years.
In accordance with FASB ASC 805-50, Business Combinations: Transactions Between Entities Under Common Control, the Company accounted for the Affiliates Acquisition, a transaction between entities under common control, as if the transaction had occurred at the beginning of the period (i.e., December 28, 2009) using the historical cost basis of the acquired affiliates. Further, prior years amounts also have been retrospectively adjusted to furnish comparative information while the entities were under common control.
4. PROPERTY AND EQUIPMENT
Property and equipment are comprised of the following assets:
|
March 27
|
December 26
|
|||||||
|
2011
|
2010
|
|||||||
| Land | $ | 385,959 | $ | 385,959 | ||||
| Land (restricted assets of VIE) | 520,000 | 520,000 | ||||||
| Building | 2,255,246 | 2,255,246 | ||||||
| Building (restricted assets of VIE) | 1,570,967 | 1,570,967 | ||||||
|
Equipment
|
9,269,706 | 8,140,417 | ||||||
|
Furniture and fixtures
|
2,592,628 | 2,216,347 | ||||||
|
Leasehold improvements
|
16,065,769 | 13,925,216 | ||||||
|
Restaurant construction in progress
|
- | 1,247,265 | ||||||
|
Total
|
32,660,275 | 30,261,417 | ||||||
|
Less accumulated depreciation
|
(11,539,669 | ) | (10,917,851 | ) | ||||
| Less accumulated depreciation attributable to restricted assets of VIE | (610,530 | ) | (602,974 | ) | ||||
|
Property and equipment, net
|
$ | 20,510,076 | $ | 18,740,592 | ||||
5. INTANGIBLES
Intangible assets are comprised of the following:
|
March 27
|
December 26
|
|||||||
|
2011
|
2010
|
|||||||
|
Amortized Intangibles:
|
||||||||
|
Franchise fees
|
$ | 373,750 | $ | 373,750 | ||||
|
Trademark
|
8,025 | 7,475 | ||||||
|
Loan fees
|
155,100 | 155,100 | ||||||
|
Total
|
536,875 | 536,325 | ||||||
|
Less accumulated amortization
|
(124,972 | ) | (115,246 | ) | ||||
|
Amortized Intangibles, net
|
411,903 | 421,079 | ||||||
|
Unamortized Intangibles:
|
||||||||
|
Liquor licenses
|
631,698 | 554,382 | ||||||
|
Total Intangibles, net
|
$ | 1,043,601 | $ | 975,461 | ||||
9
Amortization expense for the three months ended March 27, 2011 and March 28, 2010 was $9,726 and $7,053, respectively. Based on the current intangible assets and their estimated useful lives, amortization expense for fiscal years 2011, 2012, 2013, 2014, and 2015 is projected to total approximately $47,600 per year.
6. RELATED PARTY TRANSACTIONS
The Affiliates Acquisition (see Note 3) was accomplished by issuing unsecured promissory notes to each selling shareholder that bear interest at 6% per year, mature on February 1, 2016, and are payable in quarterly installments of approximately $157,000, with principal and interest fully amortized over six years.
Fees for monthly accounting and financial statement compilation services are paid to an entity owned by a director and stockholder of the Company. Fees paid during the three months ended March 27, 2011 and the three months ended March 28, 2010 were $69,355 and $60,434, respectively.
Current debt (see Note 7) also includes a promissory note to a DRH stockholder in the amount of $250,000. The note is a demand note that does not require principal or interest payments. Interest is accrued at 8% per annum and is compounded quarterly. The Company has 180 days from the date of demand to pay the principal and accrued interest.
See Note 10 for related party operating lease transactions.
7. LONG-TERM DEBT
Long-term debt consists of the following obligations:
10
|
March 27
|
December 26
|
|||||||
|
2011
|
2010
|
|||||||
|
Note payable to a bank secured by a senior lien on all company assets. Scheduled monthly principal and interest payments are approximately $120,000 through maturity in May 2017. Interest is charged based on a swap arrangement designed to yield a fixed annual rate of 7.10%.
|
$ | 8,142,197 | $ | 8,399,538 | ||||
|
Note payable to a bank secured by a senior mortgage on the Brandon Property and a personal guaranty. Scheduled monthly principal and interest payments are approximately $8,000 for the period beginning July 2010 through maturity in June 2030, at which point a balloon payment of $413,550 is due. Interest is charged based on a fixed rate of 6.72%, per annum, through June 2017, at which point the rate will adjust to the U.S. Treasury Securities Rate plus 4% (and every seven years thereafter).
|
1,136,351 | 1,141,188 | ||||||
|
Note payable to a bank secured by a junior mortgage on the Brandon Property. Matures in 2030 and requires monthly principal and interest installments of approximately $6,100 until maturity. Interest is charged at a rate of 3.58% per annum.
|
907,386 | 915,446 | ||||||
|
DLOC to a bank, secured by a senior lien on all company assets. Scheduled interest payments are charged at a rate of 4% over the 30-day LIBOR (the rate at March 27, 2011 was approximately 4.25%). In November 2011, the DLOC will convert into a term loan bearing interest at 4% over the 30-day LIBOR and will mature in May 2017. The DLOC includes a carrying cost of .25% per year of any available but undrawn amounts.
|
265,586 | 1,424,679 | ||||||
|
Note payable to a bank secured by a senior lien on all company assets. Scheduled monthly principal and interest payments are approximately $15,000 through maturity in May 2017. Interest is charged based on a swap arrangement designed to yield a fixed annual rate of 5.91%.
|
1,334,195 | 1,379,098 | ||||||
|
Note payable to a bank secured by a senior lien on all company assets. Scheduled monthly principal and interest payments are approximately $33,000 through maturity in May 2017. Interest is charged based on a swap arrangement designed to yield a fixed annual rate of 6.35%.
|
2,900,000 | - | ||||||
|
Unsecured note payable that matures in August 2013 and requires monthly principal and interest installments of approximately $2,200, with the balance due at maturity. Interest is 7% per annum.
|
239,423 | 241,832 | ||||||
|
Note payable to Ford Credit secured by a vehicle purchased by Flyer Enterprises, Inc. to be used in the operation of the business. This is an interest-free loan under a promotional 0% rate. Scheduled monthly principal payments are approximately $430. The note matures in April 2013.
|
10,729 | 12,016 | ||||||
|
Notes payable -- variable interest entity. Note payable to a bank secured by a senior mortgage on the property located at 15745 15 Mile Road, Clinton Township, Michigan 48035, a DRH corporate guaranty, and a personal guaranty. Scheduled monthly principal and interest payments are approximately $12,500 through maturity in 2025. Interest is charged at a rate of 4% over the 30-day LIBOR (the rate at March 27, 2011 was approximately 4.25%).
|
1,296,498 | 1,318,851 | ||||||
|
Notes payable – related parties
|
2,901,397 | 3,051,221 | ||||||
|
Total long-term debt
|
19,133,762 | 17,883,869 | ||||||
|
Less current portion (includes VIE debt of $89,414)
|
(2,249,197 | ) | (1,947,676 | ) | ||||
|
Long-term debt, net of current portion
|
$ | 16,884,565 | $ | 15,936,193 | ||||
11
Scheduled principal maturities of long-term debt for the next five years, and thereafter, are summarized as follows:
|
Year
|
Amount
|
|||
|
2011
|
$ | 2,249,197 | ||
|
2012
|
2,309,318 | |||
|
2013
|
2,680,751 | |||
|
2014
|
2,602,572 | |||
|
2015
|
2,768,131 | |||
|
Thereafter
|
6,523,793 | |||
|
Total
|
$ | 19,133,762 | ||
Interest expense was $286,810 and $169,733 (including related party interest expense of $57,080 and $7,534) for the three months ended March 27, 2011 and March 28, 2010, respectively.
On May 5, 2010, DRH entered into a credit facility (the “Credit Facility”) with RBS Citizens, N.A. (“RBS”), a national banking association. The Credit Facility consists of a $6 million development line of credit (“DLOC”) and a $9 million senior secured term loan (“Senior Secured Term Loan”). The Credit Facility is secured by a senior lien on all Company assets.
On August 30, 2010, Ansley Group, LLC entered into a $1.3 million mortgage refinance agreement with RBS. This agreement is secured by a senior mortgage on the property located at 15745 15 Mile Road, Clinton Township, Michigan 48035, a DRH corporate guaranty, and a personal guaranty. Ansley Group, LLC was formed for the sole purpose of acting as landlord for this property. DRH leases this property through its wholly-owned subsidiary, Bearcat Enterprises, Inc. In accordance with ASC 810, Ansley Group, LLC is considered a variable interest entity and, accordingly, its activities are consolidated into DRH’s interim consolidated financial statements.
The above agreements contain various customary financial covenants generally based on the performance of the specific borrowing entity and other related entities. The more significant covenants consist of a minimum debt service coverage ratio and a maximum lease adjusted leverage ratio, both of which we are in compliance with as of March 27, 2011.
8. CAPITAL STOCK (INCLUDING PURCHASE WARRANTS AND OPTIONS)
On July 31, 2010, DRH granted options for the purchase of 210,000 shares of common stock to the directors of the Company. These options vest ratably over a three-year period and expire six years from issuance. Once vested, the options can be exercised at a price of $2.50 per share.
Stock option expense of $21,981and $8,078, as determined using the Black-Scholes model, was recognized during the three months ended March 27, 2011 and March 28, 2010, as compensation cost in the consolidated statements of operations and as additional paid-in capital on the consolidated statement of stockholders' equity to reflect the fair value of shares vested as of March 27, 2011. The fair value of unvested shares, as determined using the Black-Scholes model, is $197,833 as of March 27, 2011. The fair value of the unvested shares will be amortized ratably over the remaining vesting term. The valuation methodology used an assumed term based upon the stated term of three years and a risk-free rate of return represented by the U.S. 5-year Treasury Bond rate and volatility factor of 30% based on guidance as defined in FASB ASC 718, Compensation–Stock Compensation. A dividend yield of 0% was used because the Company has never paid a dividend and does not anticipate paying dividends in the reasonably foreseeable future.
12
In October 2009, one member of the Board of Directors exercised 6,000 vested options at a price of $2.50 per share. Consequently, at March 27, 2011, 354,000 shares of authorized common stock are reserved for issuance to provide for the exercise of the Company’s stock options.
The Company has authorized 10,000,000 shares of preferred stock at a par value of $0.0001. No preferred shares are issued or outstanding as of March 27, 2011. Any preferences, rights, voting powers, restrictions, dividend limitations, qualifications, and terms and conditions of redemption shall be set forth and adopted by a board of directors' resolution prior to issuance of any series of preferred stock.
9. INCOME TAXES
The provision for income taxes consists of the following components for the three months ended March 27, 2011 and March 28, 2010, respectively:
|
Three Months Ended
|
||||||||
|
March 27
2011
|
March 28
2010
|
|||||||
|
Federal
|
||||||||
| Current | $ | - | $ | - | ||||
|
Deferred
|
223,988 | 105,137 | ||||||
|
State
|
||||||||
|
Current
|
32,707 | 50,101 | ||||||
|
Deferred
|
53,293 | (32,662 | ) | |||||
|
Income Tax Provision
|
$ | 309,988 | $ | 122,576 | ||||
The provision for income taxes is different from that which would be obtained by applying the statutory federal income tax rate to loss before income taxes. The items causing this difference are as follows:
|
March 27
2011
|
March 28
2010
|
|||||||
|
Income tax provision at federal statutory rate
|
$ | 350,733 | $ | 87,667 | ||||
|
State income tax provision
|
86,000 | 17,439 | ||||||
|
Permanent differences
|
37,707 | (34,581 | ) | |||||
|
Tax credits
|
(105,629 | ) | (35,000 | ) | ||||
|
Other
|
(58,823 | ) | 87,051 | |||||
|
Income tax provision
|
$ | 309,988 | $ | 122,576 | ||||
13
Deferred income taxes reflect the net tax effects of temporary differences between the carrying amounts of assets and liabilities for financial reporting purposes and the amounts used for income tax purposes. The Company expects the deferred tax assets to be fully realizable within the next several years. Significant components of the Company's deferred income tax assets and liabilities are summarized as follows:
|
March 27
2011
|
December 26
2010
|
|||||||
|
Deferred tax assets:
|
||||||||
|
Net operating loss carry forwards
|
$ | 694,200 | $ | 1,252,609 | ||||
|
Deferred rent expense
|
66,001 | 68,509 | ||||||
|
Start-up costs
|
190,075 | 190,076 | ||||||
|
Tax credit carry forwards
|
634,423 | 540,533 | ||||||
|
Other – including state deferred tax assets
|
595,006 | 487,139 | ||||||
|
Total deferred assets
|
2,179,705 | 2,538,866 | ||||||
|
Deferred tax liabilities:
|
||||||||
|
Other – including state deferred tax liabilities
|
340,294 | 425,322 | ||||||
|
Tax depreciation in excess of book
|
1,508,948 | 1,505,800 | ||||||
|
Total deferred tax liabilities
|
1,849,242 | 1,931,122 | ||||||
|
Net deferred income tax assets
|
$ | 330,463 | $ | 607,744 | ||||
If deemed necessary by management, the Company establishes valuation allowances in accordance with the provisions of FASB ASC 740, Income Taxes. Management continually reviews realizability of deferred tax assets and the Company recognizes these benefits only as reassessment indicates that it is more likely than not that such tax benefits will be realized.
The Company expects to use net operating loss and general business tax credit carryforwards before its 20-year expiration. A significant amount of net operating loss carry forwards were used when the Company purchased nine affiliated restaurants in 2010, which were previously managed by DRH. Net operating loss carry forwards of $2,041,765 will expire in 2028. General business tax credits of $105,628, $341,156, $122,850, $59,722 and $5,067 will expire in 2031, 2030, 2029, 2028 and 2027, respectively.
The Company applies the provisions of FASB ASC 740 (“ASC 740”), Income Taxes, regarding the accounting for uncertainty in income taxes. There are no amounts recorded on the Company's consolidated financial statements for uncertain positions. The Company classifies all interest and penalties as income tax expense. There are no accrued interest amounts or penalties related to uncertain tax positions as of March 27, 2011.
The Company files income tax returns in the United States federal jurisdiction and various state jurisdictions.
10. OPERATING LEASES (INCLUDING RELATED PARTY)
Lease terms range from four to 15 years, with renewal options, and generally require us to pay a proportionate share of real estate taxes, insurance, common area maintenance, and other operating costs. Some restaurant leases provide for contingent rental payments based on sales thresholds.
Total rent expense was $613,311 and $657,908 for the three months ended March 27, 2011 and March 28, 2010, respectively (of which $20,872 and $82,802, respectively, were paid to a related party).
14
Scheduled future minimum lease payments for each of the five years and thereafter for non-cancelable operating leases with initial or remaining lease terms in excess of one year at December 26, 2010 are summarized as follows:
|
Year
|
Amount
|
|||
|
2011
|
$ | 2,672,770 | ||
|
2012
|
2,790,753 | |||
|
2013
|
2,862,396 | |||
|
2014
|
2,730,112 | |||
|
2015
|
2,425,788 | |||
|
Thereafter
|
7,892,977 | |||
| Total | $ | 21,374,796 | ||
11. COMMITMENTS AND CONTINGENCIES
The Company assumed, from a related entity, an "Area Development Agreement" with BWWI in which the Company undertakes to open 23 BWW restaurants within its designated "development territory", as defined by the agreement, by October 1, 2016. On December 12, 2008, this agreement was amended adding nine additional restaurants and extending the date of fulfillment to March 1, 2017. Failure to develop restaurants in accordance with the schedule detailed in the agreement could lead to potential penalties of $50,000 for each undeveloped restaurant, payment of the initial franchise fees for each undeveloped restaurant, and loss of rights to development territory. As of March 27, 2011, of the 32 restaurants required to be opened, 15 of these restaurants had been opened for business.
The Company is required to pay BWWI royalties (5% of net sales) and advertising fund contributions (3% of net sales) for the term of the individual franchise agreements. The Company incurred $700,964 and $502,830 in royalty expense for the three months ended March 27, 2011 and March 28, 2010, respectively. Advertising fund contribution expenses were $416,040 and $316,064 for the three months ended March 27, 2011 and March 28, 2010, respectively.
The Company is required by its various BWWI franchise agreements to modernize the restaurants during the term of the agreements. The individual agreements generally require improvements between the fifth year and the tenth year to meet the most current design model that BWWI has approved. The modernization costs can range from approximately $50,000 to approximately $500,000 depending on the individual restaurants’ needs.
The Company is subject to ordinary, routine, legal proceedings, as well as demands, claims and threatened litigation, which arise in the ordinary course of its business. The ultimate outcome of any litigation is uncertain. While unfavorable outcomes could have adverse effects on the Company's business, results of operations, and financial condition, management believes that the Company is adequately insured and does not believe that any pending or threatened proceedings would adversely impact the Company's results of operations, cash flows, or financial condition.
12. SUPPLEMENTAL CASH FLOWS INFORMATION
Other Cash Flows Information
Cash paid for interest was $286,810 and $169,263 during the three months ended March 27, 2011 and March 28, 2010, respectively.
Cash paid for income taxes was $37,943 and $94,979 during the three months ended March 27, 2011 and March 28, 2010, respectively.
15
13. FAIR VALUE OF FINANCIAL INSTRUMENTS
The guidance for fair value measurements, ASC 820 Fair Value Measurements and Disclosures, establishes the authoritative definition of fair value, sets out a framework for measuring fair value, and outlines the required disclosures regarding fair value measurements. Fair value is the price that would be received to sell an asset or paid to transfer a liability (an exit price) in the principal or most advantageous market for the asset or liability in an orderly transaction between market participants at the measurement date. We use a three-tier fair value hierarchy based upon observable and non-observable inputs as follows:
|
•
|
Level 1 — Quoted market prices in active markets for identical assets and liabilities;
|
||
|
•
|
Level 2 — Inputs, other than level 1 inputs, either directly or indirectly observable; and
|
|
•
|
Level 3 — Unobservable inputs developed using internal estimates and assumptions (there is little or no market data) which reflect those that market participants would use.
|
As of March 27, 2011 and December 26, 2010, respectively, our financial instruments consisted of cash equivalents, accounts payable, and debt. The fair value of cash equivalents, accounts payable and short-term debt approximate its carrying value, due to its short-term nature.
The fair value of our interest rate swaps is determined based on valuation models, which utilize quoted interest rate curves to calculate the forward value and then discount the forward values to the present period. The Company measures the fair value using broker quotes which are generally based on market observable inputs including yield curves and the value associated with counterparty credit risk. Our interest rate swaps are classified as a Level 2 measurement as these securities are not actively traded in the market, but are observable based on transactions associated with bank loans with similar terms and maturities.
There were no transfers between levels of the fair value hierarchy during the three months ended March 27, 2011 and the fiscal year ended December 26, 2010, respectively.
The following table presents the fair values for those assets and liabilities measured on a recurring basis as of March 27, 2011:
|
FAIR VALUE MEASUREMENTS
|
||||||||||||||||||||
|
Asset/(Liability)
|
||||||||||||||||||||
|
Description
|
Level 1
|
Level 2
|
Level 3
|
Total
|
Total
|
|||||||||||||||
|
Interest Rate Swaps
|
$
|
—
|
(373,021
|
)
|
—
|
(373,021
|
)
|
$ |
(373,021
|
)
|
||||||||||
The following table presents the fair values for those assets and liabilities measured on a recurring basis as of December 28, 2010:
|
FAIR VALUE MEASUREMENTS
|
||||||||||||||||||||
|
Asset/(Liability)
|
||||||||||||||||||||
|
Description
|
Level 1
|
Level 2
|
Level 3
|
Total
|
Total
|
|||||||||||||||
|
Interest Rate Swaps
|
$
|
—
|
(367,181
|
)
|
—
|
(367,181
|
)
|
$ |
(367,181
|
)
|
||||||||||
As of March 27, 2011, our total debt, less related party debt, was approximately $14.9 million and had a fair value of approximately $14.2 million. As of December 26, 2010, our total debt, less related party debt, was approximately $13.5 million and had a fair value of approximately $11.8 million. Related party debt at March 27, 2011 and December 26, 2010 totaled $2,901,397 and $3,051,221, respectively. The Company estimates the fair value of its fixed-rate debt using discounted cash flow analysis based on the Company’s incremental borrowing rate.
16
Item 2. Management's Discussion and Analysis of Financial Condition and Results of Operations
(The following discussion and analysis of our financial condition and results of operations should be read in conjunction with our consolidated interim financial statements and related notes included in Item 1 of Part 1 of this Quarterly Report and the audited consolidated financial statements and related notes and Management’s Discussion and Analysis of Financial Condition and Results from Operations contained in our Form 10-K, as amended, for the fiscal year ended December 26, 2010.)
INFORMATION REGARDING FORWARD-LOOKING STATEMENTS
Statements contained in this “Quarterly Report on Form 10-Q” may contain information that includes or is based upon certain “forward-looking statements” relating to our business. These forward-looking statements represent management’s current judgment and assumptions, and can be identified by the fact that they do not relate strictly to historical or current facts. Forward-looking statements are frequently accompanied by the use of such words as “anticipates,” “plans,” “believes,” “expects,” “projects,” “intends,” and similar expressions. Such forward-looking statements involve known and unknown risks, uncertainties, and other factors, including, while it is not possible to predict or identify all such risks, uncertainties, and other factors, those relating to our ability to secure the additional financing adequate to execute our business plan; our ability to locate and start up new restaurants; acceptance of our restaurant concepts in new market places; the cost of food and other raw materials. Any one of these or other risks, uncertainties, other factors, or any inaccurate assumptions may cause actual results to be materially different from those described herein or elsewhere by us. We caution readers not to place undue reliance on any such forward-looking statements, which speak only as of the date they were made. Certain of these risks, uncertainties, and other factors may be described in greater detail in our filings from time to time with the Securities and Exchange Commission, which we strongly urge you to read and consider. Subsequent written and oral forward-looking statements attributable to us or to persons acting on our behalf are expressly qualified in their entirety by the cautionary statements set forth above and elsewhere in our reports filed with the Securities and Exchange Commission. We expressly disclaim any intent or obligation to update any forward-looking statements.
OVERVIEW
Diversified Restaurant Holdings, Inc. (“DRH” or the “Company”) is a leading Buffalo Wild Wings® ("BWW") franchisee that is rapidly expanding through organic growth and acquisitions. It operates 21 BWW restaurants; 14 in Michigan and seven in Florida. We plan to open an additional location in Bradenton, Florida during the second half of 2011. DRH also created and launched its own unique, full-service, ultra-casual restaurant concept, Bagger Dave’s Legendary Burger Tavern® (“Bagger Dave’s”), in January 2008. As of March 27, 2011, the Company owned and operated four Bagger Dave’s® restaurants in Southeast Michigan with the most recent store opening, in Brighton, Michigan, in February 2011. A fifth location is currently under construction and is scheduled to open during the third quarter of 2011. We also plan to franchise the Bagger Dave’s concept in Michigan, Indiana, Illinois, Ohio, Wisconsin, and Kentucky.
17
Our organic growth strategy is dependent on three key components. First is the continued development of our BWW concept as a franchisee. Under the terms of our current area development agreement, we expect to open two to three BWW stores each year through 2017 with a combined total of 38 by the end of 2017. Second is our continued development of our own Bagger Dave’s concept throughout Michigan and potentially in other areas in the Midwest consistent with the current capabilities of our supply base. We intend to open a total of three Bagger Dave’s restaurants in 2011 (one of which was opened in February) and, depending on our ability to find real estate and fund new development, we intend to open a minimum of three to five corporate stores each year for the next few years to come. Third is our push to franchise our Bagger Dave’s concept throughout the Midwest. We have made significant investments, including the hiring of a veteran in the franchise community, to seek qualified multi-unit operators, support the development of new franchisee-owned stores, and ultimately manage the franchisee system.
ACQUISITION OF NINE AFFILIATED BWW RESTAURANTS
On February 1, 2010, the Company, through its WINGS subsidiary, acquired nine affiliated BWW restaurants it previously managed (“Affiliates Acquisition”). The Affiliates Acquisition was approved by resolution of the disinterested directors of the Company, who determined that the acquisition terms were at least as favorable as those that could be obtained through arms-length negotiations with an unrelated party. The Company paid the purchase price for each of the affiliated restaurants to each selling shareholder by issuing an unsecured promissory note for the pro-rata value of the equity interest in the affiliated restaurants. The promissory notes bear interest at 6% per year, mature on February 1, 2016, and are payable in quarterly installments, with principal and interest fully amortized over six years.
In accordance with FASB ASC 805-50, Business Combinations: Transactions Between Entities Under Common Control, the Company accounted for the Affiliates Acquisition, a transaction between entities under common control, as if the transaction had occurred at the beginning of the period (i.e., December 28, 2009) using the historical cost basis of the acquired affiliates. Further, prior years amounts also have been retrospectively adjusted to furnish comparative information while the entities were under common control.
RESTAURANT OPENINGS
The following table outlines the restaurant unit information for the years indicated. “Total owned restaurants” reflects the number of restaurants owned and operated by DRH for each year. From the Company’s inception to February 1, 2010, it managed nine existing BWW restaurants that were owned by affiliated parties. On February 1, 2010, these restaurants were acquired by the Company. “Total managed restaurants” reflects the total number of restaurants managed and/or owned by the Company. 2009 comparative results are a consolidation of owned and managed restaurants based on the accounting of an acquisition of entities under common control (refer to Note 2 in the notes to consolidated financial statements for further details).
|
2011
|
2010
|
2009
|
2008
|
2007
|
||
|
Beginning of year
|
22
|
9
|
8
|
2
|
0
|
|
|
Acquisitions
|
0
|
9
|
0
|
0
|
0
|
|
|
Openings
|
3
|
4
|
1
|
6
|
2
|
|
|
Planned Openings
|
3
|
|||||
|
Total owned restaurants
|
28
|
22
|
9
|
8
|
2
|
|
|
Affiliate restaurants under common control
|
0
|
0
|
9
|
9
|
9
|
|
|
Total managed restaurants
|
28
|
22
|
18
|
17
|
11
|
|
18
RESULTS OF OPERATIONS
For the three months ended March 27, 2011 ("First Quarter 2011"), revenue was generated from the operations of 21 BWW restaurants (two of which opened in February 2011) and four Bagger Dave’s restaurants (one of which opened in late February 2011). For the three months ended March 28, 2010 ("First Quarter 2010"), revenue was generated from the operations of 16 BWW restaurants and three Bagger Dave’s restaurants (one of which opened in February 2010).
Our operating results below are expressed as a percentage of total revenue on the basis of comparison to prior periods.
|
Three Months Ended
|
||||||||
|
March 27
|
March 28
|
|||||||
|
2011
|
2010
|
|||||||
|
Total revenue
|
100.0 | % | 100.0 | % | ||||
|
Operating expenses
|
||||||||
|
Compensation costs
|
28.0 | % | 28.3 | % | ||||
|
Food and beverage costs
|
28.2 | % | 31.1 | % | ||||
|
General and administrative
|
22.6 | % | 22.9 | % | ||||
|
Pre-opening
|
1.7 | % | 1.0 | % | ||||
|
Occupancy
|
5.3 | % | 7.1 | % | ||||
|
Depreciation and amortization
|
5.1 | % | 5.6 | % | ||||
|
Total operating expenses
|
90.9 | % | 96.2 | % | ||||
|
Operating profit
|
9.2 | % | 3.8 | % | ||||
| Change in fair value of derivative instruments | 0.0 | % | 0.0 | % | ||||
|
Interest expense
|
(1.9 | %) | (1.6 | %) | ||||
|
Other income (expense), net
|
(0.2 | %) | 0.2 | % | ||||
|
Income before income taxes
|
7.1 | % | 2.4 | % | ||||
|
Income tax provision
|
2.1 | % | 1.1 | % | ||||
|
Net income
|
5.0 | % | 1.3 | % | ||||
19
Results of Operations for the Three Months Ended March 27, 2011 and March 28, 2010
Total revenue for First Quarter 2011 was $15.1 million, an increase of $4.4 million or 40.9% over the $10.7 million of revenue generated during First Quarter 2010. The increase was primarily attributable to two factors. First, approximately $3.9 million of the increase was attributable to revenues generated following the opening of three new restaurants in 2011 (one Bagger Dave’s restaurant and two BWW restaurants) and revenues generated by four restaurants (one Bagger Dave’s restaurant and three BWW restaurants) that opened prior to 2011 but did not meet the criteria for same-store sales for all or part of the three-month period. Second, we believe the remaining $481 thousand increase was related to a 1.4% increase in same-store sales for 16 BWW restaurants opened prior to 2010 and a 4.9% increase in same-store sales for two Bagger Dave’s restaurants opened prior to 2010.
Compensation cost increased by $1.2 million or 39.2% to $4.2 million in First Quarter 2011 from $3.0 million in First Quarter 2010. The increase was primarily due to the addition of seven restaurants. Compensation cost as a percentage of sales decreased to 28.0% in First Quarter 2011 from 28.3% in First Quarter 2010 primarily due to a reduction in hourly labor and because our proportional increase in revenue exceeded the increase of non-store level management compensation. This improvement was partially offset by early-stage hourly labor inefficiencies attributable to the opening of three new stores in February 2011.
Food and beverage cost increased by $900 thousand or 27.4% to $4.3 million in First Quarter 2011 from $3.3 million in First Quarter 2010. The increase was primarily due to the addition of seven restaurants. Food and beverage cost as a percentage of sales decreased to 28.2% in First Quarter 2011 from 31.1% in First Quarter 2010 primarily due to lower bone-in chicken wing prices, menu price increases and efficiencies in food preparation. This decrease was partially offset by increases in other food and beverage prices.
General and administrative cost increased by $950 thousand or 38.7% to $3.4 million in First Quarter 2011 from $2.5 million in First Quarter 2010. This increase was primarily due to the addition of seven restaurants. General and administrative cost as a percentage of sales decreased to 22.6% in First Quarter 2011 from 22.9% in First Quarter 2010 due to cost reduction initiatives and because the proportional increase in revenue was greater than that of non-store level general and administrative overhead expenses.
Pre-opening cost increased by $150 thousand or 141.4% to $250 thousand in First Quarter 2011 from $100 thousand in First Quarter 2010. This increase was due to the Company opening three stores in February 2011 versus one store in February 2010. Pre-opening cost as a percentage of sales increased to 1.7% in First Quarter 2011 from 1.0% in First Quarter 2010 for the same reason.
Occupancy cost increased by $31 thousand or 4.0% to $800 thousand in First Quarter 2011 from $766 thousand in First Quarter 2010. This increase was primarily due to the addition of seven new stores. Occupancy cost as a percentage of sales decreased to 5.3% in First Quarter 2011 from 7.1% in First Quarter 2010 primarily due to the Company taking advantage of the favorable real estate market through a combination of securing lower than average lease rates for all seven new stores and rent reductions at existing locations.
Depreciation and amortization cost increased by $170 thousand or 28.2% to $775 thousand in First Quarter 2011 from $605 thousand in First Quarter 2010. This increase was primarily due to the addition of seven restaurants. Depreciation and amortization cost as a percentage of sales decreased to 5.1% in First Quarter 2011 from 5.6% in First Quarter 2010 primarily due to the fact that depreciation and amortization cost, for the nine stores acquired in First Quarter 2010, was spread over a revenue period of 87 days in 2010 vs. a period of 91 days in 2011.
INTEREST AND TAXES
Interest expense was $286,810 and $169,263 during First Quarter 2011 and First Quarter 2010, respectively. The significant increase is due to the new debt facility effective May of 2010 and new borrowing.
For First Quarter 2011, we booked an income tax provision of $309,988 compared to First Quarter 2010 when an income tax provision of $122,576 was recorded. The effective tax rate of income before taxes was 30.1% for First Quarter 2011 vs. 47.5% for First Quarter 2010. The First Quarter 2010 income tax rate was higher due to the effects of the Affiliates Acquisition.
20
LIQUIDITY AND CAPITAL RESOURCES; EXPANSION PLANS
Our primary liquidity and capital requirements are for new restaurant construction, remodeling of existing restaurants, and other general business needs. We intend to fund up to 70% of the construction and start-up costs of future BWW restaurants and up to 60% of the construction and start-up costs of future Bagger Dave’s restaurants with a $7.0 million development line of credit that we anticipate renewing in June 2011 with RBS Charter One. We expect this facility to have similar terms as our existing $6.0 million DLOC effective May 2010. We expect to meet all remaining capital requirements from operational cash flow. We believe that the cash flow from operations and the development line of credit will be sufficient to meet our operational funding, development and obligations for the foreseeable future. However, to provide additional certainty that our liquidity requirements will be met, we have secured a $1.0 million line of credit for working capital which will be effective in June 2011, in conjunction with the $7.0 million DLOC. We do not anticipate drawing on this line.
Cash flow from operations for First Quarter 2011 was $2.1 million compared with $1.1 million for First Quarter 2010.
Total capital expenditures for fiscal year 2011 are expected to be approximately $9.1 million, of which approximately $7.2 million is for new restaurant construction, $0.6 million is for real estate, and $1.3 million is for existing store renovations, which includes a remodel, an addition, upgrades to audio/visual equipment and patio upgrades.
Opening new restaurants is the Company’s primary use of capital and is critical to its growth. Our completed and planned new construction for 2011 includes:
|
·
|
Traverse City, Michigan – BWW – opened February 7, 2011.
|
|
·
|
Lakeland, Florida – BWW – opened February 13, 2011.
|
|
·
|
Brighton, Michigan – Bagger Dave’s – opened February 27, 2011.
|
|
·
|
E. Lansing, Michigan – Bagger Dave’s - construction began in May of 2011 with an anticipated opening date in September of 2011.
|
|
·
|
West Michigan area – Bagger Dave’s - construction is scheduled to begin in August of 2011 with an anticipated opening date in December of 2011.
|
|
·
|
Bradenton, Florida – BWW – construction is scheduled to begin in September of 2011 with an anticipated opening date in December of 2011.
|
Although investments in new stores are an integral part of our strategic and capital expenditures plan, we also believe that reinvesting in existing stores is an important factor and necessary to maintain the overall positive dining experience for our guests. Depending on the age of the existing stores, upgrades range from $50 thousand on the interior to $500 thousand for a full remodel of the restaurant. Stores are typically upgraded after approximately five years of operation and fully remodeled after approximately 10 years of operation.
Mandatory Upgrades:
| • |
Per a Franchise Agreement dated July 29, 2010 by and between BWWI and Anker, Inc., a wholly-owned subsidiary of the Company, we are obligated to complete a full remodel of our Fenton, Michigan location by August 31, 2011. Estimated cost of this remodel is $450 thousand dollars, which we plan to commence in June 2011. This remodel will be funded by cash from operations.
|
21
Discretionary Upgrades:
In fiscal year 2011, the Company anticipates investing additional capital to upgrade up to seven existing locations, all of which will be funded by cash from operations. The precise timing and amounts will vary but we expect these upgrades to each range in cost from $65 - $100 thousand dollars. These improvements will primarily consist of audio/video equipment upgrades and outdoor patio upgrades. The following is a listing of completed and scheduled upgrades:
|
•
|
Clinton Township, Michigan — BWW — in February 2011, we completed a remodel of this location funded by cash from operations in the amount of $72 thousand dollars. This remodel was discretionary and consisted primarily of audio/video equipment upgrades and a freshening up of the interior to enhance the guest experience.
|
||
|
•
|
Sarasota, Florida — BWW — in February 2011, we completed a remodel of this location funded by cash from operations in the amount of $56 thousand dollars. This remodel was discretionary and consisted primarily of audio/video equipment upgrades and a freshening up of the interior to enhance the guest experience.
|
||
| • | Brandon, Florida — BWW — in February 2011, we completed a remodel of this location funded by cash from operations in the amount of $55 thousand dollars. This remodel was discretionary and consisted primarily of audio/video equipment upgrades and a freshening up of the interior to enhance the guest experience. | ||
| • | Riverview, Florida — BWW — in March 2011, we completed a remodel of this location funded by cash from operations in the amount of $109 thousand dollars. This remodel was discretionary and consisted primarily of a patio upgrade which includes audio/video equipment and furniture. | ||
| • | Warren, Michigan — BWW — by July 2011, we anticipate completing a remodel of this location funded by cash from operations estimated at $130 thousand dollars. This remodel is discretionary and will consist primarily of audio/video equipment upgrades, new furniture and a freshening up of the interior to enhance the guest experience. | ||
| • | Fish Hawk, Florida— BWW — by July 2011, we anticipate completing a remodel of this location funded by cash from operations and estimated at $105 thousand dollars. This remodel is discretionary and will consist primarily of audio/video equipment upgrades and a freshening up of the interior to enhance the guest experience. | ||
| • | Berkley, Michigan — BWW — by August 2011, we anticipate completing an addition to this location funded by cash from operations and estimated at $345 thousand dollars. This addition is discretionary and will consist of an 800 sq. ft. addition to accommodate 48 additional seats, a new draft beer system and cooler and new manager’s office. This addition will require the demolition of a neighboring building which provides increased visibility of the restaurant, an improved parking plan and a monument sign. |
22
Our Credit Facility has debt covenants that have to be met on a quarterly basis. As of March 27, 2011, we are in compliance with all of the covenants.
Item 3. Quantitative and Qualitative Disclosure About Market Risks
Item 4. Controls and Procedures
We are required to maintain disclosure controls and procedures designed to ensure that material information related to us, including our consolidated subsidiaries, is recorded, processed, summarized and reported within the time periods specified in the SEC rules and forms. Management does not expect that our disclosure controls and procedures or our internal control over financial reporting will prevent or detect all error and fraud. Any control system, no matter how well designed and operated, is based upon certain assumptions and can provide only reasonable, not absolute, assurance that its objectives will be met. Further, no evaluation of controls can provide absolute assurance that misstatements due to error or fraud will not occur or that all control issues and instances of fraud, if any, within the Company have been detected.
Conclusion Regarding the Effectiveness of Disclosure Controls and Procedures
As of March 27, 2011, an evaluation was performed under the supervision of and with the participation of our management, including our principal executive and principal financial officers, of the effectiveness of the design and operation of our disclosure controls and procedures. Based on that evaluation, our management, including our principal executive and principal financial officers, concluded that our disclosure controls and procedures were effective as of March 27, 2011.
(b) Changes in internal controls over financial reporting.
There were no changes in the Company’s internal control over financial reporting during the quarter ended March 27, 2011 that have materially affected, or are reasonably likely to materially affect the Company’s internal control over financial reporting.
Our process for evaluating controls and procedures is continuous and encompasses constant improvement of the design and effectiveness of established controls and procedures and the remediation of any deficiencies that may be identified during this process.
PART II. OTHER INFORMATION
Item 1. Legal Proceedings
Occasionally, we are a defendant in litigation arising in the ordinary course of our business, including claims arising from personal injuries, contract claims, dram shop claims, employment-related claims, and claims from guests or employees alleging injury, illness, or other food quality, health, or operational concerns. To date, none of these types of litigation, most of which are typically covered by insurance, has had a material effect on our financial condition or results of operations. We have insured and continue to insure against most of these types of claims. A judgment on any claim not covered by or in excess of our insurance coverage could materially adversely affect our financial condition or results of operations.
23
Item 1A. Risk Factors
There have been no material changes in our risk factors from those previously disclosed in our annual report on Form 10-K, as amended, for the year ended December 26, 2010.
Item 2. Unregistered Sales of Equity Securities and Use of Proceeds
Not Applicable.
Item 3. Defaults Upon Senior Securities
Item 5. Other Information
Item 6. Exhibits
(a) Exhibits:
|
3.1
|
Certificate of Incorporation (filed as an exhibit to the Company's Registration Statement on Form S-1, as filed with the Securities and Exchange Commission on August 10, 2007, and incorporated herein by this reference).
|
|
3.2
|
By-Laws (filed as an exhibit to the Company's Registration Statement on Form S-1, as filed with the Securities and Exchange Commission on August 10, 2007, and incorporated herein by this reference).
|
|
10.1
|
Consulting Agreement between the Company and P. Freidman & Associates dated March 15, 2011.
|
|
10.2
|
Buffalo Wild Wings Franchise Agreement dated March 25, 2011, by and between Buffalo Wild Wings International, Inc. and AMC Sarasota Inc., a wholly-owned subsidiary of the Company (filed as an exhibit to the Company’s Current Report on Form 8-K filed with the Securities and Exchange Commission on March 30, 2011, and incorporated herein by this reference).
|
|
31.1
|
Certification of Chief Executive Officer pursuant to Rule 13a-14(a).
|
|
31.2
|
Certification Chief Financial Officer pursuant to Rule 13a-14(a).
|
|
32.1
|
Certification Chief Executive Officer pursuant to Section 906 of Sarbanes Oxley Act of 2002.
|
|
32.2
|
Certification Chief Financial Officer pursuant to Section 906 of Sarbanes Oxley Act of 2002.
|
24
SIGNATURES
In accordance with Section 13 or 15(d) of the Exchange Act, the registrant caused this report to be signed on its behalf by the undersigned, there unto duly authorized.
| DIVERSIFIED RESTAURANT HOLDINGS, INC. | ||||
|
Dated: May 16, 2011
|
By: /s/ T. Michael Ansley
|
|||
|
|
T. Michael Ansley
President and Chief Executive Officer
(Principal Executive Officer)
|
|||
| By: /s/ David G. Burke | ||||
| David G. Burke
Chief Financial Officer and Treasurer
(Principal Financial and Accounting Officer)
|
25