Attached files
| file | filename |
|---|---|
| EX-21 - VirtualScopics, Inc. | v178262_ex21.htm |
| EX-32.1 - VirtualScopics, Inc. | v178262_ex32-1.htm |
| EX-31.2 - VirtualScopics, Inc. | v178262_ex31-2.htm |
| EX-23.1 - VirtualScopics, Inc. | v178262_ex23-1.htm |
| EX-31.1 - VirtualScopics, Inc. | v178262_ex31-1.htm |
| EX-32.2 - VirtualScopics, Inc. | v178262_ex32-2.htm |
UNITED
STATES
SECURITIES
AND EXCHANGE COMMISSION
WASHINGTON, D.C.
20549
Form
10-K
¨ ANNUAL
REPORT PURSUANT TO SECTION 13 OR 15(d) OF THE SECURITIES
EXCHANGE
ACT OF 1934
For
the fiscal year ended December 31, 2009
OR
¨
TRANSITION REPORT PURSUANT TO SECTION 13 OR 15(d) OF THE
SECURITIES
EXCHANGE
ACT OF 1934
For
the transition period from ____ to____
Commission
file number: 000-52018
VIRTUALSCOPICS,
INC.
(Exact
name of registrant as specified in its charter)
|
DELAWARE
|
04-
3007151
|
|
(State
or other jurisdiction of incorporation or organization)
|
(I.R.S.
Employer Identification No.)
|
|
500
Linden Oaks, Rochester, New York
|
14625
|
|
(Address
of principal executive offices)
|
(Zip
Code)
|
(585)
249-6231
(Registrant's
Telephone Number, Including Area Code)
SECURITIES
REGISTERED PURSUANT TO SECTION 12(b) OF THE EXCHANGE ACT:
Common
Stock, $0.001 par value
NASDAQ
Capital Market
SECURITIES
REGISTERED PURSUANT TO SECTION 12(g) OF THE EXCHANGE ACT:
TITLE
OF EACH CLASS:
Indicate
by check mark if the registrant is a well-known seasoned issuer, as defined in
Rule 405 of the Securities Act.
|
¨
Yes x
No
|
Indicate
by check mark if the registrant is not required to file reports pursuant to
Section 13 or Section 15(d) of the Exchange Act.
|
¨
Yes x
No
|
Indicate
by check mark whether the registrant: (1) has filed all reports required to
be filed by Section 13 or 15(d) of the Securities Exchange Act of 1934
during the preceding 12 months (or for such shorter period that the
registrant was required to file such reports), and (2) has been subject to
such filing requirements for past 90 days. Yes ¨ndicate
by
Indicate
by check mark whether the registrant has submitted electronically and posted on
its corporate Web site, if any, every Interactive Data File required to be
submitted and posted pursuant to Rule 405 of Regulation S-T during the preceding
12 months (or for such shorter period that the registrant was required to submit
and post such files). * Yes ¨ or
No ¨.
*
Registrant is not yet required to submit Interactive Data Files pursuant to Rule
405 of Regulation S-T
Indicate
by check mark if disclosure of delinquent filers in response to Item 405 of
Regulation S-K is not contained herein, and will not be contained, to the
best of registrant's knowledge, in definitive proxy or information statements
incorporated by reference in Part III of this Form 10-K or any
amendment to this Form 10-K. ¨
Indicate
by check mark whether the registrant is a large accelerated filer, an
accelerated filer, a non-accelerated filer, or a smaller reporting
company. See definitions of “large accelerated filer,” “accelerated
filer” and “smaller reporting” in Rule 12b-2 of the Exchange Act.
|
Larger
accelerated filer ¨
|
Accelerated
filer ¨
|
|
Non-accelerated
filer ¨ (Do
not check if a smaller reporting company)
|
Smaller reporting company x |
Indicate
by check mark whether the registrant is a shell company (as defined in Rule
12b-2 of the Exchange Act). Yes ¨ or
No ¨n
The
aggregate market value of the issuer’s voting and non-voting common equity held
by non-affiliates of the issuer as of February 26, 2010 was approximately
$16,937,719 (calculated by excluding all shares held by executive officers,
directors and holders known to the registrant of five percent or more of the
voting power of the registrant's common stock, without conceding that such
persons are “affiliates” of the registrant for purposes of the federal
securities laws). This amount does not include any value for the
issuer’s series A preferred stock or series B preferred stock, for which there
is no established United States public trading market, or any value for the
common stock issuable upon conversion of shares of such preferred
stock.
As of
February 26, 2010, there were outstanding 25,579,810 shares of the issuer’s
common stock, $.001 par value.
Documents
Incorporated By Reference: Portions of the Company's Proxy Statement to be
delivered to the Company’s stockholders in connection with the Company’s 2010
Annual Meeting of Stockholders, which the Company plans to file with the
Securities and Exchange Commission pursuant to Regulation 14A promulgated
under the Securities Exchange Act of 1934, on or prior to April 30, 2010, are
incorporated by reference in Part III (Items 9, 10, 11, 12 and 14) of
this Form 10-K.
TABLE OF
CONTENTS
|
Page Numbers
|
|||
|
PART
I
|
|||
|
ITEM
1: Business
|
4
|
||
|
ITEM
1A: Risk Factors
|
16
|
||
|
ITEM
2: Properties
|
20
|
||
|
ITEM
3: Legal Proceedings
|
20
|
||
|
ITEM
4: Submission of Matters to a Vote of Security Holders
|
20
|
||
|
PART
II
|
|||
|
ITEM
5: Market For Registrant's Common Equity, Related Stockholder Matters and
Issuer Purchases of Equity Securities
|
21
|
||
|
ITEM
7: Management's Discussion and Analysis of Financial Condition and Results
of Operations
|
22
|
||
|
ITEM
8: Financial Statements and Supplementary Data
|
27
|
||
|
ITEM
9: Changes in and Disagreements with Accountants on Accounting and
Financial Disclosure
|
27
|
||
|
ITEM
9A: Controls and Procedures
|
27
|
||
|
ITEM
9B: Other Information
|
28
|
||
|
PART
III
|
|||
|
ITEM
10: Directors, Executive Officers and Corporate Governance
|
29
|
||
|
ITEM
11: Executive Compensation
|
29
|
||
|
ITEM
12: Security Ownership of Certain Beneficial Owners and Management and
Related Stockholder Matters
|
29
|
||
|
ITEM
13: Certain Relationships and Related Transactions, and Director
Independence
|
29
|
||
|
ITEM
14: Principal Accountant Fees and Services
|
29
|
||
|
PART
IV
|
|||
|
ITEM
15: Exhibits
|
29
|
PART
I
FORWARD-LOOKING
STATEMENTS
Some of
the statements under the captions of this report on Form 10-K titled “Risk
Factors,” “Management's Discussion and Analysis of Financial Condition and
Results of Operations” or “Business,” contained or incorporated by reference
elsewhere in this report, and in our other reports filed with the Securities
Exchange Commission (“SEC”) constitute “forward-looking statements” within the
meaning of Section 27A of the Securities Act of 1933, as amended, and Section
21E of the Securities Exchange Act of 1934, as amended, which involve risks and
uncertainties. These statements are made pursuant to the safe harbor provisions
of the Private Securities Litigation Reform Act of 1995. These
forward-looking statements include statements that address activities, events or
developments that we expect, believe or anticipate may occur in the future,
including:
|
|
·
|
adverse
economic conditions;
|
|
|
·
|
unexpected
costs, lower than expected sales and revenues, and operating
defects;
|
|
|
·
|
adverse
results of any legal proceedings;
|
|
|
·
|
the
volatility of our operating results and financial
condition;
|
|
|
·
|
inability
to attract or retain qualified senior management personnel, including
sales and marketing, and scientific
personnel;
|
|
|
·
|
inability
to raise sufficient additional capital to operate our business, if
necessary, and;
|
|
|
·
|
other
specific risks that may be referred to in this
report.
|
All
statements, other than statements of historical facts, included in this report
regarding our strategy, future operations, financial position, estimated revenue
or losses, projected costs, prospects and plans and objectives of management are
forward-looking statements. When used in this report, the words
“may,” “believe,” “anticipate,” “intend,” “estimate,” “expect,” “project,”
“plan,” “could,” “would” and similar expressions are intended to identify
forward-looking statements, although not all forward-looking statements contain
such identifying words. All forward-looking statements speak only as
of the date of this report. We do not undertake any obligation to
update any forward-looking statements or other information contained in this
report. Existing stockholders and potential investors should not
place undue reliance on these forward-looking statements. Although we believe
that our plans, intentions and expectations reflected in or suggested by the
forward-looking statements in this report are reasonable, we cannot assure our
stockholders or potential investors that these plans, intentions or expectations
will be achieved. We disclose important factors that could cause our
actual results to differ materially from our expectations under “Risk Factors”
and elsewhere in this report. These risk factors qualify all
forward-looking statements attributable to us or persons acting on our
behalf.
Information
regarding market and industry statistics contained in this report is included
based on information available to us that we believe is accurate. It
is generally based on academic and other publications that are not produced for
purposes of securities offerings or economic analysis. We have not
reviewed or included data from all sources, and we cannot assure our
stockholders or potential investors of the accuracy or completeness of the data
included in this report. Forecasts and other forward-looking
information obtained from these sources are subject to the same qualifications
and the additional uncertainties accompanying any estimates of future market
size, revenue and market acceptance of products and services. We have
no obligation to update forward-looking information to reflect actual results or
changes in assumptions or other factors that could affect those
statements. See “Risk Factors” for a more detailed discussion of
uncertainties and risks that may have an impact on future results.
ITEM
1: Business
We are a
provider of quantitative imaging for clinical trials serving the pharmaceutical,
biotechnology and medical device industries. We have created a suite
of image analysis software tools and applications which are used in detecting
and measuring specific anatomical structures and metabolic activity using
medical images. Our proprietary software and algorithms provide
measurement capabilities designed to improve clinical research and development.
We focus on applying our imaging technology to improve the efficiency and
effectiveness of the pharmaceutical and medical device research and development
processes. We believe our technology can also be used in improving the treatment
planning for patients with cancer.
VirtualScopics,
LLC was formed in 2000. In November 2005, VirtualScopics, LLC (“VS”), a New York
limited liability company, entered into a merger agreement with ConsultAmerica,
Inc. (“CA”), a Delaware corporation. As a result of the exchange, the
members of VS became the controlling stockholders of CA. CA did not
have any meaningful operations prior to the merger. Immediately
following the merger, CA changed its name to VirtualScopics, Inc.
VirtualScopics, Inc. is a Delaware corporation and headquartered in Rochester,
New York.
Business
Overview
Our
image-based measurement and visualization tools enable automated, accurate and
reproducible measurement of minute changes that occur in anatomic structures in
musculoskeletal, oncological, cardiological and neurological
diseases. For pharmaceutical, biotechnology and medical device
manufacturers, these tools can significantly alleviate or reduce clinical
development bottlenecks by increasing the speed, accuracy and reliability of the
demonstration of a new compound’s efficacy. Further, these
measurements can be used to assess the viability of continuing a drug
development project and eliminate as soon as possible a drug that is likely to
fail. Early failure is critical to the pharmaceutical industry to
prevent the expenditure of R&D funds on a drug that will not perform as
expected. We believe that this is especially important today with the large
number of compounds that are awaiting evaluation.
We have
also begun pursuing the application of one of our technologies into the
personalized medicine market. Specifically, we believe there could be further
benefit of our blood flow and vascular permeability software tool in providing
patients and oncologists information to determine whether an anti-angiogenic
therapy is having the desired effect. We believe this application will better
assist oncologists with treatment planning for patients undergoing
anti-angiogenic cancer therapies. We have begun the regulatory process for
obtaining 510k clearance from the FDA. We will continue to assess the best
mechanism for channeling our application into the market as well as the process
for obtaining reimbursement from payers; however, there can be no assurance that
approval will be granted or we will experience significant demand for our
application.
Additionally,
in 2007, we received two awards totaling approximately $2.1 million for the
application of our technology with the United States Department of Defense in
the area of oblique hyper-spectral imagery, this work concluded in 2009. In 2009
and 2008, we recognized approximately $344,000 and $860,000, respectively, in
revenues related to our work with the Department of Defense.
Benefits
to Pharmaceutical, Biotech and Medical Device Companies
The
benefits to pharmaceutical companies from using our image analysis tools can
include shorter clinical development time, and earlier determination of the
effectiveness or ineffectiveness of a new drug or compound. Our
technology helps to curtail trials that are not likely to be beneficial and to
avoid mistaken termination of compounds that are likely to prove efficacious,
through:
|
|
·
|
improved
precision in the measurement of existing biomarkers resulting in shorter
observation periods, with beneficial cost savings within a clinical
trial;
|
|
|
·
|
new
biomarkers, which are better correlated with disease states, again
reducing trial length and therefore costs;
and
|
4
|
|
·
|
reduced
processing time for image data analysis through
automation.
|
In
addition, our technology reduces aggregate clinical development costs
through:
|
|
·
|
improved
precision of existing biomarkers, thus requiring smaller patient
populations and lower administrative costs;
and
|
|
|
·
|
new
biomarkers that serve as better correlates, leading to better early
screening and elimination of weak drug candidates in pre-clinical
trials.
|
Benefits
to Patients and Health Care Providers in Personalized Medicine
The
specific opportunities that we are pursuing within personalized medicine are
mostly related to the treatment monitoring of patients. Cancer is a leading
cause of death throughout much of the developed world, and technologies for
closely monitoring disease progression and response to treatment are currently
lacking. We believe this presents us with a significant market
opportunity.
In
personalized medicine, our technology is designed to offer physicians and
medical insurers better treatment planning of patients based on determination of
patient response to compounds or other treatment options. For
example, in oncology we have demonstrated the ability to determine whether
patients are showing response to an anti-angiogenic drug after only 48 hours of
treatment (Glenn Liu et al.,
“Dynamic Contrast-Enhanced Magnetic Resonance Imaging as a
Pharmacodynamic Measure of Response After Acute Dosing of AG-013736, an Oral
Angiogenesis Inhibitor, in Patients With Advanced Solid Tumors: Results From a
Phase I Study,” Journal of
Clinical Oncology, vol. 20, August 20, 2005).
We are
the first company able to provide blood flow and volume measurements for cancer
diagnosis and monitoring in a standardized and consistent way across multiple
institutions (Jerry M. Collins, “Imaging and Other Biomarkers in Early Clinical
Studies: One Step at a Time or Re-Engineering Drug Development?,” Journal of Clinical Oncology,
vol. 20, August 20, 2005). These measurements are vital for
assessing patient response to next-generation anti-angiogenic cancer
drugs.
During
2010, we plan to expand our assessment and commercialization efforts within this
market. We have begun a dialogue with the FDA to gather the Agency's feedback on
our services and validate our assumptions regarding regulatory approval. We also
intend to gain insight into the level of supporting data that will be necessary
to claim and demonstrate predictability. Based on this feedback we plan to
consider whether to do a staged approach with the regulatory approvals (i.e. not
include the predictability claim in our first approval) in order to begin
performing blood flow and vascular permeability measurements and collect any
necessary data to demonstrate and claim predictability. Also, during 2010, we
will engage consultants to assist in our efforts to commercialize this service.
We expect this will begin with a technology assessment, followed by further
verification of the economic and value propositions to the various impacted
groups. The next step will be to gather feedback from key opinion leaders within
oncology, insurance companies and pharmaceutical companies on their assessment
and utility of the service. We then plan to further our knowledge regarding the
various elements and hurdles of healthcare services in order to develop a solid
strategy and financial models of this market. Based on these results, we would
anticipate a resulting executable strategy on how best to navigate the complex
healthcare markets in order to drive adoption within the industry. At that time,
we will be able to estimate the level of capital, if any, that would be
necessary to enter this market.
Our
Technology Solution
Oncology
Applications
Automated
Measurement of Tumor Structure in Oncology
Rapid
determination of drug efficacy depends on precise measurement of tumor structure
and function. Yet current practices - direct measurement from films and
computer-aided tracing - can be time-consuming, inaccurate and highly variable.
Manual approaches often lead to false conclusions when tumors take on abnormal
shapes; where a two-dimensional analysis may indicate no change, a three
dimensional analysis may show a significant change in tumor volume. The RECIST
standard, still the primary imaging endpoint for assessing disease progression
or response to treatment in many types of cancer, measures structural changes in
tumors through a simple summation of longest diameters, limited to the axial
imaging plane. Originally developed for x-ray imaging, it fails to take
advantage of the far richer three dimensional information set available with
today's imaging technologies.
5
Our
semi-automated, statistically driven feature analysis provides greater
precision, higher throughput and less dependence on a particular reader than
manual tracing does. In retrospective analysis for a leading pharmaceutical
company, our volumetric measurement showed that tumors found to be stable under
RECIST actually were growing significantly. With our semi-automated analysis we
could have discovered the failure sooner and avoided the expense of funding the
next phase of clinical research. Conversely, volumetric measurement can greatly
accelerate clinical research by preventing mistaken kills and identifying
efficacious compounds sooner.
Innovation
in Image-Based Biomarkers
With a
multidisciplinary team of medical professionals (including staff radiologists),
scientists and software developers, we deliver unparalleled innovation in the
analysis of specific biomarkers. Measurements may include specific
FDA-acknowledged (RECIST and tumor volume) biomarkers as well as secondary or
exploratory endpoints such as cavitation/necrosis, or shape. By extracting
substantially more information from existing imaging modalities such as CT or
MRI, we believe we offer a more definite and efficient basis for determining the
course of clinical trials.
Measurement
of Blood Flow and Metabolic Activity
A growing
number of anti-cancer drugs both on the market (e.g., Iressa and Avastin) and
under development are designed to reduce the blood supply available to tumors,
thereby depriving them of the ability to grow and spread. During development,
these compounds require the ability to accurately measure blood flow and
vascular permeability in vivo,
in order to determine dose-response relationships and compound
efficacy. In the clinic, this same capability is necessary in order
to determine whether a particular patient is responding to
treatment. We have developed a method, using dynamic contrast
enhanced magnetic resonance imaging (DCE-MRI), to accomplish
this. This technique involves repeated imaging, generally every five
to ten seconds, for a period of several minutes before and after the injection
of a gadolinium-based, FDA-approved, contrast agent. Tracer
concentration changes over time can then be measured both in normal and
cancerous tissues, and based on this information parameters such as blood flow,
blood volume and vascular permeability can be derived. These
parameters have been shown to relate directly to the activity of
anti-angiogenesis and anti-vascular cancer drugs, and to allow the prediction of
response or failure after only a few days of treatment.
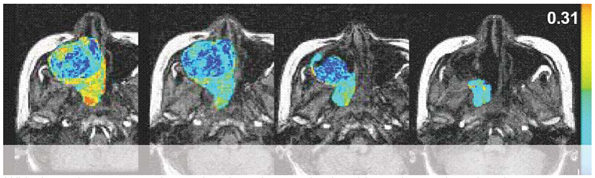
With
dynamic contrast-enhanced series, changes in signal intensity can be related to
tracer concentration in tissues. This information can be used to determine the
blood flow to the tumor.
Musculoskeletal
Applications
Our image
analysis provides a degree of accuracy and reproducibility that cannot be
duplicated by manual techniques. Standard endpoints, such as pain or
functionality scoring are largely subjective and difficult to reproduce. Our
quantitative imaging replaces subjective evaluation - knee pain ranked on a
scale of 1 to 10 - with an objective quantification - volume of lost cartilage
in cubic millimeters. Unlike manual assessment methods, our computer aided
approach allows you to track the boundary location of each structure in a data
set from one scan to another, even if the patient is not positioned in precisely
the same way for each scan, or if there have been some anatomical changes
between scans. For cartilage volumes and thickness measurements, the Coefficient
of Variation (CV) typically falls between 2% and 4% - we can detect minute
changes with statistical confidence, allowing our clients to reduce study
populations or shorten study durations.
6
With our
automated analysis, researchers can more confidently make the go/no go decision
for a compound early in the evaluation process, allowing scarce resources to be
allocated to the most promising candidates. In the evaluation of osteoarthritis,
for example, MRI of the cartilage in the knee coupled with automated measurement
of volume and composition shows disease changes in months; these changes would
not be apparent for years using standard x-ray evaluation.
Reproducible
medical image analysis is driven by computer image analysis algorithms that
enable quantitative measurement of different structural parameters. Guided by
the information present in the images, as well as embedded anatomical knowledge,
the algorithms enable segmentation of different structures. From an MRI knee
scan, for instance, it is possible to produce a three-dimensional reconstruction
that graphically distinguishes cartilage from underlying bone, as well as from
ligaments, fluid, degenerated menisci or inflamed synovium. This capability
provides a valuable assessment tool for clinical research in osteoarthritis - a
disease with multiple endpoints - because it allows sensitive and specific
measurement of all the components of the knee joint and detects small changes in
any of those components over time.
Medical
Device and Biologics
New
research continues to focus on the development of devices and/or biologics that
will generate new and better cartilage for patients with osteoarthritis and knee
injuries. Our technology uses a suite of tools to assist in the identification
of cartilage lesions within the knee. These tools allow for the tracking of
structural changes and the quality of new tissue being grown within those
lesions. For example, we are currently working with leading biologic
and medical device companies to determine the percent fill for lesions implanted
with the device/biologic. This analysis serves as a useful tool in that it
demonstrates the degree of success of the implant. It is presumed in
the industry that the higher the percent fill the lower the degree of pain for
the patient. We also provide quality of tissue assessments (i.e. T2
maps) to provide our customers with information on the composition of the repair
tissue. It is also believed that the closer the repair tissue is to ‘normal’
tissue the longer the life span is of the repair tissue with the resulting
benefit being the ultimate health and comfort of the patient.
Additionally,
our motion tracking software capabilities allows us to more precisely measure
changes in the structural and tissue quality measurements. It has been
demonstrated that this technique can reduce the amount of variability inherent
in these types of measurements, thereby, reducing the amount of patients
necessary to demonstrate the effectiveness of the medical device and/or
biologic.
Cardiovascular
Applications
Cardiovascular
disease is one of the leading causes of mortality within most developed
countries. Early identification of the changes leading the disease can prompt
early intervention which can result in longer and better quality of life as well
as lower healthcare costs. Imaging provides a valuable tool for the assessment
of early development of arterial plaques which can lead to arterial stenosis as
well as stroke and myocardial infarction. The current primary imaging tool for
screening cardiovascular patients is ultrasound but these carotid ultrasound
scans produce a large amount of data which can be laborious and imprecise to
analyze. We have developed a suite of patented semi-automated tools for the
identification and measurement of carotid plaques which has proven to reduce
analysis time to as little as 3 minutes per case compared to the current manual
methods which can take over one hour. In addition, these tools have been tested
against expert readers in the field and found to be highly precise and accurate
and in many cases more sensitive to the appearance of small arterial
plaques. This provides a valuable tool for screening of
normal/healthy individuals as well as monitoring the use in patients enrolled in
clinical trials.
7
More
detailed information about plaque composition and progression can be obtained by
using MRI. This modality has advantages over ultrasound in that it can precisely
measure plaque volume as well as composition. This is important because it is
widely recognized in the industry that certain plaques, in particular those with
high lipid or necrotic cores, pose a much higher risk to the health of the
patient, while those that are fibrous may pose a lower risk. Therefore, the
ability to distinguish between benign and vulnerable plaques may enable treating
physicians to better personalize the treatment for each patient. Additionally,
certain drugs designed to reduce blood lipids may have greater effect on lipid
rich plaques, making this a potentially beneficial screening tool for patients
enrolled in clinical trials. Our patented semi-automated tools for the
measurement of plaques in MRI and automated identification of lipids and
calcification allows accurate and precise analysis of vulnerable
plaques.
These
proprietary ultrasound and MRI techniques for cardiovascular health are being
used in large industry sponsored trials today.
Neurology
Applications
Evaluating
diseases such as multiple sclerosis (MS), epilepsy, and Alzheimer’s requires the
identification and measurement of neurological structures and lesions. However,
current methods for obtaining data points rely on subjective and error prone
manual techniques. Manual tracing, especially of abnormal neurological
structures, requires considerable expertise and time. Tracing introduces
significant variability even when all measurements are made by one individual,
an effect that is compounded with multiple operators. Intra- and inter-operator
variability poses a major obstacle for researchers attempting to take advantage
of the power of MRI analysis in the study of neurological disease.
VirtualScopics eliminates these problems with automated, statistically driven
feature analysis. Our algorithms employ the two types of knowledge that expert
radiologists use to measure structures within the brain: differentiation of
various tissue types and knowledge of structure, size, location, and shape. Our
software incorporates an a
priori model of neurological anatomy that enables the measurement of
structures with indistinct boundaries such as the hippocampus. Knowledge of
anatomical structures also improves reproducibility, allowing disease
progression to be precisely monitored over time. To gain higher resolution and
superior tissue separability, we reconstruct volumes by co-registering and
fusing images from multiple imaging planes and pulse sequences. Moreover, its
automatic reconstruction produces a smooth and continuous surface, much closer
to actual shape than would result from manual segmentation.
Many
neurological conditions can be detected and evaluated with quantitative measures
of structures in MRI studies. While automated measurement tracks lesions in MS
clinical trials, it also provides a critical tool in measuring hippocampal
volume for diagnosing and monitoring both intractable temporal lobe epilepsy and
Alzheimer’s disease. Validation studies prove that our automated approach
provides greater speed, precision and accuracy in clinical trials than current
manual methods do. In MS clinical trials, where current techniques to measure
progress in drug development are largely manual, we provide an FDA-approved
metric for quickly determining drug efficacy of MS compounds. A VirtualScopics
validation study compared manual tracing using two VirtualScopics software
algorithms for automated measurement: geometrically constrained region growth
(GEORG) and directed clustering. Our Core Lab utilizes both algorithms to
achieve an optimal system for quantification of MS lesions in multi-spectral MRI
studies. In the MS validation study, mean processing time was 60 minutes for
manual tracing, 10 minutes for GEORG, and 3 minutes for directed clustering.
Intra- and inter-operator coefficients of variation were 5.1% and 16.5% for
manual tracing, 1.4% and 2.3% for region growth and 1.5% and 5.2% for directed
clustering. The study also compared our automated measurement and manual tracing
from an expert radiologist against a phantom data set, obtained from the
McConnell Brain Imaging Center. In all data sets, automated algorithms performed
significantly better than manual tracing. Our automated measurements also proved
more repeatable than manual methods, an important feature in multi-center
clinical trials.
Sales
and Marketing
Our sales
and business development strategy is centered around the publication and
presentation of our technology and services at targeted industry conferences
along with an active marketing effort aimed at pharmaceutical, medical device,
and biotechnology companies. To date, we have made significant inroads by having
contracts with 12 of the 15 leading pharmaceutical, biotechnology and medical
device companies. During 2009, we performed services for 109 projects
representing 28 customers. We continue to grow our business by leveraging
relationships with our current customers and through referrals. As a
result, our current customers have been instrumental in introducing us to other
therapeutic groups within their organization. We continue to receive
positive feedback from our customers, which has resulted in new projects. Our
marketing efforts are instrumental in broadening the awareness of VirtualScopics
throughout the industry and educating current customers on the breadth of our
services.
8
Complementing
our sales and marketing effort, we actively participate in medical conferences
to showcase our technology, services and results, as well as joint publications
with sponsors which often results in highly visible, research. We
have built a strong base of clinical collaborators across varied disease
platforms.
We are
continuing an active sales and marketing effort and are currently in discussions
with a number of additional potential customers to form business and/or
partnerships.
Industry
Background and Market Trends
Market
in Pharmaceutical and Medical Device Development
Industry
Overview
The
global Pharmaceutical market is expected to grow by 2.5-3.5% in 2009 with the
industry forecasted to generate around $750 billion in revenues. Although
impacted by the economic downturn in 2009, the industry is insulated to a
greater extent than other industries where consumer spending is far more
discretionary. Other factors such as patent expirations, the introduction of
cheaper generics, a slowdown in innovative product launches, and hurdles imposed
by payers on market access and acceptance have contributed to record low sales
growth this year. While the pharmaceutical market is expected to rebound as the
global economy recovers, an unprecedented level of potential patent expirations
in 2011 and 2012 will curb sales growth. In spite of these pressures, the demand
for medicines and treatments is expected to rise due to 1) an aging world
population with an increased need for medical care, 2) unhealthy lifestyles
leading to increased frequency of chronic diseases, 3) high economic growth in
emerging markets leading to an increased demand for better quality healthcare
and 4) scientific advances that create the foundation for innovative treatments
for previously untreatable diseases.
The
global compound annual growth rate (CAGR) for pharmaceutical market growth is
forecasted to be 3 - 6 percent through 2013.1 The U.S.
Pharmaceutical market is expected to contract by 1-2 percent in 2009, with the 5
year growth forecast being fairly flat. Emerging markets on the other hand are
expected to grow collectively at a 13-16 percent rate through 2013 and
contribute 40% to global revenues. Approximately 50 - 60 new chemical or
biological products are expected to be launched over the next two years with at
least 10 of them being potential blockbuster drugs.
As the
growth rate in the demand for prescription drugs decreases, it is getting harder
for Pharmaceutical companies to maintain the same levels of R&D spending as
in the past. Additionally, the cost and complexity of developing new drugs has
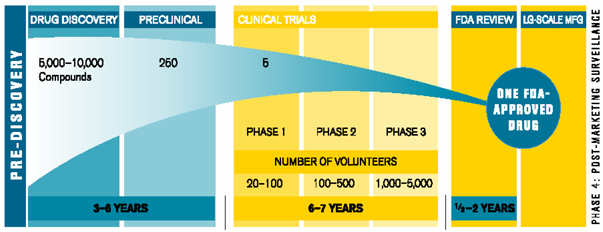
increased substantially relative to its eventual potential value. Due to the
high attrition rates, the total resources required to yield one successful
product are rising. For every 5,000 -10,000 compounds that enter at the
discovery stage, only one goes on to reach the market. The table below
illustrates the complete R&D process from pre discovery to
market.
1 imshealth.com - IMS Health Lowers 2009 Global Pharmaceutical Market Forecast to 2.5 – 3.5 Percent Growth
9
 2
2Drug
Development Process
Typically,
most functions of the drug and medical device R&D process are managed by
Clinical Research Organizations (CROs). Rising costs and falling productivity,
among other trends are driving pharmaceutical companies to outsource an
increasing range of functions to CROs in search of time and cost savings. This
produced strong double-digit growth in the CRO sector between 2003 and 2008. The
total CRO market size is estimated at $20bn in 2008 and expected to grow at an
annual rate of 8.5% to reach $35bn through 2015. The market is highly fragmented
and the number of CROs worldwide has reached over 1,100 despite continued
consolidation.3 The
leading CRO’s are Quintiles (7.6%), Covance (4.7%) and PPD (4.3%)
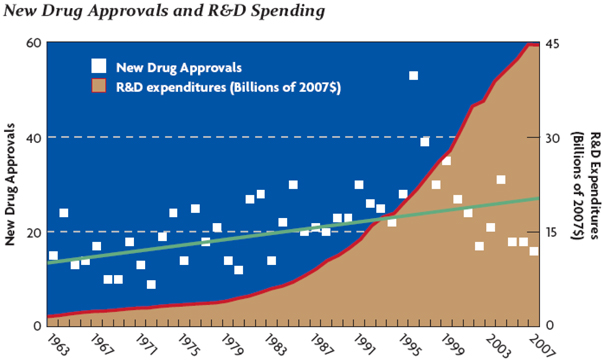
Although
the FDA has significantly reduced the average approval time for new drugs (1.1
years in 2005-2007 period), clinical development time has been increasing over
the years, resulting in total development time being fairly flat in recent years
(average of 8.6 years since 2002). Growing complexities in protocol design
leading to longer clinical development times has been the major contributor to
the rising costs that sponsors are facing. The table below illustrates the
increasing trend in R&D costs over the years, while the number of new drug
approvals continues to stagnate.
2 PHRMA Industry Report 2009
3
http://www.reuters.com/article/pressRelease/idUS39967+21-Sep-2009+BW20090921
10
The
current trend in drug development is for pharmaceutical companies to shift
towards a niche market. The 'one size fits all' approach is being replaced by a
more targeted, innovative approach to develop treatments for small patient
groups with complicated diseases such as cancer, rheumatoid arthritis and immune
disorders. Such 'niche buster drugs' are expected to exploit new technologies
such as biomarkers and theranostics and will support the continued development
of personalized medicine.
With the
U.S administration trying to implement health care reform, increased regulatory
oversight and pressure on drug companies to reduce prices, there is a need for
R&D to become more efficient and reduce costs to prevent an innovation
slowdown in the industry. Many leading pharmaceutical companies have
restructured their R&D processes by establishing centers of R&D
excellence and disease focused centers. Commercial success rate for new drugs is
low, with only 2 out of 10 drugs matching or exceeding average R&D
costs.
Because
of these factors, we believe our quantitative imaging analysis offer a solution
to these issues within drug development but providing more precise and reliable
information in the assessment of compounds being developed. We believe our
increased precision and reproducibility enable our customers to make more
confident decisions on the efficacy of their compounds.
Quantitative
Image Analysis Services
We have
conducted research to determine the current size of the market for image
analysis services in clinical trials supporting the pharmaceutical, biotech and
medical device industries. Based on our research and discussion
within the imaging CRO and medical device and drug development industries, we
have found that the market is fragmented, with approximately $550 million in
total annual revenues projected for 2009.
Over the
past several years, the industry underwent a growth phase as the use of imaging
end-points is becoming more prevalent within the FDA. We now estimate
the annual growth rate for the market at 5% to 10% for the next five
years. Our estimates are based on the amount of trials currently
conducted within therapeutic areas that we work in. We also have performed a
bottom-up calculation of the individual growth rates of the companies and
academic centers within the industry. We believe that some of the largest
players, which offer the broadest set of capabilities, are also
growing. Specifically, BioClinica, Perceptive (division of Parexel),
RadPharm and ICON.
11
Image
Analysis Solutions in the Pharmaceutical and Medical Device
Industries
It is
well known that greater reproducibility of measurements can decrease the cost
and time to market of compounds in development. The higher reproducibility of
our automated analysis enables researchers to achieve statistically significant
results with substantially smaller patient populations. Automated analysis
greatly reduces the analyst variability and interaction time required to process
clinical trial data. Published studies demonstrate that our automated analysis
consistently yields a lower coefficient of variation than manual techniques. As
measurement variation diminishes, so does the percentage change in a given
structure necessary to determine whether a treatment is having the desired
effect. In short, precise measurement allows companies to learn more from
smaller populations earlier in the compound development process.
Drug
discovery and development has been constrained by the lack of accurate image
analysis tools and appropriate image-based biomarkers. In many musculoskeletal
clinical studies, X-ray is the chosen modality for evaluating a compound’s
efficacy. X-ray imaging in drug discovery has significant limitations, which
include:
|
|
·
|
partial
or complete inability to detect changes in a region of interest due to
poor contrast or occlusion;
|
|
|
·
|
the
potential for inter/intra-observer variability - error in radiologist
measurements can amount to upwards of 30% for small structures of
interest;
|
|
|
·
|
the
need for a radiologist to perform manual tracings is not only subject to
error, but is also time consuming;
and
|
|
|
·
|
reliance
on a radiologist for biomarker measurements results in very limited
throughput.
|
The
constraints mentioned above can add months and years to the drug discovery
process.
The use
of MRI and CT to determine drug efficacy is increasing, owing to its superior
information content relative to X-ray. MRI and CT are more sensitive to
pathology, provide higher contrast for soft tissue and are three-dimensional.
These attributes improve the detection of disease and the ability to monitor
disease progression over time. While MRI and CT are preferred modalities, they
too suffer from the need to have a radiologist review the images, detect
disease, monitor progression and, when necessary, perform manual
calculations.
Intellectual
Property
We
consider our proprietary and patented technology and the technology for which we
have applied for patent protection to be of importance to our business
plan. We hold eleven patents issued by the United States Patent and
Trademark Office. These patents begin to expire in November 2018
through 2027. We have also applied for a number of other patents,
both domestically and in foreign jurisdictions. To protect our
proprietary technology, we rely primarily on a combination of confidentiality
procedures, copyright, trademark and patent laws. Our policy is to
require employees and consultants to execute confidentiality and invention
assignment agreements upon the commencement of their relationship with
us. These agreements provide that confidential information developed
or made known during the course of a relationship with us must be kept
confidential and not disclosed to third parties except in specific circumstances
and for the assignment to us of intellectual property rights developed within
the scope of the employment relationship.
12
Competition
Our main
competitors are clinical research organizations (CROs) providing clinical trial
services to pharmaceutical companies. As of the date of this report, we believe
that none of the leading CROs have technology capabilities that are comparable
to our technology. CROs typically provide manual and non-differentiated
interpretation of medical images for the pharmaceutical industry. As
a result, we believe that currently there is an opportunity for us to establish
a technology advantage and a set of differentiated services in the advanced
image-based biomarker market.
Our
technology competition is largely comprised of a limited number of university
research centers that are working on developing the next generation of image
analysis tools. Aside from the university centers, there are a few
commercial entities that have a desire to provide these advanced imaging
services; however, we believe they are constrained by their lack of technical
capabilities.
Competitors
in Accelerating Pharmaceutical and Medical Device Development
The main
CROs which participate in imaging trials are BioClinica, RadPharm, Synarc,
Perceptive and ICON. It is our understanding that these companies use
predominately manual approaches that are unable to quantify minute structures in
medical images. As a result, it may be difficult for them to offer
differentiated services to achieve higher profit margins and at the same levels
of reproducibility as ours. Additionally, some academic centers have worked on
software that has applications for neurological diseases. These academic centers
include Duke Image Analysis Laboratory, University of Pennsylvania, University
of Montreal and University of California at San Francisco. However,
we believe these organizations lack the required FDA compliance standards and
ability to scale their operations to meet customer demand and we believe they
offer inferior technology.
Academic
institutions such as the University of Pennsylvania, University of Montreal and
University of California at San Francisco tend to have more advanced technology
than their commercial peers. However, their commercial efforts are
constrained by being part of an academic institution.
Government
Regulation
Healthcare
in the United States is heavily regulated by the federal government, and by
state and local governments. The federal laws and regulations
affecting healthcare change constantly, thereby increasing the uncertainty and
risk associated with any healthcare-related company.
The
federal government regulates healthcare through various agencies, including the
following:
|
|
·
|
the
Food and Drug Administration, or FDA, which administers the Food, Drug,
and Cosmetic Act, or FD&C Act, as well as other relevant
laws;
|
|
|
·
|
Centers
for Medicare & Medicaid Services, or CMS, which administers the
Medicare and Medicaid programs;
|
|
|
·
|
the
Office of Inspector General, or OIG, which enforces various laws aimed at
curtailing fraudulent or abusive practices, including by way of example,
the Anti-Kickback Law, the Anti-Physician Referral Law, commonly referred
to as Stark, the Anti-Inducement Law, the Civil Money Penalty Law, and the
laws that authorize the OIG to exclude health care providers and others
from participating in federal healthcare programs;
and
|
|
|
·
|
the
Office of Civil Rights which administers the privacy aspects of the Health
Insurance Portability and Accountability Act of 1996, or
HIPAA.
|
All of
the aforementioned are agencies within the Department of Health and Human
Services, or HHS. Healthcare is also provided or regulated, as the case may be,
by the Department of Defense through its TriCare program, the Public Health
Service within HHS under the Public Health Service Act, the Department of
Justice through the Federal False Claims Act and various criminal statutes, and
state governments under the Medicaid program and their internal laws regulating
all healthcare activities.
13
FDA
The FDA
regulates medical devices. A “medical device,” or device, is an article,
including software and software associated with another medical device, which,
among other things, is intended for use in the diagnosis of disease or other
conditions, or in the cure, mitigation, treatment or prevention of disease, in
man or other animals. Computer software that complements a CT or MRI scan, such
as VirtualScopics, we believe is considered a medical device and is therefore
subject to FDA regulation. To date, our sales have been to the
pharmaceutical and medical device industries to support their clinical trials.
We would need to obtain FDA clearance or approval, as discussed below, before
using our technology and services for diagnostic or treatment planning in a
clinical setting. When we begin pursuing the application of our services in
patient diagnostics, no assurance can be given that such clearance or approval
would be granted or that it would be granted in a timely manner.
Devices
are subject to varying levels of regulatory control, the most comprehensive of
which requires that a clinical evaluation be conducted before a device receives
approval for commercial distribution. In the United States, we
generally are able to obtain permission to distribute a new device in two
ways. The first applies to any new device that is substantially
equivalent to a device first marketed prior to May 1976. In this case, to obtain
FDA permission to distribute the device, we generally must submit a premarket
notification application (a section 510(k) submission), and receive an FDA order
finding substantial equivalence to a device (first marketed prior to May 1976)
and permitting commercial distribution of that device for its intended use. A
510(k) submission must provide information supporting its claim of substantial
equivalence to the predicate device.
If
clinical data from human experience are required to support the 510(k)
submission, these data must be gathered in compliance with investigational
device exemption (IDE) regulations for investigations performed in the
United States. The 510(k) process is normally used for software products of the
type that we propose distributing. The FDA review process for
premarket notifications submitted pursuant to section 510(k) takes on average
about 90 days, but it can take substantially longer if the agency has concerns,
and there is no guarantee that the agency will “clear” the device for marketing,
in which case the device cannot be used for diagnosis and distributed in the
United States. Nor is there any guarantee that the agency will deem
the article subject to the 510(k) process, as opposed to the more time-consuming
and resource intensive and problematic, premarket approval, or PMA, process
described below.
The
second, more comprehensive, approval process applies to a new device that is not
substantially equivalent to a pre-1976 product. In this case, two
steps of FDA approval generally are required before we can market the product in
the United States. First, we must comply with IDE regulations in connection with
any human clinical investigation of the device. Second, the FDA must
review our PMA application, which contains, among other things, clinical
information acquired under the IDE. The FDA will approve the PMA application if
it finds there is reasonable assurance the device is safe and effective for its
intended use.
Certain
changes to existing devices that do not significantly affect safety or
effectiveness can be made with
in vitro testing under reduced regulatory procedures, generally
without human clinical trials and by filing a PMA supplement to a prior PMA.
Exported devices are subject to the regulatory requirements of each country to
which the device is exported, as well as certain FDA export
requirements.
After
approval or clearance to market is given, the FDA and foreign regulatory
agencies, upon the occurrence of certain events, have the power to withdraw the
clearance or require changes to a device, its manufacturing process, or its
labeling or additional proof that regulatory requirements have been
met.
A device
manufacturer is also required to register with the FDA. As a result, we may be
subject to periodic inspection by the FDA for compliance with the FDA’s Quality
System Regulation requirements and other regulations. In the European Community,
we are required to maintain certain International Organization for
Standardization (ISO) certifications in order to sell product and to
undergo periodic inspections by notified bodies to obtain and maintain these
certifications. These regulations require us to manufacture products
and maintain documents in a prescribed manner with respect to design,
manufacturing, testing and control activities. Further, we are
required to comply with various FDA and other agency requirements for labeling
and promotion. The Medical Device Reporting regulations require that
we provide information to the FDA whenever there is evidence to reasonably
suggest that a device may have caused or contributed to a death or serious
injury or, if a malfunction were to occur, could cause or contribute to a death
or serious injury. In addition, the FDA prohibits us from promoting a medical
device for unapproved indications.
14
We
currently meet the requirements of Good Clinical Practices:
Consolidated Guidance, which governs the conduct of clinical trials, and
our software complies with the FDA’s Regulation 21 CFR Part 11 (Electronic
Records; Signatures) and 21 CFR Part 820.30, which outline the requirements for
design controls in medical devices. As mentioned throughout this section, as we
develop our approach into personalized medicine, FDA approval would most likely
be required for the use of our software in that market.
Privacy
Provisions of HIPAA
HIPAA,
among other things, protects the privacy and security of individually
identifiable health information by limiting its use and disclosure. HIPAA
directly regulates “covered entities” (healthcare providers, insurers and
clearinghouses) and indirectly regulates “business associates” with respect to
the privacy of patients’ medical information. All entities that receive and
process protected health information are required to adopt certain procedures to
safeguard the security of that information. It is our policy to comply with
HIPAA requirements.
Research
and Development Costs
We
incurred $975,311 and $941,193 in research and development costs for the years
ended December 31, 2009 and 2008, respectively.
Customers
One
customer accounted for 10% or more of our revenue during the year ended December
31, 2009, this same customer accounted for more than 10% of our revenue during
the year ended December 31, 2008. The following table sets forth information as
to revenue and percentage of revenue for these years for our three largest
customers in 2009 and corresponding revenues for 2008:
|
Years
Ended December 31,
|
||||||||||||||||
|
Customer
|
2009
|
2008
|
||||||||||||||
|
Novartis
|
$ | 4,473,523 | 43 | % | $ | 1,275,720 | 18 | % | ||||||||
|
Merck
Serono
|
$ | 851,385 | 8 | % | $ | 537,246 | 8 | % | ||||||||
|
Amgen
|
$ | 707,804 | 7 | % | $ | 637,189 | 9 | % | ||||||||
Employees
As of
December 31, 2009, we had 70 employees and six contract
radiologists. Of our employees, 66 are full-time.
15
ITEM
1A: Risk Factors
You
should carefully consider the following risk factors before making an investment
decision. If any of the following risks actually occur, our business,
financial condition, or results of operations could be materially adversely
affected. In such cases, the trading price of our common stock could
decline, and you may lose all or part of your investment.
We
have a history of operating losses and uncertain future
profitability.
Prior to 2009, VirtualScopics incurred
losses from operating activities since it began operations in 2001. As we
continue to grow the business, we may face risks and difficulties in our
business including uncertainties of further market penetration, competition,
cost increases and delays in achieving business objectives. There can be no
assurance that we will succeed in addressing any or all of these risks or that
we will achieve future profitability and the failure to do so would have a
material adverse effect on our business, financial condition and operating
results.
If
our products and services do not continue to attract interest from new and
existing customers, we may not achieve future growth.
If we are unable to continue to attract
interest in the industry for our services, we could fail to achieve future
growth which would have a detrimental effect on our business. Our ability to
generate revenues is highly dependent on building and maintaining relationships
with leading pharmaceutical and biotechnology companies. No assurance can be
given that a sufficient number of such companies will increase their demand for
our services, thereby limiting the overall market for quantitative imaging
services and not enable us to increase our revenue to the extent expected. In
addition, the rate of the growth of MRI and CT image-based biomarkers is
difficult to predict. Failure to attract and maintain a significant customer
base would have a detrimental effect on our business, operating results and
financial condition.
The
majority of the contracts we have with customers are cancelable for any reason
by giving 30 days advance notice.
Our customers typically engage us to
perform services for them on a project-by-project basis and are required by us
to enter into a written contractual agreement for the work, labor and services
to be performed. Generally, our project contracts are terminable by the customer
for any or no reason on 30 days’ advance notice to us. If a number of our
customers were to exercise cancellation rights, our business and operating
results would be materially and adversely affected.
If
we are unable to manage and sustain our growth, our operating results would be
adversely affected.
We have seen a growing demand for our
image analysis services over the past several years. Although there
can be no assurance that this will continue, if it does continue we may be
unable to scale our capacity efficiently to meet this demand. If we
are unable to do so, we may fail to maintain our operating margins or achieve
expected operating margins. This may have a material and adverse
effect on our operating results.
Our
services may become obsolete if we do not effectively respond to rapid
technological change on a timely basis.
Our services depend on the needs of our
customers and their desire to utilize image-related services in drug and medical
device development and clinical diagnosis and treatment. Since the image-based
biomarker industry is characterized by evolving technologies, uncertain
technology and limited availability of standards, we must respond to new
research findings and technological changes affecting our customers. We may not
be successful in developing and marketing, on a timely and cost-effective basis,
new or modified products and services, which respond to technological changes,
evolving customer requirements and competition. If we are unsuccessful in this
regard, our business and operating results could be materially and adversely
affected.
16
Although
we believe that our products and services do not and will not infringe upon the
patents or violate the proprietary rights of others, it is possible such
infringement or violation has occurred or may occur which could have a material
adverse effect on our business.
Portions of our business are reliant
upon patented and patentable systems and methods used in our image analysis and
related intellectual property. In the event that products and services we sell
are deemed to infringe upon the patents or proprietary rights of others, we
could be required to modify our products and services or obtain a license for
the manufacture and/or sale of such products and services. In such event, there
can be no assurance that we would be able to do so in a timely manner, upon
acceptable terms and conditions, or at all, and the failure to do any of the
foregoing could have a material adverse effect upon our business. Moreover,
there can be no assurance that we will have the financial or other resources
necessary to enforce or defend a patent infringement or proprietary rights
violation action. In addition, if our products and services or proposed products
and services are deemed to infringe or likely to infringe upon the patents or
proprietary rights of others, we could be subject to injunctive relief and,
under certain circumstances, become liable for damages, which could also have a
material adverse effect on our business.
We
are subject to numerous pharmaceutical, medical device and healthcare industry
regulations, which could adversely affect the nature and extent of the products
and services we offer.
Many aspects of the pharmaceutical,
medical device and healthcare industry are subject to regulation at the federal
level. From time to time, the regulatory entities that have jurisdiction over
the industry adopt new or modified regulations or take other actions as a result
of their own regulatory processes or as directed by other governmental bodies.
This changing regulatory environment could adversely affect the nature and
extent of the services we are able to offer.
To date, our sales have been within the
clinical trial industry. To enter the patient treatment or personalized medicine
market we would need to obtain FDA clearance or approval before marketing our
services in this area. There can be no assurance that such clearance or approval
would be granted or that it would be granted in a timely manner. To effectively
market our products to physicians as a treatment aid, we would also need to
obtain appropriate coverage and favorable reimbursement from third-party payers,
such as Medicare and insurance companies. There can be no assurance that
appropriate coverage would be granted or that reimbursement levels or conditions
of coverage would be adequate to ensure acceptance among physicians.
Additionally, the efforts of governments and third-party payers to contain or
reduce the cost of health care, such as a number of legislative and regulatory
proposals currently being discussed, could affect our ability to implement our
plans in this area.
We
may in the future experience competition from academic sites, imaging CROs, and
other competing technologies.
Competition in the development of
imaging solutions may become more widespread as with emerging technologies such
as proteomics and genomics which can serve as predictive tools of drug efficacy.
Competitors range from university-based research and development projects which
would develop advanced tools to development stage companies and major domestic
and international companies which would commercialize the tools. Some of these
entities have greater financial, technical, marketing, sales, distribution and
other resources than ours. There can be no assurance that we can continue to
develop our technologies or that present or future competitors will not develop
technologies that render our image-based biomarker industry obsolete or less
marketable or that we will be able to introduce new products and product
enhancements that are competitive with other products marketed by industry
participants.
17
We
have experienced significant demand from one customer, thereby increasing our
dependence on the customer until we can further diversify our customer
base.
While we
continue to serve a broad range of customers, we’ve experienced strong demand
from one of our customers, and our dependence on that customer to sustain our
continued growth has increased. In 2009, this customer accounted for 43% of our
revenue. We continue to see increasing demand from other customers, however, not
to the same significant pace. We continue to invest on our sales and marketing
efforts to further diversify our customers and more broadly penetrate the
market, in order to minimize reliance on any one customer. As with all of our
contracts, this customer may terminate its contractual relationship with us for
any or no reason on 30 days’ advance notice. A decision by the customer to
cancel all of its studies with us could have an adverse impact on the growth of
our business.
Consolidation
within the pharmaceutical industry and changes within healthcare regulation may
have an adverse impact on our business.
Over the past few years, there have
been several mergers and acquisitions among pharmaceutical and biotechnology
companies. Historically, these transactions have positively impacted our
business due to a broader exposure within the merged entity, however, there can
be no assurance that consolidation within the industry will continue to be
beneficial to us. Additionally, with the recent political landscape and changes
within the healthcare industry, there may be an adverse impact on our business
if the cost of imaging significantly increases or no longer becomes standard of
care for patients. Although, we don’t believe imaging will decline in its level
of use, if it does we may need to reduce prices or invest in research to advance
the education and science of medical imaging.
The
trading price of our stock may be adversely affected if we are not able to
continue to grow the business.
We intend to continue to use our cash
on hand to broaden our market penetration of our services within the industry
and pursue the application of one of our technologies in the personalized
medicine market. If our plans or assumptions with respect to our business change
or prove to be inaccurate, we may be required to use part or all of our cash to
fund general operating expenses and/or reduce costs within the organization.
This will depend on a number of factors, including, but not limited
to:
|
|
·
|
the
lack of significant cancellations of customer
contracts
|
|
|
·
|
the
further market penetration of our products and services;
and
|
|
|
·
|
our
ability to manage and sustain the growth of our
business.
|
We currently do not plan to raise
additional capital, however, if we need to raise additional capital, it may not
be available on acceptable terms, or at all. Our failure to obtain
required capital, or the acquisition of capital on less favorable terms, would
have a material adverse effect on our business. If we issue
additional equity securities in the future, you could experience dilution or a
reduction in priority of your securities.
The
market price of our common stock may fluctuate significantly.
The market price of our common stock
may fluctuate significantly in response to factors, some of which are beyond our
control, such as the announcement of new products or product enhancements by us
or our competitors; developments concerning intellectual property rights and
regulatory approvals; quarterly variations in our competitors’ results of
operations; changes in earnings estimates or recommendations by securities
analysts; developments in our industry; product liability claims or other
litigation; and general market conditions and other factors, including factors
unrelated to our own operating performance.
Our
common stock may be considered a “penny stock” and may be difficult to
sell.
The SEC has adopted regulations which
generally define “penny stock” to be an equity security that has a market or
exercise price of less than $5.00 per share, subject to specific exemptions. The
market price of our common stock is currently below $5.00 per share and
therefore may be designated as a “penny stock” according to SEC rules. This
designation requires any broker or dealer selling these securities to disclose
certain information concerning the transaction, obtain a written agreement from
the purchaser and determine that the purchaser is reasonably suitable to
purchase the securities. These rules may restrict the ability of brokers or
dealers to sell our common stock and may affect the ability of our stockholders
to sell their shares.
18
A
significant number of the shares of our common stock are eligible for sale, and
their sale could depress the market price of the our common stock.
Sales of
a significant number of shares of our common stock in the public market or the
possibility of such sales, could harm the market price of our common stock and
impede our ability to raise capital through the issuance of equity
securities. As of February 26, 2010, we had 25,579,810 shares of
common stock outstanding. These shares are eligible for resale in the
public market either immediately or subject to applicable volume, manner of
sale, holding period and other limitations of Rule 144. In addition
to these outstanding shares of common stock, the series B convertible preferred
stock and the warrants to purchase common stock issued in our 2007 private
placement are initially convertible into 5,846,821 shares of our common stock
and registered for resale under a registration statement on Form
S-3. There are also 2,854,780 shares of our common stock issuable
upon conversion of our series A convertible preferred stock and warrants sold in
our November 2005 private placement, eligible for resale under Rule
144. Additionally, we have filed registration statements on Form S-8
to register the sale of up to 6,900,000 shares issued or to be issued pursuant
to our Amended and Restated 2006 Long-Term Incentive Plan. Finally,
we have approximately 1,243,000 shares of common stock underlying options issued
under our 2001, and 2005 Long-Term Incentive Plans that may be eligible for
resale in the public market pursuant to an exemption under Rule 701 of the
Securities Act. Sales of our common stock in the public market may
have a depressive effect on the market for the shares of our common
stock.
Our
principal stockholders have significant voting power and may take actions that
may not be in the best interests of other stockholders.
Our officers, directors, principal
stockholders (greater than 10%) and their affiliates control approximately 30%
of our outstanding voting securities. If these stockholders act together, they
will be able to exert significant control over our management and affairs
requiring stockholder approval, including approval of significant corporate
transactions. This concentration of ownership may have the effect of delaying or
preventing a change in control and might adversely affect the market price of
our common stock. This concentration of ownership may not be in the best
interests of all our stockholders.
We
do not anticipate paying dividends on our common stock in the foreseeable
future, and the lack of dividends may have a negative effect on the stock
price.
We currently intend to retain our
future earnings to support operations and to finance expansion and meet dividend
obligations on our series B convertible preferred stock. In addition, the terms
of our series B preferred stock limit our ability to pay dividends to the
holders of our common stock. Therefore, we do not anticipate paying
any cash dividends on our common stock in the foreseeable
future.
19
ITEM
2: Properties
In July,
2007 we began leasing approximately 19,500 square feet of office space at our
corporate headquarters in Rochester, New York. The annual rent under the lease
is $360,000, and increases three percent (3%) a year. During the
first twenty months of the lease, the rent was paid in two portions: a cash
portion of $156,000 annually, paid in equal monthly installments, increasing
three percent (3%) annually; and, a stock portion of $204,000 annually, paid in
equal monthly installments, increasing three percent (3%) annually. The stock
portion was payable in shares of our common stock. In February 2009,
the Landlord exercised their option to receive their remaining rental payments
in all cash. During 2009 and 2008, we had issued 88,132 and 165,007 shares,
respectively, of the Company’s common stock ranging from $1.20 to $2.50 per
share for a total value of $105,570 and $221,000,
respectively. Management believes that the leased property is
adequately covered by insurance.
None.
None.
20
PART
II
ITEM
5: Market For Registrant's Common Equity, Related Stockholder Matters and Issuer
Purchases of Equity Securities
Our
shares of common stock are listed for trading on the NASDAQ Capital Market under
the trading symbol “VSCP.” The following table sets forth the high
and low closing sales prices for our common stock as reported on the NASDAQ
Capital Market for the period from January 1, 2008 through December 31, 2009.
These prices do not include retail markup, markdown or commission and may not
necessarily represent actual transactions. Investors should not rely on
historical stock price performance as an indication of future price
performance.
Fiscal
Year Ended December 31, 2008
|
HIGH
|
LOW
|
|||||||
|
First
Quarter
|
$ | 1.24 | $ | 0.37 | ||||
|
Second
Quarter
|
0.79 | 0.40 | ||||||
|
Third
Quarter
|
0.75 | 0.36 | ||||||
|
Fourth
Quarter
|
0.60 | 0.37 | ||||||
Fiscal
Year Ended December 31, 2009
|
HIGH
|
LOW
|
|||||||
|
First
Quarter
|
$ | 1.10 | $ | 0.43 | ||||
|
Second
Quarter
|
1.26 | 0.83 | ||||||
|
Third
Quarter
|
1.48 | 1.01 | ||||||
|
Fourth
Quarter
|
1.22 | 1.01 | ||||||
As of
February 26, 2010, we had approximately 122 registered holders of record of
shares of our common stock.
Dividend
Policy
We have
never declared a cash dividend on our common stock. We intend to retain any
earnings to fund future growth and the operation of our business and, therefore,
we do not anticipate paying any cash dividends on our common stock in the
foreseeable future. In addition, the terms of our series B preferred stock limit
our ability to pay dividends to the holders of our common stock. Thereafter,
dividends may be paid on our common stock only if and when declared by our board
of directors and paid on an as-converted basis to the holders of our series A
and series B convertible preferred stock.
21
The
following table summarizes information, as of December 31, 2009, relating to our
equity compensation plans:
|
Number of Securities
to be Issued Upon
Exercise of
Outstanding Options
|
Weighted-
Average
Exercise Price
of
Outstanding
Options
|
Number of Securities Remaining
Available for Future Issuance Under
Equity Compensation Plans
(Excluding Securities Reflected in Column
(a))
|
||||||||||
|
Plan
Category
|
(a)
|
(b)
|
(c)
|
|||||||||
|
Equity
compensation plans approved by security holders
|
5,157,512 |
(1)
|
$ | 0.67 | 3,727,424 | |||||||
|
Equity
compensation plans not approved by security holders
|
350,000 |
(2)
|
$ | 2.50 | - | |||||||
|
Total
|
5,507,512 | $ | 0.79 | 3,727,424 | ||||||||
(1) This
amount includes shares under the plans of VirtualScopics, LLC, pursuant to the
November 2005 reverse acquisition in connection with which we agreed to issue
532,490 shares of our common stock to holders of warrants granted by
VirtualScopics, LLC, in exchange for consideration in the form of goods and
services. Also we agreed to issue 4,557,492 shares of common stock collectively,
under our 2001, 2005 and 2006 Long Term Incentive Plans. Also included are
67,530 shares of common stock underlying warrants we issued to the placement
agent in connection with our September 2007 private placement, which was
approved by stockholders in November 2007.
(2) In
November 2005, our Board of Directors granted to our Chairman and former CEO,
Robert Klimasewski, an option to purchase 350,000 shares of our common stock at
$2.50 per share.
Recent
Sales of Unregistered Securities
During
the quarter ended December 31, 2009, the Company issued 103,795 shares of common
stock upon the conversion of 125 shares of the Company’s series A convertible
preferred stock and issued 237,482 shares of common stock upon the conversion of
286 shares of series B convertible preferred stock. The Company did
not receive any cash or other consideration in connection with the
conversions. Additionally, no commission or other remuneration was
paid by the Company in connection with such conversions. The issuance
of common stock upon conversions of the series A and series B convertible
preferred stock was made in reliance on the exemption provided in Section
3(a)(9) of the Securities Act of 1933, as amended.
Issuer
Repurchases of Equity Securities
None.
The
following discussion should be read in conjunction with VirtualScopics’
consolidated balance sheet, and related consolidated statements of operations,
consolidated changes in stockholders’ equity and cash flow for the years ended
December 31, 2009 and 2008, included elsewhere in this report. This discussion
contains forward-looking statements, the accuracy of which involves risks and
uncertainties. Our actual results could differ materially from those anticipated
in the forward-looking statements for many reasons including, but not limited
to, those discussed in “Risk Factors” and elsewhere in this report. We disclaim
any obligation to update information contained in any forward-looking
statements.
Overview
VirtualScopics,
Inc. is a leading provider of imaging solutions to accelerate drug and medical
device development. We have developed a robust software platform for
analysis and modeling of both structural and functional medical
images. In combination with our industry-leading experience and
expertise in advanced imaging biomarker measurement, this platform provides a
uniquely clear window into the biological activity of drugs and devices in
clinical trial patients, allowing our customers to make better decisions
faster.
22
In July
2000, VirtualScopics was formed after being spun out of the University of
Rochester. In June 2002, we purchased the underlying technology and patents
created by VirtualScopics’ founders from the University of Rochester. In
November 2005, we performed an exchange transaction with ConsultAmerica whereby
prior to the exchange ConsultAmerica, Inc. had no meaningful operations and,
therefore, the exchange was treated as recapitalization of VirtualScopics,
LLC. Following the transaction, we succeeded to the business of
VirtualScopics, Inc. as a provider of image-based biomarker solutions and have
continued this business since that time. We own all rights to the patents
underlying its technology.
Revenue
over the past eight years has been derived primarily from image processing
services in connection with pharmaceutical drug trials. For these
services, we have been concentrating in the areas of oncology and
osteoarthritis. We have also derived a small portion of revenue from
consulting services, and pharmaceutical drug trials in the neurology and
cardiovascular areas. We expect that the concentration of our revenue
will continue in these services and in those areas in 2010. Revenues
are recognized as the MRI and CT images that we process are quantified and
delivered to our customers and/or the services are performed. During 2010, we
will also continue to pursue the personalized medicine market, however, we do
not anticipate significant revenues from this market opportunity in 2010 as we
further define our opportunity and commercialization strategy.
As of
December 31, 2009, the amount remaining to be earned from active projects and
awards was approximately $36 million. Once we enter into a new contract for
participation in a drug trial, there are several factors that can effect whether
we will realize the full benefits under the contract, and the time over which we
will realize that revenue. Customers may not continue our services
due to performance reasons with their compounds in
development. Furthermore, the contracts may contemplate performance
over multiple years. Therefore, revenue may not be realized in the
fiscal year in which the contract is signed or the award is
made. Recognition of revenue under the contract may also be affected
by the timing of patient recruitment and image site identification and
training. Additionally, the majority of contracts we have with
customers are cancelable for any reason by giving 30 days advance
notice.
Results
of Operations
Results
of Operations for Year Ended December 31, 2009 Compared to Year Ended December
31, 2008
Revenue
We had
revenues of $10,393,000 for the year ended December 31, 2009 compared to
$7,131,000 for the year ended December 31, 2008, representing a 46% increase.
The increase in revenues is directly related to the growing demand for our
services in the industry. We continue to see growing demand for our oncology
analysis services as well as demand within the medical device industry. During
2009 we performed work for 28 customers, representing 109 different projects, in
connection with their pharmaceutical drug trials primarily in the fields of
oncology and musculoskeletal diseases (osteoarthritis and rheumatoid arthritis)
along with various other projects. This compares to 90 projects in 2008. Our
average contract size was $513,000 in 2009 compared to approximately $350,000 in
2008. The increase in contract size is a reflection of a greater number of
studies performed in later phases of clinical trials as well as our customers
confidence and value in our services. As of December 31, 2009, we had active
projects with 12 of the leading 15 pharmaceutical and biotechnology companies in
the world. Historically, the majority of the pharmaceutical projects for which
we have performed work to date are in pre-clinical, Phase I or Phase II studies.
In 2009, 64% of our revenues were now from Phase II and Phase III studies
compared to 42% for the full year of 2008. Additionally, for the year ended
December 31, 2009, oncology, musculoskeletal and other projects represented 76%,
17%, and 7%, respectively, of our revenues. This compares to 52%, 26%, and 22%,
respectively, for 2008.
23
Gross
Profit
We had a
gross profit of $5,615,000 for the year ended December 31, 2009 compared to
$3,099,000 for the comparable period in 2008. Our gross profit
improved year over year due to the greater amount of work performed on later
stage clinical trials, and efficiencies made within our operations. Later stage
trials (Phase II/III) typically have more analysis due to the patient population
of the study, as a result, we tend to have greater economies of scale because of
the repetitive nature of the work we perform. We anticipate our gross margins
will approximate 50% throughout 2010 based on the projected nature of the
project services in later stage trials we expect to perform.
Research
and Development
Research
and development costs increased slightly in 2009 by $34,000, or 4%, to $975,000,
when compared to 2008. The slight increase was largely attributed to
the allocation of resources to research and development during 2009, along with
the relocation costs associated with one of our scientists. As of December 31,
2009, there were ten employees in our research and development group, this
includes the algorithm and software development groups. Our research and
development efforts are centered around improving the functionality of our
existing algorithms and software platform as well as the refinement of our
algorithms to new therapeutic areas. We anticipate some investments made within
our software platform in 2010 as we enhance and enable a reporting functionality
accessible to our customers.
Sales
and Marketing
Sales and
marketing costs increased slightly in 2009 by $20,000, to $1,240,000, when
compared to 2008. The increase was a result of higher marketing
efforts during the first half of 2008, offset by higher commissions and salaries
in 2009. We anticipate additional investments in our sales and marketing effort
in 2010 as we continue to increase our efforts around broader market penetration
of our services. As of the date of this report, there are five individuals in
our sales and marketing department.
General
and Administrative
General
and administrative expenses for the year ended December 31, 2009 were
$3,209,000, representing a slight increase of $51,000 or 2%, when compared to
2008. The increase is mainly due to higher costs associated with
computer network and licensing costs supporting the 46% increase in revenues
during 2009. During 2010, the company anticipates higher general and
administrative costs as it continues its investment in the commercialization of
the personalized medicine application. The Company anticipates consultant
charges to add to the base of general and administrative costs that it currently
operates within.
Depreciation
and Amortization
Depreciation
and amortization charges increased slightly for the year ended December 31, 2009
by $4,000 or less than 1%, to $470,000, when compared to 2008. This
increase is attributed to the amortization and depreciation of patents and
computer equipment. The amortization and depreciation schedules are based on the
timing and life of the patent costs and equipment. We continue to invest in our
patent portfolio and computer systems, however, do not anticipate significant
expenditures necessary in either area to support our current
business.
Interest
(Expense)/Income, net
Interest
income for the year ended December 31, 2009 was $7,000, representing interest
derived on the Company’s operating and savings accounts, compared to interest
income of $74,000 in 2008. The decrease in interest income was due to
lower rates of return earned on our investment accounts. Other
expense for the years ended December 31, 2009 and 2008 was $22,000 and $16,000,
respectively which relates to franchise taxes paid during the year.
Additionally, we recognized a marked to market adjustment of $717,000 related to
the loss in fair value of warrants issued during our 2005 and 2007 equity
raises. No adjustment was required in 2008 in accordance with ASC
815-40.
24
Net
Loss
Our net
loss for the year ended December 31, 2009 was $1,011,000 compared to a net loss
of $2,629,000 for the year ended December 31, 2008. The decrease in
our net loss over the prior period was related to higher revenues, better gross
margin and reduced spending in research and development, as planned and outlined
above offset by a non-cash marked to market adjustment to reflect the changes in
the fair value of certain outstanding warrants during 2009 as
compared to 2008.
Liquidity
and Capital Resources
Our
working capital as of December 31, 2009 and 2008 was approximately $2,549,000
and $2,923,000, respectively. The decrease in working capital was a
result of the $1,100,000 non-cash mark to market adjustment with respect to
warrants issued in our 2005 and 2007 equity financings, required under ASC
815-40 for 2009. Retroactive adjustment was not required for 2008 under the
guidance of ASC815-40. This was offset by a $1,200,000 increase in
our cash balance compared to December 31, 2008.
Net cash
provided by operating activities in 2009 was $1,850,000 compared to net cash
used in operating activities of $846,000 in 2008. This significant
improvement in the amount of cash used on operating activities was primarily the
result of the strong revenue growth and solid cost controls in 2009. Also
impacting the change from the prior year was the timing of payment of our
receivables, accounts payable and accrued expenses and advance billings from
customers, which is reflected in deferred revenue. As we perform the
services to our customers, revenue is recognized and offset against deferred
revenue.
We
invested $362,000 in the purchase of equipment and the acquisition of patents in
2009, compared to $127,000 for the investment of these items in
2008. This increase largely represents an increase in computer
hardware and software to support our growing revenues and hiring of employees.
We anticipate that our IT related costs will increase in 2010 as we develop our
on-line reporting tool for our customers. During 2009, we
incurred $45,000 in patent costs associated with filing costs for intellectual
property, as compared to $100,000 in 2008. The reduction is due to the timing of
office actions within our existing patent filings.
Net cash
used in financing activities in 2009 was $304,000 compared to net cash provided
by our financing activities in 2008 was $161,000. This decrease was
due to restricted cash which was used in 2008 for the payment of
dividends.
We
currently expect that existing cash and cash equivalents will be sufficient to
fund our existing operations for the next 12 months and foreseeable future. If
in the future our plans or assumptions change or prove to be inaccurate, we may
be required to seek additional capital through public or private debt or equity
financings. If we need to raise additional funds, we may not be able to do so on
terms favorable to us, or at all. If we cannot raise sufficient funds on
acceptable terms, we may have to curtail our level of expenditures and our rate
of expansion.
Off
Balance Sheet Arrangements
We have
no off-balance sheet arrangements, other than the consulting agreements and
operating leases (as described in “Contractual Obligations” below) that have or
are reasonably likely to have a current or future effect that is material to
investors on our financial condition, revenues or expenses, results of
operations, liquidity, capital resources or capital expenditures.
Contractual
Obligations
The
following table summarizes our contractual obligations at December 31, 2009
which we expect to have an effect on our liquidity and cash flow in future
periods. (See Item 2: Description of Property for a full description
of our lease obligations.)
25
|
Payments Due by Period
|
||||||||||||
|
Less than
|
||||||||||||
|
Total
|
1
Year
|
1-2
Years
|
||||||||||
|
Operating
Leases
|
$ | 805,415 | $ | 324,968 | $ | 480,447 | ||||||
Recently Issued and Adopted
Accounting Pronouncements
In June
2009, the FASB issued the accounting codification provisions (the
“Codification”) as described in FASB ASC 105, Generally Accepted Accounting
Principles (formerly SFAS No. 168, The FASB Accounting Codification and the
Hierarchy of Generally Accepted Accounting Principles). Released on July 1,
2009, the Codification became the source of authoritative non-governmental U.S.
GAAP. Rules and interpretive releases of the SEC under authority of federal
securities laws are also sources of authoritative GAAP for SEC registrants. On
the effective date of these provisions, the Codification superseded all
then-existing non-SEC accounting and reporting standards. All other
non-grandfathered non-SEC accounting literature not included in the Codification
became non-authoritative. The Codification was effective for the Company’s
quarterly reporting period ended September 30, 2009. The adoption of the
provisions did not have any impact on the Company’s consolidated financial
statements other than changes in referencing to authoritative accounting
pronouncements.
Effective
January 1, 2009, the Company adopted new provisions of FASB ASC 815-40,
Contracts in Entity’s own Equity (formerly FASB Staff Position Emerging Issues
Task Force Issue No. 07-05, Determining Whether an Instrument (or
Embedded Feature) is Indexed to an Entity’s Own Stock ) which applies to any
freestanding financial instruments or embedded features that have the
characteristics of a derivative and to any freestanding financial instruments
that are potentially settled in an entity’s own common stock. The Company
adopted this standard on January 1, 2009 and has included additional disclosures
in its consolidated financial statements. See Note 7 – Derivative Liability for
a further discussion regarding the Company’s measurement of derivative
instruments
In May
2009, the FASB issued a new provision as described in FASB ASC 855, Subsequent
Events (formerly SFAS No. 165, Subsequent Events), which provides
guidance on events that occur after the balance sheet date but prior to the
issuance of the financial statements. The provisions distinguish events
requiring recognition in the financial statements and those that may require
disclosure in the financial statements and requires disclosure of the date
through which subsequent events were evaluated. The FASB subsequently issued ASU
2010-09 which among other things eliminated the requirement that SEC registrants
disclose the date through which it has evaluated subsequent events. The
provisions are effective for interim and annual periods ending after June 15,
2009. The adoption of the provisions did not have any impact on the Company’s
consolidated financial statements.
In April
2009, the FASB issued new provisions of FASB ASC 825, Financial Instruments
(formerly FASB Staff Position FAS 107-1 and APB 28-1, Interim Disclosures about
Fair Value of Financial Instruments) requiring entities to provide disclosures
about the fair value of financial instruments in interim financial information.
The provisions require an entity to disclose in the body or in the accompanying
notes of its summarized financial information for interim reporting periods and
in its financial statements for annual reporting periods the fair value of all
financial instruments for which it is practicable to estimate that value,
whether recognized or not recognized in the statement of financial position. The
Company adopted the provisions for the quarter ended June 30, 2009 and the
adoption of the provisions did not have a material impact on the Company’s
consolidated financial statements.
In August
2009, the FASB issued Accounting Standards Update 2009-04, Accounting for
Redeemable Equity Instruments — Amendment to Section 480-10-S99 (“Update
2009-04”). Update 2009-04 represents an update to Topic 480-10-S99,
Distinguishing Liabilities from Equity, based on Emerging Issues Task Force
(“EITF”) Topic D-98, “Classification and Measurement of Redeemable Securities.”
The Company adopted Update 2009-04 for the quarter ended September 30, 2009 and
the adoption of Update 2009-04 did not have a material impact on the Company’s
consolidated financial statements.
26
In August
2009, the FASB issued Accounting Standard Update 2009-05, Fair Value Measurement
and Disclosures — Measuring Liabilities at Fair Value (“Update
2009-05”) which includes amendments to Subtopic 820-10, Fair Value Measurement
and Disclosures – Overall of the FASB ASC. Update 2009-05 provides clarification
that in circumstances in which a quoted price in an active market for the
identical liability is not available, a reporting entity is required to measure
fair value of such liability using one or more of the techniques prescribed by
the update. The Company adopted Update 2009-05 for the quarter ended September
30, 2009. Management has determined that the adoption of Update 2009-05 did not
have a material impact on the Company’s consolidated financial
statements.
The
financial statements required hereby are located on pages F-1 through F-21 of
this report.
ITEM
9: Changes In and Disagreements with Accountants on Accounting and Financial
Disclosure
ITEM
9A: Controls and Procedures
Evaluation
of Disclosure Controls and Procedures
We
maintain a set of disclosure controls and procedures, as defined in Section
13a-15(e) of the Securities Exchange Act of 1934, as amended (the “Exchange
Act”), that are designed to ensure that information required to be disclosed by
us in the reports filed by us under the Securities Exchange Act of 1934, as
amended (the “Exchange Act”) is recorded, processed, summarized and reported
within the time periods specified in the SEC’s rules and forms. We carried out
an evaluation, under the supervision and with the participation of our Chief
Executive Officer and our Chief Financial Officer, of the effectiveness of the
design and operation of our disclosure controls and procedures pursuant to Rule
13a-15(b) of the Exchange Act. Based on that evaluation, our Chief Executive
Officer and our Chief Financial Officer concluded that our disclosure controls
and procedures were effective as of the end of the period covered by this
report.
Notwithstanding
the foregoing, there can be no assurance that the Company’s disclosure controls
and procedures will detect or uncover all failures of persons within the Company
to disclose material information otherwise required to be set forth in the
Company’s periodic reports. There are inherent limitations to the effectiveness
of any system of disclosure controls and procedures, including the possibility
of human error and the circumvention or overriding of the controls and
procedures. Accordingly, even effective disclosure controls and procedures can
only provide reasonable, not absolute, assurance of achieving their control
objectives.
Management’s
Report on Internal Control Over Financial Reporting
Our
management is responsible for establishing and maintaining adequate internal
control over financial reporting, as such term is defined in Exchange Act Rule
13a-15(f). Internal control over financial reporting is a process
designed to provide reasonable assurance regarding the reliability of financial
reporting and the preparation of financial statements for external purposes in
accordance with generally accepted accounting principles. Internal
control over financial reporting includes those policies and procedures that (i)
pertain to the maintenance of records that, in reasonable detail, accurately and
fairly reflect the transactions and dispositions of our assets; (ii) provide
reasonable assurance that transactions are recorded as necessary to permit
preparation of the financial statements in accordance with generally accepted
accounting principles, and that receipts and expenditures are being made only
with proper authorizations; and (iii) provide reasonable assurance regarding
prevention or timely detection of unauthorized acquisition, use or disposition
of our assets that could have a material effect on the financial
statements.
27
Because
of its inherent limitations, internal control over financial reporting may not
prevent or detect misstatements. Also, projections of any evaluation of
effectiveness to future periods are subject to the risk that controls may become
inadequate because of changes in conditions, or that the degree of compliance
with the policies or procedures may deteriorate.
Our
management, under the supervision of and with the participation of the Chief
Executive Officer and the Chief Financial Officer, assessed the effectiveness of
our internal control over financial reporting as of December 31, 2009 based on
criteria for effective control over financial reporting described in Internal
Control — Integrated Framework issued by the Committee of Sponsoring
Organizations of the Treadway Commission, or COSO. Based on this assessment, our
management concluded that our internal control over financial reporting was
effective as of December 31, 2009.
This
annual report does not include an attestation report of the Company's
independent registered public accounting firm regarding internal control over
financial reporting. Management's report was not subject to
attestation by the Company's registered public accounting firm pursuant to
temporary rules of the Securities and Exchange Commission that permit the
Company to provide only management's report in this annual report.
Changes
in Internal Controls over Financial Reporting
An
evaluation was performed under the supervision of the Company’s management,
including the Chief Executive Officer and Chief Financial Officer, as required
under Exchange Act Rules 13a-15(d) and 15d-15(d), of whether any change in the
Company’s internal control over financial reporting occurred during the fiscal
quarter ended December 31, 2009. Based on that evaluation, the
Company’s management, including the Chief Executive Officer and Chief Financial
Officer, concluded that no change in the Company’s internal controls over
financial reporting occurred during the fiscal quarter ended December 31, 2009
that has materially affected or is reasonably likely to materially affect, the
Company’s internal control over financial reporting.
None.
28
ITEM
10: Directors, Executive Officers, Promoters and Control Persons; Compliance
with Section 16(a) of the Exchange Act
Section
16(a) Beneficial Ownership Reporting Compliance
The
discussion under the heading “Security Ownership of Certain Beneficial Owners
and Management” in our definitive proxy statement for the 2010 Annual Meeting of
Stockholders is incorporated herein by reference to such proxy
statement.
Code
of Ethics
The
Company has adopted a Code of Ethics that is applicable to our principal
executive officer and principal financial officer and can be viewed on our
website www.virtualscopics.com.
ITEM
11. Executive Compensation
The
information required by this Item is incorporated in this report by reference to
our definitive Proxy Statement referred to in Item 10 above where such
information appears under the heading “Executive Compensation and Other
Matters.”
ITEM
12. Security Ownership of Certain Beneficial Owners and Management and Related
Stockholder Matters
The
information required by this Item regarding security ownership of certain
beneficial owners and management is incorporated in this report by reference to
our definitive Proxy Statement referred to in Item 10 above where such
information appears under the heading “Security Ownership of Certain Beneficial
Owners and Management” and “Equity Compensation Plans.”
ITEM
13. Certain Relationships and Related Transactions
The
information required by this Item is incorporated in this report by reference to
our definitive Proxy Statement referred to in Item 10 above where such
information appears under the heading “Certain Relationships and Related
Transactions.”
The
information required by this Item is incorporated in this report by reference to
our definitive Proxy Statement referred to in Item 10 above where such
information appears under the heading “Principal Accounting Fees and
Services.”
ITEM
15: Exhibits
The list
of exhibits required by this Item is incorporated in this Item by reference to
the exhibit index attached after the signature page to this report.
29
SIGNATURES
In
accordance with Section 13 or 15(d) of the Securities Exchange Act of
1934, the Registrant has caused this report to be signed on its behalf by the
undersigned, thereunto duly authorized.
|
March
23, 2010
|
VirtualScopics, Inc.
(Registrant)
|
|
|
/s/ Molly Henderson
|
||
|
Chief
Business and Financial Officer, Sr. Vice
President
|
POWER OF
ATTORNEY
KNOW ALL
BY THESE PRESENTS, that each person whose signature appears below constitutes
and appoints Jeffrey Markin and Molly Henderson, or either of them, as his or
her true and lawful attorneys-in-fact and agents, with full power of
substitution and resubstitution, for him and in his name, place and stead, in
any and all capacities, to sign any and all amendments to this Annual Report on
Form 10-K and any documents related to this report and filed pursuant to
the Securities and Exchange Act of 1934, and to file the same, with all exhibits
thereto, and other documents in connection therewith, with the Securities and
Exchange Commission, granting unto said attorneys-in-fact and agents, full power
and authority to do and perform each and every act and thing requisite and
necessary to be done in connection therewith as fully to all intents and
purposes as he might or could do in person, hereby ratifying and confirming all
that said attorneys-in-fact and agents, or their substitute or substitutes may
lawfully do or cause to be done by virtue hereof.
In
accordance with the Securities Exchange Act of 1934, this report has been signed
below by the following persons on behalf of the Registrant and in the capacities
and on the dates indicated.
|
DATE
|
SIGNATURE
|
TITLE
|
|||
|
March
23, 2010
|
/s/ Jeffrey Markin
|
President
and Chief Executive Officer
|
|||
|
(Jeffrey
Markin)
|
(Principal
Executive Officer)
|
||||
|
March
23, 2010
|
/s/ Molly Henderson
|
Chief
Business and Financial Officer and
|
|||
|
(Molly
Henderson)
|
Sr.
Vice President
|
||||
|
(Principal
Financial and Accounting Officer)
|
|||||
|
March
23, 2010
|
/s/ Robert Klimasewski
|
Chairman
of the Board of Directors
|
|||
|
(Robert
Klimasewski)
|
|||||
|
March
23, 2010
|
/s/ Norman Mintz
|
Director
|
|||
|
(Norman
Mintz)
|
|||||
|
March
23, 2010
|
/s/ Charles Phelps
|
Director
|
|||
|
(Charles
Phelps)
|
|||||
|
March
23, 2010
|
/s/ Sidney Knafel
|
Director
|
|||
|
(Sidney
Knafel)
|
|||||
|
March
23, 2010
|
/s/ Dan Kerpelman
|
Director
|
|||
|
(Dan
Kerpelman)
|
|||||
|
March
23, 2010
|
/s/ Terence Walts
|
Director
|
|||
|
(Terence
Walts)
|
|||||
|
/s/ Mostafa Analoui
|
Director
|
||||
|
(Mostafa
Analoui)
|
Exhibit
Index
|
2.1
|
Securities
Purchase Agreement dated September 12, 2007 by and among the
VirtualScopics, Inc. and the Buyers listed on the Schedule of Buyers
attached thereto (Incorporated herein by reference to Exhibit 10.1 of the
VirtualScopics, Inc. Report on Form 8-K filed with the Securities and
Exchange Commission on September 17, 2007 (File No. 000-52018)).
(Schedules and exhibits have been omitted pursuant to Regulation S-B Item
601(b)(2) and will be made available to the Commission upon
request).
|
|
3.1
|
Certificate
of Incorporation of VirtualScopics, Inc. dated April 21, 1988
(Incorporated herein by reference to Exhibit 3.1 of the VirtualScopics,
Inc.’s Registration Statement on Form SB-2 filed with the Securities and
Exchange Commission on November 4, 2004 (File No.
333-120253)).
|
|
3.2
|
Certificate
of Amendment of Certificate of Incorporation of VirtualScopics, Inc. dated
February 2, 1989 (Incorporated herein by reference to Exhibit 3.1a of the
VirtualScopics, Inc.’s Registration Statement on Form SB-2 filed with the
Securities and Exchange Commission on November 4, 2004 (File No.
333-120253)).
|
|
3.3
|
Certificate
for Renewal and Revival of Certificate of Incorporation of VirtualScopics,
Inc. dated February 23, 2004 (Incorporated herein by reference to Exhibit
3.1b of the VirtualScopics, Inc.’s Registration Statement on Form SB-2
filed with the Securities and Exchange Commission on November 4, 2004
(File No. 333-120253)).
|
|
3.4
|
Certificate
of Amendment of Certificate of Incorporation of VirtualScopics, Inc. dated
August 20, 2004 (Incorporated herein by reference to Exhibit 3.1c of the
VirtualScopics, Inc.’s Registration Statement on Form SB-2 filed with the
Securities and Exchange Commission on November 4, 2004 (File No.
333-120253)).
|
|
3.5
|
Certificate
of Amendment of Certificate of Incorporation of VirtualScopics, Inc. dated
October 7, 2005 (Incorporated by reference to Exhibit 3.5 the
VirtualScopics, Inc.’s Annual Report on Form 10-KSB filed with the
Securities and Exchange Commission on March 30, 2006 (File No.
333-120253)).
|
|
3.6
|
Certificate
of Amendment to Certificate of Incorporation of VirtualScopics, Inc. dated
November 4, 2005 (Incorporated herein by reference to Exhibit 3.1 of the
VirtualScopics, Inc. Report on Form 8-K filed with the Securities and
Exchange Commission on November 10, 2005 (File No.
333-120253)).
|
|
3.7
|
Certificate
of Designations, Powers, Preferences and Other Rights and Qualifications
of Series A Convertible Preferred Stock of VirtualScopics, Inc. dated
November 4, 2005 (Incorporated herein by reference to Exhibit 3.2 of the
VirtualScopics, Inc. Report on Form 8-K filed with the Securities and
Exchange Commission on November 10, 2005 (File No.
333-120253)).
|
|
3.8
|
Certificate
of Designation of Rights and Preferences of the Series B Preferred Stock
of VirtualScopics, Inc. dated September 12, 2007 (Incorporated herein by
reference to Exhibit 3.1 of the VirtualScopics, Inc. Report on Form 8-K
filed with the Securities and Exchange Commission on September 17, 2007
(File No. 000-52018)).
|
|
3.9
|
Certificate
of Amendment to Certificate of Designation of Rights and Preferences of
the Series B Preferred Stock of VirtualScopics, Inc. dated November 27,
2007 (Incorporated herein by reference to Exhibit 3.1 of the
VirtualScopics, Inc. Report on Form 8-K filed with the Securities and
Exchange Commission on November 29, 2007 (File No.
000-52018)).
|
|
3.10
|
Amended
and Restated Bylaws of VirtualScopics, Inc. dated August 28, 2007
(Incorporated herein by reference to Exhibit 3.9 to the VirtualScopics,
Inc.’s Registration Statement of Form S-3 filed with the Securities
Exchange Commission on October 11, 2007 (File No.
333-146635)).
|
31
|
4.1
|
Registration
Rights Agreement Dated September 12, 2007 between the VirtualScopics,
Inc. and the Buyers listed on the Schedule of Buyers thereto
(Incorporated herein by reference to Exhibit 10.3 of the VirtualScopics,
Inc. Report on Form 8-K filed with the Securities and Exchange Commission
on September 17, 2007 (File No.
000-52018)).
|
|
4.2
|
Form
of Warrant to Purchase Common Stock of VirtualScopics (Incorporated herein
by reference to Exhibit 10.2 of the VirtualScopics, Inc. Report on Form
8-K filed with the Securities and Exchange Commission on September 17,
2007 (File No. 000-52018)).
|
|
10.1
|
VirtualScopics,
Inc. 2005 Long Term Incentive Plan (Incorporated herein by reference to
Exhibit 10.1 of the VirtualScopics, Inc. Report on Form 8-K filed with the
Securities and Exchange Commission on November 10, 2005 (File No.
333-120253)).*
|
|
10.2
|
Clinical
Imaging Development and Services Agreement dated July 26, 2005 by and
between VirtualScopics, LLC and Pfizer, Inc. (Incorporated herein by
reference to Exhibit 10.6 of the VirtualScopics, Inc. Report on Form 8-K
filed with the Securities and Exchange Commission on November 10, 2005
(File No. 333-120253)).
|
|
10.3
|
Amendment
to Clinical Imaging Development and Services Agreement dated October 5,
2006 by and between VirtualScopics, Inc. and Pfizer, Inc. (Incorporated
herein by reference to Exhibit 10.1 to the VirtualScopics, Inc. Report on
Form 8-K filed with the Securities and Exchange Commission on November 28,
2006 (File No. 000-52018)).
|
|
10.4
|
Equipment
Purchase Agreement dated December, 2003 by and between VirtualScopics, LLC
and the University of Rochester Medical Center. (Incorporated herein by
reference to Exhibit 10.9 of the VirtualScopics, Inc. Report on Form 8-K
filed with the Securities and Exchange Commission on November 10, 2005
(File No. 333-120253)).
|
|
10.5
|
Determination
of Intellectual Property Rights Agreement dated July 1, 2002 by and
between VirtualScopics, LLC and the University of Rochester (Incorporated
herein by reference to Exhibit 10.10 of the VirtualScopics, Inc. Report on
Form 8-K filed with the Securities and Exchange Commission on November 10,
2005 (File No. 333-120253)).
|
|
10.6
|
Option
Agreements with Robert Klimasewski dated November 5, 2005 (Incorporated
herein by reference to Exhibit 10.18 to the VirtualScopics, Inc.
Registration Statement on Form SB-2 filed with the Securities and Exchange
Commission on May 2, 2006 (File No.
333-133747)).*
|
|
10.7
|
Form
of April 28, 2006 Indemnification Agreement by and among VirtualScopics,
Inc. and the directors and officers of the VirtualScopics, Inc.
(Incorporated herein by reference to Exhibit 10.19 to the VirtualScopics,
Inc. Registration Statement on Form SB-2 filed with the Securities and
Exchange Commission on May 2, 2006 (File No.
333-133747)).*
|
|
10.8
|
VirtualScopics,
Inc. Amended and Restated 2006 Long Term Incentive Plan (incorporated
herein by reference to Appendix B to the Registrant’s Definitive Proxy
Statement on Schedule 14A, filed with the Commission on April 10, 2009
(File No. 000-52018))
|
|
10.9
|
2007
Bonus Plan (Incorporated herein by reference to Exhibit 10.21 of the
VirtualScopics, Inc. Annual Report on Form 10-KSB filed with the
Securities and Exchange Commission on April 2, 2007 (File No.
000-52018)).*
|
|
10.10
|
Independent
Director Compensation Plan (Incorporated herein by reference to Exhibit
10.22 of the VirtualScopics, Inc. Annual Report on Form 10-KSB filed with
the Securities and Exchange Commission on April 2, 2007 (File No.
000-52018))*
|
|
10.11
|
Indemnification
Agreement by and among VirtualScopics, Inc. and Norman Mintz, dated as of
August 1, 2007. (Reference is made to the VirtualScopics, Inc. Form of
Indemnification Agreement by and among VirtualScopics, Inc., and the
directors and officers of the VirtualScopics, Inc. filed as Exhibit 10.19
to the VirtualScopics, Inc. Registration Statement on Form SB-2 filed with
the Securities and Exchange Commission on May 2, 2006 (File No.
333-133747)).*
|
32
|
10.12
|
Standstill
Agreement by and between VirtualScopics, Inc. Jeffrey Markin, dated
September 12, 2007. (Incorporated herein by reference to Exhibit 10.4 of
the VirtualScopics, Inc. Report on Form 8-K filed with the Securities and
Exchange Commission on September 17, 2007 (File No.
000-52018)).*
|
|
10.13
|
Non-Employee
Director Compensation Plan (Incorporated herein by reference to Exhibit
10.1 to the VirtualScopics, Inc. Report on Form 10-Q filed with the
Securities and Exchange Commission on August 12, 2008 (File No. 000-52018)).*
|
|
10.14
|
2009
Bonus Plan (Incorporated herein by reference to Exhibit 10.3 of the
VirtualScopics, Inc. Quarterly Report on Form 10-Q filed with
the Securities and Exchange Commission on May 15, 2009 (File No.
000-52018)).*
|
|
10.15
|
Employment
Agreement dated February 24, 2009, by and between Jeffrey Markin and
VirtualScopics, Inc.* (Incorporated herein by reference to
Exhibit 10.17 to the VirtualScopics, Inc., Annual Report on Form 10-K
filed with the Securities and Exchange Commission on March 19, 2009 (File
No. 000-52018)).
|
|
10.16
|
Employment
Agreement dated February 24, 2009, by and between Molly Henderson and
VirtualScopics, Inc.* (Incorporated herein by reference to
Exhibit 10.18 to the VirtualScopics, Inc., 2008 Annual Report on Form 10-K
filed with the Securities and Exchange Commission on March 19, 2009 (File
No. 000-52018)).
|
|
21
|
Subsidiaries
of VirtualScopics, Inc.
|
|
23.1
|
Consent
of Marcum LLP
|
|
24
|
Power
of Attorney (included on the signature page to this
report)
|
|
31.1
|
Certification
of Chief Executive Officer as required by Rule 13a-14 Or 15d-14 of the
Securities Exchange Act of 1934, as adopted pursuant to Section 302 Of The
Sarbanes-Oxley Act of 2002
|
|
31.2
|
Certification
of Chief Financial Officer as required by Rule 13a-14 Or 15d-14 of the
Securities Exchange Act of 1934, as adopted pursuant to Section 302 Of The
Sarbanes-Oxley Act of 2002
|
|
32.1
|
Certification
pursuant to 18 U.S.C. Section 1350 by the Chief Executive Officer, as
adopted pursuant to Section 906 of the Sarbanes-Oxley Act of
2002
|
|
32.2
|
Certification
pursuant to 18 U.S.C. Section 1350 by the Chief Financial Officer, as
adopted pursuant to Section 906 of the Sarbanes-Oxley Act of
2002
|
|
*
|
Management
contract or compensatory plan or
arrangement.
|
33
VirtualScopics,
Inc. and Subsidiary
Index
to Consolidated Financial Statements
|
Report
of Independent Registered Public Accounting Firm
|
F-2
|
|
|
Consolidated
Balance Sheets as of December 31, 2009 and 2008
|
F-3
|
|
|
Consolidated
Statements of Operations for the Years Ended December 31, 2009 and
2008
|
F-4
|
|
|
Consolidated
Statements of Changes in Stockholders’ Equity for the Years Ended December
31, 2009 and 2008
|
F-5
|
|
|
Consolidated
Statements of Cash Flows for the Years Ended December 31, 2009 and
2008
|
F-6
|
|
|
Notes
to Consolidated Financial Statements
|
|
F-7
- F-21
|
F-1
REPORT OF INDEPENDENT
REGISTERED PUBLIC ACCOUNTING FIRM
To the
Audit Committee of the
Board of
Directors and Stockholders of
VirtualScopics,
Inc. and Subsidiary
We have
audited the accompanying consolidated balance sheets of VirtualScopics, Inc. and
Subsidiary (the “Company”) as of December 31, 2009 and 2008, and the related
consolidated statements of operations, changes in stockholders’ equity and cash
flows for the years then ended. These consolidated financial
statements are the responsibility of the Company’s management. Our
responsibility is to express an opinion on these consolidated financial
statements based on our audits.
We
conducted our audits in accordance with the standards of the Public Company
Accounting Oversight Board (United States). Those standards require
that we plan and perform the audits to obtain reasonable assurance about whether
the financial statements are free of material misstatement. The
Company is not required to have, nor were we engaged to perform, an audit of its
internal control over financial reporting. Our audits included
consideration of internal control over financial reporting as a basis for
designing audit procedures that are appropriate in the circumstances, but not
for the purpose of expressing an opinion on the effectiveness of the Company’s
internal control over financial reporting. Accordingly, we express no
such opinion. An audit also includes examining, on a test basis,
evidence supporting the amounts and disclosures in the financial statements,
assessing the accounting principles used and significant estimates made by
management, as well as evaluating the overall financial statement
presentation. We believe that our audits provide a reasonable basis
for our opinion.
In our
opinion, the consolidated financial statements referred to above present fairly,
in all material respects, the consolidated financial position of VirtualScopics,
Inc. and Subsidiary as of December 31, 2009 and 2008, and the results of their
operations and their cash flows for the years then ended in conformity with
accounting principles generally accepted in the United States of
America.
As discussed in Note 2 to the
consolidated financial statements effective January 1, 2009, the Company adopted
a new accounting principle which required it to change the manner in which it
accounts for certain equity instruments (Note 5).
/s/
Marcum LLP
New York,
New York
March 23,
2010
F-2
VirtualScopics,
Inc. and Subsidiary
Consolidated
Balance Sheets
|
December 31,
|
||||||||
|
2009
|
2008
|
|||||||
|
Assets
|
||||||||
|
Current
assets
|
||||||||
|
Cash
|
$ | 4,327,410 | $ | 3,143,904 | ||||
|
Accounts
receivable, net of allowance for doubtful accounts of $20,786 and $0,
respectively
|
1,481,381 | 1,021,110 | ||||||
|
Prepaid
expenses and other assets
|
387,247 | 263,297 | ||||||
|
Total
current assets
|
6,196,038 | 4,428,311 | ||||||
|
Patents,
net
|
1,832,560 | 1,920,446 | ||||||
|
Property
and equipment, net
|
456,169 | 355,479 | ||||||
|
Other
assets
|
33,258 | 156,788 | ||||||
|
Total
assets
|
$ | 8,518,025 | $ | 6,861,024 | ||||
|
Liabilities
and Stockholders’ Equity
|
||||||||
|
Current
liabilities
|
||||||||
|
Accounts
payable and accrued expenses
|
$ | 658,430 | $ | 659,009 | ||||
|
Accrued
payroll
|
837,177 | 554,425 | ||||||
|
Unearned
revenue
|
1,011,498 | 291,594 | ||||||
|
Derivative
liability
|
1,139,953 | - | ||||||
|
Total
current liabilities
|
3,647,058 | 1,505,028 | ||||||
|
Commitments
and Contingencies
|
||||||||
|
Stockholders’
Equity
|
||||||||
|
Convertible
preferred stock, $0.001 par value; 15,000,000 shares
authorized;
|
||||||||
|
Series
A; 8,400 shares authorized; issued and outstanding; 3,438 and 3,976 at
December 31, 2009 and 2008, respectively, liquidation preference $1,000
per share
|
3 | 4 | ||||||
|
Series
B; 6,000 shares authorized; issued and outstanding; 2,910 and 4,226 at
December 31, 2009 and 2008, respectively, liquidation preference $1,000
per share
|
3 | 4 | ||||||
|
Common
stock, $0.001 par value; 85,000,000 shares authorized;
|
25,233 | 23,503 | ||||||
|
issued
and outstanding, 25,233,255 shares at December 31, 2009 and 23,502,352
shares at December 31, 2008
|
||||||||
|
Additional
paid-in capital
|
14,354,929 | 16,546,550 | ||||||
|
Accumulated
deficit
|
(9,509,201 | ) | (11,214,065 | ) | ||||
|
Total
stockholders’ equity
|
4,870,967 | 5,355,996 | ||||||
|
Total
liabilities and stockholders’ equity
|
$ | 8,518,025 | $ | 6,861,024 | ||||
The
accompanying notes are an integral part of these consolidated financial
statements.
F-3
VirtualScopics,
Inc. and Subsidiary
Consolidated
Statements of Operations
|
For the Years Ended December 31,
|
||||||||
|
2009
|
2008
|
|||||||
|
Revenues
|
$ | 10,392,825 | $ | 7,130,518 | ||||
|
Cost
of services
|
4,777,471 | 4,031,198 | ||||||
|
Gross
profit
|
5,615,354 | 3,099,320 | ||||||
|
Operating
expenses
|
||||||||
|
Research
and development
|
975,311 | 941,193 | ||||||
|
Sales
and marketing
|
1,240,310 | 1,219,882 | ||||||
|
General
and administrative
|
3,209,419 | 3,158,359 | ||||||
|
Depreciation
and amortization
|
469,585 | 466,150 | ||||||
|
Total
operating expenses
|
5,894,625 | 5,785,584 | ||||||
|
Operating
loss
|
(279,271 | ) | (2,686,264 | ) | ||||
|
Other
income (expense)
|
||||||||
|
Interest
income
|
7,116 | 73,599 | ||||||
|
Other
expense
|
(22,027 | ) | (16,077 | ) | ||||
|
Loss
on derivative financial instrument
|
(717,045 | ) | - | |||||
|
Total
other (expense) income
|
(731,956 | ) | 57,522 | |||||
|
Net
loss
|
(1,011,227 | ) | (2,628,742 | ) | ||||
|
Series
B preferred stock cash dividend
|
304,318 | 338,827 | ||||||
|
Net
loss attributable to common stockholders
|
$ | (1,315,545 | ) | $ | (2,967,569 | ) | ||
|
Basic
and diluted net loss per common share
|
$ | (0.05 | ) | $ | (0.13 | ) | ||
|
Weighted
average number of common shares outstanding basic and
diluted
|
24,102,126 | 23,389,705 | ||||||
The
accompanying notes are an integral part of these consolidated financial
statements.
F-4
VirtualScopics,
Inc. and Subsidiary
Consolidated
Statements of Changes in Stockholders’ Equity
For
the Years Ended December 31, 2009 and 2008
|
Series A
Preferred Stock
|
Series B
Preferred
Stock
|
Common Stock
|
||||||||||||||||||||||||||||||||||
|
Shares
|
Amount
|
Shares
|
Amount
|
Shares
|
Amount
|
Additional
Paid-In Capital
|
Accumulated
Deficit
|
Total
|
||||||||||||||||||||||||||||
|
Balances
at December 31, 2007
|
4,001 | $ | 4 | 4,230 | $ | 4 | 23,225,664 | $ | 23,226 | $ | 15,616,124 | $ | (8,585,323 | ) | $ | 7,054,035 | ||||||||||||||||||||
|
Conversion
of Series A Preferred to Common Stock
|
(25 | ) | - | - | - | 20,759 | 21 | (21 | ) | - | - | |||||||||||||||||||||||||
|
Conversion
of Series B Preferred to Common Stock
|
- | - | (4 | ) | - | 3,321 | 3 | (3 | ) | - | - | |||||||||||||||||||||||||
|
Exercise
of warrants
|
- | - | - | - | 87,601 | 88 | 788 | - | 876 | |||||||||||||||||||||||||||
|
Amortization
of stock option costs
|
- | - | - | - | - | - | 1,047,654 | - | 1,047,654 | |||||||||||||||||||||||||||
|
Common
stock issued for rent
|
- | - | - | - | 165,007 | 165 | 220,835 | - | 221,000 | |||||||||||||||||||||||||||
|
Series
B preferred stock cash dividends based on 8% annual rate
|
- | - | - | - | - | - | (338,827 | ) | - | (338,827 | ) | |||||||||||||||||||||||||
|
Net
loss
|
(2,628,742 | ) | $ | (2,628,742 | ) | |||||||||||||||||||||||||||||||
|
Balances
at December 31, 2008
|
3,976 | $ | 4 | 4,226 | $ | 4 | 23,502,352 | $ | 23,503 | $ | 16,546,550 | $ | (11,214,065 | ) | $ | 5,355,996 | ||||||||||||||||||||
|
Cumulative
effect of change in accounting principle January 1, 2009 reclassification
of equity-linked financial instruments to derivative
liability
|
- | - | - | - | - | - | (3,138,999 | ) | 2,716,091 | (422,908 | ) | |||||||||||||||||||||||||
|
Conversion
of Series A Preferred to Common Stock
|
(538 | ) | (1 | ) | - | - | 446,319 | 446 | (445 | ) | - | - | ||||||||||||||||||||||||
|
Conversion
of Series B Preferred to Common Stock
|
- | - | (1,316 | ) | (1 | ) | 1,092,752 | 1,093 | (1,092 | ) | - | - | ||||||||||||||||||||||||
|
Amortization
of stock option costs
|
- | - | - | - | - | - | 1,027,561 | - | 1,027,561 | |||||||||||||||||||||||||||
|
Common
stock issued for rent
|
- | - | - | - | 88,132 | 88 | 105,482 | - | 105,570 | |||||||||||||||||||||||||||
|
Restricted
stock units issuance
|
103,700 | 103 | 120,190 | 120,293 | ||||||||||||||||||||||||||||||||
|
Series
B preferred stock cash dividends based on 8% annual rate
|
- | - | - | - | - | - | (304,318 | ) | - | (304,318 | ) | |||||||||||||||||||||||||
|
Net
loss
|
- | - | - | - | - | - | - | (1,011,227 | ) | $ | (1,011,227 | ) | ||||||||||||||||||||||||
|
Balances
at December 31, 2009
|
3,438 | $ | 3 | 2,910 | $ | 3 | 25,233,255 | $ | 25,233 | $ | 14,354,929 | $ | (9,509,201 | ) | $ | 4,870,967 | ||||||||||||||||||||
The
accompanying notes are an integral part of these consolidated financial
statements.
F-5
VirtualScopics,
Inc. and Subsidiary
Consolidated Statements of Cash Flows
|
For the Years Ended December 31,
|
||||||||
|
2009
|
2008
|
|||||||
|
Cash
flows from operating activities
|
||||||||
|
Net
loss
|
$ | (1,011,227 | ) | $ | (2,628,742 | ) | ||
|
Adjustments
to reconcile net loss to net cash provided by (used in) operating
activities
|
||||||||
|
Depreciation
and amortization
|
469,585 | 466,150 | ||||||
|
Loss
on disposition and write downs of property and equipment
|
2,904 | - | ||||||
|
Provision
for doubtful accounts
|
20,786 | - | ||||||
|
Stock-based
compensation
|
1,067,080 | 1,123,283 | ||||||
|
Issuance
of equity instruments for rent
|
105,570 | 221,000 | ||||||
|
Issuance
of restricted stock units
|
120,293 | - | ||||||
|
Accrual
for future issuance of equity instruments for rent
|
- | 207,060 | ||||||
|
Loss
on derivative financial instrument
|
717,045 | - | ||||||
|
Changes
in operating assets and liabilities
|
||||||||
|
Accounts
receivable
|
(481,057 | ) | (372,810 | ) | ||||
|
Prepaid
expenses and other assets
|
(123,950 | ) | 43,004 | |||||
|
Unearned
revenue
|
719,904 | 12,319 | ||||||
|
Accounts
payable and accrued expenses
|
(40,098 | ) | (250,373 | ) | ||||
|
Accrued
payroll
|
282,752 | 333,412 | ||||||
|
Total
adjustments
|
2,860,814 | 1,783,045 | ||||||
|
Net
cash provided by (used in) operating activities
|
1,849,587 | (845,697 | ) | |||||
|
Cash
flows from investing activities
|
||||||||
|
Purchase
of equipment
|
(317,067 | ) | (26,731 | ) | ||||
|
Acquisition
of patents
|
(44,696 | ) | (100,351 | ) | ||||
|
Net
cash used in investing activities
|
(361,763 | ) | (127,082 | ) | ||||
|
Cash
flows from financing activities
|
||||||||
|
Proceeds
from the exercise of warrants and stock options
|
- | 876 | ||||||
|
Restricted
cash
|
- | 498,799 | ||||||
|
Cash
dividends on series B preferred stock
|
(304,318 | ) | (338,827 | ) | ||||
|
Net
cash (used in) provided by financing activities
|
(304,318 | ) | 160,848 | |||||
|
Net
increase (decrease) in cash and cash equivalents
|
1,183,506 | (811,931 | ) | |||||
|
Cash
and cash equivalents
|
||||||||
|
Beginning
of year
|
3,143,904 | 3,955,835 | ||||||
|
End
of year
|
$ | 4,327,410 | $ | 3,143,904 | ||||
|
Supplemental
disclosure of cash flow information
|
||||||||
|
Cash
paid during the year for:
|
||||||||
|
Taxes
|
$ | - | $ | - | ||||
|
Non-cash
financing activity:
|
||||||||
|
Issuance
of common stock for partial payment of rent in equity
|
$ | 105,570 | $ | 221,000 | ||||
|
Issuance
of restricted stock units
|
$ | 120,293 | $ | - | ||||
F-6
VirtualScopics,
Inc. and Subsidiary
Notes
to Consolidated Financial Statements
NOTE
1 - Organization and Basis of Presentation
Nature of
Business
The
Company’s headquarters are located in Rochester, New York. The
Company has created a suite of image analysis software tools and applications
which are used in detecting and analyzing specific structures in medical
images. The Company’s developed software provides measurement and
visualization capabilities designed to improve clinical research and
development.
In
February 2008, the Company received a written notice from the Nasdaq Stock
Market indicating that its common stock was not in compliance with minimum bid
price ($1.00) required for continued listing on the Nasdaq Capital
Market. The Company was granted additional time by Nasdaq to regain
compliance with the continued listing requirements. On May 19, 2009, the Company
regained compliance and remains in compliance as of the date of this
report.
NOTE
2 - Summary of Significant Accounting Policies
Principles of
Consolidation
The
accompanying consolidated financial statements include the accounts of the
Company and its wholly-owned subsidiary, VirtualScopics, LLC. All
significant intercompany balances and transactions have been eliminated in
consolidation.
Use of
Estimates
The
preparation of financial statements in conformity with accounting principles
generally accepted in the United States of America requires management to make
estimates and assumptions that affect the reported amounts of assets and
liabilities and disclosure of contingent assets and liabilities at the date of
the financial statements and the reported amounts of revenues and expenses
during the year. Actual results could differ from those
estimates.
Cash and Cash
Equivalents
The
Company considers all highly liquid investments when purchased with a maturity
of three months or less to be cash equivalents. At December 31, 2009
and 2008, the Company had no cash equivalents.
Concentration of Credit
Risk
Financial
instruments that potentially subject the Company to significant concentrations
of credit risk consist of cash and cash equivalents. At times, our
cash and cash equivalents may be uninsured or in deposit accounts that exceed
the Federal Deposit Insurance Corporation (“FDIC”) insurance
limits.
Accounts
Receivable
Accounts
receivable are stated at estimated net realizable value. Accounts
receivable are comprised of balances due from customers net of estimated
allowances for uncollectible accounts, if any. In determining collectability,
historical trends are evaluated and specific customer issues are reviewed to
arrive at appropriate allowances, if any. The allowance for doubtful accounts at
December 31, 2009 and 2008 was $20,768 and $0, respectively.
Right to Use
Equipment
In April
2004, the Company obtained the right to use a Magnetic Resonance Imaging (“MRI”)
machine owned by the University of Rochester for a period of seven years (Note
11). The Company has recorded the value of the right in other assets
in the accompanying consolidated balance sheets and is amortizing the asset
based on usage over the life of the agreement.
For the
years ended December 31, 2009 and 2008, the total amount charged to amortization
on this asset which is included in the accompanying consolidated statements of
operations was $123,530 and $123,529, respectively. As of December
31, 2009 and 2008, the unamortized balance of this asset is $156,787 and
$280,317, respectively, of which $123,529 is classified within prepaid expenses
and other assets for 2009 and 2008.
F-7
VirtualScopics,
Inc. and Subsidiary
Notes
to Consolidated Financial Statements
Patents
Costs
incurred to acquire and file for patents, including legal costs, are capitalized
as long-lived assets and amortized on a straight-line basis over the lower of
the estimated useful life or legal life of the patent, which is 20
years.
Property and
Equipment
Property
and equipment are carried at cost less accumulated depreciation. When
retired or otherwise disposed of, the related cost and accumulated depreciation
are removed from the respective accounts and any resulting gain or loss is
recognized and included in income.
Expenditures
for maintenance and repairs, which do not generally extend the useful life of
the assets, are charged to expense as incurred. Gains or losses on disposal of
property and equipment are reflected in general and administrative expense in
the statement of operations in the period of disposal.
Depreciation
is computed using the straight-line method over the following useful
lives:
|
Years
|
||
|
Office/computer
equipment
|
3-5
|
|
|
Furniture
and fixtures
|
5-7
|
|
|
Software
|
|
3
|
Leasehold
improvements, which are included in property and equipment, are recorded at cost
less accumulated depreciation. Depreciation on leasehold improvements is
computed using the straight-line method over the shorter of their estimated
useful lives or the lease term, whichever is shorter.
Impairment of Long-Lived
Assets
The
Company reviews long-lived assets, including intangible assets other than
goodwill, for impairment whenever events or changes in circumstances indicate
that the carrying value of the asset may not be recoverable. In connection with
this review, the Company also reevaluates the periods of depreciation and
amortization for these assets. The Company assesses recoverability by
determining whether the net book value of the related asset will be recovered
through the projected undiscounted future cash flows of the asset. If the
Company determines that the carrying value of the asset may not be recoverable,
it measures any impairment based on the projected future discounted cash flows
as compared to the asset’s carrying value. Through December 31, 2009, the
Company has not recorded any impairment charges on its long-lived
assets.
Derivative Financial
Instruments
The
Company does not use derivative instruments to hedge exposures to cash flow,
market or foreign currency risks. The Company evaluates all of its
financial instruments to determine if such instruments are derivatives or
contain features that qualify as embedded derivatives. For derivative
financial instruments that are accounted for as liabilities, the derivative
instrument is initially recorded at its fair value and is then re-valued at each
reporting date, with changes in the fair value reported in the consolidated
statements of operations. For stock-based derivative financial
instruments, the Company uses the Black-Scholes option valuation model to value
the derivative instruments at inception and on subsequent valuation
dates. The classification of derivative instruments, including
whether such instruments should be recorded as liabilities or as equity, is
evaluated at the end of each reporting period. Derivative instrument
liabilities are classified in the balance sheet as current or non-current based
on whether or not net-cash settlement of the derivative instrument could be
required within 12 months of the balance sheet date (Note 5).
F-8
VirtualScopics,
Inc. and Subsidiary
Notes
to Consolidated Financial Statements
Revenue
Recognition
The
Company recognizes revenue when it is realized or realizable and
earned. The Company considers revenue realized or realizable and
earned when an agreement exists, services and products are provided to the
customer, prices are fixed or determinable, and collectability is reasonably
assured. Revenues are reduced for estimated discounts and other
allowances, if any.
The
Company provides advanced medical image analysis on a per analysis basis, and
recognizes revenue when the image analysis is completed and delivered to the
customer. Revenue related to project, data and site management
services is recognized as the services are rendered and in accordance with the
terms of the contract. Consulting revenue is recognized once the
services are rendered and typically charged as an hourly rate.
Occasionally,
the Company provides software development services to its customers, which may
require significant development, modification, and
customization. Software development revenue is billed on a fixed
price basis and recognized upon delivery of the software and acceptance by the
customer on a completed contract basis. The Company does not sell
software, software licenses, upgrades or enhancements, or post-contract customer
services.
Reimbursements
received for out-of-pocket expenses incurred are reported as revenue in the
financial statements.
Income
Taxes
Income
taxes are accounted for under the asset and liability
method. Deferred tax assets and liabilities are recognized for the
future tax consequences attributable to differences between the financial
statement carrying amounts of existing assets and liabilities and their
respective tax bases, and operating loss and tax credit
carryforwards. Deferred tax assets and liabilities are measured using
enacted tax rates expected to apply to taxable income in the years in which
those temporary differences are expected to be recovered or
settled. The effect on deferred tax assets and liabilities of a
change in tax rates is recognized in operations in the period that includes the
enactment date. A valuation allowance is provided when it is more
likely than not that some portion or all of a deferred tax asset will not be
realized. The ultimate realization of deferred tax assets is
dependent upon the generation of future taxable income and the reversal of
deferred tax liabilities during the period in which related temporary
differences become deductible. The benefit of tax positions taken or expected to
be taken in the Company’s income tax returns are recognized in the consolidated
financial statements if such positions are more likely than not of being
sustained.
Research and
Development
Research
and development expense relates to the development of new products and processes
including significant improvements to existing products. These costs are
expensed as incurred. Research and development costs for the year ended December
31, 2009 and 2008 were $975,311 and $941,193, respectively.
Fair Value of Financial
Instruments
Fair
value of financial instruments is defined as an exit price, which is the price
that would be received upon sale of an asset or paid upon transfer of a
liability in an orderly transaction between market participants at the
measurement date. The degree of judgment utilized in measuring the
fair value of assets and liabilities generally correlates to the level of
pricing observability. Financial assets and liabilities with readily
available, actively quoted prices or for which fair value can be measured from
actively quoted prices in active markets generally have more pricing
observability and require less judgment in measuring fair
value. Conversely, financial assets and liabilities that are rarely
traded or not quoted have less price observability and are generally measured at
fair value using valuation models that require more judgment. These
valuation techniques involve some level of management estimation and judgment,
the degree of which is dependent on the price transparency of the asset,
liability or market and the nature of the asset or liability. The
Company has categorized its financial assets and liabilities measured at fair
value into a three-level hierarchy. See Note 5 – Derivative Liability
for a further discussion regarding the Company’s measurement of financial assets
and liabilities at fair value.
F-9
VirtualScopics,
Inc. and Subsidiary
Notes
to Consolidated Financial Statements
Stock Based
Compensation
For the
year ended December 31, 2009 and 2008, the Company’s consolidated statements of
operations reflect stock-based compensation expense for stock options granted
under its long-term stock incentive plans amounting to $1,067,080 and
$1,123,283, respectively.
Stock
options issued under the Company’s long-term incentive plans are granted with an
exercise price equal to no less than the market price of the Company’s stock at
the date of grant and expire up to ten years from the date of
grant. These options generally vest over a three- or four-year
period.
The fair
value of stock options granted was determined on the grant date using
assumptions for risk free interest rate, the expected term, expected volatility,
and expected dividend yield. The risk free interest rate is based on
U.S. Treasury zero-coupon yield curve over the expected term of the
option. The expected term assumption is primarily based on the
Company’s historical data related to exercise and post-vesting cancellation
information, which is expected to be similar to future results. Since
the Company has limited historical volatility information, it bases its expected
volatility on the historical volatility of similar entities whose share prices
are publicly available. In making its determination as to similarity,
the Company considered the industry, stage of life cycle, size, and financial
leverage of such other entities. The Company’s model includes a zero
dividend yield assumption, as the Company has not historically paid nor does it
anticipate paying dividends on its common stock. The Company’s model
does not include a discount for post-vesting restrictions, as the Company has
not issued awards with such restrictions. The periodic expense is
then determined based on the valuation of the options, and at that time an
estimated forfeiture rate is used to reduce the expense recorded. The
Company’s estimate of pre-vesting forfeitures is primarily based on the
Company’s historical experience and is adjusted to reflect actual forfeitures as
the options vest.
The
following assumptions were used to estimate the fair value of options granted
for the year ended December 31, 2009 and 2008 using the Black-Scholes
option-pricing model:
|
December
31,
|
||||||||
|
2009
|
2008
|
|||||||
|
Risk
free interest rate
|
2.81 | % | 3.85 | % | ||||
|
Expected
term (years)
|
8.10 | 9.71 | ||||||
|
Expected
volatility
|
73.6 | % | 89.7 | % | ||||
|
Expected
dividend yield
|
- | - | ||||||
Loss Per
Share
Basic
loss per share is computed by dividing the net loss applicable to common shares
by the weighted average number of common shares outstanding during the period.
Diluted loss attributable to common shares adjusts basic loss per share for the
effects of convertible securities, warrants, stock options and other potentially
dilutive financial instruments only in the periods in which such effect is
dilutive. The shares issuable upon the conversion of preferred stock,
the exercise of stock options and warrants are excluded from the calculation of
net loss per share as their effect would be antidilutive.
Securities
that could potentially dilute earnings per share in the future that were not
included in the computation of diluted loss per share consist of the following
as of December 31:
|
2009
|
2008
|
|||||||
|
Series
A convertible preferred stock
|
2,854,780 | 3,301,098 | ||||||
|
Series
B convertible preferred stock
|
2,416,341 | 3,509,093 | ||||||
|
Warrants
to purchase common stock
|
2,679,652 | 4,309,055 | ||||||
|
Options
to purchase common stock
|
4,907,492 | 4,818,558 | ||||||
|
Total
|
12,858,265 | 15,937,804 | ||||||
F-10
VirtualScopics,
Inc. and Subsidiary
Notes
to Consolidated Financial Statements
Recently Adopted Accounting
Pronouncements
In June
2009, the FASB issued the accounting codification provisions (the
“Codification”) as described in FASB ASC 105, Generally Accepted Accounting
Principles (formerly SFAS No. 168, The FASB Accounting Codification and the
Hierarchy of Generally Accepted Accounting Principles). Released on July 1,
2009, the Codification became the source of authoritative non-governmental U.S.
GAAP. Rules and interpretive releases of the SEC under authority of federal
securities laws are also sources of authoritative GAAP for SEC registrants. On
the effective date of these provisions, the Codification superseded all
then-existing non-SEC accounting and reporting standards. All other
non-grandfathered non-SEC accounting literature not included in the Codification
became non-authoritative. The Codification was effective for the Company’s
quarterly reporting period ended September 30, 2009. The adoption of the
provisions did not have any impact on the Company’s consolidated financial
statements other than changes in referencing to authoritative accounting
pronouncements.
Effective
January 1, 2009, the Company adopted new provisions of FASB ASC 815-40,
Contracts in Entity’s own Equity (formerly FASB Staff Position Emerging Issues
Task Force Issue No. 07-05, Determining Whether an Instrument (or
Embedded Feature) is Indexed to an Entity’s Own Stock ) which applies to any
freestanding financial instruments or embedded features that have the
characteristics of a derivative and to any freestanding financial instruments
that are potentially settled in an entity’s own common stock. The Company
adopted this standard on January 1, 2009 and has included additional disclosures
in its consolidated financial statements. See Note 7 – Derivative Liability for
a further discussion regarding the Company’s measurement of derivative
instruments
In May
2009, the FASB issued a new provision as described in FASB ASC 855, Subsequent
Events (formerly SFAS No. 165, Subsequent Events), which provides
guidance on events that occur after the balance sheet date but prior to the
issuance of the financial statements. The provisions distinguish events
requiring recognition in the financial statements and those that may require
disclosure in the financial statements and requires disclosure of the date
through which subsequent events were evaluated. The FASB subsequently issued ASU
2010-09 which among other things eliminated the requirement that SEC registrants
disclose the date through which it has evaluated subsequent events. The
provisions are effective for interim and annual periods ending after June 15,
2009. The adoption of the provisions did not have any impact on the Company’s
consolidated financial statements.
In April
2009, the FASB issued new provisions of FASB ASC 825, Financial Instruments
(formerly FASB Staff Position FAS 107-1 and APB 28-1, Interim Disclosures about
Fair Value of Financial Instruments) requiring entities to provide disclosures
about the fair value of financial instruments in interim financial information.
The provisions require an entity to disclose in the body or in the accompanying
notes of its summarized financial information for interim reporting periods and
in its financial statements for annual reporting periods the fair value of all
financial instruments for which it is practicable to estimate that value,
whether recognized or not recognized in the statement of financial position. The
Company adopted the provisions for the quarter ended June 30, 2009 and the
adoption of the provisions did not have a material impact on the Company’s
consolidated financial statements.
In August
2009, the FASB issued Accounting Standards Update 2009-04, Accounting for
Redeemable Equity Instruments — Amendment to Section 480-10-S99 (“Update
2009-04”). Update 2009-04 represents an update to Topic 480-10-S99,
Distinguishing Liabilities from Equity, based on Emerging Issues Task Force
(“EITF”) Topic D-98, “Classification and Measurement of Redeemable Securities.”
The Company adopted Update 2009-04 for the quarter ended September 30, 2009 and
the adoption of Update 2009-04 did not have a material impact on the Company’s
consolidated financial statements.
F-11
VirtualScopics,
Inc. and Subsidiary
Notes
to Consolidated Financial Statements
In August
2009, the FASB issued Accounting Standard Update 2009-05, Fair Value Measurement
and Disclosures — Measuring Liabilities at Fair Value (“Update
2009-05”) which includes amendments to Subtopic 820-10, Fair Value Measurement
and Disclosures – Overall of the FASB ASC. Update 2009-05 provides clarification
that in circumstances in which a quoted price in an active market for the
identical liability is not available, a reporting entity is required to measure
fair value of such liability using one or more of the techniques prescribed by
the update. The Company adopted Update 2009-05 for the quarter ended September
30, 2009. Management has determined that the adoption of Update 2009-05 did not
have a material impact on the Company’s consolidated financial
statements.
NOTE
3 - Property and Equipment
Property
and equipment consisted of the following as of December 31:
|
2009
|
2008
|
|||||||
|
Office/computer
equipment
|
$ | 882,776 | $ | 861,901 | ||||
|
Furniture
and fixtures
|
165,286 | 114,462 | ||||||
|
Software
|
229,101 | 147,650 | ||||||
|
Leasehold
improvements
|
99,375 | 99,375 | ||||||
| 1,376,538 | 1,223,388 | |||||||
|
Less:
accumulated depreciation
|
(920,369 | ) | (867,909 | ) | ||||
| $ | 456,169 | $ | 355,479 | |||||
Depreciation
expense amounted to 213,473 and $213,931 for the years ended December 31, 2009
and 2008, respectively.
The
Company disposed of and wrote-off property and equipment with $163,917 of cost
and $161,013 of accumulated depreciation for the year ended December 31,
2009.
NOTE
4 - Patents
On May
24, 2002, the Company purchased from the University of Rochester, a related
party, certain patents developed by the Company’s founders and previously
licensed by the Company under an Exclusive Right Agreement. The
Company paid $1,500,000 and issued warrants to acquire 357,075 shares of common
stock to the University of Rochester for the full right and title to the
patents. The warrants were recorded at fair value which totaled
$157,000. During the years ended December 31, 2009 and 2008, the Company
capitalized $44,696 and $100,351, respectively, of legal expenses and filing
fees associated with its patents.
Accumulated
amortization on the patents amounted to $837,988 as of December 31,
2009. Amortization expense for the years ended December 31, 2009 and
2008 amounted to $132,582 and $128,690, respectively. The estimated
amortization expense on the patents for the next five years and thereafter is as
follows:
|
For the Years Ending
|
||||
|
December 31,
|
Amount
|
|||
|
2010
|
$ | 133,527 | ||
|
2011
|
133,527 | |||
|
2012
|
133,527 | |||
|
2013
|
133,527 | |||
|
2014
|
133,527 | |||
|
Thereafter
|
1,164,925 | |||
|
Total
|
$ | 1,832,560 | ||
F-12
VirtualScopics,
Inc. and Subsidiary
Notes
to Consolidated Financial Statements
NOTE
5 - Derivative Liability
Effective
January 1, 2009, the Company adopted a new accounting policy requiring it to
change the manner in which it accounts for certain equity instruments. The
warrants issued with the Company’s series A and series B preferred stock, and to
the placement agent in the series B financing, do not have fixed settlement
provisions because their exercise prices may be lowered if the Company issues
securities at lower prices in the future. The Company was required to
include the reset provisions in order to protect the warrant holders from the
potential dilution associated with future financings. Accordingly,
the warrants were recognized as a derivative instrument and have been
re-characterized as derivative liabilities. The fair value of these liabilities
be re-measured at the end of every reporting period with the change in value
reported in the statement of operations.
The
derivative liabilities were valued using the Black-Scholes option valuation
model and the following assumptions on the following dates:
|
December 31,
2009
|
January 1,
2009
|
November 5,
2005
|
||||||||||
|
Series A warrants:
|
||||||||||||
|
Risk-free
interest rate
|
- | 2.24 | % | 4.66 | % | |||||||
|
Expected
volatility
|
- | 72.9 | % | 59.6 | % | |||||||
|
Expected
life (in years)
|
- | .92 | 4 | |||||||||
|
Expected
dividend yield
|
- | - | - | |||||||||
|
Number
of warrants
|
- | 1,400,000 | 1,400,000 | |||||||||
|
Fair
value
|
$ | - | $ | 14,840 | $ | 1,299,900 | ||||||
|
December 31,
2009
|
January 1,
2009
|
September 7,
2007
|
||||||||||
|
Series
B warrants:
|
||||||||||||
|
Risk-free
interest rate
|
2.62 | % | 2.24 | % | 4.37 | % | ||||||
|
Expected
volatility
|
67.5 | % | 57.8 | % | 70.0 | % | ||||||
|
Expected
life (in years)
|
4.67 | 5.67 | 7 | |||||||||
|
Expected
dividend yield
|
- | - | - | |||||||||
|
Number
of warrants
|
2,234,764 | 2,234,764 | 2,234,764 | |||||||||
|
Fair
value
|
$ | 1,139,953 | $ | 408,068 | $ | 1,839,099 | ||||||
The
risk-free interest rate was based on rates established by the Federal
Reserve. The Company’s expected volatility was based on the
historical volatility of similar entities whose share prices are publicly
available. The expected life of the warrants was determined by the
expiration date of the warrants. The expected dividend yield was
based upon the fact that the Company has not historically paid dividends on its
common stock, and does not expect to pay dividends on its common stock in the
future.
The
change in accounting for warrants was implemented in the first quarter of 2009
and was reported as a cumulative effect of a change in accounting
principle. As a result, the cumulative effect on the accounting for
the warrants was as follows:
F-13
VirtualScopics,
Inc. and Subsidiary
Notes
to Consolidated Financial Statements
|
Derivative
Instrument
|
Decrease in
Additional Paid-
In-Capital
|
Decrease in
Accumulated
Deficit
|
Increase in
Derivative
Liability
|
|||||||||
|
Warrants
|
$ | 3,138,999 | $ | 2,716,091 | $ | 422,908 | ||||||
The
warrants were originally recorded at their relative fair value as an increase in
additional paid-in-capital. Changes in accumulated deficit include
$2,716,091 in gains resulting from the decrease in the fair value of the
derivative liabilities through December 31, 2008. The derivative
liability amount reflects the fair value of each derivative instrument as of the
January 1, 2009 date of implementation. The $717,045 change in fair
value is reported in our consolidated statement of operations as a loss on
derivative financial instruments. The fair value of these liabilities will be
re-measured at the end of every reporting period and the change in fair value
will be reported in our consolidated statement of operations as a gain or loss
on derivative financial instruments.
Fair
Value Measurement
Valuation
Hierarchy
ASC 820,
“Fair Value Measurements and Disclosures,” establishes a valuation hierarchy for
disclosure of the inputs to valuation used to measure fair value. This hierarchy
prioritizes the inputs into three broad levels as follows. Level 1
inputs are quoted prices (unadjusted) in active markets for identical assets or
liabilities. Level 2 inputs are quoted prices for similar assets and
liabilities in active markets or inputs that are observable for the asset or
liability, either directly or indirectly through market corroboration, for
substantially the full term of the financial instrument. Level 3
inputs are unobservable inputs based on the Company’s own assumptions used to
measure assets and liabilities at fair value. A financial asset or
liability’s classification within the hierarchy is determined based on the
lowest level input that is significant to the fair value
measurement.
The
following table provides the assets and liabilities carried at fair value
measured on a recurring basis as of December 31, 2009:
|
Fair Value Measurements at December 31, 2009
|
||||||||||||||||
|
Total
Carrying
Value at
December 31,
2009
|
Quoted
prices in
active
markets
(Level 1)
|
Significant
other
observable
inputs
(Level 2)
|
Significant
unobservable
inputs (Level
3)
|
|||||||||||||
|
Derivative
liabilities
|
$ | 1,139,953 | $ | - | $ | - | $ | 1,139,953 | ||||||||
The
carrying amounts of cash, accounts receivable, accounts payable, and accrued
liabilities approximate their fair value due to their short
maturities. The derivative liabilities are measured at fair value
using quoted market prices and estimated volatility factors, and are classified
within Level 3 of the valuation hierarchy. There were no changes in the
valuation techniques during the year ended December 31, 2009.
The
following table sets forth a summary of the changes in the fair value of our
Level 3 financial liabilities that are measured at fair value on a recurring
basis:
F-14
VirtualScopics,
Inc. and Subsidiary
Notes
to Consolidated Financial Statements
|
Years Ended December 31,
|
||||||||
|
2009
|
2008
|
|||||||
|
Beginning
balance
|
$ | (422,908 | ) | $ | - | |||
|
Net
unrealized loss on derivative financial instruments
|
(717,045 | ) | - | |||||
|
Ending
balance
|
$ | (1,139,953 | ) | $ | - | |||
NOTE
6 – Stockholders’ Equity
Common
Stock
The
Company has authorized 85,000,000 shares of common stock, par value
$0.001. As of December 31, 2009, the Company had reserved 2,327,937
shares of common stock for issuance under its 2001 and 2005 long-term incentive
plans, another 350,000 shares of common stock issued to a previous CEO outside
of one of its long-term incentive plans, and 6,900,000 shares for its 2006
Long-term Incentive Plan.
Preferred
Stock
The
Company has authorized 15,000,000 shares of preferred stock, par value $0.001
per share, of which 8,400 are designated as Series A Convertible Preferred Stock
(“Series A Preferred”) and 6,000 are designated as Series B Convertible
Preferred Stock (“Series B Preferred”) as specified in the Certificate of
Designation (the “Certificate”).
During
November and December 2005, the Company completed a private placement totaling
7,000 units at a purchase price of $1,000 per unit. Each unit
consisted of one share of Series A Preferred, convertible into 400 shares of
common stock, and a detachable warrant to purchase 200 shares of common stock at
an exercise price of $4.00 per share. Gross proceeds from the private
placement amounted to $7,000,000 and net proceeds amounted to approximately
$6,000,000. As a result of the private placement, in September 2007
(see below), Series A Preferred is now convertible into 830.36 shares of the
Company’s common stock. All Series A warrants have expired.
On
September 17, 2007, the Company completed a private placement of 4,350 shares of
Series B convertible preferred stock, par value $0.001 per share, and warrants
to purchase the Company’s common stock, par value $0.001 per share, for an
aggregate purchase price of $4,350,000. Each share of the Series B
convertible preferred stock is initially convertible, at the holder’s election,
into approximately 830.36 shares of common stock and has a liquidation
preference that is pari passu with the Company’s Series A convertible preferred
stock and senior to the Company’s common stock. Cumulative dividends
on the Series B convertible preferred stock accrue on the initial stated value
of $1,000 per share at an annual rate of 8%, payable monthly in cash and/or
shares of the Company’s common stock, at the option of the
Company. As of December 31, 2009, cash dividend payments amounted to
$304,318 and there were no accrued but unpaid dividends to Series B convertible
preferred stockholders. During the years ended December 31, 2009 and 2008, cash
dividends paid aggregated to $304,318 and $338,827, respectively.
The
warrants have a seven-year term and are initially exercisable into 2,167,232
shares of common stock. The warrants are exercisable, at the holder’s
election, for shares of the Company’s common stock in either a cash or cashless
exercise. Fifty percent of the warrants have an initial exercise
price equal to $1.2043 per share and the other fifty percent have an initial
exercise price of $1.3849 per share. The Company also issued warrants to the
financial advisor in the transaction, Canaccord Adams, Inc., to purchase 67,530
shares of common stock, which was recorded at fair value of approximately
$57,000 and was recognized as additional paid in capital. The value
of the warrants was computed using the Black-Scholes option-pricing model with
the following assumptions: risk free rate of 2.62%, contractual term of seven
years, expected volatility of 67.5%, 0% expected dividend yield, stock price of
$1.01 per share, and exercise prices of $1.2043 and $1.3849 per
share.
F-15
VirtualScopics,
Inc. and Subsidiary
Notes
to Consolidated Financial Statements
The
conversion feature of the Company’s warrants do not have fixed settlement
provisions because their exercise prices may be lowered if the Company issues
securities at lower prices in the future. The Company included the reset
provisions in order to protect the warrant holders from the potential dilution
associated with future financings. Accordingly the warrants have been
classified as derivative liabilities as discussed above.
NOTE
7 – Share-Based Compensation
Stock
Options
As of the
end of 2009, the Company’s 2001 Long-Term Incentive Plan, 2005 Long-Term
Incentive Plan and 2006 Long-Term Incentive Plan have a total of 4,907,492 in
stock option grants and 103,700 in restricted stock issued to directors,
officers and employees of the Company for a total of 5,011,192. In May 2007, the
stockholders of the Company approved the adoption of the Company’s 2006 Stock
Plan (the “Plan”), which amended the Company’s 2005 and 2001 Stock Plan. The
Plan provides for the grant of incentive stock options, within the meaning of
Section 422 of the Internal Revenue Code, to employees and for the grant of
non-statutory stock options, restricted stock, and stock appreciation rights to
employees, directors, and consultants. The Compensation Committee of the
Company’s board of directors administers the Plan and has the authority to make
awards under the Plan and establish vesting and other terms, but cannot grant
stock options at less than the fair value of the Company’s common stock on the
date of grant or re-price stock options previously granted. The employee stock
options granted under the Plan generally vest ratably over three to four years
of service and expire seven to ten years from the date of grant (or ninety days
after the termination of employment). As of December 31, 2009,
3,727,424 stock options remained eligible for grant under the 2006 Long-Term
Incentive Plan. The 2001 and 2005 Long-Term Incentive Plans have been closed for
additional grants.
On
November 4, 2009, the Company executed a stock option exchange program whereby
eligible employees and directors could elect to receive one stock option at the
closing market price on November 4, 2009 for two previously granted stock
options. Pursuant to the exchange offer, 1,366,250 eligible options
(representing 40% of the total stock options eligible for exchange) were
exchanged for new stock options with similar terms (including an additional year
vesting period) to purchase 683,125 shares of common stock. The exercise price
of the new options is $1.20 per share, which was the closing price of the
Company’s common stock on November 4, 2009 as reported by the Nasdaq Capital
Market. The exchange did not result in incremental fair value or an additional
charge to the Company’s consolidated statement of operations for the year ended
December 31, 2009.
During
the years ended December 31, 2009 and 2008, the Company granted options to
purchase 1,468,184 and 1,124,432 common stock, respectively, to employees at
exercise prices of $0.43, $0.90, $1.02, $1.16, $1.20 and $1.45, which
approximated the fair value on the respective grant dates. Shares
granted after November 4, 2005 (the exchange transaction date) were made under
the 2006 VirtualScopics, Inc., Long Term Incentive Plan. These options generally
vest ratably during the first four years following their issuance and have a
ten-year life.
A summary
of the option activity for the year ended December 31, 2008 and 2009 are as
follows:
|
Number
of
Shares
|
Weighted
Average
Exercise
Price
|
Weighted-
Average
Remaining
Contractual
Term
|
Aggregate
Intrinsic
Value
|
|||||||||||||
|
Options
outstanding at January 1, 2008
|
3,790,731 | $ | 2.12 | |||||||||||||
|
Granted
|
1,124,432 | 0.95 | ||||||||||||||
|
Cancelled
|
(238,295 | ) | (1.70 | ) | ||||||||||||
|
Options
outstanding at December 31, 2008
|
4,676,868 | 1.64 | 6.53 | $ | 4,200 | |||||||||||
|
Granted
|
1,468,184 | 1.06 | ||||||||||||||
|
Cancelled
|
(1,379,250 | ) | (3.02 | ) | ||||||||||||
|
Options
outstanding at December 31, 2009
|
4,765,802 | $ | 0.74 | 6.10 | $ | 329,782 | ||||||||||
|
Options
exercisable at December 31, 2009
|
2,390,349 | $ | 1.50 | 4.74 | $ | 208,026 | ||||||||||
F-16
VirtualScopics,
Inc. and Subsidiary
Notes
to Consolidated Financial Statements
Additional
information with respect to the outstanding options as of December 31, 2009 is
as follows:
|
Options Outstanding
|
Options Exercisable
|
|||||||||||||||||||
|
Exercise
Prices
|
Number
Outstanding
at
December
31,
2009
|
Weighted
Average
Remaining
Life
(Years)
|
Weighted
Average
Exercise
Price
|
Number
Exercisable
at
December
31,
2009
|
Weighted
Average
Exercise
Price
|
|||||||||||||||
|
$
0.48 - 1.19
|
2,557,730 | 6.61 | $ | 0.88 | 1,075,780 | $ | 0.82 | |||||||||||||
|
$
1.20 - 1.45
|
1,200,586 | 6.13 | 1.22 | 336,960 | 1.27 | |||||||||||||||
|
$
1.88 - 1.90
|
254,330 | 2.65 | 1.90 | 248,329 | 1.90 | |||||||||||||||
|
$
2.36 - 2.50
|
669,656 | 5.34 | 2.44 | 666,655 | 2.44 | |||||||||||||||
|
$
3.03 - 6.70
|
83,500 | 6.61 | 3.04 | 62,625 | 3.04 | |||||||||||||||
| 4,765,802 | 6.10 | $ | 0.74 | 2,390,349 | $ | 1.50 | ||||||||||||||
The
weighted-average grant-date fair value of options granted during the year ended
December 31, 2009 and 2008 was $1,552,150 and $1,065,431,
respectively.
For the
year ended December 31, 2009, the Company recorded a total of $1,067,080 in
stock-based compensation expense, which is included in the general and
administrative expenses in the consolidated financial statements.
A summary
of the status of the non-vested shares as of December 31, 2009 and changes
during the year ended December 31, 2009, is presented below:
|
Non-vested Shares
|
Shares
|
Weighted-Average
Grant-Date Fair Value
Per Share
|
||||||
|
Non-vested
at January 1, 2009
|
1,688,002 | $ | 1.65 | |||||
|
Granted
|
1,468,184 | 1.06 | ||||||
|
Vested
|
598,517 | 3.90 | ||||||
|
Cancelled
Grants
|
(1,379,250 | ) | (3.02 | ) | ||||
|
Non-vested
at December 31, 2009
|
2,375,453 | |||||||
As of
December 31, 2009, there was $1,307,652 of total unrecognized compensation cost
related to non-vested share-based compensation arrangements. This
cost is expected to be recognized over a weighted-average period of 2.20
years. The total fair value of shares vested during the year ended
December 31, 2009 amounted to $2,337,097.
F-17
VirtualScopics,
Inc. and Subsidiary
Notes
to Consolidated Financial Statements
Prior to
2008, the Company issued options under the 2006 Long-Term Incentive Plan to
non-employee consultants for radiological services performed. These
options to non-employees vest immediately, have exercise prices ranging from
$1.12 to $6.85 and a term of seven or six years from the date of grant. The
value of the options was based on the fair value of the services performed and
were included in the Company’s statements of operations.
The total
amount of stock options outstanding as of December 31, 2009 is:
|
Stock
options granted to employees
|
4,765,802 | |||
|
Stock
options granted to consultants
|
141,690 | |||
|
Total
outstanding
|
4,907,492 |
During
2010, and through the date of this report, a total of 1,171,295 stock options
were granted, of that amount 1,020,795 were granted to executive officers of the
Company.
Restricted Stock
Awards
A
restricted stock award entitles the recipient to receive shares of unrestricted
common stock upon vesting of the award. The fair value of each
restricted stock award is determined upon granting of the shares and the related
compensation expense is recognized ratably over the vesting period and charged
to the income statements as non-cash compensation expense. Restricted
stock awards granted but unvested shares are forfeited upon termination of
employment, unless otherwise agreed. The fair value of restricted
stock issued under the Plan is determined based on the closing price of the
Company’s common stock on the grant date. Under the provisions of the 2006 Long
Term Incentive Plan, the Company may grant restricted stock to its employees,
Board members and consultants. During 2006, the Board of Directors Compensation
Committee approved an equity based compensation structure for non-employee Board
members. As of December 31, 2009 and 2008, respectively, there were 229,682 and
198,810 shares of common stock that have been issued or are reserved for
issuance as restricted stock units under the Plan. As of December 31, 2009, the
Company has a liability of $148,860 (equating to 229,682 restricted stock units)
related to awards that will be given to certain Board members, on pre-determined
dates, in lieu of cash for their services as Board members during 2006, 2007,
2008 and 2009. As the shares are issued by the transfer agent, the liability is
reduced. In 2009, 103,700 restricted stock awards were issued to members of the
Board for their services on the Board under the 2006 Long Term Incentive Plan.
The restricted stock awards are fully vested and non-forfeitable and are
therefore included in the outstanding common stock of the Company as of December
31, 2009. The weighted average grant date fair value of restricted stock issued
by the Company during 2009 and 2008 were $120,293 and $0,
respectively.
The
Company incurred $39,519 and $78,128 in compensation expense in 2009 and 2008
related to the restricted stock awards for services by Board members for those
respective periods.
NOTE
8 - Benefit Plan
The
Company has a defined contribution plan which covers all of its full-time
employees. The employees’ annual contributions are limited to the
maximum allowed under the Internal Revenue Code. During 2009, the
Company began a matching contribution to participants 401k plans equal to 50% of
the participants’ contributions up to a maximum 3% of annual wages. In 2009, the
Company paid a total of $28,023 to participants representing the employer
contribution amount.
F-18
VirtualScopics,
Inc. and Subsidiary
Notes
to Consolidated Financial Statements
NOTE
9 - Income Taxes
The
Company has identified its federal tax return and its state tax return in New
York as “major” tax jurisdictions, as defined. Based on the Company’s
evaluation, it has been concluded that there are no significant uncertain tax
positions requiring recognition in the Company’s consolidated financial
statements. The Company’s evaluation was performed for the tax years ended 2001
through 2009, the only periods subject to examination. The Company believes that
its income tax positions and deductions will be sustained on audit and does not
anticipate any adjustments that will result in a material change to its
financial position. The Company does not expect its unrecognized tax benefit to
change during the next 12 months. As of December 31, 2009, all of the Company’s
deferred tax assets were fully reserved by a valuation allowance equal to 100%
of the net deferred tax assets. The Company has never been profitable and has
not paid any income taxes.
The
Company has significant net operating loss and business credit carryovers which
are subject to a valuation allowance due to the uncertain nature of the
realization of the losses. Section 382 of the Internal Revenue Code imposes
certain limitations on the utilization of net operating loss carryovers and
other tax attributes after a change in control. If the Company has a
change in ownership, such change could significantly limit the possible
utilization of such carryovers. Since
its formation, the Company has raised capital through the issuance of capital
stock which, combined with purchasing shareholders' subsequent disposition of
these shares, has resulted in an ownership change as defined by Section 382, and
also could result in an ownership change in the future upon subsequent
disposition.
The
Company will recognize interest and penalties accrued related to unrecognized
tax benefits as components of its income tax provision. The Company does not
have any interest and penalties accrued related to unrecognized tax
benefits.
The
Company has net operating loss carryforwards (“NOLs”) of approximately
$8,692,000 as of December 31, 2009 that will be available to offset future
taxable income. Approximately $9,000 of the NOL carryforward, if realized,
will result in a benefit to be recorded in APIC. The NOLs are due to expire in
2026 - 2028. The Company has concluded that a full valuation allowance was
appropriate for the NOLs as they are more likely than not to be utilized prior
to their expiration.
The total
net deferred tax asset as of December 31, 2009 and 2008 consists of the
following:
|
2009
|
2008
|
|||||||
|
Net
operating loss carryforwards
|
$ | 3,362,588 | $ | 3,537,789 | ||||
|
Intangible
assets
|
1,140,944 | 1,274,223 | ||||||
|
Accrued
expenses
|
115,944 | 114,704 | ||||||
|
Stock-based
compensation
|
948,222 | 1,204,814 | ||||||
|
Total
deferred tax asset
|
5,567,698 | 6,131,530 | ||||||
|
Deferred
tax liability:
|
||||||||
|
Property
and equipment
|
(39,825 | ) | (18,517 | ) | ||||
|
Subtotal
|
5,527,873 | 6,113,013 | ||||||
|
Less:
valuation allowance
|
(5,527,873 | ) | (6,113,013 | ) | ||||
|
Total
net deferred tax asset
|
$ | - | $ | - | ||||
The
difference between the federal statutory and effective income tax rates for the
years ended December 31, 2009 and 2008 is as follows:
|
2009
|
2008
|
|||||||
|
Federal
statutory tax rate
|
34.00 | % | (34.00 | )% | ||||
|
State
and local income taxes, net of federal benefit
|
4.69 | % | (4.95 | )% | ||||
|
Stock-based
compensation
|
(66.20 | )% | 4.95 | % | ||||
|
Loss
from derivative financial instrument
|
(27.43 | )% | - | |||||
|
Other
|
(2.92 | )% | 0.13 | % | ||||
| (57.86 | )% | (33.87 | )% | |||||
|
Less:
valuation allowance
|
57.86 | % | 33.87 | % | ||||
|
Provision
for income taxes
|
0.00 | % | 0.00 | % | ||||
F-19
VirtualScopics,
Inc. and Subsidiary
Notes
to Consolidated Financial Statements
NOTE
10 - Commitments and Contingencies
Operating
Leases
In July,
2007, the Company began leasing approximately 19,500 square feet of office space
at our corporate headquarters in Rochester, New York. The annual rent under the
lease is $360,000, and increases three percent (3%) a year. During
the first twenty months of the lease, the rent was paid in two portions: a cash
portion of $156,000 annually, paid in equal monthly installments, increasing
three percent (3%) annually, and a stock portion of $204,000 annually paid in
equal monthly installments, increasing three percent (3%) annually. The stock
portion was payable in shares of our common stock. In February 2009,
the Landlord exercised their option to receive their remaining rental payments
in all cash. During 2009 and 2008, we had issued 88,132 and 165,007 shares,
respectively, of the company’s common stock ranging from $1.20 to $2.50 per
share for a total value of $105,570 and $221,000,
respectively. Management believes that the leased property is
adequately covered by insurance.
In
October 2007, the Company entered into a lease agreement for certain
equipment. The lease is for 36 months and will expire in November
2010.
Total
rent expense for the years ended December 31, 2009 and 2008 was $331,065 and
$371,004, respectively.
Future
minimum rental commitments under non-cancelable operating leases are as
follows:
|
For the Years Ending
|
||||
|
December 31,
|
Amount
|
|||
|
2010
|
$ | 324,968 | ||
|
2011
|
320,298 | |||
|
2012
|
160,149 | |||
|
Total
|
$ | 805,415 | ||
Services and Co-Marketing
Agreement
The
Company entered into a Consulting Services and Co-Marketing Agreement dated
March 1, 2004, in which it agreed to pay Chondrometrics GmbH, a German limited
liability company, fees equal to approximately 7% of the gross revenues it
derived from certain services each year throughout the term of the
agreement. The Company was obligated to make minimum payments to
Chondrometrics for the first three years of the agreement. Payments made to
Chondrometrics in 2009 and 2008 amounted to $0 and approximately $15,000,
respectively. The Consulting Services agreement expired on December
31, 2006 whereas the Co-Marketing Agreement expired on December 31,
2008.
F-20
VirtualScopics,
Inc. and Subsidiary
Notes
to Consolidated Financial Statements
NOTE
11 - Related Parties
On June
26, 2002, the Company entered into a multi-year strategic relationship with
Pfizer Inc. (“Pfizer”) to accelerate the discovery, validation and application
of image-based biomarkers for clinical research. Under the terms of
the agreement, Pfizer invested $2,500,000 in the Company, for a 10% ownership
interest. The Company used $1,500,000 of the investment to purchase the
intellectual property that it was licensing from the University of
Rochester. In August 2005, the agreement was extended for another two
years and provided for termination by Pfizer by giving a 30-day advance written
notice. Additionally, in November 2006, the agreement was further extended until
July 2008, with automatic renewals unless either party provides written notice
60 days prior to the next anniversary. Revenues generated from this customer
were $100,969 and $636,611 for the years ended December 31, 2009 and 2008,
respectively. As of December 31, 2009 and 2008, the accounts receivable balance
from Pfizer was $8,383 and $14,159, respectively.
In
December 2002, the Company received an investment of $2,450,000 from GE Medical
Systems. Upon receipt of the proceeds of this investment, the Company
purchased an MRI machine from this investor for $2,300,000. During
2003, the equipment was sold to the University of Rochester, a related party,
for $2,300,000. The Company retained the right to use the machine
exclusively one day a week until March, 2011. The balance of
$1,050,000 was applied as an advance payment for use of the equipment and is
recorded in other assets on the balance sheet as of December 31, 2009 and is
being amortized based on usage over the life of the agreement. The
equipment is being used by the Company for research and to broaden its ability
to service its customers.
NOTE
12 - Major Customers
The
Company’s top customer accounted for approximately 43% of total revenue for the
year ended December 31, 2009. The Company’s top two customers accounted for 45%
and 14% of accounts receivable for the year ended December 31, 2009. For the
year ended December 31, 2008, the then top three customers accounted for 18%,
12% and 12% of total revenue. For the year ended December 31, 2008,
the then top three customers accounted for 23%, 10% and 6% of accounts
receivable.
NOTE
13 – Subsequent Event
The
Company evaluates events that have occurred after the balance sheet date but
before the financial statements are issued. Based upon the evaluation, the
Company did not identify any recognized or non-recognized subsequent events that
would have required adjustment or disclosure in the consolidated financial
statements.
F-21