Attached files
| file | filename |
|---|---|
| EXCEL - IDEA: XBRL DOCUMENT - VirtualScopics, Inc. | Financial_Report.xls |
| EX-21 - EXHIBIT 21 - VirtualScopics, Inc. | v404973_ex21.htm |
| EX-23.1 - EXHIBIT 23.1 - VirtualScopics, Inc. | v404973_ex23-1.htm |
| EX-31.1 - EXHIBIT 31.1 - VirtualScopics, Inc. | v404973_ex31-1.htm |
| EX-31.2 - EXHIBIT 31.2 - VirtualScopics, Inc. | v404973_ex31-2.htm |
| EX-32.2 - EXHIBIT 32.2 - VirtualScopics, Inc. | v404973_ex32-2.htm |
| EX-32.1 - EXHIBIT 32.1 - VirtualScopics, Inc. | v404973_ex32-1.htm |
UNITED STATES
SECURITIES AND EXCHANGE COMMISSION
WASHINGTON, D.C. 20549
Form 10-K
x ANNUAL REPORT PURSUANT TO SECTION 13 OR 15(d) OF THE SECURITIES
EXCHANGE ACT OF 1934
For the fiscal year ended December 31, 2014
OR
¨ TRANSITION REPORT PURSUANT TO SECTION 13 OR 15(d) OF THE SECURITIES
EXCHANGE ACT OF 1934
For the transition period from ____ to____
Commission file number: 000-52018
VIRTUALSCOPICS, INC.
(Exact name of registrant as specified in its charter)
| DELAWARE | 04- 3007151 | |
| (State or other jurisdiction of incorporation or organization) | (I.R.S. Employer Identification No.) |
| 500 Linden Oaks, Rochester, New York | 14625 | ||
| (Address of principal executive offices) | (Zip Code) |
(585) 249-6231
(Registrant's Telephone Number, Including Area Code)
SECURITIES REGISTERED PURSUANT TO SECTION 12(b) OF THE EXCHANGE ACT:
Common Stock, $0.001 par value
NASDAQ Capital Market
SECURITIES REGISTERED PURSUANT TO SECTION 12(g) OF THE EXCHANGE ACT:
TITLE OF EACH CLASS:
Indicate by check mark if the registrant is a well-known seasoned issuer, as defined in Rule 405 of the Securities Act.
| ¨ Yes x No |
Indicate by check mark if the registrant is not required to file reports pursuant to Section 13 or Section 15(d) of the Exchange Act.
| ¨ Yes x No |
Indicate by check mark whether the registrant: (1) has filed all reports required to be filed by Section 13 or 15(d) of the Securities Exchange Act of 1934 during the preceding 12 months (or for such shorter period that the registrant was required to file such reports), and (2) has been subject to such filing requirements for past 90 days. Yes x No ¨
Indicate by check mark whether the registrant has submitted electronically and posted on its corporate Web site, if any, every Interactive Data File required to be submitted and posted pursuant to Rule 405 of Regulation S-T during the preceding 12 months (or for such shorter period that the registrant was required to submit and post such files). Yes x No ¨
Indicate by check mark if disclosure of delinquent filers in response to Item 405 of Regulation S-K is not contained herein, and will not be contained, to the best of registrant's knowledge, in definitive proxy or information statements incorporated by reference in Part III of this Form 10-K or any amendment to this Form 10-K. x
Indicate by check mark whether the registrant is a large accelerated filer, an accelerated filer, a non-accelerated filer, or a smaller reporting company. See definitions of “large accelerated filer,” “accelerated filer” and “smaller reporting” in Rule 12b-2 of the Exchange Act.
| Larger accelerated filer ¨ | Accelerated filer ¨ | |
| Non-accelerated filer ¨ (Do not check if a smaller reporting company) | Smaller reporting company x |
Indicate by check mark whether the registrant is a shell company (as defined in Rule 12b-2 of the Exchange Act). Yes ¨ or No x
The aggregate market value of the issuer’s voting and non-voting common equity held by non-affiliates of the issuer as of June 30, 2014 was approximately $10,079,691 (calculated by excluding all shares held by executive officers, directors and holders known to the registrant of five percent or more of the voting power of the registrant's common stock, without conceding that such persons are “affiliates” of the registrant for purposes of the federal securities laws). This amount does not include any value for the issuer’s series A preferred stock, series B preferred stock or series C preferred stock, for which there is no established United States public trading market, or any value for the common stock issuable upon conversion of shares of such preferred stock.
As of March 26, 2015, there were outstanding 2,994,928 shares of the issuer’s common stock, $.001 par value.
Documents Incorporated By Reference: Portions of the Company's Proxy Statement to be delivered to the Company’s stockholders in connection with the Company’s 2015 Annual Meeting of Stockholders, which the Company plans to file with the Securities and Exchange Commission pursuant to Regulation 14A promulgated under the Securities Exchange Act of 1934, on or prior to April 30, 2015, are incorporated by reference in Part III (Items 10, 11, 12, 13 and 14) of this Form 10-K.
TABLE OF CONTENTS
FORWARD-LOOKING STATEMENTS
Some of the statements under the captions of this report on Form 10-K titled “Risk Factors,” “Management's Discussion and Analysis of Financial Condition and Results of Operations” or “Business,” contained or incorporated by reference elsewhere in this report, and in our other reports filed with the Securities Exchange Commission (“SEC”) constitute “forward-looking statements” within the meaning of Section 27A of the Securities Act of 1933, as amended, and Section 21E of the Securities Exchange Act of 1934, as amended, which involve risks and uncertainties. These statements are made pursuant to the safe harbor provisions of the Private Securities Litigation Reform Act of 1995. These forward-looking statements include statements that address activities, events or developments that we expect, believe or anticipate may occur in the future, including:
| · | adverse
economic conditions; |
| · | loss
of market share due to competing products and services; |
| · | unexpected costs, lower than expected sales and revenues, and operating defects; |
| · | study cancellations and delays in the startup of trials; |
| · | adverse results of any legal proceedings; |
| · | the volatility of our operating results and financial condition; |
| · | inability
to attract or retain qualified senior management and scientific personnel; |
| · | inability to raise sufficient additional capital to operate our business, if necessary, and; |
| · | changes in government regulations; |
| · | other specific risks that may be referred to in this report. |
All statements, other than statements of historical facts, included in this report regarding our strategy, future operations, financial position, estimated revenue or losses, projected costs, prospects and plans and objectives of management are forward-looking statements. When used in this report, the words “may,” “believe,” “anticipate,” “intend,” “estimate,” “expect,” “project,” “plan,” “could,” “would” and similar expressions are intended to identify forward-looking statements, although not all forward-looking statements contain such identifying words. All forward-looking statements speak only as of the date of this report. We do not undertake any obligation to update any forward-looking statements or other information contained in this report. Existing stockholders and potential investors should not place undue reliance on these forward-looking statements. Although we believe that our plans, intentions and expectations reflected in or suggested by the forward-looking statements in this report are reasonable, we cannot assure our stockholders or potential investors that these plans, intentions or expectations will be achieved. We disclose important factors that could cause our actual results to differ materially from our expectations under “Risk Factors” and elsewhere in this report. These risk factors qualify all forward-looking statements attributable to us or persons acting on our behalf.
Information regarding market and industry statistics contained in this report is included based on information available to us that we believe is accurate. It is generally based on academic and other publications that are not produced for purposes of securities offerings or economic analysis. We have not reviewed or included data from all sources, and we cannot assure our stockholders or potential investors of the accuracy or completeness of the data included in this report. Forecasts and other forward-looking information obtained from these sources are subject to the same qualifications and the additional uncertainties accompanying any estimates of future market size, revenue and market acceptance of products and services. We have no obligation to update forward-looking information to reflect actual results or changes in assumptions or other factors that could affect those statements. See “Risk Factors” for a more detailed discussion of uncertainties and risks that may have an impact on future results.
| 3 |
We are a provider of quantitative imaging solutions currently serving the pharmaceutical, biotechnology and medical device industries. We have created a suite of image analysis software tools and applications which are used in detecting and measuring specific anatomical structures and metabolic activity using medical images. Our proprietary software and algorithms provide measurement capabilities designed to improve clinical research and development. We focus on applying our imaging technology to improve the efficiency and effectiveness of the pharmaceutical and medical device research and development processes. We believe our technology can also be used in improving the treatment planning for patients with cancer and other debilitating diseases. We are a Delaware corporation formed in 1988.
Business Overview
Our image-based measurement and visualization tools enable automated, accurate and reproducible measurement of minute changes that occur in anatomic structures in musculoskeletal, oncological, cardiological and neurological diseases. For pharmaceutical, biotechnology and medical device manufacturers, these tools can significantly alleviate or reduce clinical development bottlenecks by increasing the speed, accuracy and reliability of the demonstration of a new compound’s efficacy. Further, these measurements can be used to assess the viability of continuing a drug development project and eliminate as soon as possible further investigation of a drug that is likely to fail. Early termination is critical to the pharmaceutical industry to prevent the expenditure of research and development (“R&D”) funds on a drug that will not perform as expected. We believe that this is especially important today with the large number of compounds that are awaiting evaluation.
We are continuously looking for opportunities to expand the use of our quantitative imaging into new markets. There can be no assurance that we will experience significant demand for any opportunities that are pursued, or that we will have sufficient capital available to successfully commercialize any application.
Benefits to Pharmaceutical, Biotech and Medical Device Companies
The benefits to pharmaceutical companies from using our image analysis tools can include shorter clinical development time and earlier determination of the effectiveness or ineffectiveness of a new drug or compound. Our technology helps to curtail trials that are not likely to be beneficial and to avoid mistaken termination of the investigation of compounds that are likely to prove efficacious, through:
| · | improved precision in the measurement of traditional imaging biomarkers resulting in shorter observation periods, with beneficial cost savings within a clinical trial; |
| · | advanced imaging biomarkers, which are better correlated with disease states, again reducing trial length and therefore costs; and |
| · | reduced processing time for image data analysis through automation. |
In addition, our technology reduces aggregate clinical development costs through:
| · | improved precision of traditional imaging biomarkers, thus requiring smaller patient populations and lower administrative costs; and |
| · | advanced imaging biomarkers that serve as better correlates, leading to better early screening and elimination of weak drug candidates in pre-clinical and early phase trials. |
| 4 |
Our Technology Solution
Oncology Applications
Automated Measurement of Tumor Structure in Oncology
Volumetric imaging modalities such as X-Ray Computed Tomography (CT), Magnetic Resonance Imaging (MRI), and Positron Emission Tomography (PET) can provide a wealth of information about tumor size, structure, and function. However, the standard for clinical assessment of both tumor response to therapy and disease progression, the Response Evaluation Criteria in Solid Tumors (RECIST), focuses on the measurement of a single diameter in the axial plane for each measurable tumor, ignoring much of this additional information. VirtualScopics has developed a system which allows the rapid and efficient assessment of oncology patients per standard RECIST criteria, while also permitting the measurement of more sensitive measures including tumor volume, tumor metabolic rate via FDG-PET, tumor mitotic rate via FLT-PET, or tumor cellular density via diffusion MRI. VirtualScopics’ flexible workflow engine allows us to efficiently handle both large Phase III studies for which RECIST evaluation is the only endpoint, and smaller Phase I and Phase II studies where sponsors may need much more detailed information in order to make go/no-go decisions based on small patient populations.
Innovation in Image-Based Biomarkers
With a multidisciplinary team of medical professionals (including staff radiologists), scientists and software developers, we deliver unparalleled innovation in the analysis of specific biomarkers. Measurements may include specific Food and Drug Administration (“FDA”) acknowledged (e.g. RECIST) biomarkers as well as secondary or exploratory endpoints such as cavitation/necrosis, cellular density, or metabolic rate. By extracting substantially more information from existing imaging modalities such as CT or MRI, we believe we offer a more definite and efficient basis for determining the course of clinical trials.
Measurement of Blood Flow and Metabolic Activity
A growing number of anti-cancer drugs both on the market (e.g., Iressa and Avastin) and under development are designed to reduce the blood supply available to tumors, thereby depriving them of the ability to grow and spread. During development, these compounds require the ability to accurately measure blood flow and vascular permeability in vivo, in order to determine dose-response relationships and compound efficacy. In the clinic, this same capability is necessary in order to determine whether a particular patient is responding to treatment. We have developed a method, using dynamic contrast enhanced magnetic resonance imaging (DCE-MRI), to accomplish this. This technique involves repeated imaging, generally every two to six seconds, for a period of several minutes before and after the injection of a gadolinium-based, FDA-approved, contrast agent. Contrast concentration changes over time can then be measured both in normal and cancerous tissues, and based on this information parameters such as blood flow, blood volume and vascular permeability can be derived. These parameters have been shown to relate directly to the activity of anti-angiogenesis and anti-vascular cancer drugs, and to allow the prediction of response or failure after only a few days of treatment, as in the example given above.
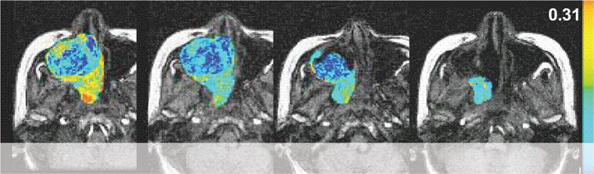
With dynamic contrast-enhanced series, changes in signal intensity can be related to tracer concentration in tissues. This information can be used to determine the blood flow to the tumor.
| 5 |
Musculoskeletal Applications
Our image analysis provides a degree of accuracy and reproducibility that cannot be duplicated by manual techniques. Traditional radiologic interpretation of medical images is qualitative and subjective. Using semi-automated, computer-assisted assessment techniques produces quantitative results that are accurate, reproducible and objective. Unlike manual assessment methods, our computer-aided approach allows the user to track the boundary location of each structure in a data set from one scan to another, even if the patient is not positioned in precisely the same way for each scan, or if there have been some anatomical changes between scans. For cartilage volumes and thickness measurements, the Coefficient of Variation (CV) typically falls between 2% and 4% - we can detect minute changes with statistical confidence, allowing our clients to reduce study populations or shorten study durations. For changes in muscle volume, our semi-automated algorithms decrease the variability to below 1%. The reason for this is two-fold: the algorithms that identify the boundaries are both accurate and reproducible, and the time-savings produced by the algorithm reduces reader fatigue – instead of spending six hours reading a case, the reader is able to complete their analysis in about 25% of the time or less.
With our automated analysis, researchers can more confidently make the go/no go decision for a compound early in the evaluation process, allowing scarce resources to be allocated to the most promising candidates. The reason for this is two-fold: the algorithms that identify the boundaries are both accurate and reproducible, and the time-savings produced by the algorithm reduces reader fatigue – instead of spending six hours reading a case, the reader is able to complete their analysis in about 25% of the time or less.
Reproducible medical image analysis is driven by computer image analysis algorithms that enable quantitative measurement of different structural parameters. Guided by the information present in the images, as well as embedded anatomical knowledge, the algorithms enable segmentation of different structures. From an MRI knee scan, for instance, it is possible to produce a three-dimensional reconstruction that graphically distinguishes cartilage from underlying bone, as well as from ligaments, fluid, degenerated menisci or inflamed synovium. This capability provides a valuable assessment tool for clinical research in osteoarthritis - a disease with multiple endpoints - because it allows sensitive and specific measurement of all the components of the knee joint and detects small changes in any of those components over time.
Fatty Liver Disease
Many diseases and safety assessments benefit from the ability to calculate accurate hepatic fat fractions. As an example, non-alcoholic fatty liver disease (NAFLD) has become increasingly prevalent with estimates of 19% of adults in the US (28.8 million). Traditional methods for determining hepatic fat fraction are either extremely invasive (liver biopsy), qualitative (ultrasound), not widespread in clinical practice (magnetic resonance spectroscopy or MRS), or not particularly accurate (in- and out-of-phase dual-echo magnetic resonance imaging or MRI). VirtualScopics worked with a research organization and a sponsor to demonstrate that there is a much more accurate, non-invasive, quantitative technique utilizing MRI that works on most clinical magnets. The results of this study were published in the Journal of Magnetic Resonance Imaging in June of 2013. VirtualScopics has utilized this technique to evaluate the hepatic fat fraction of clinical trial subjects nearly 2,000 times.
Cardiovascular Applications
Cardiovascular disease is one of the leading causes of mortality within most developed countries. Cardiac toxicity is also one of the most common and most dangerous side-effects of a wide range of drugs. Oncology drugs in particular are known to often have adverse effects on cardiac function, and assessment of changes in cardiac function is an important part of the safety evaluation of nearly all oncology drugs. It is therefore very important to have efficient and accurate methods for assessing cardiac function in a clinical trial setting. VirtualScopics has integrated third party software packages, which are FDA-approved medical devices, with our workflow engine and analysis platform. This allows us to provide a wide range of cardiovascular safety and efficacy endpoints to our customers in a reliable and efficient manner, including:
| · | Automatic import of measurement values from ultrasound systems |
| · | Availability of all current 2D Echo-, M-Mode- and Doppler measurements |
| · | Measurement of up to five values for each parameter |
| · | Fast and flexible composition of relevant image data ensured by intuitive user interface |
| · | Side-by-side comparison of current and previous examinations (XA and Echo) |
| · | Comfortable analysis of image sequences using video functions |
| 6 |
| · | Export of image-data to AVI, BMP, JPEG or DICOM format |
The capabilities provided by these software packages, combined with VirtualScopics’ team of cardiologists and radiologists, have allowed VirtualScopics to take on trials which include a wide variety of cardiovascular endpoints including change in left ventricular ejection fraction, change in valve and wall motion, and cardiac strain assessment.
Neurology Applications
Evaluating diseases such as multiple sclerosis (MS), epilepsy, and Alzheimer’s requires the identification and measurement of neurological structures and lesions. Manual tracing, especially of abnormal neurological structures, requires considerable expertise and time. Tracing introduces significant variability even when all measurements are made by one individual, an effect that is compounded with multiple operators. Intra- and inter-operator variability poses a major obstacle for researchers attempting to take advantage of the power of MRI analysis in the study of neurological disease. VirtualScopics eliminates these problems with automated, statistically driven feature analysis. Our algorithms employ the two types of knowledge that expert radiologists use to measure structures within the brain: differentiation of various tissue types and knowledge of structure, size, location, and shape. Our software incorporates a priori model of neurological anatomy that enables the measurement of structures with indistinct boundaries such as the hippocampus. Knowledge of anatomical structures also improves reproducibility, allowing disease progression to be precisely monitored over time.
Many neurological conditions can be detected and evaluated with quantitative measures of structures in MRI studies. While automated measurement tracks lesions in MS clinical trials, it also provides a critical tool in measuring hippocampal volume for diagnosing and monitoring both intractable temporal lobe epilepsy and Alzheimer’s disease. Validation studies prove that our automated approach provides greater speed, precision and accuracy in clinical trials than manual methods do. In MS clinical trials, we provide an FDA-approved metric for quickly determining drug efficacy of MS compounds. A VirtualScopics validation study compared manual tracing using two VirtualScopics software algorithms for automated measurement: geometrically constrained region growth (GEORG) and directed clustering. Our Core Lab utilizes both algorithms to achieve an optimal system for quantification of MS lesions in multi-spectral MRI studies. In the MS validation study, mean processing time was 60 minutes for manual tracing, 10 minutes for GEORG, and 3 minutes for directed clustering. Intra- and inter-operator coefficients of variation were 5.1% and 16.5% for manual tracing, 1.4% and 2.3% for region growth and 1.5% and 5.2% for directed clustering. The study also compared our automated measurement and manual tracing from an expert radiologist against a phantom data set. In all data sets, automated algorithms performed significantly better than manual tracing. Our automated measurements also proved more repeatable than manual methods, an important feature in multi-center clinical trials.
Sales and Marketing
Our sales and business development strategy is centered around the publication and presentation of our technology and services at targeted industry conferences along with an active marketing effort aimed at pharmaceutical, medical device, and biotechnology companies. It is focused on a segmented and targeted approach relative to account type, sales channel, therapeutic area, and study phase. The Sales Plan consists of the positioning of our core imaging services through direct selling efforts and through the PPD Channel in the Oncology, Metabolic, and Cardiology markets and the IXICO strategic alliance in the Alzheimer’s market.
During 2014, we performed services on new and existing contracts with 8 of the 10 leading pharmaceutical, biotechnology and medical device companies. In total, we performed services on 142 projects for 34 customers. We continue to grow our business by leveraging relationships with our current customers and through referrals. As a result, our current customers have been instrumental in introducing us to other therapeutic groups within their organization. Our marketing efforts are instrumental in broadening the awareness of VirtualScopics throughout the industry and educating current customers on the breadth of our services.
| 7 |
Complementing our sales and marketing efforts are our strategic alliances with PPD, Inc. and IXICO, plc. The alliance affords us the opportunity to penetrate an expanded customer base through a combined solution to the market. We are working closely to develop the best in kind solution combining core Clinical Resource Organization (CRO) services with our imaging platform. The alliance also provides for our earlier engagement with potential customers because PPD tends to be engaged earlier in the supplier selection process of the drug development cycle.
In June 2014, we entered into an international commercial alliance with IXICO plc (LON: IXI), a provider of quantitative medical imaging focused on Alzheimer’s, based in London. The alliance will help give us operational capabilities in Europe and a broader range of therapeutic area and modality expertise. By combining our resources, we believe we are enhancing our ability to deliver on the largest trials worldwide and to do so across a more diverse range of therapeutic areas.
Subsequently, we jointly opened an office in New Hope, Pennsylvania, strategically located in the corridor that runs through New Jersey and Pennsylvania, in a location close to many of our pharmaceutical customers.
On December 11, 2014, we entered into an agreement to license IXICO’s TrialTrackerTM proprietary image data and query management platform. The agreement includes the implementation of TrialTrackerTM together with multi-year software license and maintenance support. We were also delighted to announce on December 16, 2014, that the alliance had been awarded its first joint project by a global top 15 pharmaceutical company. This involves the provision of image analysis services for a Phase II oncology clinical trial.
In addition to these initiatives, we actively participate in medical conferences to showcase our technology, services and results, as well as authoring joint publications with sponsors which often results in highly visible research. We have built a strong base of clinical collaborators across varied disease platforms.
Backlog
Backlog represents anticipated service revenue from work not yet completed or performed under signed contracts. Once work commences, revenue is generally recognized over the life of the contract as services are provided. Backlog at December 31, 2014 was approximately $29 million, compared with approximately $24 million at December 31, 2013, an increase of 21%. Subject to the matters addressed in the following paragraph, we believe that approximately $19 million of the backlog will not be recognized as revenue in our fiscal year ending December 31, 2015.
We believe that backlog is a useful measure for management and investors to evaluate our business activity. Nonetheless, there are several factors that can affect whether we will realize the full benefits of projects included in the backlog and the time over which we will realize that revenue. These factors include customers terminating, delaying, or changing the scope of a project for a variety of reasons including, among others, the failure of drugs being tested to satisfy safety requirements, unexpected or undesirable clinical results, client decisions to forego a particular study, and insufficient patient enrollment or investigator recruitment. Furthermore, the contracts may contemplate performance over multiple years. Therefore, revenue may not be realized in the fiscal year in which the contract is signed or the award is made. Recognition of revenue under the contract may also be affected by the timing of patient recruitment and image site identification and training. Additionally, the majority of contracts we have with customers are cancelable for any reason by giving 30 days advance notice. As a result, we cannot assure you amounts included in our backlog will be indicative of future results.
Industry Background and Market Trends
Market in Pharmaceutical and Medical Device Development
| 8 |
Industry Overview
The global pharmaceutical market is expected to reach nearly $1.3 trillion by 2018, an increase of about 30 percent over the 2013 level, driven by population growth, an aging population, and improved access to pharmerging markets. The global compound annual growth rate (CAGR) of the global pharmaceutical market is forecasted to peak in 2014-15 and will be moderate through 2018, due to fewer patent expires, launches of more innovative medicines and price increases with the CAGR expected to stabilize between 4-7 percent through 2018. The U.S. Pharmaceutical market is expected to peak in 2014 with a forecasted growth rate of 11-13 percent and expand by 5-8 percent through 2018. Emerging markets on the other hand are expected to grow collectively at a 8-11 percent rate through 2018. Meanwhile, the five major European markets of Germany, France, Italy, Spain and the UK are expected to grow at only a 1-4 percent pace with Canada expected to grow at a 3-6 percent pace.1
The Center for Drug Evaluation and Research (“CDER”) approved 41 new molecular entities or “NMEs” in 2014, which is more than the average number approved annually during the past decade. For instance from 2005 through 2013, CDER has averaged about 25 NME approvals per year.2
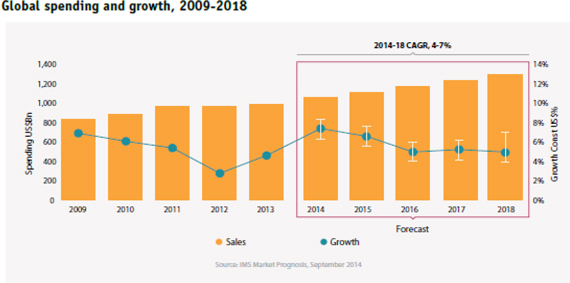
Source: IMS Institute for Healthcare Informatics – The Global Use of Medicines: Outlook through 2018
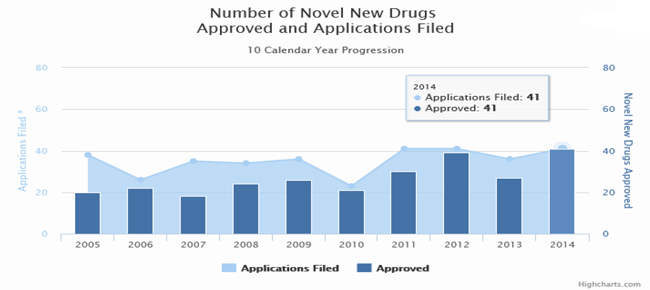
Source: Food and Drug Administration – 2014 Novel New Drugs Summary
1 IMS Institute for Healthcare Informatics – The Global Use of Medicines: Outlook through 2018
2 Food and Drug Administration – 2014 Novel New Drugs Summary
| 9 |
As the growth rate in the demand for prescription drugs decreases, it is getting harder for pharmaceutical companies to maintain the same levels of R&D spending as in the past. Additionally, the cost and complexity of developing new drugs, in part due to the increased scrutiny over product safety and the pressure to demonstrate health outcomes earlier, has increased substantially relative to its potential value. It has been estimated that the average cost to yield a single FDA approved drug is approximately $1.2 billion and the entire research and development and FDA approval process time is between 10 and 15 years. Additionally, for every 5,000 -10,000 compounds that enter at the discovery stage, only one goes on to reach the market. The table below illustrates the complete R&D process from pre discovery to market.
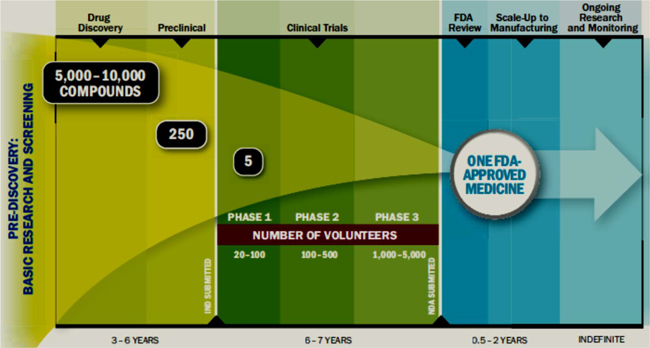
Source: PhRMA – 2013 Profile Pharmaceutical Industry
Drug Development Process
Typically, most functions of the drug and medical device R&D process are managed by clinical research organizations, or CROs. Most biopharma companies are at the end of multi-year patent cliffs and are stepping up investments in their late stage pipelines. The sector is expecting growth with a CAGR of 5-6 percent through 2018. The market is highly concentrated with the top ten players accounting for more than 50% of the CRO Market. The leading CROs by amount of estimated market share are Quintiles (15%), Covance (9%), Parexel (8%), PRA International (7-8%), and PPD (6-7%).3
Although the FDA has reduced the average approval time for new drugs, clinical development time has been increasing over the years, resulting in total development time being fairly flat in recent years. Growing complexities in protocol design leading to longer clinical development times has been the major contributor to the rising costs that sponsors are facing.
The current trend in drug development is for pharmaceutical companies to shift towards a niche market. The 'one size fits all' approach is being replaced by a more targeted, innovative approach to develop treatments for small patient groups with complicated diseases such as cancer, rheumatoid arthritis and immune disorders. Such 'niche buster drugs' are expected to exploit new technologies such as biomarkers and theranostics.
With the U.S. administration implementing health care reform, increased regulatory oversight and pressure on drug companies to reduce prices, we believe there is a need for R&D to become more efficient and reduce costs to prevent an innovation slowdown in the industry. Many leading pharmaceutical companies have restructured their R&D processes by establishing centers of R&D excellence and disease focused centers although historical commercial success rate for new drugs is low, with only 2 out of 10 drugs matching or exceeding average R&D costs.4
3 Results Healthcare – 2013 CRO’s and Other Outsourced Pharmaceutical Support Services
| 10 |
Due to these factors, we believe our quantitative imaging analyses offer solutions to these issues within drug development by providing more precise and reliable information in the assessment of compounds being developed. We believe our increased precision and reproducibility enable our customers to make more confident decisions on the efficacy of their compounds.
Quantitative Image Analysis Services
We have conducted research to determine the size of the market for image analysis services in clinical trials supporting the pharmaceutical, biotech and medical device industries. Based on our research and discussion within the imaging CRO and medical device and drug development industries, we have found that the market is highly competitive and fragmented, with approximately $550 million in total annual revenues projected for 2015. As competition increases, we will look to provide value-added services and undertake marketing and sales programs to differentiate our services based on our technology, expertise, and experience in specific therapeutic areas. Competition has resulted in additional pressure being placed on price, service and quality with the recent consolidations within the industry over the past few years.
We estimate that the annual growth rate for the market is 0% to 10% for the next five years. Our estimates are based on the amount of trials currently conducted within therapeutic areas in which we work and the annual growth rate of the pharmaceutical and CRO markets in which imaging is a component. We believe that some of the largest players, which offer the broadest set of capabilities, are experiencing flat to modest growth relative to their revenues derived by imaging services.
Intellectual Property
We consider our proprietary and patented technology and the technology for which we have applied for patent protection to be of importance to our business plan. We hold eight patents issued by the United States Patent and Trademark Office. These patents begin to expire in 2020 and expire thereafter through 2028. We have also applied for a number of other patents, both domestically and in foreign jurisdictions. To protect our proprietary technology, we rely primarily on a combination of confidentiality procedures and copyright, trademark and patent laws. Our policy is to require employees and consultants to execute confidentiality and invention assignment agreements upon the commencement of their relationship with the Company. These agreements provide that confidential information developed or made known during the course of a relationship with the Company must be kept confidential and not disclosed to third parties except in specific circumstances and for the assignment to VirtualScopics of intellectual property rights developed within the scope of the relationship.
Competition
Our main competitors are imaging clinical research organizations (iCROs) providing clinical trial services to pharmaceutical companies. As of the date of this report, we believe that none of the leading imaging CROs have technology capabilities that are comparable to our technology. iCROs typically provide manual and non-differentiated interpretation of medical images for the pharmaceutical industry. As a result, we believe that currently there is an opportunity for us to establish a technology advantage and a set of differentiated services in the advanced image-based biomarker market.
The main CROs which participate in imaging trials are Perceptive, Icon, and CCBR-Synarc+BioClinica. Additionally, some academic centers have worked on software that has applications for neurological diseases. However, we believe these academic centers lack the required FDA compliance standards and ability to scale their operations to meet customer demand and we believe they offer inferior technology.
4 PhRMA – 2014 Profile Pharmaceutical Industry
| 11 |
Our technology competition is largely comprised of a limited number of university research centers that are developing the next generation of image analysis tools. Aside from university centers, there are a few commercial entities that have a desire to provide these advanced imaging services. However, we believe they are constrained by a lack of technical capabilities.
Government Regulation
Healthcare in the United States is heavily regulated by the federal government, and by state and local governments. The federal laws and regulations affecting healthcare change constantly, thereby increasing the uncertainty and risk associated with any healthcare-related company.
The federal government regulates healthcare through various agencies, including the following:
| · | the Food and Drug Administration, or FDA, which administers the Food, Drug, and Cosmetic Act, or FD&C Act, as well as other relevant laws; |
| · | Centers for Medicare & Medicaid Services, or CMS, which administers the Medicare and Medicaid programs; |
| · | the Office of Inspector General, or OIG, which enforces various laws aimed at curtailing fraudulent or abusive practices, including by way of example, the Anti-Kickback Law, the Anti-Physician Referral Law, commonly referred to as Stark, the Anti-Inducement Law, the Civil Money Penalty Law, and the laws that authorize the OIG to exclude health care providers and others from participating in federal healthcare programs; and |
| · | the Office of Civil Rights which administers the privacy aspects of the Health Insurance Portability and Accountability Act of 1996, or HIPAA. |
All of the aforementioned are agencies within the Department of Health and Human Services, or HHS. Healthcare is also provided or regulated, as the case may be, by the Department of Defense through its TriCare program, the Public Health Service within HHS under the Public Health Service Act, the Department of Justice through the Federal False Claims Act and various criminal statutes, and state governments under the Medicaid program and their internal laws regulating all healthcare activities.
FDA
The FDA regulates medical devices. A “medical device,” or device, is an article, including software and software associated with another medical device, which, among other things, is intended for use in the diagnosis of disease or other conditions, or in the cure, mitigation, treatment or prevention of disease, in man or other animals. Computer software that complements a CT or MRI scan, such as VirtualScopics’, we believe is considered a medical device and is therefore subject to FDA regulation. To date, our sales have been to the pharmaceutical and medical device industries to support their clinical trials. We would need to obtain FDA clearance or approval, as discussed below, before using our technology and services for diagnostic or treatment planning in a clinical setting.
Devices are subject to varying levels of regulatory control, the most comprehensive of which requires that a clinical evaluation be conducted before a device receives approval for commercial distribution. In the United States, we generally are able to obtain permission to distribute a new device in two ways. The first applies to any new device that is substantially equivalent to a device first marketed prior to May 1976. In this case, to obtain FDA permission to distribute the device, we generally must submit a premarket notification application (a section 510(k) submission), and receive an FDA order finding substantial equivalence to a device (first marketed prior to May 1976) and permitting commercial distribution of that device for its intended use. A 510(k) submission must provide information supporting its claim of substantial equivalence to the predicate device.
| 12 |
If clinical data from human experience are required to support the 510(k) submission, these data must be gathered in compliance with investigational device exemption (IDE) regulations for investigations performed in the United States. The FDA review process for premarket notifications submitted pursuant to section 510(k) takes on average about 90 days, but it can take substantially longer if the agency has concerns, and there is no guarantee that the agency will “clear” the device for marketing, in which case the device cannot be used for diagnosis and distributed in the United States. Nor is there any guarantee that the agency will deem the article subject to the 510(k) process, as opposed to the more time-consuming and resource intensive and problematic, premarket approval, or PMA, process described below.
The second, more comprehensive, approval process applies to a new device that is not substantially equivalent to a pre-1976 product. In this case, two steps of FDA approval generally are required before we can market the product in the United States. First, we must comply with IDE regulations in connection with any human clinical investigation of the device. Second, the FDA must review our PMA application, which contains, among other things, clinical information acquired under the IDE. The FDA will approve the PMA application if it finds there is reasonable assurance the device is safe and effective for its intended use.
Certain changes to existing devices that do not significantly affect safety or effectiveness can be made with in vitro testing under reduced regulatory procedures, generally without human clinical trials and by filing a PMA supplement to a prior PMA. Exported devices are subject to the regulatory requirements of each country to which the device is exported, as well as certain FDA export requirements.
After approval or clearance to market is given, the FDA and foreign regulatory agencies, upon the occurrence of certain events, have the power to withdraw the clearance or require changes to a device, its manufacturing process, its labeling or additional proof that regulatory requirements have been met.
A device manufacturer is also required to register with the FDA. As a result, we may be subject to periodic inspection by the FDA for compliance with the FDA’s Quality System Regulation requirements and other regulations. In the European Union, we are required to maintain certain International Organization for Standardization (ISO) certifications in order to sell product and to undergo periodic inspections by notified bodies to obtain and maintain these certifications. These regulations require the Company to manufacture products and maintain documents in a prescribed manner with respect to design, manufacturing, testing and control activities. Further, we are required to comply with various FDA and other agency requirements for labeling and promotion. The Medical Device Reporting regulations require that we provide information to the FDA whenever there is evidence to reasonably suggest that a device may have caused or contributed to a death or serious injury or, if a malfunction of the device were to occur, it could cause or contribute to a death or serious injury. In addition, the FDA prohibits the Company from promoting a medical device for unapproved purposes.
We currently meet the requirements of Good Clinical Practices: Consolidated Guidance, which governs the conduct of clinical trials, and our software complies with the FDA’s Regulation 21 CFR Part 11 (Electronic Records; Signatures) and 21 CFR Part 820.30, which outline the requirements for design controls in medical devices. As mentioned throughout this section, as we develop our approach into personalized medicine, FDA approval would most likely be required for the use of our software in that market.
Privacy Provisions of HIPAA
HIPAA, among other things, protects the privacy and security of individually identifiable health information by limiting its use and disclosure. HIPAA directly regulates “covered entities” (healthcare providers, insurers and clearinghouses) and indirectly regulates “business associates” with respect to the privacy of patients’ medical information. All entities that receive and process protected health information are required to adopt certain procedures to safeguard the security of that information. It is our policy to comply with HIPAA requirements.
| 13 |
Research and Development Costs
We incurred $1,245,264 and $1,510,721 in research and development costs for the years ended December 31, 2014 and 2013, respectively.
Customers
The following table sets forth information as to revenue and percentage of revenue for our largest customers in 2014 and 2013:
| For the Years Ended December 31, | ||||||||||||||||
| 2014 | 2013 | |||||||||||||||
| Customer 1 | $ | 2,699,978 | 26 | % | $ | 4,682,332 | 42 | % | ||||||||
| Customer 2 | $ | 2,158,828 | 21 | % | $ | 1,290,075 | 12 | % | ||||||||
| Customer 3 | $ | 2,083,135 | 20 | % | $ | 1,226,391 | 11 | % | ||||||||
| Customer 4 | $ | 1,082,844 | 10 | % | $ | - | - % | |||||||||
Employees
As of December 31, 2014 we had 95 employees, 85 of which were full-time. We are not party to any collective bargaining agreements and we believe our relationships with our employees are good.
You should carefully consider the following risk factors before making an investment decision. If any of the following risks actually occur, our business, financial condition, or results of operations could be materially adversely affected. In such cases, the trading price of our common stock could decline, and you may lose all or part of your investment.
If our services do not continue to attract interest from new and existing customers, we may not maintain our current level of business or achieve future growth.
If we are unable to continue to attract interest in the industry for our services, we could fail to maintain our current level of business or achieve future growth. This would have a detrimental effect on our business. Our ability to generate revenues is highly dependent on building and maintaining relationships with leading pharmaceutical and biotechnology companies. No assurance can be given that a sufficient number of such companies will maintain or increase their demand for our services, thereby limiting the overall market and not enable us to increase our revenue. In addition, the rate of the growth of MRI and CT image-based biomarkers is difficult to predict. Failure to attract and maintain a significant customer base would have a detrimental effect on our business, operating results and financial condition.
The majority of the contracts we have with customers are cancelable for any reason by giving 30 days advance notice.
Our customers typically engage us to perform services for them on a project-by-project basis and are required by us to enter into a written contractual agreement for the work, labor and services to be performed. Generally, our project contracts are terminable by the customer for any or no reason on 30 days’ advance notice to us. If a number of our customers were to exercise cancellation rights, our business and operating results would be materially and adversely affected.
Our reported amounts of anticipated service revenue to be earned from the backlog may not be indicative of future results.
As of December 31, 2014, the amount of anticipated service revenue remaining to be earned from the backlog was approximately $29 million as compared to approximately $24 million as of December 31, 2013.
| 14 |
Backlog represents anticipated service revenue from work not yet completed or performed under signed contracts. The majority of contracts we have with customers are cancelable for any reason by giving 30 days advance notice. We cannot assure you that this amount will be indicative of future results. Furthermore, the contracts may contemplate performance over multiple years. Therefore, revenue may not be realized in the fiscal year in which the contract is signed or the award is made. There are several factors that can affect whether we will realize the full benefits under a contract or award and the time over which we will realize that revenue including:
| • | Customer cancellation due to performance reasons with their compounds in development; |
| • | Change in the scope of a project; |
| • | Timing of performance, including over multiple years; |
| • | Timing of patient recruitment and image site identification and training. |
Also, if clients delay projects, we will not generate revenue at the rate originally expected. Accordingly, the historical relationship of our reported backlog to revenues may not be indicative of future results.
If we are unable to manage and sustain growth in our business, our operating results would be adversely affected.
We have seen a growing demand for our image analysis services in clinical trials for pharmaceutical companies over the past year. Although there can be no assurance that growth in demand will continue or that customers will complete the clinical trial projects as awarded to us, if it does continue we may be unable to scale our capacity efficiently to meet this demand. If we are unable to do so, we may fail to maintain our operating margins or achieve expected operating margins. This may have a material and adverse effect on our operating results.
Our services may become obsolete if we do not effectively respond to rapid technological change on a timely basis.
Our services depend on the needs of our customers and their desire to utilize image-related services in drug and medical device development. Since the image-based biomarker industry is characterized by evolving technologies, uncertain technology and limited availability of standards, we must respond to new research findings and technological changes affecting our customers. We may not be successful in developing and marketing, on a timely and cost-effective basis, new or modified products and services, which respond to technological changes, evolving customer requirements and competition. If we are unsuccessful in this regard, our business and operating results could be materially and adversely affected.
We have a history of operating losses and uncertain future profitability.
We have incurred losses from operating activities. As we work to grow our business, we may face risks and difficulties in our business including uncertainties of maintaining our current customers, further market penetration, competition, cost increases and delays in achieving business objectives. There can be no assurance that we will succeed in addressing any or all of these risks or that we will achieve future profitability. The failure to do so would have a material adverse effect on our business, financial condition, and operating results.
Although we believe that our services do not and will not infringe upon the patents or violate the proprietary rights of others, it is possible such infringement or violation has occurred or may occur which could have a material adverse effect on our business.
Portions of our business are reliant upon patented and patentable systems and methods used in our image analysis and related intellectual property. In the event that we are deemed to infringe upon the patents or proprietary rights of others, we could be required to modify our products and services or obtain a license for the manufacture and/or sale of such services. In such event, there can be no assurance that we would be able to do so in a timely manner, upon acceptable terms and conditions, or at all, and the failure to do any of the foregoing could have a material adverse effect upon our business. Moreover, there can be no assurance that we will have the financial or other resources necessary to enforce or defend a patent infringement or proprietary rights violation action. In addition, we could be subject to injunctive relief and, under certain circumstances, become liable for damages, which could also have a material adverse effect on our business.
| 15 |
We are subject to pharmaceutical, medical device and healthcare industry regulations, which could adversely affect the nature and extent of the products and services we offer.
Many aspects of the pharmaceutical, medical device and healthcare industry are subject to regulation at the federal level. From time to time, the regulatory entities that have jurisdiction over the industry adopt new or modified regulations or take other actions as a result of their own regulatory processes or as directed by other governmental bodies. This changing regulatory environment could adversely affect the nature and extent of the services we are able to offer.
Our failure to compete effectively in our industry could cause our revenues to decline.
The image analysis industry is highly competitive. We face numerous competitors in our business. If we fail to compete effectively, we will lose clients, which would cause our business to suffer. Our ability to successfully compete is dependent on many factors, including: timely and quality performance; expertise and experience in specific therapeutic areas; the scope of service offerings; strength in various geographic markets; the price of services; our competitors’ service and product offerings; and our ability to upgrade our services in comparison to the service and product offerings of our competitors. If our services are not competitive based on these or other factors, our business, financial condition and results of operations could be materially harmed.
We may in the future experience competition from academic sites, imaging CROs, and other competing technologies.
Competition in the development of imaging solutions may become more widespread as with emerging technologies such as proteomics and genomics which can serve as predictive tools of drug efficacy. Competitors range from university-based research and development projects which would develop advanced tools to development stage companies and major domestic and international companies which would commercialize the tools. Some of these entities have greater financial, technical, marketing, sales, distribution and other resources than ours. There can be no assurance that we can continue to develop our technologies or that present or future competitors will not develop technologies that render our image-based biomarker industry obsolete or less marketable or that we will be able to introduce new products and product enhancements that are competitive with other products marketed by industry participants.
We have experienced significant demand from certain customers, thereby increasing our dependence on these customers until we can further diversify our customer base.
While we continue to serve a broad range of customers, we have experienced strong demand from four of our customers in 2014 as compared to three of our customers in 2013. We depend on these customers to sustain our growth. In 2014 and 2013, these customers accounted for 77% and 65% of our revenue, respectively. We continue to see demand from other customers but not at the same significant pace as these three customers. We continue to invest on our sales and marketing efforts to further diversify our customers and more broadly penetrate the market, in order to minimize reliance on any one customer. As with all of our contracts, these customers may terminate their contractual relationships with us for any or no reason on 30 days’ advance notice. A decision by any of these customers to cancel all of its studies with us could have an adverse impact on the growth of our business.
| 16 |
Consolidation within the pharmaceutical industry and changes within healthcare regulation may have an adverse impact on our business.
Over the past few years, there have been several mergers and acquisitions among pharmaceutical and biotechnology companies. Historically, these transactions have positively impacted our business due to the ability to use our strong relationships within one of the merged entities to better penetrate the combined entity. However, there can be no assurance that consolidation within the industry will continue to be beneficial to us. Additionally, with the recent political landscape and changes within the healthcare industry, there may be an adverse impact on our business if the cost of imaging significantly increases or no longer becomes standard of care for patients. Although, we do not believe imaging will decline in its level of use, if it does we may need to reduce prices or invest in research to advance the education and science of medical imaging.
Consolidation among our competitors could cause us to lose customers or could exert additional pressure on the prices of our services.
There has been a significant amount of consolidation among providers of clinical trial imaging services and other services such as ours. Larger enterprises created through this consolidation may also have greater resources and efficiencies than our company and have other competitive advantages. As a result of this consolidation, competition to provide goods and services to customers has increased. Further consolidation in the industry could exert additional pressure on the prices of our products.
Loss of key personnel, or failure to attract and retain additional personnel, could have a material adverse effect on our business.
Our success will be dependent on our continued ability to attract, retain and motivate highly skilled employees. The Board of Directors appointed director Eric Converse to serve as President and Chief Executive Officer and Jim Groff to serve as Chief Financial Officer during 2014. Leadership transitions can be inherently difficult to manage and may cause disruption to our business or further turnover in our workforce or management team. The loss of services of one or more other members of senior management would likely have a material adverse effect on our business.
Furthermore, our performance also depends on our ability to attract and retain management and qualified scientific and technical operating staff. Competition for these skilled personnel is intense. The loss of services of any key executive, or inability to continue to attract and retain qualified staff could have a material adverse effect on our business, results of operations and financial condition. We do not maintain any key employee insurance on any of our executives.
The trading price of our stock may be adversely affected if we are not able to maintain and grow our business.
We intend to continue to use our cash on hand to broaden our market penetration of our services within the industry. If our plans or assumptions with respect to our business change or prove to be inaccurate, we may be required to use part or all of our cash to fund general operating expenses and/or reduce costs within the organization.
We currently do not plan to raise additional capital. However, if we need to raise additional capital, it may not be available on acceptable terms, or at all. Our failure to obtain required capital, or the acquisition of capital on less favorable terms, would have a material adverse effect on our business. If we issue additional equity securities in the future, there could be a dilution or a reduction in priority of our outstanding securities.
The market price of our common stock may fluctuate significantly.
The market price of our common stock may fluctuate significantly in response to factors, some of which are beyond our control, such as the announcement of new products or product enhancements by us or our competitors; developments concerning intellectual property rights and regulatory approvals; quarterly variations in our competitors’ results of operations; changes in earnings estimates or recommendations by securities analysts; developments in our industry; product liability claims or other litigation; and general market conditions and other factors, including factors unrelated to our own operating performance.
| 17 |
Our common stock may be considered a “penny stock” and may be difficult to sell.
The SEC has adopted regulations which generally define “penny stock” to be an equity security that has a market or exercise price of less than $5.00 per share, subject to specific exemptions. The market price of our common stock is currently below $5.00 per share and therefore may be designated as a “penny stock” according to SEC rules. This designation requires any broker or dealer selling these securities to disclose certain information concerning the transaction, obtain a written agreement from the purchaser and determine that the purchaser is reasonably suitable to purchase the securities. These rules may restrict the ability of brokers or dealers to sell our common stock and may affect the ability of our stockholders to sell their shares.
Our strategic alliance with PPD is an important aspect of our growth, and the market may not value our strategic alliance with PPD as we anticipate.
In 2010, we formed an alliance with PPD to provide a joint solution to provide clients with an integrated and customized clinical development and medical imaging solution for oncology clinical trials. The alliance was expanded in January 2012 to include cardiovascular, central nervous system and medical device studies. If the market does not value this model as we anticipate, our ability to grow our business may be negatively impacted. Additionally, the agreement may be terminated by either party on 90 days’ notice. In the event PPD terminates the agreement, we may also experience a negative impact in our ability to experience the level of growth we have historically achieved.
The inability to maintain our NASDAQ listing may adversely affect the trading market for our common stock.
There can be no assurance that we will be able to maintain compliance with NASDAQ listing requirements, including the $1.00 minimum bid price requirement. If our common stock is delisted from NASDAQ, trading in our common stock could be conducted on the OTC Bulletin Board or in the over-the-counter market in what is commonly referred to as the "pink sheets." If this occurs, a shareholder will find it more difficult to dispose of our common stock or to obtain accurate quotations as to the price of our common stock. Lack of any active trading market would have an adverse effect on a shareholder's ability to liquidate an investment in our common stock easily and quickly at a price acceptable to the shareholder. It might also contribute to volatility in the market price of our common stock and could adversely affect our ability to raise additional equity or debt financing on acceptable terms or at all.
A significant number of the shares of our common stock are eligible for sale, and their sale could negatively affect the market price of our common stock.
Sales of a significant number of shares of our common stock in the public market or the possibility of such sales could harm the market price of our common stock and impede our ability to raise capital through the issuance of equity securities. As of December 31, 2014, we had 2,994,928 shares of common stock outstanding. These shares are eligible for resale in the public market either immediately or subject to applicable limitations of Rule 144. In addition to these outstanding shares of common stock, we also have shares to be issued upon the conversion or exercise of 404,612 outstanding options to purchase common stock, 136,132 warrants to purchase common stock and 478,701 shares of preferred stock that are convertible into common stock. We have registered on Form S-8 the sale of up to 690,000 shares issued or to be issued pursuant to our Amended and Restated 2006 Long-Term Incentive Plan, of which 363,070 are subject to outstanding option awards. Sales of our common stock in the public market may have an adverse effect on the market for the shares of our common stock.
| 18 |
Our principal stockholders have significant voting power and may take actions that may not be in the best interests of other stockholders.
Our officers, directors, principal stockholders (greater than 5%) and their affiliates control approximately 30% of our outstanding voting securities. If these stockholders act together, they will be able to exert significant control over our management and affairs requiring stockholder approval, including approval of significant corporate transactions. This concentration of ownership may have the effect of delaying or preventing a change in control and might adversely affect the market price of our common stock. This concentration of ownership may not be in the best interests of all our stockholders.
We do not anticipate paying dividends on our common stock in the foreseeable future, and the lack of dividends may have a negative effect on the stock price.
We currently intend to retain our future earnings to support operations and to finance expansion and meet dividend obligations on our series C-1 and series B convertible preferred stock. In addition, the terms of our series C-1 and series B preferred stock limit our ability to pay dividends to the holders of our common stock. Therefore, we do not anticipate paying any cash dividends on our common stock in the foreseeable future.
In July 2007 we began leasing approximately 19,500 square feet of office space at our corporate headquarters in Rochester, New York. In June 2012, the Company renewed its lease for five years with a lease commencement date of July 1, 2012. The base annual rent under the lease is $309,075, and increases two percent (2%) per year over the term of the lease.
In May 2014, the Company entered into a lease for approximately 2,190 square feet of office space in New Hope, Pennsylvania. The lease term is for three years with a lease commencement date of June 1, 2014. The base annual rent under the lease is $54,000, and increases three percent (3%) per year over the term of the lease.
None.
ITEM 4: Mine Safety Disclosures
Not applicable.
| 19 |
ITEM 5: Market For Registrant's Common Equity, Related Stockholder Matters and Issuer Purchases of Equity Securities
Our shares of common stock are listed for trading on the NASDAQ Capital Market under the trading symbol “VSCP.” The following table sets forth the high and low closing sales prices for our common stock as reported on the NASDAQ Capital Market for the period from January 1, 2013 through December 31, 2014. We affected a 1-for-10 reverse stock split of the Company’s outstanding common stock on August 21, 2013. Corresponding adjustments were made to the number of shares of common stock underlying the Company’s outstanding options, warrants, and preferred stock exercisable for or convertible into common stock and the related long-term incentive plans for such options. All share and related option information presented have been retroactively adjusted to reflect the reduced number of shares and the corresponding increase in stock price resulting from this action. These prices also do not include retail markup, markdown or commission and may not necessarily represent actual transactions. Investors should not rely on historical stock price performance as an indication of future price performance.
| Fiscal Year Ended December 31, 2013 | ||||||||
| High | Low | |||||||
| First Quarter | $ | 7.80 | $ | 6.00 | ||||
| Second Quarter | 6.80 | 3.80 | ||||||
| Third Quarter | 6.70 | 4.20 | ||||||
| Fourth Quarter | 4.82 | 2.93 | ||||||
| Fiscal Year Ended December 31, 2014 | ||||||||
| High | Low | |||||||
| First Quarter | $ | 4.20 | $ | 3.21 | ||||
| Second Quarter | 5.59 | 3.64 | ||||||
| Third Quarter | 5.10 | 3.77 | ||||||
| Fourth Quarter | 4.62 | 3.10 | ||||||
As of March 26, 2015, we had approximately 63 registered holders of record of shares of our common stock.
Dividend Policy
We have never declared a cash dividend on our common stock. We intend to retain any earnings to fund future growth and the operation of our business and, therefore, we do not anticipate paying any cash dividends on our common stock in the foreseeable future. In addition, the terms of our Series B Preferred Stock and Series C-1 Preferred Stock limit our ability to pay dividends to the holders of our common stock. Dividends may be paid on our common stock only if and when declared by our board of directors and paid on an as-converted basis to the holders of our Series A, Series B, and Series C-1 convertible preferred stock.
Equity Compensation Plan Information
The following table summarizes information, as of December 31, 2014, relating to our equity compensation plans:
| 20 |
| Number of Securities to be Issued Upon Exercise of Outstanding Options | Weighted- Average Exercise Price of Outstanding Options | Number of Securities Remaining Available for Future Issuance Under Equity Compensation Plans (Excluding Securities Reflected in Column (a) | ||||||||||
| Plan Category | (a) | (b) | (c) | |||||||||
| Equity compensation plans approved by security holders | 369,612 | (1) | $ | 8.61 | 272,222 | |||||||
| Equity compensation plans not approved by security holders | 35,000 | (2) | $ | 25.00 | - | |||||||
| Total | 404,612 | $ | 10.03 | 272,222 | ||||||||
(1) This amount includes shares options to purchase shares of common stock collectively, under our 2005 and 2006 Long Term Incentive Plans.
(2) In November 2005, our Board of Directors granted to our former Chairman and CEO, Robert Klimasewski, an option to purchase 35,000 shares of our common stock at $25 per share.
Recent Sales of Unregistered Securities
We made no sales of unregistered securities during the quarter ended December 31, 2014.
Issuer Repurchases of Equity Securities
None.
ITEM 7: Management’s Discussion and Analysis of Financial Condition and Results of Operations
The following discussion should be read in conjunction with VirtualScopics’ consolidated balance sheet, and related consolidated statements of operations, changes in stockholders’ equity and cash flows for the years ended December 31, 2014 and 2013, included elsewhere in this report. This discussion contains forward-looking statements, the accuracy of which involves risks and uncertainties. Our actual results could differ materially from those anticipated in the forward-looking statements for many reasons including, but not limited to, those discussed in “Risk Factors” and elsewhere in this report. We disclaim any obligation to update information contained in any forward-looking statements.
Overview
VirtualScopics, Inc. is a leading provider of imaging solutions to accelerate drug and medical device development. We have developed a robust software platform for analysis and modeling of both structural and functional medical images. In combination with our industry-leading experience and expertise in advanced imaging biomarker measurement, this platform provides a uniquely clear window into the biological activity of drugs and devices in clinical trial patients, allowing our customers to make better decisions faster.
Since inception, revenues have been derived primarily from image processing services in connection with pharmaceutical drug trials. For these services, we have been concentrating in the areas of oncology, fatty liver disease, neurology, cardiovascular, and osteoarthritis. We have also derived a small portion of revenue from consulting services. We expect that the concentration of our revenue will continue in these services and in those areas in 2015. Revenues are recognized as the medical images that we process are quantified and delivered to our customers and/or the services are performed.
| 21 |
We are focused on strengthening our core business and increasing the number of contract awards we receive. This effort includes investments in our infrastructure and sales function. We continue to submit proposals and bids for new contracts, however, there can be no assurance that we will secure or maintain contracts from these efforts. Additionally, due to recent consolidation within the industry, our pricing and services may not stay competitive with companies that have a stronger global presence.
There are several factors that can affect whether we will realize the full benefits under any contract and the time over which we will realize that revenue. Customers may not continue our services due to many reasons including lack of demonstrated efficacy with their compounds in development. Furthermore, the contracts may contemplate performance over multiple years. Therefore, revenue may not be realized in the fiscal year in which the contract is signed or awarded. Recognition of revenue under the contract may also be affected by the timing of patient recruitment and image site identification and training.
Results of Operations
Results of Operations for Year Ended December 31, 2014 Compared to Year Ended December 31, 2013
Revenues
We had revenues of $10,452,000 for the year ended December 31, 2014 compared to $11,174,000 for the year ended December 31, 2013, representing a 6% decrease. The decrease in revenues is partially related to the slowdown in the amount of new projects awarded in 2012, the effects of which can carry over multiple years due to the timing in the recognition of revenue for a study can be on average over a three year period. Revenues were also impacted by the timing of the initiation of awarded and contracted projects and the large number of studies that were completed in 2013 and 2014. During the life of a project, quite often there is an expansion in the size of the study. However there are also situations where the sponsor does not recruit the number of subjects or sites as originally budgeted and in those cases there are remaining budget dollars at the end of the study that will not be realized into revenue. Additionally, the decrease in revenues was affected by a six week, retrospective, Phase III breast cancer study which generated over $1 million in revenues during the second quarter of 2013 that did not reoccur in 2014. Excluding this six week nonrecurring study from 2013, revenues would have increased by approximately $278,000 or 3% for the year ended December 31, 2014.
The Company continues to focus on strategies that we believe will lead to increased revenue and profitability. In 2014, the Company finalized an alliance with IXICO, plc located in London, which provides clinical trial solutions focusing on Alzheimer’s disease. The alliance enables the Company to access IXICO’s expertise in this area and provides a European presence. In addition, we believe the integration of the companies’ complementary technologies will help provide more comprehensive and scalable capabilities especially for Phase III studies. The Company also finalized the recruitment of a Scientific Advisory Board which we believe will enhance and deepen our knowledge base in our core competencies and allow for an exchange of ideas and knowledge in each therapeutic area. We continued investments in our sales function by the recent opening of a satellite office in New Hope, Pennsylvania. This office is primarily for sales and project management, allowing our representatives to be closer to our customers in the Pharma corridor.
During 2014, we performed work on 142 different projects in connection with our pharmaceutical drug trials in the fields of oncology, osteoarthritis and various other therapeutic areas. This compares to 138 projects on which we performed work during 2013.
| 22 |
Gross Profit
We had a gross profit of $3,362,000 for the year ended December 31, 2014 compared to $4,419,000 for the comparable period in 2013. The gross margin for the year ended December 31, 2014 was 32% compared to 40% for the year ended December 31, 2013. During 2014, 51% of our business was in oncology services and 32% in musculoskeletal, and the remaining 17% was in other therapeutic areas. This compares to 59%, 26% and 15%, respectively, in 2013. For the year ended December 31, 2014, 40% of the revenues were derived from Phase III studies compared to 47% during the comparable period in 2013. Our margins decreased year over year due to the volume of business in specific therapeutic areas and the phase of the studies. Historically, we have experienced lower margins in our musculoskeletal projects than our oncology projects and Phase III studies tend to generate higher margins than early phase studies. Specifically, in 2013, we achieved improved gross margins due to a large, retrospective, Phase III study that we delivered within a six week timeframe, aided by our 2013 software release that enabled quick, efficient and reliable analysis of traditional Phase III imaging endpoints. We believe our revenues in Phase III oncology projects will increase due to the therapeutic and study phase mix of the 2014 bookings.
Research and Development
Research and development costs decreased in 2014 by $265,000, or 21%, to $1,245,000 from $1,510,000 in 2013. The expenditures were lower due to approximately $215,000 in consultant and professional fees incurred during 2013, related to the personalized medicine application that did not reoccur in 2014. Additionally, the development group performed work in the operations area to help overall efficiencies and support the increase in new projects which resulted in their labor costs being allocated to the service cost area. Our research and development efforts center around refining our processes through the use of our software platform in order to gain efficiencies which we believe will better allow us to standardize our processes as we scale the business. Additionally, we continue to invest in the commercialization of new imaging techniques across many modalities and therapeutic areas to best serve our customers. We finalized the recruitment of our Scientific Advisory Board which we believe will enhance and deepen our knowledge base in our core competencies and allow for an exchange of ideas and knowledge in each therapeutic area.
Sales and Marketing
Sales and marketing costs increased in 2014 by $320,000, or 17%, to $1,876,000, from $1,556,000 in 2013. The increase was largely attributed to higher commissions resulting from the significant increase in bookings achieved during 2014. The bookings in 2014 were $26 million compared to $17 million in 2013. Bookings represent the full value of contracts signed during a given reporting period, regardless of when the services will be performed or revenue recognized.
Our sales and marketing initiatives encompass attendance and presentations at leading industry conferences, frequent educational webinars and active calling on existing and new customers as well as our continued efforts to attract new business through our strategic alliance with PPD, Inc. and IXICO, plc.
General and Administrative
General and administrative expenses for the year ended December 31, 2014 were $3,350,000, representing a decrease of $399,000 or 12%, from $3,749,000 in 2013. There was approximately a $228,000 decrease in consultant and professional fees that were incurred during 2013 related to the personalized medicine application and approximately $454,000 in severance costs from the resignation of the former CEO and related search expenses for a replacement that did not reoccur in 2014. Additionally, there was a $163,000 decrease in stock compensation expense during 2014. These expenses were offset by approximately a $125,000 increase in investor relations as well as legal costs which were incurred as part of negotiating the office lease in Pennsylvania, finalizing the Scientific Advisory Board and IXICO alliance agreements. During 2014, we hired three employees in the finance, information technology, and quality departments which increased costs by approximately $171,000 and we continued investing in our system infrastructure including professional fees for a mock FDA audit resulting in $157,000 of additional costs. General and administrative expenses include both personnel and non-personnel costs. Departments included within general and administrative function are finance, information technology, quality, human resources and the CEO position. Non-payroll related costs included within general and administration include stock option expense, audit and legal fees, regulatory and compliance fees, Nasdaq listing fees, board fees, non-capitalizable hardware and software costs and licenses and non-sales related travel costs. We plan to take additional efforts during the 2015 fiscal year to reduce our general and administrative expenses relative to our revenues.
| 23 |
Depreciation and Amortization
Depreciation and amortization charges decreased for the year ended December 31, 2014 by $53,000 or 14%, to $314,000, from $367,000 in 2013. The reduction was due to a number of capital assets becoming completely depreciated during 2014 and reductions in spending for capital purchases during 2012 and 2013. The amortization and depreciation costs are based on the timing and life of patents and property and equipment. We continue to invest in our patent portfolio, however, we do not anticipate significant expenditures are necessary to support our current business and future strategies. Our IT systems are the basis of our operating platform. In 2015, we expect our investments to increase in our IT infrastructure to ensure we have a robust and reliable operating system.
Other income (expense), net
Interest income for the year ended December 31, 2014 was $4,000, representing interest derived on the Company’s operating and savings accounts, compared to interest income of $22,000 in 2013. The decrease is a result of lower average cash balances in the Company’s interest bearing accounts in 2014 compared to 2013.
Net Loss
Our net loss for the year ended December 31, 2014 was $3,422,000 compared to a net loss of $2,745,000 for the year ended December 31, 2013. The increase in our net loss was primarily related to the decreases in our revenues and gross margins along with increased expenditures for commissions as discussed above.
Liquidity and Capital Resources
Our working capital as of December 31, 2014 and 2013 was approximately $3,294,000 and $6,731,000, respectively. The decrease in working capital was primarily a result of the decline in revenue resulting in additional cash used in operations along with additional cash used to purchase software and equipment and cash used for dividend payments. We do not expect, nor have we experienced, significant write-offs within our receivables, however, we continue to see an extension of payment terms within the industry and with several of our largest customers.
Net cash used in operating activities totaled $2,857,000 in the year ended December 31, 2014 compared to net cash used in operating activities of $1,126,000 in the comparable 2013 period. The increase in the use of cash is mostly due to increasing net losses in comparison to 2013 as well as increases in accounts payable and accrued expenses due to the timing of payments to vendors.
We invested $301,000 in the purchase of equipment and the costs in patent applications and their maintenance in 2014, compared to $67,000 for the investment in these items in 2013. The increase reflects investments in our IT and IS infrastructure in 2014 to improve operational efficiencies. In 2015, we are planning to invest in our operating systems and infrastructure in connection with our core business. We believe these planned investments will help further enhance our abilities as a Phase III provider and continue to improve our operational efficiencies.
There was $126,000 in cash used by our financing activities during 2014 compared to no cash provided or used in 2013. The payment of Series C-1 and B preferred stock cash dividends resulted from the Series C-1 stockholders electing to receive cash dividends in 2014.
| 24 |
We currently anticipate that our cash will be sufficient to meet our working capital requirements to continue our sales and marketing and research and development efforts for at least the next 12 months. Our future plans and growth are dependent on our ability to continue our business development efforts surrounding our project award backlog and in turn, increasing the revenues of the Company. If in the future, our plans or assumptions change or prove to be inaccurate, we may be required to seek additional capital through public or private debt or equity financings, corporate collaborations or other means. We may also be required to reduce our operating expenditures and investments in our infrastructure especially if revenues do not realize as expected from our backlog. We have not secured any commitment for new financing at this time, nor can we provide any assurance that other new financings will be available on commercially acceptable terms, if needed, or at all. If we cannot raise sufficient funds on acceptable terms, we may have to reduce or restrict our level of expenditures, curtail our research and development activities and take additional measures to reduce costs in order to conserve our cash.
Off Balance Sheet Arrangements
We have no off-balance sheet arrangements, other than operating leases (as described in “Contractual Obligations” below) that have or are reasonably likely to have a current or future effect that is material to investors on our financial condition, revenues or expenses, results of operations, liquidity, capital resources or capital expenditures.
Contractual Obligations
The following table summarizes our contractual obligations at December 31, 2014 which we expect to have an effect on our liquidity and cash flow in future periods. (See Item 2: Description of Property for a full description of our lease obligations.)
| Payments Due by Period | ||||||||||||
| Less than | ||||||||||||
| Total | 1 Year | 1-4 Years | ||||||||||
| Operating Leases | $ | 972,234 | $ | 384,950 | $ | 587,284 | ||||||
ITEM 8: Financial Statements and Supplementary Data
The financial statements required hereby are located on pages F-1 through F-20 of this report.
ITEM 9: Changes In and Disagreements with Accountants on Accounting and Financial Disclosure
Not applicable.
ITEM 9A: Controls and Procedures
Evaluation of Disclosure Controls and Procedures
We maintain a set of disclosure controls and procedures, as defined in Section 13a-15(e) of the Securities Exchange Act of 1934, as amended (the “Exchange Act”), that are designed to ensure that information required to be disclosed by us in the reports filed by us under the Securities Exchange Act of 1934, as amended (the “Exchange Act”) is recorded, processed, summarized and reported within the time periods specified in the SEC’s rules and forms. We carried out an evaluation, under the supervision and with the participation of our Chief Executive Officer and our Chief Financial Officer, of the effectiveness of the design and operation of our disclosure controls and procedures pursuant to Rule 13a-15(b) of the Exchange Act. Based on that evaluation, our Chief Executive Officer and our Chief Financial Officer concluded that our disclosure controls and procedures were effective as of the end of the period covered by this report.
| 25 |
Notwithstanding the foregoing, there can be no assurance that the Company’s disclosure controls and procedures will detect or uncover all failures of persons within the Company to disclose material information otherwise required to be set forth in the Company’s periodic reports. There are inherent limitations to the effectiveness of any system of disclosure controls and procedures, including the possibility of human error and the circumvention or overriding of the controls and procedures. Accordingly, even effective disclosure controls and procedures can only provide reasonable, not absolute, assurance of achieving their control objectives.
Management’s Report on Internal Control Over Financial Reporting
Our management is responsible for establishing and maintaining adequate internal control over financial reporting, as such term is defined in Exchange Act Rule 13a-15(f). Internal control over financial reporting is a process designed to provide reasonable assurance regarding the reliability of financial reporting and the preparation of financial statements for external purposes in accordance with generally accepted accounting principles. Internal control over financial reporting includes those policies and procedures that (i) pertain to the maintenance of records that, in reasonable detail, accurately and fairly reflect the transactions and dispositions of our assets; (ii) provide reasonable assurance that transactions are recorded as necessary to permit preparation of the financial statements in accordance with generally accepted accounting principles, and that receipts and expenditures are being made only with proper authorizations; and (iii) provide reasonable assurance regarding prevention or timely detection of unauthorized acquisition, use or disposition of our assets that could have a material effect on the financial statements.
Because of its inherent limitations, internal control over financial reporting may not prevent or detect misstatements. Also, projections of any evaluation of effectiveness to future periods are subject to the risk that controls may become inadequate because of changes in conditions, or that the degree of compliance with the policies or procedures may deteriorate.
Our management, under the supervision of and with the participation of the Chief Executive Officer and the Chief Financial Officer, assessed the effectiveness of our internal control over financial reporting as of December 31, 2014 based on criteria for effective control over financial reporting described in the 1992 Internal Control — Integrated Framework issued by the Committee of Sponsoring Organizations of the Treadway Commission, or COSO. Based on this assessment, our management concluded that our internal control over financial reporting was effective as of December 31, 2014.
This annual report does not include an attestation report of the Company's independent registered public accounting firm regarding internal control over financial reporting. Management's report was not subject to attestation by the Company's registered public accounting firm pursuant to Section 404(c) of the Sarbanes-Oxley Act of 2002, which permits the Company to provide only management's report in this annual report.
Changes in Internal Controls over Financial Reporting
An evaluation was performed under the supervision of the Company’s management, including the Chief Executive Officer and Chief Financial Officer, as required under Exchange Act Rules 13a-15(d) and 15d-15(d), of whether any change in the Company’s internal control over financial reporting occurred during the fiscal quarter ended December 31, 2014. Based on that evaluation, the Company’s management, including the Chief Executive Officer and Chief Financial Officer, concluded that no change in the Company’s internal controls over financial reporting occurred during the fiscal quarter ended December 31, 2014 that has materially affected or is reasonably likely to materially affect, the Company’s internal control over financial reporting.
None.
| 26 |
ITEM 10: Directors, Executive Officers, Promoters and Control Persons; Compliance with Section 16(a) of the Exchange Act
The information required by this Item regarding our directors and executive officers is incorporated in this report by reference to our Proxy Statement for our 2015 Annual Meeting of Stockholders where such information appears under the heading “Directors and Executive Officers” in our Proxy Statement for our 2015 Annual Meeting of Stockholders.
Section 16(a) Beneficial Ownership Reporting Compliance
The discussion under the heading “Security Ownership of Certain Beneficial Owners and Management” in our definitive proxy statement for the 2015 Annual Meeting of Stockholders is incorporated herein by reference to such proxy statement.
Code of Ethics
The Company has adopted a Code of Ethics that is applicable to our principal executive officer and principal financial officer and can be viewed on our website www.virtualscopics.com.
ITEM 11. Executive Compensation
The information required by this Item is incorporated in this report by reference to our definitive Proxy Statement referred to in Item 10 above where such information appears under the heading “Executive Compensation and Other Matters.”
ITEM 12. Security Ownership of Certain Beneficial Owners and Management and Related Stockholder Matters
The information required by this Item regarding security ownership of certain beneficial owners and management is incorporated in this report by reference to our definitive Proxy Statement referred to in Item 10 above where such information appears under the heading “Security Ownership of Certain Beneficial Owners and Management” and “Equity Compensation Plans.”
ITEM 13. Certain Relationships and Related Transactions
The information required by this Item is incorporated in this report by reference to our definitive Proxy Statement referred to in Item 10 above where such information appears under the heading “Certain Relationships and Related Transactions.”
ITEM 14. Principal Accountant Fees and Services
The information required by this Item is incorporated in this report by reference to our definitive Proxy Statement referred to in Item 10 above where such information appears under the heading “Principal Accounting Fees and Services.”
The list of exhibits required by this Item is incorporated in this Item by reference to the exhibit index attached after the signature page to this report.
| 27 |
SIGNATURES
Pursuant to the requirements of Section 13 or 15(d) of the Securities Exchange Act of 1934, the Registrant has caused this report to be signed on its behalf by the undersigned, thereunto duly authorized.
| March 31, 2015 | VirtualScopics, Inc. (Registrant) |
| /s/ James Groff | |
| Chief Financial Officer |
POWER OF ATTORNEY
KNOW ALL BY THESE PRESENTS, that each person whose signature appears below constitutes and appoints Eric Converse and James Groff, or either of them, as his or her true and lawful attorneys-in-fact and agents, with full power of substitution and resubstitution, for him and in his name, place and stead, in any and all capacities, to sign any and all amendments to this Annual Report on Form 10-K and any documents related to this report and filed pursuant to the Securities and Exchange Act of 1934, as amended and to file the same, with all exhibits thereto, and other documents in connection therewith, with the Securities and Exchange Commission, granting unto said attorneys-in-fact and agents, full power and authority to do and perform each and every act and thing requisite and necessary to be done in connection therewith as fully to all intents and purposes as he might or could do in person, hereby ratifying and confirming all that said attorneys-in-fact and agents, or their substitute or substitutes may lawfully do or cause to be done by virtue hereof.
Pursuant to the requirements of the Securities Exchange Act of 1934, this report has been signed below by the following persons on behalf of the Registrant and in the capacities and on the dates indicated.
DATE |
SIGNATURE | TITLE | ||
| March 31, 2015 | /s/ Eric Converse | President and Chief Executive Officer | ||
| (Eric Converse) | (Principal Executive Officer) | |||
| March 31, 2015 | /s/ James Groff | Chief Financial Officer | ||
| (James Groff) | (Principal Financial and Accounting Officer) | |||
| March 31, 2015 | /s/ Robert Klimasewski | Director | ||
| (Robert Klimasewski) | ||||
| March 31, 2015 | /s/ Bruce Lev | Director | ||
| (Bruce Lev) | ||||
| March 31, 2015 | /s/ Andrew Levitch | Director | ||
| (Andrew Levitch) | ||||
| March 31, 2015 | /s/ Charles Phelps | Director | ||
| (Charles Phelps) | ||||
| March 31, 2015 | /s/ Terence Walts | Director | ||
| (Terence Walts) | ||||
| March 31, 2015 | /s/ Michael Woehler | Director | ||
(Michael Woehler)
|
| 28 |
Exhibit Index
| 3.1 | Certificate of Incorporation of VirtualScopics, Inc. dated April 21, 1988 (Incorporated herein by reference to Exhibit 3.1 of the VirtualScopics, Inc.’s Registration Statement on Form SB-2 filed with the Securities and Exchange Commission on November 4, 2004 (File No. 333-120253)). |
| 3.2 | Certificate of Amendment of Certificate of Incorporation of VirtualScopics, Inc. dated February 2, 1989 (Incorporated herein by reference to Exhibit 3.1a of the VirtualScopics, Inc.’s Registration Statement on Form SB-2 filed with the Securities and Exchange Commission on November 4, 2004 (File No. 333-120253)). |
| 3.3 | Certificate for Renewal and Revival of Certificate of Incorporation of VirtualScopics, Inc. dated February 23, 2004 (Incorporated herein by reference to Exhibit 3.1b of the VirtualScopics, Inc.’s Registration Statement on Form SB-2 filed with the Securities and Exchange Commission on November 4, 2004 (File No. 333-120253)). |
| 3.4 | Certificate of Amendment of Certificate of Incorporation of VirtualScopics, Inc. dated August 20, 2004 (Incorporated herein by reference to Exhibit 3.1c of the VirtualScopics, Inc.’s Registration Statement on Form SB-2 filed with the Securities and Exchange Commission on November 4, 2004 (File No. 333-120253)). |
| 3.5 | Certificate of Amendment of Certificate of Incorporation of VirtualScopics, Inc. dated October 7, 2005 (Incorporated by reference to Exhibit 3.5 the VirtualScopics, Inc.’s Annual Report on Form 10-KSB filed with the Securities and Exchange Commission on March 30, 2006 (File No. 333-120253)). |
| 3.6 | Certificate of Amendment to Certificate of Incorporation of VirtualScopics, Inc. dated November 4, 2005 (Incorporated herein by reference to Exhibit 3.1 of the VirtualScopics, Inc. Report on Form 8-K filed with the Securities and Exchange Commission on November 10, 2005 (File No. 333-120253)). |
| 3.7 | Certificate of Designation of Rights and Preferences of the Series C-1 Preferred Stock and the Series C-2 Preferred Stock of VirtualScopics, Inc., dated April 3, 2012 (Incorporated herein by reference to Exhibit 3.1 of the VirtualScopics, Inc. Report on Form 8-K filed with the Securities and Exchange Commission on April 4, 2012 (File No. 000-52018)). |
| 3.8 | Amended and Restated Certificate of Designations, Powers, Preferences and Other Rights and Qualifications of Series A Convertible Preferred Stock of VirtualScopoics, Inc., dated June 14, 2012 (Incorporated herein by reference to Exhibit 3.1 of the VirtualScopics, Inc. Report on Form 8-K filed with the Securities and Exchange Commission on June 18, 2012 (File No. 000-52018)). |
| 3.9 | Amended and Restated Certificate of Designation of Rights and Preferences of the Series B Preferred Stock of VirtualScopoics, Inc., dated June 14, 2012 (Incorporated herein by reference to Exhibit 3.2 of the VirtualScopics, Inc. Report on Form 8-K filed with the Securities and Exchange Commission on June 18, 2012 (File No. 000-52018)). |
| 3.10 | Certificate of Amendment to the Certificate of Incorporation of VirtualScopics, Inc. filed with the Secretary of State of the State of Delaware on August 21, 2013 (Incorporated herein by reference to Exhibit 3.1 of the VirtualScopics, Inc. Report on Form 8-K filed with the Securities and Exchange Commission on August 21, 2013 (File No. 000-52018)). |
| 3.11 | Certificate of Amendment to the Certificate of Incorporation of VirtualScopics, Inc. dated June 18, 2014 (Incorporated herein by reference to Exhibit 3.1 of the VirtualScopics, Inc. Report on Form 8-K filed with the Securities and Exchange Commission on June 19, 2014 (File No. 000-52018)). |
| 29 |
| 3.12 | Amended and Restated Bylaws of VirtualScopics, Inc. dated March 21, 2014 (Incorporated herein by reference to Exhibit 3.11 of the VirtualScopics, Inc. Annual Report on Form 10-K filed with the Securities and Exchange Commission on March 31, 2014 (File No. 000-52018)). |
| 4.1 | Form of Series C Warrant (Incorporated herein by reference to Exhibit 4.1 of the VirtualScopics, Inc. Report on Form 8-K filed with the Securities and Exchange Commission on April 4, 2012 (File No. 000-52018)). |
| 10.1 | VirtualScopics, Inc. 2005 Long Term Incentive Plan (Incorporated herein by reference to Exhibit 10.1 of the VirtualScopics, Inc. Report on Form 8-K filed with the Securities and Exchange Commission on November 10, 2005 (File No. 333-120253)).* |
| 10.2 | Option Agreements with Robert Klimasewski dated November 5, 2005 (Incorporated herein by reference to Exhibit 10.18 to the VirtualScopics, Inc. Registration Statement on Form SB-2 filed with the Securities and Exchange Commission on May 2, 2006 (File No. 333-133747)).* |
| 10.3 | Form of April 28, 2006 Indemnification Agreement by and among VirtualScopics, Inc. and the directors and officers of the VirtualScopics, Inc. (Incorporated herein by reference to Exhibit 10.19 to the VirtualScopics, Inc. Registration Statement on Form SB-2 filed with the Securities and Exchange Commission on May 2, 2006 (File No. 333-133747)).* |
| 10.4 | VirtualScopics, Inc. Amended and Restated 2006 Long Term Incentive Plan (incorporated herein by reference to Appendix B to the Registrant’s Definitive Proxy Statement on Schedule 14A, filed with the Commission on April 10, 2009 (File No. 000-52018)) |
| 10.5 | Non-Employee Director Compensation Plan (Incorporated herein by reference to Exhibit 10.1 to the VirtualScopics, Inc. Report on Form 10-Q filed with the Securities and Exchange Commission on August 12, 2008 (File No. 000-52018)).* |
| 10.6 | Company Bonus Plan (Incorporated herein by reference to Exhibit 10.7 of the VirtualScopics, Inc. Annual Report on Form 10-K filed with the Securities and Exchange Commission on March 31, 2014 (File No. 000-52018)).* |
| 10.7 | Strategic Alliance Agreement between VirtualScopics, Inc. and PPD Development, LP, dated October 20, 2010 (Incorporated herein by reference to Exhibit 10.1 to the VirtualScopics, Inc. Report on Form 10-Q filed with the Securities and Exchange Commission on November 12, 2010 (File No. 000-52018)). |
| 10.8 | Amendment to the Strategic Alliance Agreement between VirtualScopics, Inc. and PPD Development, LP, dated January 24, 2012 (Incorporated herein by reference to Exhibit 10.1 to the VirtualScopics, Inc. Report on Form 8-K filed with the Securities and Exchange Commission on January 26, 2012 (File No. 000-52018)). |
| 10.9 | Series C Preferred Stock and Warrant Purchase Agreement between VirtualScopics, Inc. and Merck Global Health Innovation Fund, LLC dated April 3, 2012 (Incorporated herein by reference to Exhibit 10.1 of the VirtualScopics, Inc. Report on Form 8-K filed with the Securities and Exchange Commission on April 4, 2012 (File No. 000-52018)). |
| 10.10 | Investor Rights Agreement between VirtualScopics, Inc. and Merck Global Health Innovation Fund, LLC dated April 3, 2012 (Incorporated herein by reference to Exhibit 10.2 of the VirtualScopics, Inc. Report on Form 8-K filed with the Securities and Exchange Commission on April 4, 2012 (File No. 000-52018)). |
| 30 |
| 10.11 | Separation, Waiver and Release Agreement between the Company and L. Jeffrey Markin dated October 25, 2013 (Incorporated herein by reference to Exhibit 10.1 to the VirtualScopics, Inc. Report on Form 8-K filed with the Securities and Exchange Commission on October 25, 2013 (File No. 000-52018)).* |
| 10.12 | Services Agreement between the Company and Converse & Company and Eric Converse dated October 25, 2013 (Incorporated herein by reference to Exhibit 10.2 to the VirtualScopics, Inc. Report on Form 8-K filed with the Securities and Exchange Commission on October 25, 2013 (File No. 000-52018)).* |
| 10.13 | Indemnification Agreements between the Company and Eric Converse dated October 25, 2013 and Bruce Lev dated August 13, 2013 (Reference is made to the VirtualScopics, Inc. Form of Indemnification Agreement by and among VirtualScopics, Inc., and the directors and officers of the VirtualScopics, Inc. filed as Exhibit 10.19 to the VirtualScopics, Inc. Registration Statement on Form SB-2 filed with the Securities and Exchange Commission on May 2, 2006 (File No. 333- 133747). |
| 10.14 | Employment Agreement, dated July 23, 2014, between VirtualScopics, Inc. and Eric T. Converse (Incorporated herein by reference to Exhibit 10.1 to the VirtualScopics, Inc. Current Report on Form 8-K filed with the Securities and Exchange Commission on July 25, 2014 (File No. 000-52018)). |
| 10.15 | Confidentiality and Non-Competition Agreement, dated July 23, 2014, between VirtualScopics, Inc. and Eric T. Converse (Incorporated herein by reference to Exhibit 10.2 to the VirtualScopics, Inc. Current Report on Form 8-K filed with the Securities and Exchange Commission on July 25, 2014 (File No. 000-52018)). |
| 10.16 | Employment Agreement, dated August 19, 2014, between VirtualScopics, Inc. and James A. Groff (Incorporated herein by reference to Exhibit 10.1 to the VirtualScopics, Inc. Current Report on Form 8-K filed with the Securities and Exchange Commission on August 22, 2014 (File No. 000-52018)). |
| 10.17 | Confidentiality and Non-Competition Agreement, dated August 19, 2014, between VirtualScopics, Inc. and James A. Groff (Incorporated herein by reference to Exhibit 10.2 to the VirtualScopics, Inc. Current Report on Form 8-K filed with the Securities and Exchange Commission on August 22, 2014 (File No. 000-52018)). |
| 10.18 | Alliance Framework Agreement, dated June 26, 2014, between VirtualScopics, Inc. and IXICO Technologies Limited (Incorporated herein by reference to Exhibit 10.3 to the VirtualScopics, Inc. Quarterly Report on Form 10-Q filed with the Securities and Exchange Commission on August 14, 2014 (File No. 000-52018)). |
| 10.19 | Master Subcontract Agreement, dated June 26, 2014, between VirtualScopics, Inc. and IXICO Technologies Limited (Incorporated herein by reference to Exhibit 10.4 to the VirtualScopics, Inc. Quarterly Report on Form 10-Q filed with the Securities and Exchange Commission on August 14, 2014 (File No. 000-52018)). |
| 10.20 | Indemnification Agreements between the Company and Andrew Levitch dated March 2, 2015 and Michael Woehler dated March 2, 2015 (Reference is made to the VirtualScopics, Inc. Form of Indemnification Agreement by and among VirtualScopics, Inc., and the directors and officers of the VirtualScopics, Inc. filed as Exhibit 10.19 to the VirtualScopics, Inc. Registration Statement on Form SB-2 filed with the Securities and Exchange Commission on May 2, 2006 (File No. 333- 133747). |
| 31 |
| 21 | Subsidiaries of VirtualScopics, Inc. |
| 23.1 | Consent of Marcum LLP |
| 24 | Power of Attorney (included on the signature page to this report) |
| 31.1 | Certification of Chief Executive Officer as required by Rule 13a-14 Or 15d-14 of the Securities Exchange Act of 1934, as adopted pursuant to Section 302 Of The Sarbanes-Oxley Act of 2002 |
| 31.2 | Certification of Chief Financial Officer as required by Rule 13a-14 Or 15d-14 of the Securities Exchange Act of 1934, as adopted pursuant to Section 302 Of The Sarbanes-Oxley Act of 2002 |
| 32.1 | Certification pursuant to 18 U.S.C. Section 1350 by the Chief Executive Officer, as adopted pursuant to Section 906 of the Sarbanes-Oxley Act of 2002 |
| 32.2 | Certification pursuant to 18 U.S.C. Section 1350 by the Chief Financial Officer, as adopted pursuant to Section 906 of the Sarbanes-Oxley Act of 2002 |
| 101.CAL | XBRL Taxonomy Extension Calculation Linkbase. |
| 101.DEF | XBRL Taxonomy Extension Definition Linkbase. |
| 101.INS | XBRL Instance Document. |
| 101.LAB | XBRL Taxonomy Extension Label Linkbase. |
| 101.PRE | XBRL Taxonomy Extension Presentation Linkbase. |
| 101.SCH | XBRL Taxonomy Extension Schema Linkbase. |
* Management contract or compensatory plan or arrangement.
| 32 |
VirtualScopics, Inc. and Subsidiary
Index to Consolidated Financial Statements
| F-1 |
REPORT OF INDEPENDENT REGISTERED PUBLIC ACCOUNTING FIRM
To the Audit Committee of the
Board of Directors and Stockholders of
VirtualScopics, Inc.
We have audited the accompanying consolidated balance sheets of VirtualScopics, Inc. and Subsidiary (the “Company”) as of December 31, 2014 and 2013 and the related consolidated statements of operations, changes in stockholders’ equity and cash flows for the years then ended. These financial statements are the responsibility of the Company’s management. Our responsibility is to express an opinion on these financial statements based on our audits.
We conducted our audits in accordance with the standards of the Public Company Accounting Oversight Board (United States). Those standards require that we plan and perform the audits to obtain reasonable assurance about whether the financial statements are free of material misstatement. The Company is not required to have, nor were we engaged to perform, an audit of its internal control over financial reporting. Our audits included consideration of internal control over financial reporting as a basis for designing audit procedures that are appropriate in the circumstances, but not for the purpose of expressing an opinion on the effectiveness of the Company’s internal control over financial reporting. Accordingly, we express no such opinion. An audit also includes examining, on a test basis, evidence supporting the amounts and disclosures in the consolidated financial statements, assessing the accounting principles used and significant estimates made by management, as well as evaluating the overall financial statement presentation. We believe that our audits provide a reasonable basis for our opinion.
In our opinion, the financial statements referred to above present fairly, in all material respects, the consolidated financial position of VirtualScopics, Inc. and Subsidiary as of December 31, 2014 and 2013, and the consolidated results of its operations and its cash flows for the years then ended in conformity with accounting principles generally accepted in the United States of America.
/s/ Marcum LLP
Marcum LLP
Melville, NY
March 31, 2015
| F-2 |
VirtualScopics, Inc. and Subsidiary
Consolidated Balance Sheets
| December 31, | December 31, | |||||||
| 2014 | 2013 | |||||||
| Assets | ||||||||
| Current assets | ||||||||
| Cash | $ | 4,046,599 | $ | 7,330,630 | ||||
| Accounts receivable, net of allowance for doubtful accounts of $0 and $15,000 at December 31, 2014 and 2013, respectively | 1,814,143 | 1,725,070 | ||||||
| Prepaid expenses and other current assets | 410,188 | 397,699 | ||||||
| Total current assets | 6,270,930 | 9,453,399 | ||||||
| Patents, net | 1,211,770 | 1,334,420 | ||||||
| Property and equipment, net | 330,873 | 221,700 | ||||||
| Other assets | 10,661 | - | ||||||
| Total assets | $ | 7,824,234 | $ | 11,009,519 | ||||
| Liabilities and Stockholders’ Equity | ||||||||
| Current liabilities | ||||||||
| Accounts payable and accrued expenses | $ | 1,289,099 | $ | 846,071 | ||||
| Accrued payroll | 681,964 | 837,611 | ||||||
| Unearned revenue | 670,332 | 745,028 | ||||||
| Dividends payable | 335,333 | 293,333 | ||||||
| Total current liabilities | 2,976,728 | 2,722,043 | ||||||
| Commitments and Contingencies | ||||||||
| Stockholders' Equity | ||||||||
| Convertible preferred stock, $0.001 par value; 1,000,000 and 15,000,000 shares authorized at December 31, 2014 and 2013, respectively; | ||||||||
| Series C-1 3,000 shares authorized; issued and outstanding, 3,000 shares at December 31, 2014 and 2013; liquidation preference $1,000 per share | 3 | 3 | ||||||
| Series B 6,000 shares authorized; issued and outstanding, 600 shares at December 31, 2014 and 2013; liquidation preference $1,000 per share | 1 | 1 | ||||||
| Series A 8,400 shares authorized; issued and outstanding, 2,165 and 2,190 shares at December 31, 2014 and 2013, respectively; liquidation preference $1,000 per share | 2 | 2 | ||||||
| Series C-2 3,000 shares authorized; none issued and outstanding, at December 31, 2014 and 2013; liquidation preference $1,000 per share | - | - | ||||||
| Common stock, $0.001 par value; 20,000,000 and 85,000,000 shares authorized at December 31, 2014 and 2013, respectively; issued 2,994,928 and 2,992,853 shares at December 31, 2014 and December 31, 2013, respectively; outstanding, 2,994,928 shares at December 31, 2014 and 2,991,869 shares at December 31, 2013, respectively | 2,995 | 2,992 | ||||||
| Additional paid-in capital | 21,975,069 | 21,992,619 | ||||||
| Accumulated deficit | (17,130,564 | ) | (13,708,141 | ) | ||||
| Total stockholders' equity | 4,847,506 | 8,287,476 | ||||||
| Total liabilities and stockholders' equity | $ | 7,824,234 | $ | 11,009,519 | ||||
The accompanying notes are an integral part of these consolidated financial statements
| F-3 |
VirtualScopics, Inc. and Subsidiary
Consolidated Statements of Operations
| For the Years Ended December 31, | ||||||||
| 2014 | 2013 | |||||||
| Revenues | $ | 9,832,300 | $ | 10,466,348 | ||||
| Reimbursement revenues | 620,184 | 707,703 | ||||||
| Total revenues | 10,452,484 | 11,174,051 | ||||||
| Cost of services | 6,470,430 | 6,047,444 | ||||||
| Cost of reimbursement revenues | 620,184 | 707,703 | ||||||
| Total cost of services | 7,090,614 | 6,755,147 | ||||||
| Gross profit | 3,361,870 | 4,418,904 | ||||||
| Operating expenses | ||||||||
| Research and development | 1,245,264 | 1,510,721 | ||||||
| Sales and marketing | 1,876,041 | 1,556,257 | ||||||
| General and administrative | 3,349,879 | 3,749,130 | ||||||
| Depreciation and amortization | 314,249 | 366,527 | ||||||
| Total operating expenses | 6,785,433 | 7,182,635 | ||||||
| Operating loss | (3,423,563 | ) | (2,763,731 | ) | ||||
| Other income (expense) | ||||||||
| Interest income | 4,237 | 22,287 | ||||||
| Other expense | (3,097 | ) | (3,097 | ) | ||||
| Total other income | 1,140 | 19,190 | ||||||
| Net Loss | (3,422,423 | ) | (2,744,541 | ) | ||||
| Preferred stock dividends | 168,000 | 168,000 | ||||||
| Net loss attributable to common stockholders | $ | (3,590,423 | ) | $ | (2,912,541 | ) | ||
| Basic and diluted loss per common share | $ | (1.20 | ) | $ | (0.98 | ) | ||
| Weighted average number of common shares outstanding | ||||||||
| Basic and diluted | 2,993,601 | 2,981,732 | ||||||
The accompanying notes are an integral part of these consolidated financial statements
| F-4 |
VirtualScopics, Inc. and Subsidiary
Consolidated Statements of Changes in Stockholders’ Equity
For the Years Ended December 31, 2014 and 2013
| Series A | Series B | Series C-1 | ||||||||||||||||||||||||||||||||||||||||||
| Preferred Stock | Preferred Stock | Preferred Stock | Common Stock | Additional | Accumulated | |||||||||||||||||||||||||||||||||||||||
| Shares | Amount | Shares | Amount | Shares | Amount | Shares | Amount | Paid-In Capital | Deficit | Total | ||||||||||||||||||||||||||||||||||
| Balances at December 31, 2012 | 2,190 | $ | 2 | 600 | $ | 1 | 3,000 | $ | 3 | 2,979,877 | $ | 2,980 | $ | 21,807,904 | $ | (10,963,600 | ) | $ | 10,847,290 | |||||||||||||||||||||||||
| Amortization of stock option expense | 257,263 | 257,263 | ||||||||||||||||||||||||||||||||||||||||||
| Amortization of restricted stock units | 6,723 | 6,723 | ||||||||||||||||||||||||||||||||||||||||||
| Restricted stock units issuance | 11,992 | 12 | 88,729 | 88,741 | ||||||||||||||||||||||||||||||||||||||||
| Accrual of Series B preferred stock dividends based on 8% annual rate | (48,000 | ) | (48,000 | ) | ||||||||||||||||||||||||||||||||||||||||
| Accrual of Series C-1 preferred stock dividends based on 4% annual rate | (120,000 | ) | (120,000 | ) | ||||||||||||||||||||||||||||||||||||||||
| Net loss | (2,744,541 | ) | (2,744,541 | ) | ||||||||||||||||||||||||||||||||||||||||
| Balances at December 31, 2013 | 2,190 | $ | 2 | 600 | $ | 1 | 3,000 | $ | 3 | 2,991,869 | $ | 2,992 | $ | 21,992,619 | $ | (13,708,141 | ) | $ | 8,287,476 | |||||||||||||||||||||||||
| Amortization of stock option expense | 149,894 | 149,894 | ||||||||||||||||||||||||||||||||||||||||||
| Amortization of restricted stock units | 559 | 559 | ||||||||||||||||||||||||||||||||||||||||||
| Conversion of Series A Preferred Stock to Common Stock | (25 | ) | 2,075 | 2 | (2 | ) | ||||||||||||||||||||||||||||||||||||||
| Restricted stock units issuance | 984 | 1 | (1 | ) | - | |||||||||||||||||||||||||||||||||||||||
| Accrual of Series B preferred stock dividends based on 8% annual rate | (48,000 | ) | (48,000 | ) | ||||||||||||||||||||||||||||||||||||||||
| Accrual of Series C-1 preferred stock dividends based on 4% annual rate | (120,000 | ) | (120,000 | ) | ||||||||||||||||||||||||||||||||||||||||
| Net loss | (3,422,423 | ) | (3,422,423 | ) | ||||||||||||||||||||||||||||||||||||||||
| Balances at December 31, 2014 | 2,165 | $ | 2 | 600 | $ | 1 | 3,000 | $ | 3 | 2,994,928 | $ | 2,995 | $ | 21,975,069 | $ | (17,130,564 | ) | $ | 4,847,506 | |||||||||||||||||||||||||
The accompanying notes are an integral part of these consolidated financial statements
| F-5 |
VirtualScopics, Inc. and Subsidiary
Consolidated Statements of Cash Flows
| For the Years Ended December 31, | ||||||||
| 2014 | 2013 | |||||||
| Cash flows from operating activities | ||||||||
| Net loss | $ | (3,422,423 | ) | $ | (2,744,541 | ) | ||
| Adjustments to reconcile net loss to net cash used in operating activities | ||||||||
| Depreciation and amortization | 314,249 | 366,527 | ||||||
| Loss on the disposal of long lived assets | - | 16,761 | ||||||
| Gain on the disposal of property and equipment | - | (2,089 | ) | |||||
| Stock-based compensation | 150,453 | 352,727 | ||||||
| Changes in operating assets and liabilities | ||||||||
| Accounts receivable | (89,073 | ) | 37,437 | |||||
| Prepaid expenses and other assets | (23,150 | ) | 45,427 | |||||
| Unearned revenue | (74,696 | ) | 472,519 | |||||
| Accounts payable and accrued expenses | 443,028 | (26,581 | ) | |||||
| Accrued payroll | (155,647 | ) | 355,950 | |||||
| Total adjustments | 565,164 | 1,618,678 | ||||||
| Net cash used in operating activities | (2,857,259 | ) | (1,125,863 | ) | ||||
| Cash flows from investing activities | ||||||||
| Purchases of property and equipment | (285,542 | ) | (78,207 | ) | ||||
| Proceeds from the sale of equipment | - | 28,441 | ||||||
| Patent applications and maintenance | (15,230 | ) | (17,548 | ) | ||||
| Net cash used in investing activities | (300,772 | ) | (67,314 | ) | ||||
| Cash flows from financing activities | ||||||||
| Cash dividends on series B preferred stock | (126,000 | ) | - | |||||
| Net cash used in financing activities | (126,000 | ) | - | |||||
| Net decrease in cash | (3,284,031 | ) | (1,193,177 | ) | ||||
| Cash | ||||||||
| Beginning of year | 7,330,630 | 8,523,807 | ||||||
| End of year | $ | 4,046,599 | $ | 7,330,630 | ||||
| Supplemental disclosure of cash flow information | ||||||||
| Cash paid during the year for: | ||||||||
| Non-cash financing activities: | ||||||||
| Accrual of dividends on Series B and C-1 preferred stock | $ | 42,000 | $ | 168,000 | ||||
| Conversion of Series A preferred stock into common stock | $ | 2 | $ | - | ||||
The accompanying notes are an integral part of these consolidated financial statements
| F-6 |
VirtualScopics, Inc. and Subsidiary
Notes to Consolidated Financial Statements
NOTE 1 - Organization and Basis of Presentation
Nature of Business
The Company’s headquarters are located in Rochester, New York. The Company has created a suite of image analysis software tools and applications which are used in detecting and analyzing specific structures in medical images. The Company’s developed software provides measurement and visualization capabilities designed to improve clinical research and development.
Basis of Presentation
A Certificate of Amendment to effect a reverse stock split was approved by the Company's stockholders at its Annual Meeting of Stockholders held on August 13, 2013. The Company's stockholders granted the Board authority to effectuate a reverse stock split at a ratio of between 1-for-2 to 1-for-10. The Company’s Board of Directors subsequently approved a 1-for-10 reverse stock split of the Company’s outstanding common stock that was effected on August 21, 2013. Corresponding adjustments were made to the number of shares of common stock underlying the Company’s outstanding options, warrants, and preferred stock exercisable for or convertible into common stock and the related long-term incentive plans for such options. All share and related option information presented in these financial statements and accompanying footnotes have been retroactively adjusted to reflect the reduced number of shares resulting from this action.
A Certificate of Amendment to decrease the Company’s number of authorized common stock from 85,000,000 shares to 20,000,000 shares and to decrease the number of authorized and undesignated preferred stock from 15,000,000 shares to 1,000,000 shares was approved by the Company's stockholders at its Annual Meeting of Stockholders on June 17, 2014. The authorized share information presented in these consolidated financial statements and accompanying footnotes reflects such change.
NOTE 2 – Liquidity and Financial Condition
The Company had a net loss attributable to common stockholders of $3,590,423 for the year ended December 31, 2014. At December 31, 2014, the Company’s accumulated deficit amounted to $17,130,564 and the Company had working capital of $3,294,202. The Company’s future plans and growth are dependent on its ability to increase revenues and continue its business development efforts surrounding its contract award backlog. If the Company continues to incur losses and revenues do not generate from the backlog as expected, the Company may need to raise additional capital to expand its business and continue as a going concern. The Company currently anticipates that its cash and cash equivalents will be sufficient to meet its working capital requirements to continue its sales and marketing and research and development efforts for at least 12 months. If in the future our plans or assumptions change or prove to be inaccurate, the Company may need to raise additional funds through public or private debt or equity offerings financings, corporate collaborations or other means. The Company may also be required to reduce operating expenditures or investments to its infrastructure. The Company has not secured any commitment for new financing at this time, nor can it provide any assurance that other new financings will be available on commercially acceptable terms, if needed. If the Company is unable to secure additional capital, it may be required to curtail its research and development activities and take additional measures to reduce costs in order to conserve its cash.
NOTE 3 - Summary of Significant Accounting Policies
Principles of Consolidation
The accompanying consolidated financial statements include the accounts of VirtualScopics, Inc. and its wholly-owned subsidiary, VirtualScopics, LLC. All significant intercompany balances and transactions have been eliminated in consolidation.
| F-7 |
VirtualScopics, Inc. and Subsidiary
Notes to Consolidated Financial Statements
Use of Estimates
The preparation of financial statements in conformity with accounting principles generally accepted in the United States of America (“GAAP”) requires management to make estimates and assumptions that affect the reported amounts of assets and liabilities and disclosure of contingent assets and liabilities at the date of the financial statements and the reported amounts of revenues and expenses during the year. Actual results could differ from those estimates. Estimates included in these consolidated financial statements relate to assessing the collectability of accounts receivable, the valuation of securities underlying share-based compensation, realization of deferred tax assets, tax contingencies and any related valuation allowance, and the useful lives and potential impairment of the Company’s property and equipment and intangible assets. Estimates and assumptions are reviewed periodically and the effects of revisions are reflected in the period that they are determined to be necessary.
Cash and Cash Equivalents
The Company considers all highly liquid investments when purchased with a maturity of three months or less to be cash equivalents. At December 31, 2014 and 2013, the Company had no cash equivalents.
Concentration of Credit Risk
Financial instruments that potentially subject the Company to significant concentrations of credit risk consist of cash. At times, our cash may be uninsured or in deposit accounts that exceed the Federal Deposit Insurance Corporation (“FDIC”) insurance limits.
Accounts Receivable
Accounts receivable are stated at estimated net realizable value. Accounts receivable are comprised of balances due from customers net of estimated allowances for uncollectible accounts, if any. In determining collectability, historical trends are evaluated and specific customer issues are reviewed to arrive at appropriate allowances, if any.
Patents
Costs incurred to acquire and file for patents, including legal costs, are capitalized as long-lived assets and amortized on a straight-line basis over the lower of the estimated useful life or legal life of the patent, which is 20 years.
Property and Equipment
Property and equipment are carried at cost less accumulated depreciation. When retired or otherwise disposed of, the related cost and accumulated depreciation are removed from the respective accounts and any resulting gain or loss is recognized and included in the consolidated statement of operations.
Expenditures for maintenance and repairs, which do not generally extend the useful life of the assets, are charged to expense as incurred. Gains or losses on disposal of property and equipment are reflected in other expense in the consolidated statement of operations in the period of disposal.
Depreciation is computed using the straight-line method over the following useful lives:
| Years | |
| Office/computer equipment | 3-5 |
| Furniture and fixtures | 5-7 |
| Software | 3 |
Leasehold improvements, which are included in property and equipment, are recorded at cost less accumulated depreciation. Depreciation on leasehold improvements is computed using the straight-line method over the shorter of their estimated useful lives or the lease term, whichever is shorter.
| F-8 |
VirtualScopics, Inc. and Subsidiary
Notes to Consolidated Financial Statements
Impairment of Long-Lived Assets
The Company reviews long-lived assets, including intangible assets other than goodwill, for impairment whenever events or changes in circumstances indicate that the carrying value of the asset may not be recoverable. In connection with this review, the Company also re-evaluates the periods of depreciation and amortization for these assets. The Company assesses recoverability by determining whether the net book value of the related asset will be recovered through the projected undiscounted future cash flows of the asset. If the Company determines that the carrying value of the asset may not be recoverable, it measures any impairment based on the projected future discounted cash flows as compared to the asset’s carrying value. Through December 31, 2014, the Company has not recorded any impairment charges on its long-lived assets.
Revenue Recognition
The Company recognizes revenue when it is realized or realizable and earned. The Company considers revenue realized or realizable and earned when an agreement exists, services are performed, prices are fixed or determinable, and collectability is reasonably assured. Revenues are reduced for estimated discounts and other allowances, if any.
The Company provides advanced medical image analysis on a per analysis basis, and recognizes revenue when the image analysis is completed. Revenue related to project, data, and site management services is recognized as the services are rendered and in accordance with the terms of the contract. Consulting revenue is recognized once the services are rendered and typically charged as an hourly rate.
Reimbursements received and related costs incurred for out-of-pocket expenses are separately reported as reimbursement revenues and cost of reimbursement revenues, respectively, in the consolidated financial statements.
Income Taxes
Income taxes are accounted for under the asset and liability method. Deferred tax assets and liabilities are recognized for the future tax consequences attributable to differences between the financial statement carrying amounts of existing assets and liabilities and their respective tax bases, and operating loss and tax credit carryforwards. Deferred tax assets and liabilities are measured using enacted tax rates expected to apply to taxable income in the years in which those temporary differences are expected to be recovered or settled. The effect on deferred tax assets and liabilities of a change in tax rates is recognized in operations in the period that includes the enactment date. A valuation allowance is provided when it is more likely than not that some portion or all of a deferred tax asset will not be realized. The ultimate realization of deferred tax assets is dependent upon the generation of future taxable income and the reversal of deferred tax liabilities during the period in which related temporary differences become deductible. The benefit of tax positions taken or expected to be taken in the Company’s income tax returns are recognized in the consolidated financial statements if such positions are more likely than not of being sustained.
Research and Development
Research and development expense relates to the development of new applications and processes, including improvements to existing applications. These costs are expensed as incurred.
Preferred Stock
The Company applies the accounting standards for distinguishing liabilities from equity when determining the classification and measurement of its preferred stock. Preferred shares subject to mandatory redemption are classified as liability instruments and are measured at fair value. Conditionally redeemable preferred shares (including preferred shares that feature redemption rights that are either within the control of the holder or subject to redemption upon the occurrence of uncertain events not solely within the Company’s control) are classified as temporary equity. At all other times, preferred shares are classified as stockholders’ equity.
| F-9 |
VirtualScopics, Inc. and Subsidiary
Notes to Consolidated Financial Statements
Convertible Instruments
The Company applies the accounting standards for derivatives and hedging and for distinguishing liabilities from equity when accounting for hybrid contracts that feature conversion options. The accounting standards require companies to bifurcate conversion options from their host instruments and account for them as free standing derivative financial instruments according to certain criteria. The criteria includes circumstances in which (i) the economic characteristics and risks of the embedded derivative instrument are not clearly and closely related to the economic characteristics and risks of the host contract, (ii) the hybrid instrument that embodies both the embedded derivative instrument and the host contract is not re-measured at fair value under otherwise applicable generally accepted accounting principles with changes in fair value reported in earnings as they occur and (iii) a separate instrument with the same terms as the embedded derivative instrument would be considered a derivative instrument. The derivative is subsequently marked to market at each reporting date based on current fair value, with the changes in fair value reported in results of operations.
Conversion options that contain variable settlement features such as provisions to adjust the conversion price upon subsequent issuances of equity or equity linked securities at exercise prices more favorable than that featured in the hybrid contract generally result in their bifurcation from the host instrument.
The Company accounts for convertible debt instruments when the Company has determined that the embedded conversion options should not be bifurcated from their host instruments in accordance with Accounting Standards Codification (“ASC”) 470-20 “Debt with Conversion and Other Options”. The Company records, when necessary, discounts to convertible notes for the intrinsic value of conversion options embedded in debt instruments based upon the differences between the fair value of the underlying common stock at the commitment date of the note transaction and the effective conversion price embedded in the note. Debt discounts under these arrangements are amortized over the term of the related debt. The Company also records, when necessary, deemed dividends for the intrinsic value of the conversion options embedded in preferred stock based upon the difference between the fair value of the underlying common stock at the commitment date of the transaction and the effective conversion price embedded in the preferred stock.
Common Stock Purchase Warrants and Other Derivative Financial Instruments
The Company classifies as equity any contracts that (i) require physical settlement or net-share settlement or (ii) provides a choice of net-cash settlement or settlement in the Company’s own shares (physical settlement or net-share settlement) providing that such contracts are indexed to the Company's own stock as defined in ASC 815-40 "Contracts in Entity's Own Equity" (“ASC 815-40”). The Company classifies as assets or liabilities any contracts that (i) require net-cash settlement (including a requirement to net cash settle the contract if an event occurs and if that event is outside the Company’s control) or (ii) gives the counterparty a choice of net-cash settlement or settlement in shares (physical settlement or net-share settlement). The Company assesses classification of common stock purchase warrants and other free standing derivatives at each reporting date to determine whether a change in classification between assets and liabilities or equity is required.
Recently Issued and Adopted Accounting Pronouncements
The Financial Accounting Standards Board (“FASB”) has issued Accounting Standards Update (“ASU”) No. 2014-12, Compensation – Stock Compensation (Topic 718): Accounting for Share-Based Payments When the Terms of an Award Provide That a Performance Target Could Be Achieved after the Requisite Service Period. This ASU requires that a performance target that affects vesting, and that could be achieved after the requisite service period, be treated as a performance condition. As such, the performance target should not be reflected in estimating the grant date fair value of the award. This update further clarifies that compensation cost should be recognized in the period in which it becomes probable that the performance target will be achieved and should represent the compensation cost attributable to the period(s) for which the requisite service has already been rendered. The amendments in this ASU are effective for annual periods and interim periods within those annual periods beginning after December 15, 2015. Earlier adoption is permitted. The adoption of this standard is not expected to have a material impact on the Company’s consolidated financial position and results of operations.
| F-10 |
VirtualScopics, Inc. and Subsidiary
Notes to Consolidated Financial Statements
The FASB has issued ASU No. 2014-09, Revenue from Contracts with Customers. This ASU supersedes the revenue recognition requirements in Accounting Standards Codification 605 - Revenue Recognition and most industry-specific guidance throughout the Codification. The standard requires that an entity recognizes revenue to depict the transfer of promised goods or services to customers in an amount that reflects the consideration to which the company expects to be entitled in exchange for those goods or services. This ASU is effective on January 1, 2017 and should be applied retrospectively to each prior reporting period presented or retrospectively with the cumulative effect of initially applying the ASU recognized at the date of initial application. The adoption of this standard is not expected to have a material impact on the Company’s consolidated financial position and results of operations.
The FASB has issued ASU No. 2014-15, Presentation of Financial Statements-Going Concern (Subtopic 205-40): Disclosure of Uncertainties about an Entity’s Ability to Continue as a Going Concern. The guidance, which is effective for annual reporting periods ending after December 15, 2016, extends the responsibility for performing the going-concern assessment to management and contains guidance on how to perform a going-concern assessment and when going-concern disclosures would be required under U.S. GAAP. The adoption of this standard is not expected to have a material impact on the Company’s consolidated financial position and results of operations.
Stock-Based Compensation
The Company accounts for share-based awards exchanged for employee services at the estimated grant date fair value of the award. The Company estimates the fair value of employee stock awards using the Black-Scholes option pricing model. The Company amortizes the fair value of employee stock options on a straight-line basis over the requisite service period of the awards. Compensation expense includes the impact of an estimate for forfeitures for all stock options.
The Company accounts for equity instruments issued to non-employees at their fair value on the measurement date. The measurement of stock-based compensation is subject to periodic adjustment as the underlying equity instrument vests or becomes non-forfeitable. Non-employee stock-based compensation charges are amortized over the vesting period or as earned.
Loss Per Share
Basic loss per share is computed by dividing the net loss available to common stockholders by the weighted average number of common shares outstanding during the period. Diluted loss per share is computed using the weighted average number of common shares and, if dilutive, potential common shares outstanding during the period. Potential common shares consist of the incremental common shares issuable upon the exercise of stock options (using the treasury stock method) and the conversion of the Company’s convertible preferred stock and warrants (using the if-converted method). Diluted loss per share excludes the shares issuable upon the conversion of preferred stock, the exercise of stock options and warrants from the calculation of net loss per share as their effect would be antidilutive.
Securities that could potentially dilute loss per share in the future that were not included in the computation of diluted loss per share consist of the following numbers of shares into which preferred stock could have been converted and shares for which outstanding options and warrants could have been exercised during the years ending December 31, 2014 and 2013:
| 2014 | 2013 | |||||||
| Convertible preferred stock | 478,701 | 480,777 | ||||||
| Warrants to purchase common stock | 136,132 | 233,753 | ||||||
| Non-vested restricted stock awards | - | 984 | ||||||
| Options to purchase common stock | 404,612 | 425,995 | ||||||
| Total | 1,019,445 | 1,141,509 | ||||||
| F-11 |
VirtualScopics, Inc. and Subsidiary
Notes to Consolidated Financial Statements
NOTE 4 - Property and Equipment
Property and equipment consisted of the following as of December 31:
| 2014 | 2013 | |||||||
| Office/computer equipment | $ | 967,791 | $ | 876,393 | ||||
| Furniture and fixtures | 293,318 | 267,939 | ||||||
| Software | 629,342 | 468,226 | ||||||
| Leasehold improvements | 122,318 | 114,669 | ||||||
| 2,012,769 | 1,727,227 | |||||||
| Less: accumulated depreciation | (1,681,896 | ) | (1,505,527 | ) | ||||
| $ | 330,873 | $ | 221,700 | |||||
Depreciation expense amounted to $176,369 and $229,724 for the years ended December 31, 2014 and 2013, respectively. The Company disposed of and wrote-off property and equipment with an original cost of $126,277 and accumulated depreciation of $99,925 during the year ended December 31, 2013, which resulted in a net gain of $2,089 and cash proceeds of $28,441.
NOTE 5 - Patents
On May 24, 2002, the Company purchased from the University of Rochester, a related party, certain patents developed by the Company’s founders and previously licensed by the Company under an Exclusive Right Agreement. The Company paid $1,500,000 and issued warrants to acquire 357,075 shares of common stock to the University of Rochester for the full right and title to the patents. The warrants were recorded at fair value which totaled $157,000. Since May 24, 2002, the Company has invested an additional $1,071,863 in connection with improving and expanding its patent portfolio. These costs consist predominately of legal and filing fees and historically been capitalized as long-lived assets.
For the years ended December 31, 2014 and 2013, the Company capitalized $15,230 and $17,548, respectively, of legal expenses and filing fees associated with the maintenance of its patents. During 2013, the Company wrote off $16,761 in legal expenses associated with pending patent applications. In addition, during the year ended December 31, 2014, the Company reviewed the remaining estimated useful lives of its patent portfolio and determined that the remaining useful lives of four of its patents held should be reduced due to the Company’s future planned use of this intellectual property. At December 31, 2014 and 2013, these four patents had a weighted average remaining useful life of 4.12 and 9.9 years, respectively, when considering the Company’s change in estimate.
Accumulated amortization on the patents amounted to $1,517,093 and $1,379,213 as of December 31, 2014 and 2013, respectively. Amortization expense for the years ended December 31, 2014 and 2013 amounted to $137,880 and $136,803, respectively. The weighted-average remaining amortization period of the Company’s complete patent portfolio is approximately 7.5 years as of December 31, 2014. The estimated future amortization of the patents is as follows:
| For the Years Ending | ||||
| December 31, | Amount | |||
| 2015 | $ | 201,524 | ||
| 2016 | 171,242 | |||
| 2017 | 171,242 | |||
| 2018 | 158,532 | |||
| 2019 | 131,485 | |||
| Thereafter | 377,745 | |||
| Total | $ | 1,211,770 | ||
| F-12 |
VirtualScopics, Inc. and Subsidiary
Notes to Consolidated Financial Statements
NOTE 6 – Stockholders’ Equity
Common Stock
The Company has authorized 20,000,000 shares of common stock, par value $0.001. Each share of common stock entitles the holder to one vote.
Preferred Stock
The Company has authorized 1,000,000 shares of preferred stock, par value $0.001 per share, of which 8,400 are designated as Series A Convertible Preferred Stock (“Series A”), 6,000 are designated as Series B Convertible Preferred Stock (“Series B”), 3,000 are designated as Series C-1 Convertible Preferred Stock (“Series C-1”), and 3,000 are designated as Series C-2 Convertible Preferred Stock (“Series C-2”) as specified in the Certificate of Designation (the “Certificate”).
Each share of Series A is convertible into 83.036 shares of the Company’s common stock and is senior in liquidation preference in comparison to shares of the Company’s common stock. During the year ended December 31, 2014, 25 shares of Series A Preferred Stock were converted to 2,075 shares of common stock. There were no conversions of the Company’s Series A Preferred Stock during the year ended December 31, 2013.
Each share of Series B is convertible into 83.036 shares of the Company’s common stock and has a liquidation preference that is pari passu with the Company’s Series A and senior to the Company’s common stock. Cumulative dividends on the Series B accrue on the stated value of $1,000 per share at an annual rate of 8%, payable monthly in cash and/or shares of the Company’s common stock at the option of the Company. During the years ended December 31, 2014 and 2013, the Company accrued $48,000 of Series B dividends per year and paid cash dividends of $36,000 and $0, respectively. As of December 31, 2014 and 2013, $96,000 and $84,000 of dividends were accrued to the holders of Series B were included in accrued dividends on the consolidated balance sheet.
Each share of Series C-1 is convertible into shares of the Company’s common stock at a conversion rate, which is determined by dividing (i) the stated value per share of $1,000, plus, if consented to by the Company, all accrued and unpaid dividends, by (ii) the conversion price of $12.043. The conversion price of the Series C Preferred Stock and exercise price of the Series C Warrants is subject to customary anti-dilution provisions. The Series C-1 Preferred Stock has a 4% cumulative dividend and is senior in liquidation preference to the existing preferred stock and common stock. The Series C-1 holders elected to receive cash dividends during 2014 and to accrue the dividends during 2013 making these dividends payable on the earlier of the liquidation of the corporation according to the Series C Certificate of Designation or upon the conversion of the Series C-1 into common stock. Subject to certain exceptions, the Series B holders are only entitled to be paid dividends, if full dividends are first paid or concurrently paid to the holders of the Series C-1 Preferred Stock. During the years ended December 31, 2014 and 2013, the Company accrued $120,000 of Series C-1 dividends per year and paid cash dividends of $90,000 and $0, respectively. As of December 31, 2014 and 2013, $239,333 and $209,333 of dividends were accrued to the holders of Series B were included in accrued dividends on the consolidated balance sheet.
Warrants
A summary of the warrant activity for the years ended December 31, 2014 is as follows:
| F-13 |
VirtualScopics, Inc. and Subsidiary
Notes to Consolidated Financial Statements
| Number of Warrants | Weighted Average Exercise Price | Weighted- Average Remaining Contractual Term | Aggregate Intrinsic Value | |||||||||||||
| Warrants outstanding at January 1, 2014 | 233,753 | 12.04 | 3.34 | $ | - | |||||||||||
| Expired | (97,621 | ) | (12.04 | ) | ||||||||||||
| Warrants outstanding at December 31, 2014 | 136,132 | 12.04 | 4.25 | $ | - | |||||||||||
During the year ended December 31, 2014, 97,621 of the Series B warrants expired leaving 136,132 of the Series C-1 warrants outstanding.
NOTE 7 – Share-Based Compensation
Long-Term Incentive Plans
As of December 31, 2014, the Company had reserved 6,542 shares of common stock for issuance under its 2005 long-term incentive plan and 690,000 shares for its 2006 long-term incentive plan. An additional 35,000 options to purchase common stock were issued to a previous CEO outside of one of the Company’s long-term incentive plans. As of December 31, 2014, the Company’s 2005 Long-Term Incentive Plan and 2006 Long-Term Incentive Plan had a total of 404,612 in stock option grants outstanding. The 2005 Long-Term Incentive Plan have been closed for additional grants.
In May 2007, the stockholders of the Company approved the adoption of the Company’s 2006 Stock Plan (the “Plan”). The Plan provides for the grant of incentive stock options, within the meaning of Section 422 of the Internal Revenue Code, to employees and for the grant of non-statutory stock options, restricted stock, and stock appreciation rights to employees, directors, and consultants. The Compensation Committee of the Company’s board of directors administers the Plan and has the authority to make awards under the Plan and establish vesting and other terms, but cannot grant stock options at less than the fair value of the Company’s common stock on the date of grant or re-price stock options previously granted. As of December 31, 2014, 272,222 stock options remained eligible for grant under the 2006 Long-Term Incentive Plan.
Stock options issued under the Plan are granted with an exercise price equal to no less than the market price of the Company’s stock at the date of grant and expire up to ten years from the date of grant. These options generally vest over a three or four year period.
Stock Options
The fair value of stock options granted was determined on the grant date using assumptions for risk free interest rate, the expected term, expected volatility, and expected dividend yield. The risk free interest rate is based on U.S. Treasury zero-coupon yield curve over the expected term of the option. The expected term of stock options represents the average period the stock options are expected to remain outstanding and is based on the expected term calculated using the approach prescribed by the Securities and Exchange Commission's Staff Accounting Bulletin No. 110 for “plain vanilla” options. The Company estimates its expected volatility using the trading volume of its own historical stock prices. The Company’s model includes a zero dividend yield assumption, as the Company has not historically paid nor does it anticipate paying dividends on its common stock. The Company’s model does not include a discount for post-vesting restrictions, as the Company has not issued awards with such restrictions. The periodic expense is then determined based on the valuation of the options, and at that time an estimated forfeiture rate is used to reduce the expense recorded. The Company’s estimate of pre-vesting forfeitures is primarily based on the Company’s historical experience and is adjusted to reflect actual forfeitures as the options vest. The estimated forfeiture rates used during the years ended December 31, 2014 and 2013 ranged from 12.2% to 7.1%.
The following assumptions were used to estimate the fair value of options granted for the years ended December 31, 2014 and 2013 using the Black-Scholes option-pricing model:
| F-14 |
VirtualScopics, Inc. and Subsidiary
Notes to Consolidated Financial Statements
| December 31, | ||||||||
| 2014 | 2013 | |||||||
| Risk free interest rate | 1.84 | % | 1.97 | % | ||||
| Expected term (in years) | 5.93 | 6.70 | ||||||
| Expected volatility | 64.45 | % | 68.22 | % | ||||
| Expected dividend yield | - | - | ||||||
During the years ended December 31, 2014 and 2013, the Company granted options to employees to purchase 185,267 and 6,850 shares of common stock, respectively. Of the total amount of options granted in 2014, 112,017 were granted to executive officers of the Company. These options generally vest ratably during the first four years following their issuance and have a ten-year life. No options were exercised in 2014 and 2013.
A summary of the employee stock option activity for the year ended December 31, 2014 are as follows:
| Number of Shares | Weighted Average Exercise Price | Weighted- Average Remaining Contractual Term | Aggregate Intrinsic Value | |||||||||||||
| Options outstanding at January 1, 2014 | 425,875 | 12.72 | 4.34 | $ | - | |||||||||||
| Granted | 185,267 | 4.13 | ||||||||||||||
| Exercised | - | |||||||||||||||
| Forfeited | (201,668 | ) | (10.23 | ) | $ | 1,965 | ||||||||||
| Expired | (4,862 | ) | (12.75 | ) | ||||||||||||
| Options outstanding at December 31, 2014 | 404,612 | 10.03 | 6.31 | $ | - | |||||||||||
| Options exercisable at December 31, 2014 | 202,506 | 15.10 | 3.40 | $ | - | |||||||||||
Additional information with respect to the outstanding employee stock options as of December 31, 2014 is as follows
| Options Outstanding | Options Exercisable | |||||||||||||||||||
| Exercise Prices | Number Outstanding at December 31, 2014 | Weighted Average Remaining Life (Years) | Weighted Average Exercise Price | Number Exercisable at December 31, 2014 | Weighted Average Exercise Price | |||||||||||||||
| $ 3.88 – 4.15 | 109,017 | 9.34 | 4.07 | - | - | |||||||||||||||
| $ 4.16 – 4.95 | 74,400 | 9.18 | 4.25 | 5,900 | 4.80 | |||||||||||||||
| $ 4.96 – 11.25 | 73,739 | 4.30 | 9.11 | 63,768 | 9.54 | |||||||||||||||
| $ 11.26 – 13.40 | 75,924 | 4.68 | 12.24 | 66,629 | 12.31 | |||||||||||||||
| $ 13.41 – 41.50 | 71,532 | 2.51 | 23.74 | 66,209 | 24.16 | |||||||||||||||
| 404,612 | 6.31 | 10.03 | 202,506 | 15.10 | ||||||||||||||||
| F-15 |
VirtualScopics, Inc. and Subsidiary
Notes to Consolidated Financial Statements
The weighted-average grant-date fair value of options granted during the years ended December 31, 2014 and 2013 was $451,884 and $25,081, respectively.
For the years ended December 31, 2014 and 2013, the Company’s consolidated statements of operations reflect $149,894 and $257,263, respectively, of stock-based compensation expense relating to the amortization of stock options granted under its long-term incentive plans, which is allocated as follows:
| For Years Ended December 31, | ||||||||
| 2014 | 2013 | |||||||
| Cost of service revenues | $ | 40,766 | $ | 50,466 | ||||
| Research and development | 36,178 | 64,917 | ||||||
| Sales and marketing | 10,140 | 11,101 | ||||||
| General and administrative | 62,810 | 130,779 | ||||||
| Total stock-based compensation | $ | 149,894 | $ | 257,263 | ||||
As of December 31, 2014, there was $366,416 of total unrecognized compensation cost related to non-vested share-based compensation arrangements. This cost is expected to be recognized over a weighted-average period of 3.15 years.
Restricted Stock Awards
A restricted stock award entitles the recipient to receive shares of unrestricted common stock upon vesting of the award and expiration of the restrictions. The fair value of each restricted stock award is determined upon granting of the shares and the related compensation expense is recognized ratably over the vesting period and charged to the operations as non-cash compensation expense. Shares contained in the unvested portion of restricted stock awards are forfeited upon termination of employment, unless otherwise agreed. The fair value of restricted stock issued under the Plan is determined based on the closing price of the Company’s common stock on the grant date. Under the provisions of the 2006 Long Term Incentive Plan, the Company may grant restricted stock to its employees, board members and consultants. During 2006, the Board of Directors Compensation Committee approved an equity based compensation structure for non-employee Board members.
A summary of the restricted stock award activity for the year ended December 31, 2014 is as follows:
| Number of Units | Weighted Average Grant Date Fair Value | |||||||
| Non-vested at January 1, 2014 | 984 | 7.40 | ||||||
| Granted | - | - | ||||||
| Vested | (984 | ) | (7.40 | ) | ||||
| Cancelled/Forfeited | - | - | ||||||
| Non-vested at December 31, 2014 | - | $ | - | |||||
The Company incurred $558 and $95,464 in compensation expense during the year ended December 31, 2014 and 2013, respectively, related to the restricted stock awards granted to Board members and former officers of the Company. During the year ended December 31, 2014, 984 restricted stock units vested as part of the former CFO’s consulting agreement. During 2013, the Company issued an aggregate 15,927 stock awards to the former CEO and CFO, which had a grant date fair value of $117,861 ($7.40 per share) and vest over a four year period. On August 31, 2013, 2,951 restricted stock awards were forfeited as the result of the resignation of the former CFO. On October 25, 2013, as part of the separation agreement with the former CEO, the vesting was accelerated for 11,992 shares underlying restricted stock units to the date of termination.
| F-16 |
VirtualScopics, Inc. and Subsidiary
Notes to Consolidated Financial Statements
NOTE 8 - Benefit Plan
The Company has a defined contribution plan which covers all of its full-time employees. The employees’ annual contributions are limited to the maximum allowed under the Internal Revenue Code. During 2012, the Company discontinued the matching contribution and reinstated the program in 2014. The matching contribution to participants 401k plans equal to 50% of the participants’ contributions up to a maximum 3% of annual wages. The Company contributed $59,040 and $0 in 2014 and 2013 to participants accounts representing the employer contribution amount.
NOTE 9 - Income Taxes
The Company has identified its federal tax return and state tax returns for New York and Pennsylvania as “major” tax jurisdictions, as defined. Based on the Company’s evaluation, it has been concluded that there are no significant uncertain tax positions requiring recognition in the Company’s consolidated financial statements. The Company’s evaluation was performed for the tax years ended 2012 through 2014, the only periods subject to examination. The Company believes that its income tax positions and deductions will be sustained on audit and does not anticipate any adjustments that will result in a material change to its financial position. The Company does not expect its unrecognized tax benefit to change during the next 12 months. As of December 31, 2014, all of the Company’s deferred tax assets were fully reserved by a valuation allowance equal to 100% of the net deferred tax assets. The Company will continue to assess the likelihood of recognizing a portion of its deferred tax assets and will make an assessment of whether it should reduce the valuation allowance.
The Company has significant net operating loss and business credit carryovers which are subject to a valuation allowance due to the uncertain nature of the realization of the losses. Section 382 of the Internal Revenue Code imposes certain limitations on the utilization of net operating loss carryovers and other tax attributes after a change in control. The Company has completed a study to assess whether a change in control occurred from November 4, 2005 through December 31, 2014, in order to determine whether an “ownership change” as defined in Section 382 occurred as a result of equity transactions. The Company, after considering all available evidence, concluded that an ownership change has not occurred. An ownership change does not occur until the 5% shareholders have a cumulative ownership shift of greater than 50%.
The Company will recognize interest and penalties accrued related to unrecognized tax benefits as components of its income tax provision. The Company does not have any interest and penalties accrued related to unrecognized tax benefits.
The Company accounts for income taxes in accordance with ASC 740, Income Taxes. Under ASC 740, deferred income taxes and liabilities are recognized based on temporary differences between the financial statement and tax basis of assets and liabilities using the enacted tax rates in effect in the years in which the differences are expected to reverse. ASC 740 requires recognition of net deferred tax assets to the extent it is more likely than not that such net assets will be realized. To the extent that the Company believes that its net deferred tax assets will not be realized, a valuation allowance must be recorded against those assets.
| F-17 |
VirtualScopics, Inc. and Subsidiary
Notes to Consolidated Financial Statements
The income tax provision consists of the following:
| 2014 | 2013 | |||||||
| Current | ||||||||
| Federal | $ | - | $ | - | ||||
| State | - | - | ||||||
| - | - | |||||||
| Deferred | ||||||||
| Federal | (735,191 | ) | (846,095 | ) | ||||
| State | (89,118 | ) | (99,926 | ) | ||||
| Change in valuation allowance | 824,309 | 946,021 | ||||||
| Total income tax provision | $ | - | $ | - | ||||
The Company has net operating loss carryforwards (“NOLs”) of approximately $15,046,000 as of December 31, 2014 that will be available to offset future taxable income. Approximately $677,000 of the NOL carryforward, if realized, will result in a benefit to be recorded in APIC. The NOLs are due to expire in 2021 through 2034. The Company has concluded that a full valuation allowance was appropriate for the NOLs at December 31, 2014 and 2013 as it is more likely than not that they will be utilized prior to their expiration.
The total net deferred tax asset and liabilities as of December 31, 2014 and 2013 consists of the following:
| 2014 | 2013 | |||||||
| Net operating loss carryforwards | $ | 5,501,926 | $ | 4,095,519 | ||||
| Property and equipment | 17,283 | - | ||||||
| Intangible assets | 532,716 | 658,055 | ||||||
| Accrued expenses | 140,691 | 146,249 | ||||||
| Credit carryforwards | 316,651 | 287,756 | ||||||
| Stock-based compensation | 461,985 | 958,607 | ||||||
| Total deferred tax asset | 6,971,252 | 6,146,186 | ||||||
| Deferred tax liability: | ||||||||
| Property and equipment | - | (11,526 | ) | |||||
| Subtotal | 6,971,252 | 6,134,660 | ||||||
| Less: valuation allowance | (6,971,252 | ) | (6,134,660 | ) | ||||
| Total net deferred tax asset | $ | - | $ | - | ||||
The difference between the federal statutory and effective income tax rates for the years ended December 31, 2014 and 2013 is as follows:
| 2014 | 2013 | |||||||
| Federal statutory tax rate | (34.00 | )% | (34.00 | )% | ||||
| State and local income taxes, net of federal benefit | (2.60 | )% | (3.64 | )% | ||||
| Stock-based compensation | 14.12 | % | 7.56 | % | ||||
| Research and development credit | (0.84 | )% | (4.41 | )% | ||||
| Other | (0.77 | )% | (0.37 | )% | ||||
| (24.09 | )% | (34.86 | )% | |||||
| Less: valuation allowance | 24.09 | % | 34.86 | % | ||||
| Provision for income taxes | - % | - % | ||||||
| F-18 |
VirtualScopics, Inc. and Subsidiary
Notes to Consolidated Financial Statements
NOTE 10 - Commitments and Contingencies
Operating Leases
In July, 2007 the Company began leasing approximately 19,500 square feet of office space at our corporate headquarters in Rochester, New York. In June 2012, the Company renewed its lease for approximately 19,500 square feet of office space at the corporate headquarters in Rochester, New York. The lease term is for five years and commenced on July 1, 2012. The base annual rent under the lease is $309,075, and increases two percent (2%) per year over the term of the lease.
In May 2014, the Company entered into a lease for approximately 2,190 square feet of office space in New Hope, Pennsylvania. The lease term is for three years with a lease commencement date of June 1, 2014. The base annual rent under the lease is $54,000, and increases three percent (3%) per year over the term of the lease.
In August 2014, the Company entered into a lease agreement for certain equipment. The lease was for 36 months and expires in August 2017. The base annual rent under the lease was $5,221, with $2,176 being recognized in 2014.
Total rent expense for the years ended December 31, 2014 and 2013 was $356,320 and $322,993, respectively.
Future minimum rental commitments under non-cancelable operating leases are as follows:
| For the Years Ending | ||||
| December 31, | Amount | |||
| 2015 | 384,950 | |||
| 2016 | 393,092 | |||
| 2017 | 194,192 | |||
| Total | $ | 972,234 | ||
| F-19 |
VirtualScopics, Inc. and Subsidiary
Notes to Consolidated Financial Statements
Employment Agreements
On July 23, 2014, (the “Effective Date”), the Company entered into an employment agreement with Eric T. Converse who was appointed President and Chief Executive Officer (the “CEO Employment Agreement”). The CEO Employment Agreement begins as of the Effective Date, has an initial term of one year and will be extended automatically for one-year periods so long as Mr. Converse remains fully employed by the Company. Mr. Converse will receive an annual salary of $325,000 during the term of the CEO Employment Agreement. Mr. Converse is also eligible to receive an annual incentive bonus tied to the achievement of Company goals approved by the Compensation Committee of the Company’s Board of Directors. The Company accrued $74,202 toward the annual incentive bonus during 2014. On the Effective Date, Mr. Converse was also granted an option to purchase 87,017 shares of the Company’s common stock with a $4.22 exercise price, four year vesting period, and ten year term. If Mr. Converse remains employed by the Company on the date that is twelve months after the Effective Date, the Company will award an option to purchase an additional 87,017 shares, and if employed twenty-four months after the Effective Date, then the Company will also award an option to purchase an additional 43,510 shares. Each award is subject to the terms of the Company’s Amended and Restated 2006 Long-Term Incentive Plan. The options will vest at the rate of 25% on each anniversary of each award while Mr. Converse is employed by the Company.
The CEO Employment Agreement provides that if the Company terminates Mr. Converse’s employment without cause, then the Company is required to pay his annual salary and benefits for a period of six months. If a change in control (as defined in the CEO Employment Agreement) occurs on or before the third anniversary of the Effective Date, then the Company is required to pay Mr. Converse an amount equal to 75% of his annual salary for the year in which the change in control occurs.
On August 19, 2014 (the “Second Effective Date”), the Company entered into an employment agreement with James A. Groff, pursuant to which Mr. Groff agreed to serve as the Company’s Chief Financial Officer (the “CFO Employment Agreement”). The term of the CFO Employment Agreement begins as of the Second Effective Date, and will be extended automatically for one-year periods so long as Mr. Groff remains fully employed by the Company. Mr. Groff will receive an annual salary of $150,000 during the term of the CFO Employment Agreement. Mr. Groff is also eligible to receive an annual incentive bonus tied to the achievement of Company goals approved by the Compensation Committee of the Company’s Board of Directors. The Company accrued $25,842 toward the annual incentive bonus during 2014. On the Second Effective Date, Mr. Groff was granted an option to purchase 25,000 shares of the Company’s common stock. If Mr. Groff remains employed by the Company on the date that is twelve months after the Second Effective Date, the Company will award an option to purchase an additional 25,000 shares, and if employed twenty-four months after the Second Effective Date, then the Company will also award an option to purchase an additional 25,000 shares. Each award is subject to the terms of the Company’s Amended and Restated 2006 Long-Term Incentive Plan. The options will vest at the rate of 25% on each anniversary of each award while Mr. Groff is employed by the Company.
The CFO Employment Agreement provides that if the Company terminates Mr. Groff’s employment without cause, then the Company is required to pay his annual salary and benefits for a period of six months. If a change in control (as defined in the CFO Employment Agreement) occurs on or before the third anniversary of the Second Effective Date, then the Company is required to pay Mr. Groff an amount equal to 50% of his annual salary for the year in which the change in control occurs.
| F-20 |
VirtualScopics, Inc. and Subsidiary
Notes to Consolidated Financial Statements
Separation Agreement
On October 25, 2013, the Company entered into a Separation, Waiver and Release Agreement (the “Separation Agreement”) with its former Chief Executive Officer, L. Jeffrey Markin. Under the terms of the Separation Agreement, Mr. Markin received monthly separation payments in the amount of $25,310 commencing on the date of the Separation Agreement and continuing until May 31, 2014, In addition, Mr. Markin received $8,213 in benefits through May 31, 2014, on terms comparable to the benefits provided for under his existing Employment Agreement with the Company dated February 24, 2009, as amended by the Amendment to Employment Agreement, dated December 28, 2012 (as amended, the “Employment Agreement”). The Employment Agreement was terminated and superseded by the Separation Agreement. Mr. Markin received a $98,136 bonus earned under the Company’s 2013 Bonus Plan. Unvested stock options, stock awards and restricted stock units granted to Mr. Markin were forfeited as of the effective date of the Separation Agreement, other than 11,992 shares underlying restricted stock units for which vesting was accelerated to the date of termination. As of December 31, 2013, there was a $20,867 receivable for the employee payroll taxes resulting from the issuance of the 11,992 shares to Mr. Markin which was reported as part of prepaid expenses and other current assets in the Company’s consolidated balance sheet. Also under the Separation Agreement, Mr. Markin provided a general release in favor of the Company and its affiliates. As of December 31, 2014 and 2013, there remained approximately $ 0 and $133,897, respectively, of severance payable which was reported as part of accrued payroll in the Company’s consolidated balance sheet.
Other Agreements
On June 26, 2014, the Company entered into an Alliance Framework Agreement (the "Framework Agreement") and Master Subcontract Agreement with IXICO Technologies Limited (“IXICO”) as part of a strategic alliance between the two companies. The Framework Agreement provides a framework under which the parties will work to provide imaging contract research services related to clinical trials of drugs and medical devices across a range of therapeutic areas and modalities. For projects awarded under the alliance, one party will generally be the lead and the other will provide imaging services as a subcontractor. This will depend upon, among other things, existing contacts and the therapeutic area of the project. Generally, VirtualScopics will be the service provider for oncology projects and IXICO will be the service provider for neuroscience projects. As part of the alliance, IXICO will use space at VirtualScopics’ new office in New Hope, Pennsylvania.
The Framework Agreement has a one-year term with automatic one year renewals. Either party may terminate the Agreement for any reason on at least 30 days’ notice. Either may also terminate for cause due to a material breach not cured within 30 days. The Framework Agreement may also be terminated immediately if an insolvency event occurs. In the event of termination, each party agrees for 120 days not to solicit any opportunities the other party brought to the alliance. Upon notice of termination, existing work orders shall continue and the parties shall generally continue to pursue any awards and proposals received prior to notice of termination.
On December 11, 2014, the Company signed a multi-year software license and support agreement with alliance partner, IXICO plc, for their proprietary imaging data and query management digital platform, TrialTracker™. Under the terms of the agreement, VirtualScopics will pay IXICO to implement and support the use of TrialTracker™ in its clinical trial business both as part of and separate to the Alliance. The terms of the agreement included a set up fee of approximately $200,000 that was incurred during 2014. Starting in 2015, there is a yearly license fee of $40,000 and a minimum support fee of $90,000 in each of the first two service years and thereafter reduced to a minimum of $25,000.
NOTE 11 - Related Parties
In April 2012, the Company issued Merck Global Health Innovation Fund, LLC (a wholly-owned subsidiary of Merck & Co, Inc. (“Merck”)) 3,000 shares of Series C-1 Preferred Stock which are initially convertible into 249,107 shares of common stock and Series C-1 Warrants which are exercisable to purchase 136,132 shares of common stock. Revenues generated from Merck were $204,688 and $368,977 for the years ended December 31, 2014 and 2013, respectively. The accounts receivable balance due from Merck was $95,985 and $87,200 as of December 31, 2014 and 2013, respectively.
| F-21 |
VirtualScopics, Inc. and Subsidiary
Notes to Consolidated Financial Statements
NOTE 12 – Concentrations of Credit Risk
The Company’s top four customers accounted for approximately 26%, 21%, 20%, and 10% of total revenue for the year ended December 31, 2014. The Company’s top three customers accounted for approximately 42%, 12%, and 11% of total revenue for the year ended December 31, 2013.
Three customers accounted for approximately 27%, 19%, and 18% of accounts receivable as of December 31, 2014 as compared to four customers accounted for approximately 34%, 13%, 13%, and 11% of accounts receivable as of December 31, 2013.
NOTE 13 – Subsequent Events
The Company evaluates events that have occurred after the balance sheet date through date the financial statements are issued. Based upon the evaluation, the Company did not identify any recognized or non-recognized subsequent events that would have required adjustment or disclosure in the consolidated financial statements.
| F-22 |