Attached files
| file | filename |
|---|---|
| 8-K - FORM 8-K - E TRADE FINANCIAL CORP | d8k.htm |
 2010
Citi Financial Services Conference Bruce Nolop Chief Financial Officer March 10, 2010 © 2010 E*TRADE FINANCIAL Corp. All rights reserved. This presentation contains confidential information and may not be disclosed without
E*TRADE FINANCIAL Corporation’s written permission. EXHIBIT 99.1 |
 © 2010 E*TRADE FINANCIAL Corp. All rights reserved. This presentation contains confidential information and may not be disclosed without
E*TRADE FINANCIAL Corporation’s written permission. 2 Safe Harbor Statement This presentation contains certain projections or other forward- looking statements regarding future events or the future performance of the Company. Various factors, including risks and uncertainties referred to in the 10Ks, 10Qs and other reports E*TRADE FINANCIAL Corporation periodically files with the SEC, could cause our actual results to differ materially from those indicated by our projections or other forward- looking statements. This presentation also contains disclosure of non-GAAP financial measures. A reconciliation of these financial measures to the most directly comparable GAAP financial measures can be found on the investor relations site at https://investor.etrade.com © 2010 E*TRADE FINANCIAL Corp. All rights reserved. |
 © 2010 E*TRADE FINANCIAL Corp. All rights reserved. This presentation contains confidential information and may not be disclosed without E*TRADE FINANCIAL Corporation’s written permission. 3 Overview Thriving Online Brokerage Business Improving Loan Performance Trends Strengthened Financial Condition |
 © 2010 E*TRADE FINANCIAL Corp. All rights reserved. This presentation contains confidential information and may not be disclosed without
E*TRADE FINANCIAL Corporation’s written permission. 4 Thriving Online Brokerage Business |
 © 2010 E*TRADE FINANCIAL Corp. All rights reserved. This presentation contains confidential information and may not be disclosed without E*TRADE FINANCIAL Corporation’s written permission. 5 Thriving Online Brokerage Business Achieved record levels in 2009 for DARTs, brokerage accounts, and consistent growth in brokerage cash Gained market share versus traditional brokers and remained competitive versus online brokers Introduced new products and enhancements for both active traders and long-term investors Benefited from disciplined expense management, while investing in customer service Generated consistent net operating income |
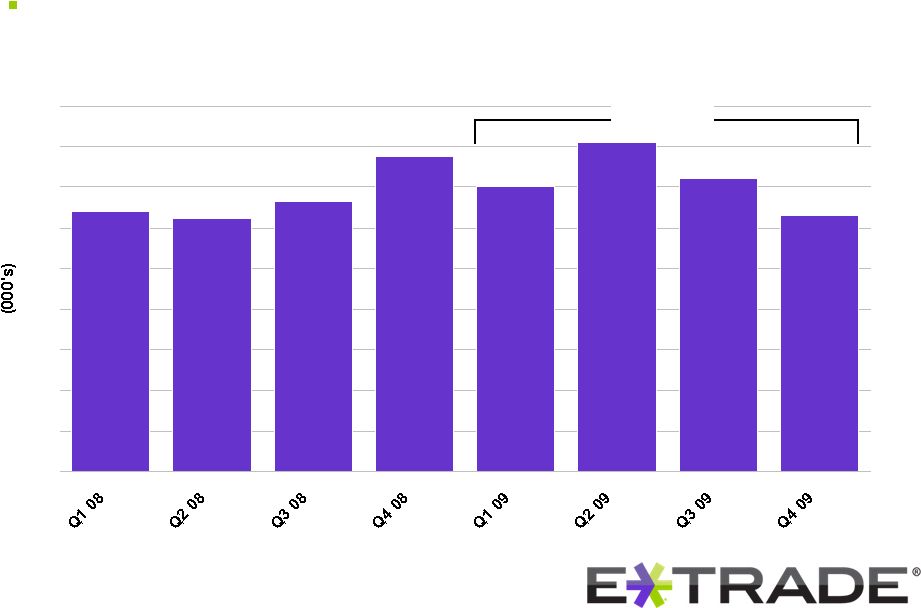 © 2010 E*TRADE FINANCIAL Corp. All rights reserved. This presentation contains confidential information and may not be disclosed without E*TRADE FINANCIAL Corporation’s written permission. 161 156 166 194 175 203 180 158 0 25 50 75 100 125 150 175 200 225 6 Thriving Online Brokerage Business Strength in DARTs (1) 179 |
 © 2010 E*TRADE FINANCIAL Corp. All rights reserved. This presentation contains confidential information and may not be disclosed without
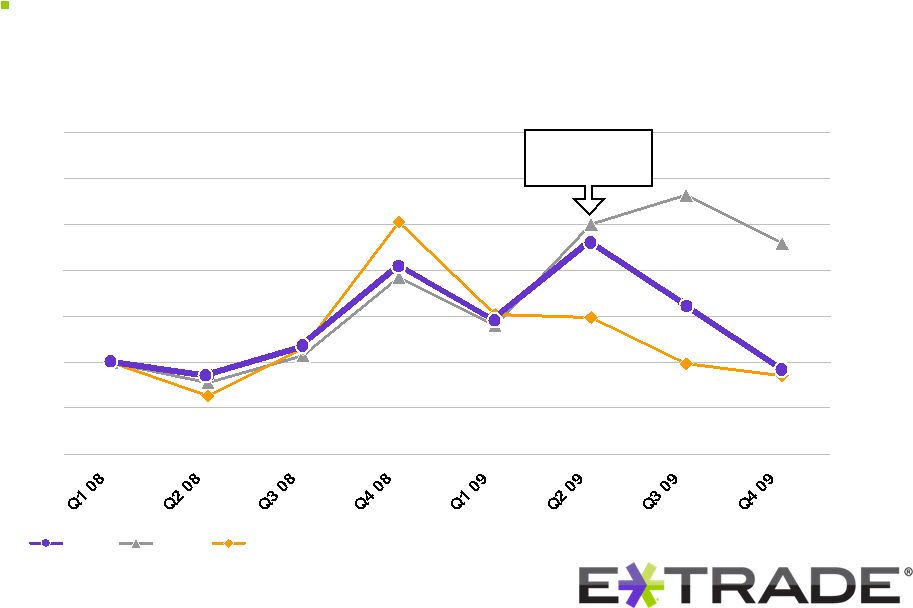
E*TRADE FINANCIAL Corporation’s written permission. 80 90 100 110 120 130 140 150 ETFC AMTD SCHW 7 Thriving Online Brokerage Business Competitive versus largest online brokers DARTs indexed to Q1 2008 Ameritrade acquires thinkorswim |
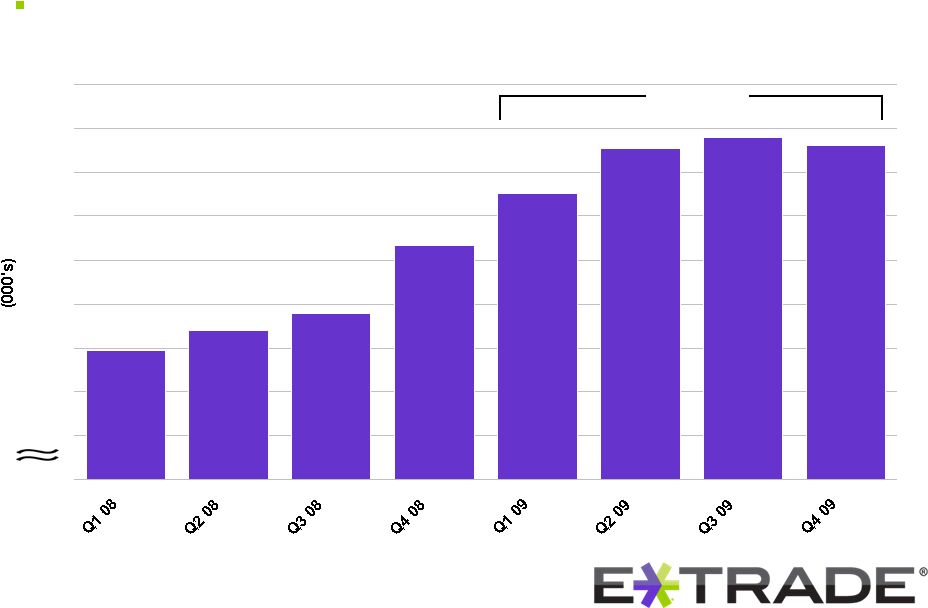 © 2010 E*TRADE FINANCIAL Corp. All rights reserved. This presentation contains confidential information and may not be disclosed without E*TRADE FINANCIAL Corporation’s written permission. 8 Thriving Online Brokerage Business Growth in brokerage accounts (2) 114K net new 0 2,397 2,420 2,440 2,516 2,575 2,627 2,639 2,630 2,300 2,350 2,400 2,450 2,500 2,550 2,600 2,650 2,700 |
   © 2010 E*TRADE FINANCIAL Corp. All rights reserved. This presentation contains confidential information and may not be disclosed without E*TRADE FINANCIAL Corporation’s written permission. 9 Thriving Online Brokerage Business Improved brokerage account attrition (3) 13.3% 16.9% 17.0% 15.8% 15.4% 18.4% 13.2% 12.4% 11.6% 14.3% 0% 5% 10% 15% 20% 25% |
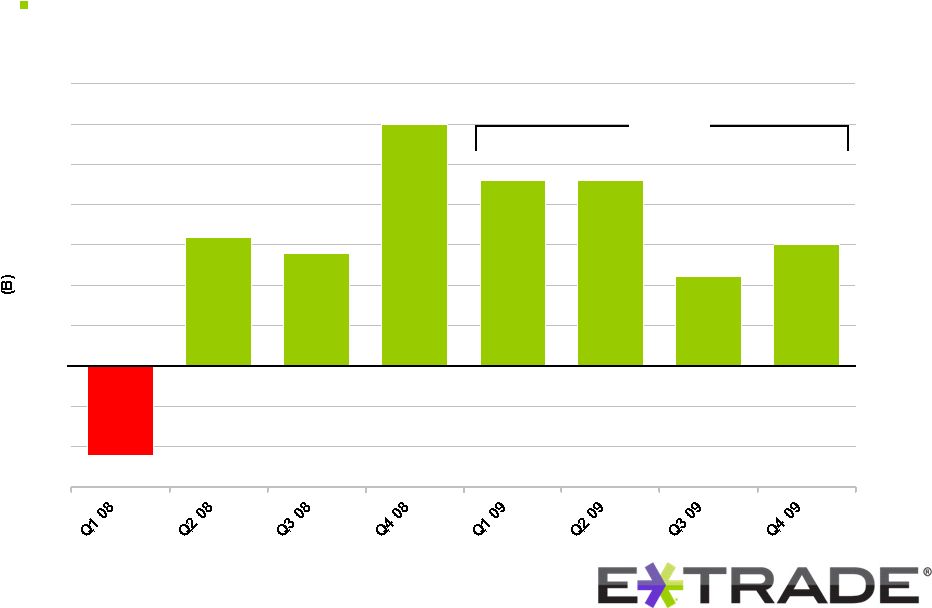 © 2010 E*TRADE FINANCIAL Corp. All rights reserved. This presentation contains confidential information and may not be disclosed without E*TRADE FINANCIAL Corporation’s written permission. -$1.5 -$1.0 -$0.5 $0.0 $0.5 $1.0 $1.5 $2.0 $2.5 $3.0 $3.5 Thriving Online Brokerage Business 10 Net new brokerage assets (4) $7.2B |
 © 2010 E*TRADE FINANCIAL Corp. All rights reserved. This presentation contains confidential information and may not be disclosed without
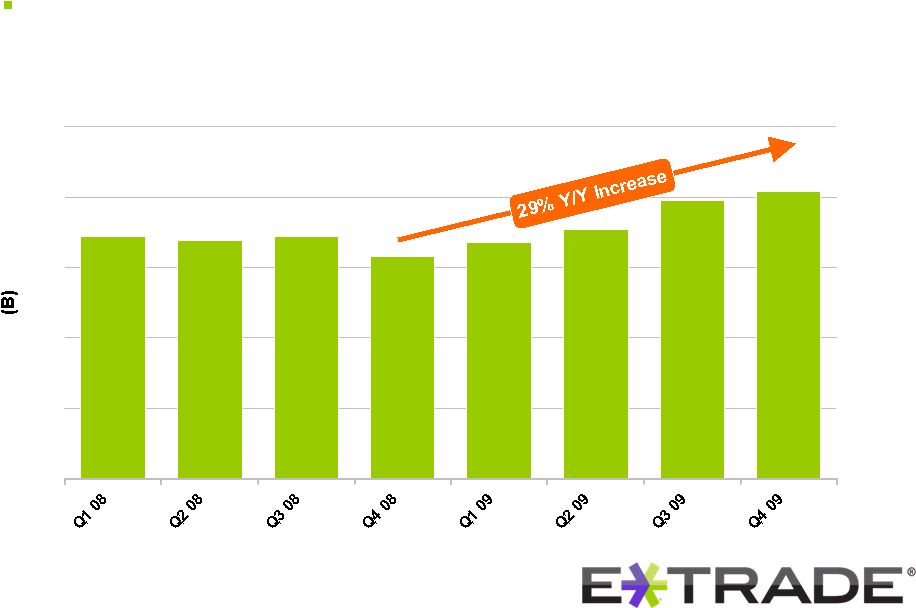
E*TRADE FINANCIAL Corporation’s written permission. $0 $5 $10 $15 $20 $25 Thriving Online Brokerage Business
11 Growth in brokerage-related cash |
 © 2010 E*TRADE FINANCIAL Corp. All rights reserved. This presentation contains confidential information and may not be disclosed without
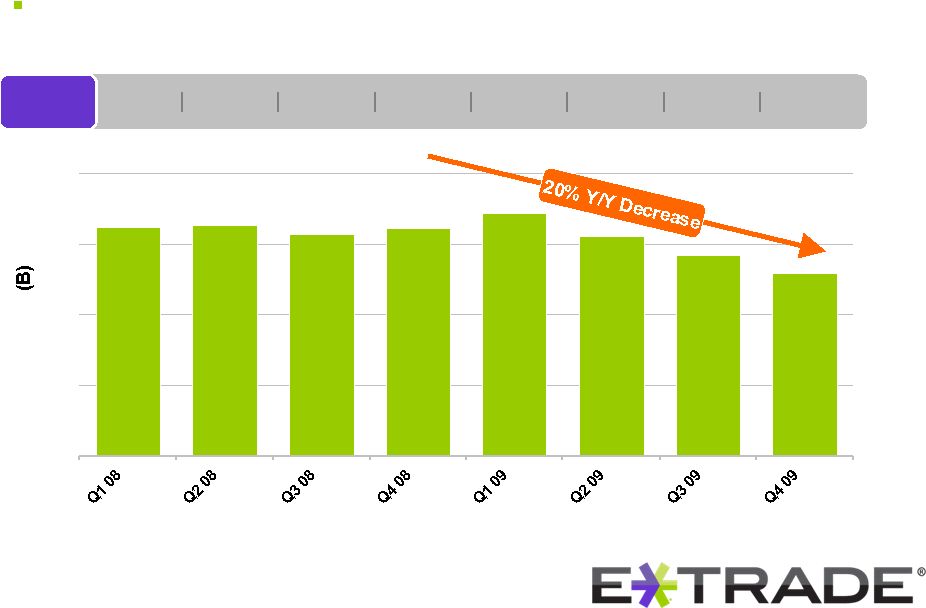
E*TRADE FINANCIAL Corporation’s written permission. Thriving Online Brokerage Business 12 Planned decline in bank-related cash * APY for E*TRADE Complete Savings Account 3.45% 3.15% 3.30% 3.01% 1.45% 0.95% 0.60% 0.50% CSA* Balances are not adjusted for the sale of approximately $1B of deposits to Discover
Financial Services, completed in Q1 2010 $0 $5 $10 $15 $20 |
 © 2010 E*TRADE FINANCIAL Corp. All rights reserved. This presentation contains confidential information and may not be disclosed without
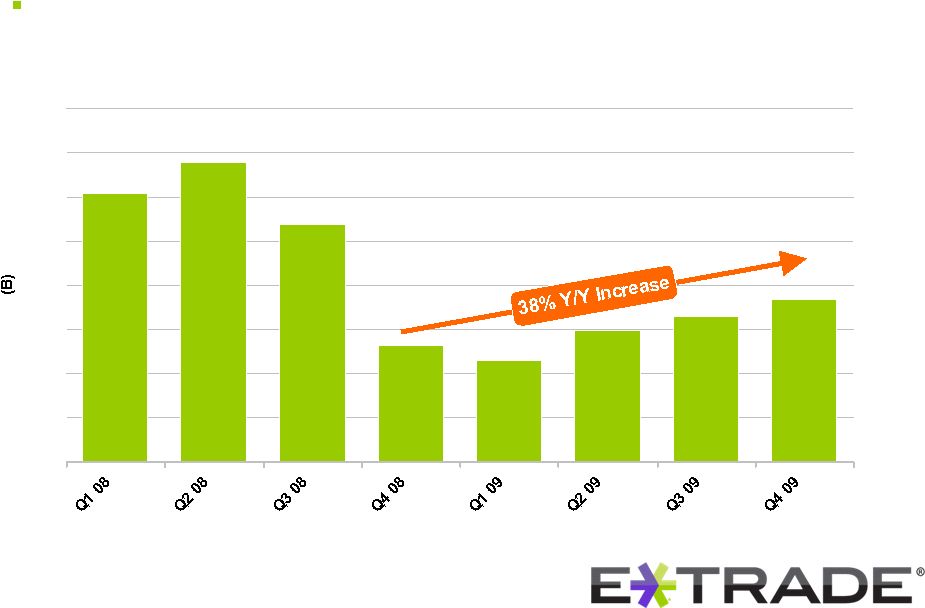
E*TRADE FINANCIAL Corporation’s written permission. $0.0 $1.0 $2.0 $3.0 $4.0 $5.0 $6.0 $7.0 $8.0 Thriving Online Brokerage Business 13 Recovery of customer margin receivables |
 © 2010 E*TRADE FINANCIAL Corp. All rights reserved. This presentation contains confidential information and may not be disclosed without
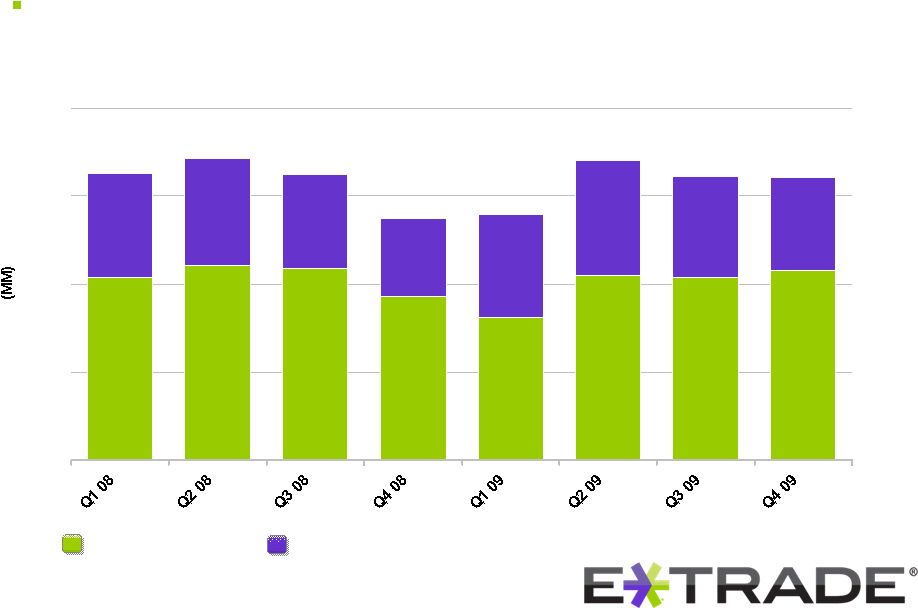
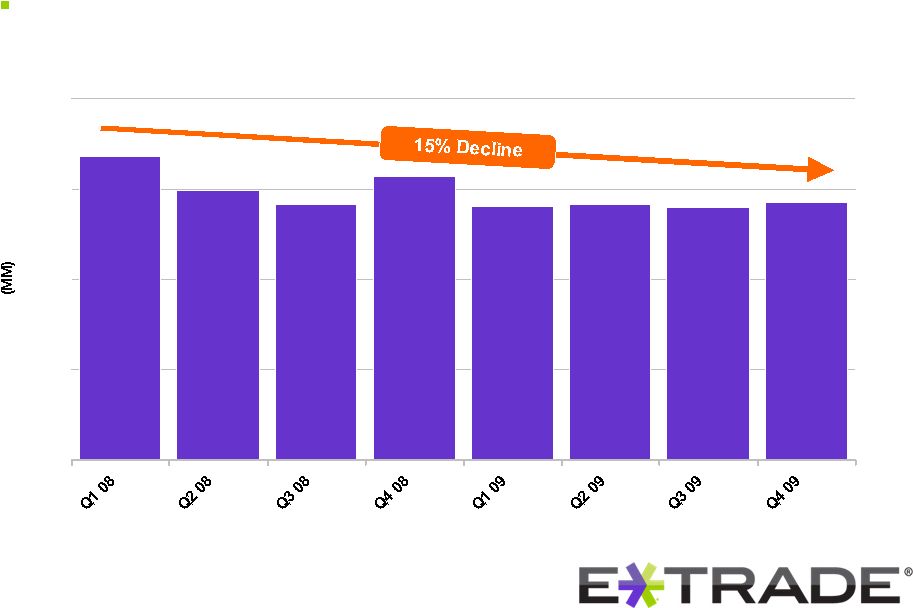
E*TRADE FINANCIAL Corporation’s written permission. $0 $100 $200 $300 $400 Thriving Online Brokerage Business
14 Consistent net operating interest income Trading and Investing Balance Sheet Management |
 © 2010 E*TRADE FINANCIAL Corp. All rights reserved. This presentation contains confidential information and may not be disclosed without
E*TRADE FINANCIAL Corporation’s written permission. $285 $279 $283 $281 $313 $283 $299 $335 $0 $100 $200 $300 $400 Thriving Online Brokerage Business 15 Disciplined expense management Adjusted Total Operating Expense (5) |
 © 2010 E*TRADE FINANCIAL Corp. All rights reserved. This presentation contains confidential information and may not be disclosed without
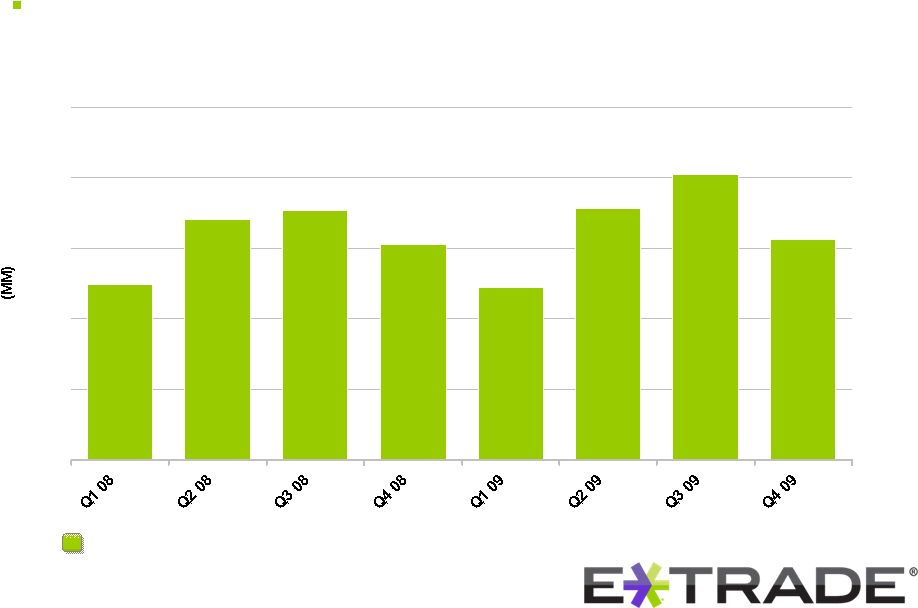
E*TRADE FINANCIAL Corporation’s written permission. $0 $50 $100 $150 $200 $250 Thriving Online Brokerage Business 16 Profitable trading and investing segment Segment income |
 © 2010 E*TRADE FINANCIAL Corp. All rights reserved. This presentation contains confidential information and may not be disclosed without
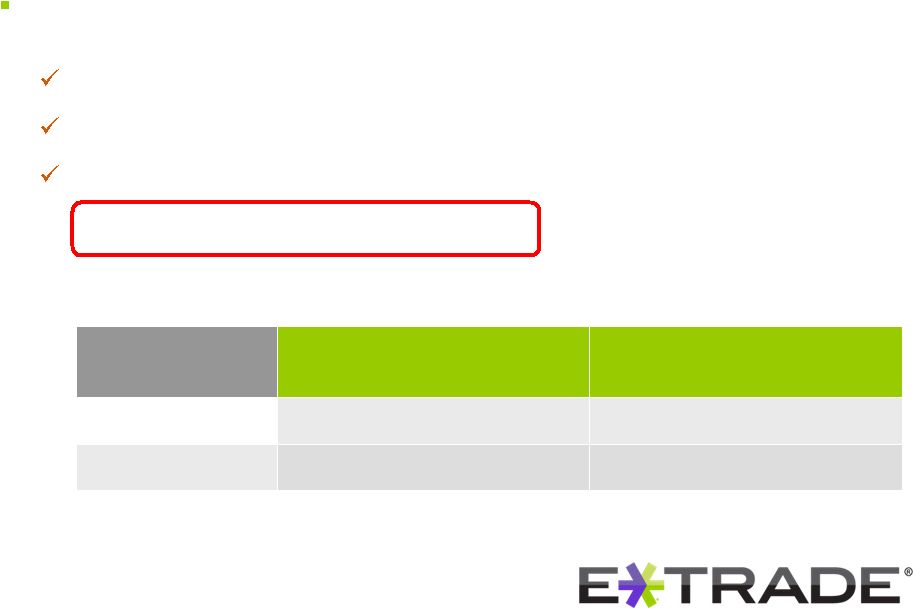
E*TRADE FINANCIAL Corporation’s written permission. 17 Thriving Online Brokerage Business Simplified and transparent pricing Eliminated $12.99 commission tier Eliminated per share charges (6) Eliminated account inactivity fees (7) Estimated revenue impact: $50 million 150+ trades per quarter 0-149 trades per quarter Stock trades (8) $7.99 $9.99 Options trades (8) $7.99 + $0.75 $9.99 + $0.75 Revised commission schedule (8) |
 © 2010 E*TRADE FINANCIAL Corp. All rights reserved. This presentation contains confidential information and may not be disclosed without
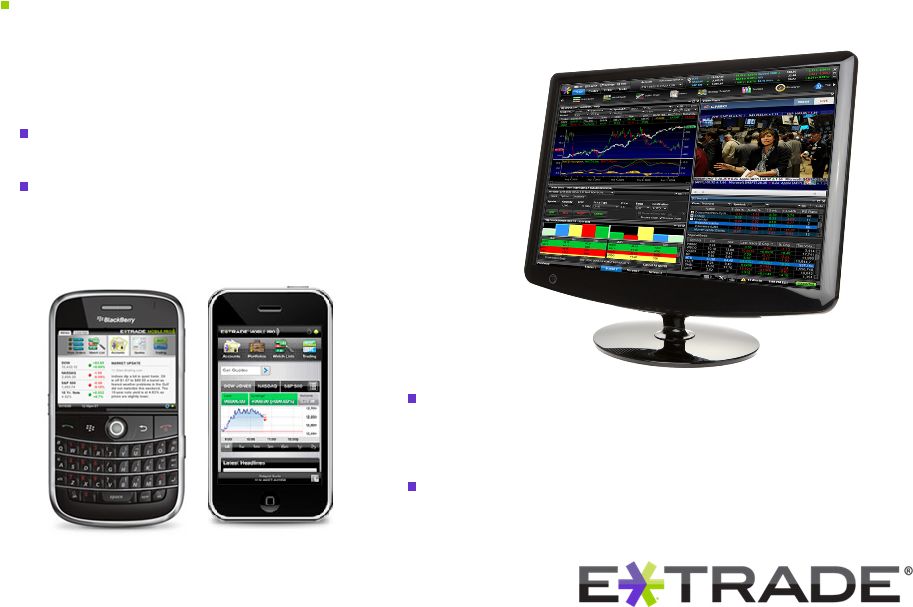
E*TRADE FINANCIAL Corporation’s written permission. 18 Thriving Online Brokerage Business New products and enhancements for active traders Updated Power E*TRADE Pro Upgrades for mobile devices Back-testing and advanced screeners Portfolio margining |
 © 2010 E*TRADE FINANCIAL Corp. All rights reserved. This presentation contains confidential information and may not be disclosed without
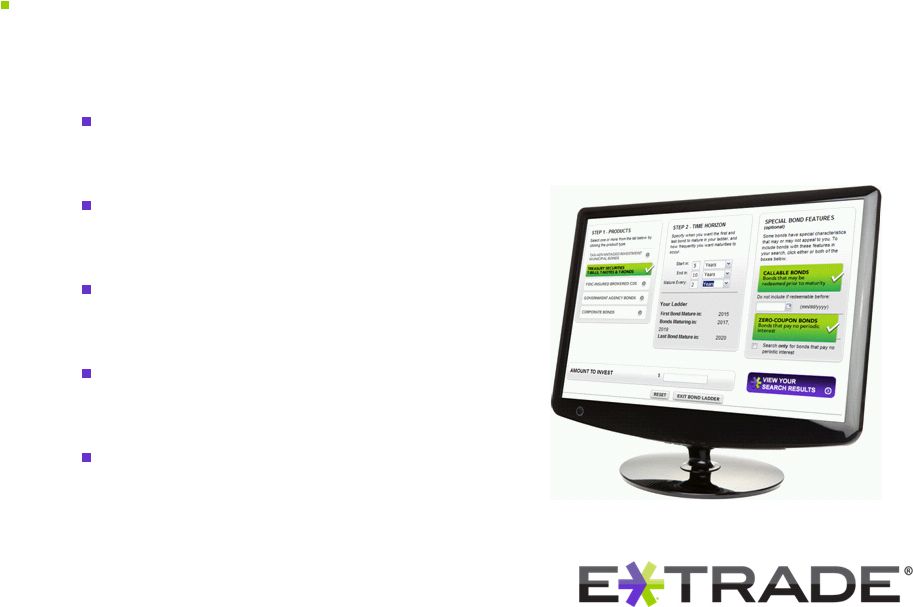
E*TRADE FINANCIAL Corporation’s written permission. 19 Thriving Online Brokerage Business New products and enhancements for long-term investors Managed Investment Portfolio Retirement QuickPlan Investor Resource Center Bond Investor Tools Online Advisor |
 Brand expansion Value propositions Thriving Online Brokerage Business 20 Highly effective marketing program © 2010 E*TRADE FINANCIAL Corp. All rights reserved. This presentation contains confidential information and may not be disclosed without
E*TRADE FINANCIAL Corporation’s written permission.
|
 © 2010 E*TRADE FINANCIAL Corp. All rights reserved. This presentation contains confidential information and may not be disclosed without
E*TRADE FINANCIAL Corporation’s written permission. 21 Thriving Online Brokerage Business Grow active trader franchise Deepen penetration of long-term investor segment Increase the quality of customer accounts Reduce brokerage account attrition Restructure international operations
to improve profitability Focusing on profitable growth |
 © 2010 E*TRADE FINANCIAL Corp. All rights reserved. This presentation contains confidential information and may not be disclosed without
E*TRADE FINANCIAL Corporation’s written permission. 22 Improving Loan Performance Trends |
 © 2010 E*TRADE FINANCIAL Corp. All rights reserved. This presentation contains confidential information and may not be disclosed without
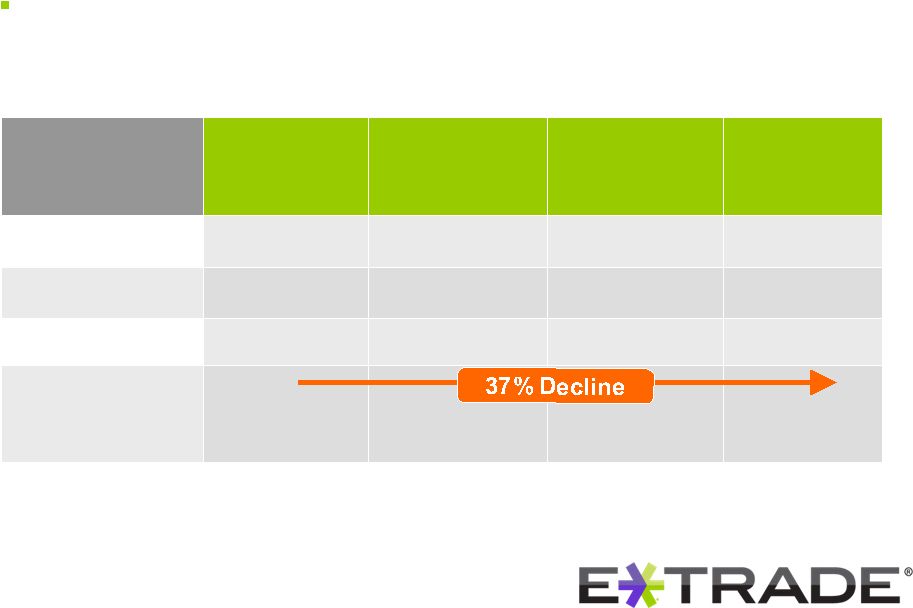
E*TRADE FINANCIAL Corporation’s written permission. 23 Loan portfolio in full run-off mode Proactively managing to reduce charge-offs Meaningful improvement in delinquencies Provision has crossed below the level of charge-offs Expect loan loss provision and internally-generated Bank capital to breakeven in 2010 Improving Loan Performance Trends |
 © 2010 E*TRADE FINANCIAL Corp. All rights reserved. This presentation contains confidential information and may not be disclosed without
E*TRADE FINANCIAL Corporation’s written permission. 24 Improving Loan Performance Trends ($ in billions) Loan Balance 9/30/07 (9) Paydowns (10) Charge-offs Loan Balance 12/31/09 (9) 1-4 Family loans $16.9 ($5.8) ($0.5) $10.6 Home equity $12.4 ($2.7) ($1.9) $7.8 Consumer $3.0 ($1.0) ($0.2) $1.8 TOTAL $32.3 ($9.5) ($2.6) $20.2 Loan portfolio in full run-off mode |
 © 2010 E*TRADE FINANCIAL Corp. All rights reserved. This presentation contains confidential information and may not be disclosed without
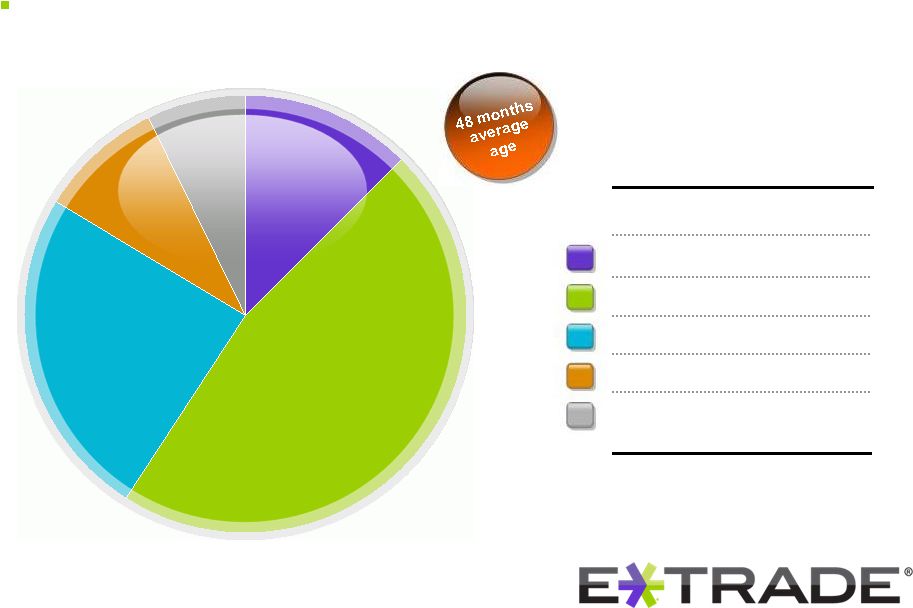
E*TRADE FINANCIAL Corporation’s written permission. 2008 $0.0B 0% 2007 $1.0B 12% 2006 $3.6B 47% 2005 $1.9B 24% 2004 $0.7B 9% 2003 and older $0.6B 7% Total $7.8B 100% Unpaid Balances
by Origination Vintage 2007 2003 and older 2004 2005 2006 Improving Loan Performance Trends 25 Seasoning of the home equity portfolio |
 © 2010 E*TRADE FINANCIAL Corp. All rights reserved. This presentation contains confidential information and may not be disclosed without
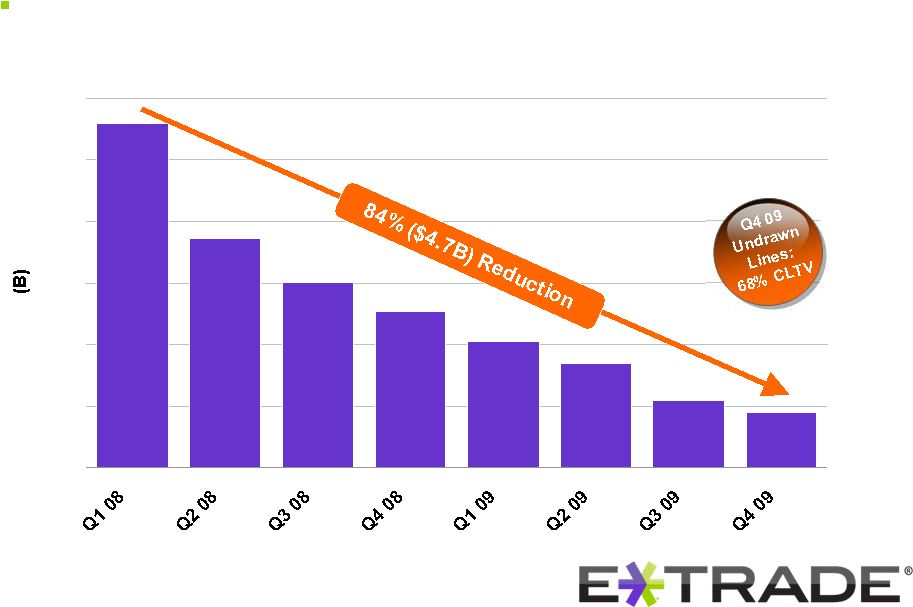
E*TRADE FINANCIAL Corporation’s written permission. $0.9 $1.1 $1.7 $2.0 $2.5 $3.0 $3.7 $5.6 $0.0 $1.0 $2.0 $3.0 $4.0 $5.0 $6.0 Undrawn Home Equity Lines Improving Loan Performance Trends 26 Proactively managing to reduce exposure |
 © 2010 E*TRADE FINANCIAL Corp. All rights reserved. This presentation contains confidential information and may not be disclosed without
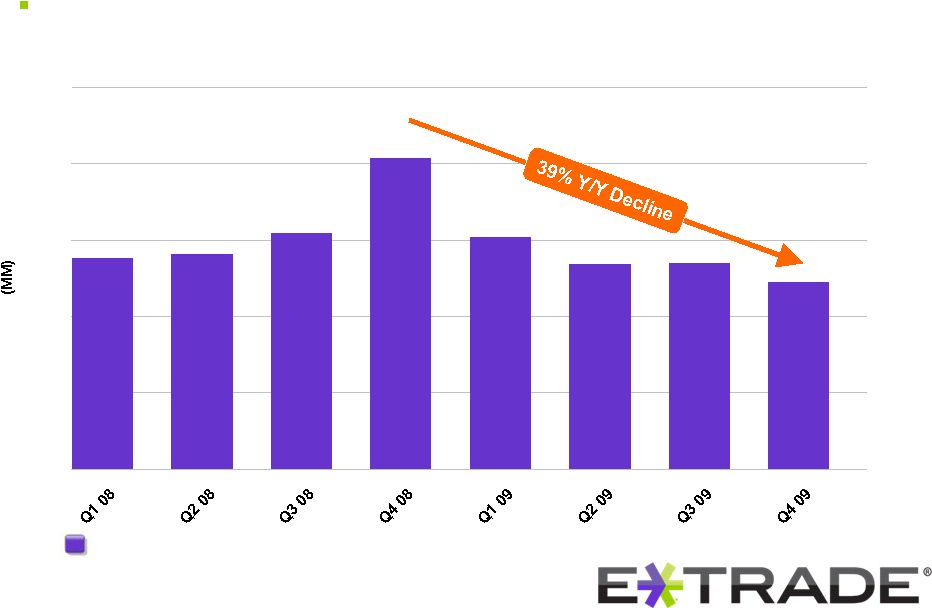
E*TRADE FINANCIAL Corporation’s written permission. $0 $100 $200 $300 $400 $500 27 Improving Loan Performance Trends Significantly lower home equity delinquencies in 2009 30-89 Days Delinquent |
 © 2010 E*TRADE FINANCIAL Corp. All rights reserved. This presentation contains confidential information and may not be disclosed without
E*TRADE FINANCIAL Corporation’s written permission. $0 $100 $200 $300 $400 $500 $600 $700 28 Improving Loan Performance Trends Gradually declining 1-4 Family delinquencies in 2009 30-89 Days Delinquent |
 © 2010 E*TRADE FINANCIAL Corp. All rights reserved. This presentation contains confidential information and may not be disclosed without
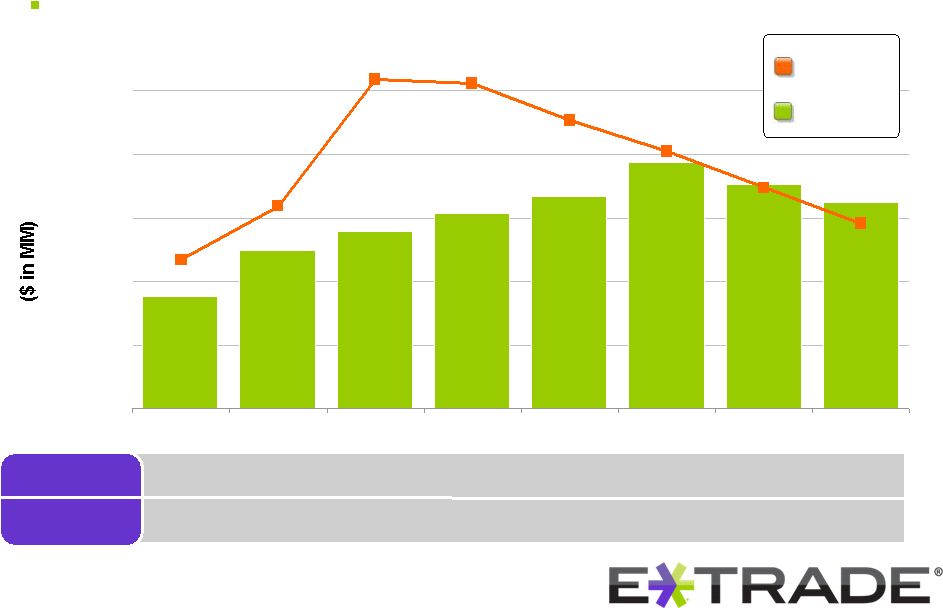
E*TRADE FINANCIAL Corporation’s written permission. 1.95% 29 Improving Loan Performance Trends 5.27% 4.91% 4.23% 3.31% 2.30% 5.66% 5.81% Allowance % of total gross loans $566 $1,219 $1,201 $1,081 $874 $636 $1,215 $1,183 Provision for loan losses Charge-offs Declining provisions below charge-offs $0 $100 $200 $300 $400 $500 Q1 08 Q2 08 Q3 08 Q4 08 Q1 09 Q2 09 Q3 09 Q4 09 |
 © 2010 E*TRADE FINANCIAL Corp. All rights reserved. This presentation contains confidential information and may not be disclosed without
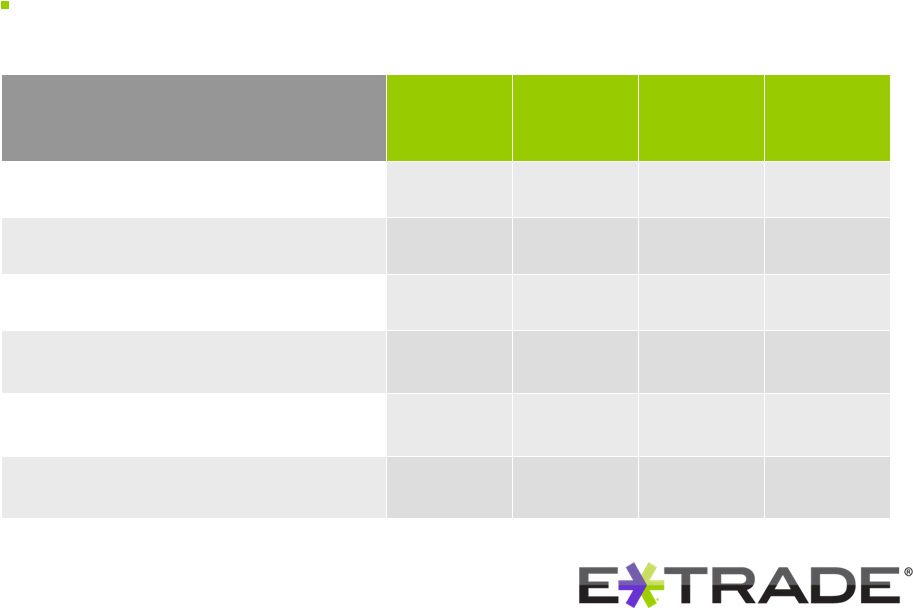
E*TRADE FINANCIAL Corporation’s written permission. 30 Improving Loan Performance Trends Generating regulatory capital to absorb loan loss provision ($ in millions) Q1 2009 Q2 2009 Q3 2009 Q4 2009 Bank earnings (11) $181 $232 $243 $247 Dividend to parent -- -- -- ($28) Loan run-off (12) $84 $101 $131 $81 Portfolio changes and other (12) ($82) $39 ($53) ($94) Provision for loan losses ($454) ($405) ($347) ($292) Net generation (usage) (13) ($271) ($33) ($26) ($86) |
 © 2010 E*TRADE FINANCIAL Corp. All rights reserved. This presentation contains confidential information and may not be disclosed without
E*TRADE FINANCIAL Corporation’s written permission. 31 Strengthened Financial Condition |
 © 2010 E*TRADE FINANCIAL Corp. All rights reserved. This presentation contains confidential information and may not be disclosed without
E*TRADE FINANCIAL Corporation’s written permission. Reduced parent debt burden Bolstered Bank capital ratios Improved consolidated capital structure Retained value of the deferred tax asset Eliminated uncertainty about long-term viability 32 Strengthened Financial Condition |
 © 2010 E*TRADE FINANCIAL Corp. All rights reserved. This presentation contains confidential information and may not be disclosed without
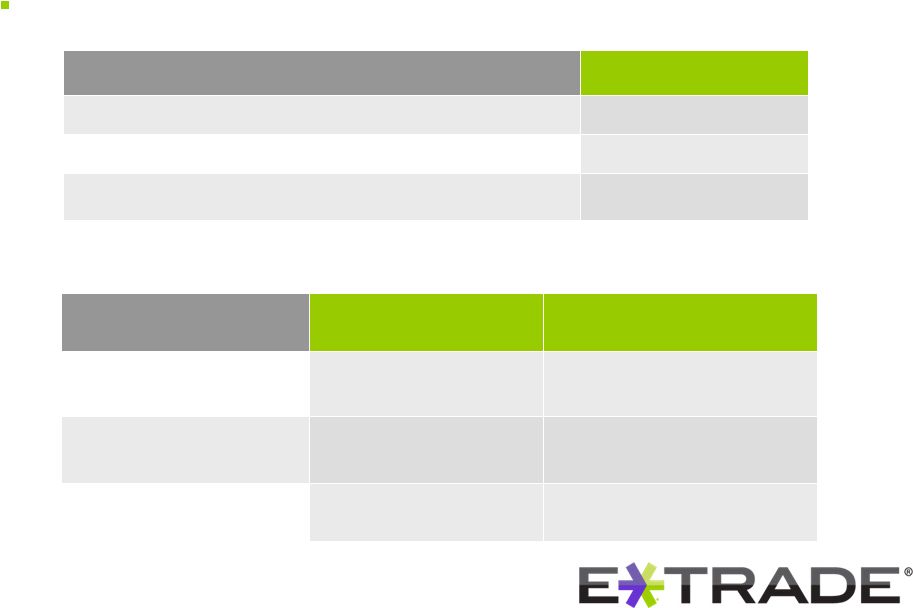
E*TRADE FINANCIAL Corporation’s written permission. 33 Strengthened Financial Condition Benefits from 2009 recapitalization as of
12/31/09 ($ in millions) Ratio Excess to well-capitalized Total capital to risk-weighted assets 14.1% $899 Tier I Capital to risk-weighted assets 12.8% $1,496 Tier I Capital to total adjusted assets 6.7% $724 2009 Recapitalization actions Net proceeds from stock issuance $733 million Debt exchanged for convertible $1.7 billion Annual interest payment reduction $198 million Bank capital |
 © 2010 E*TRADE FINANCIAL Corp. All rights reserved. This presentation contains confidential information and may not be disclosed without E*TRADE FINANCIAL Corporation’s written permission. 34 (in millions) 7 3/8% Due 2013 7 7/8% Due 2015 12 1/2% Due 2017 (15) Total Outstanding (14) $415 $243 $930 $1,591 Annual interest payments $31 $19 $116 $166 Strengthened Financial Condition Improved consolidated capital structure Interest-bearing debt (in billions) Shares Book value Common stock 1.894 $3.750 Convertible debt 0.987 $1.021 Total 2.881 $4.771 Corporate Cash (12/31): $393 million Goal: Maintain 2 years of debt service |
 © 2010 E*TRADE FINANCIAL Corp. All rights reserved. This presentation contains confidential information and may not be disclosed without
E*TRADE FINANCIAL Corporation’s written permission. $1.4 $3.6 $0.0 $1.0 $2.0 $3.0 $4.0 35 DTA Pre-tax Income Strengthened Financial Condition Substantial value in deferred tax asset Shelters approximately $3.6 billion of income from tax in future periods Approximately 19 years to utilize Approximately $1.4B Deferred Tax Asset |
 © 2010 E*TRADE FINANCIAL Corp. All rights reserved. This presentation contains confidential information and may not be disclosed without
E*TRADE FINANCIAL Corporation’s written permission. $0.9 $0.5 $0.0 $0.4 $0.8 $1.2 $1.6 36 Limited Not limited Strengthened Financial Condition Substantial value in deferred tax asset Total DTA: $1.4B Tax code 382 Limitation 382 Tax ownership change imposes an annual limitation on a portion of the Company’s DTA Limited to using $60 million per year, sheltering $155 million of income Remainder of DTA – only limited to Company’s ability to generate taxable income |
 © 2010 E*TRADE FINANCIAL Corp. All rights reserved. This presentation contains confidential information and may not be disclosed without
E*TRADE FINANCIAL Corporation’s written permission. 37 Conclusion Thriving Online Brokerage Business Improving Loan Performance Trends Strengthened Financial Condition |
 |
 © 2010 E*TRADE FINANCIAL Corp. All rights reserved. This presentation contains confidential information and may not be disclosed without
E*TRADE FINANCIAL Corporation’s written permission. 39 Appendix ($ in thousands) Q1 08 Q2 08 Q3 08 Q4 08 Q1 09 Q2 09 Q3 09 Q4 09 Operating expense 354,333 $ 318,543 $ 295,890 $ 321,449 $ 293,984 $ 329,226 $ 301,714 $ 318,405 $ Less: FDIC insurance premiums 8,859 7,592 7,721 7,086 12,712 42,129 19,993 19,424 Less: Facility restructuring and other exit activities 10,566 12,433 5,526 977 (112) 4,447 2,497 13,820 Total adjusted operating expense 334,908 $ 298,518 $ 282,643 $ 313,386 $ 281,384 $ 282,650 $ 279,224 $ 285,161 $ (6) Per share charges eliminated for certain market orders over 2,000 shares. (7) Account inactivity fees scheduled for elimination after the first quarter of 2009. (9) Represents unpaid principal balances. (10) Net paydowns includes paydowns on loans, as well as limited origination activity, home equity
advances, repurchase activity and transfers to real estate owned assets. Explanation of
Non-GAAP Measures and Certain Metrics Management believes that operating income (pre-credit cost) and bank earnings before taxes and before
credit losses are appropriate measures for evaluating the operating and liquidity performance of
the Company. Management believes that the elimination of certain items from the related GAAP measures is helpful to investors and analysts who may wish to use some or all of this information to analyze our current performance, prospects and valuation.
Management uses non-GAAP information internally to evaluate our operating performance in
formulating our budget for future periods. (1) U.S. DARTs are defined as transactions executed
on the Company’s domestic platforms. (2) References to “brokerage” in these metrics refer to activity on our domestic platforms and do
not include brokerage activity from our international local brokerage accounts. (4) The net new brokerage assets metrics treat asset flows between E*TRADE entities in the same manner as
unrelated third party accounts. (5) Total adjusted operating expense, excluding FDIC insurance premiums and facilities restructuring and
other exit activities expense is a non-GAAP measure useful to investors and analysts
as it is an indicator of recurring expenses that management considers when budgeting for future periods, as it presents a normalized operating environment (3) The attrition rate is calculated by dividing attriting (a) brokerage accounts, excluding international local accounts, by total brokerage accounts, excluding international local accounts for the previous period end. This measure is presented annually and on an
annualized basis (where it appears quarterly) (a) Attriting brokerage accounts: Gross new brokerage accounts, less net new brokerage accounts, excluding international local accounts (8) This presentation does not represent an offer of E*TRADE Securities. A current schedule of commissions and service fees is available on www.etrade.com under the “Pricing” section |
 © 2010 E*TRADE FINANCIAL Corp. All rights reserved. This presentation contains confidential information and may not be disclosed without
E*TRADE FINANCIAL Corporation’s written permission. 40 Appendix (a) The capital release from loan portfolio run-off includes the decrease in risk-based capital required for our one- to four-family, home equity and consumer loan portfolios. (b) Represents cash flows to and from the parent company. (c) Represents the capital impact related to changes in other risk-weighted assets.
Q4 2009 Q3 2009 Q2 2009 Q1 2009 Beginning E*TRADE Bank excess risk-based capital ($MM) 985 $ 911 $ 444 $ 715 $ Bank earnings before taxes and before credit losses 247 243 232 181 Provision for loan losses (292) (347) (405) (454) Loan portfolio run-off (a) 81 131 101 84 Margin decrease (increase) (37) (30) (69) 36 Capital downstream (upstream) (b) (28) 100 500 - Other capital changes (c) (57) (23) 108 (118) Ending E*TRADE Bank excess risk-based capital ($MM) 899 $ 985 $ 911 $ 444 $ Q4 2009 Q3 2009 Q2 2009 Q1 2009 Loss before income tax benefit and discontinued operations (128,530) $ (1,151,349) $ (211,496) $ (344,056) $ Add back: Non-bank loss before income tax benefit and discontinued operations (b) 80,286 1,032,910 71,731 84,525 Provision for loan losses 292,402 347,222 404,525 453,963 Gains on loans and securities, net (18,667) (41,979) (73,170) (35,290) Net impairment 21,412 19,229 29,671 18,783 Losses on early extinguishment of FHLB advances - 37,239 10,356 2,999 Bank earnings before taxes and before credit losses 246,903 $ 243,272 $ 231,617 $ 180,924 $ (a) Excess risk-based capital is the excess capital that E*TRADE Bank has compared to
the regulatory minimum well-capitalized threshold. (b) Non-bank loss represents all of the Company’s subsidiaries, including
Corporate, but excluding the Bank. (12) The portfolio changes from loan
run-off only includes the decrease in risk based capital required for our 1-4 family, home equity and consumer loan portfolios. This slide does not depict the capital impact related to changes in other risk-weighted assets (represented in ‘other’ line in the below chart), such as securities, and the impact of our provision for loan losses. (11) Bank earnings before taxes and before credit losses represents the pre-tax
earnings of E*TRADE Bank Holding Company (“Bank”) before discontinued operations, provision for loan losses, gains (losses) on loans and securities, net, net impairment and losses on early
extinguishment of FHLB advances. This metric shows the amount of earnings that the Bank, after accruing for the interest expense on its trust preferred securities, generates each
quarter prior to credit related losses, primarily provision and losses on securities. Management believes this non-GAAP measure is useful to investors and analysts as it is an indicator of the level of credit related losses the Bank can absorb without causing a decline in E*TRADE Bank’s excess risk-based capital(a). Below is a reconciliation of Bank earnings
before taxes and before credit losses from loss before income taxes and discontinued operations: |
| © 2010 E*TRADE FINANCIAL Corp. All rights reserved. This presentation contains confidential information and may not be disclosed without
E*TRADE FINANCIAL Corporation’s written permission. 41 Appendix (13) Net usage is calculated by adding the bank earnings and capital release from loan
run off and other then subtracting the loan loss provision. (14)Total
interest-bearing outstanding debt includes $3.6M of 8% Senior Notes due in 2011 that are not represented in the table. (15) Interest on the 12 ½% Springing Lien Notes may be paid in kind (PIK) through
May 2010. |
