Attached files
| file | filename |
|---|---|
| 8-K - FORM 8-K - PIONEER ENERGY SERVICES CORP | d8k.htm |
 Company Presentation March 2010 (NYSE AMEX: PDC) www.pioneerdrlg.com Exhibit 99.1 |
 2 Forward-looking Statements This presentation contains various forward-looking statements and information that are based on management’s current expectations and assumptions about future events. Forward-looking statements are generally accompanied by words such as “estimate,” “project,” “predict,” “expect,” “anticipate,” “plan,” “intend,” “seek,” “will,” “should,” “goal,” and other words that convey the uncertainty of future events and outcomes. Forward-looking information includes, among other matters, statements regarding the Company’s anticipated growth, quality of assets, rig utilization rate, capital spending by oil and gas companies, production rates, the Company's growth strategy, and the Company's international operations. Although the Company believes that the expectations and assumptions reflected in such forward-looking statements are reasonable, it can give no assurance that such expectations and assumptions will prove to have been correct. Such statements are subject to certain risks, uncertainties and assumptions, including, among others: general and regional economic conditions and industry trends; the continued strength of the contract land drilling industry in the geographic areas where the Company operates; decisions about onshore exploration and development projects to be made by oil and gas companies; the highly competitive nature of the contract land drilling business; the Company’s future financial performance, including availability, terms and deployment of capital; the continued availability of qualified personnel; changes in governmental regulations, including those relating to the environment; the political, economic and other uncertainties encountered in the Company's international operations and other risks, contingencies and uncertainties, most of which are difficult to predict and many of which are beyond our control. Should one or more of these risks, contingencies or uncertainties materialize, or should underlying assumptions prove incorrect, actual results may vary materially from those expected. Many of these factors have been discussed in more detail in the Company's annual reports on Form 10-K for the fiscal year ended December 31, 2008 and December 31, 2009 and quarterly reports on Form 10Q for the quarters ended March 31, 2009, June 30, 2009 and September 30, 2009. Unpredictable or unknown factors that the Company has not discussed in this presentation or in its filings with the Securities and Exchange Commission could also have material adverse effects on actual results of matters that are the subject of the forward-looking statements. All forward-looking statements speak only as the date on which they are made and the Company undertakes no duty to update or revise any forward-looking statements. We advise our shareholders to use caution and common sense when considering our forward looking statements. |
 Overview Ticker Symbol: PDC Market Cap: $403 million (March 5, 2010) Stock price: $7.45 (March 5, 2010) Average 3-month daily trading volume: 636,000 shares Public float: Approximately 54 million shares Employees: 1,700 Headquarters: San Antonio, Texas 3 |
 4 Pioneer Drilling Overview |
 Investment Considerations Rig fleet trading at a significant discount to replacement value Focused on protecting cash flow from softening gas prices 50% of working rigs on term contracts (1) 43% of working rigs in shale plays (1) 42% of working rigs drilling for oil (1) Balance sheet restructured for maximum flexibility and liquidity Continued organic growth opportunities in three core businesses: land drilling, well services and wireline 5 (1) Based on information provided in 4 quarter conference call and includes contracts beginning in April 2010. |
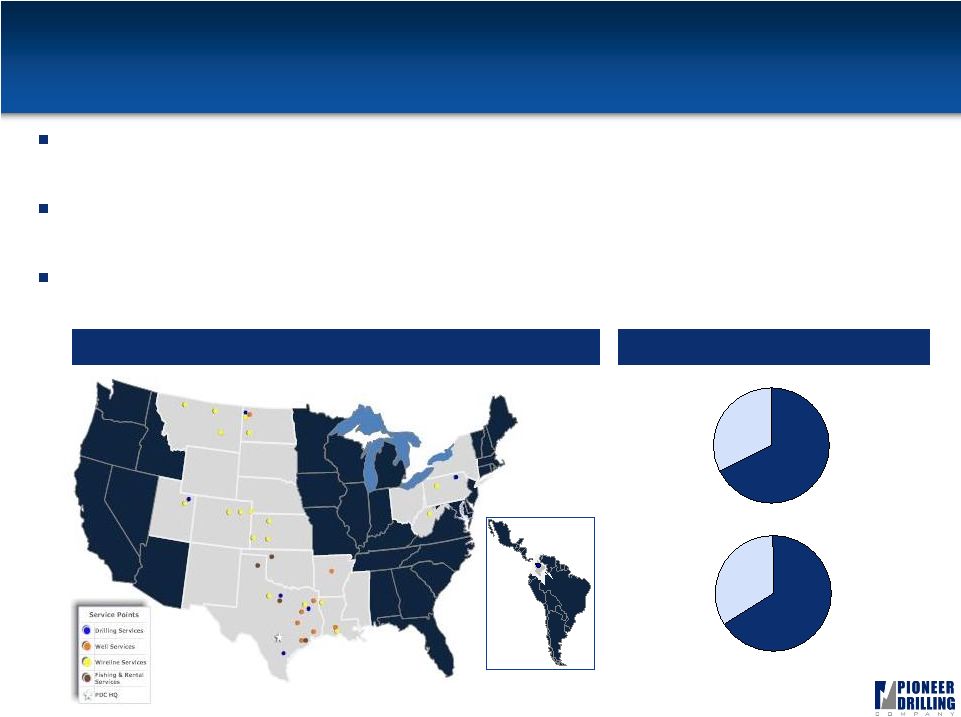 6 Colombia Overview of Pioneer 9th largest contract driller, 6th largest well services provider and a significant open hole wireline provider in the U.S. 71 high-quality and well-maintained land drilling rigs among the youngest in the
industry Best-in-class production services assets include 74 workover rigs and 65 wireline units Diversified Energy Services Provider 2009 Results 32% 68% 34% 66% Total Revenue: $326 million Total Segment Margin: $110 million Drilling Services Production Services Drilling Services Production Services |
 Corporate Strategy Focused on value-added organic growth in three core businesses: land drilling, well services and wireline Maintaining emphasis on new-build equipment and state-of-the-art
technology Focused on increasing mix of oil-driven business Continuing to pursue further international expansion Maintain leadership position in accident-free work environment 7 |
 Recent Developments 8 Focused on the most attractive shale plays and oil markets Position rigs to achieve highest risk-adjusted returns Balanced mix of oil and natural gas exposure Locking in rig utilization with term contracts Increased term contracts from 4 to 15 since beginning of year 5 more term contracts expected by April 6 of 8 rigs in Colombia are contracted for 3-year term contracts 5 rig sent to Marcellus in February 8 rig going to Colombia in March 8 rig going to Bakken in April th th th |
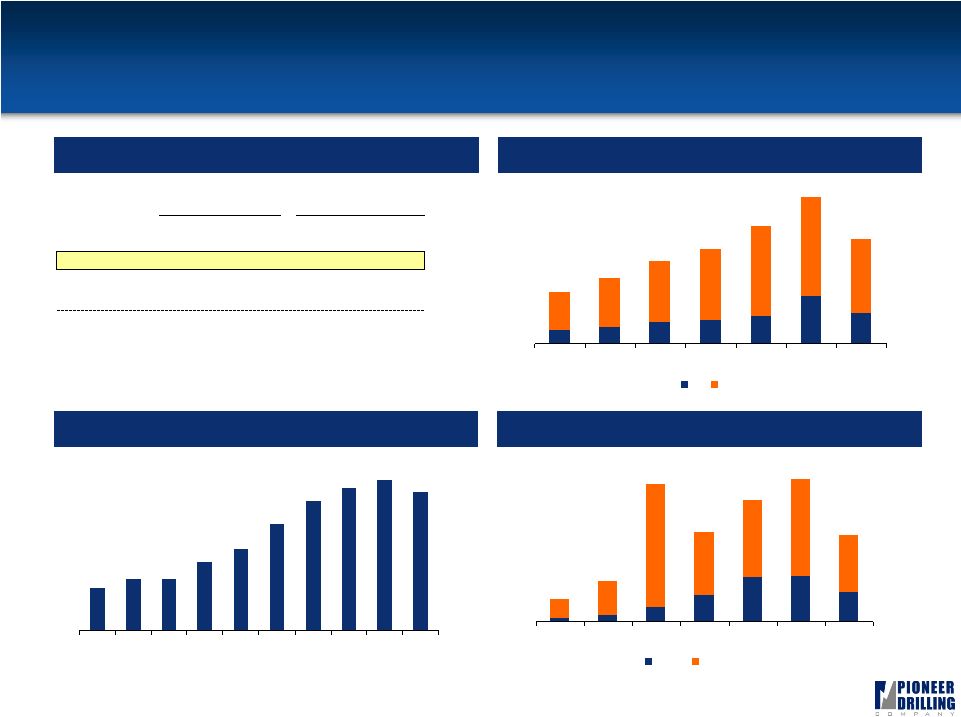
 40 52 61 71 70 66 0 10 20 30 40 50 60 70 80 2004 2005 2006 2007 2008 2009 Drilling Services-Segment Overview 9 Historical Fleet Growth Locations Current Rig Fleet Mix * Cold-stacked 15 rigs Avg HP: 1,040 South Texas 19 rigs Avg HP: 995 East Texas 58% 42% 49% 31% 20% Electric Mechanical 550-999 HP 1,000-1,499 HP 1,500-2,000 HP 8 rigs Avg HP: 1,281 North Dakota 5 rigs Avg HP: 888 North Texas 5 rigs Avg HP: 950 Utah 5 rigs Avg HP: 1,000 Appalachia 8 rigs Avg HP: 1,375 Colombia 6 rigs Avg HP: 600 Oklahoma* Note: Rig count for calendar years 2004, 2005 and 2006 represent fiscal year ended March 31, 2005, 2006
and 2007. |
 0% 20% 40% 60% 80% 100% Pioneer Helmerich & Payne Grey Wolf Patterson-UTI Nabors Precision 10 Strong Utilization Through the Cycles Averaged 85% utilization through cycles since 2001, comparing favorably to peers
Execution of risk-reducing strategy achieved through customer focus and asset
quality Utilization has rebounded from a monthly low of 33% in June 2009 to 56% currently (1) Comparable Utilization Rates (1) Source: Helmerich & Payne, Grey Wolf, Patterson-UTI, & Precision Drilling data consists of
U.S. domestic utilization rates derived from Form 10-K, Form 10-Q reports, & press releases. Nabors utilization rates for worldwide land fleet obtained from public documents and industry analysts. Precision Drilling acquired Grey Wolf in
December 2008. Pioneer Drilling utilization rates include Colombian operations beginning Q3 2007. (1) PDC utilization as of February 16, 2010. |
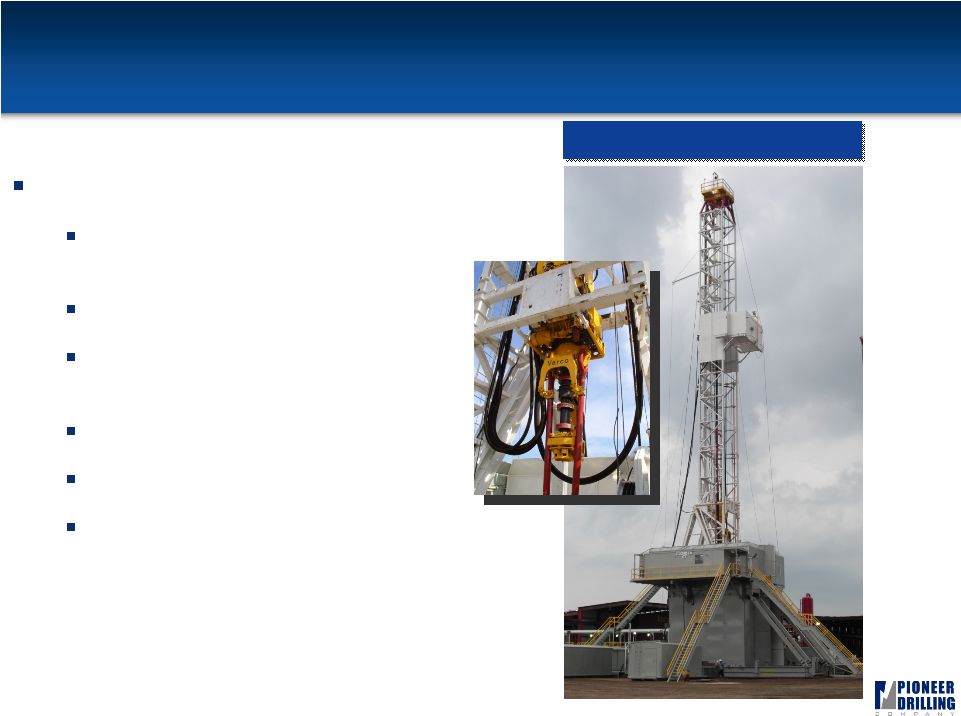 11 Modern, Efficient Drilling Fleet Over 75% of fleet is shale capable 31 new builds (44%) since 2001 with most constructed during 2004 - 2006 69% with 1,000 HP - 2,000 HP 23 rigs with top drives (32%) with another eight on order (44%) 62% with iron roughnecks 42% electric 55% with mobile or fast-pace subs 50 Series Rig 50 Series Rig |
 60
Series Rig 12 Mast Traveling Equipment Mud Tanks Handling Equipment Drawworks Mud Pumps Mud Cleaning Equipment Pipe Racks Accumulator Gas Buster Choke Manifold SCR House Fuel-Water Tank Power Package Suitcases |
 66% Workover Fleet Overview 13 One of the newest and most highly capable workover fleets in the industry Sixty-nine 550 HP rigs and four 600 HP rigs with an average age of 2.4 years Initial entry via WEDGE acquisition in 2008 with subsequent expansion into the Bakken, Fayetteville, Haynesville and Eagle Ford shales Workover Fleet Age Workover Locations Average year in service: 2007 66% 2007 or newer 31% 3% Williston Bryan Palestine Longview New Iberia El Campo Liberty Kenedy Conway Laurel 2005-2006 2002-2004 |
 Wireline and Fishing & Rental Overview 14 Wireline Services Open and cased-hole wireline services 65 trucks with an average age of 4.3 years Initial entry via WEDGE acquisition with subsequent expansion into the Barnett, Marcellus and Haynesville shales Fishing & Rental Services Range of specialized services and equipment that are utilized on a non- routine basis for both drilling and well servicing operations Overview Locations Williston Dickinson Cut Bank Billings Havre Tyler Bossier City Broussard Graham Alvarado Roosevelt Pratt Liberal Hays Casper Buckhannon Punxsutawney Ft. Morgan Brighton Wray Woodward Pampa Springtown El Campo Wireline Fishing & Rental |
 Blue Chip Customers & Strong Safety Record 15 Key component of employee culture Strengthens customer relationships Consistently beat the IADC average for recordable incidents Total recordable incident rate decreased 65% since 2005 Earned 100% Health, Safety, Environment & Quality (HSEQ) score from Ecopetrol Safety Long-standing Relationships |
 16 Industry and Market Conditions |
 Recovery in U.S. Land Rig Count 1 17 Steady rig count improvement during the second half of 2009 and 2010 YTD Horizontal and oil rig counts have returned to Fall 2008 peak levels Land Rig Count Horizontal & Oil Rig Count Source: Baker Hughes. Source: Baker Hughes. 600 1,000 1,400 1,800 2,200 Jan-07 Jul-07 Jan-08 Jul-08 Jan-09 Jul-09 Jan-10 (5.0%) (2.5%) 0.0% 2.5% 5.0% Land Rigs BHI Rolling 4-week Avg. Weekly Change 0 200 400 600 800 Jan-07 Jul-07 Jan-08 Jul-08 Jan-09 Jul-09 Jan-10 U.S. Horizontal Rig Count U.S. Oil Rig Count Horizontal Fall ’08 Peak: 650 Current: 658 Oil Fall ’08 Peak: 442 Current: 440 |
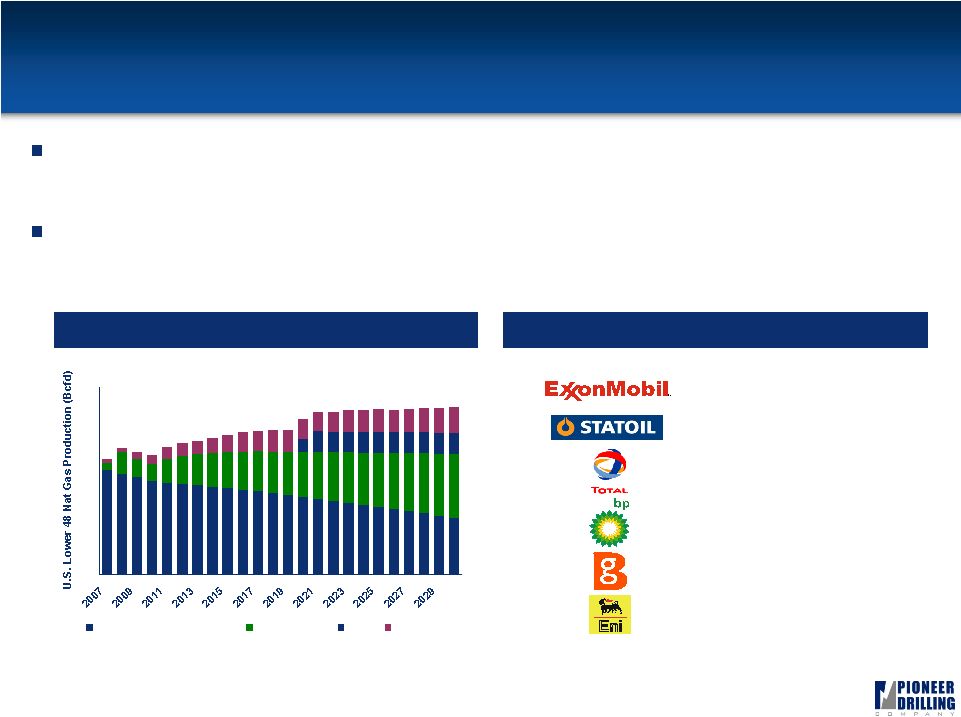 $40,991 Million 12/14/2009 $3,375 Million 11/11/2008 $2,250 Million 12/30/2009 $1,900 Million 9/2/2008 $1,050 Million 6/30/2009 $280 Million 5/8/2009 30 35 40 45 50 55 60 65 70 75 80 Base Production (all sources) Unconventional Alaska LNG Imports Benefits of Growing Shale Plays 1 18 Service firms stand to benefit from shale production due to its lower risk development and increased service intensity (up to 3 - 5x conventional) Reintroduction of the Majors should provide increased capital discipline in the U.S. market, resulting in greater stability and shallower cycles Recent U.S. Shale Investments Source: Base production, Alaska, and LNG import data – EIA AEO 2008. Growing Importance of Shale |
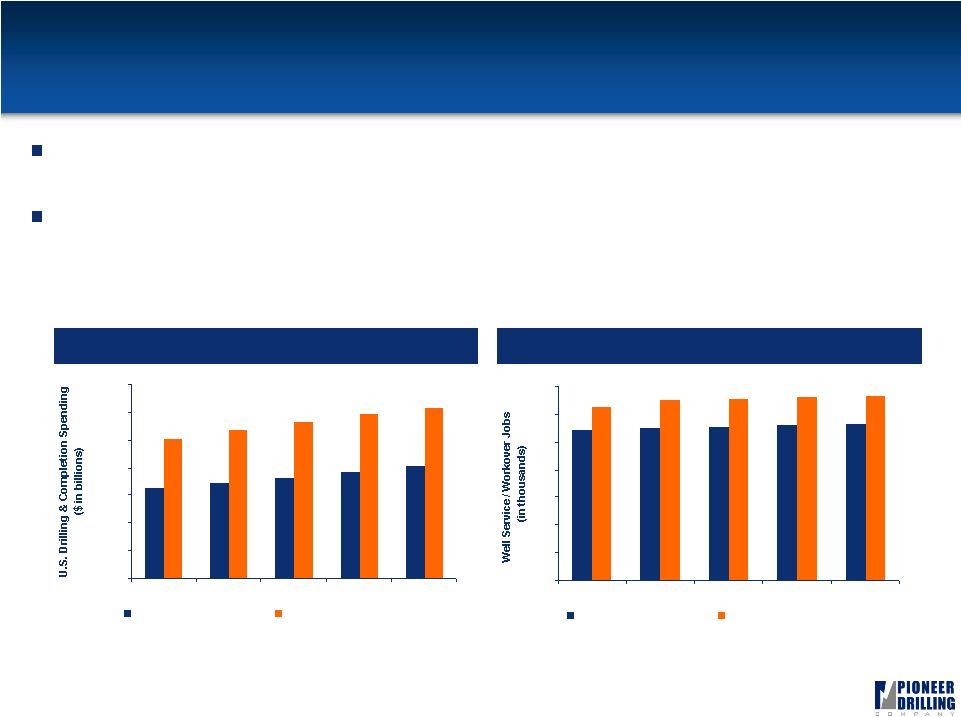 Conclusion: Improving Oil Service Outlook 1 19 North American oilfield services pricing and activity appear to have bottomed Most analysts expect a moderate recovery in upstream spending and drilling activity over the next few years Upstream Spending Outlook Well Service / Workover Jobs Outlook Source: Spears & Associates. Source: Spears & Associates. 62.6 65.0 65.5 65.9 66.3 56.3 54.2 54.9 55.4 55.9 0 10 20 30 40 50 60 70 2010 2011 2012 2013 2014 June 2009 Estimate December 2009 Estimate $100.3 $107.0 $112.6 $118.5 $123.1 $76.8 $72.8 $68.9 $65.1 $81.0 $- $20 $40 $60 $80 $100 $120 $140 2010 2011 2012 2013 2014 June 2009 Estimate December 2009 Estimate |
 17.8% 19.5% 20.4% 21.1% 20.2% 15.0% 13.8% 13.8% 13.2% 16.0% 2000 2001 2002 2003 2004 2005 2006 2007 2008 2009 3.4 2.2 2.5 9.1 4.7 5.7 7.2 4.2 2.0 1.1 0.5 0.3 3.3 1.4 2003 2004 2005 2006 2007 2008 YTD Sept 09 Oil FDI Other FDI $1.7 $3.0 $10.3 $6.7 $9.0 $10.6 $6.4 8.0 9.7 12.6 15.6 18.1 22.7 25.4 18.8 12.2 6.3 5.6 4.2 3.4 7.3 2003 2004 2005 2006 2007 2008 YTD Oct 09 Oil Others $13.1 $16.8 $21.2 $24.4 $30.0 $37.6 $26.8 Source: DANE (National Bureau of Statistics). Colombia: Strong, Growing Country 1 20 Investment (% GDP) Foreign Direct Investment ($ in billions) World Bank Business Rankings Exports ($ in billions) Source: The World Bank Group (Ease of Doing Business), EIA. S. & Central America 2008 Production Business Rank MBoe/d Puerto Rico 1 1 St. Lucia 2 0 Colombia 3 601 Chile 4 11 Antigua 5 0 Argentina 23 792 Brazil 26 2,422 Ecuador 27 505 Venezuela 32 2,643 Source: Banco de la Republica (Central Bank). Source: DANE (National Bureau of Statistics). |
 21 Financials |
 High Yield Highlights Priced an offering for $250MM of senior unsecured notes due 2018 Yield of 10.677% (coupon 9.875%) Scheduled to close March 11 th Will utilize proceeds to pay down revolver from $258MM to $23MM High yield offering positive impact Improved capital expenditure flexibility Total revolver availability will increase from $58MM to $202MM (1) Extended debt maturity profile Concurrent with the closing of the notes offering, a second amendment to the credit facility will become effective Will reduce credit facility commitments to $225MM Will eliminate excess cash flow recapture provision 22 (1) Excludes approximately $11.5MM in letters of credit outstanding.
|
 Pro Forma Capitalization 23 ($ in millions) Actual Pro Forma 12/31/2009 Adjustments 12/31/2009 Cash $ 40.4 $ 40.4 Revolving Credit Facility ($325 / $225)(1) 257.5 (234.8) 22.7 New Sr. Unsecured Notes - 239.4 239.4 Other 4.6 4.6 Total Debt $ 262.1 $ 266.7 Stockholders' Equity 421.4 421.4 Total Capitalization $ 683.6 $ 688.2 Total Liquidity(2) $ 96.4 $ 242.7 LTM EBITDA $ 74.9 $ 74.9 Debt / LTM EBITDA 3.5x 3.6x Debt / Total Book Capitalization 38.3% 38.8% (1) Excludes $11.5 million of LCs outstanding. (2) Cash + revolver availability. Revolver capacity reduced from $325 million to $225 million with
transaction's repayment and bank amendment. |
 24 $163 $257 $396 $417 $610 $326 $0 $150 $300 $450 $600 $750 2004 2005 2006 2007 2008 2009 $32 $90 $177 $145 $215 $75 $0 $50 $100 $150 $200 $250 2004 2005 2006 2007 2008 2009 Consolidated Revenue & EBITDA Revenue ($ millions) EBITDA ($ millions) Note: Fiscal year end was changed from March 31 to December 31 effective on December 31, 2007; all data points reflect calendar year information derived from 10K and 10Q filings. |
 $416 $417 $220 $457 $185 $284 33% 41% 40% 46% 42% 25% $0 $150 $300 $450 $600 $750 2004 2005 2006 2007 2008 2009 0% 10% 20% 30% 40% 50% Revenue % Gross Margin 25 Segment Financials – Drilling Services Avg Number of Rigs and Utilization Revenues and Op Costs per Day Revenue and Division Margin Capex and D&A 71 40 52 61 71 67 66 56% 41% 96% 95% 95% 89% 89% 0 20 40 60 80 100 2004 2005 2006 2007 2008 2009 Current 0% 20% 40% 60% 80% 100% Average Number of Rigs Utilization $13 $16 $20 $19 $21 $21 $9 $14 $12 $10 $12 $11 $0 $5 $10 $15 $20 $25 2004 2005 2006 2007 2008 2009 Revenue per Day Daily Operating Costs $80 $129 $147 $154 $107 $95 $81 $23 $34 $53 $64 $66 $0 $40 $80 $120 $160 $200 2004 2005 2006 2007 2008 2009 Capex Depreciation & Amortization (2) (1) Note: Calendar year 2004, 2005 and 2006 data represent fiscal year ended March 31, 2005, 2006 and
2007, respectively. The Company revised the fiscal year to end December 31 as of 2007. (1)
Utilization as of February 16, 2010. (2) Excludes WEDGE acquisition.
|
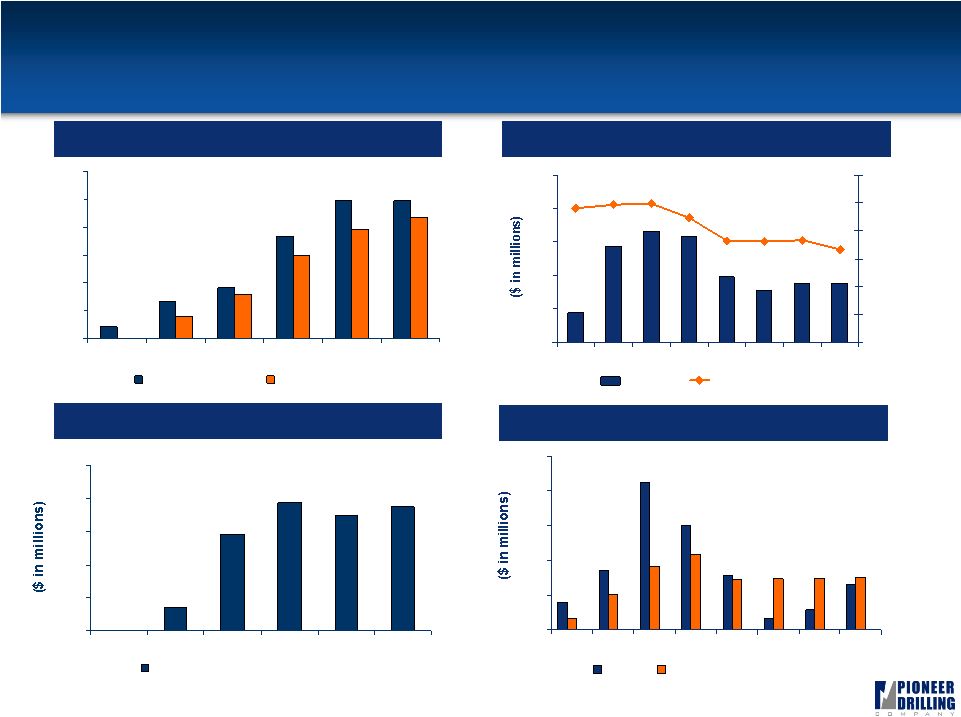 $0 $3 $12 $16 $14 $15 $0 $4 $8 $12 $16 $20 2004 2005 2006 2007 2008 2009 Gross Book Value of Equipment $3 $7 $17 $12 $6 $6 $6 $5 $2 $1 $6 $9 $6 $1 $4 $7 $0 $4 $8 $12 $16 $20 Q108 Q208 Q308 Q408 Q109 Q209 Q309 Q409 Capex Depreciation & Amortization $13 $43 $50 $29 $23 $26 $27 $47 50% 48% 49% 36% 36% 37% 45% 33% $0 $15 $30 $45 $60 $75 Q108 Q208 Q308 Q408 Q109 Q209 Q309 Q409 0% 10% 20% 30% 40% 50% 60% Revenue % Gross Margin 74 74 55 27 20 6 65 59 45 24 12 0 0 15 30 45 60 75 90 2004 2005 2006 2007 2008 2009 Workover Rigs Wireline Units 26 Segment Financials – Production Services Workover Rigs and Wireline Units Revenue and Division Margin Capex and D&A (1) (1) Fishing and Rental Services Note: Information for the years 2004 to 2007 represents workover rig and wireline unit counts and fishing
and rental tool inventory values when the Production Services business was owned by WEDGE Group. (1) Production Services segment was purchased from WEDGE in March 2008. |
 27 Appendix |
 28 Reconciliation of EBITDA to Net Income We define EBITDA as earnings (loss) before interest income (expense), taxes, depreciation, amortization and impairments. Although not prescribed under GAAP, we
believe the presentation of EBITDA is relevant and useful because it helps
our investors understand our operating performance and makes it easier to
compare our results with those of other companies that have different
financing, capital or tax structures. EBITDA should not be considered in
isolation from or as a substitute for net earnings (loss) as an indication of operating performance or cash flows from operating activities or as a measure of liquidity. A reconciliation of net earnings (loss) to EBITDA is included in the table
below. EBITDA, as we calculate it, may not be comparable to EBITDA measures
reported by other companies. In addition, EBITDA does not represent funds
available for discretionary use. Year ended December 31, ($ in millions) 2004 2005 2006 2007 2008 2009 EBITDA 31.7 90.3 176.6 144.5 214.8 74.9 Depreciation & Amortization (20.6) (30.8) (47.6) (63.6) (88.1) (106.2) Net Interest (1.9) 0.8 3.6 3.3 (11.8) (8.9) Impairment Expense - - - - (171.5) - Income Tax (Expense) Benefit (3.4) (22.1) (47.7) (27.3) (6.1) 17.0 Net Income (Loss) 5.7 38.1 84.8 56.9 (62.7) (23.2) |
 29 |