Attached files
UNITED STATES
SECURITIES AND EXCHANGE COMMISSION
Washington, D.C. 20549
FORM 10-K
(Mark one)
| þ | Annual Report Pursuant to Section 13 or 15(d) of the Securities Exchange Act of 1934 |
| For the Fiscal Year Ended December 31, 2009 |
Or
| ¨ | Transition Report Pursuant to Section 13 or 15(d) of the Securities Exchange Act of 1934 |
| For the transition period from to |
Commission File Number: 0-22248
ULTRATECH, INC.
(Exact name of registrant as specified in its charter)
| Delaware (State or other jurisdiction of incorporation or organization) |
94-3169580 (I.R.S. Employer Identification No.) | |
| 3050 Zanker Road San Jose, California (Address of principal executive offices) |
95134 (Zip Code) | |
(408) 321-8835
(Registrant’s telephone number, including area code)
Securities registered pursuant to Section 12(b) of the Act:
None
Securities registered pursuant to Section 12(g) of the Act:
Common Stock, $0.001 Par Value Per Share
Indicate by check mark if the Registrant is a well-known seasoned issuer, as defined in Rule 405 of the Securities Act. Yes ¨ No þ
Indicate by check mark if the Registrant is not required to file reports pursuant to Section 13 or Section 15(d) of the Act. Yes ¨ No þ
Indicate by check mark whether the Registrant (1) has filed all reports required to be filed by Section 13 or 15(d) of the Securities Exchange Act of 1934 during the preceding 12 months (or for such shorter period that the Registrant was required to file such reports), and (2) has been subject to such filing requirements for the past 90 days. Yes þ No ¨
Indicate by check mark whether the registrant has submitted electronically and posted on its corporate Web site, if any, every Interactive Data File required to be submitted and posted pursuant to Rule 405 of Regulation S-T (§ 232.405 of this chapter) during the preceding 12 months (or for such shorter period that the registrant was required to submit and post such files). Yes ¨ No ¨
Indicate by check mark if disclosure of delinquent filers pursuant to Item 405 of Regulation S-K (§ 229.405) is not contained herein, and will not be contained, to the best of Registrant’s knowledge, in definitive proxy or information statements incorporated by reference in Part III of this Form 10-K or any amendment to this Form 10-K. þ
Indicate by check mark whether the Registrant is a large accelerated filer, an accelerated filer, or a non-accelerated filer, or a smaller reporting company. See the definitions of “large accelerated filer,” “accelerated filer” and “smaller reporting company” in Rule 12b-2 of the Exchange Act. (Check one):
| Large accelerated filer ¨ | Accelerated filer þ | Non-accelerated filer ¨ (Do not check if a smaller reporting company) |
Smaller reporting company ¨ |
Indicate by check mark whether the Registrant is a shell company (as defined in Rule 12b-2 of the Exchange Act). Yes ¨ No þ
The aggregate market value of voting stock held by non-affiliates of the Registrant, as of July 2, 2009, was approximately $186,925,812 (based upon the closing price for shares of the Registrant’s common stock as reported by the NASDAQ Global Market on that date, the last trading date of the Registrant’s most recently completed second quarter). Shares of common stock held by each officer, director and holder of 5% or more of the outstanding common stock have been excluded in that such persons may be deemed to be affiliates. This determination of affiliate status is not necessarily a conclusive determination for other purposes.
As of February 23, 2010, the Registrant had 23,849,349 shares of common stock outstanding.
DOCUMENTS INCORPORATED BY REFERENCE
Portions of the Registrant’s Proxy Statement for the 2010 Annual Meeting of Stockholders are incorporated by reference into Part III of this Annual Report on Form 10-K.
2
PART I
ITEM 1. BUSINESS
This Annual Report on Form 10-K contains, in addition to historical information, certain forward-looking statements that involve significant risks and uncertainties, which are difficult to predict, and are not guarantees of future performance. Such statements can generally be identified by words such as “anticipates,” “expects,” “intends,” “will,” “could,” “believes,” “estimates,” “continue,” and similar expressions. Our actual results could differ materially from the information set forth in any such forward-looking statements. Factors that could cause or contribute to such differences include those discussed below, as well as those discussed under “Item 1A Risk Factors” and elsewhere in this Annual Report on Form 10-K.
The Company
Ultratech, Inc. (“Ultratech” or “we”) develops, manufactures and markets photolithography and laser thermal processing equipment designed to reduce the cost of ownership for manufacturers of integrated circuits, including advanced packaging processes and various nanotechnology components, thin film head magnetic recording devices (“thin film heads” or “TFHs”), optical networking devices, laser diodes and high-brightness light emitting diodes (“HBLEDs”).
Lithography
We supply step-and-repeat photolithography systems based on one-to-one (“1X”) imaging technology to customers located throughout North America, Europe, Japan and the rest of Asia. We believe that our 1X steppers utilizing the Wynne Dyson optical design offer cost and performance advantages, as compared with competitors’ contact aligners or reduction steppers, to semiconductor device manufacturers for applications involving line geometries of 0.75 microns or greater (“non-critical feature sizes”) and to nanotechnology manufacturers.
Advanced packaging for integrated circuits, specifically bump or wafer level chip scale packaging (“WLCSP”) techniques, require lithography steps in the device fabrication process. We continue to enhance our product offerings for bump, WLCSP processing and post passivation lithography (“PPL”). Our steppers are used to manufacture high volume, low cost semiconductors used in a variety of applications such as telecommunications, automotive control systems, power systems and consumer electronics. We also supply 1X photolithography systems to thin film head manufacturers and believe that our steppers offer advantages over certain competitive reduction lithography tools with respect to field size, throughput, specialized substrate handling and cost. Additionally, we supply 1X photolithography equipment to various other nanotechnology markets where certain technical features, such as high resolution at gh-line wavelengths, depth of focus and special size substrates, may offer advantages over certain competing tools.
Laser Anneal Technology
Device scaling has been the predominant means pursued by the semiconductor industry to achieve the gains in productivity and performance quantified by Moore’s Law. In the past several years, scaled device performance has been compromised because traditional transistor materials, such as silicon, silicon dioxide, and polysilicon, have been pushed to their fundamental materials limits. Continued scaling thus requires the introduction of new materials. For example, the traditional gate dielectric has been silicon dioxide, and as devices are scaled below 45 nanometers (nm), high K material such as hafnium oxide must be considered because silicon dioxide begins to lose its effectiveness at levels below 45 nm. These new materials impose added challenges to the methods used to dope and activate silicon to produce very shallow, highly activated junctions. The main challenges regarding short channel effects include achieving maximum activation and minimal diffusion with abrupt junctions.
By leveraging our core competencies in optics engineering and system integration and our extensive knowledge of laser processing, we introduced the LSA100A laser spike annealing system to enable thermal annealing solutions at the 65 nm technology node and below. This advanced annealing technology provides solutions to the difficult challenge of fabricating ultra-shallow junctions and highly activated source/drain contacts. Laser processing offers the flexibility to operate at near-instantaneous timeframes (microseconds to milliseconds) at temperatures below the melting point of silicon (1412° C). At these temperatures and anneal times, full activation is achieved with negligible diffusion. In addition, our proprietary hardware design minimizes the pattern density effect, reducing absorptivity variations.
Our products and markets are more fully described below.
3
General Background
The fabrication of devices such as integrated circuits (“semiconductors” or “ICs”) requires a large number of complex processing steps, including deposition, photolithography and etching.
Deposition is a process in which a layer of either electrically insulating or electrically conductive material is deposited on the surface of a wafer. Typically deposition is followed by the photolithography imaging process in which the deposited layer is coated with a photosensitive layer called photoresist or resist. Exposure of the resist to an image formed by ultraviolet light, followed by development, results in some of the resist being removed. A subsequent etching step selectively removes the deposited material from areas not protected by the remaining resist pattern.
Photolithography is one of the most critical and expensive steps in IC device manufacturing. Photolithography exposure equipment is used to create device features by patterning a light-sensitive polymer coating on the wafer surface using a photomask containing the master image of a particular device layer. Typically, each exposure results in the patterning of a different deposited layer, and therefore requires a different pattern on the device. Each new device layer must be properly aligned to previously defined layers before imaging takes place, so that structures formed on the wafers are correctly placed, one on top of the other, in order to ensure a functioning device.
Since the introduction of the earliest commercial photolithography tools for IC manufacturing in the early 1960s, a number of tools have been introduced to enable manufacturers to produce ever more complex devices that incorporate progressively finer line widths. In the early 1970s, photolithography tools included contact printers and proximity aligners, which required the photomask to physically contact or nearly contact the wafer in order to transfer the entire pattern during a single exposure. By the mid 1970s, there were also projection scanners, which transferred the device image through reflective optics having a very narrow annular field that spanned the width of the wafer. Exposure was achieved by scanning the entire photomask and wafer in a single, continuous motion across the annular field. Scanners were followed by steppers, which expose a rectangular area or field on the wafer containing one or more chip patterns in a single exposure, then move or “step” the wafer to an adjacent site to repeat the exposure. This stepping process is repeated as often as necessary until the entire wafer has been exposed. By imaging a small area, steppers are able to achieve finer resolution, improved image size control and better alignment between the multiple device layers resulting in higher yield and higher performance devices than was possible with earlier tools.
The two principal types of steppers currently in use by the semiconductor industry are reduction steppers, which are the most widely used steppers, and 1X steppers. Reduction steppers, which typically have reduction ratios of four- or five-to-one, employ photomask patterns that are four or five times larger than the device pattern that is to be exposed on the wafer surface. In addition, there is now a fourth generation of lithography tools, known as step-and-scan systems, that address device sizes of 0.35 micron and below. In contrast to steppers, which require lenses that cover the entire field, step-and-scan optical systems have an instantaneous field just large enough to span the width of a field and employ scanning to stretch coverage over the entire field. Each scan is followed by re-registration of the wafer with respect to the mask, i.e. “stepping”, to create multiple fields covering the entire wafer. The smaller instantaneous field size of step-and-scan system projection optical systems allows them to resolve finer geometries and scanning allows them to cover larger fields.
The principal advantage of reduction steppers and step-and-scan systems is that they may be used in manufacturing steps requiring critical feature sizes and are therefore necessary for manufacturing advanced ICs. 1X steppers, on the other hand, employ photomask patterns that are the same scale as the device pattern that is exposed on the wafer surface. The optical projection system, employed in our 1X steppers is based on a Wynne Dyson design, which uses both a reflective mirror and refractive lens elements. This design approach leads to a very simple and versatile optical system that is less expensive than those employed in reduction steppers. Because our 1X optical design covers a much broader spectral range than reduction steppers, it delivers a greater proportion of the exposure energy from the lamp to the wafer surface. Depending on the size of the lamp used and the exposure energy required for an application, this can result in appreciably higher throughput. Resolution considerations currently limit 1X steppers to manufacturing steps involving less-critical, larger feature sizes. Accordingly, we believe that sales of these systems are highly dependent upon capacity expansions by our current 1X customers, or by customers making the transition to chips containing “bump” connections, that facilitate the use of higher data rates and a higher number of connections.
In the past, manufacturers of ICs and similar devices purchased capital equipment based principally on performance specifications. In view of the significant capital expenditures required to construct, equip and maintain advanced fabrication facilities, relatively short product cycles and manufacturers’ increasing concern for overall fabrication costs, we believe that focus has shifted to the total cost of ownership. Cost of ownership includes the costs associated with the acquisition of equipment, as well as components based on throughput, yield, up-time, service, labor overhead, maintenance, and various other costs associated with owning and using the equipment. As a result, in many cases the most technologically advanced system will not necessarily be the manufacturing system of choice.
4
In addition to enhancing our current lithography solutions, we have been developing new tools to serve new markets such as advanced annealing. The LSA100A tool is aimed at volume production of advanced state of the art devices. These products, based on the same platform and stage technology as our advanced lithography tools, employ a 3500 Watt carbon dioxide laser to activate ultra-shallow, transistor junctions. Annealing times are reduced from several seconds, typical for the current generation of Rapid Thermal Processing equipment, to a millisecond or less. This results in more abrupt junctions with higher dopant activation levels and leads to transistors with higher drive currents and lower leakage. While this technology is expected to be useful for multiple IC generations, we anticipate that eventually this technology will be superseded by a laser processing technology that will exceed the melting point of silicon (1412°C) and reduce the processing time below one microsecond, thereby achieving even higher performance characteristics with almost “zero” thermal budget. We believe these new laser thermal processing technologies—for which we have been awarded 83 patents and have 38 patent applications pending—remove several critical barriers to future device scaling and will help to extend Moore’s Law well into the future.
Products
We currently offer two different series of 1X lithography systems for use in the semiconductor fabrication process: the 1000 Family, which addresses the markets for high volume/low cost semiconductor fabrication and R&D packaging activities and nanotechnology applications; and the AP series, which were designed to meet the requirements in the advanced packaging market. These steppers currently offer minimum feature size capabilities ranging from 2.0 microns to 0.75 microns.
For the advanced packaging market, we offer our AP series built on the Unity Platform®. These advanced packaging systems were developed for high volume bump and WLCSP manufacturing and post passivation lithography applications. They provide broadband or selective exposure (g, h or i-line), and are used in conjunction with downstream processes to produce a pattern of bumps, or metal connections, on the bond pads of the die for flip chip devices. Using flip chip interconnect offers reduced signal inductance, reduced power/ground inductance, die shrink advantages and reduced package footprint.
The AP series, consisting of the AP300 and AP200, are built on our Unity Platform and feature a customer-configurable design that supports flexible manufacturing requirements as well as tool extendibility for multiple device generations. Designed to optimize productivity, the AP systems integrate the processing advantages associated with our advanced packaging lithography equipment with the productivity benefits of our new Unity Platform. We believe that these new lithography systems support a lower cost-of-ownership strategy due to significant throughput enhancements, higher reliability, and superior alignment and illumination systems.
The 1000 family is a small field system available with gh-line, i-line and broadband ghi-line illumination options. In semiconductor applications, we offer the Star 100. This platform is typically used in the manufacture of power devices, ASICs, analog devices and compound semiconductors. In addition, this platform is well suited for a number of nanotechnology applications.
Nanotechnology manufacturing combines electronics with mechanics in small devices. We have defined a nanotechnology device as a device that has at least one dimension in the XYZ direction less than 0.1 microns. Examples include accelerometers used to activate air bags in automobiles and membrane pressure sensors used in industrial control systems. These micro-machined devices are manufactured on silicon substrates using photolithography techniques similar to those used for manufacturing semiconductors and thin film head devices. In addition, these systems are used in applications such as HBLEDs and laser diodes. In 2002, we introduced the NanoTech systems.
The NanoTech systems utilize a platform based on the previous 1000 Series steppers, incorporating an optional Dual Side Alignment (“DSA”) capability for applications requiring lithography on both sides of a wafer, to provide customers with a 1X stepper solution for this special processing requirement. The NanoTech steppers also have enhanced capabilities directed at TFH backend, or rowbar processing applications. These steppers are used to expose the Air Bearing Surface (“ABS”) patterns on rowbars. We believe that our NanoTech steppers offer resolution and depth of focus advantages over alternative technologies to the manufacturers of nanotechnology components.
In addition to selling new systems, we sell upgrades to systems in our installed base and refurbished systems. These refurbished systems typically have a purchase price that is lower than the purchase price for our new systems.
We offer an advanced laser-based thermal annealing tool, the LSA100A, built on our Unity Platform. Thermal annealing is used by the semiconductor industry for a variety of process steps, including activation of implanted impurities, dielectric film formation, formation of silicides and stabilization of copper grain structures. Annealing tools currently in use by manufacturers of semiconductor devices are furnaces and rapid thermal annealing, or Rapid Thermal Processing (“RTP”), systems. We believe there is a need for tools that anneal at higher temperatures for shorter periods of time and that our future
5
laser annealing tools may ultimately provide this capability to the industry. The near-term application of our laser-based thermal annealing tools is anticipated to be in the area of source/drain dopant activation. However, we are also researching the use of these tools for other applications. In 2009 we shipped and recognized revenue from sales of production systems to multiple customers.
Our current systems are set forth below:
| Product Line | Wavelength | Minimum Feature Size (microns) | ||
| 1X Steppers: |
||||
| Star 100™ |
i-line, gh-line | 0.8 - 1.0 | ||
| NanoTech 160 |
i-line, gh-line, ghi-line | 0.8 - 2.0 | ||
| NanoTech 190 |
ghi-line | 1.0 - 2.0 | ||
| Prisma-ghi |
ghi-line | 2.0 - 4.0 | ||
| AP200 |
ghi-line | 2.0 | ||
| AP300 |
ghi-line | 2.0 | ||
| Laser Processing: |
||||
| LSA100A |
NA | NA | ||
Research, Development and Engineering
The semiconductor and nanotechnology industries are subject to rapid technological change and new product introductions and enhancements. We believe that continued and timely development and introduction of new and enhanced systems to serve these markets is essential for us to maintain our competitive position. We have made and continue to make substantial investments in the research and development of our core optical technology, which we believe is critical to our future financial results. We intend to continue to develop our technology and to develop innovative products and product features to meet customer demands. Current engineering projects include continued research and development and process insertion for our laser processing technologies and continued development of our 1X stepper products. Other research and development efforts are currently focused on: performance enhancement and development of new features for existing systems, both for inclusion as a standard component in our systems and to meet special customer order requirements; reliability improvement; and manufacturing cost reductions. These research and development efforts are undertaken, principally, by our research, development and engineering organizations and costs are generally expensed as incurred. Other operating groups within Ultratech support our research, development and engineering efforts, and the associated costs are charged to those organizations and expensed as incurred.
We work with many customers to jointly develop technology required to manufacture advanced devices or to lower the customer’s cost of ownership. We also have a worldwide engineering support organization including reticle engineering, photo processing capability and applications support.
We have historically devoted a significant portion of our financial resources to research and development programs and expect to continue to allocate significant resources to these efforts in the future. As of December 31, 2009, we had approximately 66 full-time employees engaged in research, development and engineering. For 2009, 2008 and 2007, total research, development and engineering expenses were approximately $18.8 million, $23.3 million and $23.4 million, respectively, and represented 20%, 18% and 21% of our net sales, respectively.
Sales and Service
We market and sell our products in North America, Europe, Japan, Taiwan and the rest of Asia principally through our direct sales organization. We also have service personnel based throughout the United States, Europe, Japan and the rest of Asia. We believe that as semiconductor and nanotechnology device manufacturers produce increasingly complex devices, they will require an increased level of support. Global support capability as well as product reliability, performance, yield, cost, uptime and mean time between failures are increasingly important factors by which customers evaluate potential suppliers of photolithography equipment. We believe that the strength of our worldwide service and support organization is an important factor in our ability to sell our systems, maintain customer loyalty and reduce the maintenance costs of our systems. In addition, we believe that working with our suppliers and customers is necessary to ensure that our systems are cost effective, technically advanced and designed to satisfy customer requirements.
6
We support our customers with field service, applications, technical support service engineers and training programs. We provide our customers with comprehensive support and service before, during and after delivery of our systems. To support the sales process and to enhance customer relationships, we work closely with prospective customers to develop hardware, applications test specifications and benchmarks, and often design customized applications to enable prospective customers to evaluate our equipment for their specific needs. Prior to shipment, our support personnel typically assist the customer in site preparation and inspection, and provide customers with training at our facilities or at the customer’s location. We currently offer our customers various courses of instruction on our systems, including instructions in system hardware and related applications tools for optimizing our systems to fit a customer’s particular needs. Our customer training program also includes instructions in the maintenance of our systems. Our field support personnel work with the customer to install the system and demonstrate system readiness. Technical support is also available via telephone 24 hours a day, seven days a week at our headquarters in San Jose, California and through our on-site personnel.
In general, we warrant our new systems against defects in design, materials and workmanship for one year. We offer our customers additional support after the warranty period for a fee in the form of service contracts for specified time periods. Service contracts include various options such as priority response, planned preventive maintenance, scheduled one-on-one training, daily on-site support, and monthly system and performance analysis.
Manufacturing
We currently perform all of our manufacturing activities (final assembly, system testing and certain subassembly) in clean room environments totaling approximately 25,000 square feet located in San Jose, California. Performing manufacturing operations in California exposes us to a higher risk of natural disasters, including earthquakes. In addition, in the past California has experienced power shortages, which have interrupted our operations. Such shortages could occur in the future and could again interrupt our operations resulting in product shipment delays, increased costs and other problems, any of which could have a material adverse effect on our business, customer relationships and results of operations. We are not insured against natural disasters and power shortages and the occurrence of such an event could have a material adverse impact on our business, financial condition and results of operations. We currently are planning to establish and extend manufacturing capabilities and operations in Singapore.
Our manufacturing activities consist of assembling and testing components and subassemblies, which are then integrated into finished systems. We rely on a limited number of outside suppliers and subcontractors to manufacture certain components and subassemblies. We order one of the most critical components of our technology, the glass for our 1X lenses, from external suppliers. We design the 1X lenses and provide the lens specifications and the glass to other suppliers, who then machine the lens elements. We then assemble and test the optical 1X lenses. We have recorded the critical parameters of each of our optical lenses sold since 1988, and believe that such information enables us to supply lenses to our customers that match the characteristics of our customers’ existing lenses.
We procure some of our other critical systems’ components, subassemblies and services from single outside suppliers or a limited group of outside suppliers in order to ensure overall quality and timeliness of delivery. Many of these components and subassemblies have significant production lead times. To date, we have been able to obtain adequate services and supplies of components and subassemblies for our systems in a timely manner. However, disruption or termination of certain of these sources could result in a significant adverse impact on our ability to manufacture our systems. This, in turn, would have a material adverse effect on our business, financial condition and results of operations. Our reliance on a sole or a limited group of suppliers and our reliance on subcontractors involve several risks, including a potential inability to obtain an adequate supply of required components due to the suppliers’ failure or inability to provide such components in a timely manner, or at all, and reduced control over pricing and timely delivery of components. Although the timeliness, yield and quality of deliveries to date from our subcontractors have been acceptable, manufacture of certain of these components and subassemblies is an extremely complex process, and long lead-times are required. Any inability to obtain adequate deliveries or any other circumstance that would require us to seek alternative sources of supply or to manufacture such components internally could delay our ability to ship our products, which could damage relationships with current and prospective customers and have a material adverse effect on our business, financial condition and results of operations.
We maintain a company-wide quality program. Our operations achieved ISO 9001:1994 certification in 1996 and ISO 14001:1996 certification in March 2001. Our ISO 9001 certification was upgraded to the ISO 9001:2000 standard in January 2002. Our ISO 14001 certification was upgraded to the ISO 14001:2004 standard in June 2006. All certifications have been maintained uninterrupted through the date of this report.
Competition
The capital equipment industry in which we operate is intensely competitive. A substantial investment is required to install and integrate capital equipment into a semiconductor, semiconductor packaging or nanotechnology device production
7
line. We believe that once a device manufacturer or packaging subcontractor has selected a particular supplier’s capital equipment, the manufacturer generally relies upon that equipment for the specific production line application and, to the extent possible, subsequent generations of similar products. Accordingly, it is difficult to achieve significant sales to a particular customer once another supplier’s capital equipment has been selected.
Advanced Packaging
We experience competition in advanced packaging from various proximity aligner companies such as Suss Microtec AG (“Suss Microtec”) and used projection systems. We expect our competitors to continue to improve the performance of their current products and to introduce new products with improved price and performance characteristics. This could cause a decline in sales or loss of market acceptance of our steppers in our served markets, and thereby materially adversely affect our business, financial condition and results of operations. Enhancements to, or future generations of, competing products may be developed that offer superior cost of ownership and technical performance features. We believe that to be competitive, we will require significant financial resources to continue to invest in new product development, to invest in new features and enhancements to existing products, to introduce new generation stepper systems in our served markets on a timely basis, and to maintain customer service and support centers worldwide. In marketing our products, we may also face competition from suppliers employing other technologies. In addition, increased competitive pressure has led to intensified price-based competition in certain of our markets, resulting in lower prices and margins. Should these competitive trends continue, our business, financial condition and operating results may be materially adversely affected.
We have obtained a leadership position in the advanced packaging market. Our primary competition in this market comes from contact aligners offered by companies such as Suss Microtec. Although contact and proximity aligners generally have lower purchase prices than 1X steppers, 1X steppers offer lower operating costs and total cost of ownership in most applications. We believe that most device manufacturers and wafer bump foundries choose 1X steppers for the yield improvement offered by the use of non-contact lithography. Ushio, a Japanese semiconductor equipment company, has also introduced a 1X refractive stepper for the advanced packaging market. However, we believe 1X refractive steppers do not offer the same productivity and cost saving advantages as our 1X stepper based on the Wynne Dyson optical design. In addition to competition from manufacturers of contact and proximity aligners, we also face competition from reduction stepper manufacturers. While reduction steppers are typically more expensive and offer less flexibility in processing thick resists, some device manufacturers may consider this technology option.
Laser Processing
With respect to our laser annealing technologies, marketed under the LSA100A product name, our primary competition comes from companies such as Dainippon Screen Manufacturing Co., Ltd., Applied Materials, Inc. and Mattson Technology, Inc. Many of these companies offer products utilizing RTP, which is the current manufacturing technology. RTP does not prevent semiconductor device manufacturers from scaling the lateral dimensions of their transistors to obtain improved performance, but diffusion resulting from the time scales associated with RTP limits the vertical dimension of the junctions. Faster annealing times result in shallower and more abrupt junctions and faster transistors. We believe that RTP manufacturers recognize the need to reduce thermal cycle times and are working toward this goal. Several companies have published papers on annealing tools that incorporate flash lamp anneal (“FLA”) technology, a potential advanced annealing solution, in order to reduce annealing times and increase anneal temperatures. Developers of FLA technology claim to have overcome annealing difficulties at the 65nm node. This technique, which employs xenon flash lamps, has shown improvements over RTP in junction depth and sheet resistance, but we believe FLA suffers from pattern-related non-uniformities and could require additional, costly processes to equalize the reflectivity of different areas within the chip or wafer. Our proprietary laser processing solution has been specifically developed to provide junction annealing on near-instantaneous timescales, while achieving high activation levels. LSA, our first implementation of laser processing, activates dopants in the microsecond-to-millisecond time frame without melting. Our research indicates that, at temperatures just below the melting point of silicon, time durations in the microsecond to millisecond range, are required to achieve full activation, with minimal dopant diffusion.
In July 2000, we licensed certain rights to our then existing laser processing technology, with reservations, to a competing manufacturer of semiconductor equipment. We presently anticipate that this company and others intend to offer laser annealing tools to the semiconductor industry that will compete with our offerings.
Intellectual Property Rights
Although we attempt to protect our intellectual property rights through patents, copyrights, trade secrets and other measures, we believe that our success will depend more upon the innovation, technological expertise and marketing abilities of our employees. Nevertheless, we have a policy of seeking patents when appropriate on inventions resulting from our ongoing research and development and manufacturing activities. We own 153 United States and foreign patents, which expire on dates ranging from April 2010 to March 2027 and have 51 United States and foreign patent applications pending.
8
We also have various registered trademarks and copyright registrations covering mainly applications used in the operation of our systems. We also rely upon trade secret protection for our confidential and proprietary information. We may not be able to protect our technology adequately and competitors may be able to develop similar technology independently. Our pending patent applications may not be issued or U.S. or foreign intellectual property laws may not protect our intellectual property rights. In addition, litigation may be necessary to enforce our patents, copyrights or other intellectual property rights, to protect our trade secrets, to determine the validity and scope of the proprietary rights of others or to defend against claims of infringement. Such litigation has resulted in, and in the future could result in, substantial costs and diversion of resources and could have a material adverse effect on our business, financial condition and results of operations, regardless of the outcome of the litigation. Patents issued to us may be challenged, invalidated or circumvented and the rights granted thereunder may not provide competitive advantages to us. Furthermore, others may independently develop similar technology or products, or, if patents are issued to us, design around the patents issued to us. Invalidation of our patents related to those technologies, or the expiration of patents covering our key technologies, could allow our competitors to more effectively compete against us, which could result in less revenue for us.
Environmental Regulations
We are subject to a variety of governmental regulations relating to the use, storage, discharge, handling, emission, generation, manufacture and disposal of toxic or other hazardous substances. We believe that we are currently in compliance in all material respects with such regulations and that we have obtained all necessary environmental permits to conduct our business. Nevertheless, the failure to comply with current or future regulations could result in substantial fines being imposed on us, suspension of production, and alteration of the manufacturing process or cessation of operations. Such regulations could require us to acquire expensive remediation equipment or to incur substantial expenses to comply with environmental regulations. Any failure by us to control the use, disposal or storage of, or adequately restrict the discharge of, hazardous or toxic substances could subject us to significant liabilities.
Customers, Applications and Markets
We sell our systems to semiconductor, advanced packaging, HBLED, thin film head and various other nanotechnology manufacturers located throughout North America, Europe, Japan, Taiwan and the rest of Asia. Semiconductor manufacturers have purchased the 1000 Series steppers, the AP series of steppers, and the NanoTech steppers for the fabrication and/or packaging of microprocessors, microcontrollers, DRAMs, ASICs and a host of other devices. Such systems could be used in mix-and-match applications with other lithography tools, as replacements for contact proximity printers, in packaging for flip chip applications and for high volume, low cost of ownership for less critical feature size production.
On a market application basis, sales to the semiconductor industry, primarily for advanced packaging and laser thermal processing applications, accounted for approximately 94% of systems revenue for the year ended December 31, 2009, as compared to 96% and 87% for the years ended December 31, 2008 and 2007, respectively. During 2009, 2008 and 2007, approximately 6%, 4% and 13%, respectively, of our systems revenue was derived from sales to nanotechnology manufacturers, including micro systems, thin film head and optical networking device manufacturers. Our future results of operations and financial position would be materially adversely impacted by a downturn in any of these industries, or by loss of market share in any of these industries.
International sales accounted for approximately 72%, 62% and 65% of total net sales for the years 2009, 2008 and 2007, respectively, with Asia representing 68%, 43% and 50% of total net sales for those same years and Europe representing the remaining 3%, 19% and 15% of total net sales for those same years, respectively. Sales from Japan represented 12%, 16% and 21% of total net sales for the years 2009, 2008 and 2007, respectively.
Sales of our systems depend, in significant part, upon the decision of a prospective customer to increase manufacturing capacity or to restructure current manufacturing facilities, either of which typically involves a significant commitment of capital. Many of our customers in the past have cancelled or postponed the development of new manufacturing facilities and have substantially reduced their capital equipment budgets. In view of the significant investment involved in a system purchase, we have experienced and may continue to experience delays following initial qualification of our systems as a result of delays in a customer’s approval process. Additionally, we are presently receiving orders for some systems that have lengthy delivery schedules, which may be due to longer production lead times or a result of customers’ capacity scheduling requirements. For these and other reasons, our systems typically have a lengthy sales cycle during which we may expend substantial funds and management effort in securing a sale. Lengthy sales cycles subject us to a number of significant risks, including inventory obsolescence and fluctuations in operating results, over which we have little or no control. In order to maintain or exceed our present level of net sales, we are dependent upon obtaining orders for systems that will ship and be accepted in the current period. We may not be able to obtain those orders.
9
Backlog
We schedule production of our systems based upon order backlog, informal customer commitments and general economic forecasts for our targeted markets. We include in our backlog all accepted customer orders for our systems with assigned shipment dates within one year, as well as all orders for service, spare parts and upgrades, in each case, that management believes to be firm. However, all orders are subject to cancellation or rescheduling by the customer with limited or no penalties. Because of changes in system delivery schedules, cancellations of orders and potential delays in system shipments, our backlog at any particular date may not necessarily be representative of actual sales for any succeeding period. As of December 31, 2009, our backlog was approximately $80.5 million, including $10.8 million of products shipped but not yet installed. As of December 31, 2008, our backlog was approximately $62.1 million, including $3.0 million of products shipped but not yet installed. Cancellation, deferrals or rescheduling of orders by these customers would have a material adverse impact on our future results of operations.
Employees
At December 31, 2009, we had approximately 253 full-time employees, including 66 engaged in research, development and engineering, 26 in sales and marketing, 79 in customer service and support, 41 in manufacturing and 41 in general administration and finance. We believe our future success depends, in large part, on our ability to attract and retain highly skilled employees. None of our employees are covered by a collective bargaining agreement. We have, however, entered into employment agreements with our Chief Executive Officer and Chief Financial Officer. We consider our relationships with our employees to be good.
Information Available on Our Website
Our website is located at www.ultratech.com. We make available, free of charge, through our website, our annual report on Form 10-K, quarterly reports on Form 10-Q and current reports on Form 8-K (and amendments to those reports), as soon as reasonably practicable after such reports are filed electronically with the SEC. We have adopted a Code of Ethics for our principal executive officer, principal financial officer, principal accounting officer or controller, or persons performing similar functions. We have posted this Code of Ethics on our website. Any future amendments to this Code will also be posted on our website.
ITEM 1A. RISK FACTORS
In addition to risks described in the foregoing discussions under “Business,” including but not limited to those under “Products,” “Research, Development and Engineering,” “Sales and Service,” “Manufacturing,” “Competition,” “Intellectual Property Rights,” “Environmental Regulations,” “Customers, Applications and Markets,” “Backlog,” and “Employees,” the following risks apply to our business and us:
The current global financial and economic crisis could result in the cancellation, deferral or rescheduling of orders by our customers as well as changes in projection of new business.
Orders in backlog are subject to cancellation, deferral or rescheduling by a customer with limited or no penalties. Sales of our systems depend, in significant part, upon the decision of a prospective customer to increase manufacturing capacity or to restructure current manufacturing facilities, either of which typically involves a significant commitment of capital. Further, the purchase of our products involves a significant commitment of capital on the part of our customers. If the markets for our customers’ products experience a period of declining demand or if our customers’ ability to raise capital is limited, they may choose to cancel, delay or reschedule purchases of our products. The current global financial and economic crisis and the uncertainty created thereby could result in such a decline in demand or limited ability to raise capital, or could otherwise affect our customers’ markets, financial condition or willingness to incur expenses. As a result, we could experience the cancellation, delay or rescheduling of orders in our current backlog or of orders we currently expect to receive. Any such decision by our customers or potential customers would adversely affect our net sales and results of operations.
Our sales cycle is typically lengthy and involves a significant commitment of capital by our customers, which has subjected us, and is likely to continue to subject us, to delays in customer acceptances of our products and other risks, any of which could adversely impact our results of operations by, among other things, delaying recognition of revenue with respect to those orders and resulting in increased installation, qualification and similar costs.
Sales of our systems depend, in significant part, upon the decision of a prospective customer to increase manufacturing capacity, replace older equipment or to restructure current manufacturing facilities, any of which typically involves a significant commitment of capital. Many of our customers in the past have cancelled or postponed the development of new manufacturing facilities and have substantially reduced their capital equipment budgets. In view of the significant investment involved in a system purchase, we have experienced and may continue to experience delays following initial qualification of
10
our systems as a result of delays in a customer’s approval process. Additionally, we are presently receiving orders for systems that have lengthy delivery schedules, which may be due to longer production lead times or a result of customers’ capacity scheduling requirements. For these and other reasons, our systems typically have a lengthy sales cycle during which we may expend substantial funds and management effort in securing a sale. Lengthy sales cycles subject us to a number of significant risks, including inventory obsolescence and fluctuations in operating results, over which we have little or no control. In order to maintain or exceed our present level of net sales, we are dependent upon obtaining orders for systems that will ship and be accepted in the current period. We may not be able to obtain those orders. Other important factors that could cause demand for our products to fluctuate include:
• competitive pressures, including pricing pressures, from companies that have competing products;
• changes in customer product needs; and
• strategic actions taken by our competitors.
The semiconductor industry historically has been highly cyclical and has experienced periods of oversupply, which have in turn affected the market for semiconductor equipment such as ours and which can adversely affect our results of operations during such periods.
Our business depends in significant part upon capital expenditures by manufacturers of semiconductors, advanced packaging semiconductors and nanotechnology components which in turn depend upon the current and anticipated market demand for such devices and products utilizing such devices. The semiconductor industry historically has been highly cyclical and has experienced recurring periods of oversupply. This has, from time to time, resulted in significantly reduced demand for capital equipment including the systems manufactured and marketed by us. We believe that markets for new generations of semiconductors and semiconductor packaging will also be subject to similar fluctuations. Our business and operating results would be materially adversely affected by downturns or slowdowns in the semiconductor packaging market or by loss of market share. Accordingly, we may not be able to achieve or maintain our current or prior level of sales. We attempt to mitigate the risk of cyclicality by participating in multiple markets including semiconductor, semiconductor packaging, and nanotechnology sectors, as well as diversifying into new markets such as laser-based annealing for implant activation and other applications. Despite such efforts, when one or more of such markets experiences a downturn or a situation of excess capacity, our net sales and operating results are materially adversely affected.
We currently spend, and expect to continue to spend, significant resources to develop, introduce and commercialize our laser processing systems and AP wafer stepper products, and we may not be successful in achieving or increasing sales of these products.
Currently, we are devoting significant resources to the development, introduction and commercialization of our laser products as well as our lithography wafer steppers. We intend to continue to develop these products and technologies during 2010, and will continue to incur significant operating expenses in the areas of research, development and engineering, manufacturing and general and administrative costs in order to develop, produce and support these new products. Additionally, gross profit margins and inventory levels may be further adversely impacted in the future by costs associated with the initial production of our laser processing systems and by future generations of our 1X lithography systems. Introduction of new products generally involves higher installation costs and product performance uncertainties that could delay customer acceptance of our systems, resulting in a delay in recognizing revenue associated with those systems and a reduction in gross margins. These costs include, but are not limited to, additional manufacturing overhead, additional inventory write-downs, costs of demonstration systems and facilities and costs associated with the establishment of additional after-sales support organizations. Additionally, operating expenses may increase, relative to sales, as a result of adding additional marketing and administrative personnel, among other costs, to support our new products. If we are unable to achieve significantly increased net sales or if our sales fall below expectations, our operating results could be materially adversely affected.
Our ability to commercialize our laser processing technologies depends on our ability to demonstrate a manufacturing-worthy tool. We do not presently have in-house capability to fabricate devices. As a result, we must rely on partnering with semiconductor companies to develop the anneal process. The development of new process technologies is largely dependent upon our ability to interest potential customers in working on joint process development. Our ability to deliver timely solutions is also limited by wafer turnaround at the potential customer’s fabrication facility.
We operate in a highly competitive industry in which customers are required to invest substantial resources in each product, which makes it difficult to achieve significant sales to a particular customer once another vendor’s equipment has been purchased by that customer.
The capital equipment industry in which we operate is intensely competitive. A substantial investment is required to install and integrate capital equipment into a semiconductor, semiconductor packaging or nanotechnology device production line. We believe that once a device manufacturer or packaging subcontractor has selected a particular supplier’s capital
11
equipment, the manufacturer generally relies upon that equipment for the specific production line application and, to the extent possible, subsequent generations of similar products. Accordingly, it is difficult to achieve significant sales to a particular customer once another supplier’s capital equipment has been selected.
We experience competition in advanced packaging from various proximity aligner companies such as Suss Microtec AG (“Suss Microtec”) and used projection systems. In addition, some device manufacturers may consider using reduction steppers for advanced packaging processes. In nanotechnology, we experience competition from proximity aligner companies, such as Suss Microtec, as well as other stepper manufacturers who have developed or are developing tools specifically designed for nanotechnology applications. We expect our competitors in the lithography arena to continue to improve the performance of their current products and to introduce new products with improved price and performance characteristics. This could cause a decline in sales or loss of market acceptance of our steppers in our served markets, and thereby materially adversely affect our business, financial condition and results of operations. Enhancements to, or future generations of, competing products may be developed that offer superior cost of ownership and technical performance features.
With respect to our laser annealing technologies, marketed under the LSA100A product name, the primary competition comes from companies such as Dainippon Screen Manufacturing Co., Ltd., Applied Materials, Inc. and Mattson Technology, Inc. Many of these companies offer products utilizing rapid thermal processing (“RTP”) which is the current prevailing manufacturing technology. RTP does not prevent semiconductor device manufacturers from scaling the lateral dimensions of their transistors to obtain improved performance, but diffusion resulting from the time scales associated with RTP limits the vertical dimension of the junctions. Faster annealing times result in shallower and more abrupt junctions and faster transistors. We believe that RTP manufacturers recognize the need to reduce thermal cycle times and are working toward this goal. In July 2000, we licensed certain rights to our then existing laser processing technology, with reservations, to a competing manufacturer of semiconductor equipment. We presently anticipate that this company and others intend to offer laser annealing tools to the semiconductor industry that will compete with our offerings.
Another potential advanced annealing solution utilizes flash lamp annealing technology, or FLA. Several companies have published papers on annealing tools that incorporate flash lamp technology in order to reduce annealing times and increase anneal temperatures. Developers of FLA technology claim to have overcome annealing difficulties at the 65nm node. This technique, which employs xenon flash lamps, has shown improvements over RTP in junction depth and sheet resistance, but we believe FLA suffers from pattern-related non-uniformities and could require additional, costly processes to equalize the reflectivity of different areas within the chip or wafer. Our proprietary laser processing solution has been specifically developed to provide junction annealing on near-instantaneous time-scales, while achieving high activation levels. Laser spike annealing, our first implementation of laser processing, activates dopants in the microsecond-to-millisecond time frame without melting. Our research indicates that, at temperatures just below the melting point of silicon, time durations in the microsecond to millisecond range, are required to achieve full activation, and minimal dopant diffusion.
Additionally, competition to our laser processing products may come from other laser annealing tools, including those presently being used by the flat panel display industry to re-crystallize silicon. Manufacturers of these tools may try to extend the use of their technologies to semiconductor device applications.
We believe that in order to be competitive, we will need to continue to invest significant financial resources in new product development, new features and enhancements to existing products, the introduction of new stepper systems in our served markets on a timely basis, and maintaining customer service and support centers worldwide. In marketing our products, we may also face competition from vendors employing other technologies. In addition, increased competitive pressure has led to intensified price-based competition in certain of our markets, resulting in lower prices and margins. Should these competitive trends continue, our business, financial condition and operating results may be materially adversely affected.
We sell our products primarily to a limited number of customers and to customers in a limited number of industries, which subjects us to increased risks related to the business performance of our customers, and therefore their need for our products, and the business cycles of the markets into which we sell.
Historically, we have sold a substantial portion of our systems to a limited number of customers. In 2009, Taiwan Semiconductor Manufacturing Co. Ltd., Intel Corporation and STATS ChipPAC Ltd. accounted for 22%, 19% and 14% of our net sales, respectively. Intel Corporation accounted for 32% and 20% of our net sales in 2008 and 2007, respectively, and was the only customer that accounted for more than 10% of our net sales in 2008 and 2007. We expect that sales to a relatively few customers will continue to account for a high percentage of our net sales in the foreseeable future and believe that our financial results depend in significant part upon the success of these major customers and our ability to meet their future capital equipment needs. Although the composition of the group comprising our largest customers may vary from period to period, the loss of a significant customer or any reduction in orders by a significant customer, including reductions due to market, economic or competitive conditions in the semiconductor, semiconductor packaging or nanotechnology
12
industries or in the industries that manufacture products utilizing integrated circuits, thin film heads or other nanotechnology components, would likely have a material adverse effect on our business, financial condition and results of operations. Our ability to maintain or increase our sales in the future depends, in part, on our ability to obtain orders from new customers as well as the financial condition and success of our existing customers, the semiconductor and nanotechnology industries and the economy in general.
In addition to the business risks associated with dependence on a few major customers, these significant customer concentrations have in the past resulted in significant concentrations of accounts receivable. These significant and concentrated receivables expose us to additional risks, including the risk of default by one or more customers representing a significant portion of our total receivables. If we were required to take additional accounts receivable reserves, our business, financial condition and results of operations would be materially adversely affected.
On a market application basis, sales to the semiconductor industry, primarily for advanced packaging applications and laser thermal processing applications, accounted for approximately 94% and 96% of systems revenue for the years ended 2009 and 2008, respectively, while sales to nanotechnology manufacturers, including micro systems, thin film head and HBLED manufacturers, accounted for the remainder of our systems revenue. Our future operating results and financial condition would be materially adversely impacted by a downturn in any of these industries, or by loss of market share in any of these industries. A growing portion of our backlog of system orders is comprised of laser spike annealing tools. To date, we have limited customer experience with this technology. Should significant demand not materialize, due to technical, production, market, or other factors, our business, financial position and results of operations would be materially adversely impacted.
We rely on a limited number of outside suppliers and subcontractors to manufacture certain components and subassemblies, and on single or a limited group of outside suppliers for certain materials for our products, which could result in a potential inability to obtain an adequate supply of required components due to the suppliers’ failure or inability to provide such components in a timely manner, or at all, and reduced control over pricing and timely delivery of components and materials, any of which could adversely affect our results of operations.
Our manufacturing activities consist of assembling and testing components and subassemblies, which are then integrated into finished systems. We rely on a limited number of outside suppliers and subcontractors to manufacture certain components and subassemblies. We order one of the most critical components of our technology, the glass for our 1X lenses, from external suppliers. We design the 1X lenses and provide the lens specifications and the glass to other suppliers, who then grind and polish the lens elements. We then assemble and test the optical 1X lenses.
We procure some of our other critical systems’ components, subassemblies and services from single outside suppliers or a limited group of outside suppliers in order to ensure overall quality and timeliness of delivery. Many of these components and subassemblies have significant production lead times. To date, we have been able to obtain adequate services and supplies of components and subassemblies for our systems in a timely manner. However, disruption or termination of certain of these sources could have a significant adverse impact on our ability to manufacture our systems. This, in turn, would have a material adverse effect on our business, financial condition and results of operations. Our reliance on a sole supplier or a limited group of suppliers and our reliance on subcontractors involve several risks, including a potential inability to obtain an adequate supply of required components due to the suppliers’ failure or inability to provide such components in a timely manner, or at all, and reduced control over pricing and timely delivery of components. Although the timeliness, yield and quality of deliveries to date from our subcontractors have been acceptable, manufacture of certain of these components and subassemblies is an extremely complex process, and long lead-times are required. Any inability to obtain adequate deliveries or any other circumstance that would require us to seek alternative sources of supply or to manufacture such components internally could delay our ability to ship our products, which could damage relationships with current and prospective customers and have a material adverse effect on our business, financial condition and results of operations.
Our industry is subject to rapid technological change and product innovation, which could result in our technologies and products being replaced by those of our competitors, which would adversely affect our business and results of operations.
The semiconductor and nanotechnology manufacturing industries are subject to rapid technological change, evolving industry standards and new product introductions and enhancements. Our ability to be competitive in these and other markets will depend, in part, upon our ability to develop new and enhanced systems and related applications, and to introduce these systems and related applications at competitive prices and on a timely and cost-effective basis to enable customers to integrate them into their operations either prior to or as they begin volume product manufacturing. We will also be required to enhance the performance of our existing systems and related applications. Our success in developing new and enhanced systems and related applications depends upon a variety of factors, including product selection, timely and efficient completion of product design, timely and efficient implementation of manufacturing and assembly processes, product performance in the field and effective sales and marketing. Because new product development commitments must be made
13
well in advance of sales, new product decisions must anticipate both future customer requirements and the technology that will be available to meet those requirements. We may not be successful in selecting, developing, manufacturing or marketing new products and related applications or enhancing our existing products and related applications. Any such failure would materially adversely affect our business, financial condition and results of operations. Further, we may make substantial investments in new products before we know whether they are technically feasible or commercially viable, and as a result may incur significant product development expenses that do not result in new products or revenues.
Because of the large number of components in our systems, significant delays can occur between a system’s introduction and our commencement of volume production of such systems. We have experienced delays from time to time in the introduction of, and technical and manufacturing difficulties with, certain of our systems and enhancements and related application tools features and options, and may experience delays and technical and manufacturing difficulties in future introductions or volume production of new systems or enhancements and related application tools features and options.
We may encounter additional technical, manufacturing or other difficulties that could further delay future introductions or volume production of systems or enhancements. Our inability to complete the development or meet the technical specifications of any of our systems or enhancements and related applications, or our inability to manufacture and ship these systems or enhancements and related tools in volume and in time to meet the requirements for manufacturing the future generation of semiconductor or nanotechnology devices would materially adversely affect our business, financial condition and results of operations. In addition, we may incur substantial unanticipated costs to ensure the functionality and reliability of our products early in the products’ life cycles. If new products have reliability or quality problems, reduced orders or higher manufacturing costs, delays in customer acceptance, revenue recognition and collecting accounts receivable and additional service and warranty expenses may result. Any of such events may materially adversely affect our business, financial condition and results of operations.
We may not be successful in protecting our intellectual property rights or we could be found to have infringed the intellectual property rights of others, either of which could weaken our competitive position and adversely affect our results of operations.
Although we attempt to protect our intellectual property rights through patents, copyrights, trade secrets and other measures, we believe that our success will depend more upon the innovation, technological expertise and marketing abilities of our employees. Nevertheless, we have a policy of seeking patents when appropriate on inventions resulting from our ongoing research and development and manufacturing activities. We own 153 United States and foreign patents, which expire on dates ranging from April 2010 to March 2027 and have 51 United States and foreign patent applications pending. In addition, we have various registered trademarks and copyright registrations covering mainly applications used in the operation of our systems. We also rely upon trade secret protection for our confidential and proprietary information. We may not be able to protect our technology adequately and competitors may be able to develop similar technology independently. Our pending patent applications may not be issued or U.S. or foreign intellectual property laws may not protect our intellectual property rights. In addition, litigation may be necessary to enforce our patents, copyrights or other intellectual property rights, to protect our trade secrets, to determine the validity and scope of the proprietary rights of others or to defend against claims of infringement. Such litigation has resulted in, and in the future could result in, substantial costs and diversion of resources and could have a material adverse effect on our business, financial condition and results of operations, regardless of the outcome of the litigation. Patents issued to us may be challenged, invalidated or circumvented and the rights granted thereunder may not provide competitive advantages to us. Furthermore, others may independently develop similar technology or products, or, if patents are issued to us, design around the patents issued to us. Invalidation of our patents related to those technologies, or the expiration of patents covering our key technologies, could allow our competitors to more effectively compete against us, which could result in less revenue for us.
On July 11, 2003, we filed a lawsuit against a Southern California company asserting infringement of certain claims related to U.S. patent No. 5,621,813 in the U.S. District Court in and for the Northern District of California. On May 17, 2005, the court found the subject patent to be invalid. We appealed this decision. The defendant subsequently brought a motion for reimbursement of its attorneys’ fees and costs in a total asserted amount of approximately $2 million. We opposed this motion, and on October 12, 2005, the District Court denied the defendant’s request for attorneys’ fees in its entirety. The defendant appealed that decision. On November 3, 2005, the defendant filed a notice of appeal with respect to the court’s ruling on its motion for attorneys’ fees. In March 2006, the Federal Circuit court upheld the district court’s ruling that the subject patent is invalid. On August 8, 2006, the Federal Circuit court upheld the District Court’s denial of attorneys’ fees. Neither side appealed the rulings by the Federal Circuit, and they are final.
In May 2006, the same company filed a state court lawsuit against us for malicious prosecution and abuse of process claiming that attorney’s fees, costs and other damages were due based on the outcome of the federal patent litigation suit described above. We do not believe this action has merit, particularly given the denial by the federal court of that company’s request to be awarded attorneys’ fees payable by us in the patent litigation and the subsequent federal appellate court’s
14
affirmation of the order denying any such award. We filed a motion to have the state court complaint dismissed under California’s anti-strategic lawsuit against public participation (“anti-SLAPP”) and demurrer statutes. The anti-SLAPP statute is aimed at striking lawsuits that are brought in order to quash an individual’s constitutional rights to free speech or seeking redress of grievances (i.e. filing suit). The state court granted the anti-SLAPP motion as to the abuse of process claim, but denied it as to the malicious prosecution claim. Our subsequent appeals to the appellate court and California Supreme Court were unsuccessful, and the matter was returned to Riverside County Superior Court. We moved for summary judgment on the matter based on federal preemption, but the Superior Court denied the motion. A subsequent writ of mandamus filed by us was also not successful. At this point, we intend to prepare for a vigorous defense of the matter.
We believe that the outcome of these matters will not be material to our business, financial condition or results of operations.
We have from time to time been notified of claims that we may be infringing intellectual property rights possessed by third parties. We believe that the outcome of these matters will not be material to our business, results of operations or financial condition.
Infringement claims by third parties or claims for indemnification resulting from infringement claims may be asserted in the future and such assertions could materially adversely affect our business, financial condition and results of operations, regardless of the outcome of any litigation. With respect to any such future claims, we may seek to obtain a license under the third party’s intellectual property rights. However, a license may not be available on reasonable terms or at all. We could decide, in the alternative, to resort to litigation to challenge such claims. Such challenges could be expensive and time consuming and could materially adversely affect our business, financial condition and results of operations, regardless of the outcome of any litigation.
A substantial portion of our sales are outside of the United States, which subjects us to risks related to customer service, installation, foreign economic and political stability, uncertain regulatory and tax rules, and foreign exchange rate fluctuations, all of which make it more difficult to operate our business.
International sales accounted for approximately 72%, 62% and 65% of total net sales for the years 2009, 2008 and 2007, respectively. We anticipate that international sales will continue to account for a significant portion of total net sales. As a result, a significant portion of our net sales will continue to be subject to certain risks, including unexpected changes in regulatory requirements; difficulty in satisfying existing regulatory requirements; exchange rate fluctuations; tariffs and other barriers; political and economic instability; difficulties in accounts receivable collections; reduced protection of intellectual property; natural disasters; difficulties in staffing and managing foreign subsidiary and branch operations; and potentially adverse tax consequences.
Although we generally transact our international sales in U.S. dollars, international sales expose us to a number of additional risk factors, including fluctuations in the value of local currencies relative to the U.S. dollar, which, in turn, impact the relative cost of ownership of our products and may further impact the purchasing ability of our international customers. We have direct sales operations in Japan and orders are often denominated in Japanese yen. This may subject us to a higher degree of risk from currency fluctuations. We attempt to mitigate this exposure through foreign currency hedging. We are also subject to the risks associated with the imposition of legislation and regulations relating to the import or export of semiconductors and nanotechnology products. We cannot predict whether the United States or any other country will implement changes to quotas, duties, taxes or other charges or restrictions upon the importation or exportation of our products. These factors, or the adoption of restrictive policies, may have a material adverse effect on our business, financial condition and results of operations.
We are currently planning to establish and extend manufacturing operations in Singapore, which will continue to expose us to risks inherent in doing business outside the United States, any of which risks could harm our business, financial condition and operating results.
Foreign operations subject us to risks related to the political, economic, legal and other conditions of foreign jurisdictions. These risks include risks related to:
• foreign exchange rate fluctuations;
• the need to comply with foreign government laws and regulations, including the imposition of regulatory requirements, tariffs, and import and export restrictions;
• general geopolitical risks such as political and economic instability and changes in diplomatic and trade relationships;
• potentially less protection of intellectual property under the laws of foreign jurisdictions; and
• public safety or health concerns or natural disasters in foreign countries.
15
These risks could, among other things, result in product shipment delays, increased costs, unexpected shutdowns or other business disruptions, or loss of benefits expected to be achieved by conducting operations in affected jurisdictions. Any of the above risks, should they occur, could have a material adverse effect on our business, financial condition and results of operations.
Our results of operations and business could be adversely affected by public health issues, wars and other military action, as well as terrorist attacks and threats and government responses thereto, especially if any such actions were directed at us or our facilities or customers.
Public health issues, terrorist attacks in the United States and elsewhere, government responses thereto, and military actions in Iraq, Afghanistan and elsewhere, may disrupt our operations or those of our customers and suppliers and may affect the availability of materials needed to manufacture our products or the means to transport those materials to manufacturing facilities and finished products to customers. In June 2009, the World Health Organization declared H1N1 influenza, or swine flu, a pandemic. This pandemic could cause damage or disruption to international commerce by creating economic and political uncertainties that may have a significant negative impact on the global economy, us and our customers or suppliers. Should the severity of the H1N1 influenza pandemic increase or other public health issues arise, we could be negatively impacted by the need for more stringent employee travel restrictions, additional limitations in the availability of freight services, governmental actions limiting the movement of products between various regions and disruptions in the operations of our customers or suppliers. Any of the H1N1 influenza pandemic, terrorist attacks, or the ongoing war on terrorism could increase volatility in the United States and world financial markets which may depress the price of our Common Stock and may limit the capital resources available to us or our customers or suppliers, which could result in decreased orders from customers, less favorable financing terms from suppliers, and scarcity or increased costs of materials and components of our products. Additionally, terrorist attacks directly upon us may significantly disrupt our ability to conduct our business. The long-term effects of the H1N1 influenza pandemic, terrorist attacks and the ongoing war on terrorism on our business and on the global economy remain unknown. Any of these occurrences could have a significant impact on our operating results, revenues and costs and may result in increased volatility of the market price of our Common Stock.
Our investment portfolio may become impaired by further deterioration of the capital markets.
Our cash equivalent and short-term investment portfolio as of December 31, 2009 consisted of securities and obligations of U.S. government agencies, money market funds, commercial paper and corporate debt securities. We follow an established investment policy and set of guidelines to monitor, manage and limit our exposure to interest rate and credit risk. The policy sets forth credit quality standards and limits our exposure to any one issuer, as well as our maximum exposure to various asset classes.
As a result of current financial market conditions, investments in some financial instruments, such as structured investment vehicles, sub-prime mortgage-backed securities and collateralized debt obligations, may lose some or all of their value due to liquidity and credit concerns. As of December 31, 2009, we had no holdings in these categories of investments and no impairment charge associated with our short-term investment portfolio. Although we believe our current investment portfolio has little risk of impairment, we cannot predict future market conditions or market liquidity and our investment portfolio could become impaired.
We are dependent on our key personnel, especially Mr. Zafiropoulo our Chief Executive Officer, and our business and results of operations would be adversely affected if we were to lose our key employees.
Our future operating results depend, in significant part, upon the continued contributions of key personnel, many of whom would be difficult to replace. We have entered into employment agreements only with our Chief Executive Officer and Chief Financial Officer, and our employees are employed “at will.” The agreements with our Chief Executive Officer and Chief Financial Officer contain vesting acceleration and severance payment provisions that could result in significant costs or charges to us should the employee be terminated without cause, die or have a disability. We do not maintain any life insurance on any of our key employees. The loss of key personnel could have a material adverse effect on our business, financial condition and results of operations. In addition, our future operating results depend in significant part upon our ability to attract and retain other qualified management, manufacturing, technical, sales and support personnel for our operations. There are only a limited number of persons with the requisite skills to serve in these positions and it may become increasingly difficult for us to hire such personnel over time. At times, competition for such personnel has been intense, particularly in the San Francisco Bay Area where we maintain our headquarters and principal operations, and we may not be successful in attracting or retaining such personnel. The failure to attract or retain such persons would materially adversely affect our business, financial condition and results of operations.
16
Changes in financial accounting standards or policies in the past have affected, and in the future may, affect, our reported results of operations.
We prepare our financial statements in conformity with accounting principles generally accepted in the United States (“U.S. GAAP”). These principles are subject to interpretation by the Financial Accounting Standards Board (“FASB”), the American Institute of Certified Public Accountants (“AICPA”), the Securities and Exchange Commission (“SEC”) and various bodies formed to interpret and create appropriate accounting policies. A change in those policies can have a significant effect on our reported results and may affect our reporting of transactions which are completed before a change is announced.
Accounting policies affecting many other aspects of our business, including rules relating to revenue recognition, off-balance sheet transactions, employee stock options, restructurings, asset disposals and asset retirement obligations, derivative and other financial instruments have recently been revised or are under review. Changes to those rules or the questioning of how we interpret or implement those rules may have a material adverse effect on our reported financial results or on the way we conduct business. In addition, our preparation of financial statements in accordance with U.S. GAAP requires that we make estimates and assumptions that affect the recorded amounts of assets and liabilities, disclosure of those assets and liabilities at the date of the financial statements and the recorded amounts of expenses during the reporting period. A change in the facts and circumstances surrounding those estimates could result in a change to our estimates and could impact our future operating results.
Our equity incentive plans, certain provisions of our Certificate of Incorporation and Bylaws, and Delaware law may discourage third parties from pursuing a change of control transaction with us.
Certain provisions of our Certificate of Incorporation, equity incentive plans, licensing agreements, Bylaws and Delaware law may discourage certain transactions involving a change in control of our company. In addition to the foregoing, the shareholdings of our officers, directors and persons or entities that may be deemed affiliates and the ability of the Board of Directors to issue “blank check” preferred stock without further stockholder approval could have the effect of delaying, deferring or preventing us from experiencing a change in control and may adversely affect the voting and other rights of holders of our Common Stock.
We use hazardous substances in the operation of our business, and any failure on our part to comply with applicable regulations or to appropriately control the use, disposal or storage of such substances could subject us to significant liabilities.
We are subject to a variety of governmental regulations relating to environment protection and workplace safety, including the use, storage, discharge, handling, emission, generation, manufacture and disposal of toxic or other hazardous substances. The failure to comply with current or future regulations could result in substantial fines being imposed on us, suspension of production, alteration of the manufacturing process or cessation of operations. Such regulations could require us to acquire expensive remediation equipment or to incur substantial expenses to comply with environmental regulations. Any failure by us to comply with these regulations, including any failure to control the use, disposal or storage of, or adequately restrict the discharge of, hazardous or toxic substances, could subject us to significant liabilities.
Our stock price has experienced significant volatility in the past and we expect this to continue in the future as a result of many factors, some of which could be unrelated to our operating performance, and such volatility can have a major impact on the number of shares subject to outstanding stock options and restricted stock units that are included in calculating our earnings per share.
We believe that factors such as announcements of developments related to our business, fluctuations in our operating results, a shortfall in revenue or earnings, changes in analysts’ expectations, general conditions in the semiconductor and nanotechnology industries or the worldwide or regional economies, sales of our securities into the marketplace, an outbreak or escalation of hostilities, announcements of technological innovations or new products or enhancements by us or our competitors, developments in patents or other intellectual property rights and developments in our relationships with our customers and suppliers could cause the price of our Common Stock to fluctuate, perhaps substantially. The market price of our Common Stock has fluctuated significantly in the past and we expect it to continue to experience significant fluctuations in the future, including fluctuations that may be unrelated to our performance.
As of February 23, 2010, we had options to purchase and restricted stock units for 4,205,073 shares of our Common Stock outstanding. Among other determinants, the market price of our stock has a major bearing on the number of shares subject to outstanding stock options and restricted stock units that are included in the weighted-average shares used in determining our net income per share. During periods of extreme volatility, the impact of higher stock prices can have a materially dilutive effect on our net income per share. Additionally, shares subject to outstanding options and restricted stock units are excluded from the calculation of net income per share when we have a net loss or when the exercise price and the average
17
unrecognized compensation cost of the stock option or restricted stock unit is greater than the average market price of our Common Stock, as the impact of the stock options or restricted stock units would be anti-dilutive.
If we acquire companies, products, or technologies, we may face risks associated with those acquisitions.
We may not realize the anticipated benefits of any acquisition or investment. We may in the future pursue additional acquisitions of complementary product lines, technologies or businesses. Future acquisitions may result in potentially dilutive issuances of equity securities, the incurrence of debt and contingent liabilities and amortization expenses and impairment charges related to goodwill and other intangible assets, which could materially adversely affect our financial condition and results of operations. In addition, acquisitions involve numerous risks, including difficulties in the assimilation of the operations, technologies, personnel and products of the acquired companies; the diversion of management’s attention from other business concerns; risks of entering markets in which we have limited or no direct experience; and the potential loss of key employees of the acquired company. In the event we acquire product lines, technologies or businesses which do not complement our business, or which otherwise do not enhance our sales or operating results, we may incur substantial write-offs and higher recurring operating costs, which could have a material adverse effect on our business, financial condition and results of operations. In the event that any such acquisition does occur, there can be no assurance as to the effect thereof on our business or operating results.
Our long-term expenses reduction programs may result in an increase in short-term expenses.
As part of our continued effort to reduce company-wide expenses, we have recorded certain expenses related to work force reductions pursuant to the provisions of Accounting Standard Codification (“ASC”) Topic 420, Exit or Disposal Cost Obligations. Although we expect our cost cutting efforts to result in a decrease in expenses over the long-term, these accounting charges may result in an increase in our short-term expenses. We may from time to time undertake additional expense reduction programs or actions, any of which could result in current period charges and expenses that could have a material adverse effect on that period’s operating results.
If earthquakes or other catastrophic events occur, our business may be harmed.
We perform all of our manufacturing activities in cleanroom environments in San Jose, California, an area known for seismic activity. Performing manufacturing operations in California exposes us to a higher risk of natural disasters, including earthquakes. In addition, in the past California has experienced power shortages, which have interrupted our operations. Such shortages could occur in the future. An earthquake, other natural disaster, power shortage or other similar events could interrupt or otherwise limit our operations resulting in product shipment delays, increased costs and other problems, any of which could have a material adverse effect on our business, customer relationships and results of operations.
ITEM 1B. UNRESOLVED STAFF COMMENTS
Not applicable.
ITEM 2. PROPERTIES
We maintain our headquarters and manufacturing operations in San Jose, California in two leased facilities, totaling approximately 177,000 square feet, which contain general administration and finance, marketing and sales, customer service and support, manufacturing and research, development and engineering. The leases for these facilities expire at various dates from March 2010 to January 2016. We also lease sales and support offices in the United States in East Fishkill, New York and Woburn, Massachusetts under leases expiring in October and November 2010, respectively, and outside the United States in Taiwan, the Philippines, Japan, Korea, Singapore, Thailand, Germany, and China, with terms expiring between one month and three years from December 31, 2009.
In September 2007, we sublet approximately 28,000 square feet of our San Jose facility to a third party. This sublease expired in January 2010. In October 2009, we entered into two lease amendments for our facilities in San Jose, California. The first lease amendment is to extend one of the building leases for five years. This lease extension will expire in January 2016. Pursuant to the terms of the second lease amendment, in consideration for the waiver of certain surrender obligations set forth in the original lease of a separate building, we shall pay the landlord $0.6 million and surrender possession of the premises by the lease expiration date in March 2010.
We believe that our existing facilities will be adequate to meet our currently anticipated requirements and that suitable additional or substitute space will be available as needed.
ITEM 3. LEGAL PROCEEDINGS
On July 11, 2003, we filed a lawsuit against a Southern California company asserting infringement of certain claims related to U.S. patent No. 5,621,813 in the U.S. District Court in and for the Northern District of California. On May
18
17, 2005, the court found the subject patent to be invalid. We appealed this decision. The defendant subsequently brought a motion for reimbursement of its attorneys’ fees and costs in a total asserted amount of approximately $2 million. We opposed this motion, and on October 12, 2005, the District Court denied the defendant’s request for attorneys’ fees in its entirety. The defendant appealed that decision. On November 3, 2005, the defendant filed a notice of appeal with respect to the court’s ruling on its motion for attorneys’ fees. In March 2006, the Federal Circuit court upheld the district court’s ruling that the subject patent is invalid. On August 8, 2006, the Federal Circuit court upheld the District Court’s denial of attorneys’ fees. Neither side appealed the rulings by the Federal Circuit, and they are final.
In May 2006, the same company filed a California state court lawsuit against us in the Riverside County Superior Court for malicious prosecution and abuse of process claiming that attorney’s fees, costs and other damages were due based on the outcome of the federal patent litigation suit described above. We do not believe this new action has merit, particularly given the denial by the federal court of that company’s request to be awarded attorneys’ fees payable by us in the patent litigation and the subsequent federal appellate court’s affirmation of the order denying any such award. We filed a motion to have the state court complaint dismissed under California’s anti-strategic lawsuit against public participation (“anti-SLAPP”) and demurrer statutes. The anti-SLAPP statute is aimed at striking lawsuits that are brought in order to quash an individual’s constitutional rights to free speech or seeking redress of grievances (i.e. filing suit). The state court granted the anti-SLAPP motion as to the abuse of process claim, but denied it as to the malicious prosecution claim. Our subsequent appeals to the appellate court and California Supreme Court were unsuccessful, and the matter was returned to Riverside County Superior Court. We moved for summary judgment on the matter based on federal preemption, but the Superior Court denied the motion. A subsequent writ of mandamus filed by us was also not successful. At this point, we intend to prepare for a vigorous defense of the matter.
We believe that the outcome of these matters will not be material to our business, financial condition or results of operations.
ITEM 4. Reserved
Executive Officers of the Registrant
As of December 31, 2009, the executive officers of Ultratech, who are appointed by and serve at the discretion of the Board of Directors, were as follows:
| Name |
Age | Position with the Company | ||
| Arthur W. Zafiropoulo |
70 | Chairman of the Board of Directors, Chief Executive Officer and President | ||
| Bruce R. Wright |
61 | Senior Vice President, Finance, Chief Financial Officer and Secretary | ||
Mr. Zafiropoulo founded Ultratech in September 1992 to acquire certain assets and liabilities of the Ultratech Stepper Division (the “Predecessor”) of General Signal Technology Corporation (“General Signal”) and, since March 1993, has served as Chief Executive Officer and Chairman of the Board. Additionally, Mr. Zafiropoulo served as President of Ultratech from March 1993 to March 1996, from May 1997 until April 1999 and from April 2001 to January 2004. In October 2006, he resumed the responsibilities of President and Chief Operating Officer. Between September 1990 and March 1993, he was President of the Predecessor. From February 1989 to September 1990, Mr. Zafiropoulo was President of General Signal’s Semiconductor Equipment Group International, a semiconductor equipment company. From August 1980 to February 1989, Mr. Zafiropoulo was President and Chief Executive Officer of Drytek, Inc., a plasma dry-etch company that he founded in August 1980, and which was later sold to General Signal in 1986. From July 1987 to September 1989, Mr. Zafiropoulo was also President of Kayex, a semiconductor equipment manufacturer, which was a unit of General Signal. From July 2001 to July 2002, Mr. Zafiropoulo served as Vice Chairman of Semiconductor Equipment and Materials International (“SEMI”), an international trade association representing the semiconductor, flat panel display equipment and materials industry. From July 2002 to June 2003, Mr. Zafiropoulo served as Chairman of SEMI, and Mr. Zafiropoulo has been on the Board of Directors of SEMI since July 1995. In December 2007, Mr. Zafiropoulo was elected as Director Emeritus of SEMI.
Mr. Wright has served as Senior Vice President, Finance, Chief Financial Officer and Secretary since joining Ultratech in June 1999. From May 1997 to May 1999, Mr. Wright served as Executive Vice President, Finance and Chief Financial Officer of Spectrian Corporation, a radio frequency amplifier company. From November 1994 through May 1997, Mr. Wright was Senior Vice President of Finance and Administration, and Chief Financial Officer of Tencor Instruments until its acquisition by KLA Instruments Corporation in 1997, which formed KLA-Tencor Corporation, and from December 1991 through October 1994, Mr. Wright was Vice President and Chief Financial Officer of Tencor Instruments. Mr. Wright serves on the Board of Directors of LTX-Credence Corporation, a global provider of automated test equipment solutions for the testing of semiconductor integrated circuits.
19
PART II
| ITEM 5. | MARKET FOR THE REGISTRANT’S COMMON EQUITY, RELATED STOCKHOLDER MATTERS AND ISSUER PURCHASES OF EQUITY SECURITIES |
Our common stock is traded on the NASDAQ Global Market under the symbol UTEK. The following table sets forth, for the periods indicated, the range of high and low reported sale prices of our common stock.
| Fiscal 2009—Fiscal Quarter Ended |
March 31 | June 30 | September 30 | December 31 | ||||||||||
| Market Price: |
High | $ | 13.57 | $ | 14.04 | $ | 13.63 | $ | 16.00 | |||||
| Low | $ | 9.74 | $ | 11.00 | $ | 10.57 | $ | 12.67 | ||||||
| Fiscal 2008—Fiscal Quarter Ended |
March 31 | June 30 | September 30 | December 31 | ||||||||||
| Market Price: |
High | $ | 11.54 | $ | 17.20 | $ | 17.00 | $ | 15.10 | |||||
| Low | $ | 8.67 | $ | 9.46 | $ | 11.54 | $ | 9.00 | ||||||
Our fiscal quarters in 2009 ended on April 4, 2009, July 4, 2009, October 3, 2009 and December 31, 2009. Our fiscal quarters in 2008 ended on March 29, 2008, June 28, 2008, September 27, 2008 and December 31, 2008. For convenience of presentation, our fiscal quarters in each year have been shown as if they ended on March 31, June 30, September 30, and December 31.
As of February 23, 2010, we had approximately 276 stockholders of record.
We have not paid cash dividends on our common stock since inception, and our Board of Directors presently plans to reinvest our earnings in our business. Accordingly, it is anticipated that no cash dividends will be paid to holders of Common Stock in the foreseeable future.
In August 2009, we issued 2,500 shares of our common stock in an unregistered, private placement under Section 4(2) of the Securities Act of 1933 to SEMI Foundation, a non-profit organization, to support its efforts to educate youth interested in science and math about career opportunities in the semiconductor industry. We issued 2,000 and 2,500 shares to SEMI Foundation in August 2008 and 2007, respectively, in each case in an unregistered, private placement under Section 4(2) of the Securities Act of 1933.
Stock Performance Graph
The graph depicted below reflects a comparison of the cumulative total return (i.e., change in stock price plus reinvestment of dividends) of our common stock assuming $100 invested as of December 31, 2004 with the cumulative total returns of the NASDAQ Composite Index and the Philadelphia Semiconductor Index.
20
Comparison of Cumulative Total Returns(1)(2)(3)
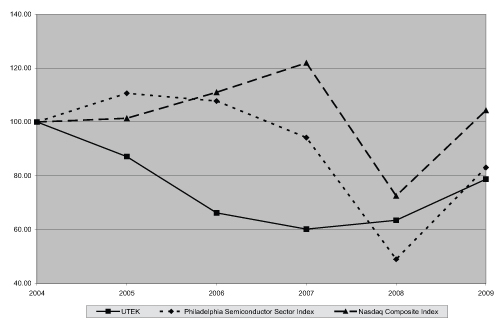
| (1) | The graph covers the period from December 31, 2004 to December 31, 2009. |
| (2) | No cash dividends have been declared on our common stock. |
| (3) | Stockholder returns over the indicated period should not be considered indicative of future stockholder returns. |
Notwithstanding anything to the contrary set forth in any of our previous filings under the Securities Act of 1933, as amended, or the Securities Exchange Act of 1934, as amended, which might incorporate our future filings under those statutes, the preceding Stock Performance Graph will not be incorporated by reference into any of those prior filings, nor will such report or graph be incorporated by reference into any our future filings under those statutes.
21
| ITEM 6. | SELECTED FINANCIAL DATA |
| In thousands, except per share data and percentage information |
2009(d) | 2008(c) | 2007(b) | 2006(a) | 2005 | |||||||||||||||
| Operations: |
||||||||||||||||||||
| Net sales |
$ | 95,813 | $ | 131,747 | $ | 112,310 | $ | 119,633 | $ | 122,366 | ||||||||||
| Gross profit |
44,990 | 64,374 | 48,859 | 46,024 | 52,047 | |||||||||||||||
| Gross profit as a percentage of net sales |
47 | % | 49 | % | 44 | % | 38 | % | 43 | % | ||||||||||
| Operating income (loss) |
(1,102 | ) | 9,135 | (5,767 | ) | (14,371 | ) | (4,875 | ) | |||||||||||
| Income (loss) before income taxes and cumulative effect of a change in accounting principle |
2,059 | 12,185 | (758 | ) | (8,014 | ) | (522 | ) | ||||||||||||
| Pre-tax income (loss) as a percentage of net sales |
2.1 | % | 9.2 | % | (0.7 | %) | (6.7 | %) | (0.4 | %) | ||||||||||
| Provision (benefit) for income taxes |
(70 | ) | 408 | 286 | 954 | 699 | ||||||||||||||
| Income (loss) before cumulative effect of a change in accounting principle |
2,129 | 11,777 | (1,044 | ) | (8,968 | ) | (1,221 | ) | ||||||||||||
| Cumulative effect of the adoption of ASC 410 |
— | — | — | — | (1,122 | ) | ||||||||||||||
| Net income (loss) |
2,129 | 11,777 | (1,044 | ) | (8,968 | ) | (2,343 | ) | ||||||||||||
| Income (loss) before cumulative effect of a change in accounting principle per share—basic |
0.09 | 0.50 | (0.04 | ) | (0.38 | ) | (0.05 | ) | ||||||||||||
| Cumulative effect of the adoption of ASC 410 per share—basic |
— | — | — | — | (0.05 | ) | ||||||||||||||
| Net income (loss) per share—basic |
0.09 | 0.50 | (0.04 | ) | (0.38 | ) | (0.10 | ) | ||||||||||||
| Number of shares used in per share computation—basic |
23,690 | 23,524 | 23,354 | 23,764 | 23,964 | |||||||||||||||
| Income (loss) before cumulative effect of a change in accounting principle per share—diluted |
0.09 | 0.50 | (0.04 | ) | (0.38 | ) | (0.05 | ) | ||||||||||||
| Cumulative effect of the adoption of ASC 410 per share—diluted |
— | — | — | — | (0.05 | ) | ||||||||||||||
| Net income (loss) per share—diluted |
0.09 | 0.50 | (0.04 | ) | (0.38 | ) | (0.10 | ) | ||||||||||||
| Number of shares used in per share computation—diluted |
23,852 | 23,665 | 23,354 | 23,764 | 23,964 | |||||||||||||||
| Balance sheet: |
||||||||||||||||||||
| Cash, cash equivalents and short-term investments |
$ | 160,341 | $ | 158,498 | $ | 131,998 | $ | 78,090 | $ | 141,067 | ||||||||||
| Working capital |
193,133 | 184,189 | 161,855 | 104,951 | 165,181 | |||||||||||||||
| Total assets |
234,581 | 229,191 | 218,641 | 216,050 | 222,309 | |||||||||||||||
| Long-term obligations |
5,935 | 6,687 | 7,534 | 7,580 | 7,805 | |||||||||||||||
| Stockholders’ equity |
199,968 | 193,423 | 177,400 | 174,108 | 188,950 | |||||||||||||||
22
Quarterly Data
| Unaudited, in thousands, except per share data |
1st | 2nd | 3rd | 4th | |||||||||
| 2009 |
|||||||||||||
| Net sales |
$ | 25,655 | $ | 18,596 | $ | 24,939 | $ | 26,623 | |||||
| Gross profit |
12,392 | 7,132 | 12,564 | 12,902 | |||||||||
| Operating income (loss) |
252 | (3,287 | ) | 729 | 1,204 | ||||||||
| Net income (loss) |
191 | (487 | ) | 1,041 | 1,384 | ||||||||
| Net income (loss) per share—basic |
0.01 | (0.02 | ) | 0.04 | 0.06 | ||||||||
| Number of shares used in per share computation—basic |
23,647 | 23,669 | 23,707 | 23,801 | |||||||||
| Net income (loss) per share—diluted |
0.01 | (0.02 | ) | 0.04 | 0.06 | ||||||||
| Number of shares used in per share computation—diluted |
23,678 | 23,669 | 23,805 | 24,191 | |||||||||
| 2008 |
|||||||||||||
| Net sales |
$ | 31,136 | $ | 32,061 | $ | 34,437 | $ | 34,113 | |||||
| Gross profit |
15,364 | 15,185 | 16,718 | 17,107 | |||||||||
| Operating income |
881 | 1,726 | 2,859 | 3,669 | |||||||||
| Net income |
1,952 | 2,584 | 3,302 | 3,939 | |||||||||
| Net income per share—basic |
0.08 | 0.11 | 0.14 | 0.17 | |||||||||
| Number of shares used in per share computation—basic |
23,456 | 23,488 | 23,558 | 23,589 | |||||||||
| Net income per share—diluted |
0.08 | 0.11 | 0.14 | 0.17 | |||||||||
| Number of shares used in per share computation—diluted |
23,473 | 23,823 | 23,865 | 23,732 | |||||||||
| (a) | Operating loss in 2006 includes $2.0 million of stock-based compensation expenses and a charge of $1.9 million related to certain exit activities (of which $0.1 million relating to the acceleration of restricted stock units and options is included in stock-based compensation expenses). |
| (b) | Operating loss in 2007 includes a charge of $1.6 million related to certain exit activities, a credit of $0.9 million which resulted from a refund of employee health insurance premiums paid previously, a benefit of $0.5 million related to sale of previously written down inventory and a credit of $0.3 million due to a change in the estimate related to collectibility of certain accounts receivable. Refer to Note 12 of our consolidated financial statements herein for further disclosures related to the exit activities. |
| (c) | Operating income in 2008 includes $2.4 million of stock-based compensation expenses and a charge of $0.6 million related to certain exit activities. Refer to Notes 5 and 12 of our consolidated financial statements herein for further disclosures related to these items. |
| (d) | Operating loss in 2009 includes $2.9 million of stock-based compensation expenses and a charge of $0.6 million related to certain exit activities. Refer to Notes 5 and 12 of our consolidated financial statements herein for further disclosures related to these items. |
| ITEM 7. | MANAGEMENT’S DISCUSSION AND ANALYSIS OF FINANCIAL CONDITION AND RESULTS OF OPERATIONS |
Certain of the statements contained herein, which are not historical facts and which can generally be identified by words such as “anticipates,” “expects,” “intends,” “will,” “could,” “believes,” “estimates,” “continue,” and similar expressions, are forward-looking statements under Section 27A of the Securities Act of 1933, as amended, and Section 21E of the Securities Exchange Act of 1934, as amended, that involve risks and uncertainties, such as risks related to timing, delays, deferrals and cancellations of orders by customers, including as a result of semiconductor manufacturing capacity as well as our customers’ financial condition and demand for semiconductors; customer concentration; our dependence on new product introductions and market acceptance of new products and enhanced versions of our existing products; lengthy sales cycles, including the timing of system installations and acceptances; lengthy and costly development cycles for laser-processing and lithography technologies and applications; integration, development and associated expenses of the laser processing operation; cyclicality in the semiconductor and nanotechnology industries; general economic and financial market conditions including impact on capital spending, as well as difficulty in predicting changes in such conditions; pricing pressures and product discounts; high degree of industry competition; intellectual property matters; changes in pricing by us, our competitors or suppliers;
23
international sales; timing of new product announcements and releases by us or our competitors; ability to volume produce systems and meet customer requirements; sole or limited sources of supply; ability and resulting costs to attract or retain sufficient personnel to achieve our targets for a particular period; dilutive effect of employee stock option grants on net income per share, which is largely dependent upon us achieving and maintaining profitability and the market price of our stock; mix of products sold; rapid technological change and the importance of timely product introductions; outcome of litigation; manufacturing variances and production levels; timing and degree of success of technologies licensed to outside parties; product concentration and lack of product revenue diversification; inventory obsolescence; asset impairment; changes to financial accounting standards; effects of certain anti-takeover provisions; future acquisitions; volatility of stock price; foreign government regulations and restrictions; business interruptions due to natural disasters or utility failures; environmental regulations; and any adverse effects of terrorist attacks in the United States or elsewhere, or government responses thereto, or military actions in Iraq, Afghanistan and elsewhere, on the economy, in general, or on our business in particular. Due to these and additional factors, the statements, historical results and percentage relationships set forth below are not necessarily indicative of the results of operations for any future period. These forward-looking statements are based on management’s current beliefs and expectations, some or all of which may prove to be inaccurate, and which may change. We undertake no obligation to revise or update any forward-looking statements to reflect any event or circumstance that may arise after the date of this report.
OVERVIEW
Ultratech, Inc. develops, manufactures and markets photolithography and laser thermal processing equipment for manufacturers of integrated circuits and nanotechnology components located throughout North America, Europe, Japan, Taiwan and the rest of Asia.
We supply step-and-repeat photolithography systems based on one-to-one imaging technology. Within the integrated circuit industry, we target the market for advanced packaging applications. Within the nanotechnology industry, our target markets include thin film head magnetic recording devices, optical networking devices, high-brightness laser diodes and light emitting diodes (“HBLEDs”). Our laser thermal processing equipment is targeted at advanced annealing applications within the semiconductor industry.
CRITICAL ACCOUNTING POLICIES AND ESTIMATES
The discussion and analysis of our financial condition and results of operations are based upon our consolidated financial statements, which have been prepared in accordance with accounting principles generally accepted in the United States. The preparation of these consolidated financial statements requires us to make estimates and judgments that affect the reported amounts of assets, liabilities, revenues and expenses, and related disclosure of contingent assets and liabilities at the date of the consolidated financial statements. By their nature, these estimates and judgments are subject to an inherent degree of uncertainty. On an on-going basis, we evaluate our estimates, including those related to revenues, inventories, warranty obligations, purchase order commitments, bad debts, deferred income taxes, restructuring liabilities, asset retirement obligations, restructuring, stock based-compensation and contingencies and litigation. Management bases its estimates and judgments on historical experience and on various other assumptions that are believed to be reasonable under the circumstances, the results of which form the basis for making judgments about the carrying values of assets and liabilities that are not readily apparent from other sources. Actual results may differ from these estimates under different assumptions or conditions.
We believe the following critical accounting policies are affected by our more significant judgments and estimates used in the preparation of our consolidated financial statements. We have reviewed these policies with our Audit Committee.
Revenue Recognition
We recognize revenue when persuasive evidence of an arrangement exists, delivery has occurred or services have been rendered, the seller’s price is fixed or determinable, and collectibility is reasonably assured. We derive revenue from four sources—system sales, spare parts sales, service contracts and license fees.
Provided all other criteria are met, we recognize revenues on system sales when we have received customer acceptance of the system. In the event that terms of the sale provide for a lapsing customer acceptance period, we recognize revenue upon the expiration of the lapsing acceptance period or customer acceptance, whichever occurs first. In these instances, which are infrequent, revenue is recorded only if the product has met product specifications prior to shipment and management deems that no significant uncertainties as to product performance exist.
Our transactions frequently include the sale of systems and services under multiple element arrangements. In situations with multiple deliverables, revenue is recognized upon the delivery of the separate elements and when we receive customer acceptance or are otherwise released from our customer acceptance obligations. Consideration from multiple element
24
arrangements is allocated among the separate accounting units based on the residual method under which the revenue is allocated to undelivered elements based on fair value of such undelivered elements and the residual amounts of revenue allocated to delivered elements, provided the undelivered elements have value on a stand alone basis, there is objective and reliable evidence of fair value for the undelivered elements, the arrangement does not include a general right of return relative to the delivered item and delivery or performance of the undelivered item(s) is considered probable and substantially in our control. The maximum revenue recognized on a delivered element is limited to the amount that is not contingent upon the delivery of additional items.
We generally recognize revenue from spare parts sales upon shipment, as our products are generally sold on terms that transfer title and risk of ownership when it leaves our site. We sell service contracts for which revenue is deferred and recognized ratably over the contract period (for time-based service contracts) or as service hours are delivered (for contracts based on a purchased quantity of hours). We recognize license revenue from transactions in which our systems are re-sold by our customers to third parties as well as from royalty arrangements.
Costs related to deferred product revenues are capitalized (deferred) and recognized at the time of revenue recognition. Deferred product revenue and costs are netted on our balance sheet, under the caption “deferred product and services income.” The gross amount of deferred revenues and deferred costs at December 31, 2009 were $13.4 million and $4.5 million, respectively, as compared to $5.3 million and $1.0 million, respectively, at December 31, 2008.
Costs incurred for shipping and handling are included in cost of sales.
Inventories and Purchase Order Commitments
The semiconductor industry is characterized by rapid technological change, changes in customer requirements and evolving industry standards. We perform a detailed assessment of inventory at each balance sheet date, which includes a review of, among other factors, demand requirements and market conditions. Based on this analysis, we record adjustments, when appropriate, to reflect inventory at lower of cost or market. Although we make every effort to ensure the accuracy of our forecasts of product demand, any significant unanticipated changes in demand, product mix or technological developments would significantly impact the value of our inventory and our reported operating results. In the future, if we find that our estimates are too optimistic and we determine that our inventory needs to be written down, we will be required to recognize such costs in our cost of sales at the time of such determination. For example, if the demand assumption used in our assessment at December 31, 2009 was reduced by 10%, assuming all other assumptions such as product mix are kept the same and that mitigation efforts were not possible, we would have had to write down our inventory and open purchase commitments by $0.2 million. Conversely, if we find our estimates are too pessimistic and we subsequently sell product that has previously been written down, our gross margin in that period will be favorably impacted.
Warranty Obligations
We recognize the estimated cost of our product warranties at the time revenue is recognized. Our warranty obligation is affected by product failure rates, material usage rates and the efficiency by which the product failure is corrected. Should actual product failure rates, material usage rates and labor efficiencies differ from our estimates, revisions to the estimated warranty liability would be required which could result in future charges or credits to our gross margins. We believe our warranty accrual, as of December 31, 2009, will be sufficient to satisfy outstanding obligations as of that date.
Allowance for Bad Debts
We maintain an allowance for estimated losses resulting from the inability of our customers to make required payments. This reserve is established based upon historical trends, current economic conditions, delinquency status based on contractual terms and an analysis of specific exposures. If the financial conditions of our customers were to deteriorate, or even a single customer was otherwise unable to make payments, additional allowances may be required. The average selling price of our systems is in excess of $2.5 million. Accordingly, a single customer default could have a material adverse effect on our results of operations. Our bad debt reserve as a percentage of gross accounts receivable at December 31, 2009 remained the same at 1% as compared to December 31, 2008.
Deferred Income Taxes
Deferred income taxes are provided for the tax effect of temporary differences between the tax basis of assets and liabilities and their reported amounts in the financial statements. ASC Topic 740, Income Taxes (“ASC 740”), provides for recognition of deferred tax assets if the realization of such deferred tax assets is more likely than not to occur. Realization of our net deferred tax assets is dependent upon our generation of sufficient taxable income in future years in appropriate tax jurisdictions to obtain the benefit of the reversal of temporary differences, net operating loss carryforwards, and tax credit carryforwards. The amount of deferred tax assets considered realizable is subject to adjustment in future periods if estimates
25
of future taxable income are changed. With the exception of certain international jurisdictions (i.e., Singapore, Japan and Taiwan), we have determined that at this time it is more likely than not that deferred tax assets attributable to the remaining jurisdictions will not be realized, primarily due to uncertainties related to our ability to utilize the net operating loss and tax credit carryforwards before they expire based on our historical operating performance and uncertainty of future taxable income. Accordingly, we have established a valuation allowance for such deferred tax assets. If there is a change in our ability to realize the deferred tax assets, then our tax provision may decrease in the period in which we determine that realization is more likely than not.
As of December 31, 2009, we had recorded a valuation allowance of $71.0 million against our net deferred tax assets except for those in Singapore, Japan and Taiwan. As of December 31, 2009, we had recorded approximately $0.4 million of net foreign deferred tax assets related to our operations in Singapore, Japan and Taiwan. Based on projected future pre-tax income in Singapore, Japan and Taiwan, these assets were not subject to a valuation allowance as it is more likely than not that they will be realized in the future.
Stock-Based Compensation
Under the fair value recognition provisions of ASC Topic 718, Compensation – Stock Compensation (“ASC 718”), share-based compensation cost is measured at the grant date based on the value of the award and is recognized as expense over the vesting period. Determining the fair value of share-based awards at the grant date requires judgment, including estimating our stock price volatility, employee stock option exercise behaviors and employee option forfeiture rates. If actual results differ significantly from these estimates, stock-based compensation expense recognized in our results of operations could be materially affected. As stock-based compensation expense recognized in the Consolidated Statement of Operations is based on awards that ultimately are expected to vest, the amount of the expense has been reduced for estimated forfeitures. ASC 718 requires forfeitures to be estimated at the time of grant and revised, if necessary, in subsequent periods if actual forfeitures differ from those estimates. Forfeitures were estimated based on historical experience. If factors change and we employ different assumptions in the application of ASC 718, the compensation expense that we record in future periods may differ significantly from what we have recorded in the current period.
RESULTS OF OPERATIONS
We derive a substantial portion of our total net sales from sales of a relatively small number of newly manufactured systems, which typically range in price from $1.2 million to $6.0 million. As a result of these high sale prices, the timing and recognition of revenue from a single transaction has had and most likely will continue to have a significant impact on our net sales and operating results for any particular period. Our backlog at the beginning of a period typically does not include all of the sales needed to achieve our sales objectives for that period. In addition, orders in backlog are subject to cancellation, shipment or customer acceptance delays, and deferral or rescheduling by a customer with limited or no penalties. Consequently, our net sales and operating results for a period have been and will continue to be dependent upon our obtaining orders for systems to be shipped and accepted in the same period in which the order is received. Our business and financial results for a particular period could be materially adversely affected if an anticipated order for even one system is not received in time to permit shipment and customer acceptance during that period. Furthermore, a substantial portion of our shipments has historically occurred near the end of each quarter. Delays in installation and customer acceptance due, for example, to our inability to successfully demonstrate the agreed-upon specifications or criteria at the customer’s facility, or to the failure of the customer to permit installation of the system in the agreed upon time, may cause net sales in a particular period to fall significantly below our expectations, which may materially adversely affect our operating results for that period. This risk is especially applicable in connection with the introduction and initial sales of a new product line. Additionally, the failure to receive anticipated orders or delays in shipments due, for example, to rescheduling, delays, deferrals or cancellations by customers, additional customer configuration requirements, or to unexpected manufacturing difficulties or delays in deliveries by suppliers due to their long production lead times or otherwise, have caused and may continue to cause net sales in a particular period to fall significantly below our expectations, materially adversely affecting our operating results for that period. In particular, the long manufacturing and acceptance cycles of our advanced packaging family of wafer steppers and laser thermal processing systems and the long lead time for lenses and other materials, could cause shipments and acceptances of such products to be delayed from one quarter to the next, which could materially adversely affect our financial condition and results of operations for a particular quarter.
Additionally, the need for continued expenditures for research and development, capital equipment, ongoing training and worldwide customer service and support, among other factors, will make it difficult for us to reduce our operating expenses in a particular period if we fail to achieve our net sales goals for the period.
26
Net Sales
2009 vs. 2008
| In millions |
2009 | 2008 | Amount of Change |
Percentage change |
|||||||||
| Sales of: |
|||||||||||||
| Systems |
$ | 70.0 | $ | 102.7 | $ | (32.7 | ) | -32 | % | ||||
| Spare parts |
10.5 | 11.6 | (1.1 | ) | -9 | % | |||||||
| Services |
15.1 | 17.0 | (1.9 | ) | -11 | % | |||||||
| Licenses |
0.2 | 0.4 | (0.2 | ) | -50 | % | |||||||
| Total Net Sales |
$ | 95.8 | $ | 131.7 | $ | (35.9 | ) | -27 | % | ||||
Net sales consist of revenues from systems sales, spare parts sales, services and licensing of technologies. For the year ended December 31, 2009, systems revenue accounted for approximately 73% of total net sales, and services, licenses and spare parts accounted for the remaining 27%.
System sales decreased 32% to $70.0 million primarily attributable to a 24% decrease in the average selling price of systems sold in 2009 compared to 2008, a 10% decrease in system unit volume and a change in product mix primarily resulting from the sustained weakening of global financial and economic conditions and its effects on the markets in which we operate.
At December 31, 2009, we had approximately $8.8 million of deferred product and services income resulting from products shipped but not yet installed and accepted, as compared with $4.3 million at December 31, 2008. The increase was primarily due to the timing differences of installation and customer acceptance. In general, it takes about two to three months to install and receive customer acceptance. The gross amounts of deferred revenues and deferred costs at December 31, 2009 were $13.4 million and $4.5 million, respectively, as compared to $5.3 million and $1.0 million, respectively, at December 31, 2008. Deferred product income is recognized as revenue upon satisfying the contractual obligations for installation and/or customer acceptance. Deferred services income is recognized as revenue ratably over the contract period (for time-based service contracts) or as purchased services are rendered (for contracts based on a purchased quantity of hours).
On a product market application basis, system sales to the semiconductor industry were $65.9 million for the year ended December 31, 2009, a decrease of 33% as compared to $98.2 million in 2008. This decrease was primarily due to a 83% decrease in sales to the laser processing market. System sales to the nanotechnology market were $4.1 million for the year ended December 31, 2009, a decrease of 8% as compared with sales of $4.5 million in 2008. System sales to the nanotechnology market are highly dependent on customer capacity demand in the thin film head industry.
Sales of spare parts in 2009 decreased 9%, to $10.5 million, as compared to $11.6 million in 2008. This decrease was mainly due to decreased spare part usage. Sales from services decreased 11% to $15.1 million for the year ended December 31, 2009 as compared to $17.0 million in 2008. The decrease in service revenue was primarily due to fewer new service contracts that were recognized as revenue in 2009.
Revenues from licensing activities decreased to $0.2 million in 2009 as compared with $0.4 million in 2008 primarily due to fewer systems being resold by our existing customers to third parties, partially offset by revenue recognized from a royalty arrangement. Pursuant to our license arrangements, such transactions are subject to a license fee based on units sold. Future revenues from licensing activities, if any, will be contingent upon existing and future licensing arrangements. We may not be successful in generating licensing revenues and do not anticipate the recognition of significant levels of licensing income in the future.
For the year ended December 31, 2009, international net sales were $68.8 million, or 72% of total net sales, as compared with $81.4 million, or 62% of total net sales in 2008. We expect sales to international customers to continue to represent a significant majority of our revenues during 2010 as companies continue to build manufacturing plants overseas, especially in Asia. Our revenue derived from sales in foreign countries is not generally subject to significant exchange rate fluctuations, principally because sales contracts for our systems are generally denominated in U.S. dollars. In Japan, however, orders are often denominated in Japanese yen.
For the year ended December 31, 2009, we recorded system sales in Japan of $6.4 million, of which 45% were denominated in Japanese yen. This subjects us to the risk of currency exchange rate fluctuations. We attempt to mitigate this risk by entering into foreign currency forward exchange contracts for the period between when an order is received and when it is recorded as revenue. After recording revenue, we use various mechanisms, such as natural hedges, to offset substantial portions of the gains or losses associated with our Japanese yen denominated receivables due to exchange rate fluctuations. We had approximately $3.9 million of Japanese yen-denominated receivables at December 31, 2009. International sales expose us to a number of additional risks, including fluctuations in the value of local currencies relative to the U.S. dollar,
27
which impact the relative cost of ownership of our products and, thus, the customer’s willingness to purchase our product. (See “Risk Factors: International Sales”).
2008 vs. 2007
| In millions |
2008 | 2007 | Amount of Change |
Percentage change |
|||||||||
| Sales of: |
|||||||||||||
| Systems |
$ | 102.7 | $ | 80.7 | $ | 22.0 | 27 | % | |||||
| Spare parts |
11.6 | 15.9 | (4.3 | ) | -27 | % | |||||||
| Services |
17.0 | 15.6 | 1.4 | 9 | % | ||||||||
| Licenses |
0.4 | 0.1 | 0.3 | 300 | % | ||||||||
| Total Net Sales |
$ | 131.7 | $ | 112.3 | $ | 19.4 | 17 | % | |||||
For the year ended December 31, 2008, systems revenue accounted for approximately 78% of total net sales, and services, licenses and spare parts accounted for the remaining 22%.
System sales increased 27% to $102.7 million primarily attributable to a 19% increase in the average selling price of systems sold in 2008 compared to 2007 and a 7% increase in system unit volume. The average selling price of systems sold increased from the prior year primarily as a result of a shift in product mix in favor of our laser processing products and away from our legacy platform products and refurbished units. In 2008, we did not sell any refurbished systems as compared to 4% of units sold in 2007. This percentage can fluctuate from year to year and, as refurbished units generally have lower average selling prices than new units, any such fluctuation will impact the weighted average selling price of the systems sold.
At December 31, 2008, we had approximately $4.3 million of deferred product and services income resulting from products shipped but not yet installed and accepted, as compared with $10.2 million at December 31, 2007. The decrease was primarily due to the timing differences of installation and customer acceptance. The gross amounts of deferred revenues and deferred costs at December 31, 2008 were $5.3 million and $1.0 million, respectively. The gross amounts of deferred revenues and deferred costs at December 31, 2007 were $14.8 million and $4.6 million, respectively.
On a product market application basis, system sales to the semiconductor industry were $98.2 million for the year ended December 31, 2008, an increase of 40% as compared to $70.3 million in 2007. This increase was primarily due to a 52% increase in advanced packaging application sales. System sales to the nanotechnology market were $4.5 million for the year ended December 31, 2008, a decrease of 57% as compared with sales of $10.4 million in 2007.
Sales of spare parts in 2008 decreased 27%, to $11.6 million, as compared to $15.9 million in 2007. This decrease was mainly due to decreased spare part usage. Sales from services grew 9% to $17.0 million for the year ended December 31, 2008 as compared to $15.6 million in 2007. The increase in service revenue was primarily due to new service contracts that were recognized as revenue in 2008.
Revenues from licensing activities increased to $0.4 million in 2008 as compared with $0.1 million in 2007 primarily due to the resale of our tools by our existing customers to third parties. Pursuant to our license arrangements, such transactions are subject to a license fee based on units sold.
For the year ended December 31, 2008, international net sales were $81.4 million, or 62% of total net sales, as compared with $73.6 million, or 65% of total net sales in 2007. For the year ended December 31, 2008, we recorded system sales in Japan of $21.5 million, of which 52% were denominated in Japanese yen. We had approximately $0.8 million of Japanese yen-denominated receivables at December 31, 2008.
Gross Profit
2009 vs. 2008
On a comparative basis, gross margins were 47% and 49% for 2009 and 2008, respectively. The 2 percentage point decrease in gross margin in 2009 was mainly due to a decrease in the average selling prices of systems sold and a change in our product mix.
Our gross profit as a percentage of sales has been and most likely will continue to be significantly affected by a variety of factors, including the mix of products sold; the introduction of new products, which typically have higher manufacturing, installation and after-sale support costs until efficiencies are realized and which are typically discounted more than existing products until the products gain market acceptance; the rate of capacity utilization; write-downs of inventory and open purchase commitments; product discounts, pricing and competition in our targeted markets; non-linearity of shipments during the quarter which can result in manufacturing inefficiencies; and the percentage of international sales, which typically have lower gross margins than domestic sales principally due to higher field service and support costs.
28
2008 vs. 2007
On a comparative basis, gross margins were 49% and 44% for 2008 and 2007, respectively. The 5 percentage point increase in gross margin in 2008 was mainly due to an increase in the average selling prices of systems sold and a change in our product mix (3.3 percentage points), our continuing effort to reduce company-wide cost of sales during 2008 (2.4 percentage points) and lower severance and benefit charges recorded during 2008 (0.4 percentage points). These lower costs were partially offset by higher inventory write-downs (0.8 percentage points) and higher fringe benefits expense resulting from the absence of a refund of employee health insurance premiums received in 2007 that we paid in prior periods (0.2 percentage points).
Research, Development and Engineering Expenses
2009 vs. 2008
| In millions |
2009 | 2008 | Amount of Change |
Percentage change |
|||||||||
| Research, development and engineering expenses |
$ | 18.8 | $ | 23.3 | $ | (4.5 | ) | -19 | % | ||||
Research, development and engineering expenses in 2009 decreased 19% to $18.8 million as compared to $23.3 million in 2008. This decrease was primarily due to lower salary and compensation related expenses of $2.5 million resulting from workforce reduction, lower travel expenses and outside services of $1.7 million, lower expense from our management incentive plan of $0.2 million and lower overall expenses of $0.1 million from our continuing effort to manage company-wide expenses. Given that there is an inherent delay between the time product development activities and expenditures occur and when resultant product revenue is ultimately realized, we expect current year research, development and engineering investments to contribute to revenue in future years. As a percentage of net sales, research, development and engineering expenses for the year ended December 31, 2009 were 20% compared to 18% for 2008. This increase was due primarily to the decrease in net sales as compared to 2008 discussed above.
2008 vs. 2007
| In millions |
2008 | 2007 | Amount of Change |
Percentage change |
|||||||||
| Research, development and engineering expenses |
$ | 23.3 | $ | 23.4 | $ | (0.1 | ) | 0 | % | ||||
Research, development and engineering expenses in 2008 remained fairly constant as compared to 2007. This was primarily due to an expense of $0.4 million for our management incentive plan as compared to zero expense in 2007 partially offset by lower severance and benefit charges of $0.1 million recorded in 2008 and the absence of the $0.2 million refund of employee health insurance premiums recorded in 2007. As a percentage of net sales, research, development and engineering expenses for the year ended December 31, 2008 were 18% compared to 21% for 2007. This decrease was due primarily to the increase in net sales as compared to 2007 discussed above.
Selling, General and Administrative Expenses
2009 vs. 2008
| In millions |
2009 | 2008 | Amount of Change |
Percentage change |
|||||||||
| Selling, general and administrative expenses |
$ | 27.3 | $ | 31.9 | $ | (4.6 | ) | -14 | % | ||||
Selling, general and administrative expenses decreased by $4.6 million, or 14%, to $27.3 million in 2009, as compared to $31.9 million in 2008. The decrease was primarily due to lower salary and compensation related expenses of $3.6 million resulting from workforce reduction, lower travel expenses and outside services of $0.8 million, lower expense from the management incentive plan of $0.5 million and lower overall expenses of $0.1 million from our continuing effort to manage company-wide expenses. These decreases were partially offset by higher stock-based compensation expense of $0.4 million resulting from options and restricted stock units. As a percentage of net sales, selling, general and administrative expenses for the year ended December 31, 2009 were 29% compared to 24% for 2008. This increase was due primarily to the decrease in net sales as compared to 2008 discussed above.
2008 vs. 2007
| In millions |
2008 | 2007 | Amount of Change |
Percentage change |
||||||||
| Selling, general and administrative expenses |
$ | 31.9 | $ | 31.2 | $ | 0.7 | 2 | % | ||||
29
Selling, general and administrative expenses increased by $0.7 million, or 2%, to $31.9 million in 2008, as compared to $31.2 million in 2007. The increase was primarily due to higher stock-based compensation expense of $0.7 million resulting from options and restricted stock units, an expense of $0.8 million for the management incentive plan as compared to zero expense in 2007 and higher sales commission expense of $0.1 million. These increases were partially offset by lower severance and benefit charges of $0.6 million and the absence of the $0.5 million refund of employee health insurance premiums recorded in 2007. As a percentage of net sales, selling, general and administrative expenses for the year ended December 31, 2008 were 24% compared to 28% for 2007. This decrease was due primarily to the increase in net sales as compared to 2007 discussed above.
Interest and Other Income, Net
| In millions |
2009 | 2008 | 2007 | |||||||
| Interest income |
$ | 1.3 | $ | 3.4 | $ | 5.7 | ||||
| Other income (expense), net |
1.6 | (0.3 | ) | — | ||||||
| Interest and other income, net |
$ | 2.9 | $ | 3.1 | $ | 5.7 | ||||
Interest income was $1.3 million for the year ended December 31, 2009, as compared with $3.4 million and $5.7 million for 2008 and 2007, respectively. The decrease in 2009 from 2008 and in 2008 from 2007 was primarily due to lower interest rates on our investments. We presently maintain an investment portfolio with a weighted-average maturity less than a year. Consequently, changes in short-term interest rates have a significant impact on our interest income. Future changes in short-term interest rates are expected to continue to have a significant impact on our interest income.
Other income was $1.6 million for the year ended December 31, 2009, as compared with other expense of $0.3 million for 2008 and zero for 2007. The increase in other income was primarily attributable to the recognition of a foreign consumption tax incentive totaling $2.5 million during 2009, partially offset by a loss from foreign currency exchange of $0.4 million resulting from the depreciation of Japanese yen and loss on equipment disposal of $0.2 million. Other expense of $0.3 million in 2008 was the loss from foreign currency exchange.
The foreign consumption tax incentive related to a benefit we received in fiscal years 2004 and 2005 and was previously reserved due to uncertainties as to the ultimate realization of the incentive. We have determined that those uncertainties have been sufficiently reduced to allow recognition of the benefit. We do not expect to recognize any additional benefit with respect to this tax incentive.
Provision for Income Taxes
For the year ended December 31, 2009, we recorded income tax benefit of $70,000 as compared to income tax expense of $0.4 million and $0.3 million, respectively, in 2008 and 2007. The income tax benefit recorded in 2009 was comprised primarily of federal tax benefit while the income tax expense recorded in 2008 and 2007 was comprised of primarily foreign taxes. The actual benefit and expense recorded for each of 2009, 2008 and 2007 differs from the federal tax benefit at 35% primarily due to current tax expense in foreign jurisdictions and the fact that the prior year U.S. losses were utilized in 2009 and 2008, whereas the tax benefit of U.S. losses in 2007 was not recognized.
Income taxes can be affected by estimates of whether, and within which jurisdictions, future earnings will occur and how and when cash is repatriated to the United States, combined with other aspects of an overall income tax strategy. Additionally, taxing jurisdictions could retroactively disagree with our tax treatment of certain items, and some historical transactions have income tax effects going forward. Accounting rules require these future effects to be evaluated using current laws, rules and regulations, each of which can change at any time and in an unpredictable manner. We believe we have adequately provided for any reasonably foreseeable outcome related to these matters and we do not anticipate any material earnings impact from their ultimate resolutions.
In accordance with ASC 740, we had unrecognized benefits of $3.4 million as of December 31, 2009 due to uncertain tax positions. We continue to recognize interest and penalties as a component of income tax provision and accrued $40,000 for these items for the year. We adopted the provisions of accounting for uncertainty in income taxes as of January 1, 2007. Prior to the adoption, our policy was to establish reserves that reflected the probable outcome of known tax contingencies. The effects of final resolution, if any, were recognized as changes to the effective income tax rate in the period of resolution. ASC 740 requires application of a “more likely than not” threshold to the recognition and de-recognition of uncertain tax positions. This permits us to recognize the amount of tax benefit that has a greater than 50 percent likelihood of being ultimately realized upon settlement. It further requires that a change in judgment related to the expected ultimate resolution of uncertain tax positions be recognized in earnings in the quarter of such change. During the year ended December 31, 2009, reserves due to uncertain tax positions decreased by $67,000.
30
Over the next twelve months, we expect a decline of approximately $0.1 million in the estimated amount of liabilities associated with our uncertain tax positions which arose prior to December 31, 2009 as a result of expiring statutes of limitations in certain foreign jurisdictions.
If we are able to eventually recognize these uncertain tax positions, $3.0 million and $2.9 million of the unrecognized benefit on January 1, 2009 and December 31, 2009, respectively, would reduce our effective tax rate. We currently have a full valuation allowance against our U.S. net deferred tax asset which would impact the timing of the effective tax rate benefit should any of these uncertain tax positions be favorably settled in the future.
We recognize interest and penalties related to uncertain tax positions as a component of income tax expense. As of December 31, 2009, we had accrued approximately $40,000 of accrued interest and penalties related to uncertain tax positions.
We are subject to Federal and state tax examination for years 1999 forward and 1997 forward, respectively, by virtue of the tax attributes carrying forward from those years. We are also subject to audits in the foreign jurisdictions in which we operate for years 2001 and forward. There are no income tax examinations currently in progress.
Outlook
The anticipated timing of orders, shipments and customer acceptances usually requires that we fill a number of production slots in any given quarter in order to meet our sales targets. If we are unsuccessful in our efforts to secure those production orders, or if existing production orders are delayed or cancelled, our results of operations will be materially adversely impacted. Accordingly, we may not be able to achieve or maintain our current or prior level of sales. We presently expect net sales in 2010 to increase 20% to 30% from 2009 net sales of $95.8 million.
Because our net sales are subject to a number of risks, including risks associated with the market acceptance of our new laser processing product line, delays in customer acceptance, intense competition in the capital equipment industry, uncertainty relating to the timing and market acceptance of our products, and the condition of the macro-economy and the semiconductor industry and the other risks described in this report, we may not exceed or maintain our current or prior level of net sales for any period in the future. Additionally, we believe that the market acceptance and volume production of our advanced packaging systems, laser processing systems, and our 1000 series family of wafer steppers are of critical importance to our future financial results. At December 31, 2009, these critical systems represented 90% of our backlog. To the extent that these products do not achieve or maintain significant sales due to difficulties involving manufacturing or engineering, the inability to reduce the current long manufacturing cycles for these products, competition, excess capacity in the semiconductor or nanotechnology device industries, or for any other reason, our business, financial condition and results of operations would be materially adversely affected.
We anticipate our operating income to be positive for 2010. We believe our cash flow for 2010 will continue to be positive.
LIQUIDITY AND CAPITAL RESOURCES
Net cash provided by operating activities was $3.2 million for the year ended December 31, 2009, as compared with $23.2 million for the comparable period in 2008. Net cash provided by operating activities during the year ended December 31, 2009 was attributable to our net income generated from product and service sales and lower overall spending from our cost-cutting measures plus the net effect of non-cash expenses from depreciation, amortization and stock-based compensation charges. Other sources of cash from operating activities included decreases in inventory and increases in deferred product and services income. The decrease in inventory was due to more sales than materials purchased in 2009. The increases in deferred product and services income was primarily due to timing of installation and acceptance resulting in more systems deferred at December 31, 2009. These sources of cash were partially offset by the increase in trade receivables and the decreases in accounts payable and other current liabilities.
We believe that because of the relatively long manufacturing cycle of certain of our systems, particularly newer products, our inventories will continue to represent a significant portion of working capital. Currently, we are devoting significant resources to the development, introduction and commercialization of our laser processing systems and to the development of our next generation 1X lithography technologies. We currently intend to continue to incur significant operating expenses in the areas of research, development and engineering, manufacturing, and selling, general and administrative costs in order to further develop, produce and support these new products. Additionally, gross profit margins, inventory and capital equipment levels may be adversely impacted in the future by costs associated with the initial production of the laser processing systems and by future generations of our 1X wafer steppers. These costs include, but are not limited to, additional manufacturing overhead, costs of demonstration systems and facilities and the establishment of additional after-sales support organizations. Additionally, there can be no assurance that operating expenses will not increase, relative to sales, as a result of adding
31
technical, marketing and administrative personnel, among other costs, to support our new products. If we are unable to achieve significantly increased net sales or if our sales fall below expectations, our cash flow and operating results will be materially adversely affected until, among other factors, costs and expenses can be reduced. Our failure to achieve our sales targets for these new products could result in additional inventory write-offs and asset impairment charges, either of which could materially adversely impact our results of operations.
During the year ended December 31, 2009, net cash used in investing activities was $40.6 million, as compared with net cash provided by investing activities of $14.6 million for the comparable period in 2008. Net cash used in investing activities during the year ended December 31, 2009 was attributable to net purchase of short-term investments of $38.1 million and capital expenditures of $3.6 million, partially offset by proceeds of $1.1 million from the sale-leaseback of certain equipment during the year.
Net cash provided by financing activities was $2.0 million during the year ended December 31, 2009, as compared with $1.7 million for the comparable period in 2008. Net cash provided by financing activities during the year ended December 31, 2009 was attributable to proceeds received from the issuance of common stock under our employee stock option plans.
At December 31, 2009, we had working capital of $193.1 million. Our principal source of liquidity at December 31, 2009 consisted of $154.3 million in cash, cash equivalents and short-term investments, net of related borrowings under our line of credit.
In December 2004, we entered into a line of credit agreement with a brokerage firm replacing a similar arrangement that we had with a different firm. Under the terms of this agreement, we may borrow funds at a cost equal to the current Federal funds rate plus 125 basis points (i.e. 1.36% as of December 31, 2009). Certain of our cash, cash equivalents and short-term investments secure outstanding borrowings under this facility. We may borrow up to 75% of our total cash, cash equivalents and investments balance in this brokerage account. Funds are advanced to us under this facility based on pre-determined advance rates on the cash and securities held by us in this brokerage account. This agreement has no set expiration date and there are no loan covenants. As of each of December 31, 2009 and 2008, $6.0 million was outstanding under this facility, with a related collateral requirement of approximately $8.0 million of our cash, cash equivalents and investments.
The following summarizes our contractual obligations at December 31, 2009, and the effect such obligations are expected to have on our liquidity and cash flows in future periods:
| In millions |
Total | Less than 1 year |
1-3 years | 3-5 years | After 5 years | ||||||||||
| Notes payable obligations |
$ | 6.0 | $ | 6.0 | $ | — | $ | — | $ | — | |||||
| Non-cancelable capital lease obligations |
0.4 | 0.1 | 0.3 | — | — | ||||||||||
| Non-cancelable operating lease obligations |
17.9 | 5.3 | 6.8 | 3.9 | 1.9 | ||||||||||
| Long-term payables |
2.1 | — | 0.1 | 0.1 | 1.9 | ||||||||||
| Asset retirement obligations |
2.2 | — | 2.1 | — | 0.1 | ||||||||||
| Open purchase order commitments |
37.4 | 24.1 | 13.3 | — | — | ||||||||||
| Total contractual cash obligations |
$ | 66.0 | $ | 35.5 | $ | 22.6 | $ | 4.0 | $ | 3.9 | |||||
The amounts shown in the table above for open purchase order commitments are primarily related to the purchase of inventories, equipment and leasehold improvements. We record charges to operations for purchase order commitments we deem in excess of normal operating requirements (see “Critical Accounting Policies and Estimates”).
The development and manufacture of new lithography systems and enhancements are highly capital-intensive. In order to be competitive, we believe we must continue to make significant expenditures for capital equipment; sales, service, training and support capabilities; systems, procedures and controls; and expansion of operations and research and development, among many other items. We expect that cash generated from operations and our cash, cash equivalents and short-term investments will be sufficient to meet our cash requirements for at least the next twelve months. However, in the near-term, we may continue to utilize existing and future lines of credit, and other sources of financing, in order to maintain our present levels of cash, cash equivalents and short-term investments. Beyond the next twelve months, we may require additional equity or debt financing to address our working capital or capital equipment needs. In addition, we may seek to raise equity or debt capital at any time that we deem market conditions to be favorable. Additional financing, if needed, may not be available on reasonable terms, or at all.
We may in the future pursue acquisitions of complementary product lines, technologies or businesses. Future acquisitions may result in potentially dilutive issuances of equity securities, the incurrence of debt and contingent liabilities and amortization expenses and impairment charges related to goodwill and other intangible assets, which could materially adversely affect our financial condition and results of operations. In addition, acquisitions involve numerous risks, including difficulties in the assimilation of the operations, technologies, personnel and products of the acquired companies; the diversion of management’s attention from other business concerns; risks of entering markets in which we have limited or no
32
direct experience; and the potential loss of key employees of the acquired company. In the event we acquire product lines, technologies or businesses which do not complement our business, or which otherwise do not enhance our sales or operating results, we may incur substantial write-offs and higher recurring operating costs, which could have a material adverse effect on our business, financial condition and results of operations. In the event that any such acquisition does occur, there can be no assurance as to the effect thereof on our business or operating results.
Off-Balance Sheet Transactions
Our off-balance sheet transactions consist of certain financial guarantees, both expressed and implied, related to indemnification for product liability, patent infringement and latent product defects. Other than liabilities recorded pursuant to known product defects, at December 31, 2009, we did not record a liability associated with these guarantees, as we have little or no history of costs associated with such indemnification requirements. (See Note 16 to our Consolidated Financial Statements for additional information.)
Foreign Currency
As part of our overall strategy to manage the level of exposure to the risk of foreign currency exchange rate fluctuations, we attempt to hedge most of our Japanese yen denominated foreign currency exposures. We use foreign currency forward contracts to hedge the risk that outstanding Japanese yen denominated receipts from customers, for actual or forecasted sales of equipment after receipt of customer orders, may be adversely affected by changes in foreign currency exchange rates. We use foreign currency forward exchange contracts and natural hedges to offset substantial portions of the potential gains or losses associated with our Japanese yen denominated assets and liabilities due to exchange rate fluctuations. We enter into foreign currency forward contracts that generally have maturities of nine months or less.
ITEM 7A. QUANTITATIVE AND QUALITATIVE DISCLOSURES ABOUT MARKET RISK
Interest Rate Risk
Our exposure to market risk due to potential changes in interest rates, relates primarily to our investment portfolio, which consisted primarily of fixed interest rate instruments as of December 31, 2009 and 2008. We maintain an investment policy designed to ensure the safety and preservation of our invested funds by limiting market risk and the risk of default.
Certain of our cash, cash equivalents and investments serve as collateral for a line of credit we maintain with a brokerage firm. The line of credit is used for liquidity purposes, mitigating the need to liquidate investments in order to meet our current operating cash requirements.
The following table presents the hypothetical changes in fair values in the financial instruments held by us at December 31, 2009 that are sensitive to changes in interest rates. These instruments are comprised of cash equivalents and investments. These instruments are held for purposes other than trading. The modeling techniques used measure the change in fair values arising from selected hypothetical changes in interest rates. Assumed market value changes to our portfolio reflects immediate hypothetical parallel shifts in the yield curve of plus or minus 50 basis points (“BPS”), 100 BPS, and 150 BPS:
| Cash equivalents and Available-for-sale Investments, in thousands |
Valuation of securities given an interest rate decrease of X basis points |
No change in interest rate |
Valuation of securities given an increase rate of X basis points | ||||||||||||||||||
| (150 BPS) | (100 BPS) | (50 BPS) | 0 BPS | 50 BPS | 100 BPS | 150 BPS | |||||||||||||||
| Commercial papers |
$ | 14,030 | $ | 14,019 | $ | 14,007 | $ | 13,996 | $ | 13,984 | $ | 13,973 | $ | 13,961 | |||||||
| Money market funds |
15,739 | 15,738 | 15,739 | 15,738 | 15,738 | 15,737 | 15,738 | ||||||||||||||
| U.S. corporate debt securities |
1,204 | 1,200 | 1,196 | 1,193 | 1,189 | 1,185 | 1,182 | ||||||||||||||
| U.S. treasury bills and notes |
15,324 | 15,282 | 15,241 | 15,200 | 15,160 | 15,119 | 15,079 | ||||||||||||||
| Securities and obligations of U.S. |
84,071 | 83,825 | 83,581 | 83,338 | 83,098 | 82,862 | 82,625 | ||||||||||||||
| Total investments |
$ | 130,368 | $ | 130,064 | $ | 129,764 | $ | 129,465 | $ | 129,169 | $ | 128,876 | $ | 128,585 | |||||||
During 2009, we did not materially alter our investment objectives or criteria and believe that, although the composition of our portfolio has changed from the preceding year, the portfolio’s sensitivity to changes in interest rates is materially the same.
Credit Risk
We mitigate credit default risk by attempting to invest in high credit quality securities and by positioning our portfolio to respond appropriately to a significant reduction in a credit rating of any investment issuer or guarantor. Our portfolio includes only marketable securities with active secondary or resale markets to ensure portfolio liquidity and is diversified in
33
accordance with our investment policy. To date, we have not experienced significant liquidity problems with our portfolio. Our largest holding at December 31, 2009, excluding the United States government and its agencies, was $11.9 million of money market fund.
As of December 31, 2009, we did not have any investments in mortgage backed or auction rate securities or any security investments in the financial service sector. However, we intend to closely monitor developments in the credit markets and make appropriate changes to our investment policy as deemed necessary or advisable. Based on our ability to liquidate our investment portfolio and our expected operating cash flows, we do not anticipate any liquidity constraints as a result of the current credit environment.
Foreign Exchange Risk
The majority of our revenue, expense and capital purchasing activities are transacted in U.S. dollars. However, we do enter into these transactions in other currencies, primarily Japanese yen. To protect against reductions in value and the volatility of future cash flows caused by changes in currency exchange rates we have established cash flow and balance sheet hedging programs.
We use foreign currency forward contracts to hedge the risk that outstanding Japanese yen denominated receipts from customers for actual or forecasted sales of equipment may be adversely affected by changes in foreign currency exchange rates. Our hedging programs reduce, but do not always entirely eliminate, the impact of currency movements. See “Derivative instruments and hedging” in Note 4 of Notes to Consolidated Financial Statements for additional disclosures.
ITEM 8. FINANCIAL STATEMENTS AND SUPPLEMENTARY DATA
The Selected Financial Data information contained in Item 6 of Part II hereof is hereby incorporated by reference into this Item 8 of Part II of this Form 10-K.
ULTRATECH, INC.
INDEX TO CONSOLIDATED FINANCIAL STATEMENTS
Consolidated Financial Statements included in Item 8:
34
CONSOLIDATED BALANCE SHEETS
| In thousands, except share and per share amounts |
December 31, 2009 |
December 31, 2008 |
||||||
| Assets |
||||||||
| Current assets: |
||||||||
| Cash and cash equivalents |
$ | 58,617 | $ | 94,034 | ||||
| Short-term investments |
101,724 | 64,464 | ||||||
| Accounts receivable, net of allowance for doubtful accounts of $318 and $185 at December 31, 2009 and 2008, respectively |
31,426 | 18,318 | ||||||
| Inventories |
25,881 | 31,618 | ||||||
| Prepaid expenses and other current assets |
4,163 | 4,836 | ||||||
| Total current assets |
221,811 | 213,270 | ||||||
| Equipment and leasehold improvements, net |
9,841 | 12,788 | ||||||
| Other assets |
2,929 | 3,133 | ||||||
| Total assets |
$ | 234,581 | $ | 229,191 | ||||
| Liabilities and Stockholders’ Equity |
||||||||
| Current liabilities: |
||||||||
| Notes payable |
$ | 6,000 | $ | 6,000 | ||||
| Accounts payable |
7,112 | 8,830 | ||||||
| Accrued expenses |
6,720 | 9,923 | ||||||
| Deferred product and services income |
8,846 | 4,328 | ||||||
| Total current liabilities |
28,678 | 29,081 | ||||||
| Accrued rent |
781 | 1,505 | ||||||
| Other liabilities |
5,154 | 5,182 | ||||||
| Commitments and contingencies |
||||||||
| Stockholders’ equity: |
||||||||
| Preferred Stock, $0.001 par value: |
||||||||
| 2,000,000 shares authorized; none issued |
— | — | ||||||
| Common Stock, $0.001 par value: |
||||||||
| 40,000,000 shares authorized; 23,838,084 and 23,516,198 shares issued and outstanding at December 31, 2009 and 2008, respectively |
26 | 25 | ||||||
| Additional paid-in capital |
238,137 | 233,246 | ||||||
| Treasury stock: 1,840,801 and 1,843,301 shares at December 31, 2009 and 2008, respectively |
(26,569 | ) | (26,605 | ) | ||||
| Accumulated other comprehensive income, net |
(38 | ) | 474 | |||||
| Accumulated deficit |
(11,588 | ) | (13,717 | ) | ||||
| Total stockholders’ equity |
199,968 | 193,423 | ||||||
| Total liabilities and stockholders’ equity |
$ | 234,581 | $ | 229,191 | ||||
See accompanying notes to consolidated financial statements.
35
CONSOLIDATED STATEMENTS OF OPERATIONS
| Years Ended December 31, | ||||||||||||
| In thousands, except per share amounts |
2009 | 2008 | 2007 | |||||||||
| Net sales |
||||||||||||
| Products |
$ | 80,540 | $ | 114,311 | $ | 96,583 | ||||||
| Services |
15,066 | 17,036 | 15,627 | |||||||||
| Licenses |
207 | 400 | 100 | |||||||||
| Total net sales |
95,813 | 131,747 | 112,310 | |||||||||
| Cost of sales |
||||||||||||
| Cost of products sold |
41,485 | 58,235 | 53,834 | |||||||||
| Cost of services |
9,338 | 9,138 | 9,617 | |||||||||
| Gross profit |
44,990 | 64,374 | 48,859 | |||||||||
| Research, development and engineering |
18,759 | 23,316 | 23,435 | |||||||||
| Selling, general and administrative |
27,333 | 31,923 | 31,191 | |||||||||
| Operating income (loss) |
(1,102 | ) | 9,135 | (5,767 | ) | |||||||
| Interest expense |
288 | (121 | ) | (701 | ) | |||||||
| Interest and other income, net |
2,873 | 3,171 | 5,710 | |||||||||
| Income (loss) before income taxes |
2,059 | 12,185 | (758 | ) | ||||||||
| Provision (benefit) for income taxes |
(70 | ) | 408 | 286 | ||||||||
| Net income (loss) |
$ | 2,129 | $ | 11,777 | $ | (1,044 | ) | |||||
| Net income (loss) per share—basic |
||||||||||||
| Net income (loss) |
$ | 0.09 | $ | 0.50 | $ | (0.04 | ) | |||||
| Number of shares used in per share computations—basic |
23,690 | 23,524 | 23,354 | |||||||||
| Net income (loss) per share—diluted |
||||||||||||
| Net income (loss) |
$ | 0.09 | $ | 0.50 | $ | (0.04 | ) | |||||
| Number of shares used in per share computations—diluted |
23,852 | 23,665 | 23,354 | |||||||||
See accompanying notes to consolidated financial statements.
36
CONSOLIDATED STATEMENTS OF CASH FLOWS
| Years Ended December 31, | ||||||||||||
| In thousands |
2009 | 2008 | 2007 | |||||||||
| Cash flows from operating activities: |
||||||||||||
| Net income (loss) |
$ | 2,129 | $ | 11,777 | $ | (1,044 | ) | |||||
| Adjustments to reconcile net income (loss) to net cash provided by operating activities: |
||||||||||||
| Depreciation |
4,350 | 5,431 | 6,386 | |||||||||
| Amortization |
611 | 898 | 907 | |||||||||
| Amortization of postretirement benefit plan obligation |
46 | 102 | 8 | |||||||||
| Accretion of asset retirement obligations |
167 | 157 | 240 | |||||||||
| Loss on disposal of equipment |
120 | 22 | 217 | |||||||||
| Stock-based compensation |
2,922 | 2,388 | 1,552 | |||||||||
| Deferred income taxes |
(126 | ) | (43 | ) | 40 | |||||||
| Changes in operating assets and liabilities: |
||||||||||||
| Accounts receivable |
(13,108 | ) | 12,244 | (12,508 | ) | |||||||
| Inventories |
6,554 | (2,397 | ) | 10,324 | ||||||||
| Prepaid expenses and other current assets |
757 | (896 | ) | 129 | ||||||||
| Other assets |
36 | (352 | ) | 464 | ||||||||
| Accounts payable |
(1,718 | ) | 630 | (2,240 | ) | |||||||
| Accrued expenses |
(2,787 | ) | (387 | ) | (5,221 | ) | ||||||
| Deferred product and services income |
4,518 | (5,833 | ) | 7,211 | ||||||||
| Other liabilities |
(1,245 | ) | (530 | ) | (468 | ) | ||||||
| Net cash provided by operating activities |
3,226 | 23,211 | 5,997 | |||||||||
| Cash flows from investing activities: |
||||||||||||
| Capital expenditures |
(3,646 | ) | (4,713 | ) | (1,112 | ) | ||||||
| Proceeds from sales of fixed assets |
1,137 | 6,801 | — | |||||||||
| Purchase of patents |
— | (744 | ) | — | ||||||||
| Purchase of investments in securities |
(125,134 | ) | (116,723 | ) | (59,710 | ) | ||||||
| Proceeds from maturities of investments |
87,024 | 129,964 | 84,994 | |||||||||
| Net cash provided by (used in) investing activities |
(40,619 | ) | 14,585 | 24,172 | ||||||||
| Cash flows from financing activities: |
||||||||||||
| Proceeds from notes payable |
34,056 | 49,061 | 27,456 | |||||||||
| Repayment of notes payable |
(34,056 | ) | (48,855 | ) | (28,636 | ) | ||||||
| Proceeds from issuance of common stock for stock option exercises |
2,448 | 1,446 | 1,714 | |||||||||
| Tax payment for issuance of common stock from release of restricted stock units |
(472 | ) | — | — | ||||||||
| Net cash provided by financing activities |
1,976 | 1,652 | 534 | |||||||||
| Net increase (decrease) in cash and cash equivalents |
(35,417 | ) | 39,448 | 30,703 | ||||||||
| Cash and cash equivalents at beginning of period |
94,034 | 54,586 | 23,883 | |||||||||
| Cash and cash equivalents at end of period |
$ | 58,617 | $ | 94,034 | $ | 54,586 | ||||||
| Supplemental disclosures of cash flow information: |
||||||||||||
| Cash paid during the period for: |
||||||||||||
| Interest |
$ | 32 | $ | 51 | $ | 332 | ||||||
| Income taxes paid |
$ | 194 | $ | 442 | $ | 590 | ||||||
| Other non-cash changes: |
||||||||||||
| Capital lease of phone system |
$ | — | $ | 42 | $ | 562 | ||||||
| Systems transferred from (to) inventory to (from) equipment and other assets |
$ | 1,361 | $ | (93 | ) | $ | 1,535 | |||||
See accompanying notes to consolidated financial statements.
37
CONSOLIDATED STATEMENTS OF STOCKHOLDERS’ EQUITY
| Stockholders’ Equity | ||||||||||||||||||||||||
| Common Stock | Additional Paid-in Capital |
Treasury Stock |
Accumulated Other Comprehensive Income (Loss) |
Accumulated (Deficit) |
Total Stockholders’ Equity |
|||||||||||||||||||
| In thousands, except share data |
Shares | Amount | ||||||||||||||||||||||
| Balance at December 31, 2006 |
23,218,722 | $ | 25 | $ | 226,146 | $ | (26,670 | ) | $ | (915 | ) | $ | (24,478 | ) | $ | 174,108 | ||||||||
| Net issuance of common stock under stock option plans |
152,333 | — | 1,714 | 36 | — | — | 1,750 | |||||||||||||||||
| Stock-based compensation |
— | — | 1,552 | — | — | — | 1,552 | |||||||||||||||||
| Impact of adjustment on adoption of ASC 740 |
— | — | — | — | — | 28 | 28 | |||||||||||||||||
| Components of comprehensive loss: |
||||||||||||||||||||||||
| Change in net unrealized gains (losses) on: |
||||||||||||||||||||||||
| Available-for-sale investments |
— | — | — | — | 1,051 | — | 1,051 | |||||||||||||||||
| Foreign exchange contracts |
— | — | — | — | (53 | ) | — | (53 | ) | |||||||||||||||
| Change in minimum postretirement benefits obligation |
— | — | — | — | 8 | — | 8 | |||||||||||||||||
| Net loss |
— | — | — | — | — | (1,044 | ) | (1,044 | ) | |||||||||||||||
| Total comprehensive loss |
(38 | ) | ||||||||||||||||||||||
| Balance at December 31, 2007 |
23,371,055 | 25 | 229,412 | (26,634 | ) | 91 | (25,494 | ) | 177,400 | |||||||||||||||
| Net issuance of common stock under stock option plans |
145,143 | — | 1,446 | 29 | — | — | 1,475 | |||||||||||||||||
| Stock-based compensation |
— | — | 2,388 | — | — | — | 2,388 | |||||||||||||||||
| Components of comprehensive income: |
||||||||||||||||||||||||
| Change in net unrealized gains (losses) on: |
||||||||||||||||||||||||
| Available-for-sale investments |
— | — | — | — | 444 | — | 444 | |||||||||||||||||
| Foreign exchange contracts |
— | — | — | — | (163 | ) | — | (163 | ) | |||||||||||||||
| Change in minimum postretirement benefits obligation |
— | — | — | — | 102 | — | 102 | |||||||||||||||||
| Net income |
— | — | — | — | — | 11,777 | 11,777 | |||||||||||||||||
| Total comprehensive income |
12,160 | |||||||||||||||||||||||
| Balance at December 31, 2008 |
23,516,198 | 25 | 233,246 | (26,605 | ) | 474 | (13,717 | ) | 193,423 | |||||||||||||||
| Net issuance of common stock under stock option plans |
321,886 | 1 | 1,968 | 36 | — | — | 2,005 | |||||||||||||||||
| Stock-based compensation |
— | — | 2,923 | — | — | — | 2,923 | |||||||||||||||||
| Components of comprehensive income: |
||||||||||||||||||||||||
| Change in net unrealized gains (losses) on: |
||||||||||||||||||||||||
| Available-for-sale investments |
— | — | — | — | (643 | ) | — | (643 | ) | |||||||||||||||
| Foreign exchange contracts |
— | — | — | — | 84 | — | 84 | |||||||||||||||||
| Change in minimum postretirement benefits obligation |
— | — | — | — | 47 | — | 47 | |||||||||||||||||
| Net income |
— | — | — | — | — | 2,129 | 2,129 | |||||||||||||||||
| Total comprehensive income |
1,617 | |||||||||||||||||||||||
| Balance at December 31, 2009 |
23,838,084 | $ | 26 | $ | 238,137 | $ | (26,569 | ) | $ | (38 | ) | $ | (11,588 | ) | $ | 199,968 | ||||||||
See accompanying notes to consolidated financial statements.
38
ULTRATECH, INC.
NOTES TO CONSOLIDATED FINANCIAL STATEMENTS
1. COMPANY AND INDUSTRY INFORMATION
Nature of Operations
Ultratech, Inc. (referred to as “Ultratech” and “we”) develops, manufactures and markets photolithography and laser thermal processing equipment for manufacturers of semiconductor and nanotechnology components located throughout North America, Europe, Japan, Taiwan and the rest of Asia.
We supply step-and-repeat photolithography systems based on one-to-one imaging technology. Within the integrated circuit industry, we target the market for advanced packaging applications. Within the nanotechnology industry, our target markets include thin film head magnetic recording devices, optical networking devices, laser diodes and high-brightness light emitting diodes (“HBLEDs”). Our laser thermal processing equipment is targeted at advanced annealing applications within the semiconductor industry.
Major Customers
In 2009, Taiwan Semiconductor Manufacturing Co. Ltd., Intel Corporation and STATS ChipPAC Ltd. accounted for 22%, 19% and 14% of our net sales, respectively. Intel Corporation accounted for 32% and 20% of our net sales in 2008 and 2007, respectively, and was the only customer that accounted for more than 10% of our net sales in 2008 and 2007.
At December 31, 2009, Taiwan Semiconductor Manufacturing Co. Ltd., STATS ChipPAC Ltd. and Intel Corporation accounted for 41%, 16% and 2% of our accounts receivable, respectively. At December 31, 2008, Intel Corporation accounted for 26% of our accounts receivable.
Business Segments
In evaluating our business, we give consideration to the Chief Executive Officer’s review of financial information and the organizational structure of our management. Based on this review, we concluded that, at the present time, resources are allocated and other financial decisions are made based on consolidated financial information. Accordingly, we have determined that we operate in one business segment, which is the manufacture and distribution of capital equipment to manufacturers of integrated circuits and nanotechnology components.
Enterprise-Wide Disclosures
Our products are manufactured in the United States and are sold worldwide. We market our products internationally through domestic and foreign-based sales and service. The following table presents enterprise-wide sales to external customers and long-lived assets by geographic region:
| In thousands |
2009 | 2008 | 2007 | ||||||
| Net sales: |
|||||||||
| United States of America |
$ | 27,034 | $ | 50,352 | $ | 38,740 | |||
| International: |
|||||||||
| Japan |
11,801 | 21,514 | 23,267 | ||||||
| Europe |
3,255 | 24,328 | 17,962 | ||||||
| Taiwan |
30,827 | 12,567 | 14,753 | ||||||
| Singapore |
14,956 | 439 | 5,218 | ||||||
| Rest of the world |
7,940 | 22,547 | 12,370 | ||||||
| subtotal |
68,779 | 81,395 | 73,570 | ||||||
| Total |
$ | 95,813 | $ | 131,747 | $ | 112,310 | |||
| Long-lived assets: |
|||||||||
| United States of America |
$ | 11,941 | $ | 14,905 | $ | 22,351 | |||
| Rest of the world |
829 | 1,016 | 728 | ||||||
| Total |
$ | 12,770 | $ | 15,921 | $ | 23,079 | |||
The rest of the world is comprised of sales to customers and long-lived assets in countries that are individually insignificant.
39
With the exception of Japan, our operations in foreign countries are not currently subject to significant currency exchange rate fluctuations, principally because sales contracts for our systems are generally denominated in U.S. dollars. In Japan, we sell our products in both U.S. dollars and Japanese yen. However, we attempt to mitigate our currency exchange rate exposure through the use of currency forward contracts. (See “Derivative Instruments and Hedging” in Note 4.)
2. CONCENTRATIONS OF RISKS
Financial instruments that potentially subject us to concentrations of credit risk consist principally of cash equivalents, short-term investments and trade receivables. These credit risks include the potential inability of an issuer or customer to honor their obligations under the terms of the instrument or the sales agreement. We place our cash equivalents and investments with high credit-quality financial institutions. We invest our excess cash in commercial paper, readily marketable debt instruments and collateralized funds of U.S. and state government entities. We have established guidelines relative to credit ratings, diversification and maturities that seek to maintain principal balance and liquidity.
A majority of our trade receivables are derived from sales in various geographic areas, principally the U.S., Europe, Japan, Taiwan and the rest of Asia, to large companies within the integrated circuit and nanotechnology industries. We perform ongoing credit evaluations of our customers’ financial condition and require collateral, whenever deemed necessary. As of December 31, 2009 and 2008, the recorded value of our accounts receivable approximated fair value due to the short-term nature of our accounts receivable.
Sole-source and single-source suppliers provide critical components and services for the manufacture of our products. The reliance on sole or limited groups of suppliers may subject us from time to time to quality, allocation and pricing constraints.
3. BASIS OF PRESENTATION
The accompanying consolidated financial statements include the accounts of Ultratech and our subsidiaries, all of which are wholly owned. Intercompany balances and transactions have been eliminated.
The U.S. dollar is the functional currency for all foreign operations. Foreign exchange gains and losses which result from the process of remeasuring foreign currency financial statements into U.S. dollars or from foreign currency exchange transactions during the period, are included in interest and other income, net. Net foreign exchange losses in 2009 and 2008 were $0.4 million and $0.3 million, respectively, as compared to gains of $0.3 million in 2007.
We have evaluated subsequent events, as defined by Accounting Standard Codification (“ASC”) Topic 855, through March 1, 2010, which is the issuance date of our financial statements.
Use of Estimates
The preparation of the financial statements and related disclosures in conformity with accounting principles generally accepted in the United States requires management to make estimates and judgments that affect the reported amounts of assets, liabilities, revenues and expenses, and related disclosure of contingent assets and liabilities at the date of the consolidated financial statements. By their nature, these estimates and judgments are subject to an inherent degree of uncertainty. On an ongoing basis, management evaluates its estimates, including those related to inventories and purchase order commitments, warranty obligations, asset retirement obligations, bad debts, estimated useful lives of fixed assets, asset impairment, income taxes, restructuring and contingencies and litigation. Management bases its estimates on historical experience and on various other analyses and assumptions that are believed to be reasonable under the circumstances, the results of which form the basis for making judgments about the carrying values of assets and liabilities that are not readily apparent from other sources. Actual results may differ from these estimates under different assumptions or conditions.
4. SUMMARY OF SIGNIFICANT ACCOUNTING POLICIES
Cash Equivalents
Cash equivalents consist of highly liquid investments with an original maturity date at acquisition of three months or less. The carrying value of cash equivalents approximates fair value.
Investments
Management determines the appropriate classification of its investments at the time of purchase and re-evaluates the classification at each balance sheet date. At December 31, 2009 and 2008, all investments and cash equivalents in our portfolio were classified as “available-for-sale” and are stated at fair value, with the unrealized gains and losses, net of tax, reported in accumulated other comprehensive income (loss), as a separate component of stockholders’ equity. The fair value
40
of short-term investments are estimated based on quoted prices in active markets or significant other observable inputs as of December 31, 2009 and 2008.
The amortized cost of debt securities is adjusted for amortization of premiums and accretion of discounts to maturity. Such amortization, as well as interest, dividends, realized gains and losses and declines in value judged to be other than temporary are included in interest and other income, net. The cost of securities sold is based on the specific identification method.
Allowance for Bad Debts
We maintain an allowance for uncollectible accounts receivable based upon expected collectibility. This reserve is established based upon historical trends, current economic conditions, delinquency status based on contractual terms and an analysis of specific exposures.
Inventories
Inventories are stated at the lower of cost or market. Cost is determined using the first-in, first-out method. The semiconductor industry is characterized by rapid technological change, changes in customer requirements and evolving industry standards. We perform a detailed assessment of inventory at each balance sheet date, which includes a review of, among other factors, demand requirements and market conditions. Based on this analysis, we record adjustments, when appropriate, to reflect inventory at lower of cost or market.
Long-lived Assets
Equipment and leasehold improvements are stated at cost, less accumulated depreciation and amortization. Equipment is depreciated on a straight-line basis over the estimated useful lives (i.e. three to 10 years). Leasehold improvements are amortized on a straight-line basis over the life of the related assets or the lease term, whichever is shorter. Depreciation and amortization expense for the years ended 2009 and 2008 was $4.9 million and $6.2 million, respectively.
We review long-lived assets for impairment whenever events or changes in circumstances indicate that the carrying amount of these assets may not be recoverable. We assess these assets for impairment based on estimated future cash flows from these assets. No asset impairment charges have been recorded during the three years ended December 31, 2009.
Related-Party Transactions
During 2009 and 2008, we made loans to several of our employees totaling $0.1 million and $0.4 million, respectively, in the form of full-recourse promissory notes. The notes accrue interest at a weighted average annual rate of 2.2% and 3.0%, respectively. The notes have a term ranging from two to six years. Certain of the notes are secured by deeds of trust for the employees’ personal residences. As of December 31, 2009, the outstanding principal balances were $0.8 million, including principal amounts outstanding under loans made prior to 2008.
In April 2006, we appointed a new member to our Board of Directors who was also an officer of one of our customers until September 2007. During 2007, sales to that customer totaled $5.9 million. We had $0.3 million of accounts receivable from that customer at December 31, 2007.
Derivative Instruments and Hedging
The majority of our revenue, expense and capital purchasing activities are transacted in U.S. dollars. However, we also enter into these transactions in other currencies, primarily Japanese yen. Our policy is to minimize foreign currency denominated transaction and remeasurement exposures with derivative instruments, mainly forward contracts. The gains and losses on these derivatives are intended to at least partially offset the transaction and remeasurement gains and losses recognized in earnings. We do not enter into foreign exchange forward contracts for speculative purposes. Under ASC Topic 815, Derivatives and Hedging (“ASC 815”) all derivatives are recorded on the balance sheet at fair value. The gains and losses resulting from changes in fair value are accounted for depending on the use of the derivative and whether it is designated and qualifies for hedge accounting. All of our derivatives are designated as hedging instruments under ASC 815. The fair value of derivative instruments recorded in our Condensed Consolidated Balance Sheets is as follows:
| Asset Derivatives as of December 31, 2009 | |||||
| In thousands |
Balance Sheet Location |
Fair Value | |||
| Foreign exchange contracts |
Other current assets | $ | 79 | ||
| Total derivatives |
$ | 79 | |||
41
Our derivative financial instruments are subject to both credit and market risk. Credit risk is the risk of loss due to failure of a counterparty to perform its obligations in accordance with contractual terms. Market risk is the potential change in an investment’s value caused by fluctuations in interest and currency exchange rates, credit spreads or other variables. We monitor the credit-worthiness of the financial institutions that are counterparties to our derivative financial instruments and do not consider the risks of counterparty nonperformance to be material. Credit and market risks, as a result of an offset by the underlying cash flow being hedged, related to derivative instruments were not considered material at December 31, 2009 and 2008.
Cash Flow Hedging
We designate and document as cash flow hedges foreign exchange forward contracts that are used by us to hedge the risk that forecasted revenue may be adversely affected by changes in foreign currency exchange rates. The effective portion of the contracts’ gains or losses is included in accumulated other comprehensive income (loss) (“OCI”) until the period in which the forecasted sale being hedged is recognized, at which time the amount in OCI is reclassified to earnings as a component of revenue. To the extent that any of these contracts are not considered to be effective in offsetting the change in the value of the forecasted sales being hedged, the ineffective portion of these contracts is immediately recognized in income as a component of interest and other income, net. For the year ended December 31, 2009, there was no hedge ineffectiveness. We calculate hedge effectiveness at a minimum each fiscal quarter. We measure hedge effectiveness by comparing the cumulative change in the spot rate of the derivative with the cumulative change in the spot rate of the anticipated sales transactions. The maturity of these instruments is generally nine months or less. We record any excluded components of the hedge in interest and other income, net. As of December 31, 2009, the excluded components recorded in earnings were immaterial.
In the event the underlying forecasted transaction does not occur within the designated hedge period or it becomes probable that the forecasted transaction will not occur, the related gains and losses on the cash flow hedge are reclassified from OCI to interest and other income, net on the consolidated statement of operations. In the event it becomes probable that a hedged anticipated transaction will not occur, the gains or losses on the related cash flow hedges will immediately be reclassified from OCI to interest and other income, net.
We did not have any currency forward contracts classified as cash-flow hedges outstanding at December 31, 2009 as compared to one currency forward contract for the sale of Japanese yen of $0.7 million at December 31, 2008. As such, we did not record any accumulated losses or gains as a component of other comprehensive income (loss) at December 31, 2009 as compared to $0.1 million of accumulated losses at December 31, 2008. The fair value of derivatives classified as cash-flow hedges at December 31, 2008 was a liability of $39,000. The following sets forth the effect of the derivative instruments on our Condensed Consolidated Statements of Operations for the year ended December 31, 2009:
| Derivatives in ASC 815 |
Amount of Loss |
Location of Loss |
Amount of Loss |
Location of Gain |
Amount of Gain | |||||
| Foreign exchange contracts |
$40 | Product Sales | $40 | Interest and other income (expense), net | $1 |
Fair Value Hedging
We manage the foreign currency risk associated with yen denominated assets and liabilities using foreign exchange forward contracts with maturities of less than nine months. The change in fair value of these derivatives is recognized as a component of interest and other income, net and is intended to offset the remeasurement gains and losses associated with the non-functional currency denominated assets and liabilities.
At December 31, 2009 and 2008, we had currency forward contracts classified as fair value hedges for the sale of Japanese yen of $3.8 million and $8.7 million, respectively. The fair value of derivatives classified as fair value hedges at December 31, 2009 was an asset of $0.1 million as compared to a liability of $0.2 million at December 31, 2008. The following sets forth the effect of the derivative instruments on our Condensed Consolidated Statements of Operations for the year ended December 31, 2009:
| Derivatives in ASC 815 Fair Value Hedging Relationship |
Location of Gain Recognized in Income on Derivative |
Amount of Gain Recognized in Income on Derivatives for the Year Ended December 31, 2009 | ||
| Foreign exchange contracts |
Interest and other income (expense), net | $243 |
42
Revenue Recognition
We recognize revenue when persuasive evidence of an arrangement exists, delivery has occurred or services have been rendered, the seller’s price is fixed or determinable, and collectibility is reasonably assured. We derive revenue from four sources—system sales, spare parts sales, service contracts and license fees.
Provided all other criteria are met, we recognize revenues on system sales when we have received customer acceptance of the system. In the event that terms of the sale provide for a lapsing customer acceptance period, we recognize revenue upon the expiration of the lapsing acceptance period or customer acceptance, whichever occurs first. In these instances, which are infrequent, revenue is recorded only if the product has met product specifications prior to shipment and management deems that no significant uncertainties as to product performance exist.
Our transactions frequently include the sale of systems and services under multiple element arrangements. In situations with multiple deliverables, revenue is recognized upon the delivery of the separate elements and when we receive customer acceptance or are otherwise released from our customer acceptance obligations. Consideration from multiple element arrangements is allocated among the separate accounting units based on the residual method under which the revenue is allocated to undelivered elements based on fair value of such undelivered elements and the residual amounts of revenue allocated to delivered elements, provided the delivered elements have value on a stand alone basis, there is objective and reliable evidence of fair value for the undelivered elements, the arrangement does not include a general right of return relative to the delivered item and delivery or performance of the undelivered item(s) is considered probable and substantially in our control. The maximum revenue recognized on a delivered element is limited to the amount that is not contingent upon the delivery of additional items.
We generally recognize revenue from spare parts sales upon shipment, as our products are generally sold on terms that transfer title and risk of ownership when it leaves our site. We sell service contracts for which revenue is deferred and recognized ratably over the contract period (for time-based service contracts) or as service hours are delivered (for contracts based on a purchased quantity of hours). We recognize license revenue from transactions in which our systems are re-sold by our customers to third parties as well as from royalty arrangements.
Costs related to deferred product revenues are capitalized (deferred) and recognized at the time of revenue recognition. Deferred product revenue and costs are netted on our balance sheet, under the caption “deferred product and services income.” The gross amount of deferred revenues and deferred costs at December 31, 2009 were $13.4 million and $4.5 million, respectively. The gross amount of deferred revenues and deferred costs at December 31, 2008 were $5.3 million and $1.0 million, respectively.
Costs incurred for shipping and handling are included in cost of sales.
Warranty Accrual
We generally warrant our products for material and labor to repair the product for a period of 12 months for new products, or three months for refurbished products, from the date of customer acceptance. Accordingly, an accrual for the estimated cost of the warranty is recorded at the time the product is shipped and the related charge is recorded in the statement of operations at the time revenue is recognized.
Research, Development and Engineering Expenses
We are actively engaged in basic technology and applied research programs designed to develop new products and product applications. In addition, substantial ongoing product and process improvement engineering and support programs relating to existing products are conducted within engineering departments and elsewhere. Research, development and engineering costs are charged to operations as incurred.
Deferred Income Taxes
Deferred income taxes are provided for the tax effect of temporary differences between the tax basis of assets and liabilities and their reported amounts in the financial statements. ASC Topic 740, Income Taxes (“ASC 740”) provides for recognition of deferred tax assets if the realization of such deferred tax assets is more likely than not to occur. Realization of our net deferred tax assets is dependent upon our generation of sufficient taxable income in future years in appropriate tax jurisdictions to obtain the benefit of the reversal of temporary differences, net operating loss carryforwards, and tax credit carryforwards. The amount of deferred tax assets considered realizable is subject to adjustment in future periods if estimates of future taxable income are changed. With the exception of certain international jurisdictions (i.e., Singapore, Japan and Taiwan), we have determined that at this time it is more likely than not that deferred tax assets attributable to the remaining jurisdictions will not be realized, primarily due to uncertainties related to our ability to utilize the net operating loss and tax credit carryforwards before they expire based on our recent years history of losses and uncertainty of future taxable income.
43
Accordingly, we have established a valuation allowance for such deferred tax assets. If there is a change in our ability to realize the deferred tax assets, then our tax provision may decrease in the period in which we determine that realization is more likely than not.
Taxes Collected from Customers
We collect taxes from our customers for sales transactions as assessed by respective governmental authorities. On our consolidated statements of operations these taxes are presented on a net basis and are excluded from revenues and expenses.
Reclassifications
Certain reclassifications have been made to prior year balances to conform to the current year’s presentation.
Impact of Recently Issued Accounting Standards
In September 2009, the Financial Accounting Standards Board (“FASB”) issued Accounting Standard Update (“ASU”) No. 2009-13, Revenue Recognition (Topic 605) – Multi-Deliverables Revenue Arrangements, a Consensus of the FASB Emerging Issues Task Force, to address the accounting for multiple-deliverable arrangements to enable vendors to account for products or services (deliverables) separately rather than as a combined unit. It establishes the accounting and reporting guidance for arrangements under which the vendor will perform multiple revenue-generating activities, specifically, how to separate deliverables and how to measure and allocate arrangement consideration to one or more units of accounting. The update will be effective prospectively for revenue arrangements entered into or materially modified in fiscal years beginning on or after June 15, 2010. We are currently evaluating the impact, if any, of adopting the update.
In October 2009, the FASB issued ASU No. 2009-14, Software (Topic 985) – Certain Revenue Arrangements That Include Software Element, a Consensus of the FASB Emerging Issues Task Force, to address concerns relating to the accounting for revenue arrangements that contain tangible products and software. It requires a vendor to use vendor-specific objective evidence of selling price to separate deliverables in a multiple-element arrangement. The update will be effective prospectively for revenue arrangements entered into or materially modified in fiscal years beginning on or after June 15, 2010. We are currently evaluating the impact, if any, of adopting the update.
In January 2010, The FASB issued ASU No. 2010-06, Fair Value Measurements and Disclosures (Topic 820) – Improving Disclosures about Fair Value Measurements, to provide amendments to Subtopic 820-10 that require new disclosures for transfers in and out of Levels 1 and 2 and for activity in Level 3 fair value measurements. It also clarifies existing disclosures for level of disaggregation and disclosures about inputs and valuation techniques. The update will be effective for interim and annual reporting periods beginning after December 15, 2009, except for the disclosures of roll forward activities in Level 3 fair value measurements. Those disclosures are effective for interim and annual reporting periods beginning after December 15, 2010. We are currently evaluating the impact, if any, of adopting the update.
5. STOCK-BASED COMPENSATION
The following table shows total stock-based compensation expense recognized under ASC Topic 718, Compensation – Stock Compensation (“ASC 718”), for employees and directors and the effect to the accompanying Consolidated Statement of Operations for the years ended December 31, 2009, 2008 and 2007. There was no tax effect.
| Years Ended December 31, | |||||||||
| In thousands |
2009 | 2008 | 2007 | ||||||
| Cost of Sales |
$ | 194 | $ | 118 | $ | 97 | |||
| Research, development, and engineering |
553 | 464 | 378 | ||||||
| Selling, general and administrative expenses |
2,175 | 1,806 | 1,077 | ||||||
| Total stock-based compensation expense |
2,922 | 2,388 | 1,552 | ||||||
| Tax benefit related to stock-based compensation expense |
— | — | — | ||||||
| Net effect on net income/loss |
$ | 2,922 | $ | 2,388 | $ | 1,552 | |||
Compensation cost capitalized as part of inventory was immaterial during each of the years ended December 31, 2009 and 2008.
The estimated fair value of our stock-based awards, less expected forfeitures, is amortized over the awards’ vesting period using a single grant approach on a ratable basis for awards granted after the adoption of ASC 718 and using a multiple grant approach on an accelerated basis for awards granted prior to the adoption of ASC 718.
The fair value of each option award is estimated on the date of grant using the Black-Scholes valuation model and the assumptions noted in the following table. The expected life of options is based on observed historical exercise patterns.
44
Groups of employees that have similar historical exercise patterns have been considered separately for valuation purposes. The expected volatility of stock options for the year ended December 31, 2009 is based on the historical volatility of our Common Stock while it was based on a combination of historical and market-based implied volatility of our traded options for the years ended December 31, 2008 and 2007. This change did not have any material impact on our results of operations or financial position. The risk free interest rate is based on the implied yield on a U.S. Treasury zero-coupon issue with a remaining term equal to the expected term of the option. The dividend yield reflects that we have not paid any cash dividends since inception and do not intend to pay any cash dividends in the foreseeable future.
We used the following weighted-average assumptions to estimate the fair value of stock options at the date of grant using the Black-Scholes option-pricing model.
| 2009 | 2008 | 2007 | |||||||
| Expected life (in years) |
5.0 | 5.3 | 5.0 | ||||||
| Risk-free interest rate |
2.16 | % | 2.87 | % | 4.11 | % | |||
| Volatility factor |
0.48 | 0.51 | 0.47 | ||||||
| Dividend yield |
0 | % | 0 | % | 0 | % |
The weighted-average fair value per share of stock options granted during 2009, 2008 and 2007 was $6.00, $5.29 and $5.48, respectively.
1993 Stock Option Plan/Stock Issuance Plan
Under our 1993 Stock Option Plan/Stock Issuance Plan, as amended and restated as of January 30, 2006, officers and other key employees, non-employee Board members and consultants may receive equity incentive awards in the form of stock options to purchase shares of common stock at no less than 100% of fair value at the grant date or restricted stock or restricted stock units. Options historically have vested in equal monthly installments over a fifty-month period, with a minimum vesting period of twelve months from the grant date, and generally expire ten years from the date of grant or upon the expiration of a limited period following any earlier termination of employment. The plan was amended in January 2006 to allow the issuance of shares pursuant to restricted stock unit awards, and during fiscal years 2009, 2008 and 2007, restricted stock unit awards were made which generally vest in equal annual installments over a three-year period measured from the award date but which defer the issuance of the vested shares until the end of the vesting period, subject to earlier issuance upon termination of employment under certain circumstances or a change in control. Awards under the plan may be subject to accelerated vesting under certain circumstances should a change in control occur. The plan terminates on the earlier of February 28, 2011 or the date on which all shares available for issuance under the plan have been issued. Under the plan, approximately 2.5 million, 2.0 million and 1.7 million options and awards were available for issuance at December 31, 2009, 2008 and 2007, respectively.
1998 Supplemental Stock Option/Stock Issuance Plan
Under our 1998 Supplemental Stock Option/Stock Issuance Plan, as amended, eligible employees (i.e. other than executive officers and employees holding the title of Vice President or General Manager) were able to receive options to purchase shares of common stock at not less than 100% of fair value on the grant date. These options generally vest in equal monthly installments over a fifty-month period, with a minimum vesting period of twelve months from grant date, and generally expire ten years from date of grant, subject to earlier termination following the optionee’s cessation of employee status. Direct stock issuances may also be made under the plan, subject to similar vesting provisions.
The plan was amended in January 2008 to allow the issuance of shares pursuant to restricted stock unit awards, which generally vest in equal annual installments over a three-year period measured from the award date but which defer the issuance of the vested shares until the end of the vesting period, subject to earlier issuance upon termination of employment under certain circumstances or a change in control. Awards under the plan may be subject to accelerated vesting under certain circumstances should a change in control occur. Since the plan terminated on October 19, 2008, there were no options available for issuance at December 31, 2009 and 2008, as compared to 29,000 options that were available for issuance at December 31, 2007.
Stock Option Activity
A summary of our stock option activity as of December 31, 2009, and related information follows:
45
| Options | Weighted- Average Exercise Price |
Weighted Average Remaining Contractual Term (Years) |
Aggregate Intrinsic Value as of December 31, 2009 | ||||||||
| Outstanding at January 1, 2009 |
4,686,549 | $ | 17.01 | ||||||||
| Granted |
15,000 | $ | 13.64 | ||||||||
| Exercised |
(204,454 | ) | $ | 11.97 | |||||||
| Forfeited and expired |
(1,119,944 | ) | $ | 22.09 | |||||||
| Outstanding at December 31, 2009 |
3,377,151 | $ | 15.62 | 3.93 | $ | 4,162,925 | |||||
| Exercisable at December 31, 2009 |
3,068,338 | $ | 16.02 | 3.52 | $ | 3,143,745 | |||||
| Vested and expected to vest as of December 31, 2009, net of anticipated forfeitures |
3,364,820 | $ | 15.63 | 3.91 | $ | 4,125,390 | |||||
The aggregate intrinsic value in the table above represents the total pre-tax intrinsic value (the difference between our closing stock price on the last trading day of fiscal 2009 and the exercise price, multiplied by the number of in-the-money options) that would have been received by the option holders had all option holders exercised their options on December 31, 2009. Total intrinsic value of options exercised in fiscal year 2009 was $0.5 million as compared to $0.3 million in each of 2008 and 2007. Cash received from option exercises in fiscal 2009 was $2.5 million.
A summary of our option activity for the prior years follows:
| 2008 | 2007 | |||||||||||
| Options | Weighted- Average Exercise Price |
Options | Weighted- Average Exercise Price | |||||||||
| Outstanding at January 1 |
5,376,777 | $ | 17.36 | 6,107,636 | $ | 17.68 | ||||||
| Granted |
301,713 | $ | 10.87 | 398,000 | $ | 11.90 | ||||||
| Exercised |
(110,423 | ) | $ | 13.03 | (140,456 | ) | $ | 12.51 | ||||
| Forfeited and expired |
(881,518 | ) | $ | 17.55 | (988,403 | ) | $ | 17.82 | ||||
| Outstanding at December 31 |
4,686,549 | $ | 17.01 | 5,376,777 | $ | 17.36 | ||||||
At December 31, 2009, options outstanding were as follows:
| Options Outstanding | Options Exercisable | |||||||||||
| Range of Exercise Prices |
Options | Weighted- Average Remaining Contractual Life (Years) |
Weighted- Average Exercise Price |
Options | Weighted- Average Exercise Price | |||||||
| $ 8.41 - $11.36 |
567,855 | 4.80 | $ | 10.76 | 443,855 | $ | 11.05 | |||||
| $11.79 - $13.83 |
588,193 | 5.16 | $ | 12.84 | 425,080 | $ | 12.97 | |||||
| $13.96 - $14.12 |
785,130 | 2.98 | $ | 14.00 | 785,130 | $ | 14.01 | |||||
| $14.25 - $16.16 |
578,408 | 4.40 | $ | 15.35 | 559,908 | $ | 15.37 | |||||
| $16.70 - $21.83 |
585,935 | 3.61 | $ | 20.84 | 582,735 | $ | 20.84 | |||||
| $22.21 - $31.21 |
271,630 | 1.83 | $ | 25.73 | 271,630 | $ | 25.73 | |||||
| $8.41 - $31.21 |
3,377,151 | 3.93 | $ | 15.62 | 3,068,338 | $ | 16.02 | |||||
As of December 31, 2009, $1.7 million of total unrecognized compensation cost related to stock options is expected to be recognized over a weighted-average period of 2.2 years.
Restricted Stock Unit Activity
A summary of our restricted stock unit activity as of December 31, 2009, 2008 and 2007, and related information follows:
46
| 2009 | 2008 | 2007 | ||||||||||||||||
| Shares | Weighted-Average Grant Date Fair Value |
Shares | Weighted`-Average Grant Date Fair Value |
Shares | Weighted-Average Grant Date Fair Value | |||||||||||||
| Nonvested stock at January 1 |
115,340 | $ | 11.47 | 87,188 | $ | 15.53 | 93,681 | $ | 19.20 | |||||||||
| Granted |
460,189 | $ | 13.66 | 150,000 | $ | 10.90 | 55,000 | $ | 12.29 | |||||||||
| Vested |
(167,968 | ) | $ | 12.70 | (116,680 | ) | $ | 13.85 | (46,404 | ) | $ | 18.68 | ||||||
| Forfeited |
(23,667 | ) | $ | 12.35 | (5,168 | ) | $ | 9.97 | (15,089 | ) | $ | 16.80 | ||||||
| Nonvested stock at December 31 |
383,894 | $ | 13.51 | 115,340 | $ | 11.47 | 87,188 | $ | 15.53 | |||||||||
A total of 179,961 shares of our common stock subject to restricted stock units was vested but not yet distributed as of December 31, 2009. Stock-based compensation expense related to our restricted stock units for the year ended December 31, 2009 was $2.1 million. As of December 31, 2009, $3.0 million of total unrecognized compensation cost related to nonvested stock is expected to be recognized over a weighted-average period of 1.4 years. Total fair value of vested shares in fiscal 2009 was $2.1 million compared to $1.6 million and $0.9 million in 2008 and 2007, respectively.
Stock Option Exchange Program
In September 2009, we filed a Tender Offer Statement on Schedule TO with the SEC relating to a one-time stock option exchange program (Option Exchange) to give employees (excluding executive officers and members of the board of directors) the opportunity to exchange eligible options for a lesser number of new restricted stock units (RSUs) with approximately the same fair value as the options surrendered, as of the date of the exchange. Eligible options included stock options granted under our equity incentive plans that had an exercise price per share equal to or greater than $13.50. The Option Exchange commenced on September 16, 2009 and expired on October 14, 2009. A total of 75 eligible employees participated in the Option Exchange. Eligible options to purchase a total of 799,799 shares of our common stock were tendered and cancelled in exchange for RSUs covering 123,189 shares of our common stock issued on October 14, 2009. These RSUs were issued at $15.44 under the 1993 Stock Option Plan/Stock Issuance Plan and are subject to its terms and conditions. These RSUs will vest (subject to the grantees’ continued service to Ultratech) on October 14, 2010. Using the Black-Scholes option pricing model, we determined that the fair value of the surrendered stock options on a grant-by-grant basis was approximately equal, as of the date of the exchange, to the fair value of the RSUs issued in exchange for such stock options, resulting in an immaterial incremental amount of stock-based compensation.
6. BASIC AND DILUTED NET INCOME (LOSS) PER SHARE
The following sets forth the computation of basic and diluted net income (loss) per share:
| Years Ended December 31, | ||||||||||
| In thousands, except per share amounts |
2009 | 2008 | 2007 | |||||||
| Numerator: |
||||||||||
| Net income (loss) |
$ | 2,129 | $ | 11,777 | $ | (1,044 | ) | |||
| Denominator: |
||||||||||
| Basic weighted-average shares outstanding |
23,690 | 23,524 | 23,354 | |||||||
| Effect of dilutive employee stock options and restricted stock units |
162 | 141 | — | |||||||
| Diluted weighted-average shares outstanding |
23,852 | 23,665 | 23,354 | |||||||
| Net income (loss) per share—basic and diluted |
$ | 0.09 | $ | 0.50 | $ | (0.04 | ) | |||
For the year ended December 31, 2009, options to purchase 3.7 million shares of common stock were excluded from the computation of diluted net income per share as the effect would have been anti-dilutive, compared to 4.4 million shares and 5.5 million shares for the years ended December 31, 2008 and 2007, respectively. In addition, for the year ended December 31, 2007, restricted stock units for 0.1 million shares of common stock were excluded from the computation as well compared to none for the years ended December 31, 2009 and 2008. Options and restricted stock units are anti-dilutive when we have a net loss or when the exercise price of the stock option and the average unrecognized compensation cost of the stock option or restricted stock unit is greater than the average market price of our Common Stock.
7. FAIR VALUE MEASUREMENTS
On January 1, 2008, we adopted ASC Topic 820, Fair Value Measurements and Disclosures (“ASC 820”) for financial assets and liabilities recognized at fair value on a recurring basis. On January 1, 2009, we adopted ASC 820 for all
47
7. FAIR VALUE MEASUREMENTS
On January 1, 2008, we adopted ASC Topic 820, Fair Value Measurements and Disclosures (“ASC 820”) for financial assets and liabilities recognized at fair value on a recurring basis. On January 1, 2009, we adopted ASC 820 for all nonfinancial assets and nonfinancial liabilities, except those that are recognized or disclosed at fair value in the financial statements on a recurring basis. These nonfinancial items include assets and liabilities such as reporting units measured at fair value in a goodwill impairment test and nonfinancial assets acquired and liabilities assumed in a business combination. The adoption of this deferred portion of ASC 820 did not have any impact on our results of operations or financial position.
Fair value is defined under ASC 820 as the exchange price that would be received for an asset or paid to transfer a liability (an exit price) in the principal or most advantageous market for the asset or liability in an orderly transaction between market participants on the measurement date. Valuation techniques used to measure fair value under ASC 820 must maximize the use of observable inputs and minimize the use of unobservable inputs. ASC 820 describes a fair value hierarchy based on three levels of inputs, of which the first two are considered observable and the last unobservable, that may be used to measure fair value which are the following:
• Level 1—Quoted prices for identical assets or liabilities in active markets.
• Level 2—Quoted prices for similar assets or liabilities in active markets; quoted prices for identical or similar instruments in markets that are not active; and model-derived valuations in which all significant inputs and significant value drivers are observable in active markets.
• Level 3—Model derived valuations in which one or more significant inputs or significant value drivers are unobservable.
We measure certain financial assets and liabilities at fair value on a recurring basis, including available-for-sale securities and foreign currency derivatives. The fair value of these certain financial assets and liabilities was determined using the following inputs at December 31, 2009 and 2008, respectively:
| Fair Value Measurements at December 31, 2009 Using | ||||||||||||
| In thousands |
Total | Quoted Prices in Active Markets for Identical Assets (Level 1) |
Significant Other Observable Inputs (Level 2) |
Significant Unobservable Inputs (Level 3) | ||||||||
| Available-for-sale securities(1) |
||||||||||||
| Commercial papers |
$ | 13,996 | $ | - | $ | 13,996 | $ | - | ||||
| Money market funds |
15,739 | 15,739 | - | - | ||||||||
| U.S. corporate debt securities |
1,193 | - | 1,193 | - | ||||||||
| U.S. treasury bills and notes |
15,200 | 15,200 | - | |||||||||
| Securities and obligations of U.S. government agencies |
83,338 | - | 83,338 | - | ||||||||
| 129,465 | 15,739 | 113,726 | - | |||||||||
| Foreign currency derivatives(2) |
79 | - | 79 | - | ||||||||
| Deferred compensation plan assets(3) |
1,032 | - | - | 1,032 | ||||||||
| Deferred compensation plan liabilities(4) |
1,217 | - | - | 1,217 | ||||||||
| $ | 131,793 | $ | 15,739 | $ | 113,805 | $ | 2,249 | |||||
| Fair Value Measurements at December 31, 2008 Using | ||||||||||||
| In thousands |
Total | Quoted Prices in Active Markets for Identical Assets (Level 1) |
Significant Other Observable Inputs (Level 2) |
Significant Unobservable Inputs (Level 3) | ||||||||
| Available-for-sale securities(1) |
||||||||||||
| Commercial papers |
$ | 17,995 | $ | - | $ | 17,995 | $ | - | ||||
| Money market funds |
56,658 | 56,658 | - | - | ||||||||
| Securities and obligations of U.S. government agencies |
62,457 | - | 62,457 | - | ||||||||
| 137,110 | 56,658 | 80,452 | - | |||||||||
| Foreign currency derivatives(5) |
198 | - | 198 | - | ||||||||
| Deferred compensation plan assets(3) |
901 | - | - | 901 | ||||||||
| Deferred compensation plan liabilities(4) |
941 | - | - | 941 | ||||||||
| $ | 139,150 | $ | 56,658 | $ | 80,650 | $ | 1,842 | |||||
48
| (1) | Included in cash and cash equivalents and short-term investments on our consolidated balance sheet. Cash equivalents at December 31, 2009 and 2008 were $27.7 million and $72.6 million, respectively. |
| (2) | Included in current assets on our consolidated balance sheet. Consisted of forward foreign exchange contracts for the Japanese yen. |
| (3) | Included in other assets on our consolidated balance sheet. |
| (4) | Included in other liabilities on our consolidated balance sheet. |
| (5) | Included in current liabilities on our consolidated balance sheet. Consisted of forward foreign exchange contracts for the Japanese yen. |
8. ACCUMULATED OTHER COMPREHENSIVE INCOME (LOSS)
The components of comprehensive income (loss), net of tax, are as follows:
| December 31, | December 31, | December 31, | ||||||||||
| In thousands |
2009 | 2008 | 2007 | |||||||||
| Net income (loss) |
$ | 2,129 | $ | 11,777 | $ | (1,044 | ) | |||||
| Other comprehensive income (loss): |
||||||||||||
| Unrealized gain (loss) on available-for-sale investments before adjustment |
(643 | ) | 860 | 1,051 | ||||||||
| Reclassification adjustment for gains included in net income (loss) |
- | (416 | ) | - | ||||||||
| Net unrealized gain (loss) on available-for-sale investments |
(643 | ) | 444 | 1,051 | ||||||||
| Unrealized gain (loss) on foreign exchange forward contracts |
84 | (163 | ) | (53 | ) | |||||||
| Change in minimum postretirement benefits obligation |
47 | 102 | 8 | |||||||||
| Comprehensive income (loss) |
$ | 1,617 | $ | 12,160 | $ | (38 | ) | |||||
Accumulated other comprehensive income is comprised of the following items, net of tax of none for 2009 and 2008:
| December 31, | December 31, | |||||||
| In thousands |
2009 | 2008 | ||||||
| Unrealized gain (loss) on: |
||||||||
| Available-for-sale investments |
$ | 6 | $ | 648 | ||||
| Foreign exchange forward contracts |
- | (84 | ) | |||||
| Change in minimum postretirement medical obligation |
(44 | ) | (90 | ) | ||||
| Accumulated other comprehensive income (loss) at end of period |
$ | (38 | ) | $ | 474 | |||
The amount of loss on foreign exchange contracts reclassified to earnings was $84,000, $0.3 million and $20,000 in 2009, 2008 and 2007, respectively.
9. INVESTMENTS
We classified all of our investments as “available-for-sale” as of December 31, 2009 and 2008. Accordingly, we state our investments at estimated fair value. Fair values are determined based on quoted market prices or pricing models using current market rates. We deem all investments to be available to meet current working capital requirements.
The following is a summary of our investments:
| December 31, 2009 | December 31, 2008 | |||||||||||||||||||||||
| Amortized Cost |
Accumulated Other Comprehensive |
Estimated Fair Value |
Amortized Cost |
Accumulated Other Comprehensive |
Estimated Fair Value | |||||||||||||||||||
| Cash equivalents and Available- for-sale Investments, in thousands |
Gains | Losses | Gains | Losses | ||||||||||||||||||||
| Commercial papers |
$ | 13,996 | $ | - | $ | - | $ | 13,996 | $ | 56,658 | $ | 11 | $ | - | $ | 56,669 | ||||||||
| Money market funds |
15,738 | - | - | 15,738 | 17,984 | - | - | 17,984 | ||||||||||||||||
| U.S. corporate debt securities |
1,186 | 6 | - | 1,192 | - | - | - | - | ||||||||||||||||
| U.S. treasury bills and notes |
15,203 | - | 3 | 15,200 | - | - | - | - | ||||||||||||||||
| Securities and obligations of U.S. government agencies |
83,336 | 109 | 106 | 83,339 | 61,819 | 638 | - | 62,457 | ||||||||||||||||
| Total |
$ | 129,459 | $ | 115 | $ | 109 | $ | 129,465 | $ | 136,461 | $ | 649 | $ | - | $ | 137,110 | ||||||||
49
The following is a reconciliation of our investments to the balance sheet classifications at December 31:
| In thousands |
2009 | 2008 | ||||
| Cash equivalents |
$ | 27,741 | $ | 72,646 | ||
| Short-term investments |
101,724 | 64,464 | ||||
| Investments, at estimated fair value |
$ | 129,465 | $ | 137,110 | ||
Gross realized gains and losses on sales of investments were immaterial in each of the years ended December 31, 2009, 2008 and 2007, respectively.
The gross amortized cost and estimated fair value of our investments at December 31, 2009, by contractual maturity, are shown below. Expected maturities will differ from contractual maturities because the issuers of the securities may have the right to prepay obligations without prepayment penalties.
| In thousands |
Gross Amortized Cost |
Fair Value | ||||
| Due in one year or less |
$ | 125,457 | $ | 125,463 | ||
| Due after one year through five years |
4,002 | 4,002 | ||||
| Total |
$ | 129,459 | $ | 129,465 | ||
The following table provides the breakdown of the cash equivalent and investments with unrealized losses at December 31, 2009:
| In Loss Position for Less Than 12 Months |
In Loss Position for More Than 12 Months |
Total | ||||||||||||||||
| Investments, in thousands |
Fair Value |
Gross Unrealized Losses |
Fair Value |
Gross Unrealized Losses |
Fair Value |
Gross Unrealized Losses | ||||||||||||
| U.S. treasury bills and notes |
$ | 15,200 | $ | 3 | $ | - | $ | - | $ | 15,200 | $ | 3 | ||||||
| Securities and obligations of U.S. government agencies |
44,635 | 106 | - | - | 44,635 | 106 | ||||||||||||
| Total |
$ | 59,835 | $ | 109 | $ | - | $ | - | $ | 59,835 | $ | 109 | ||||||
We did not have any cash equivalent and investments with unrealized losses at December 31, 2008.
We review our investment portfolio regularly for impairment. A security is considered impaired when its fair value is less than its cost basis. If we intend to sell an impaired debt security or it is more likely than not that we will be required to sell it prior to recovery of its amortized cost basis, an other-than-temporary-impairment (“OTTI”) is deemed to have occurred. In these instances, the OTTI loss is recognized in earnings equal to the entire difference between the debt security’s amortized cost basis and its fair value at the balance sheet date.
If we do not intend to sell an impaired debt security and it is not more likely than not that we will be required to sell it prior to recovery of its amortized cost basis, we must determine whether it will recover its amortized cost basis. If we conclude it will not, a credit loss exists and the resulting OTTI is separated into:
| • | The amount representing the credit loss, which is recognized in earnings, and |
| • | The amount related to all other factors, which is recognized in other comprehensive income. |
As part of this assessment we will consider the various characteristics of each security, including, but not limited to the following: the length of time and the extent to which the fair value has been less than the amortized cost basis; adverse conditions specifically related to the security, an industry, or a geographic area; the payment structure of the debt security; failure of the issuer of the security to make scheduled interest or principal payments; any changes to the rating of the security by a rating agency and related outlook or status; recoveries or additional declines in fair value subsequent to the balance sheet date. The relative importance of this information varies based on the facts and circumstances surrounding each security, as well as the economic environment at the time of assessment.
We have not recorded any OTTI of our investments during the years ended December 31, 2009, 2008 and 2007.
50
10. BALANCE SHEET DETAIL
| In thousands |
December 31, 2009 |
December 31, 2008 |
||||||
| Inventories: |
||||||||
| Raw materials |
$ | 9,739 | $ | 15,380 | ||||
| Work-in-process |
5,342 | 7,175 | ||||||
| Finished products |
10,800 | 9,063 | ||||||
| Total |
$ | 25,881 | $ | 31,618 | ||||
| Equipment and leasehold improvements, net: |
||||||||
| Machinery and equipment |
$ | 33,858 | $ | 36,059 | ||||
| Leasehold improvements |
10,417 | 8,383 | ||||||
| Office equipment and furniture(a) |
13,163 | 14,498 | ||||||
| 57,438 | 58,940 | |||||||
| Accumulated depreciation and amortization |
(47,597 | ) | (46,152 | ) | ||||
| Total |
$ | 9,841 | $ | 12,788 | ||||
| Other Assets: |
||||||||
| Intangible assets, net(b) |
$ | 649 | $ | 751 | ||||
| Deferred compensation plan assets |
1,032 | 901 | ||||||
| Other |
1,248 | 1,481 | ||||||
| Total |
$ | 2,929 | $ | 3,133 | ||||
| Accrued expenses: |
||||||||
| Accrued payroll-related liabilities |
$ | 3,753 | $ | 4,949 | ||||
| Warranty accrual |
1,710 | 1,522 | ||||||
| Accrued taxes-other |
288 | 1,374 | ||||||
| Reserve for losses on purchase order commitments |
149 | 155 | ||||||
| Capital lease, current portion |
120 | 113 | ||||||
| Other |
700 | 1,810 | ||||||
| Total |
$ | 6,720 | $ | 9,923 | ||||
| Other Liabilities: |
||||||||
| Deferred compensation plan liabilities |
$ | 1,217 | $ | 941 | ||||
| Asset retirement obligations |
2,162 | 2,281 | ||||||
| Postretirement benefits obligation |
616 | 546 | ||||||
| Capital lease |
265 | 385 | ||||||
| Income tax payable - long term |
410 | 381 | ||||||
| Deferred income tax liabilities - long term |
260 | 386 | ||||||
| Other |
224 | 262 | ||||||
| Total |
$ | 5,154 | $ | 5,182 | ||||
| (a) | As of December 31, 2009 and 2008, office equipment and furniture included $0.6 million of cost capitalized under a capital lease. Accumulated depreciation as of December 31, 2009 and 2008 was $0.3 million and $0.2 million, respectively. |
| (b) | As of December 31, 2009, future estimated amortization costs per year for our existing intangible assets are estimated as follows: |
51
| In thousands |
Estimated Amortization Expense | ||
| For the years: |
|||
| 2010 |
$ | 99 | |
| 2011 |
99 | ||
| 2012 |
87 | ||
| 2013 |
82 | ||
| 2014 |
79 | ||
| Thereafter |
203 | ||
| Total |
$ | 649 | |
Warranty Accrual
We generally warrant our products for a period of 12 months for new products, or three months for refurbished products, from the date of customer acceptance for material and labor to repair the product; accordingly, an accrual for the estimated cost of the warranty is recorded at the time the product is shipped. Extended warranty terms, if granted, result in deferral of revenue equating to our standard pricing for similar service contracts. Recognition of the related warranty cost is deferred until product revenue is recognized. Factors that affect our warranty liability include the number of installed units, historical and anticipated rates of warranty claims, and cost per claim. We periodically assess the adequacy of our recorded warranty liabilities and adjust the amounts as necessary.
Changes in our product liability are as follows:
| In thousands |
December 31, 2009 |
December 31, 2008 |
||||||
| Balance, beginning of year |
$ | 1,522 | $ | 2,112 | ||||
| Warranties issued during year |
2,051 | 2,843 | ||||||
| Settlements during year |
(2,167 | ) | (2,835 | ) | ||||
| Changes in liability for pre-existing warranties during year, including expirations |
304 | (598 | ) | |||||
| Balance, end of year |
$ | 1,710 | $ | 1,522 | ||||
Deferred Service Income
We sell service contracts for which revenue is deferred and recognized ratably over the contract period (for time based service contracts) or as service hours are delivered (for contracts based on a purchased quantity of hours). Changes in our deferred service revenue are as follows:
| In thousands |
December 31, 2009 |
December 31, 2008 |
||||||
| Balance, beginning of year |
$ | 2,117 | $ | 2,087 | ||||
| Service contracts sold during year |
2,897 | 2,997 | ||||||
| Service contract revenue recognized during year |
(3,107 | ) | (2,967 | ) | ||||
| Balance, end of year |
$ | 1,907 | $ | 2,117 | ||||
Asset Retirement Obligations
In accordance with ASC 410, Asset Retirement and Environmental Obligations, an entity is required to recognize a liability for the fair value of a conditional asset retirement obligation if the fair value of the liability can be reasonably estimated, even if conditional on a future event. The asset retirement obligation (“ARO”) liability is principally for estimable asset retirement obligations related to remediation costs, which we estimate will be incurred upon the expiration of certain operating leases.
52
| In thousands |
2009 | 2008 | ||||||
| Balance as of January 1 |
$ | 2,281 | $ | 2,222 | ||||
| Accretion expense |
167 | 157 | ||||||
| Liabilities incurred |
- | 75 | ||||||
| Liabilities settled |
(11 | ) | (44 | ) | ||||
| Adjustment to liabilities |
(275 | ) | (129 | ) | ||||
| Balance as of December 31 |
$ | 2,162 | $ | 2,281 | ||||
11. NOTES PAYABLE
In December 2004, we entered into a line of credit agreement with a brokerage firm. Under the terms of this agreement, we may borrow funds at a cost equal to the current Federal funds rate plus 125 basis points (1.36% as of December 31, 2009). Certain of our cash, cash equivalents and short-term investments secure borrowings outstanding under this facility, but we are not restricted in the use of those assets. Funds are advanced to us under this facility based on pre-determined advance rates on the cash and securities held by us in this brokerage account. This agreement has no set expiration date and there are no loan covenants, other than the aforementioned collateral requirement which does not legally restrict the cash and securities. As of each of December 31, 2009 and 2008, $6.0 million was outstanding under this facility, with a related collateral requirement of approximately $8.0 million of our cash, cash equivalents and short-term investments.
12. EXIT ACTIVITIES
Changes in our accrued severance and benefits charges in connection with exit activities are as follows:
| In thousands |
Balance at January 1, 2007 |
Expenses | Payments | Balance at December 31, 2007 |
Expenses | Payments | Balance at December 31, 2008 |
Expenses | Payments | Balance at December 31, 2009 | |||||||||||||||||||||||
| Severance and benefits (2006) |
$ | 918 | $ | - | $ | (872 | ) | $ | 46 | $ | - | $ | (46 | ) | $ | - | $ | - | $ | - | $ | - | |||||||||||
| Severance and benefits (2007) |
- | 1,588 | (1,206 | ) | 382 | - | (382 | ) | - | - | - | - | |||||||||||||||||||||
| Severance and benefits (2008) |
- | - | - | - | 591 | (573 | ) | 18 | - | (18 | ) | - | |||||||||||||||||||||
| Severance and benefits (2009) |
- | - | - | - | - | - | - | 576 | (576 | ) | - | ||||||||||||||||||||||
| Total |
$ | 918 | $ | 1,588 | $ | (2,078 | ) | $ | 428 | $ | 591 | $ | (1,001 | ) | $ | 18 | $ | 576 | $ | (594 | ) | $ | - | ||||||||||
During 2009, in our continuing effort to reduce company-wide expenses, we eliminated 21 full-time positions, 90% in the United States and 10% internationally. We recorded severance and benefits charges totaling $0.6 million during the year ended December 31, 2009. Of this $0.6 million, $0.3 million was recorded as research, development and engineering expenses, $0.2 million as cost of sales and the remaining $0.1 million as selling, general and administrative expenses. As of December 31, 2009, there were no exit activity liabilities.
During 2008, we eliminated 14 full-time positions, 79% in the United States and 21% internationally. We recorded severance and benefits charges totaling $0.6 million during the year ended December 31, 2008. Of this $0.6 million, $0.3 million was recorded as selling, general and administrative expenses, $0.2 million as research, development and engineering expenses and the remaining $0.1 million as cost of sales. As of December 31, 2008, the remaining balance of $18,000 will be fully paid by the end of 2009.
During 2007, we eliminated 39 full-time positions, 64% in the United States and 36% internationally. We recorded severance and benefits charges totaling $1.6 million during the year ended December 31, 2007. Of this $1.6 million, $1.0 million was recorded as selling, general and administrative expenses, $0.5 million as cost of sales, and the remaining $0.1 million as research, development and engineering expenses. The remaining balance of $0.4 million at December 31, 2007, which related to severance and benefit payments for exit activities incurred since 2006, was fully paid in the second quarter of 2008.
13. EMPLOYEE BENEFIT PLANS
Employee bonus plans
We currently sponsor an executive incentive bonus plan that distributes employee awards based on the achievement of predetermined targets. We recorded a charge of $0.5 million and $1.3 million under this bonus plan for the year ended December 31, 2009 and 2008, respectively, compared to no charge for the year ended December 31, 2007.
Employee Savings and Retirement Plans
We sponsor a 401(k) employee salary deferral plan that allows voluntary contributions by all full-time employees of from 1% to 20% of their pretax earnings. We may also make matching contributions to this plan at our discretion. Our
53
contributions, when made, are limited to a maximum of $2,000 per year per employee, generally become 20 percent vested at the end of an employee’s first year of service from the date of hire, and vest 20 percent per year of service thereafter until they become fully vested at the end of five years of service. We did not make any contributions to this plan for the year ended December 31, 2009 as compared to the contribution of $0.3 million for each of 2008 and 2007.
We also sponsor an executive non-qualified deferred compensation plan (the Plan) that allows qualifying executives to defer current cash compensation. At December 31, 2009, Plan assets of $1.0 million, representing the cash surrender value of life insurance policies held by us, and liabilities of $1.2 million are included in our consolidated balance sheets under the captions “other assets” and “other liabilities.” In conjunction with this Plan, we recognized $0.1 million of expense for each of the three years ended December 31, 2009, 2008 and 2007, respectively.
Postretirement Benefits
We have committed to providing lifetime postretirement medical and dental benefits to our Chief Executive Officer and Chief Financial Officer and their spouses, commencing after retirement. These medical and dental benefits are similar to the benefits provided to all full-time employees while employed by us, except that we are paying the entire cost of these benefits. The Chief Financial Officer and his spouse were included in the plan for the first time in 2006.
During the first quarter of 2007, we amended and restated the employment agreement with our Chief Financial Officer to provide him and his spouse retirement health benefits in the event of a change of control or sale of the Company or in the event that he retires when he is at least 62 years old and has served as an executive officer for 10 consecutive years.
The following table sets forth the amounts of unrecognized prior service cost and unrecognized actuarial gain included in accumulated other comprehensive income:
| In thousands |
December 31, 2009 |
December 31, 2008 |
||||||
| Prior service cost |
$ | 60 | $ | 164 | ||||
| Net actuarial gain |
(16 | ) | (74 | ) | ||||
| Amount recognized in other comprehensive income |
$ | 44 | $ | 90 | ||||
The prior service cost and actuarial loss included in accumulated other comprehensive income and expected to be recognized in net periodic benefit cost during the fiscal year ended December 31, 2010 is $60,000 and zero, respectively.
The reconciliation of the beginning and ending balance of the accumulated postretirement benefit obligation and the fair value of plan assets for the years ended December 31, 2009 and 2008 is as follows:
| In thousands |
December 31, 2009 |
December 31, 2008 |
|||||
| Benefit obligation at beginning of year |
$ | 546 | 773 | ||||
| Interest cost |
34 | 45 | |||||
| Additions |
— | — | |||||
| Actuarial loss (gain) |
36 | (272 | ) | ||||
| Benefit obligation at end of year |
616 | 546 | |||||
| Fair value of plan assets at end of year |
— | — | |||||
| Funded status at end of year |
$ | (616 | ) | (546 | ) | ||
Amounts recognized in the statement of financial position consist of:
| In thousands |
December 31, 2009 |
December 31, 2008 |
|||||
| Noncurrent assets |
$ | — | — | ||||
| Current liabilities |
— | — | |||||
| Noncurrent liabilities |
(616 | ) | (546 | ) | |||
| $ | (616 | ) | (546 | ) | |||
Weighted-average discount rates as of December 31, 2009 were 5.8% for each of the Chief Executive Officer’s plan and the Chief Financial Officer’s plan as compared to 6.3% and 6.2%, respectively, as of December 31, 2008.
54
For measurement purposes, a 12% annual rate of increase in the per capita cost of covered health care benefits was assumed for 2009, and 17% for 2010. The rate was assumed to decrease gradually to 6% for 2015 and remain at that level thereafter.
Components of net periodic benefit cost and other amounts recognized from other comprehensive income (loss) are as follows:
| In thousands |
December 31, 2009 |
December 31, 2008 |
|||||
| Interest cost |
$ | 34 | 45 | ||||
| Amortization of prior service cost |
105 | 37 | |||||
| Amortization of net gain |
(22 | ) | (207 | ) | |||
| Net periodic benefit cost |
$ | 117 | (125 | ) | |||
Other changes in plan assets and benefit obligations recognized from other comprehensive income are as follows:
| In thousands |
December 31, 2009 |
December 31, 2008 |
||||||
| Net actuarial loss (gain) |
$ | 59 | $ | (65 | ) | |||
| Prior service cost |
— | — | ||||||
| Amortization of prior service cost |
(105 | ) | (37 | ) | ||||
| Total recognized from other comprehensive income (loss) |
$ | (46 | ) | $ | (102 | ) | ||
| Total recognized in net periodic benefit cost and from other comprehensive income |
$ | 71 | $ | (227 | ) | |||
The expected benefit payments in the next 10 years are as follows:
| In thousands | |||
| 2010 |
$ | — | |
| 2011 |
39 | ||
| 2012 |
38 | ||
| 2013 |
41 | ||
| 2014 |
40 | ||
| 2015-2019 |
210 | ||
| $ | 368 | ||
Assumed health care cost trend rates have a significant effect on the amounts reported for the health care plan. A one-percentage-point change in assumed health care cost trend rates would have the following effects:
| At December 31, 2009 | |||||||
| In thousands |
1-Percentage- Point Increase |
1-Percentage- Point Decrease |
|||||
| Effect on total of service and interest cost components |
$ | 4 | $ | (4 | ) | ||
| Effect on postretirement benefit obligation |
84 | (71 | ) | ||||
14. INCOME TAXES
The domestic and foreign components of loss before income taxes and cumulative adjustments are as follows:
| Years Ended December 31, | ||||||||||
| In thousands |
2009 | 2008 | 2007 | |||||||
| Domestic |
$ | 1,723 | $ | 11,113 | $ | (1,288 | ) | |||
| Foreign |
336 | 1,072 | 530 | |||||||
| Income (loss) before income taxes |
$ | 2,059 | $ | 12,185 | $ | (758 | ) | |||
55
The components of the provision (benefit) for income taxes were as follows:
| Years Ended December 31, | ||||||||||||
| In thousands |
2009 | 2008 | 2007 | |||||||||
| Federal: |
||||||||||||
| Current |
$ | (152 | ) | $ | 51 | $ | - | |||||
| Deferred |
- | 163 | (52 | ) | ||||||||
| (152 | ) | 214 | (52 | ) | ||||||||
| State: |
||||||||||||
| Current |
(12 | ) | 59 | - | ||||||||
| Deferred |
- | 6 | (6 | ) | ||||||||
| (12 | ) | 65 | (6 | ) | ||||||||
| Foreign: |
||||||||||||
| Current |
139 | 171 | 246 | |||||||||
| Deferred |
(45 | ) | (42 | ) | 98 | |||||||
| 94 | 129 | 344 | ||||||||||
| Total income tax provision (benefit) |
$ | (70 | ) | $ | 408 | $ | 286 | |||||
The difference between the provision for income taxes and the amount computed by applying the U.S. federal statutory rate of 35 percent to income (loss) before income taxes is explained below:
| Years Ended December 31, | ||||||||||||
| In thousands |
2009 | 2008 | 2007 | |||||||||
| Tax computed at statutory rate |
$ | 721 | $ | 4,265 | $ | (265 | ) | |||||
| State income taxes, net of federal benefit |
(8 | ) | 42 | (4 | ) | |||||||
| Foreign taxes |
(24 | ) | (246 | ) | 158 | |||||||
| U.S. losses not benefited/(utilized) and other |
(759 | ) | (3,653 | ) | 397 | |||||||
| Income tax provision (benefit) |
$ | (70 | ) | $ | 408 | $ | 286 | |||||
Significant components of deferred income tax assets and liabilities are as follows:
| In thousands |
2009 | 2008 | 2007 | |||||||||
| Deferred tax assets: |
||||||||||||
| Net operating loss carryforwards |
$ | 27,560 | $ | 27,047 | $ | 29,639 | ||||||
| Inventory valuation |
2,883 | 3,671 | 3,143 | |||||||||
| Bad debt reserve |
124 | 72 | 118 | |||||||||
| Basis difference in assets |
10,068 | 12,005 | 13,450 | |||||||||
| Tax credit carryforwards |
22,836 | 22,281 | 21,418 | |||||||||
| Warranty reserves |
706 | 591 | 825 | |||||||||
| Deferred product and services income |
2,806 | 1,399 | 1,417 | |||||||||
| Other non-deductible accruals and reserves |
5,047 | 5,417 | 6,746 | |||||||||
| Stock compensation |
2,919 | 1,739 | 1,022 | |||||||||
| Total deferred tax assets |
74,948 | 74,222 | 77,778 | |||||||||
| Valuation allowance |
(71,099 | ) | (70,824 | ) | (74,821 | ) | ||||||
| Net deferred tax assets |
$ | 3,848 | $ | 3,398 | $ | 2,957 | ||||||
| Deferred tax liabilities: |
||||||||||||
| Unremitted earnings of foreign subsidiaries |
$ | (3,136 | ) | $ | (2,979 | ) | $ | (2,581 | ) | |||
| Other |
(357 | ) | (109 | ) | (109 | ) | ||||||
| Total deferred tax liabilities |
(3,493 | ) | (3,088 | ) | (2,690 | ) | ||||||
| Net deferred tax assets |
$ | 355 | $ | 310 | $ | 267 | ||||||
Based upon the weight of available evidence, which includes our historical operating performance and carry back potential, we have determined that a valuation allowance continues to be necessary for all tax jurisdictions except Singapore, Japan and Taiwan.
56
The net valuation allowance increased by $0.3 million during the year ended December 31, 2009 and decreased by $4.0 million and $2.9 million during the years ended December 31, 2008 and 2007, respectively.
Approximately $13.7 million of the valuation allowance as of December 31, 2009 is attributable to pre-2006 windfall stock option deductions, the benefit of which will be credited to paid-in capital if and when realized through a reduction in income taxes payable. Beginning in 2006, we are tracking the windfall stock option deductions off balance sheet, as required by ASC 718. As of December 31, 2009, we recorded $1.5 million of windfall stock option deductions that are being tracked off balance sheet. If and when realized, the tax benefit associated with those deductions of $0.6 million will be credited to additional paid-in capital.
As of December 31, 2009, we had net operating loss carryforwards for federal and state tax purposes of $76 million and $37 million, respectively. We also had federal and California research and development tax credit carryforwards of approximately $9.6 million and $11.3 million, respectively. The federal and state net operating loss carryforwards will expire at various dates beginning in 2009 through 2027, if not utilized. The federal tax credit carryforwards will expire at various dates beginning in 2011 through 2029, if not utilized. The California tax credit carryforwards have no expiration date.
Utilization of our net operating loss and tax credits carryforwards is subject to an annual limitation due to an ownership change, as defined by the Internal Revenue Code Section 382, that occurred in 2007. None of the net operating loss or tax credit carryforwards is anticipated to expire as a result of that one ownership change. Any future changes of ownership could result in the expiration of net operating losses or credits before utilization.
We adopted the provisions of ASC 740 as of January 1, 2007. It requires application of a more likely than not threshold to the recognition and de-recognition of uncertain tax positions. It permits us to recognize the amount of tax benefit that has a greater than 50 percent likelihood of being ultimately realized upon settlement. It further requires that a change in judgment related to the expected ultimate resolution of uncertain tax positions be recognized in earnings in the quarter of such change. During the year ended December 31, 2009, our reserve for uncertain tax decreased by $67,000. Interest and penalties related to reserve for uncertain tax positions were immaterial in 2009 and 2008.
Over the next twelve months, we expect a decline of approximately $0.1 million in the estimated amount of liabilities associated with our uncertain tax positions which arose prior to December 31, 2009 as a result of expiring statutes of limitations in certain foreign jurisdictions.
If we are able to eventually recognize these uncertain tax positions, $3.0 million and $2.9 million of the unrecognized benefit on January 1, 2009 and December 31, 2009, respectively, would reduce our effective tax rate. We currently have a full valuation allowance against our U.S. net deferred tax asset which would impact the timing of the effective tax rate benefit should any of these uncertain tax positions be favorably settled in the future.
We recognize interest and penalties related to uncertain tax positions as a component of income tax expense. As of December 31, 2009, we had accrued approximately $40,000 of accrued interest and penalties related to uncertain tax positions.
We are subject to federal and state tax examination for years 1999 forward and 1997 forward, respectively, by virtue of the tax attributes carrying forward from those years. We are also subject to audits in the foreign jurisdictions in which we operate for years 2001 and forward. There are no income tax examinations currently in progress.
A reconciliation of the change in the uncertain income tax benefit liabilities from January 1, 2008 to December 31, 2009 is as follows:
| In thousands |
2009 | 2008 | ||||||
| Balance at January 1 |
$ | 3,445 | $ | 3,329 | ||||
| Tax positions related to the current year: |
||||||||
| Additions |
130 | 288 | ||||||
| Tax positions related to the prior years: |
||||||||
| Additions |
- | 112 | ||||||
| Reductions |
(173 | ) | (215 | ) | ||||
| Lapses in statutes of limitations |
(18 | ) | (68 | ) | ||||
| Balance at December 31 |
$ | 3,384 | $ | 3,445 | ||||
57
15. COMMITMENTS AND CONTINGENCIES
Commitments
We lease our facilities and certain equipment under operating leases expiring through December 2011. The leases for our headquarters and manufacturing operations contain a five-year renewal option subject to a fair market value pricing adjustment. Certain of our leasing arrangements subject us to letter of credit requirements to provide a $2.4 million bank letter of credit as security to the landlord. In addition, certain of our leases require us to restore the facilities back to the original condition at the end of lease terms. As such, we recorded asset retirement obligations related to remediation costs as disclosed in Note 10 herein.
In September 2007, we sublet a portion of our facilities in San Jose, California and account for it as an operating lease. This sublease expires in January 2010. As of December 31, 2009, there were no minimum future sublease payments to be received. In July 2007, we capitalized a five-year lease agreement for a new phone system recorded as office equipment. The implied interest rate for this capital lease is 6.4%. The amortization of this phone system is included with depreciation expense.
In August 2008 and December 2009, we entered into agreements with a leasing company for the sale and leaseback of certain assets over initial terms of four years. The sales price of the assets was $6.8 million and $5.4 million for the sale in 2008 and 2009, respectively. There was no gain or loss from these transactions. Under the sale-leaseback arrangement, we have an option to purchase the assets back at the future current fair market value upon the expiration of the leases in 2012 and 2013, respectively. The leases are classified as operating leases in accordance with ASC Topic 840, Leases. As of December 31, 2009, the minimum future lease payments to be made were $6.2 million.
In October 2009, we entered into two lease amendments for our facilities in San Jose, California. The first lease amendment is to extend one of the building leases for five years. This lease extension will expire in January 2016. We account for this lease as an operating lease; any improvements to the leased property are capitalized and classified as leasehold improvements. Pursuant to the terms of the second lease amendment, in consideration for the waiver of certain surrender obligations set forth in the original lease of a separate building, we shall pay the landlord $0.6 million and surrender possession of the premises by the lease expiration date in March 2010.
As of December 31, 2009, future minimum lease payments were as follows:
| In thousands |
Capital Lease |
Operating Lease | |||||
| For the years: |
|||||||
| 2010 |
$ | 141 | $ | 5,256 | |||
| 2011 |
141 | 3,777 | |||||
| 2012 |
140 | 3,067 | |||||
| 2013 |
- | 2,167 | |||||
| 2014 |
- | 1,699 | |||||
| Thereafter |
- | 1,904 | |||||
| Total minimum lease payments |
422 | $ | 17,870 | ||||
| Amount representing interest |
(37 | ) | |||||
| Present value of total minimum lease payments |
385 | ||||||
| Current portion |
(120 | ) | |||||
| Capital lease obligation, net of current portion |
$ | 265 | |||||
Rent expense was approximately $3.4 million, $3.7 million and $3.9 million for the years ended December 31, 2009, 2008 and 2007, respectively, net of sublease income of $0.7 million in 2009, $0.6 million in 2008 and $0.2 million in 2007.
Our open purchase order commitments, which primarily relate to purchases of inventories, equipment and leasehold improvements were approximately $37.4 million as of December 31, 2009.
Legal Proceedings
On July 11, 2003, we filed a lawsuit against a Southern California company asserting infringement of certain claims related to U.S. patent No. 5,621,813 in the U.S. District Court in and for the Northern District of California. On May 17, 2005, the court found the subject patent to be invalid. We appealed this decision. The defendant subsequently brought a motion for reimbursement of its attorneys’ fees and costs in a total asserted amount of approximately $2 million. We opposed this motion, and on October 12, 2005, the District Court denied the defendant’s request for attorneys’ fees in its entirety. The defendant appealed that decision. On November 3, 2005, the defendant filed a notice of appeal with respect to the court’s
58
ruling on its motion for attorneys’ fees. In March 2006, the Federal Circuit court upheld the district court’s ruling that the subject patent is invalid. On August 8, 2006, the Federal Circuit court upheld the District Court’s denial of attorneys’ fees. Neither side appealed the rulings by the Federal Circuit, and they are final.
In May 2006, the same company filed a California state court lawsuit against us in Riverside County Superior Court for malicious prosecution and abuse of process claiming that attorney’s fees, costs and other damages were due based on the outcome of the federal patent litigation suit described above. We do not believe this new action has merit, particularly given the denial by the federal court of that company’s request to be awarded attorneys’ fees payable by us in the patent litigation and the subsequent federal appellate court’s affirmation of the order denying any such award. We filed a motion to have the state court complaint dismissed under California’s anti-strategic lawsuit against public participation (“anti-SLAPP”) and demurrer statutes. The anti-SLAPP statute is aimed at striking lawsuits that are brought in order to quash an individual’s constitutional rights to free speech or seeking redress of grievances (i.e. filing suit). The state court granted the anti-SLAPP motion as to the abuse of process claim, but denied it as to the malicious prosecution claim. Our subsequent appeals to the appellate court and California Supreme Court were unsuccessful, and the matter was returned to Riverside County Superior Court. We moved for summary judgment on the matter based on federal preemption, but the Superior Court denied the motion. A subsequent writ of mandamus filed by us was also not successful. At this point, we intend to prepare for a vigorous defense of the matter.
We believe that the outcome of these matters will not be material to our business, financial condition or results of operations.
16. FINANCIAL GUARANTEES
Our off-balance sheet transactions consist of certain financial guarantees, both express and implied, related to indemnification for product liability, patent infringement and latent product defects. Other than liabilities recorded pursuant to known product defects, at December 31, 2009, we did not record a liability associated with these guarantees, as we have little or no history of costs associated with such indemnification requirements. Contingent liabilities associated with product liability may be mitigated by insurance coverage we maintain.
59
REPORT OF ERNST & YOUNG LLP, INDEPENDENT REGISTERED PUBLIC ACCOUNTING FIRM
The Board of Directors and Stockholders of Ultratech, Inc.
We have audited the accompanying consolidated balance sheets of Ultratech, Inc. as of December 31, 2009 and 2008, and the related consolidated statements of operations, stockholders’ equity, and cash flows for each of the three years in the period ended December 31, 2009. Our audits also included the financial statement schedule listed in the Index at Item 15(a)(2). These financial statements and schedule are the responsibility of the Company’s management. Our responsibility is to express an opinion on these financial statements and schedule based on our audits.
We conducted our audits in accordance with standards of the Public Company Accounting Oversight Board (United States). Those standards require that we plan and perform the audit to obtain reasonable assurance about whether the financial statements are free of material misstatement. An audit includes examining, on a test basis, evidence supporting the amounts and disclosures in the financial statements. An audit also includes assessing the accounting principles used and significant estimates made by management, as well as evaluating the overall financial statement presentation. We believe that our audits provide a reasonable basis for our opinion.
In our opinion, the financial statements referred to above present fairly, in all material respects, the consolidated financial position of Ultratech, Inc. at December 31, 2009 and 2008, and the consolidated results of its operations and its cash flows for each of the three years in the period ended December 31, 2009, in conformity with U.S. generally accepted accounting principles. Also, in our opinion, the related financial statement schedule, when considered in relation to the basic financial statements taken as a whole, presents fairly, in all material respects, the information set forth therein.
As discussed in Note 14 to the consolidated financial statements, Ultratech, Inc. changed its method of accounting for uncertain tax positions as of January 1, 2007.
We also have audited, in accordance with the standards of the Public Company Accounting Oversight Board (United States), Ultratech, Inc.’s internal control over financial reporting as of December 31, 2009, based on criteria established in Internal Control—Integrated Framework issued by the Committee of Sponsoring Organizations of the Treadway Commission and our report dated March 1, 2010 expressed an unqualified opinion thereon.
/s/ ERNST & YOUNG LLP
San Jose, California
March 1, 2010
60
REPORT OF ERNST & YOUNG LLP, INDEPENDENT REGISTERED PUBLIC ACCOUNTING FIRM
The Board of Directors and Stockholders of Ultratech, Inc.
We have audited Ultratech, Inc.’s internal control over financial reporting as of December 31, 2009, based on criteria established in Internal Control—Integrated Framework issued by the Committee of Sponsoring Organizations of the Treadway Commission (the COSO criteria). Ultratech, Inc.’s management is responsible for maintaining effective internal control over financial reporting and for its assessment of the effectiveness of internal control over financial reporting included in the accompanying Management’s Annual Report on Internal Control Over Financial Reporting. Our responsibility is to express an opinion on the company’s internal control over financial reporting based on our audit.
We conducted our audit in accordance with the standards of the Public Company Accounting Oversight Board (United States). Those standards require that we plan and perform the audit to obtain reasonable assurance about whether effective internal control over financial reporting was maintained in all material respects. Our audit included obtaining an understanding of internal control over financial reporting, assessing the risk that a material weakness exists, testing and evaluating the design and operating effectiveness of internal control based on the assessed risk, and performing such other procedures as we considered necessary in the circumstances. We believe that our audit provides a reasonable basis for our opinion.
A company’s internal control over financial reporting is a process designed to provide reasonable assurance regarding the reliability of financial reporting and the preparation of financial statements for external purposes in accordance with generally accepted accounting principles. A company’s internal control over financial reporting includes those policies and procedures that (1) pertain to the maintenance of records that, in reasonable detail, accurately and fairly reflect the transactions and dispositions of the assets of the company; (2) provide reasonable assurance that transactions are recorded as necessary to permit preparation of financial statements in accordance with generally accepted accounting principles, and that receipts and expenditures of the company are being made only in accordance with authorizations of management and directors of the company; and (3) provide reasonable assurance regarding prevention or timely detection of unauthorized acquisition, use or disposition of the company’s assets that could have a material effect on the financial statements.
Because of its inherent limitations, internal control over financial reporting may not prevent or detect misstatements. Also, projections of any evaluation of effectiveness to future periods are subject to the risk that controls may become inadequate because of changes in conditions, or that the degree of compliance with the policies or procedures may deteriorate.
In our opinion, Ultratech, Inc. maintained, in all material respects, effective internal control over financial reporting as of December 31, 2009, based on the COSO criteria.
We also have audited, in accordance with the standards of the Public Company Accounting Oversight Board (United States), the accompanying consolidated balance sheets of Ultratech, Inc. as of December 31, 2009 and 2008, and the related consolidated statements of operations, stockholders’ equity, and cash flows for each of the three years in the period ended December 31, 2009 and our report dated March 1, 2010 expressed an unqualified opinion thereon.
/s/ ERNST & YOUNG LLP
San Jose, California
March 1, 2010
61
ITEM 9. CHANGES IN AND DISAGREEMENTS WITH ACCOUNTANTS ON ACCOUNTING AND FINANCIAL DISCLOSURE
Not applicable.
ITEM 9A. CONTROLS AND PROCEDURES
Controls and Procedures
We conducted an evaluation of the effectiveness of the design and operation of our disclosure controls and procedures, as defined in Rules 13a-15(e) and 15d-15(e) under the Securities Exchange Act of 1934, as amended (the “Exchange Act”), as of the end of the period covered by this report (the “Evaluation Date”). Based upon the evaluation, our principal executive officer and principal financial officer concluded as of the Evaluation Date that our disclosure controls and procedures were effective to ensure that information required to be disclosed by us in reports that we file or submit under the Exchange Act is recorded, processed, summarized and reported within the time periods specified in Securities and Exchange Commission (“SEC”) rules and forms.
Disclosure controls and procedures are controls and other procedures that are designed to ensure that information required to be disclosed in our reports filed or submitted under the Exchange Act is recorded, processed, summarized and reported within the time periods specified in the SEC’s rules and forms. Disclosure controls and procedures include, without limitation, controls and procedures designed to ensure that information required to be disclosed in our reports filed or submitted under the Exchange Act is accumulated and communicated to management to allow timely decisions regarding required disclosure. In designing and evaluating the disclosure controls and procedures, our management recognizes that any controls and procedures, no matter how well designed and operated, can provide only reasonable assurance of achieving the desired control objectives. Management is further required to apply judgment in evaluating the cost-benefit relationship of possible controls and procedures.
Management’s Annual Report on Internal Control Over Financial Reporting
Our management is responsible for establishing and maintaining adequate internal control over financial reporting as defined in Rules 13a-15(f) and 15d-15(f) under the Securities Exchange Act of 1934, as amended. Our internal control over financial reporting is designed to provide reasonable assurance to our management and board of directors regarding the preparation and fair presentation of published financial statements. Because of its inherent limitations, internal control over financial reporting may not prevent or detect misstatements. Therefore, even those systems determined to be effective can provide only reasonable assurance with respect to financial statement preparation and presentation.
Management, including our principal executive officer and principal financial officer, assessed the effectiveness of our internal control over financial reporting as of December 31, 2009. In making this assessment, management used the criteria set forth by the committee of Sponsoring Organizations of the Treadway Commission (“COSO”) in Internal Control—Integrated Framework. Based on this assessment, our management has concluded that, as of December 31, 2009, our internal control over financial reporting is effective based on those criteria. Our management has also concluded that our disclosure controls and procedures were effective to ensure that information required to be disclosed in the reports that we file or submit under the Exchange Act is accumulated and communicated to our management, including our principal executive officer and principal financial officer, to allow timely decisions regarding required disclosure.
Ernst & Young, LLP, the independent registered public accounting firm who also audited our consolidated financial statements, has issued an attestation report on our internal control over financial reporting. This attestation report appears elsewhere herein.
Changes in Internal Control Over Financial Reporting
There were no changes in our internal control over financial reporting during the quarter ended December 31, 2009 that have materially affected, or are reasonably likely to materially affect our internal control over financial reporting.
ITEM 9B. OTHER INFORMATION
None.
62
PART III
The information required by Part III is omitted from this Report and is incorporated herein by reference from our definitive proxy statement to be filed within 120 days after the end of our fiscal year pursuant to Regulation 14A for our 2010 Annual Meeting of Stockholders currently scheduled to be held on July 20, 2010.
ITEM 10. DIRECTORS, EXECUTIVE OFFICERS AND CORPORATE GOVERNANCE
The information concerning our directors required by this Item is incorporated by reference from the Item captioned “Election of Directors” in our Proxy Statement for the 2009 Annual Meeting of Stockholders (the “Proxy Statement”). The information required by this Item relating to our executive officers is included under the caption “Executive Officers of the Registrant” in Part I of this Annual Report on Form 10-K. Other information required by this Item is incorporated herein by reference from the Item captioned “Section 16(a) Beneficial Ownership Reporting Compliance” in the Proxy Statement.
ITEM 11. EXECUTIVE COMPENSATION
The information required by this Item is incorporated by reference from the Item captioned “Executive Compensation” in the Proxy Statement.
ITEM 12. SECURITY OWNERSHIP OF CERTAIN BENEFICIAL OWNERS AND MANAGEMENT AND RELATED STOCKHOLDER MATTERS
The information required by this Item is incorporated by reference from the Items captioned “Election of Directors,” “Ownership of Securities” and “Equity Compensation Information for Plans or Individual Arrangements with Employees and Non-Employees” in the Proxy Statement.
ITEM 13. CERTAIN RELATIONSHIPS AND RELATED TRANSACTIONS, AND DIRECTOR INDEPENDENCE
The information required by this Item is incorporated by reference from the items captioned “Election of Directors” and “Certain Relationships and Related Transactions” in the Proxy Statement.
ITEM 14. PRINCIPAL ACCOUNTANT FEES AND SERVICES
The information required by this Item is incorporated by reference from the item captioned “Fees billed to Ultratech by Ernst & Young LLP during fiscal year 2009” in the Proxy Statement.
PART IV
ITEM 15. FINANCIAL STATEMENTS, FINANCIAL STATEMENT SCHEDULES, AND EXHIBITS
| (a) | The following documents are filed as part of this Report on Form 10-K |
| (1) | Financial Statements |
The financial statements (including the notes thereto) listed in the Index to Consolidated Financial Statement Schedule (set forth in Item 8 of Part II of this Form 10-K) are filed within this Annual Report on Form 10-K.
| (2) | Financial Statement Schedules |
The following consolidated financial statement schedule is included herein:
| Page Number | ||
| Schedule II Valuation and Qualifying Accounts |
S-1 |
Schedules other than those listed above have been omitted since they are either not required, are not applicable, or the required information is shown in the financial statements or related notes.
63
(3) Exhibits
Except as indicated in Exhibit 32.1, the following exhibits are filed as part of, or incorporated in reference into this Annual Report on Form 10-K:
| Exhibit | Description | |
| 3.1(1) | Amended and Restated Certificate of Incorporation of the Registrant, filed October 6, 1993. | |
| 3.1.1(1) | Certificate of Amendment of the Amended and Restated Certificate of Incorporation of the Registrant, dated May 17, 1995. | |
| 3.1.2(1) | Certificate of Amendment of the Amended and Restated Certificate of Incorporation of the Registrant, filed June 17, 1998. | |
| 3.1.3(1) | Certificate of Amendment of the Amended and Restated Certificate of Incorporation of the Registrant, filed June 20, 2003. | |
| 3.1.4(16) | Certificate of Amendment of the Amended and Restated Certificate of Incorporation of the Registrant, filed August 31, 2009. | |
| 3.2(2) | Bylaws of Registrant, as amended. | |
| 4.1(3) | Specimen Common Stock Certificate of Registrant. | |
| 10.1(4) | 1993 Stock Option/Stock Issuance Plan (amended and restated as of January 30, 2007). | |
| 10.2(3) | Form of Indemnification Agreement entered into between the Registrant and each of its officers and directors. | |
| 10.3(5) | Form of Indemnification Agreement entered into between the Registrant and certain officers. | |
| 10.4(3) | Standard Industrial Lease—Single Tenant, Full Net between The Equitable Life Assurance Society of the United States, as Landlord, and Registrant, as Tenant, dated August 27, 1993. | |
| 10.4.1(5) | First Amendment to Lease between The Equitable Life Assurance Society of the United States, as Landlord, and Registrant, as Tenant, dated November 1999. | |
| 10.5(6) | Profit Sharing Plan. | |
| 10.6(7) | 1998 Supplemental Stock Option/ Stock Issuance Plan (amended and restated effective January 29, 2008). | |
| 10.7(8) | Private Wealth Management Client Agreement with Morgan Stanley, dated December 16, 2004. | |
| 10.8(9) | Lease Agreement between Montague LLC, As Landlord, and Registrant, As Tenant dated November 22, 1999. | |
| 10.9(12) | Amended and Restated Employment Agreement between Registrant and Mr. Arthur Zafiropoulo, Chief Executive Officer, dated as of October 14, 2008. | |
| 10.10(12) | Amended and Restated Employment Agreement between Registrant and Mr. Bruce Wright, Chief Financial Officer, dated as of October 14, 2008. | |
| 10.11(12) | Form of Restricted Stock Unit Issuance Agreement for Executive Officers with Employment Agreements. | |
| 10.12(12) | Form of Restricted Stock Unit Issuance Agreement for Executive Officers without Employment Agreements. | |
| 10.13(11) | Form of Restricted Stock Unit Issuance Agreement for Other Employees. | |
64
| Exhibit | Description | |
| 10.14(10) | Description of 2007 Management Incentive Compensation Plan. | |
| 10.15(7) | Ultratech, Inc. Long Term Incentive Compensation Plan as amended and restated January 28, 2008. | |
| 10.16(12) | Amended and Restated Non-Qualified Supplemental Deferred Compensation Plan. | |
| 10.17(12) | Adoption Agreement Related to Amended and Restated Non-Qualified Supplemental Deferred Compensation Plan. | |
| 10.18(12) | Amendment No. 1 to Amended and Restated Non-Qualified Supplemental Deferred Compensation Plan. | |
| 10.19(12) | Special Form of Stock Option Agreement for Executive Officers with Employment Agreements. | |
| 10.20(12) | Special Form of Stock Option Agreement for Executive Officers without Employment Agreements. | |
| 10.21(12) | Regular Form of Stock Option Agreement. | |
| 10.22(13) | Description of 2009 Management Incentive Compensation Plan. | |
| 10.23(14) | New Form of Indemnification Agreement entered into between the Registrant and each of its officers and directors. | |
| 10.24(15) | Resignation Letter Agreement, dated May 14, 2009, as amended. | |
| 10.25(17) | Second Amendment to Lease (3050 Zanker), entered into on October 30, 2009, by and between LaSalle Montague, Inc. and the Registrant. | |
| 10.26(17) | First Amendment to Lease (2880 Junction), entered into on October 30, 2009, by and between LaSalle Montague, Inc. and the Registrant. | |
| 21 | Subsidiaries of Registrant. | |
| 23 | Consent of Ernst & Young LLP, Independent Registered Public Accounting Firm. | |
| 24 | Power of Attorney (contained in Signature page hereto). | |
| 31.1 | Certification of Chief Executive Officer Pursuant to Section 302 of the Sarbanes-Oxley Act of 2002. | |
| 31.2 | Certification of Chief Financial Officer Pursuant to Section 302 of the Sarbanes-Oxley Act of 2002. | |
| 32.1* | Certifications of Chief Executive Officer and Chief Financial Officer pursuant to 18 U.S.C. Section 1350, as Adopted Pursuant to Section 906 of the Sarbanes-Oxley Act of 2002. | |
| * | Exhibit 32.1 is being furnished and shall not be deemed to be “filed” for purposes of Section 18 of the Securities Exchange Act of 1934, as amended, or otherwise subject to the liability of that section, nor shall such exhibit be deemed to be incorporated by reference in any registration statement or other document filed under the Securities Act of 1933, as amended, or the Securities Exchange Act, except as otherwise stated in such filing. | |
| (1) | Previously filed with our Quarterly Report on Form 10-Q for the quarter ended June 28, 2003 (Commission File No. 0-22248). |
| (2) | Previously filed with our Current Report on Form 8-K filed on October 20, 2008 (Commission File No. 0-22248). |
| (3) | Previously filed with our Registration Statement on Form S-1 declared effective with the Securities and Exchange Commission on September 28, 1993. File No. 33-66522. |
65
| (4) | Incorporated by reference to Item 5.02 of our Current Report on Form 8-K filed on July 30, 2007 (Commission File No. 0-22248). |
| (5) | Previously filed with our Annual Report on Form 10-K for the year ended December 31, 2002 (Commission File No. 0-22248). |
| (6) | Previously filed with our 1993 Annual Report on Form 10-K (Commission File No. 0-22248). |
| (7) | Previously filed with our Current Report on Form 8-K filed on February 1, 2008 (Commission File No. 0-22248). |
| (8) | Previously filed with our Annual Report on Form 10-K for the year ended December 31, 2004 (Commission File No. 0-22248). |
| (9) | Previously filed with our Annual Report on Form 10-K for the year ended December 31, 1999 (Commission File No. 0-22248). |
| (10) | Incorporated herein by reference to Item 5.02 of the Registrant’s Current Report on Form 8-K filed with the Commission on February 2, 2007. |
| (11) | Previously filed with our Quarterly Report on Form 10-Q filed on May 5, 2006 (Commission File No. 0-22248). |
| (12) | Previously filed with our Annual Report on Form 10-K for the year ended December 31, 2008 (Commission File No. 0-22248). |
| (13) | Previously filed with our Quarterly Report on Form 10-Q for the quarter ended April 4, 2009 (Commission File No. 0-22248). |
| (14) | Previously filed with our Current Report on Form 8-K filed on January 30, 2009 (Commission File No. 0-22248). |
| (15) | Previously filed with our Current Report on Form 8-K filed on May 20, 2009 (Commission File No. 0-22248). |
| (16) | Previously filed with our Quarterly Report on Form 10-Q for the quarter ended October 3, 2009 (Commission File No. 0-22248). |
| (17) | Previously filed with our Current Report on Form 8-K filed on November 5, 2009 (Commission File No. 0-22248). |
| (b) | Exhibits. See list of exhibits under (a)(3) above. |
| (c) | Financial Statement Schedules. See list of schedules under (a)(2) above. |
66
SIGNATURES
Pursuant to the requirements of Section 13 or 15(d) of the Securities Exchange Act of 1934, the Registrant has duly caused this Report to be signed on its behalf by the undersigned, thereunder duly authorized.
| ULTRATECH, INC. | ||||||||
| Date: March 1, 2010 |
By: | /s/ ARTHUR ZAFIROPOULO | ||||||
| Arthur Zafiropoulo | ||||||||
| Chairman of the Board of Directors and Chief Executive Officer | ||||||||
The undersigned directors and officers of Ultratech, Inc. (the “Company”), a Delaware corporation, hereby constitute and appoint Arthur W. Zafiropoulo and Bruce R. Wright, and each of them with full power to act without the other, the undersigned’s true and lawful attorney-in-fact, with full power of substitution and re-substitution, for the undersigned and in the undersigned’s name, place and stead in the undersigned’s capacity as an officer and/or director of the Company, to execute in the name and on behalf of the undersigned this Report and to file such Report, with exhibits thereto and other documents in connection therewith and any and all amendments thereto, with the Securities and Exchange Commission, granting unto said attorneys-in-fact, and each of them, full power and authority to do and perform each and every act and thing necessary or desirable to be done and to take any other action of any type whatsoever in connection with the foregoing which, in the opinion of such attorney-in-fact, may be of benefit to, in the best interest of, or legally required of, the undersigned, it being understood that the documents executed by such attorney-in-fact on behalf of the undersigned pursuant to this Power of Attorney shall be in such form and shall contain such terms and conditions as such attorney-in-fact may approve in such attorney-in-fact’s discretion.
Pursuant to the requirements of the Securities Exchange Act of 1934, this Report has been signed below (and the above Powers of Attorney granted) by the following persons on behalf of the Registrant and in the capacities and on the dates indicated.
| Name |
Title |
Date | ||
| /s/ ARTHUR ZAFIROPOULO Arthur Zafiropoulo |
Chairman of the Board of Directors and Chief Executive Officer (Principal Executive Officer) |
March 1, 2010 | ||
| /s/ BRUCE WRIGHT Bruce Wright |
Senior Vice President, Finance, Chief Financial Officer and Secretary (Principal Financial and Accounting Officer) |
March 1, 2010 | ||
| /s/ DENNIS RANEY Dennis Raney |
Director |
March 1, 2010 | ||
| /s/ RICK TIMMINS Rick Timmins |
Director |
March 1, 2010 | ||
| /s/ HENRI RICHARD Henri P Richard |
Director |
March 1, 2010 | ||
| /s/ JOEL GEMUNDER Joel Gemunder |
Director |
March 1, 2010 | ||
| /s/ NICHOLAS KONIDARIS Nicholas Konidaris |
Director |
March 1, 2010 | ||
| /s/ BEN TSAI Ben Tsai |
Director |
March 1, 2010 | ||
67
SCHEDULE II
ULTRATECH, INC.
VALUATION AND QUALIFYING ACCOUNTS
(in thousands)
| Description |
Balance at Beginning of Year |
Charged (Credited) to Costs and Expenses |
Balance at End of Year | |||||||
| Allowance for doubtful accounts: |
||||||||||
| Year ended December 31, 2007 |
||||||||||
| Trade accounts receivable |
$ | 466 | $ | (160 | ) | $ | 306 | |||
| $ | 466 | $ | (160 | ) | $ | 306 | ||||
| Year ended December 31, 2008 |
||||||||||
| Trade accounts receivable |
$ | 306 | $ | (121 | ) | $ | 185 | |||
| $ | 306 | $ | (121 | ) | $ | 185 | ||||
| Year ended December 31, 2009 |
||||||||||
| Trade accounts receivable |
$ | 185 | $ | 133 | $ | 318 | ||||
| $ | 185 | $ | 133 | $ | 318 | |||||
68
EXHIBIT INDEX
| Exhibit | Description | |
| 3.1(1) | Amended and Restated Certificate of Incorporation of the Registrant, filed October 6, 1993. | |
| 3.1.1(1) | Certificate of Amendment of the Amended and Restated Certificate of Incorporation of the Registrant, dated May 17, 1995. | |
| 3.1.2(1) | Certificate of Amendment of the Amended and Restated Certificate of Incorporation of the Registrant, filed June 17, 1998. | |
| 3.1.3(1) | Certificate of Amendment of the Amended and Restated Certificate of Incorporation of the Registrant, filed June 20, 2003. | |
| 3.1.4(16) | Certificate of Amendment of the Amended and Restated Certificate of Incorporation of the Registrant, filed August 31, 2009. | |
| 3.2(2) | Bylaws of Registrant, as amended. | |
| 4.1(3) | Specimen Common Stock Certificate of Registrant. | |
| 10.1(4) | 1993 Stock Option/Stock Issuance Plan (amended and restated as of January 30, 2007). | |
| 10.2(3) | Form of Indemnification Agreement entered into between the Registrant and each of its officers and directors. | |
| 10.3(5) | Form of Indemnification Agreement entered into between the Registrant and certain officers. | |
| 10.4(3) | Standard Industrial Lease—Single Tenant, Full Net between The Equitable Life Assurance Society of the United States, as Landlord, and Registrant, as Tenant, dated August 27, 1993. | |
| 10.4.1(5) | First Amendment to Lease between The Equitable Life Assurance Society of the United States, as Landlord, and Registrant, as Tenant, dated November 1999. | |
| 10.5(6) | Profit Sharing Plan. | |
| 10.6(7) | 1998 Supplemental Stock Option/ Stock Issuance Plan (amended and restated effective January 29, 2008). | |
| 10.7(8) | Private Wealth Management Client Agreement with Morgan Stanley, dated December 16, 2004. | |
| 10.8(9) | Lease Agreement between Montague LLC, As Landlord, and Registrant, As Tenant dated November 22, 1999. | |
| 10.9(12) | Amended and Restated Employment agreement between Registrant and Mr. Arthur Zafiropoulo, Chief Executive Officer, dated as of October 14, 2008. | |
| 10.10(12) | Amended and Restated Employment agreement between Registrant and Mr. Bruce Wright, Chief Financial Officer, dated as of October 14, 2008. | |
| 10.11(12) | Form of Restricted Stock Unit Issuance Agreement for Executive Officers with Employment Agreements. | |
| 10.12(12) | Form of Restricted Stock Unit Issuance Agreement for Executive Officers without Employment Agreements. | |
| 10.13(11) | Form of Restricted Stock Unit Issuance Agreement for Other Employees. | |
| 10.14(10) | Description of 2007 Management Incentive Compensation Plan. | |
69
| Exhibit | Description | |
| 10.15(7) | Ultratech, Inc. Long Term Incentive Compensation Plan as amended and restated January 28, 2008. | |
| 10.16(12) | Amended and Restated Non-Qualified Supplemental Deferred Compensation Plan. | |
| 10.17(12) | Adoption Agreement Related to Amended and Restated Non-Qualified Supplemental Deferred Compensation Plan. | |
| 10.18(12) | Amendment No. 1 to Amended and Restated Non-Qualified Supplemental Deferred Compensation Plan. | |
| 10.19(12) | Special Form of Stock Option Agreement for Executive Officers with Employment Agreements. | |
| 10.20(12) | Special Form of Stock Option Agreement for Executive Officers without Employment Agreements. | |
| 10.21(12) | Regular Form of Stock Option Agreement. | |
| 10.22(13) | Description of 2009 Management Incentive Compensation Plan. | |
| 10.23(14) | New Form of Indemnification Agreement entered into between the Registrant and each of its officers and directors. | |
| 10.24(15) | Resignation Letter Agreement, dated May 14, 2009, as amended. | |
| 10.25(17) | Second Amendment to Lease (3050 Zanker), entered into on October 30, 2009, by and between LaSalle Montague, Inc. and the Registrant. | |
| 10.26(17) | First Amendment to Lease (2880 Junction), entered into on October 30, 2009, by and between LaSalle Montague, Inc. and the Registrant. | |
| 21 | Subsidiaries of Registrant. | |
| 23 | Consent of Ernst & Young LLP, Independent Registered Public Accounting Firm. | |
| 24 | Power of Attorney (contained in Signature page hereto). | |
| 31.1 | Certification of Chief Executive Officer Pursuant to Section 302 of the Sarbanes-Oxley Act of 2002. | |
| 31.2 | Certification of Chief Financial Officer Pursuant to Section 302 of the Sarbanes-Oxley Act of 2002. | |
| 32.1* | Certifications of Chief Executive Officer and Chief Financial Officer pursuant to 18 U.S.C. Section 1350, as Adopted Pursuant to Section 906 of the Sarbanes-Oxley Act of 2002. | |
| * | Exhibit 32.1 is being furnished and shall not be deemed to be “filed” for purposes of Section 18 of the Securities Exchange Act of 1934, as amended, or otherwise subject to the liability of that section, nor shall such exhibit be deemed to be incorporated by reference in any registration statement or other document filed under the Securities Act of 1933, as amended, or the Securities Exchange Act, except as otherwise stated in such filing. | |
| (1) | Previously filed with our Quarterly Report on Form 10-Q for the quarter ended June 28, 2003 (Commission File No. 0-22248). |
| (2) | Previously filed with our Current Report on Form 8-K filed on October 20, 2008 (Commission File No. 0-22248). |
| (3) | Previously filed with our Registration Statement on Form S-1 declared effective with the Securities and Exchange Commission on September 28, 1993. File No. 33-66522. |
| (4) | Incorporated by reference to Item 5.02 of our Current Report on Form 8-K filed on July 30, 2008 (Commission File No. 0-22248). |
70
| (5) | Previously filed with our Annual Report on Form 10-K for the year ended December 31, 2002 (Commission File No. 0-22248). |
| (6) | Previously filed with our 1993 Annual Report on Form 10-K (Commission File No. 0-22248). |
| (7) | Previously filed with our Current Report on Form 8-K filed on February 1, 2008 (Commission File No. 0-22248). |
| (8) | Previously filed with our Annual Report on Form 10-K for the year ended December 31, 2004 (Commission File No. 0-22248). |
| (9) | Previously filed with our Annual Report on Form 10-K for the year ended December 31, 1999 (Commission File No. 0-22248). |
| (10) | Incorporated herein by reference to Item 5.02 of the Registrant’s Current Report on Form 8-K filed with the Commission on February 2, 2008. |
| (11) | Previously filed with our Quarterly Report on Form 10-Q filed on May 5, 2007 (Commission File No. 0-22248). |
| (12) | Previously filed with our Annual Report on Form 10-K for the year ended December 31, 2008 (Commission File No. 0-22248). |
| (13) | Previously filed with our Quarterly Report on Form 10-Q for the quarter ended April 4, 2009 (Commission File No. 0-22248). |
| (14) | Previously filed with our Current Report on Form 8-K filed on January 30, 2009 (Commission File No. 0-22248). |
| (15) | Previously filed with our Current Report on Form 8-K filed on May 20, 2009 (Commission File No. 0-22248). |
| (16) | Previously filed with our Quarterly Report on Form 10-Q for the quarter ended October 3, 2009 (Commission File No. 0-22248). |
| (17) | Previously filed with our Current Report on Form 8-K filed on November 5, 2009 (Commission File No. 0-22248). |
71