Attached files
| file | filename |
|---|---|
| 8-K - FORM 8-K - Ruths Hospitality Group, Inc. | d8k.htm |
 January 2010 Exhibit 99.1 |
 Disclaimer This presentation contains “forward-looking statements” that reflect, when made, the expectations of Ruth’s Hospitality Group, Inc. ("Ruth's" or the “Company”) or beliefs concerning future
events that involve risks and uncertainties. Forward- looking statements frequently are identified by the words “believe,” “anticipate,” “expect,” “estimate,” “intend,” “project,” “will be,” “will continue,” “will likely result” or other similar words and phrases. Similarly, statements herein that describe the
Company’s objectives, plans or goals also are forward-looking
statements. Actual results could differ materially from those projected,
implied or anticipated by the Company’s forward-looking statements. Some of the factors that could cause actual results to differ include the risk factors identified in the reports the Company files
with the Securities and Exchange Commission (the “SEC”),
including its Annual Report on Form 10-K for the fiscal year ended December 28, 2008 and subsequently filed Quarterly Reports on Form 10-Q, all of which are available on the SEC’s website at www.sec.gov. All forward-looking statements are qualified in their entirety by this cautionary
statement, and the Company undertakes no obligation to revise or update
this presentation after the date hereof. The Company has filed a
registration statement (including a prospectus) with the SEC (File No. 333-160231) and intends to file a prospectus supplement with respect to its proposed common stock rights offering. Before you invest, you should read the prospectus and, when filed, the prospectus supplement and other documents the
Company has filed with the SEC for more complete information about the
Company and the rights offering. In connection with the Company’s
proposed private placement transaction, the Company has filed a preliminary proxy statement with the SEC and intends to file a definitive proxy statement and to mail the
definitive proxy statement to the Company’s shareholders. The Company
and its directors and officers may be deemed to be participants in the solicitation of proxies from the Company’s shareholders in connection with the private placement
transaction. Information about the Company’s directors and executive
officers and their ownership of its securities will be set forth in the definitive proxy statement to be filed by the Company with the SEC. When available, you may obtain the foregoing documents, including the prospectus
supplement and the preliminary and definitive proxy statements, for free by visiting the SEC’s website at www.sec.gov. In addition, copies of the prospectus and prospectus supplement for the rights offering may be obtained, when available, from the
information agent to be identified in the prospectus supplement. Investors
should read the definitive proxy statement and the prospectus and prospectus supplement carefully before making any voting or investment decision because these
documents will contain important information. 1 |
 Positions Ruth’s as one of the best capitalized upscale steakhouse chains Provides management with flexibility to operate the business for long- term success Provides approximately $50 million of available bank revolver capacity at attractive rates and a 5-year term Increases capital expenditure baskets to enable the Company to take advantage of opportunistic growth opportunities Brings in a successful, experienced restaurant investor, Bruckmann, Rosser, Sherrill & Co. (“BRS”), whose representative will serve on the
board Allows current shareholders participating in the rights offering to limit their dilution and allows all shareholders, if the transaction closes, to benefit from the Company’s improved financial position Rationale for Raising Additional Equity 2 |
 Transaction Details Sale to BRS in a private placement of Series A 10% Convertible Preferred Stock for an
aggregate purchase price of $25.0 million (the “Private
Placement”) – Private Placement is conditioned upon: Completing a Common Stock rights offering raising at least $25.0 million in gross proceeds (the “Rights Offering”) Obtaining shareholder consent for the Private Placement – Private Placement conversion price will be set at a 15.0% premium to the Rights
Offering, with a minimum conversion price of $2.90 per share and a maximum conversion price of $3.25 per share Conversion price subject to customary anti-dilution adjustments – BRS will be entitled to designate or nominate one board member so long as they own
at least 5.0% of total voting power of the common stock on an as converted basis Company will conduct the Rights Offering, with gross proceeds of up to $35.0 million in cash assuming full participation – The Rights will be transferable and will allow for over-subscription in certain
circumstances Net proceeds of the Private Placement and the Rights Offering will be used to repay
debt outstanding under the Company’s revolving credit facility
A bank amendment providing covenant relief and extending the maturity of the
Company’s credit agreement will become effective upon meeting certain
conditions, including obtaining at least $42.5 million in net proceeds from
the Private Placement and the Rights Offering 3 |
 The Company has structured a portion of the equity raise in the form of a Rights Offering in order to allow existing shareholders to participate in its recapitalization and to minimize their ownership dilution Illustrative Ownership Analysis (1) Assumes that all of the Rights that are exercised are exercised by existing shareholders, all of whom exercise their Rights in full. 4 Illustrative Assumptions Current Common Shares Outstanding (in millions) 24.163 Current Stock Price (1/8/2010) $2.77 Convertible Preferred Stock $25.0 Implied Conversion Price of Convertible Preferred Stock Investment $3.19 Common Shares Issuable upon Conversion of the Convertible Preferred Stock (in
millions) 7.848 Illustrative Ownership Analysis Minimum Rights Offering Proceeds ($ in millions) $25.0 Ownership and Participation Participating Shareholders and Exercised Rights Percentage 71.4% Non-participating Shareholders and Non-exercised Rights Percentage 28.6% Post Transaction Ownership (As Converted Basis) Participating Holders (1) 64.1% Ownership Dilution from Convertible Preferred Stock Issuance (7.4%) |
 Sources
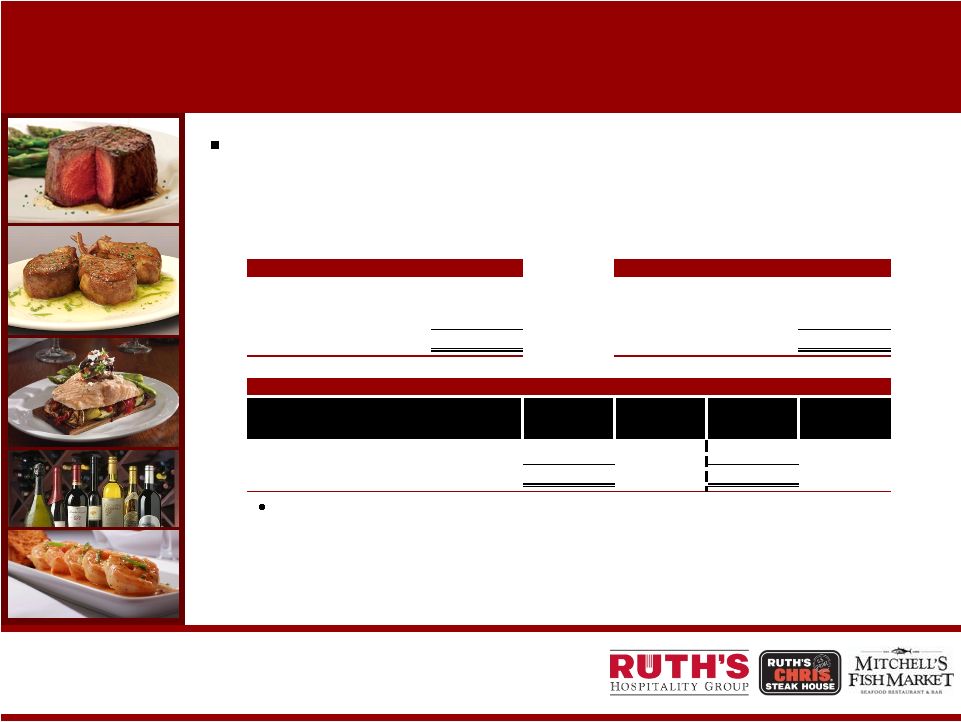
of Funds Uses of Funds BRS Investment 25.0 $ Revolver Paydown 45.5 $ Min. Rights Offering Proceeds 25.0 Estimated Fees & Expenses 4.5 Total Sources of Funds 50.0 $ Total Uses of Funds 50.0 $ Debt Capitalization as of FYE 2009 Actual Leverage Ratio (1) Pro Forma (2) Leverage Ratio (1) Revolving Credit Facility 125.5 $ 3.24x 80.0 $ 2.07x Total Debt 125.5 $ 80.0 $ Source: Company filings. (1) LTM 9/27/2009 Bank EBITDA of $38.7 million was used for the calculation of the actual
and pro forma leverage ratio at FYE 2009, and was calculated in accordance with the terms of the Company's existing credit agreement. The debt balance used in the calculation of the actual and pro forma leverage ratio at FYE 2009 was the actual and pro forma debt balance at FYE 2009, and was
calculated in accordance with the Company's existing credit agreement, as
amended by the proposed bank amendment. For a reconciliation of Bank EBITDA, a non-GAAP financial measure, to net income, see Appendix B. (2) The pro forma debt balance gives effect to the application of the net proceeds from the Private Placement and Rights Offering to repay indebtedness under the credit facility assuming that the transactions had been completed at FYE
2009. The proposed Private Placement and Rights Offering consist of a
minimum $50.0 million equity raise, with net proceeds used to pay down a
portion of the outstanding borrowings under the Company’s revolving
credit facility – The equity raise will consist of a $25.0 million private investment by BRS and a
minimum $25.0 million Rights Offering Pro Forma Transaction In 2009, the Company reduced its outstanding debt by approximately $35.0 million ($ in millions) 5 |
 Current Management Team Accomplishments Hired new Chief Operating Officers (Kevin Toomy and Sam Tancredi) Launched brand positioning study Implemented initiatives to drive traffic and top-line sales Generated labor and operating expense savings Generated G&A expense reductions through re-aligning corporate support and restructuring field supervision Established focus on generation of cash flow and reduction of balance sheet leverage – Completed sale-leaseback transaction of 5 Company-owned restaurants – Sold corporate headquarters building – Eliminated new Company-owned restaurant development 6 |
 Company Overview 7 |
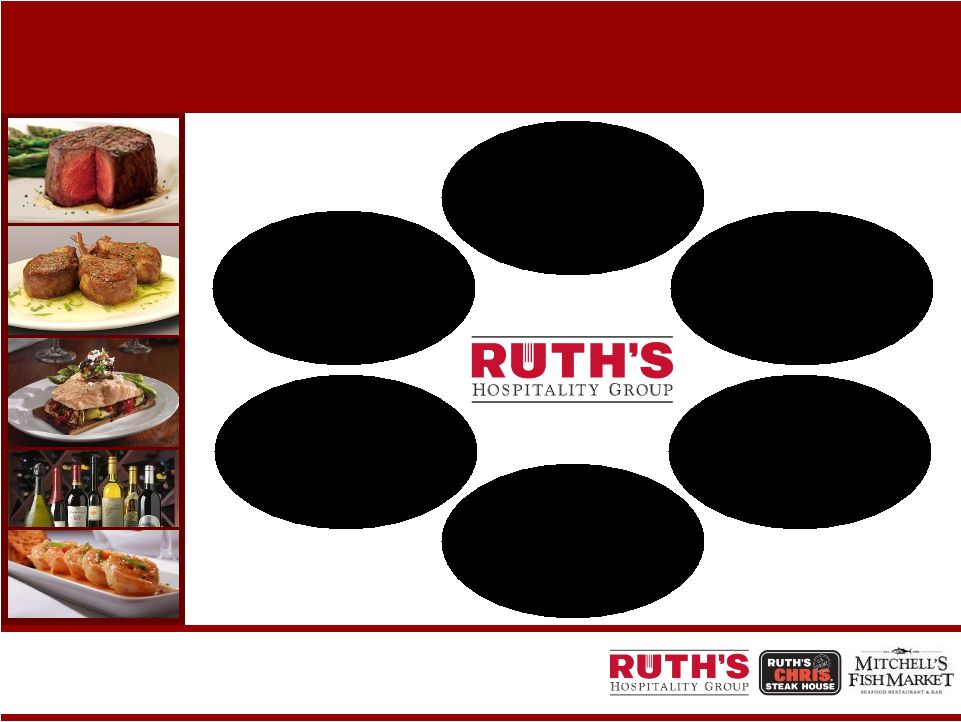 Ruth’s Hospitality Group Highlights Iconic Upscale Steakhouse Brand Broad Demographic Appeal Strong Restaurant Base with Solid Unit Economics Highly Experienced and Committed Management Team Premier Upscale- casual Seafood Concept Stable Franchise Base Generating Consistent Revenue Stream 8 |
 Ruth’s Chris history – 44+ years in business as segment leader – 64 Company-owned and 66 franchisee-owned restaurants in 30 states – 2008 / 2009 Recognition Best Restaurant to Seal the Deal - Orlando Magazine Best Steakhouse Runner-up, Best Place Special Occasion - Sacramento Magazine Best Overall, Best Steakhouse - Seminole Magazine Best Food, Best Overall - Open Table Diner Choice, Phoenix/Scottsdale Best Steakhouse - VisitDetroit.com 92 Locations Awarded the Wine Spectator Award of Excellence Best of the Best - Luxury Institute Survey Ruth’s Chris Steak House Segment Overview 9 |
 Largest Upscale Steakhouse Restaurant Locations versus Competitors Average Check Per Customer versus Competitors $ 70 97 81 73 – 74 79 70 – 75 60 79 105 Source: Company filings, Wall Street research and Company presentations. Ruth’s
Chris data as of year-end 2009. 10 130 |
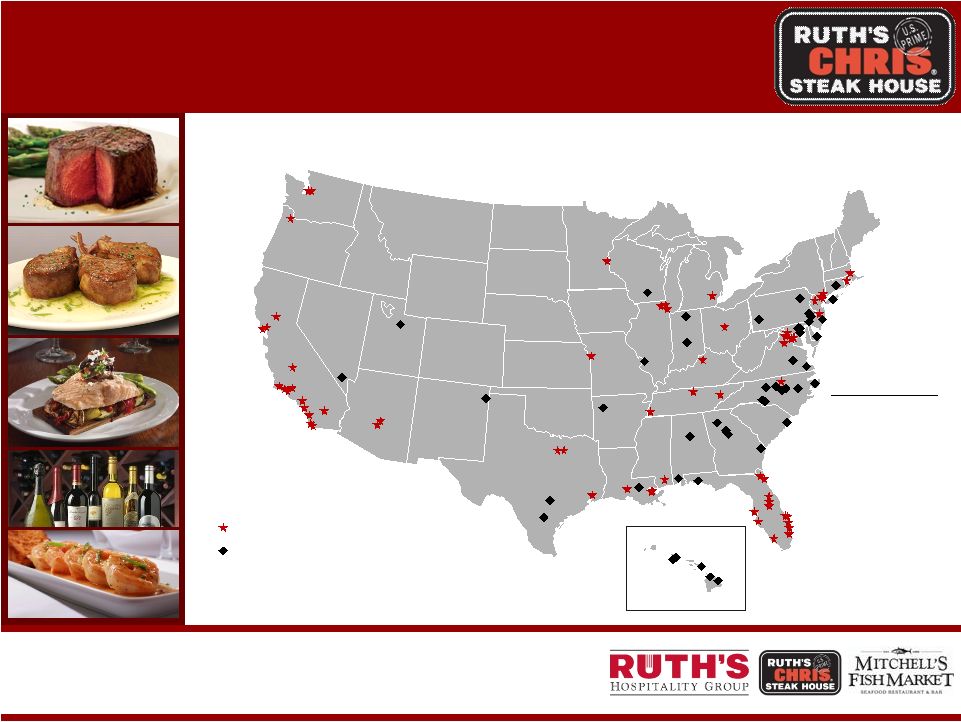 Ruth’s Chris Steak House Footprint HI Company-owned Ruth’s Chris Steak House Locations Franchisee-owned Ruth’s Chris Steak House Locations International Locations: Aruba Calgary, Canada Edmonton, Canada Mississauga, Canada Toronto, Canada Hong Kong Queensway, Hong Kong Tokyo, Japan Cabo San Lucas, Mexico Cancun, Mexico San Juan, Puerto Rico Kaohsiung, Taiwan Taichung, Taiwan Taipei, Taiwan Dubai, UAE 11 |
 Broad
Appeal of Concept Purpose of Visit Appeals to Men and Women Appeals to Wide Age Demographic Source: Based on an independent survey conducted in 2007. 12 |
 Attractive Sales Mix Ruth’s Chris Steak House’s higher margin wine and alcoholic beverage sales have remained stable since 2008, generating approximately 25% of revenues Ruth’s Chris Steak House’s signature steaks, diverse accompaniments
and extensive wine and liquor offerings drive guest appeal and generate
an attractive sales mix Source: Company data for LTM 9/27/2009. 13 |
 Strong Franchise Positioning Strength of franchise system – 27 franchisees operating 51 domestic and 15 international locations in 21 states and 8 countries – All franchisees are current on their royalty payments as of FYE 2009 – Recent growth 7 new franchised restaurants in 2008 and 6 new franchised restaurants in 2009 International market expansion – Aruba 2008, Dubai 2009, San Juan 2009 – Business model with both Company-owned and franchisee-owned restaurants is unique in the upscale steakhouse segment Provides approximately $10 – $12 million in aggregate annual royalty fees Allows system growth without additional Company capital 14 |
 Profile of Franchise System First franchise opened in 1976 in Baton Rouge, LA Unlevered franchise system provides stability and enables future growth Allows for development in secondary and tertiary markets Recurring, high margin revenue stream Franchise Breakdown Franchisees Units Owned by Franchisees % of Franchised Units Average Tenure Single Unit 15 15 22.7% 14 years 2 – 3 Units 6 14 21.2% 14 years 4 – 8 Units 6 37 56.1% 17 years Total 27 66 100.0% Note: Data as of year-end 2009. 15 |
 Mitchell’s Fish Market 16 |
 Why
Mitchell’s Fish Market Expansion into the seafood segment was a logical
move for Ruth’s – For health and other reasons, fish consumption has increased in the U.S., notably among higher-income households – National chains are increasingly taking market share away from independent operators: the segment is consolidating Core competencies are very similar to Ruth’s Chris: – Corporate culture – High quality menu – Commitment to service – Attractive unit level economics 17 |
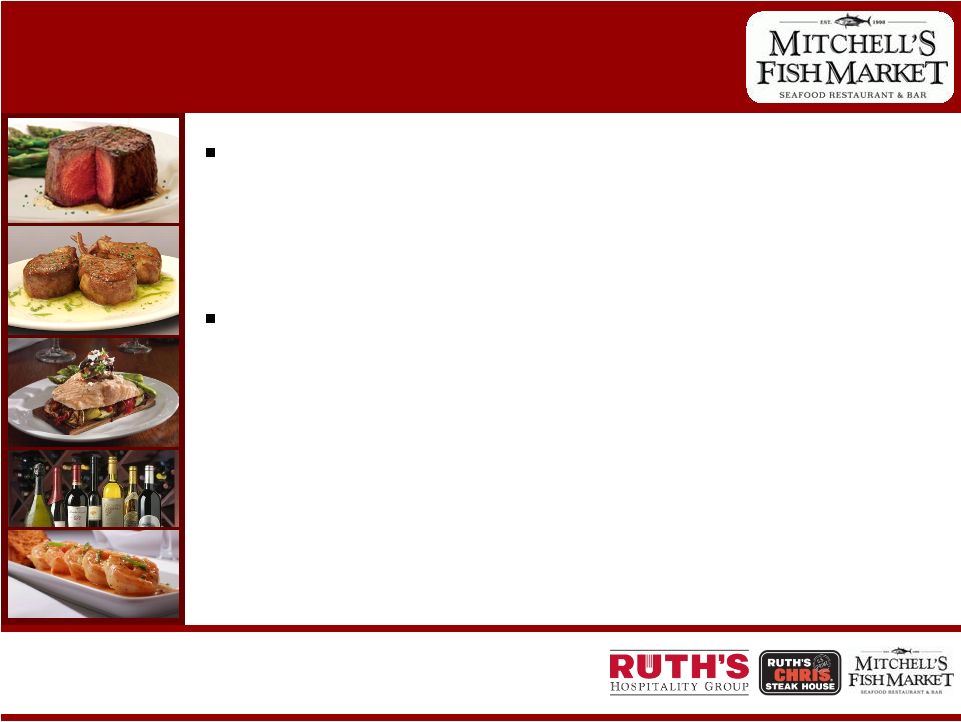 Mitchell’s Fish Market Segment Overview Mitchell’s Fish Market – Acquired by Ruth’s Hospitality Group in February 2008 – Celebrated 10 year anniversary in 2008 – 19 restaurants in 9 states 2009 Recognition Best Seafood Best Seafood Columbus Alive City Beat Cincinnati Best Seafood Best Seafood / Best Fish Market Metro Times Hour Detroit Magazine Best Food Best Seafood Selection Stamford Plus Magazine Tampa Bay Magazine 18 |
 Mitchell’s Fish Market Summary Upscale-casual seafood restaurant 19 locations in 9 states Menu offers over 80 dishes with creative presentations and a focus on always fresh A specialized fish preparation room ensures all fish is maintained at 36 o F until it is cooked Average lunch check of approximately $22.00, and average dinner check of approximately $38.00 (1) Recent menu changes, Fresh Bar program and branding campaign have improved same store sales and unit volumes Restaurant Highlights Proven success in multiple markets Seafood consumption tends to be higher on the coasts, which are a relatively untapped market for the Mitchell’s concept Seafood consumption as a whole has been increasing; focus on freshest possible seafood is a competitive advantage Popular concept appeals to developers, providing access to prime locations Economies of scale as restaurant base increases Potential for franchising Growth Opportunities (1) Mitchell’s Fish Market average lunch and dinner checks per the Company’s 2008
10-K. 19 |
 Mitchell’s Fish Market Atmosphere 20 |
 Significant Expansion Opportunity Restaurant Locations versus Competitors Average Check Per Customer versus Competitors $ 19 24 – 25 37 – 38 37 34 Source: Company filings, Wall Street research and Company presentations. Mitchell’s Fish Market data as of year-end 2009. 21 |
 Mitchell’s Fish Market Footprint Company-owned Mitchell’s Fish Market Locations 22 |
 Mitchell’s Fish Market Business Update Installed new leadership at the time of the acquisition Completed integration Implementing new marketing initiatives – Fixed price menu offerings – Marketing spend of 2.5-3.5% of sales Pursuing franchising opportunities (1)Sales summary reflects year over year comparisons. (2)Comparable Company Index is based on an equal weighted average of the same store
sales of Bonefish Grill and McCormick & Schmick’s per their public
SEC filings. Sales Summary (1) Q3 09 Q4 09 Mitchell’s Fish Market -10.1% -2.6% Comparable Company Index (2) -12.3% N/A 23 |
 Financial Overview 24 |
 Financial Performance Overview Despite pressure on the top-line, the Company has successfully increased
its Adjusted EBITDA margin during the periods shown below The Company has also exceeded its goals of generating free cash flow and paying down debt Revenue and Adjusted EBITDA Margin Comparison Free Cash Flow (2) and Debt Comparison FCF $5.1 $20.8 ($3.7) $12.0 Debt $160.3 $148.5 $166.9 $148.5 (1) For a reconciliation of Adjusted EBITDA, a non-GAAP financial measure, to net
income, see Appendix B. Adjusted EBITDA has not been adjusted for severance payments, hurricane and relocation costs and other costs, cash write-offs of the Manhattan UN Facility and Mitchell's Fish Market pro forma EBITDA prior to acquisition. (2) Free Cash Flow represents net cash provided from operating activities minus acquisition of property and equipment. Data is as of period end. See Appendix C for a reconciliation of Free Cash Flow to cash flows from operating
activities. ($ in millions) 25 |
 Q3
2009 and Q3 2009 YTD Review Food and Beverage Cost Improvement – Primarily driven by favorable beef costs Restaurant Operating Expense Improvement – Execution of operations initiatives Reduced Capital Expenditures – Spent $0.5 million in Q3 2009, $3.3 million through Q3 2009 YTD Stable Leverage Ratio (1) – At 3.92x at end of Q3 2009 Maximum leverage ratio under the credit agreement was 4.80x as of that date EPS – ($0.04) in Q3 2009 versus ($0.02) in Q3 2008 – $0.22 (2) in Q3 2009 YTD versus $0.29 in Q3 2008 YTD (1) Leverage ratio is defined as outstanding borrowings under the Company’s revolving credit facility and outstanding letters of credit at period end divided by LTM Bank EBITDA (calculated in accordance with the terms of the credit agreement). Excluding the
$3.2 million of outstanding letters of credit (as permitted under the terms of the proposed amendment to the credit agreement), the leverage ratio would have been 3.84x at
9/27/2009. For a reconciliation of LTM Bank EBITDA to net income, see Appendix B. (2) Q3 2009 YTD EPS included a one-time expense related to a loss on the disposal of
property and equipment of $1.0 million due to the sale of the Company’s former home office land and building in Metairie, Louisiana, which represented a decrease in
earnings of approximately $0.03 per share. 26 |
 Performance on Key Company Initiatives Cost Savings Initiatives – Introduced staggered scheduling, changed menu and preparation process, achieved concessions on pricing, eliminated services and implemented internal programs for utilities – Eliminated approximately 60 corporate positions by re-aligning corporate support and restructuring field supervision – Established a new approval system for all capital and travel expenditures – Reduced G&A expense by approximately $6.9 million during the first nine months of 2009 (versus prior year) Focus on Cash Flow Generation and Balance Sheet Leverage Reduction Menu and Marketing Strategy – No 2009 Company development; total capital expenditures expected to be $5.0 to 6.0 million for 2009, down from $32.0 million in 2008 – Opened 6 new franchise locations during 2009 – Paid down approximately $35 million in debt in 2009 Includes $9.7 million debt paydown from net proceeds of recent sale of corporate headquarters building – Capital expenditure reduction: – New franchise location openings: – Debt reduction: – Introduced a Value menu, a Bistro menu, early week promotions and a private dining satellite program – Labor and operating expense savings: – G&A expense reductions: – Initiatives to drive traffic and top-line sales: 27 |
 Ruth’s Chris Steak House SSS Comparison Comparable Sales FY 2008 Q1 09 Q2 09 Q3 09 Q4 09 Ruth’s Chris SSS -10.2% -18.6% -24.3% -23.9% -11.2% Knapp Track (1) SSS -9.6% -19.0% -22.9% -20.6% -9.7% Ruth’s SSS vs. Knapp Track (1) SSS -0.6% 0.4% -1.4% -3.3% -1.5% (1) Upscale steak segment index, which includes Ruth’s Chris, Flemings, Smith &
Wollensky, Sullivan’s, Del Frisco, Capital Grille, Three Forks, Cool River and Silver Fox. Ruth’s Chris Steak House Company-owned Comparable Restaurant Sales Traffic Comparison FY 2008 Q1 09 Q2 09 Q3 09 Q4 09 Ruth’s Traffic vs. Knapp Track (1) Traffic +0.7% +2.6% +0.7% -5.4% -4.5% Ruth’s Chris Steak House Company-owned Comparable Restaurant Traffic 28 |
 Continued interest in franchise ownership remains strong – 6 new openings in 2009: Greenville, SC Dubai, UAE St. Louis, MO Durham, NC Kennesaw, GA San Juan, Puerto Rico – signed a two unit franchise development agreement (the first restaurant opened in San Juan on November 23, 2009) – Salt Lake City – new franchisee agreement signed Stable Revenue Stream from Franchise System Franchise Royalties and Restaurant Count ($ in millions) 29 |
 (1) For a reconciliation of Adjusted EBITDA and Bank EBITDA to net income, see Appendix
B. (2) Bank EBITDA is Adjusted EBITDA, a non-GAAP financial measure, further adjusted to
exclude severance payments, hurricane and relocation costs and other
costs, cash write-offs of the Manhattan UN Facility and Mitchell's Fish Market pro forma EBITDA prior to acquisition, each of which are excluded pursuant to the terms of the Company’s credit agreement. For a reconciliation of
Bank EBITDA to net income, see Appendix B. (3) Excluding letters of credit in the amount of $3.2 million at the end of Q3 2008 and Q3 2009, the leverage ratio would have been 3.25x and 3.84x at the end of Q3 2008 and Q3 2009, respectively. Fiscal Year Q3 2009 and Q3 2009 YTD Review ($ in millions) 30 Ruth's Hospitality Group's Year-to-Date Performance Comparison Actual Actual Prior Q3 2009 Q3 2009 YTD Q3 2008 YTD B(W) Revenues Total Restaurant Revenues $75.6 $253.8 $291.8 ($38.1) Franchise and Other Revenues 2.2 9.5 12.4 (2.9) Total Revenues $77.8 $263.2 $304.2 ($41.0) Food and Beverage Costs 21.5 72.5 91.9 19.4 Restaurant Operating Expenses 43.4 139.3 147.1 7.8 Marketing 1.8 8.2 10.9 2.7 G&A 5.4 16.7 23.6 7.0 Depreciation 4.1 12.4 12.3 (0.1) Pre-opening 0.0 0.0 2.5 2.4 Loss on Impairment 0.0 0.3 0.0 (0.3) Restructuring Expenses 0.4 0.4 0.0 (0.4) Loss on Disposal of Property and Equipment 0.1 1.0 0.1 (0.9) Operating Income $1.0 $12.4 $15.8 ($3.4) Adjusted EBITDA (1) $6.2 $29.2 $31.9 ($2.7) LTM Bank EBITDA (1) (2) $38.7 $38.7 $51.4 ($12.7) Debt $151.7 $151.7 $170.1 $18.4 Debt / LTM Bank EBITDA (1) (2) (3) 3.92x 3.92x 3.31x (0.61x) |
 Financial Guidance FY 2009 guidance provided to the Street (as of October 30, 2009) – Comparable sales of high negative double digits – Cost of sales of 28.5% – 29.5% – Marketing spend of 3.0% – 3.3% of sales – G&A expense of $22.5 – $24.0 million – Tax rate of 17% – 20% – Capital expenditures of $5 – $6 million for maintenance and remodels Reported comparable store sales of -11.2% for Q4 2009 (vs. Q4 2008) 31 |
 Appendix A 32 |
 Rights Offering Size: Maximum gross proceeds of $35.0 million Subscription Price: TBD Current Shares Outstanding: 24,162,893 shares (including 484,000 shares of unvested restricted stock) Securities Offered: Each Transferable Subscription Right will represent the right to purchase a number of shares of Common Stock to be determined subject to adjustments to eliminate fractional shares Basic Subscription Privilege: Each Right will give shareholders of record the opportunity to purchase a number of shares of the Company’s Common Stock to be determined at the Subscription Price Over-Subscription Privilege: If a shareholder exercises its basic subscription privilege in full, it will also
have an over-subscription privilege in certain circumstances Transferability: The Rights will be transferable and are expected to be listed on NASDAQ Key Closing Conditions: Raising at least $25.0 million in gross proceeds in the Rights Offering and obtaining shareholder approval for the Private Placement Use of Proceeds: Net proceeds from the Rights Offering will be used to reduce the Company’s outstanding indebtedness under its revolving credit facility, which will reduce
its future interest expense, increase its operating flexibility, provide covenant relief and extend the maturity of the indebtedness under its credit agreement
until the earlier of the fifth anniversary of the effective date of the credit agreement amendment or February 15, 2015 Key Terms of Rights Offering 33 |
 Key
Terms of Private Placement Aggregate face amount of $25.0 million of Series
A 10.0% Convertible Preferred Stock – Dividends payable quarterly in cash or, at the Company’s option, by PIK Conversion price will be set at a 15.0% premium to the Rights Offering subscription
price, with a minimum conversion price of $2.90 per share and a maximum
conversion price of $3.25 per share – Conversion price subject to customary anti-dilution adjustments in the future
Optional Company redemption right after 5 years Company conversion right after 2 years if the stock price is equal to or greater than
225% of the then applicable conversion price for a period of 20 trading days over any 30 consecutive days Mandatory redemption obligation after 7 years or upon a change of control event
BRS will be entitled to designate or nominate one board member so long as they own
at least 5.0% of total voting power of the common stock on an as converted
basis The Private Placement will vote on an as converted basis and will be
granted certain registration and information rights Proceeds to be used to repay outstanding indebtedness under the Company’s
revolving credit facility Private Placement issuance conditioned upon: – The Rights Offering raising at least $25.0 million in gross proceeds – Obtaining shareholder consent for the Private Placement The Company and BRS have various termination rights; closing is conditioned upon
certain ownership and dilution thresholds after giving effect to the
transactions 34 |
 Existing
Credit Agreement Terms Proposed Amended Terms Facility: $175MM reducing Revolver ($5MM every 6 months commencing 12/31/09) $130MM Revolving Credit Facility Maturity: February 2013 February 2015 or 5 Year Anniversary Pricing: Leverage Covenant: No covenants for one year. First covenant measurement date FYE2010 Incurrence test for revolver at 3.75x during FY2010 Covenants as follows (tested quarterly): FYE2010 – 3.80x FY2011 – 3.75x FY2012 Q1 & Q2 – 3.60x FY2012 Q3 & Q4 – 3.40x FY2013 – 3.10x FY2014 – 2.75x Fixed Charge Covenant: 1.40x for Q1 09-Q4 2009 1.45x for Q1 10-Q2 2010 1.50x thereafter No covenants for one year. First covenant measurement date FYE2010 Covenants as follows: FY2010 through FY2014 - 1.35x Minimum EBITDA Covenant: YTD adjusted EBITDA test through Q3 2009 at the following levels: $8.25MM in Q1 2009, $17.0MM YTD Q2 2009, $24.0MM YTD Q3 2009 Thereafter, TTM EBITDA test of $33.5MM in Q4 2009, $34.0mm in Q1 2010, $35.0MM in Q2 2010, $35.5MM in Q3 2010 & Q4 2010 No minimum EBITDA covenant CapEx Limit $12.0MM for FY2009 $10.0MM for FY2010 and thereafter Additional growth CapEx available subject to passing an incurrence test for two consecutive quarters for FY2010 and annually through maturity: – Leverage < 3.35x - $5.0MM – Leverage < 3.25x - $10.0MM $12.0MM for FY2009 $12.5MM for FY2010 and thereafter Additional growth CapEx available subject to passing an incurrence test for two consecutive quarters for FY2010 and annually through maturity: – Leverage < 3.25x - $7.5MM – Leverage < 3.00x - $12.5MM – Leverage < 2.50x - $17.5MM Additional Baskets None No stock buy-back basket for FY2010; for FY2011-maturity: $25.0MM aggregate
for stock buy-backs subject to pro-forma incurrence test of 3.0x leverage ratio
and minimum $15MM Revolver availability No acquisitions in FY2010, thereafter acquisitions governed by CapEx test Closing Condition At least $42.5MM in net proceeds in the Private Placement and the Rights Offering Key Terms of Credit Agreement Amendment Leverage LIBOR Margin (bps) Base Rate Margin (bps) Commitment Fee (bps) >= 4.00x 500 375 50 >=3.50x<4.00x 425 300 50 >=3.00x<3.55x 375 250 37.5 <3.00x 325 200 37.5 Leverage LIBOR Margin (bps) Base Rate Margin (bps) Commitment Fee (bps) >= 4.00x 425 300 50 >=3.25x<4.00x 350 225 50 >=2.50x<3.25x 300 175 37.5 <2.50x 250 125 37.5 Q1 Q2 Q3 Q4 2008 3.75x 2009 4.75x 4.80x 4.80x 4.50x 2010 4.25x 3.85x 3.50x 3.50x 3.5x thereafter through maturity 35 |
 Appendix B EBITDA Reconciliation 36 |
 Ruth's
Hospitality Group EBITDA Reconciliation FY 2008 Q3 2008 YTD Q3 2009 YTD Q3 2009 LTM Net income (loss) ($53.9) $6.8 $5.1 ($55.5) Interest expense 10.3 6.9 6.1 9.5 Provisions for taxes (27.5) 2.4 1.2 (28.7) Depreciation expense 17.0 12.5 12.4 16.9 Non-cash write-offs or impairment of restaurant assets 88.5 0.1 1.9 90.2 Ongoing non-cash GAAP costs (stock-based compensation, bank fees and other)
3.7 3.2 2.6 3.1 Adjusted EBITDA $38.2 $31.9 $29.2 $35.4 Severance payments, hurricane and relocation costs and other 3.0 0.9 0.1 2.1 Cash write-offs of the Manhattan UN Facility 1.1 0.1 0.1 1.1 Mitchell's Fish Market pro forma EBITDA prior to acquisition 1.9 1.9 0.0 0.0 Bank EBITDA (1) $44.2 $34.9 $29.4 $38.7 Ruth's Hospitality Group EBITDA Reconciliation (1) Calculated pursuant to the terms of the Company’s existing credit agreement.
($ in millions) 37 |
 Ruth's Hospitality Group EBITDA Reconciliation Adjusted EBITDA is a supplemental measure of the Company's performance that is not
required by, or presented in accordance with, generally accepted accounting
principles (“GAAP”). Adjusted EBITDA is not a measurement of the Company's financial performance under GAAP and should not be considered as an
alternative to revenue, net income (loss) or any other performance measures
derived in accordance with GAAP or as an alternative to cash flow from operating activities as a measure of its liquidity. Adjusted EBITDA is defined as net
income (loss), plus interest expense net of interest income, income tax
provision (benefit), depreciation and amortization, and adjusted for non-cash write-offs or impairment of restaurant asset charges, stock based compensation and non-cash
bank fees. Management believes that the inclusion of supplementary
adjustments to EBITDA applied in presenting Adjusted EBITDA is appropriate to provide additional information to investors about one of the principal internal
measures of performance used by them. Management uses the Adjusted EBITDA
measure to evaluate the Company's performance and to facilitate a comparison of operating performance on a consistent basis from period to period. The Adjusted
EBITDA measure has limitations as an analytical tool, and should not be
considered in isolation, or as a substitute for analysis of the results as reported under GAAP. This measure may not be comparable to similarly titled measures reported by other
companies. Adjusted EBITDA per the Company's credit agreement, which we
refer to as Bank EBITDA, is a supplemental measure of the Company's
performance that is not required by, or presented in accordance with, GAAP. Bank EBITDA is not a measurement of the Company's financial performance under GAAP and should not be
considered as an alternative to revenue, net income (loss) or any other
performance measures derived in accordance with GAAP or as an alternative to cash flow from operating activities as a measure of its liquidity. Bank EBITDA is
defined as Adjusted EBITDA, further adjusted for severance payments,
hurricane and relocation costs and other costs, cash write-offs of the Company's Manhattan UN Facility and Mitchell's Fish Market pro forma EBITDA prior to acquisition.
Bank EBITDA is used by the Company's creditors in assessing debt covenant
compliance and management believes its inclusion is appropriate to provide
additional information to investors about certain covenants required pursuant to the Company's indebtedness. The Bank EBITDA measure has limitations as an analytical tool, and should not be
considered in isolation, or as a substitute for analysis of the results as
reported under GAAP. This measure may not be comparable to similarly titled measures reported by other companies. 38 |
 Appendix C FCF Reconciliation 39 |
 Ruth's Hospitality Group FCF Reconciliation ($ in millions) Source: Per Company filings. 40 Ruth's Hospitality Group FCF Reconciliation FY 2008 Q3 2008 YTD Q3 2009 YTD Q3 2009 LTM Cash flows from operating activities: Net income ($53.9) $6.8 $5.1 ($55.5) Depreciation and amortization 17.0 12.5 12.4 16.9 Deferred income taxes (29.5) (0.9) (0.2) (28.8) Non- cash interest expense 0.3 0.2 0.9 1.0 Loss on sale or disposition of assets 0.5 0.1 1.0 1.4 Loss on impairment 81.3 0.0 0.3 81.6 Amortization of below market lease 0.2 0.0 0.1 0.3 Restructuring 8.9 0.0 0.4 9.3 Non- cash compensation expense 2.6 2.5 1.6 1.7 Changes in operating assets and liabilities: Accounts receivables (1.5) (2.5) 5.2 6.2 Inventories 1.1 0.9 1.8 2.0 Prepaid expenses and other (0.6) (0.7) 0.3 0.4 Other assets 0.3 0.2 0.1 0.1 Accounts payable and accrued expenses 3.3 9.0 (4.3) (10.0) Deferred revenue 1.7 (7.7) (8.6) 0.8 Deferred rent 4.8 4.9 0.4 0.3 Other liabilities 0.7 (0.0) (1.4) (0.6) Net cash provided from operating activities $37.1 $25.2 $15.3 $27.2 Acquisition of property and equipment 32.0 28.9 3.3 6.4 Free Cash Flow $5.1 ($3.7) $12.0 $20.8 |
