Attached files
| file | filename |
|---|---|
| 8-K - FORM 8-K - PIONEER ENERGY SERVICES CORP | d8k.htm |
 Pritchard Capital Partners, LLC January 6, 2010 (NYSE AMEX: PDC) www.pioneerdrlg.com Exhibit 99.1 |
 2 Forward-looking Statements This presentation contains various forward-looking statements and information that are
based on management’s current expectations and assumptions about future
events. Forward-looking statements are generally accompanied by words such as
“estimate,” “project,” “predict,” “expect,” “anticipate,” “plan,” “intend,” “seek,” “will,” “should,” “goal,” and other words that convey the uncertainty of future events and outcomes.
Forward-looking information includes , among other matters, statements
regarding the Company’s anticipated growth, quality of assets, rig utilization rate, capital spending by oil and gas companies, production rates, the Company's
growth strategy, and the Company's international operations. Although the Company believes that the expectations and assumptions reflected in such forward-looking statements are reasonable, it can give no assurance that such expectations and assumptions will prove to have been correct. Such statements are subject to certain risks, uncertainties and assumptions, including, among others: general and regional economic conditions and industry
trends; the continued strength of the contract land drilling industry in the geographic areas where the Company operates; decisions about onshore exploration and development projects to be made by oil and gas
companies; the highly competitive nature of the contract land drilling business;
the Company’s future financial performance, including availability,
terms and deployment of capital; the continued availability of qualified personnel; changes in governmental regulations, including those relating to the environment; the political, economic
and other uncertainties encountered in the Company's international operations and
other risks, contingencies and uncertainties, most of which are difficult to
predict and many of which are beyond our control. Should one or more of these
risks, contingencies or uncertainties materialize, or should underlying assumptions prove incorrect, actual results may vary materially from those expected. Many of these factors have been
discussed in more detail in the Company's annual report on Form 10-K for the fiscal year ended December 31, 2008 and quarterly reports on Form 10Q for the quarters ended March 31, 2009, June 30, 2009 and September 30, 2009. Unpredictable or unknown factors that the Company has not discussed in this presentation or in its filings with the
Securities and Exchange Commission could also have material adverse effects on
actual results of matters that are the subject of the forward- looking
statements. All forward-looking statements speak only as the date on which they are made and the Company undertakes no duty to update or revise any forward-looking statements. We advise
our shareholders to use caution and common sense when considering our forward
looking statements. |
 3 Pioneer Overview Ticker Symbol NYSE AMEX US: PDC Market Cap (12/31/09) $427 million Stock Price (12/31/09) $7.90 Average 3 month daily trading volume approximately 576,000 shares Public float approximately 54 million shares Employees 1,600 Headquarters San Antonio, Texas |
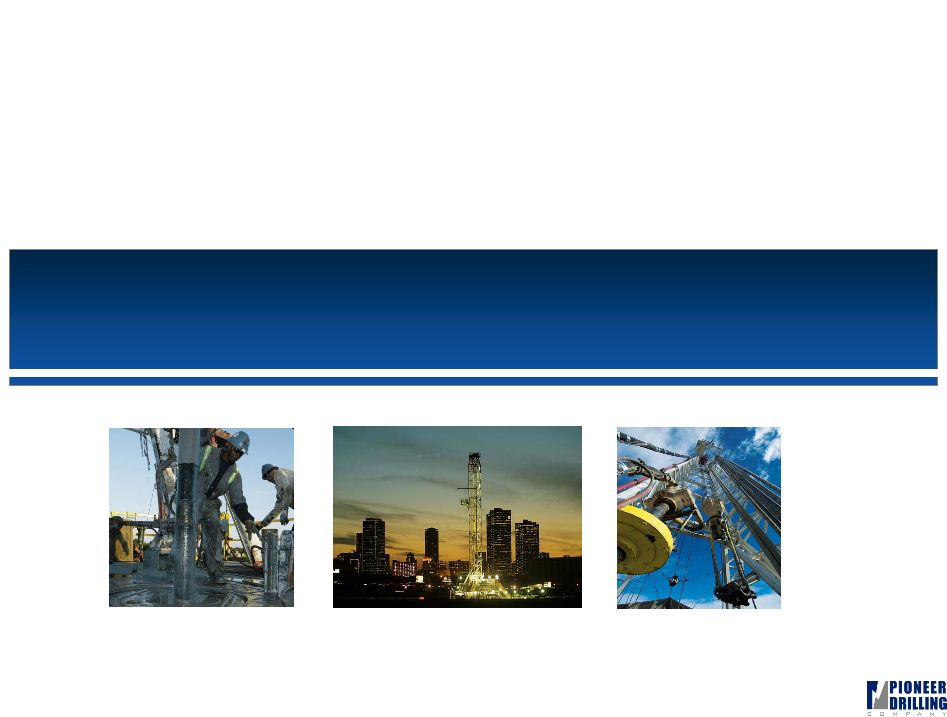
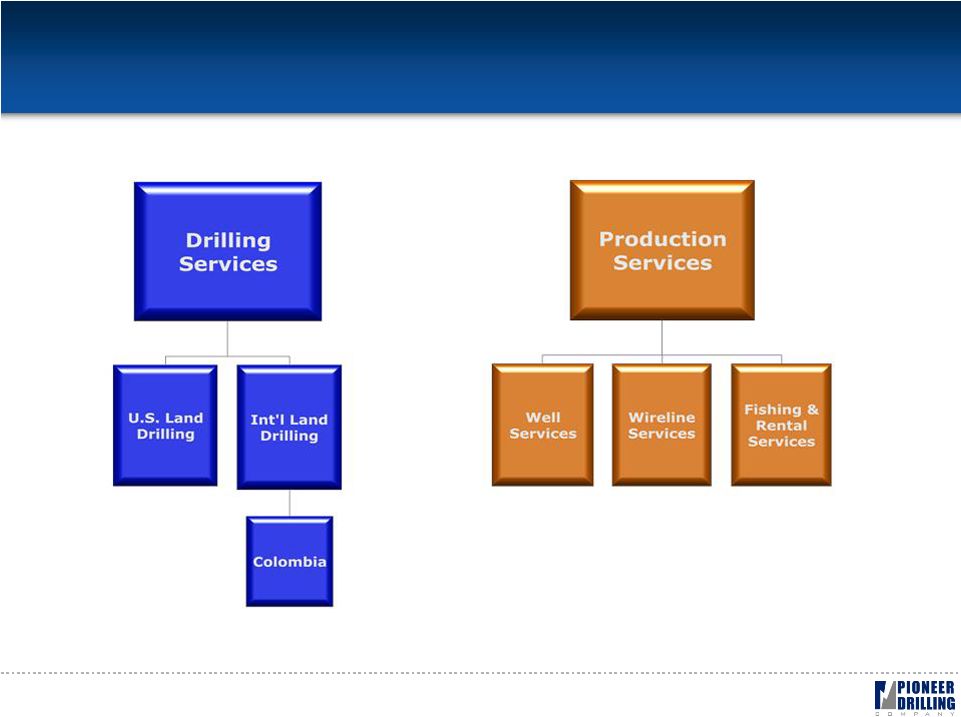 Diversified Energy Services Provider 4 |
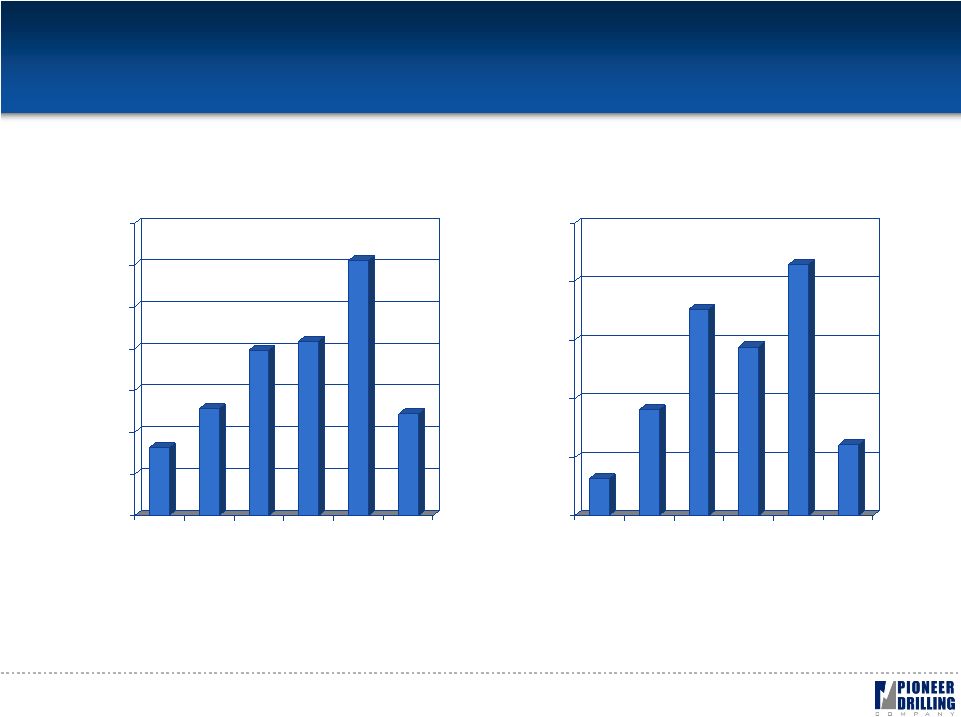
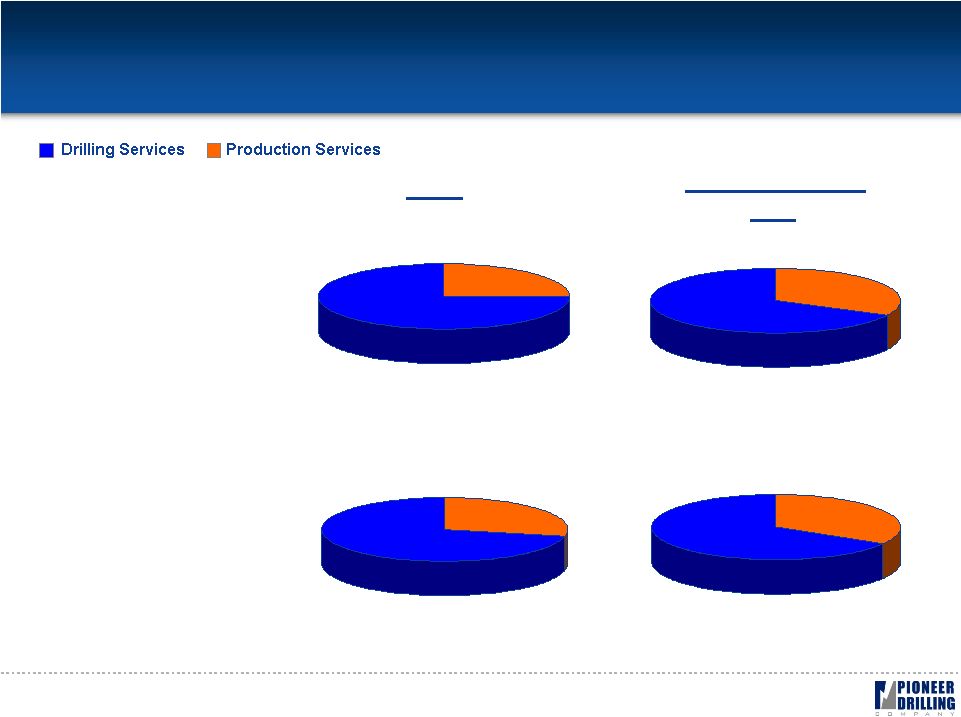 5 Contribution by Segment 2008 (2) $457 75% $154 25% September 2009 YTD $165 68% $79 32% $187 72% $74 28% $57 66% $29 34% Revenue ($millions) Gross Margin (1) ($millions) (1) See page 27 for gross margin reconciliation. (2) Production Services’ results for
2008 relate to only 10 months of activity beginning March 1, 2008. |
 Geographic Overview • Drilling Services • 71 high-quality drilling rigs capable of drilling 6,000- 25,000 feet • Production Services • 74 workover rigs, 65 wireline units, $15 million of fishing & rental tools 6 Colombia |
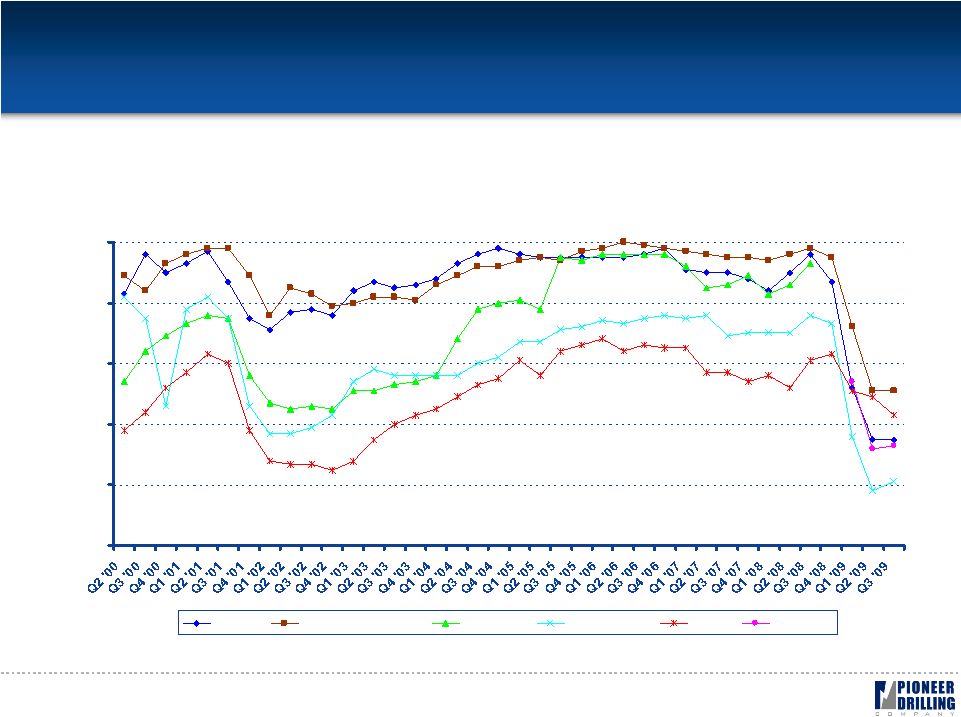
  (1) Source: Tudor, Pickering, Holt & Co (“TPH Weekly
Roundup”) (2) Source: Energy Information Administration Unconventional Rig Count (1) Onshore Drilling: Signs of Recovery • Rig Count has increased 31% (1) since it bottomed in June 2009 evidenced by improvement in commodity prices (2) • The Unconventional Rig Count has increased 25% since June 2009 fueled by the Appalachia region, Williston Basin and East Texas/North Louisiana region Historical BHI U.S. Rig Count (1) 1 Historical U.S. Commodity Prices (2) & Avg. Rig Count (1) 7 Natural Gas Oil Total U.S. Land Avg. $Price/MMBtu $Price/Bbl Rig Count 06/30/09 $3.35 $69.16 933 07/31/09 $3.33 $69.26 961 08/31/09 $3.05 $72.72 1,033 09/30/09 $2.84 $65.91 1,069 10/31/09 $3.50 $77.04 1,115 11/30/09 $3.54 $75.95 1,202 12/15/09 $5.70 $70.62 1,221 % Increase since June '09 31% 12/11/09 06/26/09 % Increase Q3 2008 Peak Barnett Shale 75 66 14% 181 Piceance Basin 22 26 -15% 100 Williston Basin 78 50 56% 95 Greater Green Rive 31 27 15% 78 Woodford Shale 27 24 13% 65 Fayetteville Shale 39 45 -13% 53 Uinta Basin 16 14 14% 55 East TX / N. LA 210 157 34% 308 Appalachia 123 89 38% 132 Totals 621 498 25% 1,067 |
 8 Steady Financial Growth $0 $100 $200 $300 $400 $500 $600 $700 2004 2005 2006 2007 2008 YTD Q3 2009 Revenue (1) 2004 - 2009 (1) Fiscal year end was changed from March 31 to December 31 effective on December 31, 2007;
all data points reflect calendar year information derived from 10K and 10Q
filings. (2) See page 26 for EBITDA reconciliation. $0 $50 $100 $150 $200 $250 2004 2005 2006 2007 2008 YTD Q3 2009 EBITDA (1)(2) 2004 - 2009 |
 9 Recent Developments • Upgrading an additional 1500 HP rig for the Bakken shale • 4th rig contracted for the Marcellus shale • Commitment letter signed to send 6 , 7 , and 8 rigs (1500HP) to Colombia to work under three year term contracts • Opened well servicing yard in Laurel, Mississippi and in the Eagle Ford shale • 2 newbuild offshore skid units added to the wireline fleet th th th |
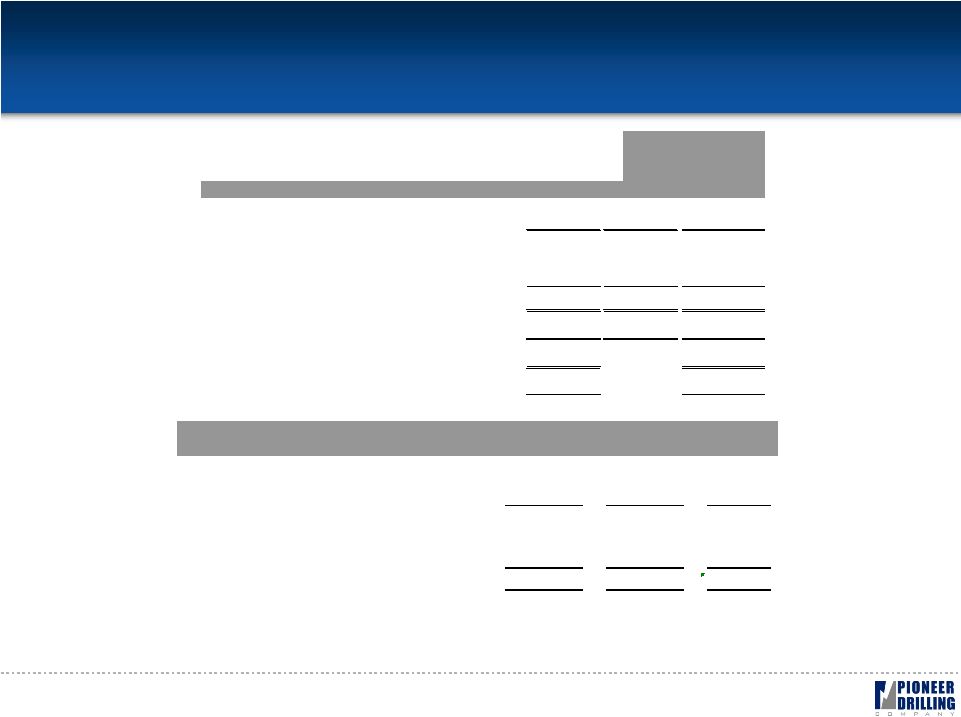  10 Capitalization Capital Expenditures Actuals FY 2008 Actuals 3Q YTD 2009 Budget FY 2009 Routine 22.6 $ 12.8 $ 23.9 $ Discretionary 125.5 32.4 80.1 Subtotals 148.1 45.2 103.9 FY 2008 Budget carryover to be incurred in FY 2009 - 19.3 19.3 Totals 148.1 $ 64.5 $ 123.2 $ ($Millions) Capitalization Actual Adj. Pro Forma (1) ($Millions) Cash and Cash Equivalents 53.3 $ 23.7 $ 77.0 $ Debt: Senior secured $325 million credit facility 257.5 $ - $ 257.5 $ Subordinated notes payable and other 4.9 - 4.9 Total debt 262.4 $ - $ 262.4 $ Total shareholders' equity 403.8 $ 23.7 $ 427.5 $ Total capitalization 666.2 $ 689.9 $ Debt to total capitalization ratio 39% 38% At September 30, 2009 (1): Adjusted to reflect net proceeds of approximately $24MM related to common
stock offering on November 11, 2009 (3.8MM shares). Proceeds are before
a 15% over-allotment option. |
 11 Drilling Services Division |
 12 Efficient, Safe, High-Quality Assets EFFICIENCY • Modern, well-maintained drilling fleet • 31 newbuilds (44%) since 2001 with majority constructed from 2004 through 2006 • 42% of fleet is electric • 21 top drives, 6 are integrated into the mast (30% of fleet) • Over 65% have tier 1, 2, or 3 engines • Over 75% have rounded bottom mud tanks • Over 90% with matched horsepower mud pumps • Over 50% with mobile or fast-pace subs • 69% of fleet is 1000HP – 2000HP SAFETY • Consistently beat the IADC average for
recordable incidents • Over 65% improvement in recordable incidents since 2005 • Iron roughnecks installed on 66% of actively marketed U.S. drilling rigs to improve safety and efficiency • Earned a score of 100% from Ecopetrol for HSEQ audit in July & November 2009 • We believe this was the first time such a score has been earned by a service provider from Ecopetrol |
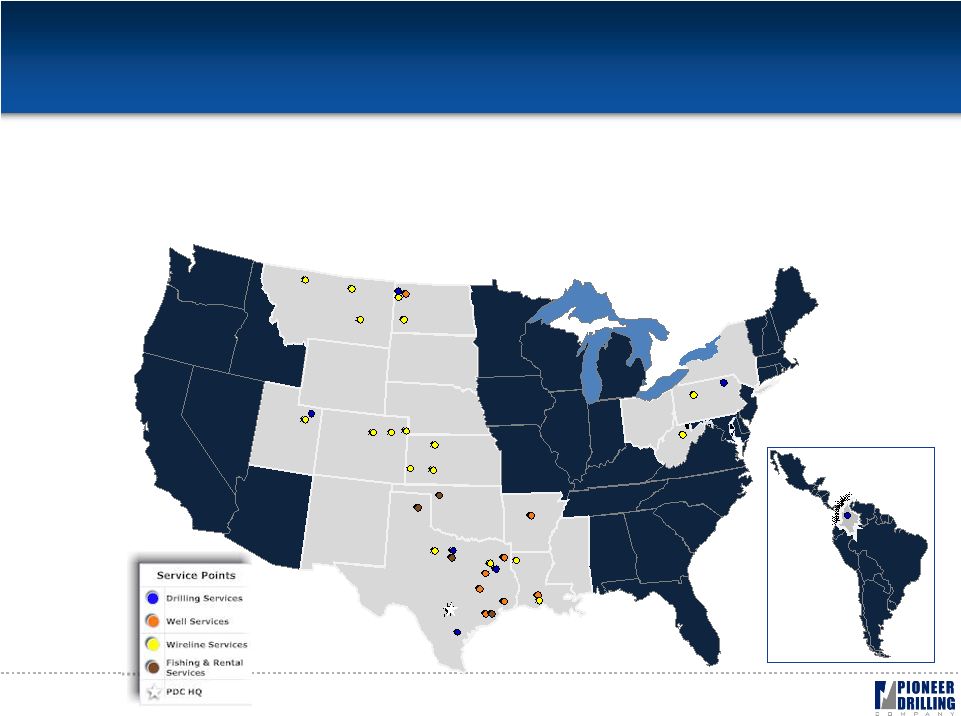
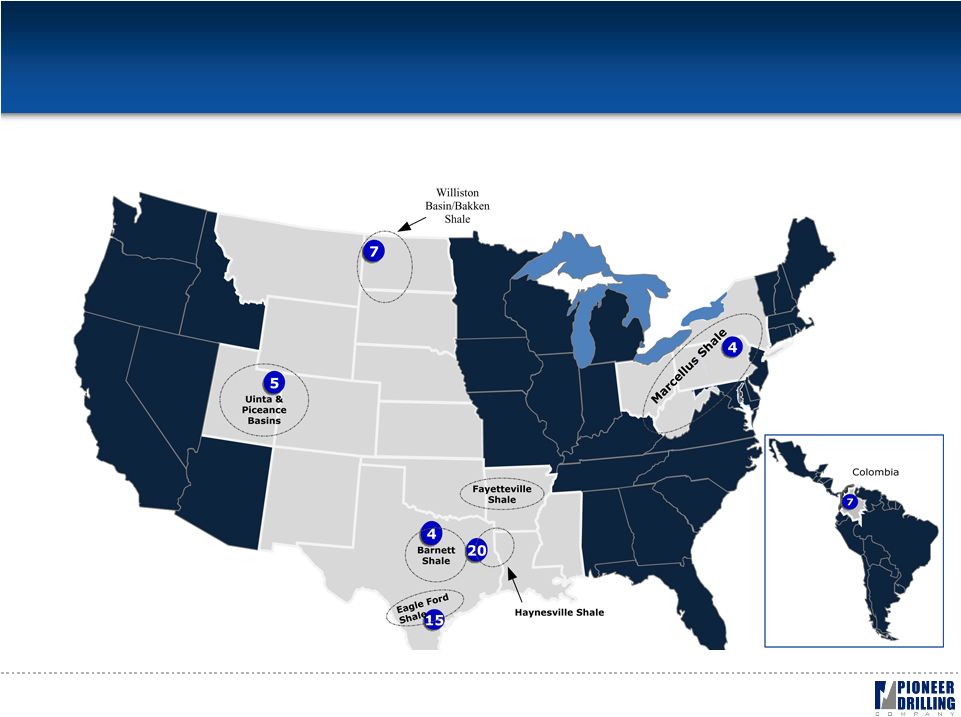 Well-Positioned in Active Plays • Our service points are within close proximity to active drilling areas 13 Note: Not included on the map are 6 cold-stacked rigs in Oklahoma, 1 rig being prepared for
Colombia, 1 rig being prepared for the Bakken shale, and 1 rig being prepared for the
Marcellus shale as of January 2010. |
 Shale Plays Require Diverse Fleet 14 1000HP Marcellus 1500HP Eagle Ford (Down-dip) 1000HP Eagle Ford (Up-dip) 1000HP Barnett 1000HP Woodford 1500HP Haynesville 750HP Fayetteville 1500HP Bakken Ideal HP Requirement Shale Play |
 Market for Modern Conventional Rigs • 84% (1) of land wells drilled in 2008 were vertical holes • Top drives not required • Average well drilled in U.S. <10,000 ft • Majority of holes in next several years will be vertical • Top drives not practical on 100% of fleet 15 (1) Source: Spears & Associates, Inc. |
 16 Strong Utilization Through the Cycles • Averaged 88% utilization through cycles since beginning of 2001 0% 20% 40% 60% 80% 100% Pioneer Helmerich & Payne Grey Wolf Patterson-UTI Nabors Precision Source: Helmerich & Payne, Grey Wolf, Patterson-UTI, & Precision Drilling data consists of
U.S. domestic utilization rates derived from Form 10-K, Form 10-Q reports, & press releases. Nabors utilization rates for worldwide land fleet obtained from public documents and industry analysts. Precision Drilling acquired Grey Wolf
in December 2008. Pioneer Drilling utilization rates include Colombian operations beginning Q3 2007. |
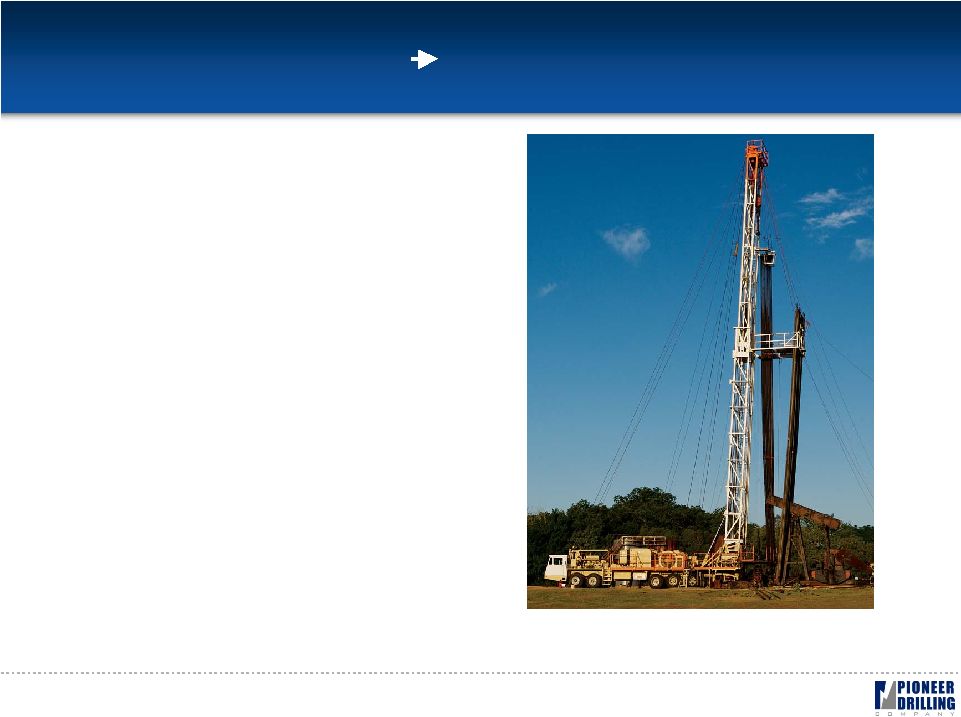
 17 International Expansion • Colombia • Stable government • Pro-U.S., Pro-Energy • Strong E&P spending • Oil • Pursuing expansion into other parts of Latin America Pioneer Rig 301, National 110UE, diesel-electric, 1,500-HP rig operating outside the city of Neiva, Colombia. |
 18 Production Services Division |
 Pure Play Land Driller Diversified Services Provider • Best in class businesses • Newest, premium workover rig fleet (550HP class) • Custom-designed wireline units/proprietary tools • Leadership position • Leading edge gross margins • Highest workover utilization • Highest hourly workover rate 19 Pioneer workover rig, a new National 5C, 550 HP working outside the city of Bryan, Texas. |
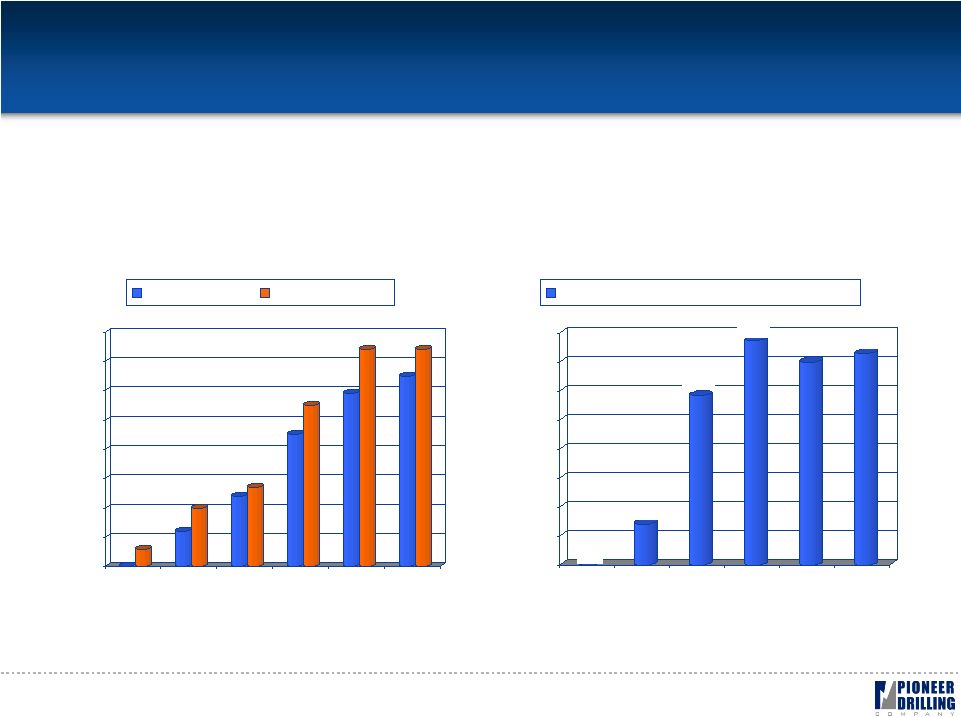 20 Consistent Growth Fishing & Rental Services Gross Equipment and Tools Value Wireline Units And Workover Rigs $0.0 $2.8 $11.7 $15.5 $14.0 $14.6 $0.0 $2.0 $4.0 $6.0 $8.0 $10.0 $12.0 $14.0 $16.0 2004 2005 2006 2007 2008 2009 Approx. Value of Equipment in Millions 0 6 12 20 24 27 45 55 59 74 65 74 0 10 20 30 40 50 60 70 80 2004 2005 2006 2007 2008 2009 Wireline Units Workover Rigs Information for the years 2004 to 2007 represents workover rig and wireline unit counts and fishing
and rental tool inventory values when the Production Services business was owned by WEDGE
group. |
 21 Supplement |
 22 Experienced Management Team • Wm. Stacy Locke - President and Chief Executive Officer Joined Pioneer as President in 1995 Seven years experience in investment banking, six years experience as exploration
geologist B.A. in Geology from the University of California Santa Barbara, MBA in Finance from Southern Methodist University • Lorne E. Phillips – Executive Vice President and Chief Financial Officer Joined Pioneer in February 2009, after ten years experience with Cameron International Corporation, most recently as Vice President and Treasurer International and multi-business unit experience, investment banking
experience B.A. from Rice University, MBA from Harvard Graduate School of
Business • F.C. “Red” West - Executive Vice President and President of Drilling Service Division 45 years experience in the drilling services industry Supervised the drilling of over 7,000 wells • Joe Eustace – Executive Vice President and President of Production Services Division Joined WEDGE in 2004 as President of WEDGE Oil and Gas Services Served as Group Vice President for Key Energy Services from 1998 – 2004 Served as VP of Operations for Dawson Production Services from 1982 until acquired by
Key Energy Services in 1998 • Carlos R. Peña – Vice President, General Counsel, Secretary and Compliance Officer Joined Pioneer in October 2008 and practicing law since 1992 Experience providing both outside corporate and securities counsel and in-house
M&A counsel B.A. from Princeton, law degree from the University of Texas
at Austin |
 23 Experienced Management Team (Cont.) Left to Right: Donald Lacombe, Senior Vice President of Drilling Services Division – Marketing and Red West, President of the Drilling Services Division. Left to Right: Joe Freeman, Vice President of Well Services, Mark Gjovig, Vice President of Wireline Services, Joe Eustace, President of the Production Services Division, Randy Watson, Vice President of Fishing and Rental Services. Drilling Services Division Production Services Division |
 Equity Offering Highlights • Issued 3.82MM shares of common stock in November 2009 to raise net proceeds of approximately $24MM • Equity proceeds earmarked to modify drilling fleet to meet customer demands 24 |
 Bank Amendment Highlights • Maturity date moved from February 2013 to August 2012 • Reduced total commitment from $400MM to $325MM • No term debt or scheduled amortization • Adequate relief from bank covenants • Senior Debt to EBITDA ratio at 5.00x for 1 half of 2010, decreasing 0.25x each quarter thereafter until reaching 3.00x in Q2 2012 • Interest coverage minimum ratio reduced from 3.0x to 2.0x for 2010 and 2011, returning to 3.0x in 2012 • Increased flexibility to position assets outside of the U.S. 25 st |
 26 Reconciliation of EBITDA to Net Income 9 Months Quarter Ended Ended 2004 2005 2006 2007 2008 Sep-09 Sep-09 EBITDA 31.7 90.3 176.6 144.5 214.8 60.9 15.2 Depreciation & Amortization (20.6) (30.8) (47.6) (63.6) (88.1) (78.5) (27.0) Net Interest (1.9) 0.8 3.6 3.3 (11.8) (5.4) (1.8) Impairment charges - - - - (171.5) - - Income Tax (Expense) Benefit (3.4) (22.1) (47.7) (27.3) (6.1) 8.1 4.4 Net Income (Loss) 5.7 38.1 84.8 56.9 (62.7) (14.8) (9.2) ($Millions) Calendar Year |
 27 Reconciliation of Gross Margin to Net Income Drilling Services Production Services Total Drilling Services Production Services Total Drilling Services Production Services Total Revenues $456.9 $154.0 $610.9 $165.2 $79.2 $244.3 $48.1 $26.3 $74.4 Operating Expenses 269.8 80.1 349.9 107.9 50.3 158.1 35.3 16.6 52.0 Gross Margin $187.0 $73.9 $260.9 $57.3 $28.9 $86.2 $12.8 $9.6 $22.4 Margin % 41% 48% 43% 35% 37% 35% 27% 37% 30% Depreciation & amortization $88.1 $78.5 $27.0 SG&A 44.8 27.9 8.9 Bad debt expense 0.4 (1.7) (1.4) Impairment of goodwill 118.6 - - Impairment of intangible assets 52.8 - - Total operating costs and expenses 654.8 262.8 86.4 (Loss) income from operations ($44.0) ($18.4) ($12.0) Other (expense) income: Interest expense ($13.1) ($5.6) ($1.8) Interest income 1.3 0.2 0.0 Other (0.9) 0.8 0.2 Total other expense (12.7) (4.5) (1.6) Income (loss) before income taxes ($56.7) ($23.0) ($13.6) Income tax benefit (expense) (6.1) 8.1 4.4 Net earnings (loss) ($62.7) ($14.8) ($9.2) Fiscal Year Ended 12/31/2008 9 Months Ended, September 30, 2009 Quarter Ended, September 30, 2009 ($millions) |
 28 |