Attached files
| file | filename |
|---|---|
| 8-K - 8-K - HOME BANCORP, INC. | hbcp-20210908.htm |

Raymond James U. S. Bank Conference September 8-9, 2021
Certain comments in this presentation contain certain forward looking statements (as defined in the Securities Exchange Act of 1934 and the regulations thereunder). Forward looking statements are not historical facts but instead represent only the beliefs, expectations or opinions of Home Bancorp, Inc. and its management regarding future events, many of which, by their nature, are inherently uncertain. Forward looking statements may be identified by the use of such words as: “believe”, “expect”, “anticipate”, “intend”, “plan”, “estimate”, or words of similar meaning, or future or conditional terms such as “will”, “would”, “should”, “could”, “may”, “likely”, “probably”, or “possibly.” Forward looking statements include, but are not limited to, financial projections and estimates and their underlying assumptions; statements regarding plans, objectives and expectations with respect to future operations, products and services; and statements regarding future performance. Such statements are subject to certain risks, uncertainties and assumption, many of which are difficult to predict and generally are beyond the control of Home Bancorp, Inc. and its management, that could cause actual results to differ materially from those expressed in, or implied or projected by, forward looking statements. The following factors, among others, could cause actual results to differ materially from the anticipated results or other expectations expressed in the forward looking statements: (1) economic and competitive conditions which could affect the volume of loan originations, deposit flows and real estate values; (2) the levels of noninterest income and expense and the amount of loan losses; (3) competitive pressure among depository institutions increasing significantly; (4) changes in the interest rate environment causing reduced interest margins; (5) general economic conditions, either nationally or in the markets in which Home Bancorp, Inc. is or will be doing business, being less favorable than expected; (6) political and social unrest, including acts of war or terrorism; (7) we may not fully realize all the benefits we anticipated in connection with our acquisitions of other institutions or our assumptions made in connection therewith may prove to be inaccurate; or (8) legislation or changes in regulatory requirements adversely affecting the business of Home Bancorp, Inc. Home Bancorp, Inc. undertakes no obligation to update these forward looking statements to reflect events or circumstances that occur after the date on which such statements were made. The COVID-19 pandemic has caused significant economic dislocation in the United States as many state and local governments have ordered non-essential businesses to close and residents to shelter in place at home. Given its ongoing and dynamic nature, it is difficult to predict the full impact of COVID-19 on our business. The extent of such impact will depend on future developments, which are highly uncertain, including when the coronavirus can be controlled and abated and when and how the national and local economies may be reopened. As a result of the COVID-19 pandemic and the related adverse local and national economic consequences, our forward-looking statements are subject to the following additional risks, uncertainties and assumptions, among others: • Demand for our products and services may decline; • If high levels of unemployment continue, our loan delinquencies, non-performing assets and loan foreclosures may increase; • Collateral for loans, especially real estate, may decline in value; • Our allowance for loan losses may have to be increased if our borrowers continue to experience financial difficulties; • As a result of the reduction in the Federal Reserve Board's target federal funds rate to near 0%, the yield on our interest-earning assets may decline more than the decline in the cost of our interest-bearing liabilities; • A material decrease in our net income or a net loss over several quarters could result in a suspension of our stock repurchase program and/or a reduction of our quarterly stock dividend; • Our cyber security risks may be increased as a result of more of our employees working remotely; and • FDIC deposit insurance premiums may increase if the agency experiences additional resolution costs. As used in this report, unless the context otherwise requires, the terms “we,” “our,” “us,” or the “Company” refer to Home Bancorp, Inc. and the term the “Bank” refers to Home Bank, N.A., a national bank and wholly owned subsidiary of the Company. In addition, unless the context otherwise requires, references to the operations of the Company include the operations of the Bank. For a more detailed description of the factors that may affect Home Bancorp’s operating results or the outcomes described in these forward-looking statements, we refer you to our filings with the Securities and Exchange Commission, including our annual report on Form 10-K for the year ended December 31, 2020. Home Bancorp assumes no obligation to update the forward-looking statements made during this presentation. For more information, please visit our website www.home24bank.com. Non-GAAP Information This presentation contains financial information determined by methods other than in accordance with generally accepted accounting principles (“GAAP”). The Company's management uses this non-GAAP financial information in its analysis of the Company's performance. In this presentation, information is included which excludes acquired loans, intangible assets, impact of the gain (loss) on the sale of a banking center, the impact of merger-related expenses and one-time tax effects. Management believes the presentation of this non-GAAP financial information provides useful information that is helpful to a full understanding of the Company’s financial position and core operating results. This non-GAAP financial information should not be viewed as a substitute for financial information determined in accordance with GAAP, nor are they necessarily comparable to non-GAAP financial information presented by other companies. Forward Looking Statements | 2

Our Company Headquarters: Lafayette, LA Ticker: HBCP (NASDAQ Global) History: • Founded in 1908 • IPO completed October 2008 • Five acquisitions completed since 2010 • 40 locations across south LA and western MS Highlights: • Total Assets: $2.8 billion at June 30, 2021 • Market Cap: $324 million at September 1, 2021 • Ownership (S&P Global as of September 1, 2021) • Institutional: 40% • Insider/ESOP: 13% | 3
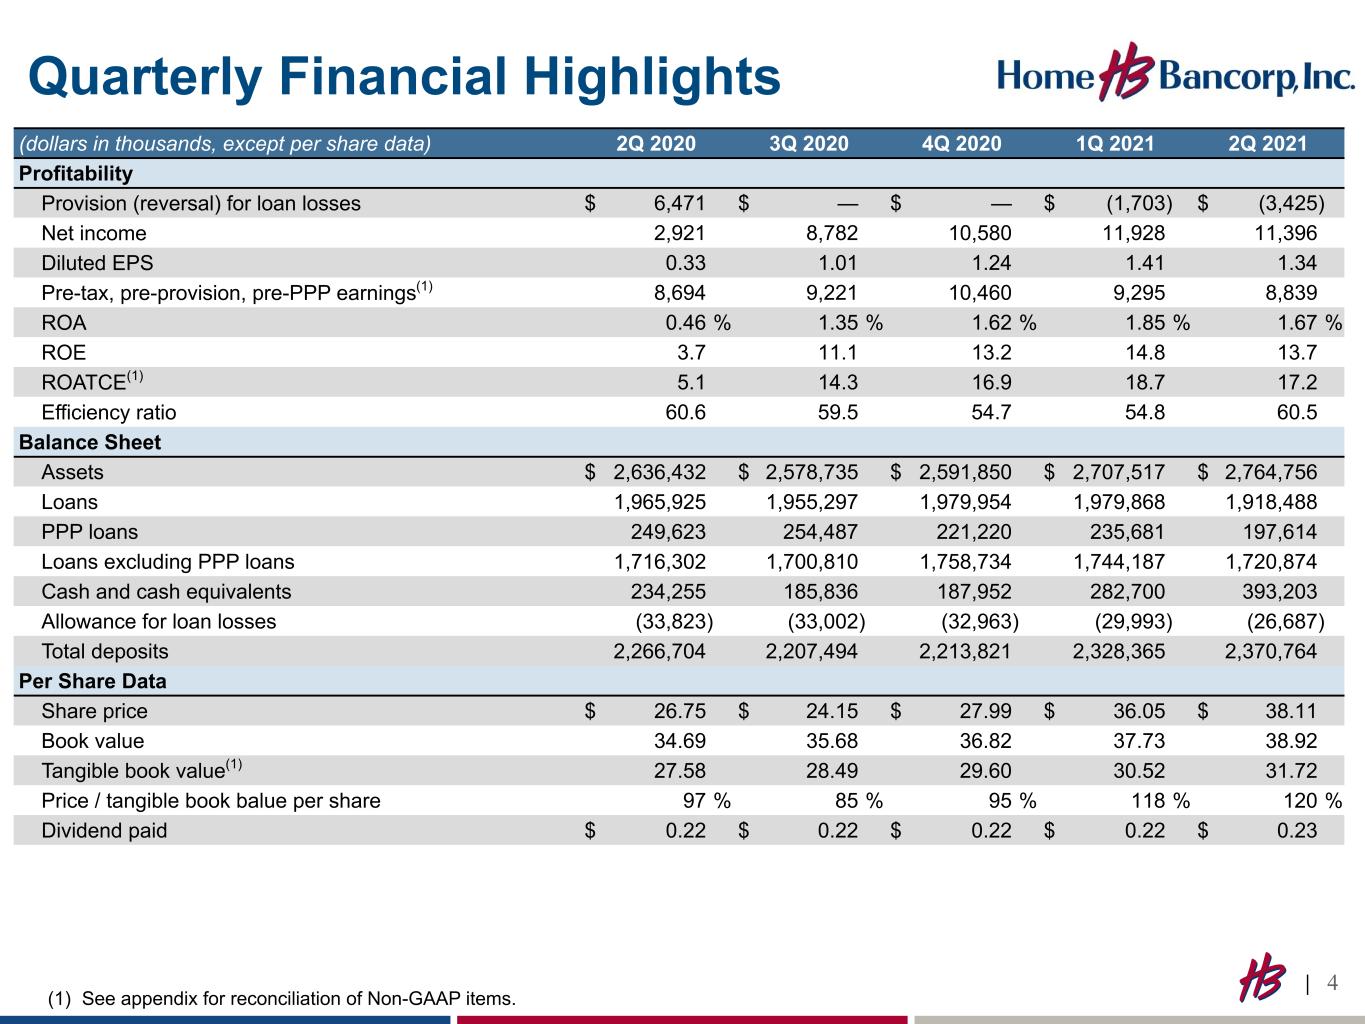
Quarterly Financial Highlights (dollars in thousands, except per share data) 2Q 2020 3Q 2020 4Q 2020 1Q 2021 2Q 2021 Profitability Provision (reversal) for loan losses $ 6,471 $ — $ — $ (1,703) $ (3,425) Net income 2,921 8,782 10,580 11,928 11,396 Diluted EPS 0.33 1.01 1.24 1.41 1.34 Pre-tax, pre-provision, pre-PPP earnings(1) 8,694 9,221 10,460 9,295 8,839 ROA 0.46 % 1.35 % 1.62 % 1.85 % 1.67 % ROE 3.7 11.1 13.2 14.8 13.7 ROATCE(1) 5.1 14.3 16.9 18.7 17.2 Efficiency ratio 60.6 59.5 54.7 54.8 60.5 Balance Sheet Assets $ 2,636,432 $ 2,578,735 $ 2,591,850 $ 2,707,517 $ 2,764,756 Loans 1,965,925 1,955,297 1,979,954 1,979,868 1,918,488 PPP loans 249,623 254,487 221,220 235,681 197,614 Loans excluding PPP loans 1,716,302 1,700,810 1,758,734 1,744,187 1,720,874 Cash and cash equivalents 234,255 185,836 187,952 282,700 393,203 Allowance for loan losses (33,823) (33,002) (32,963) (29,993) (26,687) Total deposits 2,266,704 2,207,494 2,213,821 2,328,365 2,370,764 Per Share Data Share price $ 26.75 $ 24.15 $ 27.99 $ 36.05 $ 38.11 Book value 34.69 35.68 36.82 37.73 38.92 Tangible book value(1) 27.58 28.49 29.60 30.52 31.72 Price / tangible book balue per share 97 % 85 % 95 % 118 % 120 % Dividend paid $ 0.22 $ 0.22 $ 0.22 $ 0.22 $ 0.23 | 4 (1) See appendix for reconciliation of Non-GAAP items.

H om e B an k To ta l A ss et s ($ in m ill io ns ) 2008 2009 2010 2011 2012 2013 2014 2015 2016 2017 2018 2019 2020 Jun-21 YTD 500 1,000 1,500 2,000 2,500 3,000 Asset Growth Acquired Bank Date Assets ($ in MM) (at completion) % of TBV (at announcement) # of Branches Consideration Statewide Bank March 2010 $199 FDIC-assisted 6 All Cash Guaranty Savings Bank July 2011 $257 95% 5 All Cash Britton & Koontz Bank February 2014 $301 90% 8 All Cash Bank of New Orleans September 2015 $346 126% 4 All Cash St. Martin Bank & Trust December 2017 $597 183% 12 ~80% Stock, 20% Cash(1) (1) Cash was comprised of an aggregate $19.5 million special cash distribution paid by St. Martin Bancshares to its shareholders. Statewide Bank Guaranty Savings Bank Britton & Koontz Bank Bank of New Orleans St. Martin Bank & Trust CAGR = 14.2% as of June 30, 2021 | 5

($ in millions) $9.2 $7.3 $9.9 $12.6 $16.0 $16.8 $31.6 $27.9 $24.8 $23.3 Q1 Q2 Q3 Q4 2012 2013 2014 2015 2016 2017 2018 2019 2020 2021 $0 $5 $10 $15 $20 $25 $30 $35 Net Income test $1.28 $1.06 $1.42 $1.79 $2.25 $2.28 $3.40 $3.05 $2.85 $2.75 Q1 Q2 Q3 Q4 2012 2013 2014 2015 2016 2017 2018 2019 2020 2021 $0.00 $0.50 $1.00 $1.50 $2.00 $2.50 $3.00 $3.50 $4.00 Diluted EPS Earnings | 6
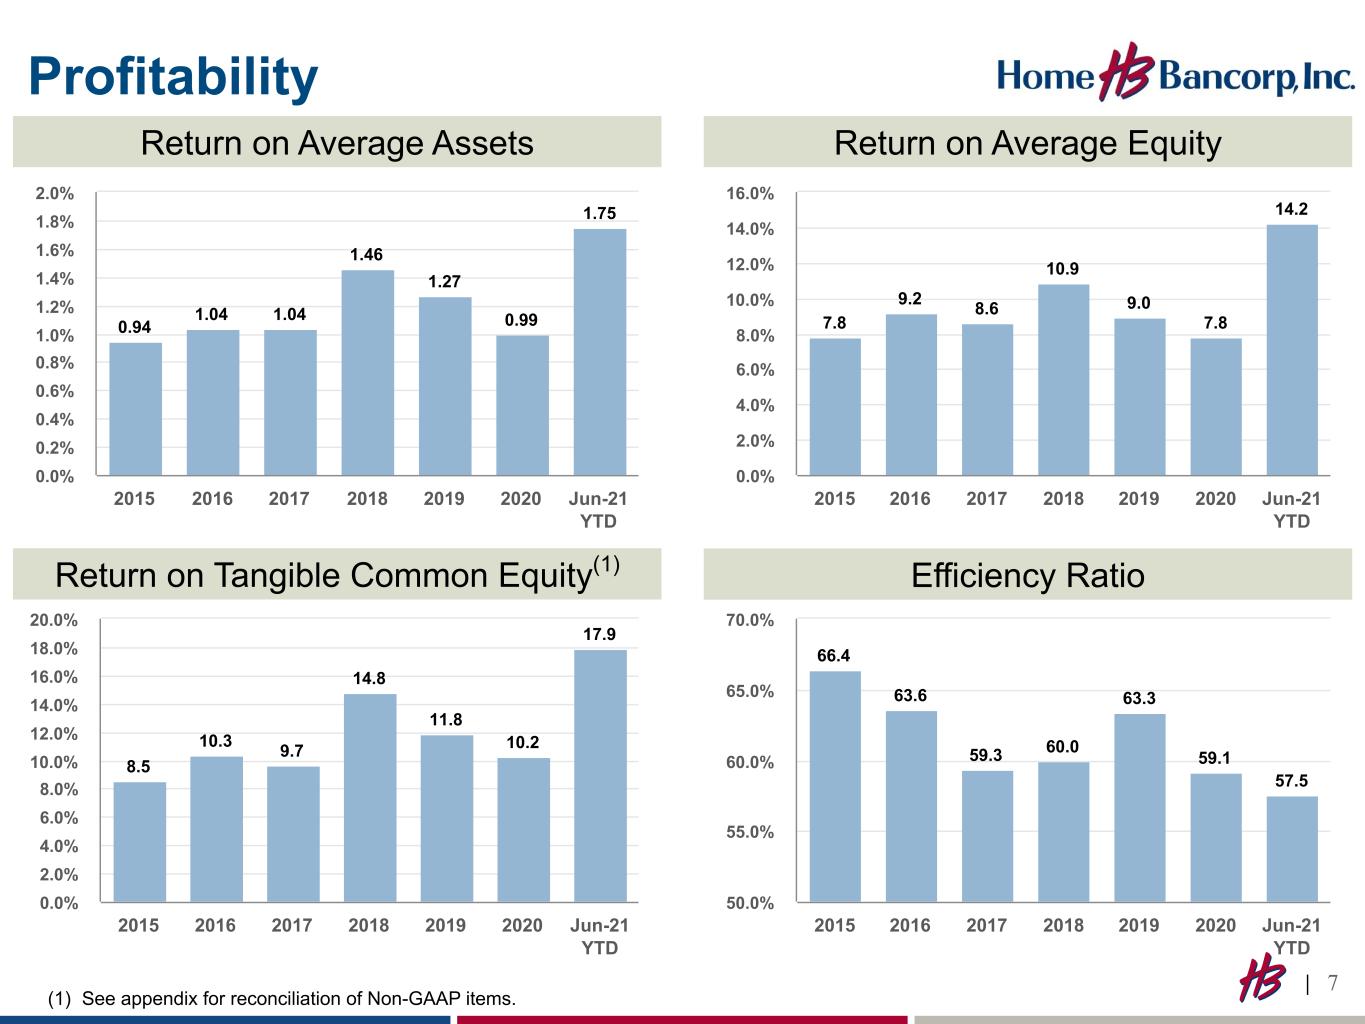
Profitability 0.94 1.04 1.04 1.46 1.27 0.99 1.75 2015 2016 2017 2018 2019 2020 Jun-21 YTD 0.0% 0.2% 0.4% 0.6% 0.8% 1.0% 1.2% 1.4% 1.6% 1.8% 2.0% Return on Average Assets 7.8 9.2 8.6 10.9 9.0 7.8 14.2 2015 2016 2017 2018 2019 2020 Jun-21 YTD 0.0% 2.0% 4.0% 6.0% 8.0% 10.0% 12.0% 14.0% 16.0% Return on Average Equity 8.5 10.3 9.7 14.8 11.8 10.2 17.9 2015 2016 2017 2018 2019 2020 Jun-21 YTD 0.0% 2.0% 4.0% 6.0% 8.0% 10.0% 12.0% 14.0% 16.0% 18.0% 20.0% Return on Tangible Common Equity(1) 66.4 63.6 59.3 60.0 63.3 59.1 57.5 2015 2016 2017 2018 2019 2020 Jun-21 YTD 50.0% 55.0% 60.0% 65.0% 70.0% Efficiency Ratio | 7 (1) See appendix for reconciliation of Non-GAAP items.

Lo an B al an ce O ut st an di ng ($ in m ill io ns ) Originated Acquired PPP Loans Originated growth % (annualized & excluding PPP) 2008 2009 2010 2011 2012 2013 2014 2015 2016 2017 2018 2019 2020 Jun-21 YTD — 250 500 750 1,000 1,250 1,500 1,750 2,000 2,250 Organic Loan Growth (excludes acquisition accounting & unearned income) 0% 7% 24% 13% 18% 19% 11% 12% 6% 16% 15% 12% CAGR Excluding PPP Loans: Total Loan CAGR = 14% Originated Loan CAGR = 12% Net PPP loans at June 30, 2021 = $198 million with $7.7 million in remaining deferred lender fees | 8 2%

Loan Portfolio Excluding PPP Loans (as of June 30, 2021) CRE, 48% 1-4 Mortgage, 21% C&D, 14% C&I, 11% Home Equity, 4% Consumer, 2% Composition Market Diversification Acadiana, 38% New Orleans, 33% Northshore, 15% Baton Rouge, 12% Mississippi, 2% | 9
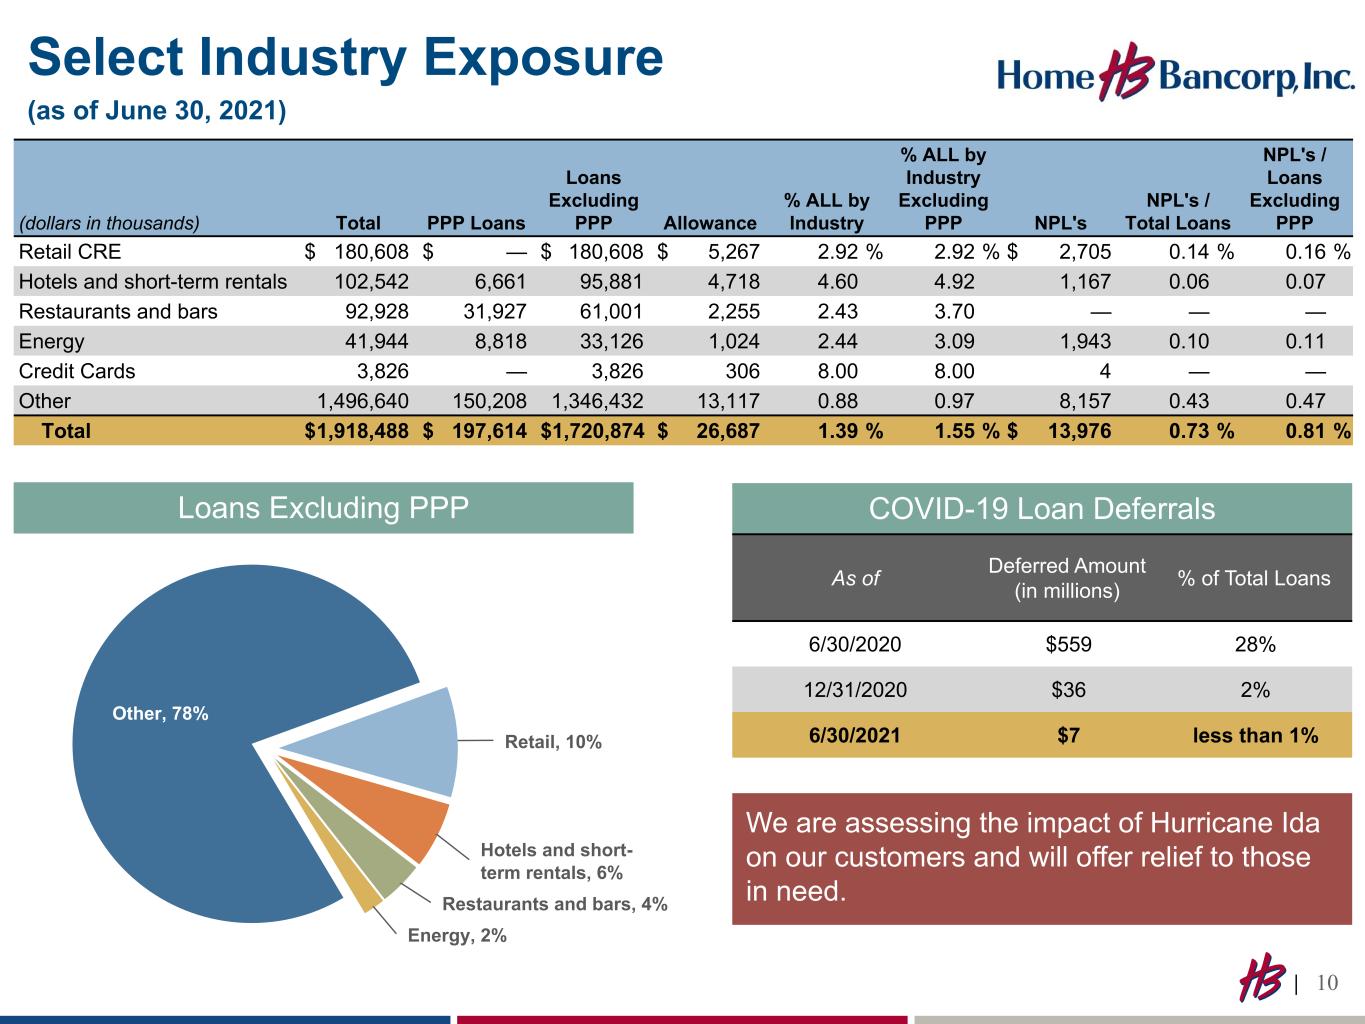
Select Industry Exposure (as of June 30, 2021) Retail, 10% Hotels and short- term rentals, 6% Restaurants and bars, 4% Energy, 2% Other, 78% Loans Excluding PPP COVID-19 Loan Deferrals As of Deferred Amount (in millions) % of Total Loans 6/30/2020 $559 28% 12/31/2020 $36 2% 6/30/2021 $7 less than 1% (dollars in thousands) Total PPP Loans Loans Excluding PPP Allowance % ALL by Industry % ALL by Industry Excluding PPP NPL's NPL's / Total Loans NPL's / Loans Excluding PPP Retail CRE $ 180,608 $ — $ 180,608 $ 5,267 2.92 % 2.92 % $ 2,705 0.14 % 0.16 % Hotels and short-term rentals 102,542 6,661 95,881 4,718 4.60 4.92 1,167 0.06 0.07 Restaurants and bars 92,928 31,927 61,001 2,255 2.43 3.70 — — — Energy 41,944 8,818 33,126 1,024 2.44 3.09 1,943 0.10 0.11 Credit Cards 3,826 — 3,826 306 8.00 8.00 4 — — Other 1,496,640 150,208 1,346,432 13,117 0.88 0.97 8,157 0.43 0.47 Total $ 1,918,488 $ 197,614 $ 1,720,874 $ 26,687 1.39 % 1.55 % $ 13,976 0.73 % 0.81 % | 10 We are assessing the impact of Hurricane Ida on our customers and will offer relief to those in need.
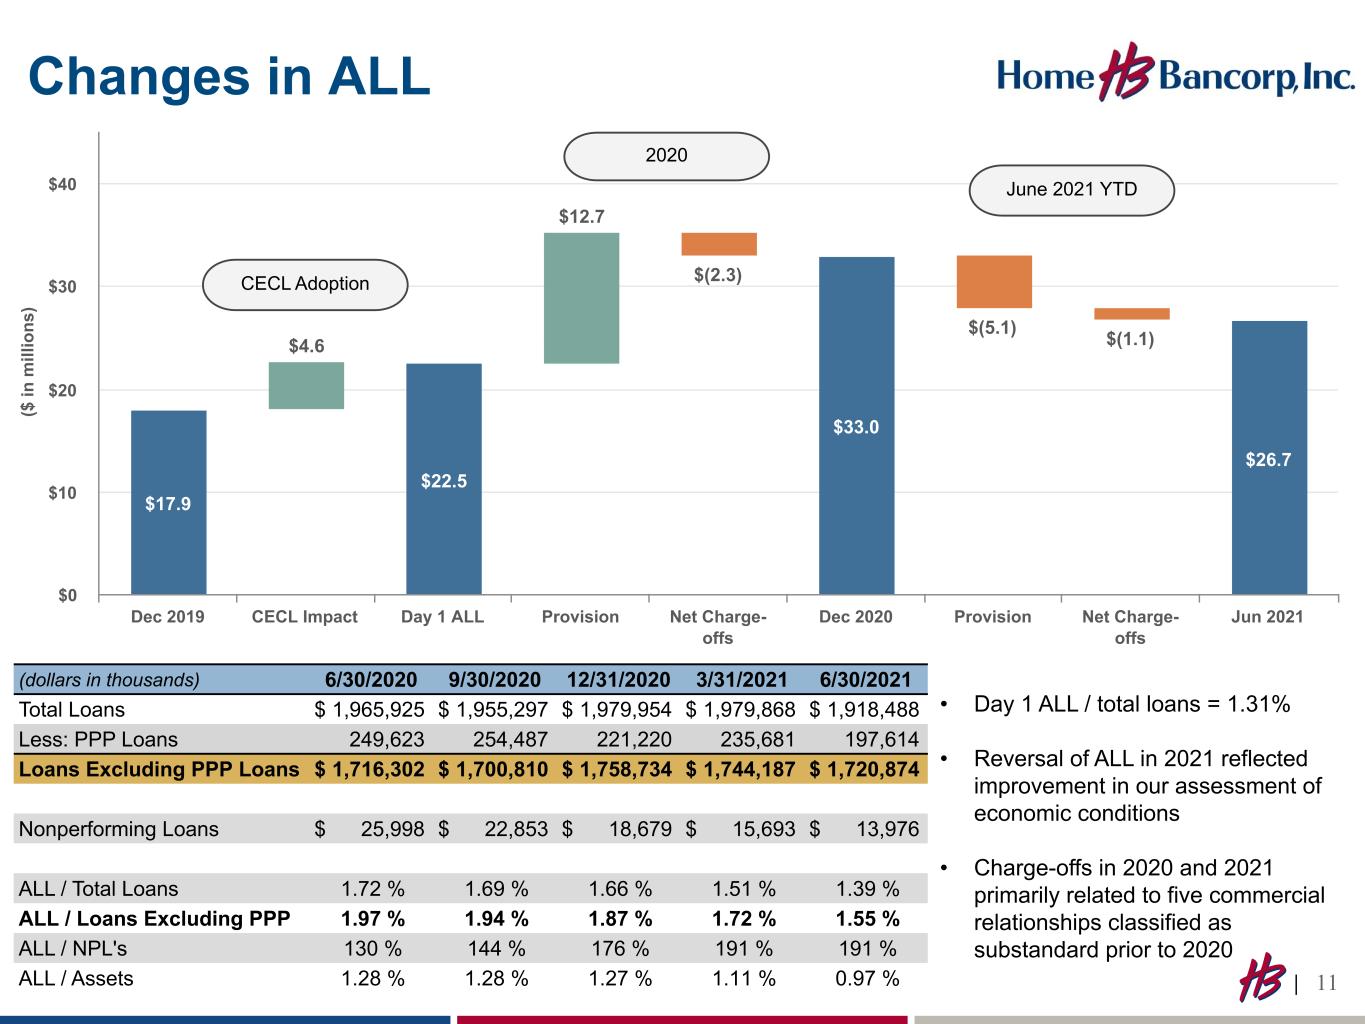
($ in m ill io ns ) $17.9 $4.6 $12.7 $(2.3) $(5.1) $(1.1) $22.5 $33.0 $26.7 Dec 2019 CECL Impact Day 1 ALL Provision Net Charge- offs Dec 2020 Provision Net Charge- offs Jun 2021 $0 $10 $20 $30 $40 • Day 1 ALL / total loans = 1.31% • Reversal of ALL in 2021 reflected improvement in our assessment of economic conditions • Charge-offs in 2020 and 2021 primarily related to five commercial relationships classified as substandard prior to 2020 Changes in ALL CECL Adoption 2020 (dollars in thousands) 6/30/2020 9/30/2020 12/31/2020 3/31/2021 6/30/2021 Total Loans $ 1,965,925 $ 1,955,297 $ 1,979,954 $ 1,979,868 $ 1,918,488 Less: PPP Loans 249,623 254,487 221,220 235,681 197,614 Loans Excluding PPP Loans $ 1,716,302 $ 1,700,810 $ 1,758,734 $ 1,744,187 $ 1,720,874 Nonperforming Loans $ 25,998 $ 22,853 $ 18,679 $ 15,693 $ 13,976 ALL / Total Loans 1.72 % 1.69 % 1.66 % 1.51 % 1.39 % ALL / Loans Excluding PPP 1.97 % 1.94 % 1.87 % 1.72 % 1.55 % ALL / NPL's 130 % 144 % 176 % 191 % 191 % ALL / Assets 1.28 % 1.28 % 1.27 % 1.11 % 0.97 % | 11 June 2021 YTD

Credit Quality Trends 0.73 1.07 1.16 1.21 1.30 0.77 0.55 0.37 0.84 1.01 0.72 0.75 0.40 0.33 NPAs / Total Assets Originated NPAs / Total Assets 2015 2016 2017 2018 2019 2020 Jun-21 YTD 0.0% 0.2% 0.4% 0.6% 0.8% 1.0% 1.2% 1.4% NPAs / Assets title 0.03 0.02 0.00 0.15 0.09 0.12 0.12 2015 2016 2017 2018 2019 2020 Jun-21 YTD 0.00% 0.05% 0.10% 0.15% 0.20% Net Charge-offs / YTD Average Loans 84.0 75.0 57.0 63.0 62.6 165.0 176.9 ALL / NPAs 2015 2016 2017 2018 2019 2020 Jun-21 YTD 0.0% 50.0% 100.0% 150.0% 200.0% ALL / NPAs 1.32 0.94 1.74 1.94 1.73 1.03 0.84 0.91 0.64 0.82 0.87 1.32 0.74 0.63 Past Due Loans / Loans Originated Past Due / Originated Loans 2015 2016 2017 2018 2019 2020 Jun-21 YTD 0.0% 1.0% 2.0% 3.0% Loans Past Due | 12
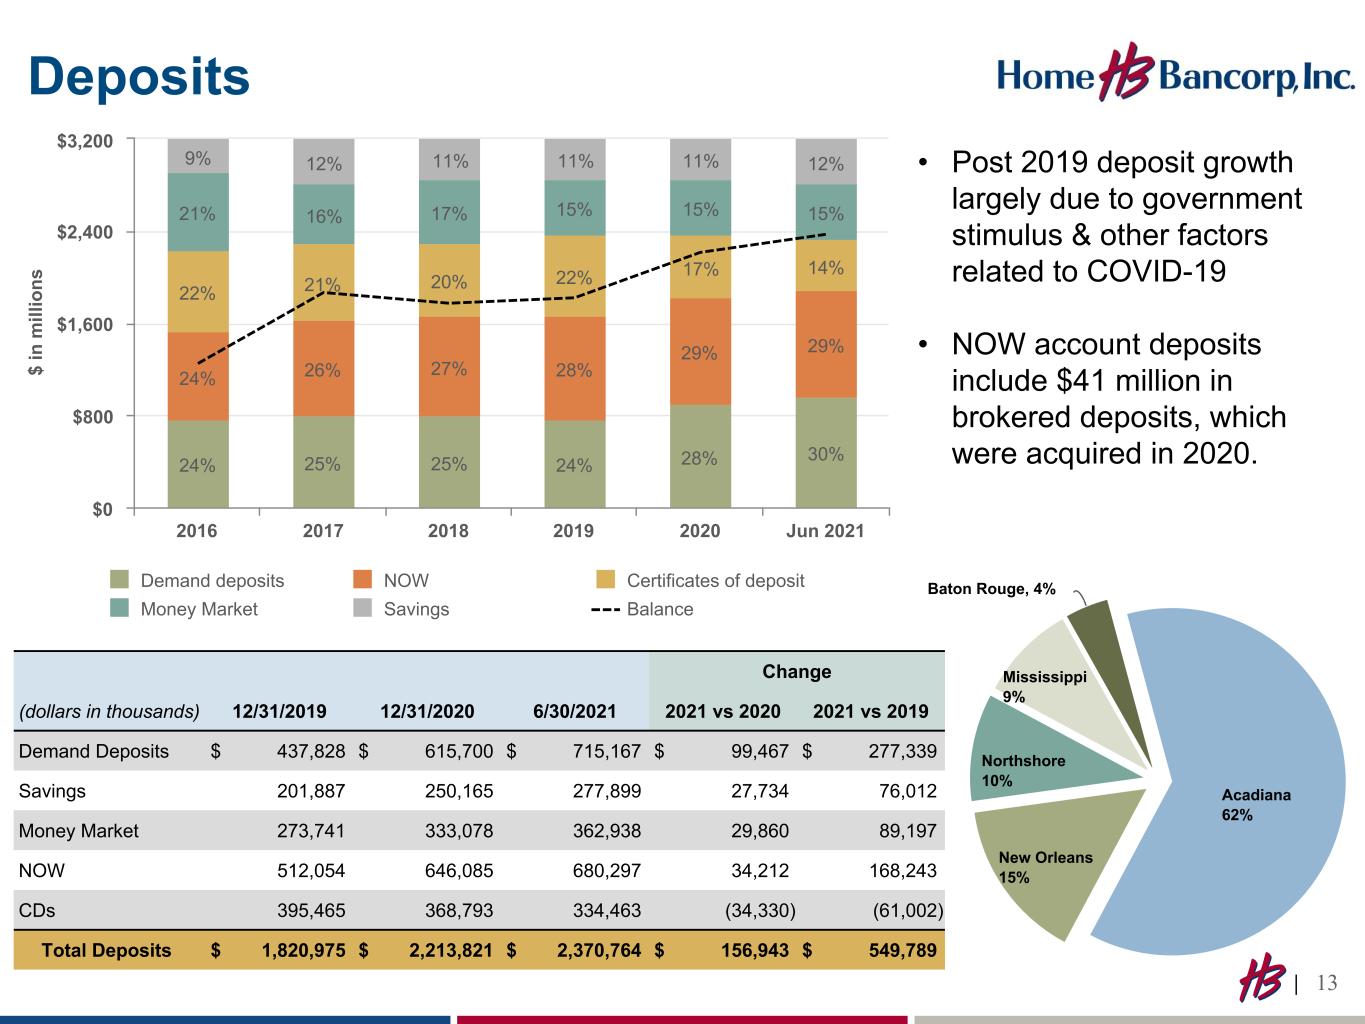
Acadiana 62% New Orleans 15% Northshore 10% Mississippi 9% Baton Rouge, 4% Deposits $ in m ill io ns 24% 25% 25% 24% 28% 30% 24% 26% 27% 28% 29% 29% 22% 21% 20% 22% 17% 14% 21% 16% 17% 15% 15% 15% 9% 12% 11% 11% 11% 12% Demand deposits NOW Certificates of deposit Money Market Savings Balance 2016 2017 2018 2019 2020 Jun 2021 $0 $800 $1,600 $2,400 $3,200 Change (dollars in thousands) 12/31/2019 12/31/2020 6/30/2021 2021 vs 2020 2021 vs 2019 Demand Deposits $ 437,828 $ 615,700 $ 715,167 $ 99,467 $ 277,339 Savings 201,887 250,165 277,899 27,734 76,012 Money Market 273,741 333,078 362,938 29,860 89,197 NOW 512,054 646,085 680,297 34,212 168,243 CDs 395,465 368,793 334,463 (34,330) (61,002) Total Deposits $ 1,820,975 $ 2,213,821 $ 2,370,764 $ 156,943 $ 549,789 • Post 2019 deposit growth largely due to government stimulus & other factors related to COVID-19 • NOW account deposits include $41 million in brokered deposits, which were acquired in 2020. | 13

Yields 4.36 4.12 4.14 4.18 3.76 3.82 4.11 4.14 3.75 3.82 3.96 4.06 3.88 3.71 NIM NIM Excl. PPP 2Q 2019 3Q 2019 4Q 2019 1Q 2020 2Q 2020 3Q 2020 4Q 2020 1Q 2021 2Q 2021 3.50% 3.75% 4.00% 4.25% 4.50% NIM (TE)(1) 5.68 5.46 5.48 5.43 5.02 4.94 5.20 5.21 4.95 5.23 5.28 5.31 5.03 5.06 Loan Yield Loan Yield Excl. PPP 2Q 2019 3Q 2019 4Q 2019 1Q 2020 2Q 2020 3Q 2020 4Q 2020 1Q 2021 2Q 2021 4.50% 5.00% 5.50% 6.00% Yield on Loans(1) 1.13 1.19 1.16 1.10 0.80 0.63 0.53 0.46 0.39 2Q 2019 3Q 2019 4Q 2019 1Q 2020 2Q 2020 3Q 2020 4Q 2020 1Q 2021 2Q 2021 0.0% 0.5% 1.0% 1.5% Cost of Interest-Bearing Liabilities • June 2021 YTD: ◦ Average PPP loans: $233.4 million ◦ PPP lender fee income: $5.0 million • As of June 30, 2021: ◦ Cash up $159 million, or 68%, YoY ◦ 74% of total loans have a fixed rate | 14 (1) See appendix for reconciliation of Non-GAAP items.

Noninterest Income & Expense 0.65 0.68 0.62 0.62 0.62 0.57 0.59 2015 2016 2017 2018 2019 2020 Jun-21 YTD 0.55% 0.60% 0.65% 0.70% Noninterest Income(1) / Assets 3.04 2.98 2.79 2.83 2.87 2.53 2.45 2015 2016 2017 2018 2019 2020 Jun-21 YTD 2.00% 2.50% 3.00% 3.50% Noninterest Expense(1) / Assets • Strong YTD income on the sale of mortgage loans • Natchez, MS branch sold and leased back in June 2021 • Sale of Vicksburg, MS location to close in January 2022 (1) Excludes noncore items. See appendix for reconciliation of non-GAAP items. (dollars in thousands) 2Q 2020 3Q 2020 4Q 2020 1Q 2021 2Q 2021 Service fees and charges $ 942 $ 1,123 $ 1,117 $ 1,072 $ 1,146 Bank card fees 1,127 1,331 1,273 1,306 1,591 Gain on sale of loans 642 904 1,082 1,168 559 Loss on sale of assets, net (13) — — — (457) Other 405 436 578 514 455 Total noninterest income $ 3,103 $ 3,794 $ 4,050 $ 4,060 $ 3,294 (dollars in thousands) 2Q 2020 3Q 2020 4Q 2020 1Q 2021 2Q 2021 Compensation $ 9,362 $ 9,740 $ 9,417 $ 9,664 $ 9,687 Data processing 1,760 1,851 1,913 1,986 2,159 Occupancy 1,653 1,686 1,719 1,696 1,733 Provision for unfunded — — — — 375 Other 2,678 2,839 2,947 2,620 2,614 Total noninterest expense $ 15,453 $ 16,116 $ 15,996 $ 15,966 $ 16,568 Noninterest expense excl. provision for unfunded $ 15,453 $ 16,116 $ 15,996 $ 15,966 $ 16,193 • Continued investment in technology, infrastructure and people to enhance customer experience. | 15

| 16 Total Return (Daily %) - 3 Years HBCP S&P US Banks Index ISTR BFST FGBI HWC Aug-18 Nov-18 Feb-19 May-19 Aug-19 Oct-19 Jan-20 Apr-20 Jul-20 Sep-20 Dec-20 Mar-21 Jun-21 Aug-21 (75)% (50)% (25)% 0% 25% 50% Total Return (Monthly %) - Since 2008 HBCP Stock Performance (as of September 1, 2021) 2008 2009 2010 2011 2012 2013 2014 2015 2016 2017 2018 2019 2020 (100)% 0% 100% 200% 300% 400% 500% | 16
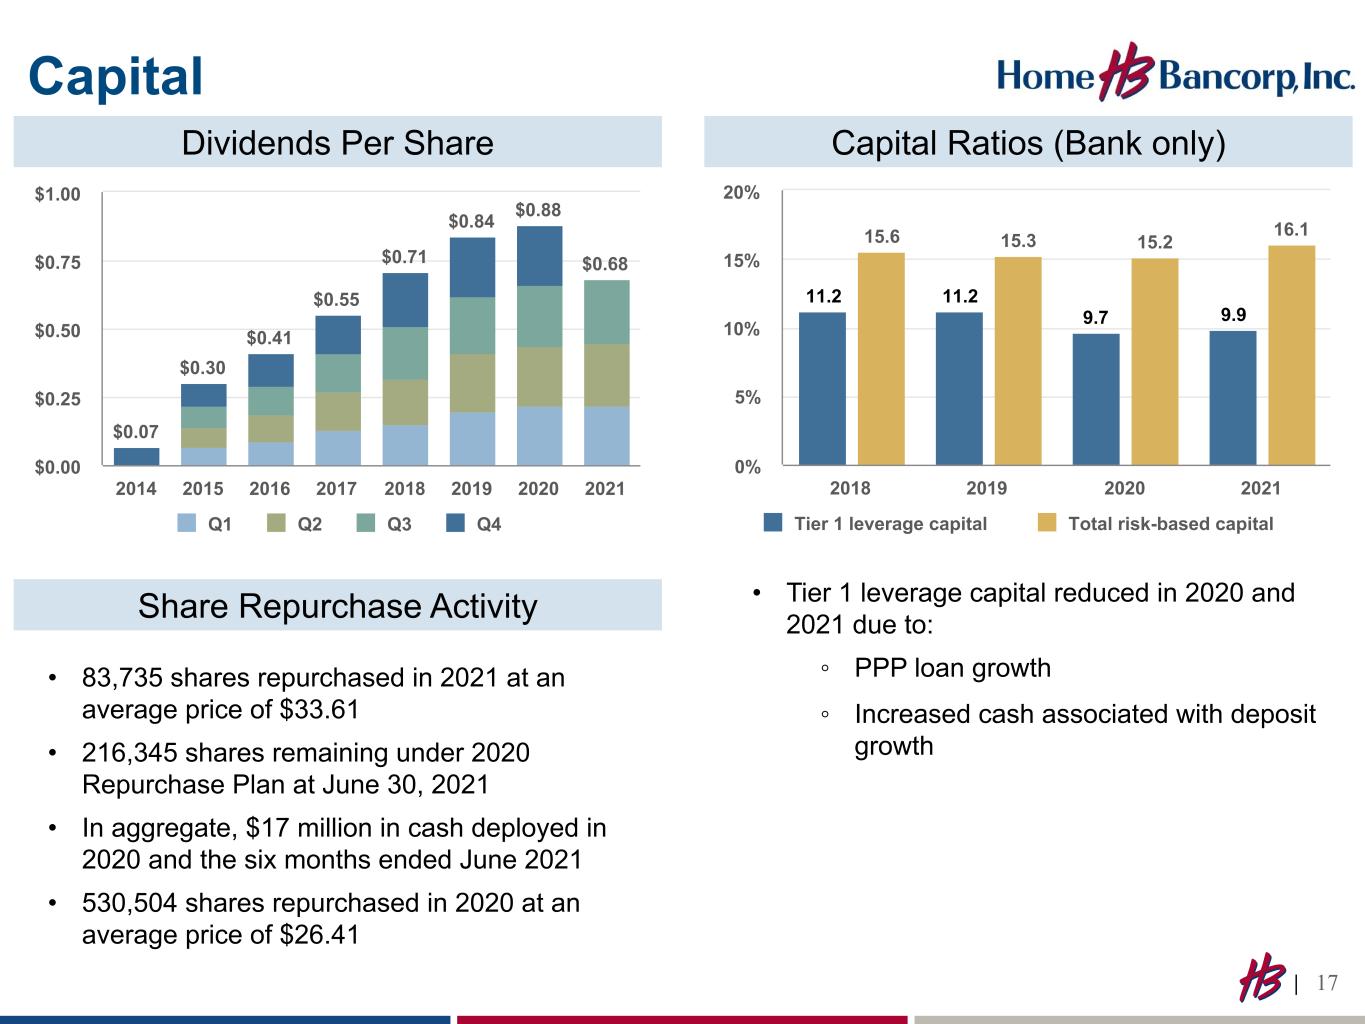
Capital $0.07 $0.30 $0.41 $0.55 $0.71 $0.84 $0.88 $0.68 Q1 Q2 Q3 Q4 2014 2015 2016 2017 2018 2019 2020 2021 $0.00 $0.25 $0.50 $0.75 $1.00 Dividends Per Share 11.2 11.2 9.7 9.9 15.6 15.3 15.2 16.1 Tier 1 leverage capital Total risk-based capital 2018 2019 2020 2021 0% 5% 10% 15% 20% Capital Ratios (Bank only) • Tier 1 leverage capital reduced in 2020 and 2021 due to: ◦ PPP loan growth ◦ Increased cash associated with deposit growth • 83,735 shares repurchased in 2021 at an average price of $33.61 • 216,345 shares remaining under 2020 Repurchase Plan at June 30, 2021 • In aggregate, $17 million in cash deployed in 2020 and the six months ended June 2021 • 530,504 shares repurchased in 2020 at an average price of $26.41 Share Repurchase Activity | 17
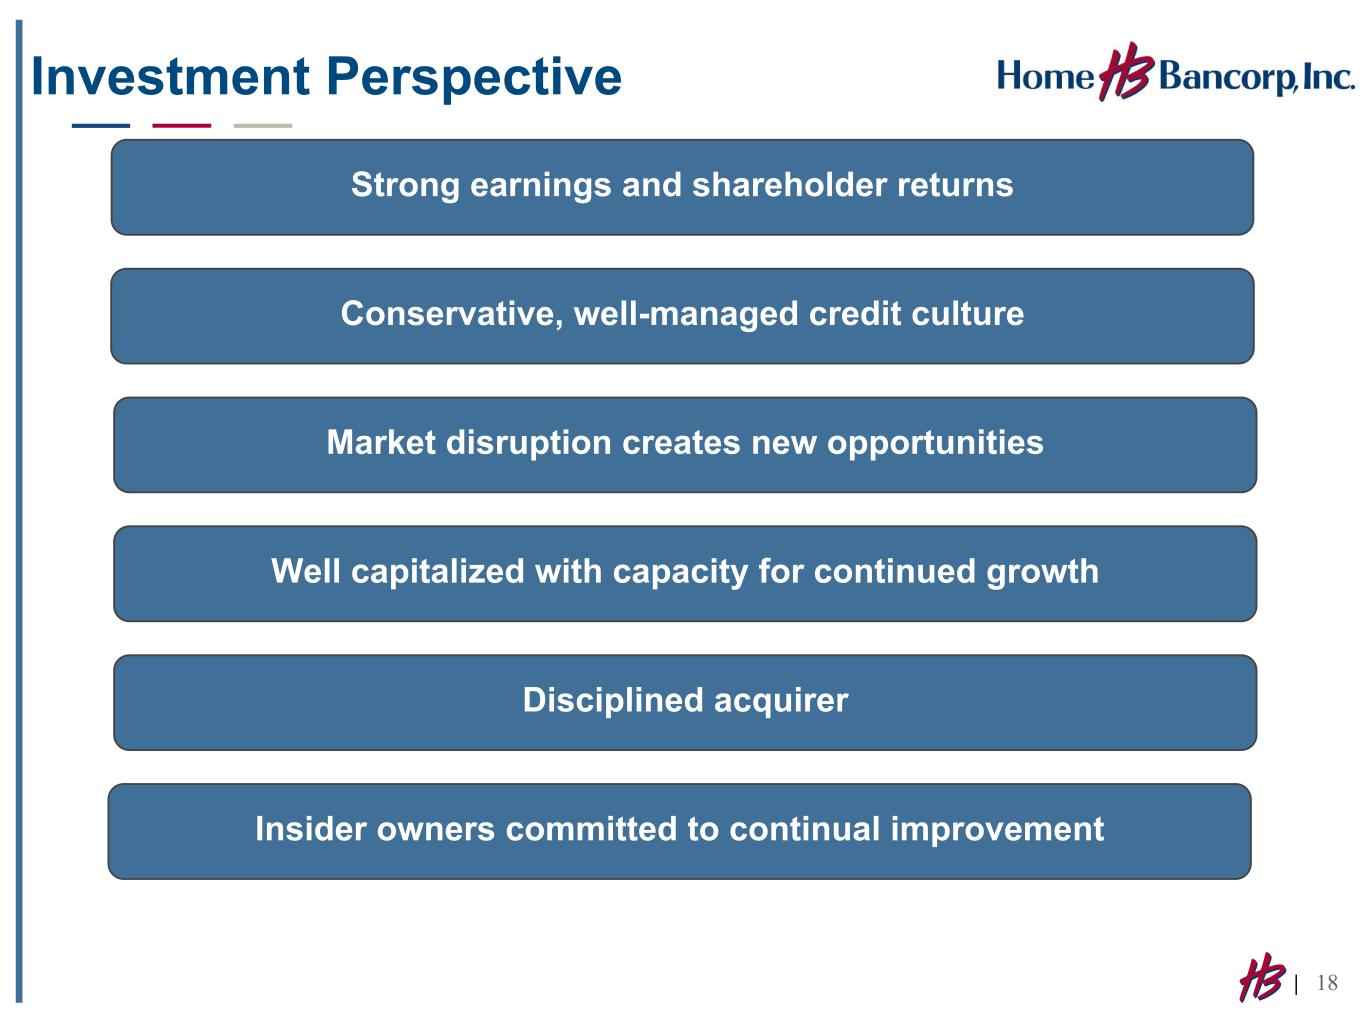
Investment Perspective Strong earnings and shareholder returns Conservative, well-managed credit culture Well capitalized with capacity for continued growth Market disruption creates new opportunities Disciplined acquirer Insider owners committed to continual improvement | 18

WE ARE ONE TEAM, CREATING EXCEPTIONAL CUSTOMER EXPERIENCES | 19
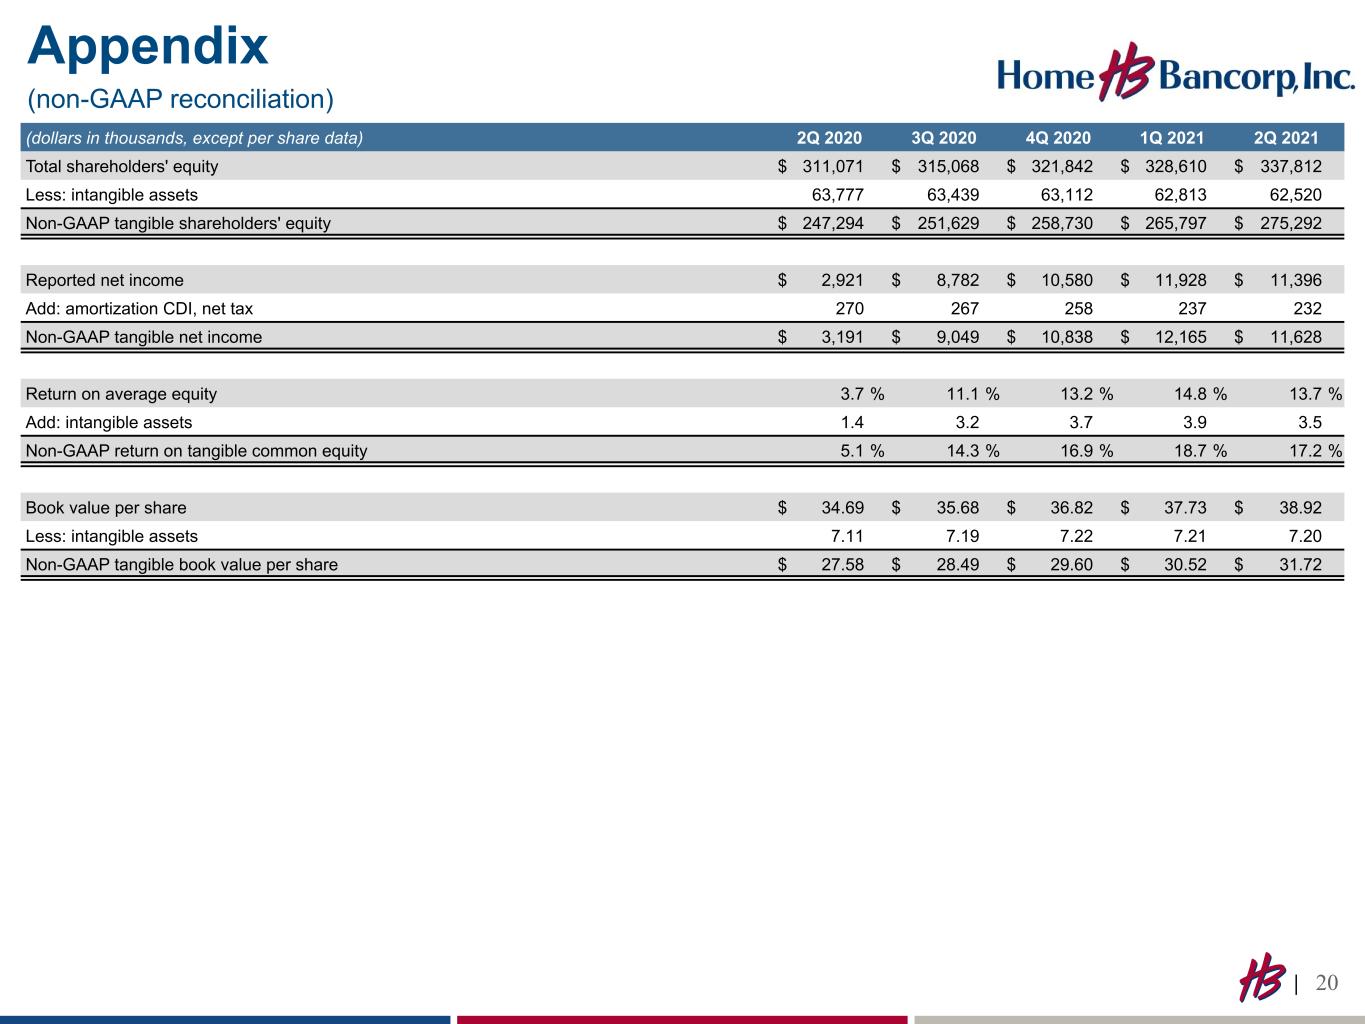
(dollars in thousands, except per share data) 2Q 2020 3Q 2020 4Q 2020 1Q 2021 2Q 2021 Total shareholders' equity $ 311,071 $ 315,068 $ 321,842 $ 328,610 $ 337,812 Less: intangible assets 63,777 63,439 63,112 62,813 62,520 Non-GAAP tangible shareholders' equity $ 247,294 $ 251,629 $ 258,730 $ 265,797 $ 275,292 Reported net income $ 2,921 $ 8,782 $ 10,580 $ 11,928 $ 11,396 Add: amortization CDI, net tax 270 267 258 237 232 Non-GAAP tangible net income $ 3,191 $ 9,049 $ 10,838 $ 12,165 $ 11,628 Return on average equity 3.7 % 11.1 % 13.2 % 14.8 % 13.7 % Add: intangible assets 1.4 3.2 3.7 3.9 3.5 Non-GAAP return on tangible common equity 5.1 % 14.3 % 16.9 % 18.7 % 17.2 % Book value per share $ 34.69 $ 35.68 $ 36.82 $ 37.73 $ 38.92 Less: intangible assets 7.11 7.19 7.22 7.21 7.20 Non-GAAP tangible book value per share $ 27.58 $ 28.49 $ 29.60 $ 30.52 $ 31.72 | 20 Appendix (non-GAAP reconciliation)

(dollars in thousands) 2Q 2020 3Q 2020 4Q 2020 1Q 2021 2Q 2021 Reported net income $ 2,921 $ 8,782 $ 10,580 $ 11,928 $ 11,396 Less: PPP loan income 1,373 1,729 2,793 3,894 2,372 Add: provision (reversal) for loan losses 6,471 — — (1,703) (3,425) Add: provision for credit losses on unfunded commitments — — — — 375 Add: income tax expense 675 2,168 2,673 2,964 2,865 Pre-tax, pre-provision, pre-PPP earnings $ 8,694 $ 9,221 $ 10,460 $ 9,295 $ 8,839 Average total loans $ 1,928,185 $ 1,971,174 $ 1,984,969 $ 1,987,264 $ 1,963,935 Less: average PPP loans 180,712 252,504 243,721 238,813 228,114 Average total loans excluding PPP loans $ 1,747,473 $ 1,718,670 $ 1,741,248 $ 1,748,451 $ 1,735,821 Loan yield 5.02 % 4.94 % 5.20 % 5.21 % 4.95 % Negative (positive) impact of PPP loans 0.21 0.34 0.11 (0.18) 0.11 Loan yield excluding PPP loans 5.23 % 5.28 % 5.31 % 5.03 % 5.06 % Net interest margin 3.76 % 3.82 % 4.11 % 4.14 % 3.75 % Negative (positive) impact of PPP loans 0.06 0.14 (0.05) (0.26) (0.04) Net interest margin excluding PPP loans 3.82 % 3.96 % 4.06 % 3.88 % 3.71 % | 21 Appendix (non-GAAP reconciliation)

Appendix (non-GAAP reconciliation) (dollars in thousands) 2015 2016 2017 2018 2019 2020 Jun-21 YTD Total shareholders' equity $ 165,046 $ 179,843 $ 277,871 $ 304,040 $ 316,329 $ 321,842 $ 337,812 Less: intangible assets 15,304 12,762 68,033 66,055 64,472 63,112 62,520 Non-GAAP tangible shareholders' equity $ 149,742 $ 167,081 $ 209,838 $ 237,985 $ 251,857 $ 258,730 $ 275,292 Reported net income $ 12,550 $ 16,008 $ 16,824 $ 31,590 $ 27,932 $ 24,765 $ 23,324 Add: amortization CDI, net tax 483 520 496 1,458 1,251 1,074 468 Non-GAAP tangible income $ 13,033 $ 16,528 $ 17,320 $ 33,048 $ 29,183 $ 25,839 $ 23,792 Return on average equity 7.8 % 9.2 % 8.6 % 10.9 % 9.0 % 7.8 % 14.2 % Add: intangible assets 0.7 1.1 1.1 3.9 2.8 2.4 3.7 Non-GAAP return on tangible common equity 8.5 % 10.3 % 9.7 % 14.8 % 11.8 % 10.2 % 17.9 % Originated loans $ 797,845 $ 884,690 $ 941,922 $ 1,095,160 $ 1,251,201 $ 1,625,139 $ 1,625,193 Acquired loans 426,521 343,143 715,873 554,594 463,160 354,815 293,295 Total loans $ 1,224,366 $ 1,227,833 $ 1,657,795 $ 1,649,754 $ 1,714,361 $ 1,979,954 $ 1,918,488 Originated NPAs $ 5,767 $ 13,012 $ 22,523 $ 15,526 $ 16,421 $ 10,353 $ 9,007 Acquired NPAs 5,616 3,634 3,238 10,444 12,121 9,628 6,082 Total NPAs $ 11,383 $ 16,646 $ 25,761 $ 25,970 $ 28,542 $ 19,981 $ 15,089 Originated past due loans $ 7,252 $ 5,653 $ 7,685 $ 9,549 $ 16,541 $ 12,070 $ 10,178 Acquired past due loans 8,953 5,912 21,120 22,493 13,098 8,335 5,881 Total past due loans $ 16,205 $ 11,565 $ 28,805 $ 32,042 $ 29,639 $ 20,405 $ 16,059 | 22

(dollars in thousands) 2015 2016 2017 2018 2019 2020 Jun-21 YTD Reported noninterest income $ 8,770 $ 11,157 $ 9,962 $ 13,447 $ 14,415 $ 14,305 $ 7,354 Less: BOLI benefit — — — — 1,194 — — Less: gain (loss) on sale of assets — 641 (69) — (347) — (457) Non-GAAP noninterest income $ 8,770 $ 10,516 $ 10,031 $ 13,447 $ 13,568 $ 14,305 $ 7,811 Reported noninterest expense $ 42,022 $ 46,797 $ 46,177 $ 63,225 $ 63,605 $ 62,981 $ 32,534 Less: lease termination — — — — 291 — — Less: severance pay — — — — 287 — — Less: merger-related expenses 1,411 856 1,086 2,010 — — — Non-GAAP noninterest expense $ 40,611 $ 45,941 $ 45,091 $ 61,215 $ 63,027 $ 62,981 $ 32,534 | 23 Appendix (non-GAAP reconciliation)
