Attached files
| file | filename |
|---|---|
| EX-32 - EX-32 - HOME BANCORP, INC. | d528421dex32.htm |
| EX-31.2 - EX-31.2 - HOME BANCORP, INC. | d528421dex312.htm |
| EX-31.1 - EX-31.1 - HOME BANCORP, INC. | d528421dex311.htm |
| EX-23.1 - EX-23.1 - HOME BANCORP, INC. | d528421dex231.htm |
| EX-10.13 - EX-10.13 - HOME BANCORP, INC. | d528421dex1013.htm |
Table of Contents
UNITED STATES
SECURITIES AND EXCHANGE COMMISSION
Washington, D.C. 20549
FORM 10-K
(Mark One)
| ☒ | Annual report pursuant to Section 13 or 15(d) of the Securities Exchange Act of 1934 |
For the fiscal year ended: December 31, 2017
or
| ☐ | Transition report pursuant to Section 13 or 15(d) of the Securities Exchange Act of 1934 |
For the transition period from to
Commission File Number: 001-34190
HOME BANCORP, INC.
(Exact name of Registrant as specified in its charter)
| Louisiana | 71-1051785 | |
| (State or Other Jurisdiction of | (I.R.S. Employer | |
| Incorporation or Organization) | Identification Number) | |
| 503 Kaliste Saloom Road, Lafayette, Louisiana | 70508 | |
| (Address of Principal Executive Offices) | (Zip Code) | |
(337) 237-1960 Registrant’s telephone number, including area code:
Securities registered pursuant to Section 12(b) of the Act:
| Title of each class |
Name of each exchange on which registered | |
| Common Stock, $0.01 par value per share | The Nasdaq Stock Market, LLC |
Securities registered pursuant to Section 12(g) of the Act: none
Indicate by check mark if the registrant is a well-known seasoned issuer, as defined in Rule 405 of the Securities Act. YES ☐ NO ☒
Indicate by check mark if the registrant is not required to file reports pursuant to Section 13 or Section 15(d) of the Act. YES ☐ NO ☒
Indicate by check mark whether the Registrant (1) has filed all reports required to be filed by Section 13 or 15(d) of the Securities Exchange Act of 1934 during the preceding 12 months and (2) has been subject to such filing requirements for the past 90 days. YES ☒ NO ☐
Indicate by check mark whether the registrant has submitted electronically and posted on its corporate Web site, if any, every Interactive Date File required to be submitted and posted pursuant to Rule 405 of Regulation S-T (§232.405 of this chapter) during the preceding 12 months (or for such shorter period that the registrant was required to submit and post such files). YES ☒ NO ☐
Indicate by check mark if disclosure of delinquent filers pursuant to Item 405 of Regulation S-K is not contained herein, and will not be contained, to the best of the Registrant’s knowledge in definitive proxy or information statements incorporated by reference in Part III of this Form 10-K or any amendment to this Form 10-K. ☐
Indicate by check mark whether the registrant is a large accelerated filer, an accelerated filer, a non-accelerated filer, or a smaller reporting company. See the definitions of “large accelerated filer,” “accelerated filer” and “smaller reporting company” in Rule 12b-2 of the Exchange Act. (Check one):
| Large accelerated filer | ☐ | Accelerated filer | ☒ | |||
| Non-accelerated filer | ☐ (Do not check if a smaller reporting company) | Smaller reporting company | ☐ | |||
| Emerging growth company | ☐ | |||||
If an emerging growth company, indicate by check mark if the registrant has elected not to use the extended transition period for complying with any new or revised financial accounting standards provided pursuant to section 13(a) or the Exchange Act. ☐
Indicate by check mark whether the registrant is a shell company (as defined in Rule 12b-2 of the Act). YES ☐ NO ☒
The aggregate market value of the 6,078,902 shares of the Registrant’s common stock held by non-affiliates, based upon the closing price of $42.52 for the common stock on June 30, 2017, as reported by the Nasdaq Stock Market, was approximately $258.5 million. Shares of common stock held by the registrant’s executive officers, directors and certain benefit plans have been excluded since such persons may be deemed to be affiliates. This determination of affiliate status is not necessarily a conclusive determination for other purposes.
Number of shares of common stock outstanding as of March 6, 2018: 9,397,077
DOCUMENTS INCORPORATED BY REFERENCE
Set forth below are the documents incorporated by reference and the part of the Form 10-K into which the document is incorporated:
Portions of the definitive Proxy Statement for the 2018 Annual Meeting of Shareholders are incorporated by reference into Part III, Items 10-14 of this Form 10-K.
Table of Contents
HOME BANCORP, INC.
2017 ANNUAL REPORT ON FORM 10-K
Table of Contents
Forward-Looking Statements
This Annual Report on Form 10-K contains certain forward looking statements (as defined in the Securities Exchange Act of 1934 and the regulations hereunder). Forward looking statements are not historical facts but instead represent only the beliefs, expectations or opinions of Home Bancorp, Inc. and its management regarding future events, many of which, by their nature, are inherently uncertain. Forward looking statements may be identified by the use of such words as: “believe”, “expect”, “anticipate”, “intend”, “plan”, “estimate”, or words of similar meaning or future or conditional terms such as “will”, “would”, “should”, “could”, “may”, “likely”, “probably”, or “possibly.” Forward looking statements include, but are not limited to, financial projections and estimates and their underlying assumptions; statements regarding plans, objectives and expectations with respect to future operations, products and services; and statements regarding future performance. Such statements are subject to certain risks, uncertainties and assumptions, many of which are difficult to predict and generally are beyond the control of Home Bancorp, Inc. and its management, that could cause actual results to differ materially from those expressed in, or implied or projected by, forward looking statements. The following factors, among others, could cause actual results to differ materially from the anticipated results or other expectations expressed in the forward looking statements: (1) economic and competitive conditions which could affect the volume of loan originations, deposit flows or real estate values; (2) the levels of noninterest income and expense and the amount of loan losses; (3) competitive pressure among depository institutions increasing significantly; (4) changes in the interest rate environment causing reduced interest margins; (5) general economic conditions, either nationally or in the markets in which Home Bancorp, Inc. is or will be doing business, being less favorable than expected; (6) political and social unrest, including acts of war or terrorism; (7) we may not fully realize all the benefits we anticipated in connection with our acquisitions of other institutions or our assumptions made in connection therewith may prove to be inaccurate; or (8) legislation or changes in regulatory requirements adversely affecting the business of Home Bancorp, Inc. Home Bancorp, Inc. undertakes no obligation to update these forward looking statements to reflect events or circumstances that occur after the date on which such statements were made.
As used in this report, unless the context otherwise requires, the terms “we,” “our,” “us,” or the “Company” refer to Home Bancorp, Inc., a Louisiana corporation, and the term “Bank” refers to Home Bank, National Association, a national bank and wholly owned subsidiary of the Company (for periods prior to March 2, 2015, the term “Bank” refers to the predecessor federal savings bank, Home Bank). In addition, unless the context otherwise requires, references to the operations of the Company include the operations of the Bank.
PART I
General. Home Bancorp, Inc. (the “Company”) is a Louisiana corporation and the holding company for Home Bank, N.A. (the “Bank”). The Bank, which is headquartered in Lafayette, Louisiana, and is a wholly-owned subsidiary of the Company, currently conducts business through 40 banking offices in the Greater Lafayette, Southwest Louisiana, Baton Rouge, Greater New Orleans and Northshore (of Lake Pontchartrain) regions of south Louisiana and the Natchez and Vicksburg regions of west Mississippi.
As of March 2, 2015, the Bank converted from a federal savings bank to a national bank with the title “Home Bank, National Association.” As a result of the Bank’s conversion to a national bank, the Company is now subject to regulation as a bank holding company by the Board of Governors of the Federal Reserve System (the “FRB” or the “Federal Reserve”). Prior to the Bank’s charter conversion, the Company was regulated by the FRB as a savings and loan holding company.
The Bank is primarily engaged in attracting deposits from the general public and using those funds to invest in loans and securities. Our principal sources of funds are customer deposits, repayments of loans, repayments of investments and funds borrowed from outside sources such as the Federal Home Loan Bank (“FHLB”) of Dallas. These funds are primarily used for the origination of loans, including one-to four-family first mortgage loans, home equity loans and lines, commercial real estate loans, construction and land loans, multi-family residential loans, commercial and industrial loans and consumer loans. The Bank derives its income principally from interest earned on loans and investment securities and, to a lesser extent, from fees received in connection with the origination of loans, service charges on deposit accounts and for other services. The Bank’s primary expenses are general operating expenses, the most significant of which is compensation and benefits.
1
Table of Contents
Although we continue to be an active originator of residential home mortgage loans in our market areas, over the course of the last decade plus, we have shifted our emphasis in the loan products we offer and increased our efforts to originate commercial real estate loans and commercial and industrial loans. Commercial real estate loans and commercial and industrial loans are deemed attractive due to their generally higher yields and shorter anticipated lives compared to single-family residential mortgage loans. In addition, the Bank views commercial real estate and commercial and industrial loans as attractive lending products because the Bank’s commercial borrowers typically maintain deposit accounts at the Bank, increasing the Bank’s core deposits.
The Company’s headquarters office is located at 503 Kaliste Saloom Road, Lafayette, Louisiana, and our telephone number is (337) 237-1960. We maintain a website at www.home24bank.com, and we provide our customers with online banking services. Information on our website should not be considered a part of this Annual Report on Form 10-K.
Market Area and Competition
The Bank has five primary market areas across south Louisiana: Greater Lafayette, Southwest Louisiana, Baton Rouge, Greater New Orleans and the Northshore (of Lake Pontchartrain) and two primary market areas in west Mississippi: Natchez and Vicksburg. Since completing its initial public offering of stock in October 2008, the Company has acquired five other financial institutions. In 2010, the Company expanded into the Northshore (of Lake Pontchartrain) through a Federal Deposit Insurance Corporation (“FDIC”) assisted transaction of certain assets and liabilities of the former Statewide Bank (“Statewide”). The Bank currently operates six banking offices in the Northshore region. In 2011, the Company expanded into the Greater New Orleans area through its acquisition of GS Financial Corporation (“GSFC”) and its subsidiary, Guaranty Savings Bank (“Guaranty”). In February 2014, the Company expanded into Natchez and Vicksburg, Mississippi through its acquisition of Britton & Koontz Capital Corporation (“Britton & Koontz”) and its subsidiary, Britton & Koontz Bank, N.A. (“Britton & Koontz Bank”). The Bank currently operates three banking offices in Natchez and one banking offices in Vicksburg. In September 2015, the Company increased its presence in Greater New Orleans through the acquisition of Louisiana Bancorp, Inc. (“LABC”) and its subsidiary, Bank of New Orleans. The Bank currently operates six banking offices in the Greater New Orleans area. In December 2017, the Company expanded its presence in the Greater Lafayette area and expanded into Southwest Louisiana with 12 banking offices through its acquisition of St. Martin Bancshares (“SMB”) and its subsidiary, St. Martin Bank & Trust Company (“St. Martin Bank”). The Bank currently operates three banking offices in Baton Rouge. For additional information on our acquisition activity, see Part II, Item 7 in this Annual Report on Form 10-K, “Management’s Discussion and Analysis of Financial Condition and Results of Operations – Acquisition Activity.”
We face significant competition in originating loans and attracting deposits. This competition stems primarily from other banks, credit unions and mortgage-banking companies. Many of the financial service providers operating in our market areas are significantly larger and have greater financial resources than us. We face additional competition for deposits from short-term money market funds and other corporate and government securities funds, mutual funds and from other non-depository financial institutions such as brokerage firms and insurance companies.
Supervision and Regulation
Set forth below is a brief description of certain laws relating to the regulation of Home Bancorp, Inc. and Home Bank. This description does not purport to be complete and is qualified in its entirety by reference to applicable laws and regulations.
General. Home Bank, N.A. is subject to federal regulation and oversight by the Office of the Comptroller of the Currency (“OCC”). The Bank is also subject to regulation and examination by the FDIC, which insures the deposits of the Bank to the maximum extent permitted by law, and requirements established by the Federal Reserve. In the last several years, the Company has experienced heightened regulatory requirements and scrutiny following the global financial crisis and as a result of the enactment in 2010 of the Dodd-Frank Wall Street Reform and Consumer Protection Act (the “Dodd-Frank Act”). Resulting reforms have caused the Company’s compliance and risk management processes, and the costs thereof, to increase. While it is anticipated that the current administration
2
Table of Contents
will not increase the regulatory burden on community banks and may reduce some of the burdens associated with implementation of the Dodd-Frank Act, the actual impact of this administration’s policies regarding the Dodd-Frank reforms is impossible to predict with any certainty.
Federal law provides the federal banking regulators with substantial enforcement powers. The OCC’s enforcement authority includes, among other things, the ability to assess civil money penalties, to issue cease and desist or removal orders and to initiate injunctive actions. In general, these enforcement actions may be initiated for violations of laws and regulations and unsafe or unsound practices. Other actions or inactions may provide the basis for enforcement action, including misleading or untimely reports filed with the OCC. The FRB has comparable enforcement authority over the Company. In addition, the FDIC, as the insurer of the Bank’s deposits, can initiate enforcement proceedings, remove Bank officials and suspend or terminate deposit insurance. Any change in such regulations could have a material adverse impact on the Company and the Bank.
Volcker Rule Regulations. Regulations have been adopted by the federal banking agencies to implement the provisions of the Dodd Frank Act commonly referred to as the Volcker Rule. The regulations contain prohibitions and restrictions on the ability of financial institution holding companies and their affiliates to engage in proprietary trading and to hold certain interests in, or to have certain relationships with, various types of investment funds, including hedge funds and private equity funds. The regulations were phased in over a period ending on July 21, 2015. The Company’s investment portfolio is in compliance with the various provisions of the Volcker Rule regulations as of December 31, 2017.
Regulation of Home Bancorp, Inc.
The Company was a savings and loan holding company until March 2, 2015, and it is now a bank holding company, subject to regulation, supervision and examination by the Federal Reserve. The Federal Reserve has enforcement authority with respect to the Company similar to that of the OCC over the Bank. Applicable federal law and regulations limit the activities of the Company and require the approval of the Federal Reserve for any acquisition of a subsidiary, including another financial institution or holding company thereof, or a merger or acquisition of the Company. The Company must serve as a source of strength for the Bank, maintaining the ability to provide financial assistance if the Bank suffers financial distress. These and other Federal Reserve policies may restrict the Company’s ability to pay dividends. In addition, dividends from the Company may depend, in part, upon its receipt of dividends from the Bank. If the Company does not have the required capital conservation buffer or otherwise meet its new capital requirements, its ability to pay dividends to its stockholders will be limited.
A bank holding company is required to give the Federal Reserve prior written notice of any purchase or redemption of its outstanding equity securities if the gross consideration for the purchase or redemption, when combined with the net consideration paid for all such purchases or redemption during the preceding 12 months, is equal to 10% or more of the company’s consolidated net worth. The Federal Reserve may disapprove such a purchase or redemption if it determines that the proposal would constitute an unsafe or unsound practice or would violate any law, regulation, Federal Reserve order, or any condition imposed by, or written agreement with the Federal Reserve. This notification requirement does not apply to any company that meets the well-capitalized standard for bank holding companies, is well-managed, and is not subject to any unresolved supervisory issues.
Permissible Activities. The business activities of the Company are generally limited to those activities permissible for bank holding companies under Section 4(c)(8) of the Bank Holding Company Act and certain additional activities authorized by the Federal Reserve regulations. The Bank Holding Company Act generally prohibits a bank holding company from acquiring direct or indirect ownership or control of more than 5% of the voting shares of any company which is not a bank or bank holding company. A bank holding company must obtain Federal Reserve Board approval before acquiring directly or indirectly, ownership or control of any voting shares of another bank or bank holding company if, after such acquisition, it would own or control more than 5% of such shares (unless it already owns or controls the majority of such shares).
Capital Requirements. Prior to January 1, 2015, there were no Federal Reserve regulations establishing minimum regulatory capital requirements for savings and loan holding companies. On January 1, 2015, new capital requirements generally applicable to both bank holding companies and savings and loan holding companies became effective. The new regulatory capital requirements applicable to the Company are the same as the new capital requirements for the Bank. For a description of these capital requirements, see “Regulation of Home Bank, N.A.—Recent Regulatory Capital Regulations.”
3
Table of Contents
Federal Securities Laws. We have registered our common stock with the Securities and Exchange Commission (“SEC”) under Section 12(b) of the Securities Exchange Act of 1934. Accordingly, the Company is subject to the proxy and tender offer rules, insider trading reporting requirements and restrictions and certain other requirements under the Securities Exchange Act of 1934.
The Sarbanes-Oxley Act. As a public company, the Company is subject to the Sarbanes-Oxley Act of 2002 which addresses, among other issues, corporate governance, auditing and accounting, executive compensation, and enhanced and timely disclosure of corporate information. As directed by the Sarbanes-Oxley Act, our principal executive officer and principal financial officer are required to certify that our quarterly and annual reports do not contain any untrue statement of a material fact. The rules adopted by the SEC under the Sarbanes-Oxley Act have several requirements, including having these officers certify that: they are responsible for establishing, maintaining and regularly evaluating the effectiveness of our internal control over financial reporting; they have made certain disclosures to our independent auditors and the Audit Committee of the Board of Directors about our internal control over financial reporting; and they have included information in our quarterly and annual reports about their evaluation and whether there have been changes in our internal control over financial reporting or in other factors that could materially affect internal control over financial reporting.
Regulation of Home Bank, N.A.
General. The Bank is subject to regulation and oversight by the OCC extending to all aspects of its operations. As part of this authority, the Bank is required to file periodic reports with the OCC and is subject to periodic examinations by the OCC and the FDIC. The investment and lending authorities of national banks are prescribed by federal laws and regulations, and such institutions are prohibited from engaging in any activities not permitted by such laws and regulations. Such regulation and supervision is primarily intended for the protection of depositors and the Deposit Insurance Fund.
The OCC’s enforcement authority over national banks includes, among other things, the ability to assess civil money penalties, to issue cease and desist or removal orders and to initiate injunctive actions. In general, these enforcement actions may be initiated for violations of laws and regulations and unsafe or unsound practices. Other actions or inactions may provide the basis for enforcement action, including misleading or untimely reports filed with the OCC.
Insurance of Accounts. The deposits of the Bank are insured to the maximum extent permitted by the Deposit Insurance Fund and are backed by the full faith and credit of the U.S. government. The Dodd-Frank Act permanently increased deposit insurance on most accounts to $250,000. As insurer, the FDIC is authorized to conduct examinations of, and to require reporting by, insured institutions. It also may prohibit any insured institution from engaging in any activity determined by regulation or order to pose a serious threat to the FDIC. The FDIC also has the authority to initiate enforcement actions against insured institutions.
The Dodd Frank Act raises the minimum reserve ratio of the Deposit Insurance Fund from 1.15% to 1.35% and requires the FDIC to offset the effect of this increase on insured institutions with assets of less than $10 billion (small institutions). In March 2016, the FDIC adopted a rule to accomplish this by imposing a surcharge on larger institutions commencing when the reserve ratio reaches 1.15% and ending when it reaches 1.35%. The reserve ratio reached 1.15% effective as of June 30, 2016. The surcharge period began effective July 1, 2016 and is expected to end by December 31, 2018. Small institutions will receive credits for the portion of their regular assessments that contributed to growth in the reserve ratio between 1.15% and 1.35%. The credits will apply to reduce regular assessments by 2.0 basis points for quarters when the reserve ratio is at least 1.38%.
Effective July 1, 2016, the FDIC adopted changes that eliminated its risk-based premium system. Under the new premium system, the FDIC assesses deposit insurance premiums on the assessment base of a depository institution, which is its average total assets reduced by the amount of its average tangible equity. For a small institution (one with assets of less than $10 billion) that has been federally insured for at least five years, effective July 1, 2016, the initial base assessment rate ranges from 3 to 30 basis points, based on the institution’s CAMELS composite and component ratings and certain financial ratios; its leverage ratio; its ratio of net income before taxes to total assets;
4
Table of Contents
its ratio of nonperforming loans and leases to gross assets; its ratio of other real estate owned to gross assets; its brokered deposits ratio (excluding reciprocal deposits if the institution is well capitalized and has a CAMELS composite rating of 1 or 2); its one year asset growth ratio (which penalizes growth adjusted for mergers in excess of 10%); and its loan mix index (which penalizes higher risk loans based on historical industry charge off rates). The initial base assessment rate is subject to downward adjustment (not below 1.5%) based on the ratio of unsecured debt the institution has issued to its assessment base, and to upward adjustment (which can cause the rate to exceed 30 basis points) based on its holdings of unsecured debt issued by other insured institutions. Institutions with assets of $10 billion or more are assessed using a scorecard method.
In addition, all institutions with deposits insured by the FDIC are required to pay assessments to fund interest payments on bonds issued by the Financing Corporation, a mixed-ownership government corporation established to recapitalize the predecessor to the Deposit Insurance Fund. The annual assessment rate set for the fourth quarter of 2017 was 0.001059% of insured deposits and is adjusted quarterly. These assessments will continue until the Financing Corporation bonds mature in 2019.
The FDIC may terminate the deposit insurance of any insured depository institution if it determines after a hearing that the institution has engaged or is engaging in unsafe or unsound practices, is in an unsafe or unsound condition to continue operations, or has violated any applicable law, regulation, order or any condition imposed by an agreement with the FDIC. It also may suspend deposit insurance temporarily during the hearing process for the permanent termination of insurance, if the institution has no tangible capital. If insurance of accounts is terminated, the accounts at the institution at the time of the termination, less subsequent withdrawals, shall continue to be insured for a period of six months to two years, as determined by the FDIC. Management is aware of no existing circumstances which would result in termination of the Bank’s deposit insurance.
Basel III and Dodd-Frank Act Regulatory Capital Regulations. In July of 2013, the respective U.S. federal banking agencies issued final rules implementing Basel III and the Dodd-Frank Act capital requirements to be fully-phased in on a global basis on January 1, 2019. The regulations establish a new tangible common equity capital requirement, increase the minimum requirement for the current Tier 1 risk-weighted asset (“RWA”) ratio, phase out certain kinds of intangibles treated as capital and certain types of instruments and change the risk weightings of certain assets used to determine required capital ratios. The new common equity Tier 1 capital component requires capital of the highest quality – predominantly composed of retained earnings and common stock instruments. For community banks, such as Home Bank, a common equity Tier 1 capital ratio of 4.5% became effective on January 1, 2015. The new capital rules also increased the current minimum Tier 1 capital ratio from 4.0% to 6.0% beginning on January 1, 2015. In addition, in order to make capital distributions and pay discretionary bonuses to executive officers without restriction, an institution must also maintain greater than 2.5% in common equity attributable to a capital conservation buffer to be phased in from January 1, 2016 until January 1, 2019. The new rules also increase the risk weights for several categories of assets, including an increase from 100% to 150% for certain acquisition, development and construction loans and more than 90-day past due exposures. The new capital rules maintain the general structure of the prompt corrective action rules (described below), but incorporate the new common equity Tier 1 capital requirement and the increased Tier 1 RWA requirement into the prompt corrective action framework.
Regulatory Capital Requirements. National banks are required to maintain minimum levels of regulatory capital. Current OCC capital standards require these institutions to satisfy a common equity Tier 1 capital requirement, a leverage capital requirement and a risk-based capital requirement. The common equity Tier 1 capital component generally consists of retained earnings and common stock instruments and must equal at least 4.5% of risk-weighted assets. Leverage capital, also known as “core” capital, must equal at least 3.0% of adjusted total assets for the most highly rated national banks. Core capital generally consists of common stockholders’ equity (including retained earnings). An additional cushion of at least 100 basis points is required for all other institutions, which effectively increases their minimum Tier 1 leverage ratio to 4.0% or more. Under the OCC’s regulations, the most highly-rated national banks are those that the OCC determines are strong banking organization and are rated composite 1 under the Uniform Financial Institutions Rating System. Under the risk-based capital requested, “total” capital (a combination of core and “supplementary” capital) must equal at least 8.0% of “risk-weighted” assets. The OCC also is authorized to impose capital requirements in excess of these standards on individual institutions on a case-by-case basis.
In determining compliance with the risk-based capital requirement, a national bank is allowed to include both core capital and supplementary capital in its total capital, provided that the amount of supplementary capital included does not exceed the national bank’s core capital. Supplementary capital generally consists of general allowances for loan
5
Table of Contents
losses up to a maximum of 1.25% of risk-weighted assets, together with certain other items. In determining the required amount of risk-based capital, total assets, including certain off-balance sheet items, are multiplied by a risk weight ranging from 0% to 1250% based on the risks inherent in the type of assets. The Bank does not have any assets assigned to a risk category over 400%.
National banks must value securities available for sale at amortized cost for regulatory capital purposes. This means that in computing regulatory capital, national banks should add back any unrealized losses and deduct any unrealized gains, net of income taxes, on debt securities reported as a separate component of capital, as defined by generally accepted accounting principles.
At December 31, 2017, the Bank exceeded all of its regulatory capital requirements, with Tier 1, Tier 1 common equity, Tier 1 common equity (to risk-weighted assets) and total risk-based capital ratios of 11.66%, 12.54%, 12.54% and 13.48%, respectively.
Any national bank that fails any of the capital requirements is subject to possible enforcement action by the OCC or the FDIC. Such action could include a capital directive, a cease and desist order, civil money penalties, the establishment of restrictions on the institution’s operations, termination of federal deposit insurance and the appointment of a conservator or receiver. The OCC’s capital regulations provide that such actions, through enforcement proceedings or otherwise, could require one or more of a variety of corrective actions.
Prompt Corrective Action. The following table shows the amount of capital associated with the different capital categories set forth in the prompt corrective action regulations.
| Capital Category |
Total Risk-Based Capital |
Tier 1 Risk-Based Capital |
Tier 1 Common Equity Capital |
Tier 1 Leverage Capital | ||||
| Well capitalized |
10% or more | 8% or more | 6.5% or more | 5% or more | ||||
| Adequately capitalized |
8% or more | 6% or more | 4.5% or more | 4% or more | ||||
| Undercapitalized |
Less than 8% | Less than 6% | Less than 4.5% | Less than 4% | ||||
| Significantly undercapitalized |
Less than 6% | Less than 4% | Less than 3% | Less than 3% |
In addition, an institution is “critically undercapitalized” if it has a ratio of tangible equity to total assets that is equal to or less than 2.0%. Under specified circumstances, a federal banking agency may reclassify a well-capitalized institution as adequately capitalized and may require an adequately capitalized institution or an undercapitalized institution to comply with supervisory actions as if it were in the next lower category (except that the OCC may not reclassify a significantly undercapitalized institution as critically undercapitalized).
An institution generally must file a written capital restoration plan which meets specified requirements within 45 days of the date that the institution receives notice or is deemed to have notice that it is undercapitalized, significantly undercapitalized or critically undercapitalized. A federal banking agency must provide the institution with written notice of approval or disapproval within 60 days after receiving a capital restoration plan, subject to extensions by the agency. An institution which is required to submit a capital restoration plan must concurrently submit a performance guaranty by each company that controls the institution. In addition, undercapitalized institutions are subject to various regulatory restrictions, and the appropriate federal banking agency also may take any number of discretionary supervisory actions.
As of December 31, 2017, the Bank was deemed a well-capitalized institution for purposes of the above regulations and as such is not subject to the above mentioned restrictions.
Limitations on Dividends. OCC regulations impose various restrictions on the ability of the Bank to pay dividends. The Bank generally may pay dividends during any calendar year in an amount up to 100% of net income for the year-to-date plus retained net income for the two preceding years, so long as it is well-capitalized after the distribution. If the Bank proposes to pay a dividend when it does not meet its capital requirements or that will exceed these limitations, it must obtain the OCC’s prior approval. The OCC may object to a proposed dividend
6
Table of Contents
based on safety and soundness concerns. No insured depository institution may pay a dividend if, after paying the dividend, the institution would be undercapitalized. In addition, as noted above, beginning in 2016, if Home Bank does not have the required capital conservation buffer, its ability to pay dividends to the Company will be limited.
Limitations on Transactions with Affiliates. Transactions between a national bank and any affiliate are governed by Sections 23A and 23B of the Federal Reserve Act. An affiliate of a national bank includes any company or entity which controls the national bank or that is controlled by a company that controls the national bank. In a holding company context, the holding company of a national bank (such as the Company) and any companies which are controlled by such holding company are affiliates of the national bank. Generally, Section 23A limits the extent to which the national bank or its subsidiaries may engage in “covered transactions” with any one affiliate to an amount equal to 10% of such bank’s capital stock and surplus, and contain an aggregate limit on all such transactions with all affiliates to an amount equal to 20% of such capital stock and surplus. Section 23B applies to “covered transactions” as well as certain other transactions and requires that all transactions be on terms substantially the same, or at least as favorable, to the national bank as those provided to a non-affiliate. The term “covered transaction” includes the making of loans to, purchase of assets from and issuance of a guarantee to an affiliate and similar transactions. Section 23B transactions also include the provision of services and the sale of assets by a national bank to an affiliate.
In addition, Sections 22(g) and (h) of the Federal Reserve Act, place restrictions on loans to executive officers, directors and principal shareholders of a national bank and its affiliates. Under Section 22(h), loans to a director, an executive officer and to a greater than 10% shareholder of a national bank, and certain affiliated interests of either, may not exceed, together with all other outstanding loans to such person and affiliated interests, a national bank’s loans to one borrower limit (generally equal to 15% of the bank’s unimpaired capital and surplus). Section 22(h) also requires that loans to directors, executive officers and principal shareholders be made on terms substantially the same as offered in comparable transactions to other persons unless the loans are made pursuant to a benefit or compensation program that (i) is widely available to employees of the bank and (ii) does not give preference to any director, executive officer or principal shareholder, or certain affiliated interests of either, over other employees of the national bank. Section 22(h) also requires prior board approval for certain loans. In addition, the aggregate amount of extensions of credit by a national bank to all insiders cannot exceed the bank’s unimpaired capital and surplus. Furthermore, Section 22(g) places additional restrictions on loans to executive officers. The Bank currently is subject to Sections 22(g) and (h) of the Federal Reserve Act, and as of December 31, 2017 was in compliance with the above restrictions.
Consumer Financial Services. The historical structure of federal consumer protection regulation applicable to all providers of consumer financial products and services changed significantly with the establishment of the Consumer Financial Protection Bureau (“CFPB”) as part of the Dodd-Frank Act reforms. On July 21, 2011, the CFPB commenced operations to supervise and enforce consumer protection laws. The CFPB has broad rulemaking authority for a wide range of consumer protection laws that apply to all providers of consumer products and services, including the Bank, as well as the authority to prohibit “unfair, deceptive or abusive” acts and practices. CFPB has examination and enforcement authority over providers with more than $10 billion in assets. FDIC-insured institutions with $10 billion or less in assets, like the Bank, continue to be examined by their applicable bank regulators.
Anti-money Laundering. All financial institutions, including national banks, are subject to federal laws that are designed to prevent the use of the U.S. financial system to fund terrorist activities. Financial institutions operating in the United States must develop anti-money laundering compliance programs, due diligence policies and controls to ensure the detection and reporting of money laundering. Such compliance programs are intended to supplement compliance requirements, also applicable to financial institutions, under the Bank Secrecy Act and the Office of Foreign Assets Control Regulations. The Bank has established policies and procedures to ensure compliance with these provisions.
Federal Home Loan Bank System. The Bank is a member of the FHLB of Dallas, which is one of 11 regional FHLBs that administer the home financing credit function of various financial institutions. Each FHLB serves as a reserve or central bank for its members within its assigned region. It is funded primarily from proceeds derived from the sale of consolidated obligations of the FHLB System. It makes loans to members (i.e., advances) in accordance with policies and procedures established by the board of directors of the FHLB. As of December 31, 2017, the Bank had $71.8 million of FHLB advances and $520.0 million available on its line of credit with the FHLB.
7
Table of Contents
As a member, the Bank is required to purchase and maintain stock in the FHLB of Dallas in an amount equal to at least 0.4% of its total assets and 4.1% of its advance based component for activity requirements. As of December 31, 2017, the Bank had $5.5 million in FHLB stock, which was in compliance with this requirement.
The FHLBs are required to provide funds for the resolution of troubled savings institutions and to contribute to affordable housing programs through direct loans or interest subsidies on advances targeted for community investment and low- and moderate-income housing projects. These contributions have adversely affected the level of FHLB dividends paid in the past and could do so in the future. These contributions also could have an adverse effect on the value of FHLB stock in the future.
Federal Reserve System. The FRB requires all depository institutions to maintain reserves against their transaction accounts and non-personal time deposits. The required reserves must be maintained in the form of vault cash or an account at the FRB. As of December 31, 2017, the Bank had met its reserve requirement.
Privacy. Financial institutions are required to disclose their policies for collecting and protecting confidential information. Customers generally may prevent financial institutions from sharing personal financial information with nonaffiliated third parties except for third parties that market the institutions’ own products and services.
Additionally, financial institutions generally may not disclose consumer account numbers to any nonaffiliated third party for use in telemarketing, direct mail marketing or other marketing through electronic mail to consumers. The Bank has established policies and procedures designed to safeguard its customers’ personal financial information and to ensure compliance with applicable privacy laws.
In analyzing whether to make or to continue an investment in our securities, investors should consider, among other factors, the following risk factors.
Risks Related to Our Business
Our business is geographically concentrated in south Louisiana and west Mississippi, which are areas where the oil and gas industry has a significant presence. Low prices in crude oil and gas, among other factors, could cause a downturn in the local economy, which could adversely affect the Company’s financial condition and results of operations.
Most of our loans are to individuals and businesses located in south Louisiana and west Mississippi. The oil and gas industry has a significant presence in the market areas in which we operate. Regional economic conditions affect the demand for our products and services as well as the ability of our customers to repay loans. While crude oil prices have rebounded somewhat in the past 24 months, they have declined considerably since mid-2014. Continued fluctuations in crude oil prices could adversely affect our operations and economic conditions in some of our markets during 2018 and future periods, which could adversely affect our future results of operations. Although the Company attempts to mitigate risk by diversifying its borrower base, approximately $58.8 million, or 3.5%, of the Company’s loan portfolio at December 31, 2017 was comprised of loans to borrowers in the oil and gas industry (which is also referred to as the “energy sector”). We had an additional $9.3 million in unfunded loan commitments to companies in the energy sector at such date. At December 31, 2017, $2.2 million of our loans in the energy sector were on nonaccrual status. $816,000 of our total allowance for loan losses at December 31, 2017 was attributable to energy sector loans. Historically, the oil and gas industry has been an important factor in the local economy in our Lafayette and Natchez markets. If oil prices continue to remain low, it could have an adverse effect on our customers resulting in increased levels of nonperforming loans, provisions for loan losses and expense associated with loan collection efforts.
8
Table of Contents
There are increased risks involved with commercial real estate, including multi-family residential, commercial and industrial and construction and land lending activities.
Our lending activities include loans secured by commercial real estate and commercial and industrial loans. Our multi-family residential, commercial real estate and commercial and industrial loans increased by an aggregate of 207.5%, 126.6% and 139.0%, respectively, from December 31, 2013 through December 31, 2017. Multi-family residential lending, commercial real estate lending and commercial and industrial lending generally are considered to involve a higher degree of risk than single-family residential lending due to a variety of factors. As a result of the larger loan balances typically involved in these loans, an adverse development with respect to one loan or one borrower relationship can expose us to greater risk of loss compared to an adverse development with respect to a one- to four-family residential mortgage loan. As of December 31, 2017, the largest outstanding balances of our, commercial real estate loans, commercial and industrial loans and multi-family residential loans were $3.3 million, $15.1 million and $5.1 million, respectively. If a large loan were to become non-performing, as we have experienced in the past, it can have a significant impact on our results of operations. Because we intend to continue our growth in commercial real estate and commercial and industrial loans, our credit risk exposure may increase and we may need to make additional provisions to our allowance for loan losses, which could adversely affect our future results of operations.
In addition to commercial real estate, commercial and industrial loans and multi-family residential loans, the Bank holds a significant portfolio of construction and land loans. As of December 31, 2017, the Bank’s construction and land loans amounted to $177.3 million, or 10.7% of our loan portfolio. Construction and land loans generally have a higher risk of loss than single-family residential mortgage loans due primarily to the critical nature of the initial estimates of a property’s value upon completion of construction compared to the estimated costs, including interest, of construction as well as other assumptions. If the estimates upon which construction loans are made prove to be inaccurate, we may be confronted with projects that, upon completion, have values which are below the loan amounts. If the Bank is forced to liquidate the collateral associated with such loans at values less than the remaining loan balance, it could have a significant impact on our results of operations.
Our allowance for loan losses may not be adequate to cover probable losses.
We have established an allowance for loan losses based upon various assumptions and judgments about the collectability of our loan portfolio which we believe is adequate to offset probable losses on our existing loans. While we are not aware of any specific factors indicating a deficiency in the amount of our allowance for loan losses, in light of the current economic environment, one of the most pressing issues faced by financial institutions is the adequacy of their allowance for loan losses. Federal bank regulators have routinely scrutinize the level of the allowance for losses maintained by regulated institutions. In the event that we have to increase our allowance for loan losses beyond current levels, it would have an adverse effect on our results in future periods. As of December 31, 2017, our allowance for loan losses amounted to $14.8 million, or 0.89% of total loans. Excluding acquired loans, our allowance for loan losses amounted to 1.52% of total loans as of December 31, 2017.
Our decisions regarding the fair value of assets acquired could be inaccurate, which could materially and adversely affect our business, financial condition, results of operations and future prospects.
Management makes various assumptions and judgments about the collectability of acquired loan portfolios, including the creditworthiness of borrowers and the value of the real estate and other assets serving as collateral for the repayment of secured loans. If our assumptions are incorrect, increased loss reserves may be needed to respond to different economic conditions or adverse developments in the acquired loan portfolio. Any increase in future loan losses would have a negative effect on our operating results.
Other than temporary declines in the value of our investment securities may require us to take additional charges to earnings.
We evaluate our securities portfolio for other-than-temporary impairment (“OTTI”) throughout the year. Each investment with a fair value less than book value is reviewed quarterly. An impairment charge is recorded against individual securities if management’s review concludes that the decline in value is other than temporary. Delinquencies and defaults in the mortgage loans underlying these securities may adversely affect the cash flows received by us and may result in a conclusion in future periods that the securities are other-than-temporarily impaired. Such a conclusion of OTTI would require us to take additional charges to earnings to write down the value of these securities.
9
Table of Contents
Our financial performance and future growth may be negatively affected if we are unable to successfully execute our growth plans, which may include acquisitions.
Over the past several years, we have grown our branch system primarily through acquisitions of other financial institutions. Our ability to successfully acquire other institutions depends on our ability to identify, acquire and integrate such institutions into our franchise. Our results of operations could be adversely affected if our analysis of past or future acquisitions was not complete and correct or our integration efforts were not successful. Currently, we have no agreements or understandings with anyone regarding a future acquisition.
A natural disaster, especially one affecting our market areas, could adversely affect the Company’s financial condition and results of operations.
Since a considerable portion of our business is conducted in south Louisiana, most of our credit exposure is in that area. Historically, south Louisiana has been vulnerable to natural disasters, including hurricanes and floods. Natural disasters could harm our operations directly through interference with communications, which would prevent us from gathering deposits, originating loans and processing and controlling our flow of business, as well as through the destruction of facilities and our operational, financial and management information systems. A natural disaster or recurring power outages may also impair the value of our loan portfolio, as uninsured or underinsured losses, including losses from business disruption, may reduce our borrowers’ ability to repay their loans. Disasters may also reduce the value of the real estate securing our loans, impairing our ability to recover on defaulted loans through foreclosure and making it more likely that we would suffer losses on defaulted loans. Although we have implemented several back-up systems and protections (and maintain business interruption insurance), these measures may not protect us fully from the effects of a natural disaster. The occurrence of natural disasters in our market areas could have a material adverse effect on our business, prospects, financial condition and results of operations.
Changes in interest rates could have a material adverse effect on our operations.
The operations of financial institutions are dependent to a large extent on net interest income, which is the difference between the interest income earned on interest-earning assets, such as loans and investment securities, and the interest expense paid on interest-bearing liabilities, such as deposits and borrowings. Changes in the general level of interest rates can affect our net interest income by affecting the difference between the weighted average yield earned on our interest-earning assets and the weighted average rate paid on our interest-bearing liabilities, or interest rate spread, and the average life of our interest-earning assets and interest-bearing liabilities. If general market rates of interest increase, our interest expense on deposits and borrowings would likely increase which could adversely affect our interest rate spread and net interest income. Changes in interest rates also can affect our ability to originate loans, the value of our interest-earning assets and our ability to realize gains from the sale of such assets, our ability to obtain and retain deposits in competition with other available investment alternatives, and the ability of our borrowers to repay adjustable or variable rate loans. Interest rates are highly sensitive to many factors, including governmental monetary policies, domestic and international economic and political conditions and other factors beyond our control.
We face strong competition which adversely affects our profitability.
We are subject to vigorous competition in all aspects and areas of our business from banks and other financial institutions. We are significantly smaller than the larger depository institutions operating in our market areas. The financial resources of these larger competitors may permit them to pay higher interest rates on their deposits and to be more aggressive in new loan originations. We also compete with non-financial institutions, including retail stores that maintain their own credit programs and governmental agencies that make available low cost or guaranteed loans to certain borrowers. Some of our larger competitors have substantially greater resources, more advanced technological capabilities, lending limits, larger branch systems and a wider array of commercial banking services. Vigorous competition from both bank and non-bank organizations is expected to continue.
10
Table of Contents
We operate in a highly regulated environment, and we may be adversely affected by changes in laws and regulations.
We are subject to extensive regulation, supervision and examination by the FRB, the OCC and the FDIC. Such regulation and supervision governs the activities in which an institution and its holding company may engage and are intended primarily for the protection of the insurance fund and the depositors and borrowers of the Bank rather than for holders of our common stock. Regulatory authorities have extensive discretion in their supervisory and enforcement activities, including the imposition of restrictions on our operations, the classification of our assets and determination of the level of our allowance for loan losses. Any change in such regulation and oversight, whether in the form of regulatory policy, regulations, legislation or supervisory action, may have a material impact on our operations.
Fluctuations in interest rates may adversely affect our net interest income and profitability.
Interest rates are highly sensitive to many factors beyond the Company’s control, including general economic conditions and the policies of the FRB and other governmental and regulatory agencies. Changes in monetary policy, including changes in interest rates, will influence the origination of loans, the prepayment of loans, the fair value of existing assets and liabilities, the purchase of investments, the retention and generation of deposits, and the rates received on loans and investment securities and paid on deposits or other sources of funding. If the interest rates paid on deposits and other borrowings increase at a faster rate than the interest rates received on loans and other investments, our earnings could be adversely affected. Earnings could also be adversely affected if the interest rates received on loans and other investments fall more quickly than the interest rates paid on deposits and other borrowings. We have adopted asset and liability management policies to mitigate the potential adverse effects of changes in interest rates on net interest income or earnings. However, even with these policies in place, a change in interest rates can impact our results of operations or financial condition.
Our goodwill may be determined to be impaired at a future date depending on the results of periodic impairment tests.
We test goodwill for impairment annually, or more frequently if necessary. According to applicable accounting requirements, acceptable valuation methods include present-value measurements based on multiples of earnings or revenues, or similar performance measures. If the quoted market price of our common stock were to decline significantly, or if it was determined that the carrying amount of our goodwill exceeded its implied fair value, we would be required to write down the amount recorded for goodwill. This, in turn, would result in a charge to earnings and, thus, a reduction in shareholders’ equity. See Notes 2 and 8 to the Consolidated Financial Statements for additional information concerning our goodwill and the required impairment test.
A failure in our operational systems or infrastructure, or those of third parties, could impair our liquidity, disrupt our businesses, result in the unauthorized disclosure of confidential information, damage our reputation and cause financial losses.
Our ability to adequately conduct and grow our business is dependent on our ability to create and maintain an appropriate operational and organizational control infrastructure. Operational risk can arise in numerous ways including employee fraud, customer fraud, and control lapses in bank operations and information technology. Our dependence on our employees and automated systems, including the automated systems used by acquired entities and third parties, to record and process transactions may further increase the risk that technical failures or tampering of those systems will result in losses that are difficult to detect. We are also subject to disruptions of our operating systems arising from events that are wholly or partially beyond our control. Failure to maintain an appropriate operational infrastructure can lead to loss of service to customers, legal actions, and noncompliance with various laws and regulations.
We continuously monitor our operational and technological capabilities and make modifications and improvements when we believe it will be cost effective to do so. In some instances, we may build and maintain these capabilities ourselves. We also outsource some of these functions to third parties. These third parties may experience errors or disruptions that could adversely impact us and over which we may have limited control. We also face risk from the integration of new infrastructure platforms and/or new third party providers of such platforms into its existing businesses.
11
Table of Contents
Changes in accounting policies or in accounting standards could materially affect how we report our financial condition and results of operations.
Our accounting policies are fundamental to the understanding of our financial condition and results of operations. The preparation of consolidated financial statements in conformity with generally accepted accounting principles in the United States (“GAAP”) requires management to make significant estimates and assumptions that affect the financial statements by affecting the value of our assets or liabilities and results of operations. Some of our accounting policies are critical because they require management to make difficult, subjective and complex judgments about matters that are inherently uncertain and because materially different amounts may be reported if different estimates or assumptions were used. If such estimates or assumptions underlying the financial statements are incorrect, we could experience material losses. From time to time, the Financial Accounting Standards Board (“FASB”) and the Securities and Exchange Commission (“SEC”) change the financial accounting and reporting standards or the interpretation of such standards that govern the preparation of our external financial statements. These changes are beyond our control, can be difficult to predict and could materially impact how we report our financial condition and results of operations. Additionally, it is possible, if unlikely, we could be required to apply a new or revised standard retrospectively, resulting in the restatement of prior period financial statements in material amounts.
System failure or cybersecurity breaches of our network security could subject us to increased operating costs as well as litigation and other potential losses.
We rely heavily on communications and information systems to conduct our business. The computer systems and network infrastructure we use could be vulnerable to unforeseen hardware and cybersecurity issues. Our operations are dependent upon our ability to protect our computer equipment against damage from fire, power loss, telecommunications failure or a similar catastrophic event. Any damage or failure that causes an interruption in our operations could have an adverse effect on our financial condition and results of operations. In addition, our operations are dependent upon our ability to protect the computer systems and network infrastructure we use, including our Internet banking activities, against damage from physical break-ins, cybersecurity breaches and other disruptive problems caused by the internet or users. Such problems could jeopardize the security of our customers’ personal information and other information stored in and transmitted through our computer systems and network infrastructure, which may result in significant liability to us, subject us to additional regulatory scrutiny, damage our reputation, result in a loss of customers, or inhibit current and potential customers from our internet banking services, any of all of which could have a material adverse effect on our results of operations and financial condition. Although we have security measures designed to mitigate the possibility of break-ins, breaches and other disruptive problems, including firewalls and penetration testing, there can be no assurance that such security measures will be effective in preventing such problems.
Economic conditions could result in increases in our level of non-performing loans and/or reduce demand for our products and services, which could have an adverse effect on our results of operations.
Prolonged deteriorating economic conditions could significantly affect the markets in which we do business, the value of our loans and investment securities, and our ongoing operations, costs and profitability. Further, declines in real estate values and sales volumes and elevated unemployment levels may result in higher loan delinquencies, increases in our non-performing and classified assets and a decline in demand for our products and services. These events may cause us to incur losses and may adversely affect our financial condition and results of operations. Reduction in problem assets can be slow, and the process can be exacerbated by the condition of the properties securing non-performing loans and the length of time involved in the foreclosure process. To the extent that we must work through the resolution of assets, economic problems may cause us to incur losses and adversely affect our capital, liquidity, and financial condition.
12
Table of Contents
We may be adversely affected by recent changes in U.S. tax laws and regulations.
Changes in tax laws contained in the Tax Cuts and Jobs Act, which was enacted in December 2017, include a number of provisions that will have an impact on the banking industry, borrowers and the market for residential real estate. Included in this legislation was a reduction of the corporate income tax rate from 35% to 21%. In addition, other changes included: (i) a lower limit on the deductibility of mortgage interest on single-family residential mortgage loans, (ii) the elimination of interest deductions for home equity loans, (iii) a limitation on the deductibility of business interest expense and (iv) a limitation on the deductibility of property taxes and state and local income taxes.
The recent changes in the tax laws may have an adverse effect on the market for, and valuation of, residential properties, and on the demand for such loans in the future, and could make it harder for borrowers to make their loan payments. If home ownership becomes less attractive, demand for mortgage loans could decrease. The value of the properties securing loans in our loan portfolio may be adversely impacted as a result of the changing economics of home ownership, which could require an increase in our provision for loan losses, which would reduce our profitability and could materially adversely affect our business, financial condition and results of operations.
We expect that the implementation of a new accounting standard could require us to increase our allowance for loan losses and may have a material adverse effect on our financial condition and results of operations.
The Financial Accounting Standards Board (“FASB”) has adopted a new accounting standard that will be effective for the Company and the Bank for our first fiscal year after December 15, 2019. This standard, referred to as Current Expected Credit Loss (“CECL”), will require financial institutions to determine periodic estimates of lifetime expected credit losses on loans, and provide for the expected credit losses as allowances for loan losses. This will change the current method of providing allowances for loan losses that are probable, which we expect could require us to increase our allowance for loan losses, and will likely greatly increase the data we would need to collect and review to determine the appropriate level of the allowance for loan losses. Any increase in our allowance for loan losses, or expenses incurred to determine the appropriate level of the allowance for loan losses, may have a material adverse effect on our financial condition and results of operations.
We are subject to certain risks in connection with our strategy of growing through mergers and acquisitions.
Mergers and acquisitions are currently a component of our business model and growth strategy. Accordingly, it is possible that we could acquire other banking institutions, other financial services companies or branches of banks in the future. Acquisitions typically involve the payment of a premium over book and trading values and, therefore, may result in the dilution of our tangible book value per share. Our ability to engage in future mergers and acquisitions depends on various factors, including: (1) our ability to identify suitable merger partners and acquisition opportunities; (2) our ability to finance and complete transactions on acceptable terms and at acceptable prices; and (3) our ability to receive the necessary regulatory and, when required, shareholder approvals. Our inability to engage in an acquisition or merger for any of these reasons could have an adverse impact on the implementation of our business strategies. Furthermore, mergers and acquisitions involve a number of risks and challenges, including: (1) our ability to achieve planned synergies and to integrate the branches and operations we acquire, and the internal controls and regulatory functions into our current operations and (2) the diversion of management’s attention from existing operations, which may adversely affect our ability to successfully conduct our business and negatively impact our financial results.
We are dependent on our information technology and telecommunications systems and third-party service providers; systems failures, interruptions and cybersecurity breaches could have a material adverse effect on us.
Our business is dependent on the successful and uninterrupted functioning of our information technology and telecommunications systems and third-party service providers. The failure of these systems, or the termination of a third-party software license or service agreement on which any of these systems is based, could interrupt our operations. Because our information technology and telecommunications systems interface with and depend on third-party systems, we could experience service denials if demand for such services exceeds capacity or such third-party systems fail or experience interruptions. If significant, sustained or repeated, a system failure or service denial could compromise our ability to operate effectively, damage our reputation, result in a loss of customer business, and/or subject us to additional regulatory scrutiny and possible financial liability, any of which could have a material adverse effect on us.
13
Table of Contents
Our third-party service providers may be vulnerable to unauthorized access, computer viruses, phishing schemes and other security breaches. We likely will expend additional resources to protect against the threat of such security breaches and computer viruses, or to alleviate problems caused by such security breaches or viruses. To the extent that the activities of our third-party service providers or the activities of our customers involve the storage and transmission of confidential information, security breaches and viruses could expose us to claims, regulatory scrutiny, litigation costs and other possible liabilities.
The occurrence of fraudulent activity, breaches or failures of our information security controls or cybersecurity-related incidents could have a material adverse effect on our business, financial condition, results of operations and growth prospects.
As a bank, we are susceptible to fraudulent activity, information security breaches and cybersecurity-related incidents that may be committed against us or our clients, which may result in financial losses or increased costs to us or our clients, disclosure or misuse of our information or our client information, misappropriation of assets, privacy breaches against our clients, litigation or damage to our reputation. Such fraudulent activity may take many forms, including check fraud, electronic fraud, wire fraud, phishing, social engineering and other dishonest acts. Information security breaches and cybersecurity-related incidents may include fraudulent or unauthorized access to systems used by us or our clients, denial or degradation of service attacks and malware or other cyber-attacks. In recent periods, there continues to be a rise in electronic fraudulent activity, security breaches and cyber-attacks within the financial services industry, especially in the commercial banking sector due to cyber criminals targeting commercial bank accounts. Moreover, in recent periods, several large corporations, including financial institutions and retail companies, have suffered major data breaches, in some cases exposing not only confidential and proprietary corporate information, but also sensitive financial and other personal information of their customers and employees and subjecting them to potential fraudulent activity. Some of our clients may have been affected by these breaches, which could increase their risks of identity theft and other fraudulent activity that could involve their accounts with us.
Information pertaining to us and our clients is maintained, and transactions are executed, on networks and systems maintained by us and certain third-party partners, such as our online banking, mobile banking or accounting systems. The secure maintenance and transmission of confidential information, as well as execution of transactions over these systems, are essential to protect us and our clients against fraud and security breaches and to maintain the confidence of our clients. Breaches of information security also may occur through intentional or unintentional acts by those having access to our systems or the confidential information of our clients, including employees. In addition, increases in criminal activity levels and sophistication, advances in computer capabilities, new discoveries, vulnerabilities in third-party technologies (including browsers and operating systems) or other developments could result in a compromise or breach of the technology, processes and controls that we use to prevent fraudulent transactions and to protect data about us, our clients and underlying transactions, as well as the technology used by our clients to access our systems. Our third-party partners’ inability to anticipate, or failure to adequately mitigate, breaches of security could result in a number of negative events, including losses to us or our clients, loss of business or clients, damage to our reputation, the incurrence of additional expenses, disruption to our business, additional regulatory scrutiny or penalties or our exposure to civil litigation and possible financial liability, any of which could have a material adverse effect on our business, financial condition, results of operations and growth prospects.
Item 1B. Unresolved Staff Comments.
Not applicable.
We currently conduct business from 15 banking offices in Greater Lafayette, six banking centers in Southwest Louisiana, three banking offices in Baton Rouge, six banking offices in Greater New Orleans, six banking offices in the Northshore (of Lake Pontchartrain) region of Louisiana, three offices in Natchez, Mississippi and one office in Vicksburg, Mississippi. The Bank owns 37 of its 40 banking offices. The Bank leases the land for one banking office in our Northshore market, and leases one banking office in Greater Lafayette and Greater New Orleans.
14
Table of Contents
From time-to-time, the Bank is named as a defendant in various legal actions arising from the normal course of business in which damages of various amounts may be claimed. While the amount, if any, of ultimate liability with respect to any such matters cannot be currently determined, management believes, after consulting with legal counsel, that any such liability will not have a material adverse effect on the Company’s consolidated financial position, results of operations, or cash flows.
Item 4. Mine Safety Disclosures.
Not applicable.
PART II
| Item 5. Market | for the Registrant’s Common Equity, Related Stockholder Matters and Issuer Purchases of Equity Securities. |
(a) Home Bancorp, Inc.’s common stock is listed on the Nasdaq Global Select Market under the symbol “HBCP”. The common stock commenced trading on the Nasdaq Stock Market on October 3, 2008. As of the close of business on December 31, 2017, there were 9,395,488 shares of common stock outstanding, held by approximately 775 shareholders of record, not including the number of persons or entities whose stock is held in nominee or “street” name through various brokerage firms and banks.
The following table sets forth the high and low prices of the Company’s common stock as reported by the Nasdaq Stock Market and cash dividends declared per share for the periods indicated.
| For The Quarter Ended |
High | Low | Cash Dividends Declared |
|||||||||
| March 31, 2016 |
$ | 27.25 | $ | 21.29 | $ | 0.09 | ||||||
| June 30, 2016 |
$ | 28.95 | $ | 24.76 | $ | 0.10 | ||||||
| September 30, 2016 |
$ | 29.78 | $ | 26.62 | $ | 0.10 | ||||||
| December 31, 2016 |
$ | 39.75 | $ | 27.00 | $ | 0.12 | ||||||
| March 31, 2017 |
$ | 38.90 | $ | 32.60 | $ | 0.13 | ||||||
| June 30, 2017 |
$ | 47.20 | $ | 32.52 | $ | 0.14 | ||||||
| September 30, 2017 |
$ | 43.88 | $ | 37.27 | $ | 0.14 | ||||||
| December 31, 2017 |
$ | 44.94 | $ | 38.55 | $ | 0.14 | ||||||
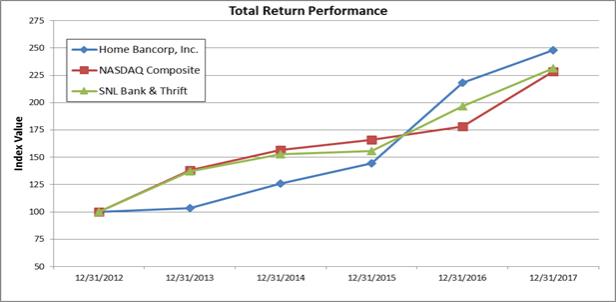
The following graph shows a comparison of the cumulative total returns for the common stock of Home Bancorp, Inc., the Nasdaq Composite Index and the SNL Securities Bank and Thrift Index for the period beginning December 31, 2012 and ending December 2017. The graph below represents $100 invested in our common stock at its closing price on December 31, 2012.
15
Table of Contents
| Period Ending | ||||||||||||||||||||||||
| Index |
12/31/12 | 12/31/13 | 12/31/14 | 12/31/15 | 12/31/16 | 12/31/17 | ||||||||||||||||||
| Home Bancorp, Inc. |
100.00 | 103.29 | 126.08 | 144.62 | 218.14 | 247.75 | ||||||||||||||||||
| NASDAQ Composite |
100.00 | 138.32 | 156.85 | 165.84 | 178.28 | 228.63 | ||||||||||||||||||
| SNL Bank and Thrift |
100.00 | 136.92 | 152.85 | 155.94 | 196.86 | 231.49 | ||||||||||||||||||
The stock price information shown above is not necessarily indicative of future price performance. Information used was obtained from S&P Global Market Intelligence, Charlottesville, Virginia. The Company assumes no responsibility for any errors or omissions in such information.
The Company did not sell any of its equity securities during 2017 that were not registered under the Securities Act of 1933.
For information regarding the Company’s equity compensation plans, see Item 12.
| (b) | Not applicable. |
| (c) | On June 7, 2013, the Company’s Board of Directors approved a share repurchase program (the “2013 Repurchase Program”) authorizing management to repurchase up to 370,000 shares, or approximately 5%, of its common stock outstanding through open market or privately negotiated transactions. As of December 31, 2017, 1,969 shares remain subject to repurchase under the 2013 Repurchase Program. On April 26, 2016, the Company announced an additional stock repurchase program (the “2016 Repurchase Program”). Under the 2016 Repurchase Program, the Company can repurchase up to 365,000 shares, or approximately 5% of its common stock outstanding, through open market or privately negotiated transactions. The Company’s purchases of its common stock made during the fourth quarter of 2017 (which were made pursuant to the 2013 Repurchase Program) are set forth in the following table. |
16
Table of Contents
| Period |
Total Number of Shares Purchased |
Average Price Paid per Share |
Total Number of Shares Purchased as Part of Publicly Announced Plans or Programs |
Maximum Number of Shares that May Yet be Purchased Under the Plans or Programs |
||||||||||||
| October 1 - October 31, 2017 |
518 | $ | 41.50 | 518 | 366,994 | |||||||||||
| November 1 - November 30, 2017 |
— | — | — | 366,994 | ||||||||||||
| December 1 - December 31, 2017 |
25 | 43.58 | 25 | 366,969 | ||||||||||||
|
|
|
|
|
|
|
|
|
|||||||||
| Total |
543 | $ | 41.60 | 543 | 366,969 | |||||||||||
|
|
|
|
|
|
|
|
|
|||||||||
Item 6. Selected Financial Data.
Set forth below is selected summary historical financial and other data of the Company. When you read this summary historical financial data, it is important that you also read the historical financial statements and related notes contained in Item 8 of this Form 10-K, as well as “Management’s Discussion and Analysis of Financial Condition and Results of Operations.”
| As of December 31, | ||||||||||||||||||||
| (dollars in thousands) |
2017 | 2016 | 2015 | 2014 | 2013 | |||||||||||||||
| Selected Financial Condition Data: |
||||||||||||||||||||
| Total assets |
$ | 2,228,121 | $ | 1,556,732 | $ | 1,551,912 | $ | 1,221,415 | $ | 984,241 | ||||||||||
| Cash and cash equivalents |
150,418 | 29,315 | 24,798 | 29,078 | 32,639 | |||||||||||||||
| Interest-bearing deposits in banks |
2,421 | 1,884 | 5,144 | 5,526 | 2,940 | |||||||||||||||
| Investment securities: |
||||||||||||||||||||
| Available for sale |
234,993 | 183,730 | 176,762 | 174,801 | 149,632 | |||||||||||||||
| Held to maturity |
13,034 | 13,365 | 13,927 | 11,705 | 9,405 | |||||||||||||||
| Loans receivable, net |
1,642,987 | 1,215,323 | 1,214,818 | 901,208 | 700,538 | |||||||||||||||
| Intangible assets |
68,033 | 12,762 | 15,304 | 4,266 | 1,909 | |||||||||||||||
| Deposits |
1,866,227 | 1,248,072 | 1,244,217 | 993,573 | 741,312 | |||||||||||||||
| Federal Home Loan Bank advances |
71,826 | 118,533 | 125,153 | 47,500 | 97,000 | |||||||||||||||
| Securities sold under repurchase agreements |
— | — | — | 20,371 | — | |||||||||||||||
| Shareholders’ equity |
277,871 | 179,843 | 165,046 | 154,144 | 141,910 | |||||||||||||||
| For the Years Ended December 31, | ||||||||||||||||||||
| (dollars in thousands, except per share data) |
2017 | 2016 | 2015 | 2014 | 2013 | |||||||||||||||
| Selected Operating Data: |
||||||||||||||||||||
| Interest income |
$ | 74,398 | $ | 67,684 | $ | 58,410 | $ | 54,323 | $ | 43,721 | ||||||||||
| Interest expense |
6,549 | 5,268 | 3,866 | 3,284 | 3,503 | |||||||||||||||
|
|
|
|
|
|
|
|
|
|
|
|||||||||||
| Net interest income |
67,849 | 62,416 | 54,544 | 51,039 | 40,218 | |||||||||||||||
| Provision for loan losses |
2,317 | 3,200 | 2,071 | 2,364 | 3,653 | |||||||||||||||
|
|
|
|
|
|
|
|
|
|
|
|||||||||||
| Net interest income after provision for loan losses |
65,532 | 59,216 | 52,473 | 48,675 | 36,565 | |||||||||||||||
| Noninterest income |
9,962 | 11,157 | 8,770 | 8,175 | 7,670 | |||||||||||||||
| Noninterest expense |
46,177 | 46,797 | 42,022 | 41,772 | 33,205 | |||||||||||||||
|
|
|
|
|
|
|
|
|
|
|
|||||||||||
| Income before income taxes |
29,317 | 23,576 | 19,221 | 15,078 | 11,030 | |||||||||||||||
| Income taxes |
12,493 | 7,568 | 6,671 | 5,206 | 3,736 | |||||||||||||||
|
|
|
|
|
|
|
|
|
|
|
|||||||||||
| Net income |
$ | 16,824 | $ | 16,008 | $ | 12,550 | $ | 9,872 | $ | 7,294 | ||||||||||
|
|
|
|
|
|
|
|
|
|
|
|||||||||||
| Earnings per share—basic |
$ | 2.36 | $ | 2.34 | $ | 1.87 | $ | 1.51 | $ | 1.11 | ||||||||||
|
|
|
|
|
|
|
|
|
|
|
|||||||||||
17
Table of Contents
| For the Years Ended December 31, | ||||||||||||||||||||
| (dollars in thousands, except per share data) |
2017 | 2016 | 2015 | 2014 | 2013 | |||||||||||||||
| Selected Operating Data: |
||||||||||||||||||||
| Earnings per share—diluted |
$ | 2.28 | $ | 2.25 | $ | 1.79 | $ | 1.42 | $ | 1.06 | ||||||||||
|
|
|
|
|
|
|
|
|
|
|
|||||||||||
| Cash dividends per share |
$ | 0.55 | $ | 0.41 | $ | 0.30 | $ | 0.07 | $ | — | ||||||||||
|
|
|
|
|
|
|
|
|
|
|
|||||||||||
| As of or For the Years Ended December 31, | ||||||||||||||||||||
| 2017 | 2016 | 2015 | 2014 | 2013 | ||||||||||||||||
| Selected Operating Ratios: (1) | ||||||||||||||||||||
| Average yield on interest-earnings assets (TE) |
4.91 | % | 4.71 | % | 4.75 | % | 4.84 | % | 5.06 | % | ||||||||||
| Average rate on interest-bearing liabilities |
0.59 | 0.49 | 0.43 | 0.39 | 0.54 | |||||||||||||||
| Average interest rate spread (TE) (2) |
4.32 | 4.22 | 4.32 | 4.45 | 4.52 | |||||||||||||||
| Net interest margin (TE) (3) |
4.48 | 4.34 | 4.43 | 4.54 | 4.65 | |||||||||||||||
| Average interest-earning assets to average interest-bearing liabilities |
135.70 | 134.34 | 136.76 | 133.91 | 132.63 | |||||||||||||||
| Noninterest expense to average assets |
2.86 | 3.04 | 3.14 | 3.38 | 3.45 | |||||||||||||||
| Efficiency ratio (4) |
59.35 | 63.61 | 66.37 | 70.54 | 69.34 | |||||||||||||||
| Return on average assets |
1.04 | 1.04 | 0.94 | 0.80 | 0.76 | |||||||||||||||
| Return on average common equity |
8.63 | 9.19 | 7.83 | 6.65 | 5.14 | |||||||||||||||
| Return on average tangible common equity (Non-GAAP) (8) |
9.66 | 10.32 | 8.53 | 7.16 | 5.37 | |||||||||||||||
| Common stock dividend payout ratio |
24.12 | 18.22 | 16.76 | 4.93 | — | |||||||||||||||
| Average equity to average assets |
12.06 | 11.30 | 11.99 | 12.02 | 14.74 | |||||||||||||||
| Book value per common share |
$ | 29.57 | $ | 24.47 | $ | 22.80 | $ | 21.64 | $ | 19.99 | ||||||||||
| Tangible book value per common share (Non-GAAP) (9) |
22.33 | 22.73 | 20.68 | 21.04 | 19.72 | |||||||||||||||
| Asset Quality Ratios: (5) (6) |
||||||||||||||||||||
| Non-performing loans as a percent of total loans receivable |
2.38 | % | 1.39 | % | 0.71 | % | 0.55 | % | 1.17 | % | ||||||||||
| Non-performing assets as a percent of total assets |
1.49 | 1.07 | 0.51 | 0.56 | 0.81 | |||||||||||||||
| Allowance for loan losses as a percent of non-performing loans as of end of period |
63.9 | 99.4 | 162.35 | 191.03 | 96.18 | |||||||||||||||
| Allowance for loan losses as a percent of net loans as of end of period |
1.52 | 1.38 | 1.15 | 1.04 | 1.12 | |||||||||||||||
| Capital Ratios: (5) (7) |
||||||||||||||||||||
| Tier 1 risk-based capital ratio |
12.54 | % | 12.91 | % | 11.61 | % | 16.94 | % | 20.84 | % | ||||||||||
| Leverage capital ratio |
11.66 | 9.94 | 8.74 | 11.96 | 14.17 | |||||||||||||||
| Total risk-based capital ratio |
13.48 | 13.96 | 12.43 | 17.85 | 21.88 | |||||||||||||||
| (1) | With the exception of end-of-period ratios, all ratios are based on average monthly balances during the respective periods. |
| (2) | Average interest rate spread represents the difference between the average yield on interest-earning assets and the average rate paid on interest-bearing liabilities. |
| (3) | Net interest margin represents net interest income as a percentage of average interest-earning assets. Taxable equivalent yields are calculated using a marginal tax rate of 35%. |
18
Table of Contents
| (4) | The efficiency ratio represents noninterest expense as a percentage of total revenues. Total revenues is the sum of net interest income and noninterest income. |
| (5) | Asset quality and capital ratios are end of period ratios. |
| (6) | Asset quality ratios represent legacy non-performing assets. At December 31, 2017, 2016, 2015, 2014 and 2013, we also had $2.7 million, $1.5 million, $2.6 million, $4.3 million and $7.3 million, respectively, of acquired nonimpaired loans, which were on nonaccrual or 90 days or more past due which are not included in the table above. In addition, not included in the table above $584,000, $2.2 million, $3.0 million, $3.4 million, and $4.5 million, respectively, in acquired assets which were repossessed assets at December 31, 2017, 2016, 2015, 2014 and 2013, respectively, and which are excluded from the asset quality ratios above. See page 26 for the asset quality ratios including acquired nonimpaired loans and acquired repossessed assets. Nonperforming loans consist of nonaccruing loans and loans 90 days or more past due excluding acquired loans. Nonperforming assets consist of nonperforming loans and repossessed assets. It is our policy to cease accruing interest on all loans 90 days or more past due. Repossessed assets consist of assets acquired through foreclosure or acceptance of title in-lieu of foreclosure. For information on our asset quality ratios, see page 26. |
| (7) | Capital ratios are for Home Bank only. |
| (8) | Tangible calculation eliminates goodwill, core deposit intangible and the corresponding amortization expense, net of tax. |
| (9) | Tangible calculation eliminates goodwill and core deposit intangible. |
This discussion and analysis contains financial information prepared other than in accordance with generally accepted accounting principles (“GAAP”). The Company uses these non-GAAP financial measures in its analysis of the Company’s performance. Management believes that the non-GAAP information provides useful data in understanding the Company’s operations and in comparing the Company’s results to peers. This non-GAAP information should be considered in addition to the Company’s financial information prepared in accordance with GAAP, and is not a substitute for, or superior to, GAAP results. A reconciliation of GAAP to non-GAAP disclosures is included in the table below.
Non-GAAP Reconciliation
| As of or For the Years Ended December 31, | ||||||||||||||||||||
| (dollars in thousands, except per share data) |
2017 | 2016 | 2015 | 2014 | 2013 | |||||||||||||||
| Book value per common share |
$ | 29.57 | $ | 24.47 | $ | 22.80 | $ | 21.64 | $ | 19.99 | ||||||||||
| Less: Intangibles |
7.24 | 1.74 | 2.12 | 0.60 | 0.27 | |||||||||||||||
|
|
|
|
|
|
|
|
|
|
|
|||||||||||
| Tangible book value per common share |
22.33 | 22.73 | 20.68 | 21.04 | 19.72 | |||||||||||||||
|
|
|
|
|
|
|
|
|
|
|
|||||||||||
| Net Income |
16,824 | 16,008 | 12,550 | 9,872 | 7,294 | |||||||||||||||
| Add: CDI amortization, net of tax |
496 | 521 | 483 | 715 | 331 | |||||||||||||||
|
|
|
|
|
|
|
|
|
|
|
|||||||||||
| Non-GAAP tangible income |
17,320 | 16,529 | 13,033 | 10,587 | 7,625 | |||||||||||||||
|
|
|
|
|
|
|
|
|
|
|
|||||||||||
| Return on common equity |
8.63 | % | 9.19 | % | 7.83 | % | 6.65 | % | 5.14 | % | ||||||||||
| Add: Intangibles |
1.03 | 1.13 | 0.70 | 0.51 | 0.23 | |||||||||||||||
|
|
|
|
|
|
|
|
|
|
|
|||||||||||
| Return on average tangible common equity |
9.66 | 10.32 | 8.53 | 7.16 | 5.37 | |||||||||||||||
|
|
|
|
|
|
|
|
|
|
|
|||||||||||
19
Table of Contents
Item 7. Management’s Discussion and Analysis of Financial Condition and Results of Operations.
MANAGEMENT’S DISCUSSION AND ANALYSIS OF FINANCIAL CONDITION AND RESULTS OF OPERATIONS
The following is an analysis and discussion of the financial condition and results of operations of Home Bancorp, Inc. (the “Company”), and its wholly owned subsidiary, Home Bank, N.A. (the “Bank”). This discussion and analysis should be read in conjunction with our Consolidated Financial Statements and related notes included herein in Part II, Item 8, “Financial Statements and Supplementary Data” and the description of our business included herein in Part 1, Item 1 “Business”.
EXECUTIVE OVERVIEW
Net income for 2017 totaled $16.8 million, an increase of 5.1% from the $16.0 million earned in 2016. Diluted earnings per share for 2017 were $2.28, an increase of 1.3% from the $2.25 earned in 2016. Key components of the Company’s performance in 2017 are summarized below.
The Company’s financial condition and income as of and for the period ended December 31, 2017 were impacted by the acquisition of St. Martin Bancshares, Inc. (“SMB”), the holding company for St. Martin Bank & Trust Company (“St. Martin Bank”) of St. Martinville, Louisiana, on December 6, 2017. As a result of the acquisition, the Company acquired assets of $592.7 million, which included loans of $439.9 million, and $559.2 million in deposits and other liabilities. Shareholders of SMB received 9.2839 shares of Home Bancorp common stock for each share of SMB common stock. In addition, immediately prior to the closing of the merger, SMB paid a special cash distribution of $94.00 per share to its shareholders. The Company incurred $1.1 million in pre-tax merger-related expenses during the year ended December 31, 2017. See Note 3 to the Consolidated Financial Statements for additional information regarding the acquisition of SMB.
| • | Assets totaled $2.2 billion as of December 31, 2017, up $671.4 million, or 43.1%, from December 31, 2016. The increase was primarily the result of the SMB acquisition. |
| • | Total loans as of December 31, 2017 were $1.7 billion, an increase of $430.0 million, or 35.0%, from December 31, 2016. The increase in loans was primarily driven by the SMB acquisition. During 2017, growth in our originated loan portfolio was primarily related to commercial real estate and residential mortgage loans, which was more than offset by decreases in our acquired loan portfolios. |
| • | Net office properties and equipment as of December 31, 2017 were $45.6 million, an increase of $6.0 million, or 15.3%, from December 31, 2016. The Company began 2017 with 29 banking offices and subsequently closed a banking center in Vicksburg, Mississippi during 2017. The acquisition of 12 SMB locations increased our total number of banking offices to 40. |
| • | Total customer deposits as of December 31, 2017 were $1.9 billion, an increase of $618.2 million, or 49.5%, from December 31, 2016. Core deposits increased $501.3 million, or 51.4%, and certificates of deposit increased $116.9 million, or 42.9%, during 2017. The SMB acquisition added $533.5 million in deposits at the acquisition date. Excluding the deposits assumed from SMB, core deposits increased $61.3 million, or 6.3%, while certificates of deposit increased $23.3 million, or 8.6%. |
| • | Interest income increased $6.7 million, or 9.9%, in 2017 compared to 2016. The increase was primarily due to an increase in accretion income of $3.1 million and a higher average volume of interest-earning assets. |
| • | Interest expense increased $1.3 million, or 24.3%, in 2017 compared to 2016. The increase was primarily due to a higher average volume of interest-bearing deposits. |
| • | The provision for loan losses totaled $2.3 million in 2017, 27.6% lower than the $3.2 million recorded in 2016. At December 31, 2017, the Company’s ratio of allowance for loan losses to total loans was 0.89%, compared to 1.02% at December 31, 2016. The ratio of the allowance for loan losses to total originated loans was 1.52% at December 31, 2017, compared to 1.38% at December 31, 2016. |
20
Table of Contents
| • | Noninterest income decreased $1.2 million, or 10.7%, in 2017 compared to 2016. The decrease was primarily the result of a loss on the closure of a banking center during 2017 compared to a gain on the sale of a banking center in the previous year (down $758,000), lower gains on the sale of mortgage loans (down $574,000) and lower other noninterest income (down $442,000 primarily due to less recoveries on previously charged off acquired loans), which were partially offset with higher bank card fees (up $400,000). |
| • | Noninterest expense decreased $620,000, or 1.3%, in 2017 compared to 2016. The Company incurred $1.1 million and $856,000 in merger-related expenses during 2017 and 2016, respectively. Excluding merger-related expenses, noninterest expense decreased $849,000, or 1.8%. The decrease was primarily the result of reduced foreclosed assets expenses (down $437,000), other expenses (down $380,000), data processing and communications (down $239,000) and occupancy (down $176,000), which were partially offset by higher compensation and benefits (up $458,000). |
| • | Income tax expense increased by $4.9 million, or 65.1%, to $12.5 million in 2017 compared to $7.6 million in 2016. The primary reason for the increase in income tax expense in 2017 was a re-measurement charge of $2.7 million of the Company’s deferred tax asset (“DTA”) related to the recently enacted Tax Cuts and Jobs Act of 2017 (the “Tax Act”). The Tax Act reduced the federal corporate tax rate and necessitated a re-measurement of the Company’s DTA reflecting lower future tax benefits due to the lower corporate tax rate. |
ACQUISITION ACTIVITY
The Company has completed five acquisitions since 2010. The following table is a summary of the Company’s acquisition activity as recorded.
SUMMARY OF ACQUISITION ACTIVITY
| (dollars in thousands) | ||||||||||||||||||||||||
| Acquisition |
Acquisition Date |
Total Assets | Total Loans | Goodwill | Core Deposit Intangible |
Total Deposits |
||||||||||||||||||
| Statewide Bank |
03/12/2010 | $ | 188,026 | $ | 110,415 | $ | 560 | $ | 1,429 | $ | 206,925 | |||||||||||||
| GS Financial Corporation |
07/15/2011 | 256,677 | 182,440 | 296 | 859 | 193,518 | ||||||||||||||||||
| Britton & Koontz Capital Corporation |
02/14/2014 | 298,930 | 161,581 | 43 | 3,030 | 216,600 | ||||||||||||||||||
| Louisiana Bancorp, Inc. |
09/15/2015 | 352,897 | 281,583 | 8,454 | 1,586 | 208,670 | ||||||||||||||||||
| St. Martin Bancshares, Inc. |
12/06/2017 | 592,666 | 439,872 | 49,268 | 6,766 | 533,497 | ||||||||||||||||||
|
|
|
|
|
|
|
|
|
|
|
|||||||||||||||
| Total Acquisitions |
$ | 1,689,196 | $ | 1,175,891 | $ | 58,621 | $ | 13,670 | $ | 1,359,210 | ||||||||||||||
|
|
|
|
|
|
|
|
|
|
|
|||||||||||||||
CRITICAL ACCOUNTING POLICIES
The accounting and financial reporting policies of the Company conform to generally accepted accounting principles in the United States (“GAAP”) and to general practices within the banking industry. Accordingly, the financial statements require certain estimates, judgments and assumptions, which are believed to be reasonable, based upon the information available. These estimates and assumptions affect the reported amounts of assets and liabilities as of the date of the financial statements and the reported amounts of income and expenses during the periods presented. The following accounting policies comprise those that management believes are the most critical to aid in fully understanding and evaluating our reported financial results. These policies require numerous estimates or economic assumptions that may prove inaccurate or may be subject to variations which may significantly affect our reported results and financial condition for the period or in future periods.
Allowance for Loan Losses. The allowance for loan losses on loans in our portfolio is maintained at an amount which management determines covers the reasonably estimable and probable losses on such portfolio. The allowance for loan losses is established through a provision for loan losses charged to expense. Loans are charged
21
Table of Contents
against the allowance for loan losses when management believes that the collectability of the principal is unlikely. Subsequent recoveries are added to the allowance. The allowance is an amount that represents the amount of probable and reasonably estimable known and inherent losses in the loan portfolio, based on evaluations of the collectability of loans. The evaluations take into consideration such factors as changes in the types and amount of loans in the loan portfolio, historical loss experience, adverse situations that may affect the borrower’s ability to repay, estimated value of any underlying collateral, estimated losses relating to specifically identified loans and current economic conditions. This evaluation is inherently subjective as it requires material estimates including, among others, exposure to default, the amount and timing of expected future cash flows on loans, value of collateral, estimated losses on our commercial and residential loan portfolios as well as consideration of general loss experience. All of these estimates may be susceptible to significant change.
While management uses the best information available to make loan loss allowance evaluations, adjustments to the allowance may be necessary based on changes in economic and other conditions or changes in accounting guidance. The OCC, as an integral part of its examination processes, periodically reviews our allowance for loan losses. The OCC may require the recognition of adjustments to the allowance for loan losses based on their judgment of information available to them at the time of their examinations. To the extent that actual outcomes differ from management’s estimates, additional provisions to the allowance for loan losses may be required that would adversely impact earnings in future periods. As part of the risk management program, an independent review is performed on the loan portfolio, which supplements management’s assessment of the loan portfolio and the allowance for loan losses. The result of the independent review is reported directly to the Audit Committee of the Board of Directors.
Acquired loans were recorded at fair value at the date of acquisition with no carryover of the allowance for loan losses. As of December 31, 2017, our allowance for loan losses included $504,000 allocated to Acquired Loans since the date of acquisition. Our accounting policy for Acquired Loans is described below.
Accounting for Loans. The following describes the distinction between originated and Acquired Loans and certain significant accounting policies relevant to each category.
Originated Loans
Loans originated for investment are reported at the principal balance outstanding net of unearned income. Interest on loans and accretion of unearned income are computed in a manner that approximates a level yield on recorded principal. Interest on loans is recorded as income as earned. The accrual of interest on an originated loan is discontinued when it is probable the borrower will not be able to meet payment obligations as they become due. The Company maintains an allowance for loan losses on originated loans that represents management’s estimate of probable losses incurred in this portfolio category.
Acquired Loans
Acquired Loans are those collectively associated with our acquisitions of Statewide, GSFC, Britton & Koontz, BNO and SMB. These loans were recorded at estimated fair value at the acquisition date with no carryover of the related allowance for loan losses. The Acquired Loans were segregated as of the date of acquisition between those considered to be performing (“acquired performing”) and those with evidence of credit deterioration (“acquired impaired”), and then further segregated into loan pools designed to facilitate the estimation of expected cash flows. The fair value estimate for each pool of acquired performing and acquired impaired loans was based on the estimate of expected cash flows, both principal and interest, from that pool, discounted at prevailing market interest rates.
The difference between the fair value of an acquired performing loan pool and the contractual amounts due at the acquisition date (the “fair value discount”) is accreted into income over the estimated life of the pool. Management estimates an allowance for loan losses for acquired performing loans using a methodology similar to that used for originated loans. The allowance determined for each loan pool is compared to the remaining fair value discount for that pool. If the allowance amount calculated under the Company’s methodology is greater than the Company’s remaining discount, the additional amount called for is added to the reported allowance through a provision for loan losses. If the allowance amount calculated under the Company’s methodology is less than the Company’s recorded discount, no additional allowance or provision is recognized. Actual losses first reduce any remaining fair value discount for the loan pool. Once the discount is fully depleted, losses are applied against the allowance established for that pool. Acquired performing loans are placed on nonaccrual status and considered and reported as nonperforming or past due using the same criteria applied to the originated portfolio.
22
Table of Contents
The excess of cash flows expected to be collected from an acquired impaired loan pool over the pool’s estimated fair value at acquisition is referred to as the accretable yield and is recognized in interest income using an effective yield method over the remaining life of the pool. Each pool of acquired impaired loans is accounted for as a single asset with a single composite interest rate and an aggregate expectation of cash flows.
Management recasts the estimate of cash flows expected to be collected on each acquired impaired loan pool periodically. If the present value of expected cash flows for a pool is less than its carrying value, an impairment is recognized by an increase in the allowance for loan losses and a charge to the provision for loan losses. If the present value of expected cash flows for a pool is greater than its carrying value, any previously established allowance for loan losses is reversed and any remaining difference increases the accretable yield which will be taken into interest income over the remaining life of the loan pool. Acquired impaired loans are generally not subject to individual evaluation for impairment and are not reported with impaired loans, even if they would otherwise qualify for such treatment.
Business Combinations. Assets and liabilities acquired in business combinations are recorded at their fair value. In accordance with ASC Topic 805, Business Combinations, the Company generally records provisional amounts at the time of acquisition based on the information available to the Company. The provisional estimates of fair values may be adjusted for a period of up to one year (“measurement period”) from the date of acquisition if new information is obtained. Subsequently, adjustments recorded during the measurement period are recognized in the current reporting period.
Income Taxes. We make estimates and judgments to calculate some of our tax liabilities and determine the recoverability of some of our deferred tax assets (“DTA”), which arise from temporary differences between the tax and financial statement recognition of revenues and expenses and enacted changes in tax rates and laws are recognized in the period in which they occur. We also estimate a valuation allowance for deferred tax assets if, based on the available evidence, it is more likely than not that some portion or all of the recorded deferred tax assets will not be realized in future periods. These estimates and judgments are inherently subjective. Historically, our estimates and judgments to calculate our deferred tax accounts have not required significant revision to our initial estimates.
In evaluating our ability to recover deferred tax assets, we consider all available positive and negative evidence, including our past operating results, recent cumulative losses and our forecast of future taxable income. In determining future taxable income, we make assumptions for the amount of taxable income, the reversal of temporary differences and the implementation of feasible and prudent tax planning strategies. These assumptions require us to make judgments about our future taxable income and are consistent with the plans and estimates we use to manage our business. Any reduction in estimated future taxable income may require us to record a valuation allowance against our deferred tax assets. An increase in the valuation allowance would result in additional income tax expense in the period and could have a significant impact on our future earnings.
Other-than-temporary Impairment of Investment Securities. Securities are evaluated periodically to determine whether a decline in their fair value is other-than-temporary. The term “other-than-temporary” is not intended to indicate a permanent decline in value. Rather, it means that the prospects for near term recovery of value are not necessarily favorable, or that there is a lack of evidence to support fair values equal to, or greater than, the carrying value of the investment. Management reviews criteria such as the magnitude and duration of the decline, the reasons for the decline and the performance and valuation of the underlying collateral, when applicable, to predict whether the loss in value is other-than-temporary and the intent and ability of the Company to retain the investment for a period of time sufficient to allow for any anticipated recovery in fair value. Once a decline in value is determined to be other-than-temporary, the carrying value of the security is reduced to its fair value and a corresponding charge to earnings is recognized for the decline in value determined to be credit related. The decline in value attributable to noncredit factors is recognized in other comprehensive income.
Stock-based Compensation. The Company accounts for its stock options in accordance with ASC Topic 718, Compensation – Stock Compensation. ASC 718 requires companies to expense the fair value of employee stock options and other forms of stock-based compensation. Management utilizes the Black-Scholes option valuation model to estimate the fair value of stock options. The option valuation model requires the input of highly subjective assumptions, including expected stock price volatility and option life. These subjective input assumptions materially affect the fair value estimate.
23
Table of Contents
FINANCIAL CONDITION
Loans, Loan Quality and Allowance for Loan Losses
Loans – The types of loans originated by the Company are subject to federal and state laws and regulations. Interest rates charged on loans are affected principally by the demand for such loans and the supply of money available for lending purposes and the rates offered by our competitors. These factors are, in turn, affected by general and economic conditions, the monetary policy of the federal government, including the FRB, legislative tax policies and governmental budgetary matters.
The Company’s lending activities are subject to underwriting standards and loan origination procedures established by our Board of Directors and management. Loan originations are obtained through a variety of sources, primarily existing customers as well as new customers obtained from referrals and local advertising and promotional efforts. Single-family residential mortgage loan applications and consumer loan applications are taken at any of the Bank’s branch offices. Applications for other loans typically are taken personally by one of our loan officers, although they may be received by a branch office initially and then referred to a loan officer. All loan applications are processed and underwritten centrally at the Bank’s main office.
The following table shows the composition of the Company’s loan portfolio as of the dates indicated.
| December 31, | ||||||||||||||||||||
| (dollars in thousands) |
2017 | 2016 | 2015 | 2014 | 2013 | |||||||||||||||
| Real estate loans: |
||||||||||||||||||||
| One- to four-family first mortgage |
$ | 477,211 | $ | 341,883 | $ | 371,238 | $ | 222,157 | $ | 164,673 | ||||||||||
| Home equity loans and lines |
94,445 | 88,821 | 94,060 | 56,000 | 40,561 | |||||||||||||||
| Commercial real estate |
611,358 | 427,515 | 405,379 | 352,863 | 269,849 | |||||||||||||||
| Construction and land |
177,263 | 141,167 | 136,803 | 100,246 | 98,104 | |||||||||||||||
| Multi-family residential |
50,978 | 46,369 | 43,863 | 27,375 | 16,578 | |||||||||||||||
|
|
|
|
|
|
|
|
|
|
|
|||||||||||
| Total real estate loans |
1,411,255 | 1,045,755 | 1,051,343 | 758,641 | 589,765 | |||||||||||||||
|
|
|
|
|
|
|
|
|
|
|
|||||||||||
| Other loans: |
||||||||||||||||||||
| Commercial and industrial |
185,284 | 139,810 | 125,108 | 104,446 | 77,533 | |||||||||||||||
| Consumer |
61,256 | 42,268 | 47,915 | 45,881 | 40,158 | |||||||||||||||
|
|
|
|
|
|
|
|
|
|
|
|||||||||||
| Total other loans |
246,540 | 182,078 | 173,023 | 150,327 | 117,691 | |||||||||||||||
|
|
|
|
|
|
|
|
|
|
|
|||||||||||
| Total loans |
$ | 1,657,795 | $ | 1,227,833 | $ | 1,224,366 | $ | 908,968 | $ | 707,456 | ||||||||||
|
|
|
|
|
|
|
|
|
|
|
|||||||||||
The loan portfolio increased $430.0 million, or 35.0%, during 2017. The increase includes loans acquired from SMB, which were recorded at their fair value of $439.9 million as of the acquisition date. Growth in our originated loan portfolio during the year was primarily related to commercial real estate and residential mortgage loans, which were largely offset by decreases in our Acquired Loan portfolios. The balance of loans to companies in the energy sector totaled $58.8 million, or 3.5%, of our outstanding loan portfolio at December 31, 2017. In addition to outstanding loans at December 31, 2017, we also had unfunded loan commitments to companies in the energy sector amounting to $9.3 million at such date. The acquisition of SMB added $30.1 million of direct loans to borrowers in the energy sector and $3.8 million in unfunded loan commitments to such customers at the acquisition date.
The following table reflects contractual loan maturities as of December 31, 2017, unadjusted for scheduled principal reductions, prepayments or repricing opportunities. Of the $1.3 billion in loans which have contractual maturity dates subsequent to December 31, 2018, $1.0 billion have fixed interest rates and $276.2 million have floating or adjustable interest rates.
24
Table of Contents
| Due In | ||||||||||||||||
| (dollars in thousands) |
One year or less |
One through five years |
More than five years |
Total | ||||||||||||
| One- to four-family first mortgage |
$ | 32,122 | $ | 116,140 | $ | 328,949 | $ | 477,211 | ||||||||
| Home equity loans and lines |
4,542 | 11,368 | 78,535 | 94,445 | ||||||||||||
| Commercial real estate |
90,387 | 355,367 | 165,604 | 611,358 | ||||||||||||
| Construction and land |
130,234 | 37,508 | 9,521 | 177,263 | ||||||||||||
| Multi-family residential |
12,851 | 26,461 | 11,666 | 50,978 | ||||||||||||
| Commercial and industrial |
90,312 | 76,626 | 18,346 | 185,284 | ||||||||||||
| Consumer |
5,975 | 24,073 | 31,208 | 61,256 | ||||||||||||
|
|
|
|
|
|
|
|
|
|||||||||
| Total |
$ | 366,423 | $ | 647,543 | $ | 643,829 | $ | 1,657,795 | ||||||||
|
|
|
|
|
|
|
|
|
|||||||||
Loan Quality – One of management’s key objectives has been, and continues to be, maintaining a high level of asset quality. In addition to maintaining credit standards for new loan originations, we proactively monitor loans and collection and workout processes of delinquent or problem loans. When a borrower fails to make a scheduled payment, we attempt to cure the deficiency by making personal contact with the borrower. Initial contacts are generally made within 10 days after the date the payment is due. In most cases, deficiencies are promptly resolved. If the delinquency continues, late charges are assessed and additional efforts are made to collect the deficiency. All loans which are designated as “special mention,” classified or which are delinquent 90 days or more are reported to the Board of Directors of the Bank monthly. For loans where the collection of principal or interest payments is doubtful, the accrual of interest income ceases. It is our policy, with certain limited exceptions, to discontinue accruing interest and reverse any interest accrued on any loan which is 90 days or more past due. On occasion, this action may be taken earlier if the financial condition of the borrower raises significant concern with regard to his/her ability to service the debt in accordance with the terms of the loan agreement. Interest income is not accrued on these loans until the borrower’s financial condition and payment record demonstrate an ability to service the debt.
An impaired loan generally is one for which it is probable, based on current information, that the lender will not collect all the amounts due under the contractual terms of the loan. Large groups of smaller balance, homogeneous loans are collectively evaluated for impairment. Loans collectively evaluated for impairment include smaller balance commercial loans, residential real estate loans and consumer loans. These loans are evaluated as a group because they have similar characteristics and performance experience. Larger commercial real estate, multi-family residential, construction and land loans and commercial and industrial loans are individually evaluated for impairment. Third party property valuations are obtained at the time of origination for real estate secured loans. When a determination is made that a loan has deteriorated to the point of becoming a problem loan, updated valuations may be ordered to help determine if there is impairment, which may lead to a recommendation for partial charge off or appropriate allowance allocation. Property valuations are ordered through, and are reviewed by, an appraisal officer. The Company typically orders an “as is” valuation for collateral property if the loan is in a criticized loan classification. The Board of Directors is provided with monthly reports on impaired loans. As of December 31, 2017 and 2016, loans identified as impaired and individually evaluated for impairment, excluding Acquired Loans, amounted to $3.5 million and $5.6 million, respectively. As of December 31, 2017 and 2016, acquired impaired loans, which are loans considered to have had deteriorated credit quality at the time of acquisition, amounted to $14.2 million and $13.1 million, respectively. As of December 31, 2017 and 2016, substandard loans, excluding Acquired Loans, amounted to $27.0 million and $23.8 million, respectively. As of December 31, 2017 and 2016, Acquired Loans considered substandard amounted to $20.3 million and $8.6 million, respectively. The increase in acquired substandard loans during 2017 primarily resulted from the acquisition of SMB. The amount of the allowance for loan losses allocated to originated impaired loans totaled $2.0 million and $795,000 as of December 31, 2017 and 2016, respectively. The amount of allowance for loan losses allocated to Acquired Loans totaled $504,000 and $291,000, respectively, at such dates. There were no assets classified as doubtful or loss as of December 31, 2017 or 2016.
Federal regulations and our policies require that we utilize an internal asset classification system as a means of reporting problem and potential problem assets. We have incorporated an internal asset classification system, substantially consistent with Federal banking regulations, as a part of our credit monitoring system. Federal banking
25
Table of Contents
regulations set forth a classification scheme for problem and potential problem assets as “substandard,” “doubtful” or “loss” assets. An asset is considered “substandard” if it is inadequately protected by the current net worth and paying capacity of the obligor or of the collateral pledged, if any. “Substandard” assets include those characterized by the “distinct possibility” that the insured institution will sustain “some loss” if the deficiencies are not corrected. Assets classified as “doubtful” have all of the weaknesses inherent in those classified “substandard” with the added characteristic that the weaknesses present make “collection or liquidation in full,” on the basis of currently existing facts, conditions and values, “highly questionable and improbable.” Assets classified as “loss” are those considered “uncollectible” and of such little value that their continuance as assets without the establishment of a specific loss reserve is not warranted. As of December 31, 2017 and 2016, we had a total of $47.3 million and $32.4 million, respectively, in assets classified as substandard. We had no assets classified as doubtful at either date. For additional information, see Note 5 to the Consolidated Financial Statements.
A bank’s determination as to the classification of its assets and the amount of its valuation allowances is subject to review by Federal bank regulators which can order the establishment of additional general or specific loss allowances. The Federal banking agencies have adopted an interagency policy statement on the allowance for loan and lease losses. The policy statement provides guidance for financial institutions on both the responsibilities of management for the assessment and establishment of allowances and guidance for banking agency examiners to use in determining the adequacy of general valuation guidelines. Generally, the policy statement recommends that institutions have effective systems and controls to identify, monitor and address asset quality problems; that management analyze all significant factors that affect the collectability of the portfolio in a reasonable manner; and that management establish acceptable allowance evaluation processes that meet the objectives set forth in the policy statement. Our management believes that, based on information currently available, our allowance for loan losses is maintained at a level which covers all known and inherent losses that are both probable and reasonably estimable as of each reporting date. However, actual losses are dependent upon future events and, as such, further additions to the level of allowances for loan losses may become necessary.
The following table sets forth the composition of the Company’s total nonperforming assets and troubled debt restructurings, excluding acquired impaired loans, as of the dates indicated.
| December 31, | ||||||||||||||||||||
| (dollars in thousands) |
2017 | 2016 | 2015 | 2014 | 2013 | |||||||||||||||
| Nonaccrual loans (1): |
||||||||||||||||||||
| Real estate loans: |
||||||||||||||||||||
| One- to four-family first mortgage |
$ | 3,173 | $ | 1,724 | $ | 1,458 | $ | 2,894 | $ | 4,196 | ||||||||||
| Home equity loans and lines |
1,542 | 1,088 | 260 | 136 | 325 | |||||||||||||||
| Commercial real estate |
8,757 | 1,963 | 2,684 | 1,291 | 2,678 | |||||||||||||||
| Construction and land |
449 | 75 | 156 | 742 | 1,265 | |||||||||||||||
| Multi-family residential |
— | — | 763 | 1,560 | 1,572 | |||||||||||||||
| Other loans: |
||||||||||||||||||||
| Commercial and industrial |
10,610 | 8,542 | 2,458 | 1,210 | 3,881 | |||||||||||||||
| Consumer |
502 | 361 | 476 | 359 | 277 | |||||||||||||||
|
|
|
|
|
|
|
|
|
|
|
|||||||||||
| Total nonaccrual loans |
25,033 | 13,753 | 8,255 | 8,192 | 14,194 | |||||||||||||||
| Accruing loans 90 days or more past due |
— | — | — | — | — | |||||||||||||||
|
|
|
|
|
|
|
|
|
|
|
|||||||||||
| Total nonperforming loans |
25,033 | 13,753 | 8,255 | 8,192 | 14,194 | |||||||||||||||
| Foreclosed property |
728 | 2,893 | 3,128 | 5,215 | 4,566 | |||||||||||||||
|
|
|
|
|
|
|
|
|
|
|
|||||||||||
| Total nonperforming assets |
25,761 | 16,646 | 11,383 | 13,407 | 18,760 | |||||||||||||||
| Performing troubled debt restructurings |
2,536 | 4,650 | 2,549 | 1,860 | 3,468 | |||||||||||||||
|
|
|
|
|
|
|
|
|
|
|
|||||||||||
| Total nonperforming assets and troubled debt restructurings |
$ | 28,297 | $ | 21,296 | $ | 13,932 | $ | 15,267 | $ | 22,228 | ||||||||||
|
|
|
|
|
|
|
|
|
|
|
|||||||||||
| Nonperforming loans to total loans |
1.51 | % | 1.12 | % | 0.67 | % | 0.90 | % | 2.01 | % | ||||||||||
| Nonperforming loans to total assets |
1.12 | % | 0.88 | % | 0.53 | % | 0.67 | % | 1.44 | % | ||||||||||
| Nonperforming assets to total assets |
1.16 | % | 1.07 | % | 0.73 | % | 1.10 | % | 1.91 | % | ||||||||||
| (1) | Table excludes Acquired Loans which were being accounted for under ASC 310-30 because they continue to earn interest from accretable yield regardless of their status as past due or otherwise not in compliance with their contractual terms. Acquired Loans with deteriorated credit quality, which were being accounting for under ASC 310-30 and which were 90 days or more past due totaled, $4.3 million, $2.7 million, $4.0 million, $5.4 million and $7.8 million as of December 31, 2017, 2016, 2015, 2014 and 2013, respectively. |
26
Table of Contents
Total nonaccrual loans increased by $11.3 million, or 82.0%, to $25.0 million at December 31, 2017, compared to $13.8 million at December 31, 2016. The ratio of non-performing loans to total assets was 1.12% at December 31, 2017, compared to 0.88% at December 31, 2016. The primary reasons for the increase in nonaccrual loans in 2017 were increases of $6.9 million in originated commercial real estate loans and $1.4 million in originated commercial and industrial loans. The increase in nonaccrual originated commercial real estate loans in 2017 was due primarily to one loan secured by a real estate located in the Northshore market. The increase in nonaccrual originated commercial and industrial loans in 2017 was due primarily to two loans secured by equipment and accounts receivable.
Net loan charge-offs for 2017 were $21,000, compared to $237,000 in 2016.
Repossessed assets which are acquired as a result of foreclosure are classified as repossessed assets until sold. Third party property valuations are obtained at the time the asset is repossessed and periodically until the property is liquidated. Repossessed assets are recorded at fair value less estimated selling costs, at the date acquired or upon receiving new property valuations. Costs associated with acquiring and improving a foreclosed property are usually capitalized to the extent that the carrying value does not exceed fair value less estimated selling costs. Holding costs are charged to expense. Gains and losses on the sale of repossessed assets are charged to operations, as incurred. At December 31, 2017, repossessed assets totaled $728,000, a decrease of $2.2 million, or 74.8%, compared to $2.9 million at December 31, 2016.
Allowance for Loan Losses – The allowance for loan losses is established through provisions for loan losses. The Company maintains the allowance at a level believed, to the best of management’s knowledge, to cover all known and inherent losses in the portfolio that are both probable and reasonable to estimate at each reporting date. Management reviews the allowance for loan losses at least quarterly in order to identify those inherent losses and to assess the overall collection probability for the loan portfolio. Our evaluation process includes, among other things, an analysis of delinquency trends, nonperforming loan trends, the level of charge-offs and recoveries, prior loss experience, total loans outstanding, the volume of loan originations, the type, size and geographic concentration of loans, the value of collateral securing loans, the borrower’s ability to repay and repayment performance, the number of loans requiring heightened management oversight, economic conditions and industry experience. Based on this evaluation, management assigns risk rankings to segments of the loan portfolio. Such risk ratings are periodically reviewed by management and revised as deemed appropriate. These efforts are supplemented by independent reviews and validations performed by an independent loan reviewer. The results of the reviews are reported directly to the Audit Committee of the Board of Directors. The establishment of the allowance for loan losses is significantly affected by management judgment and uncertainties and there is a likelihood that different amounts would be reported under different conditions or assumptions. Federal regulatory agencies, as an integral part of their examination process, periodically review our allowance for loan losses. Such agencies may require management to make additional provisions for estimated loan losses based upon judgments different from those of management.
With respect to Acquired Loans, the Company follows the reserve standard set forth in ASC 310, Receivables. At acquisition, the Company reviews each loan to determine whether there is evidence of deterioration in credit quality since origination and if it is probable that the Company will be unable to collect all amounts due according to the loan’s contractual terms. The Company considers expected prepayments and estimates the amount and timing of undiscounted expected principal, interest and other cash flows for each loan pool meeting the criteria above, and determines the excess of the loan pool’s scheduled contractual principal and interest payments in excess of cash flows expected at acquisition as an amount that should not be accreted (nonaccretable difference). The remaining amount, representing the excess of the pool’s cash flows expected to be collected over the fair value, is accreted into interest income over the remaining life of the pool (accretable yield). The Company records a discount on these loans at acquisition to record them at their estimated fair values. As a result, Acquired Loans subject to ASC 310 are excluded from the calculation of the allowance for loan losses as of the acquisition date.
27
Table of Contents
Acquired Loans were recorded as of their acquisition date fair value, which was based on expected cash flows and included an estimation of expected future loan losses. Under current accounting principles, if the Company determines that losses arose after the acquisition date, the additional losses will be reflected as a provision for loan losses. As of December 31, 2017, $59,000 of the allowance for loan losses was allocated to Acquired Loans accounted for under ASC 310-30.
We will continue to monitor and modify our allowance for loan losses as conditions dictate. No assurance can be given that our level of allowance for loan losses will cover all of the inherent losses on our loans or that future adjustments to the allowance for loan losses will not be necessary if economic and other conditions differ substantially from the conditions used by management to determine the current level of the allowance for loan losses.
The following table presents the activity in the allowance for loan losses for the years indicated.
| For the Years Ended December 31, | ||||||||||||||||||||
| (dollars in thousands) |
2017 | 2016 | 2015 | 2014 | 2013 | |||||||||||||||
| Balance, beginning of year |
$ | 12,511 | $ | 9,547 | $ | 7,760 | $ | 6,918 | $ | 5,319 | ||||||||||
| Provision charged to operations |
2,317 | 3,200 | 2,071 | 2,364 | 3,653 | |||||||||||||||
| Loans charged off: |
||||||||||||||||||||
| One- to four-family first mortgage |
(29 | ) | (33 | ) | (104 | ) | (213 | ) | (112 | ) | ||||||||||
| Home equity loans and lines |
(10 | ) | (9 | ) | (27 | ) | (2 | ) | — | |||||||||||
| Commercial real estate |
(3 | ) | — | — | (41 | ) | — | |||||||||||||
| Construction and land |
— | — | (111 | ) | (19 | ) | (44 | ) | ||||||||||||
| Multi-family residential |
— | — | — | — | — | |||||||||||||||
| Commercial and industrial |
(358 | ) | (242 | ) | (190 | ) | (1,407 | ) | (1,990 | ) | ||||||||||
| Consumer |
(64 | ) | (162 | ) | (130 | ) | (32 | ) | (9 | ) | ||||||||||
| Recoveries on charged off loans |
443 | 210 | 278 | 192 | 101 | |||||||||||||||
|
|
|
|
|
|
|
|
|
|
|
|||||||||||
| Balance, end of year |
$ | 14,807 | $ | 12,511 | $ | 9,547 | $ | 7,760 | $ | 6,918 | ||||||||||
|
|
|
|
|
|
|
|
|
|
|
|||||||||||
At December 31, 2017, the ratio of allowance for loan losses to total loans was 0.89%, compared to 1.02% at December 31, 2016. The ratio declined in 2017 due to the addition of loans acquired from SMB. Excluding Acquired Loans, the ratio of allowance for loan losses to total originated loans was 1.52% at December 31, 2017, compared to 1.38% at December 31, 2016. The balance of loans to companies in the energy sector totaled $58.8 million, or 3.5%, of outstanding loans at December 31, 2017. In addition to outstanding loans at December 31, 2017, we also had unfunded loan commitments to companies in the energy sector amounting to $9.3 million at such date. The acquisition of SMB added $30.1 million of direct loans to borrowers in the energy sector and $3.8 million in unfunded loan commitments to such customers at the acquisition date. The Company remains in close contact with our energy sector borrowers, and continues to monitor economic data to assess the potential indirect impact of low energy prices on our loan portfolio.
28
Table of Contents
The following table presents the allocation of the allowance for loan losses as of December 31 of the years indicated.
| December 31, | ||||||||||||||||||||||||||||||||||||||||
| 2017 | 2016 | 2015 | 2014 | 2013 | ||||||||||||||||||||||||||||||||||||
| (dollars in thousands) |
Amount | % Loans |
Amount | % Loans |
Amount | % Loans |
Amount | % Loans |
Amount | % Loans |
||||||||||||||||||||||||||||||
| One- to four-family first mortgage |
$ | 1,663 | 28.7 | % | $ | 1,511 | 27.9 | % | $ | 1,464 | 30.3 | % | $ | 1,310 | 24.5 | % | $ | 1,088 | 23.3 | % | ||||||||||||||||||||
| Home equity loans and lines |
1,102 | 5.7 | 728 | 7.2 | 760 | 7.7 | 553 | 6.2 | 424 | 5.7 | ||||||||||||||||||||||||||||||
| Commercial real estate |
4,906 | 36.9 | 4,177 | 34.8 | 3,152 | 33.1 | 2,922 | 38.8 | 2,528 | 38.1 | ||||||||||||||||||||||||||||||
| Construction and land |
1,749 | 10.7 | 1,782 | 11.5 | 1,417 | 11.2 | 1,101 | 11.0 | 977 | 13.9 | ||||||||||||||||||||||||||||||
| Multi-family residential |
355 | 3.1 | 361 | 3.8 | 173 | 3.6 | 192 | 3.0 | 90 | 2.3 | ||||||||||||||||||||||||||||||
| Commercial and industrial |
4,530 | 11.2 | 3,439 | 11.4 | 2,010 | 10.2 | 1,161 | 11.5 | 1,338 | 11.0 | ||||||||||||||||||||||||||||||
| Consumer |
502 | 3.7 | 513 | 3.4 | 571 | 3.9 | 521 | 5.0 | 473 | 5.7 | ||||||||||||||||||||||||||||||
|
|
|
|
|
|
|
|
|
|
|
|
|
|
|
|
|
|
|
|
|
|||||||||||||||||||||
| Total |
$ | 14,807 | 100.0 | % | $ | 12,511 | 100.0 | % | $ | 9,547 | 100.0 | % | $ | 7,760 | 100.0 | % | $ | 6,918 | 100.0 | % | ||||||||||||||||||||
|
|
|
|
|
|
|
|
|
|
|
|
|
|
|
|
|
|
|
|
|
|||||||||||||||||||||
Investment Securities
The Company invests in securities pursuant to our Investment Policy, which has been approved by our Board of Directors. The Investment Policy is designed primarily to manage the interest rate sensitivity of our assets and liabilities, to generate a favorable return without incurring undue interest rate or credit risk and to provide and maintain liquidity. The Asset-Liability Committee (“ALCO”), comprised of the Chief Executive Officer, Chief Financial Officer, Chief Banking Officer, Chief Credit Officer, Director of Financial Management and Treasurer, monitors investment activity and ensures that investments are consistent with the Investment Policy. The Board of Directors of the Company reviews investment activity monthly.
The investment securities portfolio increased by an aggregate of $50.9 million, or 25.8%, during 2017. Securities available for sale made up 94.7% of the investment securities portfolio as of December 31, 2017. The following table sets forth the amortized cost and market value of our investment securities portfolio as of the dates indicated.
| December 31, | ||||||||||||||||||||||||
| 2017 | 2016 | 2015 | ||||||||||||||||||||||
| (dollars in thousands) |
Amortized Cost |
Market Value |
Amortized Cost |
Market Value |
Amortized Cost |
Market Value |
||||||||||||||||||
| Available for sale: |
||||||||||||||||||||||||
| U.S. agency mortgage-backed |
$ | 84,639 | $ | 84,690 | $ | 78,361 | $ | 78,931 | $ | 88,443 | $ | 89,637 | ||||||||||||
| Collateralized mortgage obligations |
115,435 | 113,735 | 75,193 | 74,330 | 52,360 | 51,906 | ||||||||||||||||||
| Municipal bonds |
25,362 | 25,521 | 21,212 | 21,428 | 22,453 | 22,933 | ||||||||||||||||||
| U.S. government agency |
11,026 | 11,047 | 8,946 | 9,041 | 12,166 | 12,286 | ||||||||||||||||||
|
|
|
|
|
|
|
|
|
|
|
|
|
|||||||||||||
| Total available for sale |
236,462 | 234,993 | 183,712 | 183,730 | 175,422 | 176,762 | ||||||||||||||||||
|
|
|
|
|
|
|
|
|
|
|
|
|
|||||||||||||
| Held to maturity: |
||||||||||||||||||||||||
| Municipal bonds |
13,034 | 13,055 | 13,365 | 13,362 | 13,927 | 14,121 | ||||||||||||||||||
|
|
|
|
|
|
|
|
|
|
|
|
|
|||||||||||||
| Total held to maturity |
13,034 | 13,055 | 13,365 | 13,362 | 13,927 | 14,121 | ||||||||||||||||||
|
|
|
|
|
|
|
|
|
|
|
|
|
|||||||||||||
| Total investment securities |
$ | 249,496 | $ | 248,048 | $ | 197,077 | $ | 197,092 | $ | 189,349 | $ | 190,883 | ||||||||||||
|
|
|
|
|
|
|
|
|
|
|
|
|
|||||||||||||
29
Table of Contents
The following table sets forth the fixed versus adjustable rate profile of the investment securities portfolio as of the dates indicated. All amounts are shown at amortized cost.
| December 31, | ||||||||||||
| (dollars in thousands) |
2017 | 2016 | 2015 | |||||||||
| Fixed rate: |
||||||||||||
| Available for sale |
$ | 204,143 | $ | 151,074 | $ | 133,700 | ||||||
| Held to maturity |
13,034 | 13,365 | 13,927 | |||||||||
|
|
|
|
|
|
|
|||||||
| Total fixed rate |
217,177 | 164,439 | 147,627 | |||||||||
|
|
|
|
|
|
|
|||||||
| Adjustable rate: |
||||||||||||
| Available for sale |
32,319 | 32,638 | 41,722 | |||||||||
| Held to maturity |
— | — | — | |||||||||
|
|
|
|
|
|
|
|||||||
| Total adjustable rate |
32,319 | 32,638 | 41,722 | |||||||||
|
|
|
|
|
|
|
|||||||
| Total investment securities |
$ | 249,496 | $ | 197,077 | $ | 189,349 | ||||||
|
|
|
|
|
|
|
|||||||
The following table sets forth the amount of investment securities which mature during each of the periods indicated and the weighted average yields for each range of maturities as of December 31, 2017. No tax-exempt yields have been adjusted to a tax-equivalent basis. All amounts are shown at amortized cost.
| Amounts as of December 31, 2017 which mature in: | ||||||||||||||||||||
| (dollars in thousands) |
One Year or Less |
One Year to Five Years |
Five to Ten Years |
Over Ten Years |
Total | |||||||||||||||
| Available for sale: |
||||||||||||||||||||
| U.S. agency mortgage-backed |
$ | 2,346 | $ | 8,506 | $ | 38,990 | $ | 34,797 | $ | 84,639 | ||||||||||
| Non-U.S. agency mortgage-backed |
— | 6,181 | 11,655 | 97,599 | 115,435 | |||||||||||||||
| Municipal bonds |
2,779 | 11,430 | 7,752 | 3,401 | 25,362 | |||||||||||||||
| U.S. government agency |
999 | 3,997 | 4,320 | 1,710 | 11,026 | |||||||||||||||
|
|
|
|
|
|
|
|
|
|
|
|||||||||||
| Total available for sale |
6,124 | 30,114 | 62,717 | 137,507 | 236,462 | |||||||||||||||
|
|
|
|
|
|
|
|
|
|
|
|||||||||||
| Weighted average yield |
3.37 | % | 3.19 | % | 2.55 | % | 2.56 | % | 2.66 | % | ||||||||||
|
|
|
|
|
|
|
|
|
|
|
|||||||||||
| Held to maturity: |
||||||||||||||||||||
| Municipal bonds |
— | 5,331 | 6,085 | 1,618 | 13,034 | |||||||||||||||
|
|
|
|
|
|
|
|
|
|
|
|||||||||||
| Total held to maturity |
— | 5,331 | 6,085 | 1,618 | 13,034 | |||||||||||||||
|
|
|
|
|
|
|
|
|
|
|
|||||||||||
| Weighted average yield |
— | % | 1.55 | % | 1.85 | % | 1.35 | % | 1.67 | % | ||||||||||
|
|
|
|
|
|
|
|
|
|
|
|||||||||||
| Total investment securities |
$ | 6,124 | $ | 35,445 | $ | 68,803 | $ | 139,124 | $ | 249,496 | ||||||||||
|
|
|
|
|
|
|
|
|
|
|
|||||||||||
| Weighted average yield |
3.37 | % | 2.94 | % | 2.48 | % | 2.54 | % | 2.60 | % | ||||||||||
|
|
|
|
|
|
|
|
|
|
|
|||||||||||
30
Table of Contents
The following table summarizes activity in the Company’s investment securities portfolio during 2017.
| (dollars in thousands) |
Available for Sale | Held to Maturity | ||||||
| Balance, December 31, 2016 |
$ | 183,730 | $ | 13,365 | ||||
| Purchases |
56,997 | — | ||||||
| Sales |
(17,040 | ) | — | |||||
| Principal maturities, prepayments and calls |
(39,607 | ) | — | |||||
| Amortization of premiums and accretion of discounts |
(1,386 | ) | (331 | ) | ||||
| Acquired from SMB, at fair value |
53,786 | |||||||
| Decrease in market value |
(1,487 | ) | — | |||||
|
|
|
|
|
|||||
| Balance, December 31, 2017 |
$ | 234,993 | $ | 13,034 | ||||
|
|
|
|
|
|||||
As of December 31, 2017, the Company had a net unrealized loss on its available for sale investment securities portfolio of $1.5 million, compared to a net unrealized gain of $18,000 as of December 31, 2016. The Company acquired $53.8 million of investment securities from SMB at the acquisition date, and subsequently sold $17.0 million of the acquired investments during the fourth quarter of 2017.
Funding Sources
General – Deposits, loan repayments and prepayments, proceeds from investment securities sales, calls, maturities and paydowns, cash flows generated from operations and FHLB advances are our primary, ongoing sources of funds for use in lending, investing and for other general purposes.
Deposits – The Company offers a variety of deposit accounts with a range of interest rates and terms. Our deposits consist of checking, both interest-bearing and noninterest-bearing, money market, savings and certificate of deposit accounts.
The flow of deposits is influenced significantly by general economic conditions, changes in market interest rates and competition. Our deposits are obtained predominantly from the areas where our branch offices are located. We have historically relied primarily on a high level of customer service and long-standing relationships with customers to attract and retain deposits; however, market interest rates and rates offered by competitors significantly affect our ability to attract and retain deposits. The Company uses traditional means of advertising its deposit products, including broadcast and print media. The Company generally does not solicit deposits from outside our market area.
Total deposits were $1.9 billion as of December 31, 2017, an increase of $618.2 million, or 49.5%, compared to $1.2 billion as of December 31, 2016. The acquisition of SMB added $533.5 million in deposits during the fourth quarter of 2017.
The Company experienced strong core deposit (i.e., checking, savings, and money market accounts) growth during 2017. Core deposits totaled $1.5 billion as of December 31, 2017, an increase of $501.3 million, or 51.4%, compared to December 31, 2016. Excluding core deposits acquired from SMB, core deposits increased $61.3 million, or 6.3%, during 2017.
Certificates of deposit (“CDs”) totaled $389.2 million as of December 31, 2017, an increase of $116.9 million, or 42.9%, compared to December 31, 2016. Excluding CDs acquired from SMB, CDs increased $23.3 million, or 8.6%, compared to December 31, 2016. The following table sets forth the composition of the Company’s deposits as of the dates indicated.
31
Table of Contents
| December 31, | Increase/(Decrease) | |||||||||||||||
| (dollars in thousands) |
2017 | 2016 | Amount | Percent | ||||||||||||
| Demand deposit |
$ | 461,999 | $ | 296,519 | $ | 165,480 | 55.8 | % | ||||||||
| Savings |
217,639 | 109,414 | 108,225 | 98.9 | ||||||||||||
| Money market |
306,509 | 264,784 | 41,725 | 15.8 | ||||||||||||
| NOW |
490,924 | 305,092 | 185,832 | 60.9 | ||||||||||||
| Certificates of deposit |
389,156 | 272,263 | 116,893 | 42.9 | ||||||||||||
|
|
|
|
|
|
|
|
|
|||||||||
| Total deposits |
$ | 1,866,227 | $ | 1,248,072 | $ | 618,155 | 49.5 | % | ||||||||
|
|
|
|
|
|
|
|
|
|||||||||
The following table shows the average balance and average rate paid for each type of interest-bearing deposit for the periods indicated.
| For the Years Ended December 31, | ||||||||||||||||||||||||||||||||||||
| (dollars in thousands) |
2017 | 2016 | 2015 | |||||||||||||||||||||||||||||||||
| Average Balance |
Interest Expense |
Average Rate Paid |
Average Balance |
Interest Expense |
Average Rate Paid |
Average Balance |
Interest Expense |
Average Rate Paid |
||||||||||||||||||||||||||||
| Savings, checking and money market |
$ | 731,660 | $ | 2,422 | 0.33 | % | $ | 672,444 | $ | 1,577 | 0.23 | % | $ | 588,683 | $ | 1,331 | 0.23 | % | ||||||||||||||||||
| Certificates of deposit |
295,929 | 2,739 | 0.93 | 267,878 | 2,124 | 0.79 | 236,804 | 1,742 | 0.74 | |||||||||||||||||||||||||||
|
|
|
|
|
|
|
|
|
|
|
|
|
|
|
|
|
|
|
|||||||||||||||||||
| Total interest -bearing deposits |
$ | 1,027,589 | $ | 5,161 | 0.50 | % | $ | 940,322 | $ | 3,701 | 0.39 | % | $ | 825,487 | $ | 3,073 | 0.37 | % | ||||||||||||||||||
|
|
|
|
|
|
|
|
|
|
|
|
|
|
|
|
|
|
|
|||||||||||||||||||
Certificates of deposit in the amount of $100,000 and over increased $76.9 million, or 60.1%, from $128.0 million as of December 31, 2016 to $204.9 million as of December 31, 2017. Excluding certificates of deposit in excess of $100,000 acquired from SMB, CDs increased $21.2 million, or 16.5%, compared to December 31, 2016. The following table details the remaining maturity of large-denomination certificates of deposit of $100,000 and over as of the dates indicated.
| December 31, | ||||||||||||
| (dollars in thousands) |
2017 | 2016 | 2015 | |||||||||
| 3 months or less |
$ | 59,087 | $ | 19,795 | $ | 22,913 | ||||||
| 3 - 6 months |
31,649 | 20,175 | 18,042 | |||||||||
| 6 - 12 months |
51,813 | 25,405 | 27,253 | |||||||||
| 12 - 36 months |
50,753 | 51,376 | 37,907 | |||||||||
| More than 36 months |
11,556 | 11,212 | 15,198 | |||||||||
|
|
|
|
|
|
|
|||||||
| Total certificates of deposit greater than $100,000 |
$ | 204,858 | $ | 127,963 | $ | 121,313 | ||||||
|
|
|
|
|
|
|
|||||||
Federal Home Loan Bank Advances – Advances from the FHLB may be obtained by the Company upon the security of the common stock it owns in the FHLB and certain of its real estate loans and investment securities, provided certain standards related to creditworthiness have been met. Such advances are made pursuant to several credit programs, each of which has its own interest rate and range of maturities. Advances from the FHLB may be either short-term, maturities of one year or less, or long-term, maturities in excess of one year.
Short-term FHLB advances totaled $3.6 million as of December 31, 2017, a decrease of $36.4 million, or 90.9%, compared to $40.0 million as of December 31, 2016.
Long-term FHLB advances totaled $68.2 million as of December 31, 2017, a decrease of $10.4 million, or 13.2%, compared to $78.5 million as of December 31, 2016.
Shareholders’ Equity – Shareholders’ equity provides a source of permanent funding, allows for future growth and provides the Company with a cushion to withstand unforeseen adverse developments. As of December 31, 2017, shareholders’ equity totaled $277.9 million, an increase of $98.0 million, or 54.5%, compared to $179.8 million as of December 31, 2016. The increase was primarily due to the issuance of stock for the SMB acquisition totaling $83.0 million and net income for 2017.
32
Table of Contents
RESULTS OF OPERATIONS
The Company earned net income of $16.8 million in 2017, an increase of $816,000, or 5.1%, compared to 2016. The Company’s net income of $16.0 million in 2016 was an increase of $3.5 million, or 27.6%, compared to 2015. Diluted earnings per share for 2017 were $2.28, an increase of 1.3% from 2016. Diluted earnings per share for 2016 were $2.25, an increase of 25.7% from 2015.
Net Interest Income – Net interest income is the difference between the interest income earned on interest-earning assets, such as loans and investment securities, and the interest expense paid on interest-bearing liabilities, such as deposits and borrowings. Our net interest income is largely determined by our net interest spread, which is the difference between the average yield earned on interest-earning assets and the average rate paid on interest bearing liabilities, and the relative amounts of interest-earning assets and interest-bearing liabilities.
Net interest income totaled $67.8 million in 2017, an increase of $5.4 million, or 8.7%, compared to $62.4 million in 2016. The increase was due to a $6.7 million, or 9.9%, increase in interest income, which was partially offset by a $1.3 million, or 24.3%, increase in interest expense. The increases in 2017 compared to 2016 were primarily due to an increase in accretion income of $3.1 million and a higher volume of average interest-earnings assets.
In 2016, net interest income totaled $62.4 million, an increase of $7.9 million, or 14.4%, compared to $54.5 million in 2015. The increase was due to a $9.3 million, or 15.9%, increase in interest income, which was partially offset by a $1.4 million, or 36.3%, increase in interest expense. The increases in 2016 compared to 2015 were primarily due to increases in average loans and deposits due to the full year impact of the Louisiana Bancorp acquisition.
The Company’s net interest spread was 4.32%, 4.22% and 4.32% for the years ended December 31, 2017, 2016 and 2015, respectively. The Company’s net interest margin, which is net interest income as a percentage of average interest-earning assets, was 4.48%, 4.34% and 4.43% during the years ended December 31, 2017, 2016 and 2015, respectively.
The following table sets forth, for the periods indicated, information regarding (i) the total dollar amount of interest income to the Company from interest-earning assets and the resultant average yields; (ii) the total dollar amount of interest expense on interest-bearing liabilities and the resultant average rate; (iii) net interest income; (iv) net interest spread; and (v) net interest margin. Information is based on average monthly balances during the indicated periods. Taxable equivalent (“TE”) yields have been calculated using a marginal tax rate of 35%.
| For the Years Ended December 31, | ||||||||||||||||||||||||||||||||||||
| (dollars in thousands) |
2017 | 2016 | 2015 | |||||||||||||||||||||||||||||||||
| Average Balance |
Interest | Average Yield/ Rate |
Average Balance |
Interest | Average Yield/ Rate |
Average Balance |
Interest | Average Yield/ Rate |
||||||||||||||||||||||||||||
| Interest-earning assets: |
||||||||||||||||||||||||||||||||||||
| Loans receivable(1) |
$ | 1,253,576 | $ | 69,167 | 5.47 | % | $ | 1,225,690 | $ | 63,731 | 5.15 | % | $ | 1,013,482 | $ | 54,466 | 5.33 | % | ||||||||||||||||||
| Investment securities (TE) |
||||||||||||||||||||||||||||||||||||
| Taxable |
180,208 | 3,894 | 2.16 | 152,426 | 3,002 | 1.97 | 154,102 | 3,032 | 1.97 | |||||||||||||||||||||||||||
| Tax-exempt |
31,908 | 637 | 3.07 | 34,168 | 675 | 3.04 | 36,249 | 712 | 3.02 | |||||||||||||||||||||||||||
|
|
|
|
|
|
|
|
|
|
|
|
|
|||||||||||||||||||||||||
| Total investment securities |
212,116 | 4,531 | 2.30 | 186,594 | 3,677 | 2.17 | 190,351 | 3,744 | 2.17 | |||||||||||||||||||||||||||
|
|
|
|
|
|
|
|
|
|
|
|
|
|||||||||||||||||||||||||
| Other interest-earning assets |
43,316 | 700 | 1.61 | 19,695 | 276 | 1.40 | 24,935 | 199 | 0.80 | |||||||||||||||||||||||||||
|
|
|
|
|
|
|
|
|
|
|
|
|
|||||||||||||||||||||||||
| Total interest-earning assets (TE) |
1,509,008 | 74,398 | 4.91 | 1,431,979 | 67,684 | 4.71 | 1,228,768 | 58,409 | 4.75 | |||||||||||||||||||||||||||
|
|
|
|
|
|
|
|||||||||||||||||||||||||||||||
| Noninterest-earning assets |
106,730 | 109,761 | 109,258 | |||||||||||||||||||||||||||||||||
|
|
|
|
|
|
|
|||||||||||||||||||||||||||||||
| Total assets |
$ | 1,615,738 | $ | 1,541,740 | $ | 1,338,026 | ||||||||||||||||||||||||||||||
|
|
|
|
|
|
|
|||||||||||||||||||||||||||||||
33
Table of Contents
| For the Years Ended December 31, | ||||||||||||||||||||||||||||||||||||
| (dollars in thousands) |
2017 | 2016 | 2015 | |||||||||||||||||||||||||||||||||
| Average Balance |
Interest | Average Yield/ Rate |
Average Balance |
Interest | Average Yield/ Rate |
Average Balance |
Interest | Average Yield/ Rate |
||||||||||||||||||||||||||||
| Interest-bearing liabilities: |
||||||||||||||||||||||||||||||||||||
| Deposits: |
||||||||||||||||||||||||||||||||||||
| Savings, checking and money market |
$ | 731,660 | $ | 2,422 | 0.33 | % | $ | 672,444 | $ | 1,577 | 0.23 | % | $ | 588,683 | $ | 1,331 | 0.23 | % | ||||||||||||||||||
| Certificates of deposit |
295,929 | 2,739 | 0.93 | 267,878 | 2,124 | 0.79 | 236,804 | 1,742 | 0.74 | |||||||||||||||||||||||||||
|
|
|
|
|
|
|
|
|
|
|
|
|
|
|
|||||||||||||||||||||||
| Total interest-bearing deposits |
1,027,589 | 5,161 | 0.50 | 940,322 | 3,701 | 0.39 | 825,487 | 3,073 | 0.37 | |||||||||||||||||||||||||||
| Securities sold under repurchase agreements |
— | — | — | — | — | — | 10,291 | 39 | 0.38 | |||||||||||||||||||||||||||
| FHLB advances |
84,404 | 1,388 | 1.64 | 125,653 | 1,567 | 1.24 | 62,677 | 753 | 1.20 | |||||||||||||||||||||||||||
|
|
|
|
|
|
|
|
|
|
|
|
|
|||||||||||||||||||||||||
| Total interest-bearing liabilities |
1,111,993 | 6,549 | 0.59 | 1,065,975 | 5,268 | 0.49 | 898,455 | 3,865 | 0.43 | |||||||||||||||||||||||||||
|
|
|
|
|
|
|
|||||||||||||||||||||||||||||||
| Noninterest-bearing liabilities |
308,872 | 301,515 | 279,200 | |||||||||||||||||||||||||||||||||
|
|
|
|
|
|
|
|||||||||||||||||||||||||||||||
| Total liabilities |
1,420,865 | 1,367,490 | 1,177,655 | |||||||||||||||||||||||||||||||||
| Shareholders’ equity |
194,873 | 174,250 | 160,371 | |||||||||||||||||||||||||||||||||
|
|
|
|
|
|
|
|||||||||||||||||||||||||||||||
| Total liabilities and shareholders’ equity |
$ | 1,615,738 | $ | 1,541,740 | $ | 1,338,026 | ||||||||||||||||||||||||||||||
|
|
|
|
|
|
|
|||||||||||||||||||||||||||||||
| Net interest-earning assets |
$ | 397,015 | $ | 366,004 | $ | 330,313 | ||||||||||||||||||||||||||||||
|
|
|
|
|
|
|
|||||||||||||||||||||||||||||||
| Net interest income; net interest spread (TE) |
$ | 67,849 | 4.32 | % | $ | 62,416 | 4.22 | % | $ | 54,544 | 4.32 | % | ||||||||||||||||||||||||
|
|
|
|
|
|
|
|
|
|
|
|
|
|||||||||||||||||||||||||
| Net interest margin (TE) |
4.48 | % | 4.34 | % | 4.43 | % | ||||||||||||||||||||||||||||||
|
|
|
|
|
|
|
|||||||||||||||||||||||||||||||
| (1) | Nonperforming loans are included in the respective average loan balances, net of deferred fees, discounts and loans in process. Acquired Loans were recorded at fair value upon acquisition and accrete interest income over the remaining life of the respective loans. |
The following table displays the dollar amount of changes in interest income and interest expense for major components of interest-earning assets and interest-bearing liabilities. The table distinguishes between (i) changes attributable to volume (changes in average volume between periods times prior year rate), (ii) changes attributable to rate (changes in average rate between periods times prior year volume) and (iii) total increase (decrease).
| 2017 Compared to 2016 Change Attributable To |
2016 Compared to 2015 Change Attributable To |
|||||||||||||||||||||||
| (dollars in thousands) |
Rate | Volume | Total Increase (Decrease) |
Rate | Volume | Total Increase (Decrease) |
||||||||||||||||||
| Interest income: |
||||||||||||||||||||||||
| Loans receivable |
$ | 4,017 | $ | 1,419 | $ | 5,436 | $ | (1,855 | ) | $ | 11,120 | $ | 9,265 | |||||||||||
| Investment securities |
339 | 515 | 854 | 19 | (86 | ) | (67 | ) | ||||||||||||||||
| Other interest-earning assets |
67 | 357 | 424 | 134 | (57 | ) | 77 | |||||||||||||||||
|
|
|
|
|
|
|
|
|
|
|
|
|
|||||||||||||
| Total interest income |
4,423 | 2,291 | 6,714 | (1,702 | ) | 10,977 | 9,275 | |||||||||||||||||
|
|
|
|
|
|
|
|
|
|
|
|
|
|||||||||||||
| Interest expense: |
||||||||||||||||||||||||
| Savings, checking and money market accounts |
657 | 188 | 845 | 44 | 203 | 247 | ||||||||||||||||||
| Certificates of deposit |
374 | 241 | 615 | 144 | 238 | 382 | ||||||||||||||||||
| Securities sold under repurchase agreements |
— | — | — | — | (39 | ) | (39 | ) | ||||||||||||||||
| FHLB advances |
187 | (366 | ) | (179 | ) | 39 | 774 | 813 | ||||||||||||||||
|
|
|
|
|
|
|
|
|
|
|
|
|
|||||||||||||
| Total interest expense |
1,218 | 63 | 1,281 | 227 | 1,176 | 1,403 | ||||||||||||||||||
|
|
|
|
|
|
|
|
|
|
|
|
|
|||||||||||||
| Increase (decrease) in net interest income |
$ | 3,205 | $ | 2,228 | $ | 5,433 | $ | (1,929 | ) | $ | 9,801 | $ | 7,872 | |||||||||||
|
|
|
|
|
|
|
|
|
|
|
|
|
|||||||||||||
34
Table of Contents
Interest income includes interest income earned on earning assets as well as applicable loan fees earned. Interest income that would have been earned on nonaccrual loans had they been on accrual status is not included in the data reported above.
Provision for Loan Losses – We have identified the evaluation of the allowance for loan losses as a critical accounting policy where amounts are sensitive to material variation. This policy is significantly affected by our judgment and uncertainties. There is likelihood that materially different amounts would be reported under different, but reasonably plausible, conditions or assumptions. Our activity in the provision for loan losses, which are charges or recoveries to operating results, is undertaken in order to maintain a level of total allowance for loan losses that management believes covers all known and inherent losses that are both probable and reasonably estimable as of each reporting date. Our evaluation process typically includes, among other things, an analysis of delinquency trends, non-performing loan trends, the level of charge-offs and recoveries, prior loss experience, total loans outstanding, the volume of loan originations, the type, size and geographic concentration of loans, the value of collateral securing the loan, the borrower’s ability to repay and repayment performance, the number of loans requiring heightened management oversight, general economic conditions and industry experience. The OCC, as an integral part of its examination process, periodically reviews our allowance for loan losses. The OCC may require the Bank to make additional provisions for estimated loan losses based upon judgments different from those of management. As part of the risk management program, independent reviews are performed on the loan portfolio, which supplement management’s assessment of the loan portfolio and the allowance for loan losses. The results of independent reviews are reported to the Audit Committee of the Board of Directors.
For the year ended December 31, 2017, the Company recorded a provision for loan losses of $2.3 million, compared to $3.2 million and $2.1 million for 2016 and 2015, respectively. The provision for 2017 and 2016 primarily related to downgrades recorded on certain loans as a result of our internal loan review and classification policy, as well as organic loan growth. The provision for 2015 related primarily to organic loan growth and an 11 basis point increase for increased credit risk due to continued low energy prices.
Net charge-offs were $21,000 for 2017, compared to $237,000 and $283,000 for 2016 and 2015, respectively.
At December 31, 2017, the Company’s ratio of allowance for loan losses to total loans was 0.89%, compared to 1.02% at December 31, 2016. Excluding Acquired Loans, the ratio of allowance for loan losses to total originated loans was 1.52% at December 31, 2017, compared to 1.38% at December 31, 2016.
Noninterest Income – The following table illustrates the primary components of noninterest income for the years indicated.
| (dollars in thousands) |
2017 | 2016 | 2017 vs 2016 Percent Increase (Decrease) |
2015 | 2016 vs 2015 Percent Increase (Decrease) |
|||||||||||||||
| Noninterest income: |
||||||||||||||||||||
| Service fees and charges |
$ | 4,229 | $ | 4,061 | 4.1 | % | $ | 3,938 | 3.1 | % | ||||||||||
| Bank card fees |
3,003 | 2,603 | 15.4 | 2,413 | 7.9 | |||||||||||||||
| Gain on sale of loans, net |
1,196 | 1,770 | (32.4 | ) | 1,528 | 15.8 | ||||||||||||||
| Income from bank-owned life insurance |
494 | 483 | 2.3 | 504 | (4.2 | ) | ||||||||||||||
| Gain on sale of securities, net |
— | — | — | 7 | (100.0 | ) | ||||||||||||||
| Gain (loss) on sale of assets, net |
(162 | ) | 595 | (127.2 | ) | (491 | ) | 221.3 | ||||||||||||
| Other income |
1,202 | 1,645 | (26.9 | ) | 871 | 88.9 | ||||||||||||||
|
|
|
|
|
|
|
|
|
|
|
|||||||||||
| Total noninterest income |
$ | 9,962 | $ | 11,157 | (10.7 | )% | $ | 8,770 | 27.2 | % | ||||||||||
|
|
|
|
|
|
|
|
|
|
|
|||||||||||
2017 compared to 2016
Noninterest income for 2017 totaled $10.0 million, a decrease of $1.2 million, or 10.7%, compared to 2016. The decrease was primarily the result of decreases in gains on the sale of assets (down $758,000 due to a write down taken on the closure of a banking center in Vicksburg, Mississippi in 2017 compared to a gain on the sale of a
35
Table of Contents
banking center in 2016), gains on the sale of mortgage loans (down $574,000) and other income (down $442,000 primarily due to fewer recoveries on previously charged off Acquired Loans), which were partially offset by increases in bank card fees (up $400,000) and service fees and charges (up $168,000).
2016 compared to 2015
Noninterest income for 2016 totaled $11.2 million, an increase of $2.4 million, or 27.2%, compared to 2015. The increase was primarily the result of increases in gains on the sale of assets (up $1.1 million due to a $641,000 gain on the sale of a banking center in 2016 compared to a $491,000 loss on the sale of property during 2015), other income (up $774,000 primarily due to recoveries on previously charged off Acquired Loans), gains on the sale of mortgage loans (up $243,000), bank card fees (up $190,000) and service fees and charges (up $123,000).
Noninterest Expense – The following table illustrates the primary components of noninterest expense for the years indicated.
| (dollars in thousands) |
2017 | 2016 | 2017 vs 2016 Percent Increase (Decrease) |
2015 | 2016 vs 2015 Percent Increase (Decrease) |
|||||||||||||||
| Noninterest expense: |
||||||||||||||||||||
| Compensation and benefits |
$ | 28,162 | $ | 27,634 | 1.9 | % | $ | 25,036 | 10.4 | % | ||||||||||
| Occupancy |
5,065 | 5,255 | (3.6 | ) | 4,876 | 7.8 | ||||||||||||||
| Marketing and advertising |
1,008 | 1,063 | (5.2 | ) | 486 | 118.7 | ||||||||||||||
| Data processing and communication |
4,329 | 4,967 | (12.8 | ) | 4,045 | 22.8 | ||||||||||||||
| Professional services |
1,590 | 983 | 61.7 | 1,755 | (44.0 | ) | ||||||||||||||
| Forms, printing and supplies |
594 | 623 | (4.7 | ) | 597 | 4.4 | ||||||||||||||
| Franchise and shares tax |
948 | 821 | 15.4 | 650 | 26.3 | |||||||||||||||
| Regulatory fees |
1,264 | 1,317 | (4.0 | ) | 1,122 | 17.4 | ||||||||||||||
| Foreclosed assets, net |
(298 | ) | 140 | (313.4 | ) | 443 | (68.4 | ) | ||||||||||||
| Other expenses |
3,515 | 3,994 | (12.0 | ) | 3,012 | 32.6 | ||||||||||||||
|
|
|
|
|
|
|
|
|
|
|
|||||||||||
| Total noninterest expense |
$ | 46,177 | $ | 46,797 | (1.3 | )% | $ | 42,022 | 11.4 | % | ||||||||||
|
|
|
|
|
|
|
|
|
|
|
|||||||||||
2017 compared to 2016
Noninterest expense for 2017 totaled $46.2 million, a decrease of $620,000, or 1.3%, from 2016. Noninterest expense includes merger-related expenses of $1.1 million and $856,000 for the years ended December 31, 2017 and 2016, respectively. Excluding merger-related expenses, noninterest expense decreased $849,000, or 1.8%, during 2017. The decrease was primarily the result of lower foreclosed assets expenses (down $437,000), other expenses (down $380,000), data processing and communications (down $239,000), occupancy (down $176,000) and professional services (down $168,000), which were partially offset by higher compensation and benefits (up $458,000).
2016 compared to 2015
Noninterest expense for 2016 totaled $46.8 million, an increase of $4.8 million, or 11.4%, from 2015. Noninterest expense includes merger-related expenses related to the acquisition of Louisiana Bancorp of $856,000 and $1.4 million for the years ended December 31, 2016 and 2015, respectively. Excluding merger-related expenses, noninterest expense increased $5.3 million, or 13.1%, during 2016. The increase was primarily the result of higher compensation and benefits, data processing and communications, marketing and advertising and other expenses due primarily to the Company’s growth.
Income Taxes – For the years ended December 31, 2017, 2016 and 2015, the Company incurred income tax expense of $12.5 million, $7.6 million and $6.7 million, respectively. The Company’s effective tax rate amounted to 42.6%, 32.1% and 34.7% during 2017, 2016 and 2015, respectively. The higher effective tax rate recorded for the year ended 2017 was the result of the recently passed Tax Act. The Tax Act reduced the federal corporate statutory tax
36
Table of Contents
rate from 35% to 21%, which required a re-measurement charge of the Company’s DTA of $2.7 million in the fourth quarter of 2017. The carrying value of our DTA was reduced reflecting lower future tax benefits due to the lower corporate tax rate. The effective tax rate for the year ended 2016 was lower than the 2016 statutory tax rate due primarily to the adoption of ASU No. 2016-09, Compensation – Stock Compensation (Topic 718): Improvements to Employee Share-Based Payment Accounting.
LIQUIDITY AND CAPITAL RESOURCES
Our primary sources of funds are from deposits, amortization of loans, loan prepayments and the maturity of loans, investment securities and other investments and other funds provided from operations. While scheduled payments from the amortization of loans and investment securities and maturing investment securities are relatively predictable sources of funds, deposit flows and loan prepayments can be greatly influenced by general interest rates, economic conditions and competition. We also maintain excess funds in short-term, interest-bearing assets that provide additional liquidity. As of December 31, 2017, our cash and cash equivalents totaled $150.4 million. In addition, as of such date, our available for sale investment securities totaled $235.0 million.
We use our liquidity to fund existing and future loan commitments, to fund maturing certificates of deposit and demand deposit withdrawals, to invest in other interest-earning assets, and to meet operating expenses. As of December 31, 2017, we had certificates of deposit maturing within the next 12 months totaling $260.7 million. Based upon historical experience, we anticipate that the majority of the maturing certificates of deposit will be redeposited with us in certificates of deposit or other deposit accounts.
In addition to cash flows from loan and securities payments and prepayments as well as from sales of available for sale securities, we have significant borrowing capacity available to fund liquidity needs. In recent years, we have utilized borrowings as a cost efficient addition to deposits as a source of funds. Our borrowings consist of advances from the FHLB, of which we are a member. Under terms of the collateral agreement with the FHLB, we may pledge residential mortgage loans and mortgage-backed securities as well as our stock in the FHLB as collateral for such advances. For the year ended December 31, 2017, the average balance of our outstanding FHLB advances was $84.4 million. As of December 31, 2017, we had $71.8 million in outstanding FHLB advances and $520.0 million in additional FHLB advances available to us.
Liquidity management is both a daily and long-term function of business management. Excess liquidity is generally invested in short-term investments such as overnight deposits. On a longer-term basis, the Company maintains a strategy of investing in various lending and investment security products. The Company uses its sources of funds primarily to meet its ongoing commitments and fund loan commitments. The Company has been able to generate sufficient cash through its deposits, as well as borrowings, and anticipates it will continue to have sufficient funds to meet its liquidity requirements.
ASSET/ LIABILITY MANAGEMENT AND MARKET RISK
The objective of asset/liability management is to implement strategies for the funding and deployment of the Company’s financial resources that are expected to maximize soundness and profitability over time at acceptable levels of risk. Interest rate sensitivity is the potential impact of changing rate environments on both net interest income and cash flows. The Company measures its interest rate sensitivity over the near term primarily by running net interest income simulations.
Our interest rate sensitivity is also monitored by management through the use of models which generate estimates of the change in its net interest income over a range of interest rate scenarios. Based on the Company’s interest rate risk model, the table below sets forth the results of immediate and sustained changes in interest rates as of December 31, 2017.
|
Shift in Interest Rates (in bps) |
% Change in Projected Net Interest Income | |
| +300 |
3.6% | |
| +200 |
2.7 | |
| +100 |
1.5 |
37
Table of Contents
The actual impact of changes in interest rates will depend on many factors. These factors include the Company’s ability to achieve expected growth in interest-earning assets and maintain a desired mix of interest-earning assets and interest-bearing liabilities, the actual timing of asset and liability repricing, the magnitude of interest rate changes and corresponding movement in interest rate spreads, and the level of success of asset/liability management strategies.
Market risk is the risk of loss from adverse changes in market prices and rates. Our market risk arises primarily from the interest rate risk which is inherent in our lending and deposit taking activities. To that end, management actively monitors and manages interest rate risk exposure. In addition to market risk, our primary risk is credit risk on our loan portfolio. We attempt to manage credit risk through our loan underwriting and oversight policies.
The principal objective of our interest rate risk management function is to evaluate the interest rate risk embedded in certain balance sheet accounts, determine the level of risk appropriate given our business strategy, operating environment, capital and liquidity requirements, performance objectives and interest rate environment and manage the risk consistent with approved guidelines. We seek to manage our exposure to risks from changes in interest rates while at the same time trying to improve our net interest spread. We monitor interest rate risk as such risk relates to our operating strategies. We have established an Asset/Liability Committee (“ALCO”), which is comprised of our Chief Executive Officer, Chief Financial Officer, Chief Banking Officer, Chief Credit Officer, Chief Operating Officer, Director of Financial Management and Treasurer. ALCO is responsible for reviewing our asset/liability and investment policies and interest rate risk position. ALCO meets at least monthly. The extent of the movement of interest rates is an uncertainty that could have a negative impact on future earnings.
In recent years, we primarily have utilized the following strategies in our efforts to manage interest rate risk:
| • | we have increased our originations of shorter term loans, particularly commercial real estate and commercial and industrial loans; |
| • | we generally sell our conforming long-term (30-year) fixed-rate single-family residential mortgage loans into the secondary market; and |
| • | we have invested in securities, consisting primarily of mortgage-backed securities and collateral mortgage obligations, with relatively short average lives, generally three to five years, and we maintain adequate amounts of liquid assets. |
OFF-BALANCE SHEET ACTIVITIES
To meet the financing needs of its customers, the Company issues financial instruments which represent conditional obligations that are not recognized, wholly or in part, in the statements of financial condition. These financial instruments include commitments to extend credit and standby letters of credit. Such instruments expose the Company to varying degrees of credit and interest rate risk in much the same way as funded loans. The same credit policies are used in these commitments as for on-balance sheet instruments. The Company’s exposure to credit losses from these financial instruments is represented by their contractual amounts.
The following table summarizes our outstanding commitments to originate loans and to advance additional amounts pursuant to outstanding letters of credit, lines of credit and the undisbursed portion of construction loans as of December 31 of the years indicated.
| Contract Amount | ||||||||
| (dollars in thousands) |
2017 | 2016 | ||||||
| Standby letters of credit |
$ | 6,620 | $ | 5,233 | ||||
| Available portion of lines of credit |
203,367 | 141,968 | ||||||
| Undisbursed portion of loans in process |
78,578 | 62,791 | ||||||
| Commitments to originate loans |
96,183 | 98,714 | ||||||
38
Table of Contents
Commitments to extend credit are agreements to lend to a customer as long as there is no violation of any condition established in the contract. Commitments generally have fixed expiration dates or other termination clauses and may require payment of a fee. Since many of the commitments are expected to be drawn upon, the total commitment amounts generally represent future cash requirements.
Unfunded commitments under commercial lines-of-credit and revolving credit lines are commitments for possible future extensions of credit to existing customers. These lines-of-credit usually do not contain a specified maturity date and may not be drawn upon to the total extent to which the Company is committed.
The Company is subject to certain claims and litigation arising in the ordinary course of business. In the opinion of management, after consultation with legal counsel, the ultimate disposition of these matters is not expected to have a material effect on the financial position or results of operations of the Company.
The following table summarizes our outstanding commitments to originate loans and to advance additional amounts pursuant to outstanding letters of credit, lines of credit and the undisbursed portion of construction loans as of December 31, 2017.
| (dollars in thousands) |
Less Than One Year |
One to Three Years |
Three to Five Years |
Over Five Years |
Total | |||||||||||||||
| Unused commercial lines of credit |
$ | 98,113 | $ | 33,367 | $ | 580 | $ | — | $ | 132,060 | ||||||||||
| Unused personal lines of credit |
3,785 | 5,711 | 5,507 | 56,304 | 71,307 | |||||||||||||||
| Undisbursed portion of loans in process |
41,207 | 21,503 | 15,868 | — | 78,578 | |||||||||||||||
| Standby letters of credit |
5,978 | 630 | 12 | — | 6,620 | |||||||||||||||
| Commitments to originate loans |
96,183 | — | — | — | 96,183 | |||||||||||||||
|
|
|
|
|
|
|
|
|
|
|
|||||||||||
| Total |
$ | 245,266 | $ | 61,211 | $ | 21,967 | $ | 56,304 | $ | 384,748 | ||||||||||
|
|
|
|
|
|
|
|
|
|
|
|||||||||||
The Company has utilized leasing arrangements to support the ongoing activities of the Company. The required payments under such commitments and other contractual cash commitments as of December 31, 2017 are shown in the following table.
| (dollars in thousands) |
2018 | 2019 | 2020 | 2021 | 2022 | Thereafter | Total | |||||||||||||||||||||
| Operating leases |
$ | 493 | $ | 442 | $ | 388 | $ | 388 | $ | 388 | $ | 1,018 | $ | 3,117 | ||||||||||||||
| Certificates of deposit |
260,702 | 75,484 | 28,931 | 12,528 | 9,460 | 2,051 | 389,156 | |||||||||||||||||||||
| Long-term FHLB advances |
6,000 | 15,357 | 31,158 | 1,861 | 7,712 | 6,095 | 68,183 | |||||||||||||||||||||
|
|
|
|
|
|
|
|
|
|
|
|
|
|
|
|||||||||||||||
| Total |
$ | 267,195 | $ | 91,283 | $ | 60,477 | $ | 14,777 | $ | 17,560 | $ | 9,164 | $ | 460,456 | ||||||||||||||
|
|
|
|
|
|
|
|
|
|
|
|
|
|
|
|||||||||||||||
IMPACT OF INFLATION AND CHANGING PRICES
The financial statements, accompanying notes and related financial data of the Company presented herein have been prepared in accordance with GAAP, which require the measurement of financial position and operating results in terms of historical dollars without considering the changes in purchasing power of money over time due to inflation. The impact of inflation is reflected in the increased cost of operations. Most of our assets and liabilities are monetary in nature; therefore, the impact of interest rates has a greater impact on its performance than the effects of general levels of inflation. Interest rates do not necessarily move in the same direction or to the same extent as the prices of goods and services.
Item 7A. Quantitative and Qualitative Disclosures about Market Risk.
The information contained in the section captioned “Management’s Discussion and Analysis of Financial Condition and Results of Operations – Asset/Liability Management and Market Risk” in Item 7 hereof is incorporated herein by reference.
39
Table of Contents
Item 8. Financial Statements and Supplementary Data.

REPORT OF INDEPENDENT REGISTERED PUBLIC ACCOUNTING FIRM
To the Board of Directors and Shareholders
Home Bancorp, Inc.
Lafayette, Louisiana
Opinions on the Consolidated Financial Statements and Internal Control Over Financial Reporting
We have audited the accompanying consolidated balance sheets of Home Bancorp, Inc. and subsidiary (the “Company”) as of December 31, 2017 and 2016, and the related consolidated statements of income, comprehensive income, changes in shareholders’ equity and cash flows for each of the three years in the period ended December 31, 2017, and the related notes (collectively, the consolidated financial statements). We also have audited the Company’s internal control over financial reporting as of December 31, 2017, based on criteria established in Internal Control — Integrated Framework issued by the Committee of Sponsoring Organizations of the Treadway Commission in 2013.
In our opinion, the consolidated financial statements referred to above present fairly, in all material respects, the financial position of the Company as of December 31, 2017 and 2016, and the results of their operations and their cash flows for each of the years in the three-year period ended December 31, 2017, in conformity with accounting principles generally accepted in the United States of America. Also in our opinion, the Company maintained, in all material respects, effective internal control over financial reporting as of December 31, 2017, based on criteria established in Internal Control – Integrated Framework issued by the Committee of Sponsoring Organizations of the Treadway Commission in 2013.
Basis for Opinions
The Company’s management is responsible for these consolidated financial statements, for maintaining effective internal control over financial reporting, and for its assessment of the effectiveness of internal control over financial reporting, included in the accompanying Report of Management. Our responsibility is to express an opinion on the Company’s consolidated financial statements and an opinion on the Company’s internal control over financial reporting based on our audits. We are a public accounting firm registered with the Public Company Accounting Oversight Board (United States) (“PCAOB”) and are required to be independent with respect to the Company in accordance with U.S. federal securities laws and applicable rules and regulations of the Securities and Exchange Commission and the PCAOB.
We conducted our audits in accordance with the standards of the PCAOB. Those standards require that we plan and perform the audits to obtain reasonable assurance about whether the consolidated financial statements are free of material misstatement, whether due to error or fraud, and whether effective internal control over financial reporting was maintained in all material respects.
40
Table of Contents
Our audits of the consolidated financial statements included performing procedures to assess the risks of material misstatement of the consolidated financial statements, whether due to error or fraud, and performing procedures that respond to those risks. Such procedures included examining, on a test basis, evidence regarding the amounts and disclosures in the consolidated financial statements. Our audits also included evaluating the accounting principles used and significant estimates made by management, as well as evaluating the overall presentation of the consolidated financial statements. Our audit of internal control over financial reporting included obtaining an understanding of internal control over financial reporting, assessing the risk that a material weakness exists, and testing and evaluating the design and operating effectiveness of internal control based on the assessed risk. Our audits also included performing such other procedures as we considered necessary in the circumstances. We believe that our audits provide a reasonable basis for our opinions.
Definition and Limitations of Internal Control Over Financial Reporting
A company’s internal control over financial reporting is a process designed to provide reasonable assurance regarding the reliability of financial reporting and the preparation of consolidated financial statements for external purposes in accordance with generally accepted accounting principles. A company’s internal control over financial reporting includes those policies and procedures that (1) pertain to the maintenance of records that, in reasonable detail, accurately and fairly reflect the transactions and dispositions of the assets of the company; (2) provide reasonable assurance that transactions are recorded as necessary to permit preparation of consolidated financial statements in accordance with generally accepted accounting principles, and that receipts and expenditures of the company are being made only in accordance with authorizations of management and directors of the company; and (3) provide reasonable assurance regarding prevention or timely detection of unauthorized acquisition, use, or disposition of the company’s assets that could have a material effect on the consolidated financial statements.
Because of its inherent limitations, internal control over financial reporting may not prevent or detect misstatements. Also, projections of any evaluation of effectiveness to future periods are subject to the risk that controls may become inadequate because of changes in conditions, or that the degree of compliance with the policies or procedures may deteriorate.
We have served as the Company’s auditor since 2009.
| /s/ Porter Keadle Moore, LLC |
Atlanta, Georgia
March 14, 2018
41
Table of Contents
HOME BANCORP, INC. AND SUBSIDIARY
CONSOLIDATED STATEMENTS OF FINANCIAL CONDITION
| December 31, | ||||||||
| 2017 | 2016 | |||||||
| Assets |
||||||||
| Cash and cash equivalents |
$ | 150,417,829 | $ | 29,314,741 | ||||
| Interest-bearing deposits in banks |
2,421,000 | 1,884,000 | ||||||
| Investment securities available for sale, at fair value |
234,993,436 | 183,729,857 | ||||||
| Investment securities held to maturity (fair values of $13,055,073 and $13,362,062, respectively) |
13,033,590 | 13,365,479 | ||||||
| Mortgage loans held for sale |
5,873,132 | 4,156,186 | ||||||
| Loans, net of unearned income |
1,657,794,751 | 1,227,833,309 | ||||||
| Allowance for loan losses |
(14,807,278 | ) | (12,510,708 | ) | ||||
|
|
|
|
|
|||||
| Total loans, net of unearned income and allowance for loan losses |
1,642,987,473 | 1,215,322,601 | ||||||
|
|
|
|
|
|||||
| Office properties and equipment, net |
45,604,752 | 39,566,639 | ||||||
| Cash surrender value of bank-owned life insurance |
28,903,913 | 20,149,553 | ||||||
| Goodwill and core deposit intangibles |
68,033,472 | 12,762,211 | ||||||
| Accrued interest receivable and other assets |
35,852,241 | 36,480,766 | ||||||
|
|
|
|
|
|||||
| Total Assets |
$ | 2,228,120,838 | $ | 1,556,732,033 | ||||
|
|
|
|
|
|||||
| Liabilities |
||||||||
| Deposits: |
||||||||
| Noninterest-bearing |
$ | 461,999,611 | $ | 296,519,496 | ||||
| Interest-bearing |
1,404,227,717 | 951,552,957 | ||||||
|
|
|
|
|
|||||
| Total deposits |
1,866,227,328 | 1,248,072,453 | ||||||
| Short-term Federal Home Loan Bank advances |
3,642,422 | 40,000,000 | ||||||
| Long-term Federal Home Loan Bank advances |
68,183,173 | 78,533,173 | ||||||
| Accrued interest payable and other liabilities |
12,197,189 | 10,283,383 | ||||||
|
|
|
|
|
|||||
| Total Liabilities |
1,950,250,112 | 1,376,889,009 | ||||||
|
|
|
|
|
|||||
| Shareholders’ Equity |
||||||||
| Preferred stock, $0.01 par value – 10,000,000 shares authorized; none issued |
— | — | ||||||
| Common stock, $0.01 par value – 40,000,000 shares authorized; 9,395,488 and 7,350,102 shares issued and outstanding, respectively |
93,955 | 73,502 | ||||||
| Additional paid-in capital |
165,341,415 | 79,425,604 | ||||||
| Unallocated common stock held by: |
||||||||
| Employee Stock Ownership Plan (ESOP) |
(3,838,510 | ) | (4,195,590 | ) | ||||
| Recognition and Retention Plan (RRP) |
(83,903 | ) | (119,633 | ) | ||||
| Retained earnings |
117,312,630 | 104,647,375 | ||||||
| Accumulated other comprehensive (loss) income |
(954,861 | ) | 11,766 | |||||
|
|
|
|
|
|||||
| Total Shareholders’ Equity |
277,870,726 | 179,843,024 | ||||||
|
|
|
|
|
|||||
| Total Liabilities and Shareholders’ Equity |
$ | 2,228,120,838 | $ | 1,556,732,033 | ||||
|
|
|
|
|
|||||
The accompanying Notes are an integral part of these Consolidated Financial Statements.
42
Table of Contents
HOME BANCORP, INC. AND SUBSIDIARY
CONSOLIDATED STATEMENTS OF INCOME
| Years Ended December 31, | ||||||||||||
| 2017 | 2016 | 2015 | ||||||||||
| Interest Income |
||||||||||||
| Loans, including fees |
$ | 69,167,352 | $ | 63,731,508 | $ | 54,466,025 | ||||||
| Investment securities: |
||||||||||||
| Taxable interest |
3,894,072 | 3,001,887 | 3,031,381 | |||||||||
| Tax-exempt interest |
637,189 | 674,695 | 712,602 | |||||||||
| Other investments and deposits |
699,235 | 276,224 | 199,646 | |||||||||
|
|
|
|
|
|
|
|||||||
| Total interest income |
74,397,848 | 67,684,314 | 58,409,654 | |||||||||
|
|
|
|
|
|
|
|||||||
| Interest Expense |
||||||||||||
| Deposits |
5,160,775 | 3,701,244 | 3,072,725 | |||||||||
| Securities sold under repurchase agreements |
— | — | 39,126 | |||||||||
| Short-term Federal Home Loan Bank advances |
99,075 | 188,425 | 51,406 | |||||||||
| Long-term Federal Home Loan Bank advances |
1,289,031 | 1,378,702 | 702,136 | |||||||||
|
|
|
|
|
|
|
|||||||
| Total interest expense |
6,548,881 | 5,268,371 | 3,865,393 | |||||||||
|
|
|
|
|
|
|
|||||||
| Net interest income |
67,848,967 | 62,415,943 | 54,544,261 | |||||||||
| Provision for loan losses |
2,316,967 | 3,200,000 | 2,070,894 | |||||||||
|
|
|
|
|
|
|
|||||||
| Net interest income after provision for loan losses |
65,532,000 | 59,215,943 | 52,473,367 | |||||||||
|
|
|
|
|
|
|
|||||||
| Noninterest Income |
||||||||||||
| Service fees and charges |
4,229,041 | 4,060,906 | 3,937,797 | |||||||||
| Bank card fees |
3,003,238 | 2,603,075 | 2,413,459 | |||||||||
| Gain on sale of loans, net |
1,195,921 | 1,770,249 | 1,527,721 | |||||||||
| Income from bank-owned life insurance |
493,598 | 482,653 | 503,790 | |||||||||
| Gain on sale of securities, net |
— | — | 7,279 | |||||||||
| Gain (loss) on sale of assets, net |
(162,265 | ) | 595,523 | (491,109 | ) | |||||||
| Other income |
1,202,529 | 1,644,758 | 870,581 | |||||||||
|
|
|
|
|
|
|
|||||||
| Total noninterest income |
9,962,062 | 11,157,164 | 8,769,518 | |||||||||
|
|
|
|
|
|
|
|||||||
| Noninterest Expense |
||||||||||||
| Compensation and benefits |
28,162,089 | 27,633,636 | 25,035,862 | |||||||||
| Occupancy |
5,065,088 | 5,254,889 | 4,875,945 | |||||||||
| Marketing and advertising |
1,007,639 | 1,062,935 | 486,341 | |||||||||
| Data processing and communication |
4,328,944 | 4,967,028 | 4,044,553 | |||||||||
| Professional services |
1,590,118 | 983,445 | 1,755,286 | |||||||||
| Forms, printing and supplies |
594,139 | 623,495 | 596,748 | |||||||||
| Franchise and shares tax |
947,505 | 820,774 | 650,461 | |||||||||
| Regulatory fees |
1,264,283 | 1,317,015 | 1,122,254 | |||||||||
| Foreclosed assets, net |
(297,806 | ) | 139,578 | 443,228 | ||||||||
| Other expenses |
3,515,186 | 3,994,022 | 3,011,747 | |||||||||
|
|
|
|
|
|
|
|||||||
| Total noninterest expense |
46,177,185 | 46,796,817 | 42,022,425 | |||||||||
|
|
|
|
|
|
|
|||||||
| Income before income tax expense |
29,316,877 | 23,576,290 | 19,220,460 | |||||||||
| Income tax expense |
12,492,891 | 7,567,954 | 6,670,559 | |||||||||
|
|
|
|
|
|
|
|||||||
| Net Income |
$ | 16,823,986 | $ | 16,008,336 | $ | 12,549,901 | ||||||
|
|
|
|
|
|
|
|||||||
| Earnings per share: |
||||||||||||
| Basic |
$ | 2.36 | $ | 2.34 | $ | 1.87 | ||||||
|
|
|
|
|
|
|
|||||||
| Diluted |
$ | 2.28 | $ | 2.25 | $ | 1.79 | ||||||
|
|
|
|
|
|
|
|||||||
| Cash dividends declared per common share |
$ | 0.55 | $ | 0.41 | $ | 0.30 | ||||||
|
|
|
|
|
|
|
|||||||
The accompanying Notes are an integral part of these Consolidated Financial Statements.
43
Table of Contents
HOME BANCORP, INC. AND SUBSIDIARY
CONSOLIDATED STATEMENTS OF COMPREHENSIVE INCOME
| For the Years Ended | ||||||||||||
| December 31, | ||||||||||||
| 2017 | 2016 | 2015 | ||||||||||
| Net Income |
$ | 16,823,986 | $ | 16,008,336 | $ | 12,549,901 | ||||||
| Other Comprehensive Loss |
||||||||||||
| Unrealized losses gains on investment securities |
(1,487,119 | ) | (1,323,064 | ) | (659,057 | ) | ||||||
| Reclassification adjustment for gains included in net income |
— | — | (7,279 | ) | ||||||||
| Tax effect |
520,492 | 463,072 | 233,218 | |||||||||
|
|
|
|
|
|
|
|||||||
| Other comprehensive loss, net of taxes |
(966,627 | ) | (859,992 | ) | (433,118 | ) | ||||||
|
|
|
|
|
|
|
|||||||
| Comprehensive Income |
$ | 15,857,359 | $ | 15,148,344 | $ | 12,116,783 | ||||||
|
|
|
|
|
|
|
|||||||
The accompanying Notes are an integral part of these Consolidated Financial Statements.
44
Table of Contents
HOME BANCORP, INC. AND SUBSIDIARY
CONSOLIDATED STATEMENTS OF CHANGES IN SHAREHOLDERS’ EQUITY
| Common Stock |
Additional Paid-in Capital |
Treasury Stock |
Unallocated Common Stock Held by ESOP |
Unallocated Common Stock Held by RRP |
Retained Earnings |
Accumulated Other Comprehensive Income (Loss) |
Total | |||||||||||||||||||||||||
| Balance, December 31, 2014 |
$ | 90,088 | $ | 93,332,108 | $ | (28,572,891 | ) | $ | (4,909,750 | ) | $ | (202,590 | ) | $ | 93,101,915 | $ | 1,304,876 | $ | 154,143,756 | |||||||||||||
| Net income |
12,549,901 | 12,549,901 | ||||||||||||||||||||||||||||||
| Other comprehensive income |
(433,118 | ) | (433,118 | ) | ||||||||||||||||||||||||||||
| Purchase of Company’s common stock at cost, 155,218 shares |
(3,465,959 | ) | (3,465,959 | ) | ||||||||||||||||||||||||||||
| Reclassification of treasury stock per Louisiana law(1) |
(20,405 | ) | (20,393,258 | ) | 32,038,850 | (11,625,187 | ) | — | ||||||||||||||||||||||||
| Cash dividends declared, $0.30 per share |
(2,162,086 | ) | (2,162,086 | ) | ||||||||||||||||||||||||||||
| Exercise of stock options |
2,716 | 3,279,481 | 3,282,197 | |||||||||||||||||||||||||||||
| RRP shares released for allocation |
(32,106 | ) | 44,000 | 11,894 | ||||||||||||||||||||||||||||
| ESOP shares released for allocation |
641,576 | 357,080 | 998,656 | |||||||||||||||||||||||||||||
| Share-based compensation cost |
121,113 | 121,113 | ||||||||||||||||||||||||||||||
|
|
|
|
|
|
|
|
|
|
|
|
|
|
|
|
|
|||||||||||||||||
| Balance, December 31, 2015 |
$ | 72,399 | $ | 76,948,914 | $ | — | $ | (4,552,670 | ) | $ | (158,590 | ) | $ | 91,864,543 | $ | 871,758 | $ | 165,046,354 | ||||||||||||||
|
|
|
|
|
|
|
|
|
|
|
|
|
|
|
|
|
|||||||||||||||||
| Net income |
16,008,336 | 16,008,336 | ||||||||||||||||||||||||||||||
| Other comprehensive income |
(859,992 | ) | (859,992 | ) | ||||||||||||||||||||||||||||
| Purchase of Company’s common stock at cost, 12,826 shares |
(128 | ) | (128,501 | ) | — | (228,686 | ) | (357,315 | ) | |||||||||||||||||||||||
| Cash dividends declared, $0.41 per share |
(2,987,597 | ) | (2,987,597 | ) | ||||||||||||||||||||||||||||
| Common Stock issued under incentive plans, net of shares surrendered in payment, including tax benefit, 3,877 shares |
39 | 3,442 | (9,221 | ) | (5,740 | ) | ||||||||||||||||||||||||||
| Exercise of stock options |
1,192 | 1,414,744 | 1,415,936 | |||||||||||||||||||||||||||||
| RRP shares released for allocation |
(25,992 | ) | 38,957 | 12,965 | ||||||||||||||||||||||||||||
| ESOP shares released for allocation |
842,631 | 357,080 | 1,199,711 | |||||||||||||||||||||||||||||
| Share-based compensation cost |
370,366 | 370,366 | ||||||||||||||||||||||||||||||
|
|
|
|
|
|
|
|
|
|
|
|
|
|
|
|
|
|||||||||||||||||
| Balance, December 31, 2016 |
$ | 73,502 | $ | 79,425,604 | $ | — | $ | (4,195,590 | ) | $ | (119,633 | ) | $ | 104,647,375 | $ | 11,766 | $ | 179,843,024 | ||||||||||||||
|
|
|
|
|
|
|
|
|
|
|
|
|
|
|
|
|
|||||||||||||||||
| Net income |
16,823,986 | 16,823,986 | ||||||||||||||||||||||||||||||
| Other comprehensive income |
(966,627 | ) | (966,627 | ) | ||||||||||||||||||||||||||||
| Purchase of Company’s common stock at cost, 1,776 shares |
(19 | ) | (17,373 | ) | — | (53,385 | ) | (70,777 | ) | |||||||||||||||||||||||
| Cash dividends declared, $0.55 per share |
(4,070,310 | ) | (4,070,310 | ) | ||||||||||||||||||||||||||||
| Common Stock issued under incentive plans, net of shares surrendered in payment, including tax benefit, 8,485 shares |
85 | 34,018 | (35,036 | ) | (933 | ) | ||||||||||||||||||||||||||
| Exercise of stock options |
1,026 | 1,192,514 | 1,193,540 | |||||||||||||||||||||||||||||
| RRP shares released for allocation |
(11,893 | ) | 35,730 | 23,837 | ||||||||||||||||||||||||||||
| ESOP shares released for allocation |
1,261,488 | 357,080 | 1,618,568 | |||||||||||||||||||||||||||||
| Share-based compensation cost |
516,318 | 516,318 | ||||||||||||||||||||||||||||||
| Common stock issued for acquisition, 1,936,117 shares |
19,361 | 82,940,739 | 82,960,100 | |||||||||||||||||||||||||||||
|
|
|
|
|
|
|
|
|
|
|
|
|
|
|
|
|
|||||||||||||||||
| Balance, December 31, 2017 |
$ | 93,955 | $ | 165,341,415 | $ | — | $ | (3,838,510 | ) | $ | (83,903 | ) | $ | 117,312,630 | $ | (954,861 | ) | $ | 277,870,726 | |||||||||||||
|
|
|
|
|
|
|
|
|
|
|
|
|
|
|
|
|
|||||||||||||||||
| (1) | See Note 2 for details on the Louisiana Business Corporation Act. |
The accompanying Notes are an integral part of these Consolidated Financial Statements.
45
Table of Contents
HOME BANCORP, INC. AND SUBSIDIARY
CONSOLIDATED STATEMENTS OF CASH FLOWS
| Years Ended December 31, | ||||||||||||
| 2017 | 2016 | 2015 | ||||||||||
| Cash flows from operating activities, net of effects of acquisitions: |
||||||||||||
| Net income |
$ | 16,823,986 | $ | 16,008,336 | $ | 12,549,901 | ||||||
| Adjustments to reconcile net income to net cash provided by operating activities: |
||||||||||||
| Provision for loan losses |
2,316,967 | 3,200,000 | 2,070,894 | |||||||||
| Depreciation |
1,959,006 | 1,794,714 | 1,807,480 | |||||||||
| Amortization and accretion of purchase accounting valuations and intangibles |
6,635,159 | 3,256,194 | 4,045,736 | |||||||||
| Net amortization of mortgage servicing asset |
200,019 | 254,077 | 180,364 | |||||||||
| Federal Home Loan Bank stock dividends |
(108,500 | ) | (86,600 | ) | (12,800 | ) | ||||||
| Net amortization of discount on investments |
1,717,378 | 1,652,856 | 1,530,144 | |||||||||
| Gain on sale of investment securities, net |
— | — | (7,279 | ) | ||||||||
| Gain on loans sold, net |
(1,195,921 | ) | (1,770,249 | ) | (1,527,721 | ) | ||||||
| Proceeds, including principal payments, from loans held for sale |
123,321,023 | 179,638,804 | 153,954,728 | |||||||||
| Originations of loans held for sale |
(123,842,048 | ) | (176,373,491 | ) | (153,561,422 | ) | ||||||
| Non-cash compensation |
2,134,886 | 1,570,077 | 1,119,769 | |||||||||
| Deferred income tax expense (benefit) |
2,512,013 | (321,490 | ) | 630,864 | ||||||||
| Impact of Tax Cuts and Jobs Act on deferred taxes |
2,720,822 | — | — | |||||||||
| (Increase) decrease in accrued interest receivable and other assets |
(3,496,668 | ) | (588,526 | ) | 8,905,751 | |||||||
| Increase in cash surrender value of bank-owned life insurance |
(493,598 | ) | (482,653 | ) | (503,790 | ) | ||||||
| (Increase) decrease in accrued interest payable and other liabilities |
(6,453,247 | ) | (7,264,364 | ) | 4,982,769 | |||||||
|
|
|
|
|
|
|
|||||||
| Net cash provided by operating activities |
24,751,277 | 20,487,685 | 36,165,388 | |||||||||
|
|
|
|
|
|
|
|||||||
| Cash flows from investing activities, net of effects of acquisitions: |
||||||||||||
| Purchases of securities available for sale |
(56,997,101 | ) | (47,075,669 | ) | (18,713,312 | ) | ||||||
| Purchases of securities held to maturity |
— | — | (2,927,988 | ) | ||||||||
| Proceeds from maturities, prepayments and calls on securities available for sale |
39,606,341 | 37,458,473 | 30,094,652 | |||||||||
| Proceeds from maturities, prepayments and calls on securities held to maturity |
— | 235,000 | 400,000 | |||||||||
| Proceeds from sales on securities available for sale |
17,040,413 | — | 21,194,622 | |||||||||
| Decrease (increase) in loans, net |
4,040,248 | (7,061,612 | ) | (41,104,084 | ) | |||||||
| Reimbursement from FDIC for covered assets |
141,634 | 51,128 | 403,865 | |||||||||
| Decrease in interest-bearing deposits in banks |
693,000 | 3,259,585 | 863,700 | |||||||||
| Proceeds from sale of repossessed assets |
2,847,000 | 1,410,569 | 5,378,286 | |||||||||
| Purchases of office properties and equipment |
(1,915,830 | ) | (4,112,610 | ) | (828,723 | ) | ||||||
| Proceeds from sale of office properties and equipment |
827,340 | 4,335,095 | 2,016,239 | |||||||||
| Cash received in excess of cash paid in business combination |
68,211,617 | — | (56,404,340 | ) | ||||||||
| Purchases of Federal Home Loan Bank stock |
— | — | (4,751,000 | ) | ||||||||
| Proceeds from redemption of Federal Home Loan Bank stock |
4,180,100 | — | 2,444,900 | |||||||||
|
|
|
|
|
|
|
|||||||
| Net cash provided by (used in) investing activities |
78,674,762 | (11,500,041 | ) | (61,933,183 | ) | |||||||
|
|
|
|
|
|
|
|||||||
| Cash flows from financing activities, net of effects of acquisitions: |
||||||||||||
| Increase in deposits, net |
84,657,541 | 3,943,483 | 42,055,227 | |||||||||
| Borrowings on Federal Home Loan Bank advances |
130,750,000 | 2,642,250,000 | 4,931,772,337 | |||||||||
| Repayments of Federal Home Loan Bank advances |
(194,782,012 | ) | (2,648,729,269 | ) | (4,929,994,229 | ) | ||||||
| Decrease in securitites sold under repurchase agreements |
— | — | (20,000,000 | ) | ||||||||
| Proceeds from exercise of stock options |
1,193,540 | 1,415,936 | 3,282,197 | |||||||||
| Issuance of stock under incentive plans |
(933 | ) | (5,740 | ) | — | |||||||
| Dividends paid to shareholders |
(4,070,310 | ) | (2,987,597 | ) | (2,162,086 | ) | ||||||
| Purchase of Company’s common stock |
(70,777 | ) | (357,315 | ) | (3,465,959 | ) | ||||||
|
|
|
|
|
|
|
|||||||
| Net cash provided (used in) by financing activities |
17,677,049 | (4,470,502 | ) | 21,487,487 | ||||||||
|
|
|
|
|
|
|
|||||||
| Net change in cash and cash equivalents |
121,103,088 | 4,517,142 | (4,280,308 | ) | ||||||||
| Cash and cash equivalents at beginning of year |
29,314,741 | 24,797,599 | 29,077,907 | |||||||||
|
|
|
|
|
|
|
|||||||
| Cash and cash equivalents at end of year |
$ | 150,417,829 | $ | 29,314,741 | $ | 24,797,599 | ||||||
|
|
|
|
|
|
|
|||||||
| Supplementary cash flow information: |
||||||||||||
| Interest paid on deposits and borrowed funds |
$ | 6,548,881 | $ | 5,207,346 | $ | 3,844,807 | ||||||
| Income taxes paid |
10,053,039 | 7,913,000 | 3,702,500 | |||||||||
| Noncash investing and financing activities: |
||||||||||||
| Transfer of loans to repossessed assets |
$ | 534,738 | $ | 1,885,180 | $ | 3,073,326 | ||||||
| Common stock issued in consideration of St. Martin Bancshares, Inc. |
82,960,100 | — | — | |||||||||
| Assets acquired and liabilities assumed in acquisitions: |
||||||||||||
| Assets acquired in acquisitions |
592,895,595 | — | 351,138,388 | |||||||||
| Liablities assumed in acquisitions |
559,201,771 | — | 291,313,436 | |||||||||
The accompanying Notes are an integral part of these Consolidated Financial Statements.
46
Table of Contents
HOME BANCORP, INC. AND SUBSIDIARY
NOTES TO CONSOLIDATED FINANCIAL STATEMENTS
1. Description of Business
Home Bancorp, Inc., a Louisiana Corporation (“Company”), was organized by Home Bank (a federally-chartered savings bank and the predecessor of Home Bank, N.A.) (“Bank”) in May 2008 to facilitate the conversion of the Bank from the mutual to the stock form (“Conversion”) of ownership. The Conversion was completed on October 2, 2008, at which time the Company became the holding company for the Bank, with the Company owning all of the issued and outstanding shares of the Bank’s common stock. The Company and Bank are headquartered in Lafayette, Louisiana. As of December 31, 2017, the Company was a bank holding company.
As of December 31, 2017, Home Bank, N.A. was a nationally-chartered bank. The Bank was originally chartered in 1908 as a Louisiana state-chartered savings association. The Bank converted to a federal mutual savings bank charter in 1993.
In 2010, the Bank expanded into the Northshore (of Lake Pontchartrain) region through a Federal Deposit Insurance Corporation (“FDIC”) assisted acquisition of certain assets and liabilities of the former Statewide Bank (“Statewide”). In July 2011, the Bank expanded into the Greater New Orleans region through its acquisition of GS Financial Corporation (“GSFC”), the former holding company of Guaranty Savings Bank (“Guaranty”). In February 2014, the Bank expanded into west Mississippi through its acquisition of Britton & Koontz Capital Corporation (“Britton & Koontz”), the holding company for Britton & Koontz Bank, N.A. (“Britton & Koontz Bank”) of Natchez, Mississippi. In September 2015, the Bank expanded its presence in the Greater New Orleans region through the acquisition of Louisiana Bancorp, Inc. (“Louisiana Bancorp”), the former holding company of Bank of New Orleans (“BNO”) of Metairie, Louisiana. In December 2017, the Bank expanded its presence in the Acadiana market through the acquisition of St. Martin Bancshares (“SMB”), the former holding company of St. Martin Bank & Trust Company (“St. Martin Bank”) of St. Martinville, Louisiana. As of December 31, 2017, the Bank conducted business from 40 banking offices in the Greater Lafayette, Southwest Louisiana, Northshore, Baton Rouge and Greater New Orleans regions of south Louisiana and west Mississippi.
The Bank is primarily engaged in attracting deposits from the general public and using those funds to invest in loans and investment securities. The Bank’s principal sources of funds are customer deposits, repayments of loans, repayments of investments and funds borrowed from outside sources such as the Federal Home Loan Bank (“FHLB”) of Dallas. The Bank derives its income principally from interest earned on loans and investment securities and, to a lesser extent, from fees received in connection with the origination of loans, service charges on deposit accounts and for other services. The Bank’s primary expenses are general operating expenses and interest expense on deposits and borrowings.
The Bank’s primary regulator is the Office of the Comptroller of the Currency (“OCC”). Its deposits are insured to the maximum amount permissible under federal law by the FDIC. In July 2010, the Dodd-Frank Wall Street Reform and Consumer Protection Act (“Dodd-Frank Act”) was passed by Congress. The Dodd-Frank Act, among other things, imposed new restrictions and an expanded framework of regulatory oversight for financial institutions and their holding companies, including the Bank and the Company. The Dodd-Frank Act also created the Consumer Financial Protection Bureau (“CFPB”) that has the authority to promulgate rules intended to protect consumers in the financial products and services market.
2. Summary of Significant Accounting Policies
Principles of Consolidation
The consolidated financial statements include the accounts of the Company and the Bank. All significant intercompany balances and transactions have been eliminated in consolidation.
47
Table of Contents
Use of Estimates
The preparation of financial statements in conformity with accounting principles generally accepted in the United States (“GAAP”) requires management to make estimates and assumptions that affect the reported amounts of assets and liabilities and disclosure of contingent assets and liabilities as of the date of the financial statements and the reported amounts of revenues and expenses during the reporting period. Actual results could differ from those estimates. Material estimates that are particularly susceptible to significant change in the near term include, but are not limited to, the determination of the allowance for loan losses, income taxes, valuation of investments with other-than-temporary impairment, acquisition accounting valuations and valuation of share-based compensation.
Cash and Cash Equivalents
For purposes of reporting cash flows, cash and cash equivalents include cash on hand, due from banks and interest-bearing deposits with the FHLB. The Company considers all highly liquid debt instruments with original maturities of three months or less (excluding interest-bearing deposits in banks) to be cash equivalents.
The Bank is required to maintain cash reserves with the Federal Reserve Bank. The requirement is dependent upon the Bank’s cash on hand or noninterest-bearing balances. There was no reserve requirement as of December 31, 2017 or 2016. The Bank was in compliance with reserve requirements at such dates.
Investment Securities
The Company follows the guidance under the Financial Accounting Standards Board (“FASB”) Accounting Standards Codification (“ASC”) 320, Investments – Debt and Equity Securities. This standard addresses the accounting and reporting for investments in equity securities that have readily determinable fair values and for all investments in debt securities. Under the topic, investment securities, which the Company both positively intends and has the ability to hold to maturity, are classified as held to maturity and carried at amortized cost.
Investment securities that are acquired with the intention of being resold in the near term are classified as trading securities under ASC 320 and are carried at fair value, with unrealized holding gains and losses recognized in current earnings. The Company did not hold any securities for trading purposes at, or during the years ended, December 31, 2017 or 2016.
Securities not meeting the criteria of either trading securities or held to maturity are classified as available for sale and are carried at fair value. Unrealized holding gains and losses for these securities are recognized, net of related income tax effects, in the Consolidated Statements of Comprehensive Income.
Interest income earned on securities either held to maturity or available for sale is included in current earnings, including the amortization of premiums and the accretion of discounts using the interest method. Premiums and discounts are amortized or accreted over the life of the related security as an adjustment to the yield. The gain or loss realized on the sale of securities classified as available for sale or held to maturity, as determined using the specific identification method for determining the cost of the securities sold, is computed with reference to its amortized cost and is also included in current earnings.
The Company reviews investment securities for other-than-temporary impairment quarterly. Impairment is considered to be other-than-temporary if it is likely that all amounts contractually due will not be received for debt securities and when there is no positive evidence indicating that an investment’s carrying amount is recoverable in the near term for equity securities. When a decline in the fair value of available for sale and held to maturity securities below cost is deemed to be credit related, a charge for other-than-temporary impairment is included in earnings as “Other-than-temporary impairment of securities”. The decline in fair value attributed to non-credit related factors is recognized in other comprehensive income and a new cost basis for the security is established. The new cost basis is not changed for subsequent recoveries in fair value. Increases and decreases between fair value and cost on available for sale securities are reflected in the Consolidated Statements of Comprehensive Income. In evaluating whether impairment is temporary or other-than-temporary, the Company considers, among other things, the time period the security has been in an unrealized loss position; the financial condition of the issuer and its industry; recommendations of investment advisors; economic forecasts; market or industry trends; changes in tax laws, regulations, or other governmental policies significantly affecting the issuer; any downgrades from rating agencies; and any reduction or elimination of dividends. The Company’s intent and ability to hold a security for a period of time sufficient to allow for any anticipated recovery in fair value is also considered.
48
Table of Contents
Loans Held for Sale
The Company sells mortgage loans and loan participations for an amount equal to the principal amount of loans or participations with yields to investors based upon current market rates. Realized gains and losses related to loan sales are included in noninterest income.
The Company allocates the cost to acquire or originate a mortgage loan between the loan and the right to service the loan if it intends to sell or securitize the loan and retain servicing rights. In addition, the Company periodically assesses capitalized mortgage servicing rights for impairment based on the fair value of such rights. To the extent that temporary impairment exists, write-downs are recognized in current earnings as an adjustment to the corresponding valuation allowance. Permanent impairment is recognized through a write-down of the asset with a corresponding reduction in the valuation allowance. For purposes of performing its impairment evaluation, the portfolio is stratified on the basis of certain risk characteristics, including loan type and interest rates. Capitalized servicing rights are amortized over the period of, and in proportion to, estimated net servicing income, which considers appropriate prepayment assumptions.
For financial reporting purposes, the Company classifies a portion of its loans as “Mortgage loans held for sale”. Included in this category are loans which the Company has the current intent to sell and loans which are available to be sold in the event that the Company determines that loans should be sold to support the Company’s investment and liquidity objectives, as well as to support its overall asset and liability management strategies. Loans included in this category for which the Company has the current intention to sell are recorded at the lower of aggregate cost or fair value. As of December 31, 2017 and 2016, the Company had $5,873,000 and $4,156,000, respectively, in loans classified as “Mortgage loans held for sale.”
As of December 31, 2017 and 2016 the Company had $164,322,000 and $188,103,000, respectively, outstanding in loans sold to government agencies that it was servicing through a third party.
Loans
The following describes the distinction between originated and Acquired Loans and certain significant accounting policies relevant to each category.
Originated Loans
Loans are carried net of discounts on loan originations are amortized using the level yield interest method over the remaining contractual life of the loan. Nonrefundable loan origination fees, net of direct loan origination costs, are deferred and recognized over the life of the loan as an adjustment of yield using the interest method.
Interest on loans receivable is accrued as earned using the interest method over the life of the loan. Interest on loans deemed uncollectible is excluded from income. The accrual of interest is discontinued and reversed against current income once loans become more than 90 days past due or earlier if conditions warrant. The past due status of loans is determined based on the contractual terms. When a loan is placed on nonaccrual status, previously accrued and uncollected interest is charged against interest income on loans. Interest payments are applied to reduce the principal balance on nonaccrual loans. Loans are returned to accrual status when all past due payments are received in full and future payments are probable.
Third party property valuations are obtained at the time of origination for real estate secured loans. When a determination is made that a loan has deteriorated to the point of being deemed a criticized or classified loan, updated valuations may be ordered to help determine if there is impairment, which may lead to a recommendation for partial charge off or appropriate allowance allocation. Property valuations are ordered through, and reviewed by, the Company’s Appraisal and Review Department. The Company typically orders an “as is” valuation for collateral property if the loan is in a criticized loan classification.
Loans, or portions of loans, are charged off in the period that such loans, or portions thereof, are deemed uncollectible. The collectability of individual loans is determined through an estimate of the fair value of the underlying collateral and/or assessment of the financial condition and repayment capacity of the borrower.
49
Table of Contents
Acquired Loans
Acquired Loans at December 31, 2017 and 2016 are those associated with our acquisitions of Statewide, GSFC, Britton & Koontz, Louisiana Bancorp and SMB. These loans were recorded at estimated fair value at the acquisition date with no carryover of the related allowance for loan losses. The Acquired Loans were segregated between those considered to be performing (“acquired performing”) and those with evidence of credit deterioration (“acquired impaired”), and then further segregated into loan pools designed to facilitate the development of expected cash flows. The fair value estimate for each pool of acquired performing and acquired impaired loans was based on the estimate of expected cash flows, both principal and interest, from that pool, discounted at prevailing market interest rates.
The difference between the fair value of an acquired performing loan pool and the contractual amounts due at the acquisition date (the “fair value discount”) is accreted into income over the estimated life of the pool. Management estimates an allowance for loan losses for acquired performing loans using a methodology similar to that used for originated loans. The allowance determined for each loan pool is compared to the remaining fair value discount for that pool. If the allowance amount calculated under the Company’s methodology is greater than the Company’s remaining discount, the additional amount called for is added to the reported allowance through a provision for loan losses. If the allowance amount calculated under the Company’s methodology is less than the Company’s recorded discount, no additional allowance or provision is recognized. Actual losses first reduce any remaining fair value discount for the loan pool. Once the discount is fully depleted, losses are applied against the allowance established for that pool. Acquired performing loans are placed on nonaccrual status and considered and reported as nonperforming or past due using the same criteria applied to the originated portfolio.
The excess of cash flows expected to be collected from an acquired impaired loan pool over the pool’s estimated fair value at acquisition is referred to as the accretable yield and is recognized in interest income using an effective yield method over the remaining life of the pool. Each pool of acquired impaired loans is accounted for as a single asset with a single composite interest rate and an aggregate expectation of cash flows.
Management recasts the estimate of cash flows expected to be collected on each acquired impaired loan pool periodically. If the present value of expected cash flows for a pool is less than its carrying value, an impairment is recognized by an increase in the allowance for loan losses and a charge to the provision for loan losses. If the present value of expected cash flows for a pool is greater than its carrying value, any previously established allowance for loan losses is reversed and any remaining difference increases the accretable yield which will be taken into interest income over the remaining life of the loan pool. Acquired impaired loans are generally not subject to individual evaluation for impairment and are not reported with impaired loans, even if they would otherwise qualify for such treatment.
Allowance for Loan Losses
The allowance for loan losses on loans in our portfolio is maintained at an amount which management believes covers the reasonably estimable and probable losses on such portfolio. The allowance for loan losses is comprised of specific and general reserves. The Company determines specific reserves based on the provisions of ASC 310, Receivables. The Company’s allowance for loan losses includes a measure of impairment related to those loans specifically identified for evaluation under the topic. This measurement is based on a comparison of the recorded investment in the loan with either the expected cash flows discounted using the loan’s original effective interest rate, observable market price for the loan or the fair value of the collateral underlying certain collateral-dependent loans. General reserves are based on management’s evaluation of many factors, including current economic trends, industry experience, historical loss experience (generally three years), industry loan concentrations, the borrowers’ abilities to repay and repayment performance, probability of foreclosure and estimated collateral values. As these factors change, adjustments to the allowance for loan losses are charged to current operations. Loans that are determined to be uncollectible are charged-off against the allowance for loan losses once that determination is made.
While management uses available information to make loan loss allowance evaluations, adjustments to the allowance may be necessary based on changes in economic and other conditions or changes in accounting guidance. The OCC, as an integral part of its examination processes, periodically reviews the allowance for loan losses. The OCC may require the recognition of adjustments to the allowance for loan losses based on its judgment of information available to it as of the time of its examinations. To the extent the OCC’s estimates differ from management’s estimates, additional provisions to the allowance for loan losses may be required as of the time of its examination. As part of the risk management program, an independent review is performed on the loan portfolio, which supplements management’s assessment of the loan portfolio and the allowance for loan losses. The result of the independent review is reported directly to the Audit Committee of the Board of Directors.
50
Table of Contents
Repossessed Assets
Repossessed assets are recorded at fair value less estimated selling costs at the date acquired or upon receiving new property valuations. Costs relating to the development and improvement of foreclosed property are capitalized, and costs relating to holding and maintaining the property are expensed. Write-downs from cost to fair value at the date of foreclosure are charged against the allowance for loan losses. Valuations are performed periodically and a charge to operations is recorded if the carrying value of a property exceeds its fair value less selling costs. Generally, the Company appraises the property at the time of foreclosure and at least every 12 months following the foreclosure. The Company had $728,000 and $2,893,000 of repossessed assets as of December 31, 2017 and 2016, respectively. Repossessed Assets are recorded in accrued interest receivable and other assets on the Consolidated Statements of Financial Condition.
Federal Home Loan Bank Stock
As a member of the FHLB, the Bank is required to maintain a minimum investment in its stock that varies with the level of FHLB advances outstanding. The stock is bought from and sold to the FHLB based upon its $100 par value. The stock does not have a readily determinable fair value and as such is classified as restricted stock, carried at cost and evaluated for impairment in accordance with GAAP. The stock’s value is determined by the ultimate recoverability of the par value rather than by recognizing temporary declines. The determination of whether the par value will ultimately be recovered is influenced by criteria such as: (a) the significance of the decline in net assets of the FHLB as compared to the capital stock amount and the length of time this situation has persisted, (b) commitments by the FHLB to make payments required by law or regulation and the level of such payments in relation to the operating performance, (c) the impact of legislative and regulatory changes on the customer base of the FHLB and (d) the liquidity position of the FHLB.
Office Properties and Equipment
Office properties and equipment are stated at cost less accumulated depreciation. Depreciation is computed using the straight-line method with rates based on the estimated useful lives of the individual assets, which range from 3 to 40 years. Expenditures which substantially increase the useful lives of existing property and equipment are capitalized while routine expenditures for repairs and maintenance are expensed as incurred.
Cash Surrender Value of Bank-Owned Life Insurance
Life insurance contracts represent single premium life insurance contracts on the lives of certain officers of the Bank. The Bank is the beneficiary of these policies. These contracts are reported at their cash surrender value and changes in the cash surrender value are included in noninterest income.
Intangible Assets
Intangible assets consist of goodwill, core deposit intangibles and mortgage servicing rights. These assets are recorded in accrued interest receivable and other assets on the Consolidated Statements of Financial Condition. Goodwill represents the excess purchase price over the fair value of net assets acquired in business acquisitions. Goodwill is not amortized but rather is evaluated for impairment at least annually. Core deposit intangibles represent the estimated value related to customer deposit relationships assumed in the Company’s acquisitions. Core deposit intangibles are being amortized over nine to 15 years. The mortgage servicing rights represent servicing assets related to mortgage loans sold and serviced at fair value. Mortgage servicing rights are being amortized over a maximum of 10 years using an accelerated method.
Shareholders’ Equity
Effective January 1, 2015, companies incorporated under Louisiana law became subject to the Louisiana Business Corporation Act. Provisions of the Louisiana Business Corporation Act eliminate the concept of treasury stock and provide that shares reacquired by a company are to be treated as authorized but unissued shares. Accounting principles generally accepted in the United States of America state that accounting for treasury stock shall conform to state law. The Company’s Consolidated Financial Statements at and for the year ended December 31, 2015 reflect this change. For the years ended December 31, 2017, 2016 and 2015, the cost of shares repurchased by the Company have been allocated to common stock, additional paid-in capital and retained earnings.
51
Table of Contents
Transfer of Financial Assets
Transfers of financial assets are accounted for as sales when control over the assets has been relinquished. Control over transferred assets is deemed to be surrendered when the assets have been isolated from the Company, the transferee obtains the right, free of conditions that constrain it from taking advantage of that right, to pledge or exchange the transferred assets and the Company does not maintain effective control over the transferred assets through an agreement to repurchase them before maturity.
Salary Continuation Agreements
The Company records the expense associated with its salary continuation agreements over the service periods of the persons covered under these agreements.
Income Taxes
The Company accounts for income taxes under the liability method. Deferred tax assets and liabilities are recorded for the future tax consequences attributable to differences between the financial statement carrying amounts of existing assets and liabilities and their respective tax bases. Future tax benefits are recognized to the extent that realization of such benefits is more likely than not. Deferred tax assets and liabilities are measured using enacted tax rates expected to apply to taxable income in the years in which the assets and liabilities are expected to be recovered or settled. The effect of a change in tax rates on deferred tax assets and liabilities is recognized in income taxes during the period that includes the enactment date.
In the event the future tax consequences of differences between the financial reporting bases and the tax bases of the Company’s assets and liabilities results in deferred tax assets, an evaluation of the probability of being able to realize the future benefits indicated by such asset is required. A valuation allowance is provided for the portion of the deferred tax asset when it is more likely than not that some or all of the deferred tax asset will not be realized. In assessing the realizability of the deferred tax assets, management considers the scheduled reversals of deferred tax liabilities, projected future taxable earnings and tax planning strategies.
The income tax benefit or expense is the total of the current year income tax due or refundable and the change in deferred tax assets and liabilities.
A tax position is recognized as a benefit only if it is more likely than not that the tax position would be sustained in a tax examination, with a tax examination presumed to occur. The amount recognized is the largest amount of tax benefit that is greater than 50 percent likely of being realized on examination. For tax positions not meeting the more likely than not test, no tax benefit is recorded.
The Company recognizes interest and penalties accrued related to unrecognized tax benefits, if applicable, in noninterest expense. During the years ended December 31, 2017, 2016, and 2015, the Company did not recognize any interest or penalties in its financial statements, nor has it recorded an accrued liability for interest or penalty payments.
Stock-based Compensation Plans
The Company issues stock options under the 2009 Stock Option Plan and the 2014 Equity Incentive Plan to directors, officers and other key employees. In accordance with the requirements of ASC 718, Compensation – Stock Compensation, the Company has adopted a fair value based method of accounting for employee stock compensation plans, whereby compensation cost is measured as of the grant date based on the fair value of the award and is recognized over the service period, which is usually the vesting period.
The Company may issue restricted stock under the 2009 Recognition and Retention Plan and restricted stock or restricted stock units under the 2014 Equity Incentive Plan for directors, officers and other key employees. Awards under the plans may not be sold or otherwise transferred until certain restrictions have lapsed. The unearned compensation related to these awards is amortized to compensation expense over the service period, which is usually the vesting period. The total share-based compensation expense for these awards is determined based on the market price of the Company’s common stock as of the date of grant applied to the total number of shares granted and is amortized over the vesting period.
Earnings Per Share
Earnings per share represents income available to common shareholders divided by the weighted-average number of common shares outstanding during the period. Diluted earnings per share reflects additional common shares that would have been outstanding if dilutive potential common shares had been issued, as well as any adjustment to income that would result from the assumed issuance.
52
Table of Contents
Comprehensive Income
GAAP generally requires that recognized revenues, expenses, gains and losses be included in net earnings. Although certain changes in assets and liabilities, such as unrealized gains and losses on available for sale securities, are reported as a separate component of the equity section of the balance sheets, such items, along with net earnings, are components of comprehensive income. The tax effect for unrealized gains and losses on investment securities was ($520,492), ($463,072) and ($230,670) for the periods ending December 31, 2017, 2016 and 2015, respectively. The reclassification adjustment for gains included in net income had a no tax effect for the periods ending December 31, 2017 and 2016 and ($2,548) for the period ending December 31, 2015. Comprehensive income is reflected in the Consolidated Statements of Comprehensive Income.
Reclassifications
Certain reclassifications have been made to prior period balances to conform to the current period presentation.
Recent Accounting Pronouncements
In January 2016, the Financial Accounting Standards Board (“FASB”) issued Accounting Standards Update (“ASU”) 2016-01, “Recognition and Measurement of Financial Assets and Financial Liabilities”. The ASU amendments include changes related to how certain equity investments are measured, recognize changes in the fair value of certain financial liabilities measured under the fair value option, and disclose and present financial assets and liabilities on the Company’s consolidated financial statements. Additionally, the ASU will also require entities to present financial assets and financial liabilities separately, grouped by measurement category and form of financial asset in the statement of financial position or in the accompanying notes to the financial statements. Entities will also no longer have to disclose the methods and significant assumptions for financial instruments measured at amortized cost, but will be required to measure such instruments under the “exit price” notion for disclosure purposes. The ASU is effective for annual and interim periods beginning after December 15, 2017. The Company assessed this amendment earlier this year and anticipates that it will have no material impact on its Consolidated Financial Statements.
In February 2016, the FASB issued ASU 2016-02, “Conforming Amendments Related to Leases”. This ASU amends the codification regarding leases in order to increase transparency and comparability. The ASU requires companies to recognize lease assets and liabilities on the statement of condition and disclose key information about leasing arrangements. Upon implementation, lessee will recognize a liability to make lease payments and a right-of-use asset representing its right to use the leased asset for the lease term. The ASU is effective for annual and interim periods beginning after December 15, 2018. The Company is currently assessing the amendment but does not anticipate it will have a material impact on our Consolidated Financial Statements. Based on the Company’s preliminary assessment of its current leases, the impact to the Company’s consolidated balance sheet is estimated to be less than a 1% increase in assets and liabilities.
In June 2016, the FASB issued ASU 2016-13, “Measurement of Credit Losses on Financial Instruments”. The ASU requires a financial asset (or a group of financial assets) measured at amortized cost basis to be presented at the net amount expected to be collected. The allowance for credit losses is a valuation account that is deducted from the amortized cost basis of the financial assets to present the net carrying value at the amount expected to be collected on the financial assets. The income statement reflects the measurement of credit losses for newly recognized financial assets, as well as the expected increases or decreases of expected credit losses that have taken place during the period. The measurement of expected credit losses is based on relevant information about past events, including historical experience, current conditions, and reasonable and supportable forecasts that affect the collectability of the reported amount of financial assets. An entity must use judgment in determining the relevant information and estimation methods that are appropriate in its circumstances. The allowance for credit losses for purchased financial assets with a more-than-insignificant amount of credit deterioration since origination that are measured at amortized cost basis is determined in a similar manner to other financial assets measured at amortized cost basis; however, the initial allowance for credit losses is added to the purchase price rather than being reported as a credit loss expense. Only subsequent changes in the allowance for credit losses are recorded as a credit loss expense for these assets. Off-balance-sheet arrangements such as commitments to extend credit, guarantees, and standby letters of credit that and are not unconditionally cancellable are also within the scope of this amendment. Credit losses relating to debt securities should be recorded through an allowance for credit losses. This ASU is effective for fiscal years beginning after December 31, 2019. An entity will apply the amendments in this update on a modified
53
Table of Contents
retrospective basis, through a cumulative-effect adjustment to retained earnings as of the beginning of the first reporting period in which the guidance is effective. The Company is currently assessing this accounting standard and the implementation of a new software application during 2018 to assist in determining the impact to our Consolidated Financial Statements. It is too early to assess the impact this guidance will have on our Consolidated Financial Statements.
In August 2016, the FASB issued ASU No. 2016-15, “Statement of Cash Flows (Topic 230): Classification of Certain Cash Receipts and Cash Payments”. The amendments in this ASU clarify the proper classification for certain cash receipts and cash payments, including clarification on debt prepayment or debt extinguishment costs, settlement of zero-coupon debt instruments, contingent consideration payments made after a business combination, proceeds from the settlement of insurance claims, and proceeds from the settlement of corporate-owned life insurance policies, including bank-owned life insurance policies, among others. The amendments in this update are effective for fiscal years beginning after December 15, 2017, including interim periods within those fiscal years. The Company is currently assessing the amendment and does not anticipate it will have a material impact on our Consolidated Financial Statements.
In January 2017, FASB issued ASU No. 2017-04, “Intangibles – Goodwill and Other, Simplifying the Test for Goodwill Impairment”. The amendment in this ASU eliminates the requirement to calculate the implied fair value of goodwill in order to measure a goodwill impairment charge. An entity will record an impairment charge based on the excess of the carrying amount over its fair value. This ASU is effective for fiscal and interim testing periods beginning after December 15, 2019. The Company is currently assessing the amendment and does not anticipate it will have a material impact on our Consolidated Financial Statements.
In April 2017, FASB issued ASU No. 2017-8, “Receivables—Nonrefundable Fees and Other Costs (Subtopic 310-20): Premium Amortization on Purchased Callable Debt Securities”. This ASU shortens the amortization period for the premium on certain purchased callable debt securities to the earliest call date. The accounting for purchased callable debt securities held at a discount does not change under the new guidance. This ASU is effective for fiscal and interim periods beginning after December 15, 2018. The Company is currently assessing the amendment and does not anticipate it will have an impact on our Consolidated Financial Statements.
ASU 2018-02, “Income Statement — Reporting Comprehensive Income (Topic 220): Reclassification of Certain Tax Effects from Accumulated Other Comprehensive Income.” ASU 2018-02 was issued to address the income tax accounting treatment of the stranded tax effects within other comprehensive income as a result of tax reform. This issue came about from the enactment of the Tax Cuts and Jobs Act on December 22, 2017 that changed the Company’s income tax rate from 35% to 21%. The ASU changed current accounting whereby an entity may elect to reclassify the stranded tax effect from accumulated other comprehensive income to retained earnings. The ASU is effective for periods beginning after December 15, 2018 although early adoption is permitted. The Company plans to early adopt ASU 2018-02 in the first quarter of 2018 and will reclassify its stranded tax credit of $206,000 within accumulated other comprehensive income to retained earnings at March 31, 2018.
3. Acquisition Activity
St. Martin Bancshare, Inc. On December 6, 2017, the Company completed the acquisition of St. Martin Bancshares, Inc. (“SMB”), the former holding company of St. Martin Bank & Trust Company (“St. Martin Bank”) of St. Martinville, Louisiana. Shareholders of SMB received 9.2839 shares of Home Bancorp common stock for each share of SMB common stock. In addition, immediately prior to the closing of the merger, SMB paid a special cash distribution of $94.00 per share to its shareholders.
The acquisition was accounted for under the acquisition method of accounting in accordance with ASC 805, Business Combinations. In accordance with ASC 805, the Company recorded goodwill totaling $49,268,000 from the acquisition as a result of consideration transferred over net assets acquired. Both the assets acquired and liabilities assumed were recorded at their respective acquisition date fair values. Identifiable intangible assets, including core deposit intangible assets, were recorded at fair value.
The fair value estimates of SMB’s assets and liabilities recorded are preliminary and subject to refinement as additional information becomes available. Under current accounting principles, the Company’s estimates of fair values may be adjusted for a period of up to one year from the acquisition date.
54
Table of Contents
The assets acquired and liabilities assumed, as well as the adjustments to record the assets and liabilities at fair value, are presented in the following table as of December 6, 2017.
| (dollars in thousands) |
As Acquired |
Preliminary Fair Value Adjustments |
As recorded by Home Bancorp |
|||||||||
| Assets |
||||||||||||
| Cash and cash equivalents |
$ | 69,444 | $ | — | $ | 69,444 | ||||||
| Investment securities |
54,094 | (308 | )(a) | 53,786 | ||||||||
| Loans |
447,885 | (8,013 | )(b) | 439,872 | ||||||||
| Repossessed assets |
263 | (54 | )(c) | 209 | ||||||||
| Office properties and equipment, net |
5,960 | 1,121 | (d) | 7,081 | ||||||||
| Core deposit intangible |
238 | 6,528 | (e) | 6,766 | ||||||||
| Other assets |
18,766 | (3,258 | )(f) | 15,508 | ||||||||
|
|
|
|
|
|
|
|||||||
| Total assets acquired |
$ | 596,650 | $ | (3,984 | ) | $ | 592,666 | |||||
|
|
|
|
|
|
|
|||||||
| Liabilities |
||||||||||||
| Interest-bearing deposits |
$ | 355,973 | $ | (110 | )(g) | $ | 355,863 | |||||
| Noninterest-bearing deposits |
177,634 | — | 177,634 | |||||||||
| FHLB advances |
17,534 | (202 | )(h) | 17,332 | ||||||||
| Other liabilities |
6,642 | 1,501 | (i) | 8,143 | ||||||||
|
|
|
|
|
|
|
|||||||
| Total liabilities assumed |
$ | 557,783 | $ | 1,189 | $ | 558,972 | ||||||
|
|
|
|
|
|
|
|||||||
| Excess of assets acquired over liabilities assumed |
33,694 | |||||||||||
| Stock issuance |
(82,962 | ) | ||||||||||
|
|
|
|||||||||||
| Total goodwill recorded |
$ | 49,268 | ||||||||||
|
|
|
|||||||||||
| (a) | The adjustment represents the market value adjustments on SMB’s investments based on their interest rate risk and credit risk. |
| (b) | The adjustment to reflect the fair value of loans includes: |
| • | Adjustment of $5.9 million to reflect the removal of SMB’s allowance for loan losses in accordance with ASC 805. |
| • | Adjustment of $3.8 million for loans within the scope of ASC 310-30. As a result of an analysis by management of all impaired loans, $8.9 million of loans were determined to be within the scope of, and were evaluated under, ASC 310-30. The contractually required payments receivable related to ASC 310-30 loans is approximately $10.9 million with expected cash flow to be collected of $7.2 million. The estimated fair value of such loans is $5.2 million, with a nonaccretable difference of $3.8 million and an accretable yield of $2.0 million; and |
| • | Adjustment of $10.8 million for all remaining loans determined not to be within the scope of ASC 310-30. Loans which are not within the scope of ASC 310-30 totaled $444.6 million. In determining the fair value of the loans which are not within the scope of ASC 310-30, the acquired loan portfolio was evaluated based on risk characteristics and other credit and market criteria to determine a credit quality adjustment to the fair value of the loans acquired. The acquired loan balance was reduced by the aggregate amount of the credit quality adjustment in determining the fair value of the loans. |
| (c) | The adjustment represents the write down of the book value of SMB’s repossessed assets to their estimated fair value, as adjusted for estimated costs to sell. |
| (d) | The adjustment represents the adjustment of SMB’s office properties and equipment to their estimated fair value at the acquisition date. |
| (e) | The adjustment represents the value of the core deposit base assumed in the acquisition. The core deposit asset was recorded as an identifiable intangible asset and will be amortized on an accelerated basis over the estimated life of the deposit base of 10 years. |
| (f) | The adjustment is to record the deferred tax asset on the transaction and the estimated fair value on other assets. |
| (g) | The adjustment represents the fair value of certificates of deposit acquired based on current interest rates for similar instruments. The adjustment will be recognized using a level yield amortization method based on maturities of the deposit liabilities. |
| (h) | The adjustment is to record the fair value of FHLB advances acquired at various terms and maturities based on market rates at the acquisition date. The adjustment will be recognized using a level yield amortization method based on maturities of the borrowings. |
| (i) | The adjustment is to accrue all the liabilities owed by SMB payable at the acquisition date. |
Acquired loans which are impaired as of the date of acquisition are accounted for under ASC 310-30, Loans and Debt Securities Acquired with Deteriorated Credit Quality. In accordance with ASC 310-30 and in estimating the fair value of the acquired loans with deteriorated credit quality as of the acquisition date, we (a) calculated the contractual amount and timing of undiscounted principal and interest payments (the “undiscounted contractual cash flows”) and (b) estimated the amount and timing of undiscounted expected principal and interest payments (the “undiscounted expected cash flows”). The difference between the undiscounted contractual cash flows and the undiscounted expected cash flows is the nonaccretable difference. The nonaccretable difference totaled $3,760,000 as of December 6, 2017 and represented an estimate of the undiscounted loss exposure in the loans acquired with deteriorated credit quality as of the acquisition date.
55
Table of Contents
The following table summarizes the accretable yield on the loans acquired from SMB with deteriorated credit quality as of December 6, 2017 and the changes therein through December 31, 2017.
| (dollars in thousands) |
Accretable Yield |
|||
| Estimated fair value of loans acquired |
$ | 5,168 | ||
|
|
|
|||
| Less: |
||||
| Undiscounted contractual cash flows |
10,909 | |||
| Undiscounted cash flows not expected to be collected (nonaccretable difference) |
(3,760 | ) | ||
|
|
|
|||
| Undiscounted cash flows expected to be collected |
7,149 | |||
|
|
|
|||
| Accretable yield as of December 6, 2017 |
(1,981 | ) | ||
| Accretion during 2017 |
34 | |||
|
|
|
|||
| Accretable yield as of December 31, 2017 |
$ | (1,947) | ||
|
|
|
|||
The following pro forma information for the years ended December 31, 2017 and 2016 reflects the Company’s estimated condensed consolidated results of operations as if the acquisition of SMB occurred at January 1, 2016, unadjusted for potential cost savings.
| (dollars in thousands except per share information) |
2017 | 2016 | ||||||
| Net interest income |
$ | 93,706 | $ | 90,280 | ||||
| Noninterest income |
14,039 | 15,554 | ||||||
| Noninterest expense |
62,838 | 63,875 | ||||||
| Net income |
28,003 | 25,451 | ||||||
| Earnings per share – basic |
$ | 3.14 | $ | 2.90 | ||||
| Earnings per share – diluted |
3.05 | 2.81 | ||||||
The selected pro forma financial information presented above is for illustrative purposes only and is not necessarily indicative of the financial results of the combined companies had the acquisition actually been completed at the beginning of the periods presented, nor does it indicate future results for any other interim or full-year period.
The following table summarizes the accretable yield on the loans acquired from SMB with deteriorated credit quality as of December 6, 2017 and the changes therein through December 31, 2017.
| (dollars in thousands) |
2017 | |||
| Balance, beginning of period |
$ | — | ||
| Acquisition accretable yield |
(1,981 | ) | ||
| Accretion |
34 | |||
| Net transfers from nonaccretable difference to accretable yield |
— | |||
|
|
|
|||
| Balance, end of period |
$ | (1,947 | ) | |
|
|
|
|||
As of December 31, 2017, the weighted average remaining contractual life of the loan portfolio acquired with deteriorated credit quality from SMB was 6.8 years.
56
Table of Contents
SUMMARY OF ACQUISITION ACTIVITY
| (dollars in thousands) | ||||||||||||||||||||||||
| Acquisition |
Acquisition Date |
Total Assets |
Total Loans |
Goodwill | Core Deposit Intangible |
Total Deposits |
||||||||||||||||||
| Statewide Bank |
03/12/2010 | $ | 188,026 | $ | 110,415 | $ | 560 | $ | 1,429 | $ | 206,925 | |||||||||||||
| GS Financial Corporation |
07/15/2011 | 256,677 | 182,440 | 296 | 859 | 193,518 | ||||||||||||||||||
| Britton & Koontz Capital Corporation |
02/14/2014 | 298,930 | 161,581 | 43 | 3,030 | 216,600 | ||||||||||||||||||
| Louisiana Bancorp, Inc. |
09/15/2015 | 352,897 | 281,583 | 8,454 | 1,586 | 208,670 | ||||||||||||||||||
| St. Martin Bancshares, Inc. |
12/06/2017 | 592,666 | 439,872 | 49,268 | 6,766 | 533,497 | ||||||||||||||||||
|
|
|
|
|
|
|
|
|
|
|
|||||||||||||||
| Total Acquisitions |
$ | 1,689,196 | $ | 1,175,891 | $ | 58,621 | $ | 13,670 | $ | 1,359,210 | ||||||||||||||
|
|
|
|
|
|
|
|
|
|
|
|||||||||||||||
Acquired Loans which are impaired as of the date of acquisition are accounted for under ASC 310-30, Loans and Debt Securities Acquired with Deteriorated Credit Quality. None of the loans acquired in the acquisition of Louisiana Bancorp were considered impaired as of the date of acquisition.
The nonaccretable difference on loans acquired from Britton & Koontz totaled $17,946,000 as of February 14, 2014 and represented an estimate of the undiscounted loss exposure in the acquired loans with deteriorated credit quality as of the acquisition date.
The following table summarizes the changes in accretable yield on the loans acquired from Britton & Koontz with deteriorated credit quality for the years ended December 31, 2017, 2016 and 2015, respectively.
| (dollars in thousands) |
2017 | 2016 | 2015 | |||||||||
| Balance, beginning of period |
$ | (1,782 | ) | $ | (1,682 | ) | $ | (1,824 | ) | |||
| Accretion |
2,926 | 1,072 | 590 | |||||||||
| Net transfers from nonaccretable difference to accretable yield |
(1,284 | ) | (1,172 | ) | (448 | ) | ||||||
|
|
|
|
|
|
|
|||||||
| Balance, end of period |
$ | (140 | ) | $ | (1,782 | ) | $ | (1,682 | ) | |||
|
|
|
|
|
|
|
|||||||
As of December 31, 2017, the weighted average remaining contractual life of the loan portfolio acquired with deteriorated credit quality from Britton & Koontz was 1.1 years.
The nonaccretable difference on loans acquired from GSFC totaled $5,490,000 as of July 15, 2011 and represented an estimate of the undiscounted loss exposure in the Acquired Loans with deteriorated credit quality as of the acquisition date.
The following table summarizes the changes in accretable yield on the loans acquired from GSFC with deteriorated credit quality for the years ended December 31, 2017, 2016 and 2015, respectively.
| (dollars in thousands) |
2017 | 2016 | 2015 | |||||||||
| Balance, beginning of period |
$ | (298 | ) | $ | (1,240 | ) | $ | (1,270 | ) | |||
| Accretion |
118 | 942 | 30 | |||||||||
| Net transfers from nonaccretable difference to accretable yield |
(56 | ) | — | — | ||||||||
|
|
|
|
|
|
|
|||||||
| Balance, end of period |
$ | (236 | ) | $ | (298 | ) | $ | (1,240 | ) | |||
|
|
|
|
|
|
|
|||||||
As of December 31, 2017, the weighted average remaining contractual life of the loan portfolio acquired with deteriorated credit quality from GSFC was 5.5 years.
57
Table of Contents
The nonaccretable difference on loans acquired from Statewide totaled $61,478,000 as of March 12, 2010 and represented an estimate of the undiscounted loss exposure in the Acquired Loans with deteriorated credit quality as of the acquisition date. The following table summarizes the changes in accretable yield on the loans acquired from Statewide for the years ended December 31, 2017, 2016 and 2015, respectively.
| (dollars in thousands) |
2017 | 2016 | 2015 | |||||||||
| Balance, beginning of period |
$ | (9,011 | ) | $ | (13,870 | ) | $ | (7,706 | ) | |||
| Accretion |
2,031 | 4,859 | 3,238 | |||||||||
| Net transfers from nonaccretable difference to accretable yield |
— | — | (9,402 | ) | ||||||||
|
|
|
|
|
|
|
|||||||
| Balance, end of period |
$ | (6,980 | ) | $ | (9,011 | ) | $ | (13,870 | ) | |||
|
|
|
|
|
|
|
|||||||
As of December 31, 2017, the weighted average remaining contractual life of loan portfolio acquired with deteriorated credit quality from Statewide was 4.8 years.
4. Investment Securities
Summary information regarding the Company’s investment securities classified as available for sale and held to maturity as of December 31, 2017 and 2016 follows.
| (dollars in thousands) |
Amortized Cost |
Gross Unrealized Gains |
Gross Unrealized Losses | Fair Value | ||||||||||||||||
| December 31, 2017 | Less Than 1 Year |
Over 1 Year |
||||||||||||||||||
| Available for sale: |
||||||||||||||||||||
| U.S. agency mortgage-backed |
$ | 84,639 | $ | 619 | $ | 270 | $ | 298 | $ | 84,690 | ||||||||||
| Collateralized mortgage obligations |
115,435 | 46 | 671 | 1,075 | 113,735 | |||||||||||||||
| Municipal bonds |
25,362 | 177 | 17 | 1 | 25,521 | |||||||||||||||
| U.S. government agency |
11,026 | 42 | 21 | — | 11,047 | |||||||||||||||
|
|
|
|
|
|
|
|
|
|
|
|||||||||||
| Total available for sale |
$ | 236,462 | $ | 884 | $ | 979 | $ | 1,374 | $ | 234,993 | ||||||||||
|
|
|
|
|
|
|
|
|
|
|
|||||||||||
| Held to maturity: |
||||||||||||||||||||
| Municipal bonds |
$ | 13,034 | $ | 54 | $ | 18 | $ | 15 | $ | 13,055 | ||||||||||
|
|
|
|
|
|
|
|
|
|
|
|||||||||||
| Total held to maturity |
$ | 13,034 | $ | 54 | $ | 18 | $ | 15 | $ | 13,055 | ||||||||||
|
|
|
|
|
|
|
|
|
|
|
|||||||||||
| (dollars in thousands) |
Amortized Cost |
Gross Unrealized Gains |
Gross Unrealized Losses | Fair Value | ||||||||||||||||
| December 31, 2016 | Less Than 1 Year |
Over 1 Year |
||||||||||||||||||
| Available for sale: |
||||||||||||||||||||
| U.S. agency mortgage-backed |
$ | 78,361 | $ | 938 | $ | 368 | $ | — | $ | 78,931 | ||||||||||
| Collateralized mortgage obligations |
75,193 | 84 | 613 | 334 | 74,330 | |||||||||||||||
| Municipal bonds |
21,212 | 260 | 44 | — | 21,428 | |||||||||||||||
| U.S. government agency |
8,946 | 95 | — | — | 9,041 | |||||||||||||||
|
|
|
|
|
|
|
|
|
|
|
|||||||||||
| Total available for sale |
$ | 183,712 | $ | 1,377 | $ | 1,025 | $ | 334 | $ | 183,730 | ||||||||||
|
|
|
|
|
|
|
|
|
|
|
|||||||||||
| Held to maturity: |
||||||||||||||||||||
| Municipal bonds |
$ | 13,365 | $ | 69 | $ | 72 | $ | — | $ | 13,362 | ||||||||||
|
|
|
|
|
|
|
|
|
|
|
|||||||||||
| Total held to maturity |
$ | 13,365 | $ | 69 | $ | 72 | $ | — | $ | 13,362 | ||||||||||
|
|
|
|
|
|
|
|
|
|
|
|||||||||||
58
Table of Contents
Management evaluates securities for other-than-temporary impairment at least semi-annually, and more frequently when economic and market conditions warrant such evaluations. Consideration is given to (1) the extent and length of time the fair value has been below cost; (2) the reasons for the decline in value; (3) the Company’s intent to sell a security or whether it is more likely than not we will be required to sell the security before the recovery of its amortized cost, which may extend to maturity and our ability and intent to hold the security for a period of time that allows for the recovery in value in the case of equity securities.
The Company performs a process to identify securities that could potentially have a credit impairment that is other-than-temporary. This process involves evaluating each security for impairment by monitoring credit performance, collateral type, collateral geography, bond credit support, loan-to-value ratios, credit scores, loss severity levels, pricing levels, downgrades by rating agencies, cash flow projections and other factors as indicators of potential credit issues. When the Company determines that a security is deemed to be other than temporarily impaired, an impairment loss is recognized.
As of December 31, 2017, 112 of the Company’s debt securities had unrealized losses totaling 1.5% of the individual securities’ amortized cost basis and 1.0% of the Company’s total amortized cost basis of the investment securities portfolio. 35 of the 112 securities had been in a continuous loss position for over 12 months at such date. The 35 securities had an aggregate amortized cost basis and unrealized loss of $54,753,000 and $1,388,000, respectively, at December 31, 2017. Management has the intent and ability to hold these debt securities until maturity or until anticipated recovery. No declines in these 112 securities were deemed to be other-than-temporary.
The amortized cost and estimated fair value by maturity of the Company’s investment securities as of December 31, 2017 are shown in the following tables. Securities are classified according to their contractual maturities without consideration of principal amortization, potential prepayments or call options. The expected maturity of a security may differ from its contractual maturity because of the exercise of call options and potential paydowns. Accordingly, actual maturities may differ from contractual maturities.
| (dollars in thousands) |
One Year or Less |
After One Year through Five Years |
After Five Years through Ten Years |
After Ten Years |
Total | |||||||||||||||
| Fair Value |
||||||||||||||||||||
| Securities available for sale: |
||||||||||||||||||||
| U.S. agency mortgage-backed |
$ | 2,348 | $ | 8,471 | $ | 38,729 | $ | 35,142 | $ | 84,690 | ||||||||||
| Collateralized mortgage obligations |
— | 6,189 | 11,539 | 96,007 | 113,735 | |||||||||||||||
| Municipal bonds |
2,789 | 11,502 | 7,810 | 3,420 | 25,521 | |||||||||||||||
| U.S. government agency |
1,007 | 3,976 | 4,355 | 1,709 | 11,047 | |||||||||||||||
|
|
|
|
|
|
|
|
|
|
|
|||||||||||
| Total securities available for sale |
$ | 6,144 | $ | 30,138 | $ | 62,433 | $ | 136,278 | $ | 234,993 | ||||||||||
|
|
|
|
|
|
|
|
|
|
|
|||||||||||
| Securities held to maturity: |
||||||||||||||||||||
| Municipal bonds |
$ | — | $ | 5,335 | $ | 6,108 | $ | 1,612 | $ | 13,055 | ||||||||||
|
|
|
|
|
|
|
|
|
|
|
|||||||||||
| Total securities held to maturity |
$ | — | $ | 5,335 | $ | 6,108 | $ | 1,612 | $ | 13,055 | ||||||||||
|
|
|
|
|
|
|
|
|
|
|
|||||||||||
59
Table of Contents
| (dollars in thousands) |
One Year or Less |
After One Year through Five Years |
After Five Years through Ten Years |
After Ten Years |
Total | |||||||||||||||
| Amortized Cost |
||||||||||||||||||||
| Securities available for sale: |
||||||||||||||||||||
| U.S. agency mortgage-backed |
$ | 2,346 | $ | 8,506 | $ | 38,990 | $ | 34,797 | $ | 84,639 | ||||||||||
| Collateralized mortgage obligations |
— | 6,181 | 11,655 | 97,599 | 115,435 | |||||||||||||||
| Municipal bonds |
2,779 | 11,430 | 7,752 | 3,401 | 25,362 | |||||||||||||||
| U.S. government agency |
999 | 3,997 | 4,320 | 1,710 | 11,026 | |||||||||||||||
|
|
|
|
|
|
|
|
|
|
|
|||||||||||
| Total securities available for sale |
$ | 6,124 | $ | 30,114 | $ | 62,717 | $ | 137,507 | $ | 236,462 | ||||||||||
|
|
|
|
|
|
|
|
|
|
|
|||||||||||
| Securities held to maturity: |
||||||||||||||||||||
| Municipal bonds |
$ | — | $ | 5,331 | $ | 6,085 | $ | 1,618 | $ | 13,034 | ||||||||||
|
|
|
|
|
|
|
|
|
|
|
|||||||||||
| Total securities held to maturity |
$ | — | $ | 5,331 | $ | 6,085 | $ | 1,618 | $ | 13,034 | ||||||||||
|
|
|
|
|
|
|
|
|
|
|
|||||||||||
For the years ended December 31, 2017 and 2016, the Company recorded no gross gains or losses related to the sale of investment securities.
As of December 31, 2017 and 2016, the Company had accrued interest receivable for investment securities of $990,000 and $802,000, respectively.
As of December 31, 2017 and 2016, the Company had $121,984,000 and $91,773,000, respectively, of securities pledged to secure public deposits.
5. Loans
The Company’s loans, net of unearned income, consisted of the following as of December 31 of the years indicated.
| (dollars in thousands) |
2017 | 2016 | ||||||
| Real estate loans: |
||||||||
| One- to four-family first mortgage |
$ | 477,211 | $ | 341,883 | ||||
| Home equity loans and lines |
94,445 | 88,821 | ||||||
| Commercial real estate |
611,358 | 427,515 | ||||||
| Construction and land |
177,263 | 141,167 | ||||||
| Multi-family residential |
50,978 | 46,369 | ||||||
|
|
|
|
|
|||||
| Total real estate loans |
1,411,255 | 1,045,755 | ||||||
|
|
|
|
|
|||||
| Other loans: |
||||||||
| Commercial and industrial |
185,284 | 139,810 | ||||||
| Consumer |
61,256 | 42,268 | ||||||
|
|
|
|
|
|||||
| Total other loans |
246,540 | 182,078 | ||||||
|
|
|
|
|
|||||
| Total loans |
$ | 1,657,795 | $ | 1,227,833 | ||||
|
|
|
|
|
|||||
60
Table of Contents
A summary of activity in the Company’s allowance for loan losses for the years ended December 31, 2017, 2016 and 2015 is as follows.
| For the Year Ended December 31, 2017 | ||||||||||||||||||||
| (dollars in thousands) |
Beginning Balance |
Charge-offs | Recoveries | Provision | Ending Balance |
|||||||||||||||
| Originated loans: |
||||||||||||||||||||
| Allowance for loan losses: |
||||||||||||||||||||
| One- to four-family first mortgage |
$ | 1,436 | $ | (29 | ) | $ | — | $ | 167 | $ | 1,574 | |||||||||
| Home equity loans and lines |
654 | (10 | ) | 20 | 360 | 1,024 | ||||||||||||||
| Commercial real estate |
4,177 | (3 | ) | — | 592 | 4,766 | ||||||||||||||
| Construction and land |
1,763 | — | — | (21 | ) | 1,742 | ||||||||||||||
| Multi-family residential |
361 | — | — | (6 | ) | 355 | ||||||||||||||
| Commercial and industrial |
3,316 | (358 | ) | 408 | 980 | 4,346 | ||||||||||||||
| Consumer |
513 | (64 | ) | 15 | 32 | 496 | ||||||||||||||
|
|
|
|
|
|
|
|
|
|
|
|||||||||||
| Total allowance for loan losses |
$ | 12,220 | $ | (464 | ) | $ | 443 | $ | 2,104 | $ | 14,303 | |||||||||
|
|
|
|
|
|
|
|
|
|
|
|||||||||||
| Acquired loans: |
||||||||||||||||||||
| Allowance for loan losses: |
||||||||||||||||||||
| One- to four-family first mortgage |
$ | 75 | $ | — | $ | — | $ | 14 | $ | 89 | ||||||||||
| Home equity loans and lines |
74 | — | — | 4 | 78 | |||||||||||||||
| Commercial real estate |
— | — | — | 140 | 140 | |||||||||||||||
| Construction and land |
19 | — | — | (12 | ) | 7 | ||||||||||||||
| Multi-family residential |
— | — | — | — | — | |||||||||||||||
| Commercial and industrial |
123 | — | — | 61 | 184 | |||||||||||||||
| Consumer |
— | — | — | 6 | 6 | |||||||||||||||
|
|
|
|
|
|
|
|
|
|
|
|||||||||||
| Total allowance for loan losses |
$ | 291 | $ | — | $ | — | $ | 213 | $ | 504 | ||||||||||
|
|
|
|
|
|
|
|
|
|
|
|||||||||||
| Total loans: |
||||||||||||||||||||
| Allowance for loan losses: |
||||||||||||||||||||
| One- to four-family first mortgage |
$ | 1,511 | $ | (29 | ) | $ | — | $ | 181 | $ | 1,663 | |||||||||
| Home equity loans and lines |
728 | (10 | ) | 20 | 364 | 1,102 | ||||||||||||||
| Commercial real estate |
4,177 | (3 | ) | — | 732 | 4,906 | ||||||||||||||
| Construction and land |
1,782 | — | — | (33 | ) | 1,749 | ||||||||||||||
| Multi-family residential |
361 | — | — | (6 | ) | 355 | ||||||||||||||
| Commercial and industrial |
3,439 | (358 | ) | 408 | 1,041 | 4,530 | ||||||||||||||
| Consumer |
513 | (64 | ) | 15 | 38 | 502 | ||||||||||||||
|
|
|
|
|
|
|
|
|
|
|
|||||||||||
| Total allowance for loan losses |
$ | 12,511 | $ | (464 | ) | $ | 443 | $ | 2,317 | $ | 14,807 | |||||||||
|
|
|
|
|
|
|
|
|
|
|
|||||||||||
| For the Year Ended December 31, 2016 | ||||||||||||||||||||
| (dollars in thousands) |
Beginning Balance |
Charge-offs | Recoveries | Provision | Ending Balance |
|||||||||||||||
| Originated loans: |
||||||||||||||||||||
| Allowance for loan losses: |
||||||||||||||||||||
| One- to four-family first mortgage |
$ | 1,372 | $ | — | $ | — | $ | 64 | $ | 1,436 | ||||||||||
| Home equity loans and lines |
536 | (9 | ) | 2 | 125 | 654 | ||||||||||||||
| Commercial real estate |
3,152 | — | 1 | 1,024 | 4,177 | |||||||||||||||
| Construction and land |
1,360 | — | 52 | 351 | 1,763 | |||||||||||||||
| Multi-family residential |
173 | — | — | 188 | 361 | |||||||||||||||
| Commercial and industrial |
2,010 | (242 | ) | 56 | 1,492 | 3,316 | ||||||||||||||
| Consumer |
571 | (162 | ) | 5 | 99 | 513 | ||||||||||||||
|
|
|
|
|
|
|
|
|
|
|
|||||||||||
| Total allowance for loan losses |
$ | 9,174 | $ | (413 | ) | $ | 116 | $ | 3,343 | $ | 12,220 | |||||||||
|
|
|
|
|
|
|
|
|
|
|
|||||||||||
61
Table of Contents
| For the Year Ended December 31, 2016 | ||||||||||||||||||||
| (dollars in thousands) |
Beginning Balance |
Charge-offs | Recoveries | Provision | Ending Balance |
|||||||||||||||
| Acquired loans: |
||||||||||||||||||||
| Allowance for loan losses: |
||||||||||||||||||||
| One- to four-family first mortgage |
$ | 92 | $ | (33 | ) | $ | — | $ | 16 | $ | 75 | |||||||||
| Home equity loans and lines |
224 | — | — | (150 | ) | 74 | ||||||||||||||
| Commercial real estate |
— | — | — | — | — | |||||||||||||||
| Construction and land |
57 | — | — | (38 | ) | 19 | ||||||||||||||
| Multi-family residential |
— | — | — | — | — | |||||||||||||||
| Commercial and industrial |
— | — | 94 | 29 | 123 | |||||||||||||||
| Consumer |
— | — | — | — | — | |||||||||||||||
|
|
|
|
|
|
|
|
|
|
|
|||||||||||
| Total allowance for loan losses |
$ | 373 | $ | (33 | ) | $ | 94 | $ | (143 | ) | $ | 291 | ||||||||
|
|
|
|
|
|
|
|
|
|
|
|||||||||||
| Total loans: |
||||||||||||||||||||
| Allowance for loan losses: |
||||||||||||||||||||
| One- to four-family first mortgage |
$ | 1,464 | $ | (33 | ) | $ | — | $ | 80 | $ | 1,511 | |||||||||
| Home equity loans and lines |
760 | (9 | ) | 2 | (25 | ) | 728 | |||||||||||||
| Commercial real estate |
3,152 | — | 1 | 1,024 | 4,177 | |||||||||||||||
| Construction and land |
1,417 | — | 52 | 313 | 1,782 | |||||||||||||||
| Multi-family residential |
173 | — | — | 188 | 361 | |||||||||||||||
| Commercial and industrial |
2,010 | (242 | ) | 150 | 1,521 | 3,439 | ||||||||||||||
| Consumer |
571 | (162 | ) | 5 | 99 | 513 | ||||||||||||||
|
|
|
|
|
|
|
|
|
|
|
|||||||||||
| Total allowance for loan losses |
$ | 9,547 | $ | (446 | ) | $ | 210 | $ | 3,200 | $ | 12,511 | |||||||||
|
|
|
|
|
|
|
|
|
|
|
|||||||||||
| For the Year Ended December 31, 2015 | ||||||||||||||||||||
| (dollars in thousands) |
Beginning Balance |
Charge-offs | Recoveries | Provision | Ending Balance |
|||||||||||||||
| Originated loans: |
||||||||||||||||||||
| Allowance for loan losses: |
||||||||||||||||||||
| One- to four-family first mortgage |
$ | 1,136 | $ | (62 | ) | $ | 30 | $ | 268 | $ | 1,372 | |||||||||
| Home equity loans and lines |
442 | (15 | ) | 20 | 89 | 536 | ||||||||||||||
| Commercial real estate |
2,922 | — | 1 | 229 | 3,152 | |||||||||||||||
| Construction and land |
968 | — | — | 392 | 1,360 | |||||||||||||||
| Multi-family residential |
192 | — | — | (19 | ) | 173 | ||||||||||||||
| Commercial and industrial |
1,161 | (190 | ) | 226 | 813 | 2,010 | ||||||||||||||
| Consumer |
521 | (130 | ) | 1 | 179 | 571 | ||||||||||||||
|
|
|
|
|
|
|
|
|
|
|
|||||||||||
| Total allowance for loan losses |
$ | 7,342 | $ | (397 | ) | $ | 278 | $ | 1,951 | $ | 9,174 | |||||||||
|
|
|
|
|
|
|
|
|
|
|
|||||||||||
| Acquired loans: |
||||||||||||||||||||
| Allowance for loan losses: |
||||||||||||||||||||
| One- to four-family first mortgage |
$ | 174 | $ | (42 | ) | $ | — | $ | (40 | ) | $ | 92 | ||||||||
| Home equity loans and lines |
111 | (12 | ) | — | 125 | 224 | ||||||||||||||
| Commercial real estate |
— | — | — | — | — | |||||||||||||||
| Construction and land |
133 | (111 | ) | — | 35 | 57 | ||||||||||||||
| Multi-family residential |
— | — | — | — | — | |||||||||||||||
| Commercial and industrial |
— | — | — | — | — | |||||||||||||||
| Consumer |
— | — | — | — | — | |||||||||||||||
|
|
|
|
|
|
|
|
|
|
|
|||||||||||
| Total allowance for loan losses |
$ | 418 | $ | (165 | ) | $ | — | $ | 120 | $ | 373 | |||||||||
|
|
|
|
|
|
|
|
|
|
|
|||||||||||
62
Table of Contents
| For the Year Ended December 31, 2015 | ||||||||||||||||||||
| (dollars in thousands) |
Beginning Balance |
Charge-offs | Recoveries | Provision | Ending Balance |
|||||||||||||||
| Total loans: |
||||||||||||||||||||
| Allowance for loan losses: |
||||||||||||||||||||
| One- to four-family first mortgage |
$ | 1,310 | $ | (104 | ) | $ | 30 | $ | 228 | $ | 1,464 | |||||||||
| Home equity loans and lines |
553 | (27 | ) | 20 | 214 | 760 | ||||||||||||||
| Commercial real estate |
2,922 | — | 1 | 229 | 3,152 | |||||||||||||||
| Construction and land |
1,101 | (111 | ) | — | 427 | 1,417 | ||||||||||||||
| Multi-family residential |
192 | — | — | (19 | ) | 173 | ||||||||||||||
| Commercial and industrial |
1,161 | (190 | ) | 226 | 813 | 2,010 | ||||||||||||||
| Consumer |
521 | (130 | ) | 1 | 179 | 571 | ||||||||||||||
|
|
|
|
|
|
|
|
|
|
|
|||||||||||
| Total allowance for loan losses |
$ | 7,760 | $ | (562 | ) | $ | 278 | $ | 2,071 | $ | 9,547 | |||||||||
|
|
|
|
|
|
|
|
|
|
|
|||||||||||
The Company’s allowance for loan losses and recorded investment in loans as of the dates indicated is as follows.
| As of December 31, 2017 | ||||||||||||||||
| Originated Loans | ||||||||||||||||
| (dollars in thousands) |
Collectively Evaluated for Impairment |
Individually Evaluated for Impairment |
Acquired Loans |
Total | ||||||||||||
| Allowance for loan losses: |
||||||||||||||||
| One- to four-family first mortgage |
$ | 1,574 | $ | — | $ | 89 | $ | 1,663 | ||||||||
| Home equity loans and lines |
676 | 348 | 78 | 1,102 | ||||||||||||
| Commercial real estate |
4,766 | — | 140 | 4,906 | ||||||||||||
| Construction and land |
1,742 | — | 7 | 1,749 | ||||||||||||
| Multi-family residential |
355 | — | — | 355 | ||||||||||||
| Commercial and industrial |
2,721 | 1,625 | 184 | 4,530 | ||||||||||||
| Consumer |
496 | — | 6 | 502 | ||||||||||||
|
|
|
|
|
|
|
|
|
|||||||||
| Total allowance for loan losses |
$ | 12,330 | $ | 1,973 | $ | 504 | $ | 14,807 | ||||||||
|
|
|
|
|
|
|
|
|
|||||||||
| As of December 31, 2017 | ||||||||||||||||
| Originated Loans | ||||||||||||||||
| (dollars in thousands) |
Collectively Evaluated for Impairment |
Individually Evaluated for Impairment |
Acquired Loans(1) |
Total | ||||||||||||
| Loans: |
||||||||||||||||
| One- to four-family first mortgage |
$ | 199,199 | $ | — | $ | 278,012 | $ | 477,211 | ||||||||
| Home equity loans and lines |
53,349 | 925 | 40,171 | 94,445 | ||||||||||||
| Commercial real estate |
369,740 | 22 | 241,596 | 611,358 | ||||||||||||
| Construction and land |
124,963 | — | 52,300 | 177,263 | ||||||||||||
| Multi-family residential |
30,540 | — | 20,438 | 50,978 | ||||||||||||
| Commercial and industrial |
120,818 | 2,512 | 61,954 | 185,284 | ||||||||||||
| Consumer |
39,854 | — | 21,402 | 61,256 | ||||||||||||
|
|
|
|
|
|
|
|
|
|||||||||
| Total loans |
$ | 938,463 | $ | 3,459 | $ | 715,873 | $ | 1,657,795 | ||||||||
|
|
|
|
|
|
|
|
|
|||||||||
63
Table of Contents
| As of December 31, 2016 | ||||||||||||||||
| Originated Loans | ||||||||||||||||
| (dollars in thousands) |
Collectively Evaluated for Impairment |
Individually Evaluated for Impairment |
Acquired Loans |
Total | ||||||||||||
| Allowance for loan losses: |
||||||||||||||||
| One- to four-family first mortgage |
$ | 1,397 | $ | 39 | $ | 75 | $ | 1,511 | ||||||||
| Home equity loans and lines |
654 | — | 74 | 728 | ||||||||||||
| Commercial real estate |
4,158 | 19 | — | 4,177 | ||||||||||||
| Construction and land |
1,763 | — | 19 | 1,782 | ||||||||||||
| Multi-family residential |
361 | — | — | 361 | ||||||||||||
| Commercial and industrial |
2,579 | 737 | 123 | 3,439 | ||||||||||||
| Consumer |
513 | — | — | 513 | ||||||||||||
|
|
|
|
|
|
|
|
|
|||||||||
| Total allowance for loan losses |
$ | 11,425 | $ | 795 | $ | 291 | $ | 12,511 | ||||||||
|
|
|
|
|
|
|
|
|
|||||||||
| As of December 31, 2016 | ||||||||||||||||
| Originated Loans | ||||||||||||||||
| (dollars in thousands) |
Collectively Evaluated for Impairment |
Individually Evaluated for Impairment |
Acquired Loans(1) |
Total | ||||||||||||
| Loans: |
||||||||||||||||
| One- to four-family first mortgage |
$ | 176,392 | $ | 252 | $ | 165,239 | $ | 341,883 | ||||||||
| Home equity loans and lines |
47,865 | — | 40,956 | 88,821 | ||||||||||||
| Commercial real estate |
321,361 | 462 | 105,692 | 427,515 | ||||||||||||
| Construction and land |
138,955 | — | 2,212 | 141,167 | ||||||||||||
| Multi-family residential |
26,941 | — | 19,428 | 46,369 | ||||||||||||
| Commercial and industrial |
126,791 | 4,844 | 8,175 | 139,810 | ||||||||||||
| Consumer |
40,827 | — | 1,441 | 42,268 | ||||||||||||
|
|
|
|
|
|
|
|
|
|||||||||
| Total loans |
$ | 879,132 | $ | 5,558 | $ | 343,143 | $ | 1,227,833 | ||||||||
|
|
|
|
|
|
|
|
|
|||||||||
| (1) | $14.2 million and $13.1 million in Acquired Loans were accounted for under ASC 310-30 at December 31, 2017 and 2016, respectively. |
Although the Company has a diversified loan portfolio, a substantial portion of the loan portfolio is collateralized by improved and unimproved real estate and is dependent, in part, on values in the real estate market.
Credit quality indicators on the Company’s loan portfolio as of the dates indicated are as follows.
| December 31, 2017 | ||||||||||||||||||||
| (dollars in thousands) |
Pass | Special Mention |
Substandard | Doubtful | Total | |||||||||||||||
| Originated loans: |
||||||||||||||||||||
| One- to four-family first mortgage |
$ | 196,203 | $ | 990 | $ | 2,006 | $ | — | $ | 199,199 | ||||||||||
| Home equity loans and lines |
52,492 | 283 | 1,499 | — | 54,274 | |||||||||||||||
| Commercial real estate |
356,020 | 5,080 | 8,662 | — | 369,762 | |||||||||||||||
| Construction and land |
122,076 | 2,043 | 844 | — | 124,963 | |||||||||||||||
| Multi-family residential |
30,540 | — | — | — | 30,540 | |||||||||||||||
| Commercial and industrial |
105,097 | 4,640 | 13,593 | — | 123,330 | |||||||||||||||
| Consumer |
39,335 | 120 | 399 | — | 39,854 | |||||||||||||||
|
|
|
|
|
|
|
|
|
|
|
|||||||||||
| Total originated loans |
$ | 901,763 | $ | 13,156 | $ | 27,003 | $ | — | $ | 941,922 | ||||||||||
|
|
|
|
|
|
|
|
|
|
|
|||||||||||
64
Table of Contents
| December 31, 2017 | ||||||||||||||||||||
| (dollars in thousands) |
Pass | Special Mention |
Substandard | Doubtful | Total | |||||||||||||||
| Acquired loans: |
||||||||||||||||||||
| One- to four-family first mortgage |
$ | 269,144 | $ | 2,825 | $ | 6,043 | $ | — | $ | 278,012 | ||||||||||
| Home equity loans and lines |
39,603 | 307 | 261 | — | 40,171 | |||||||||||||||
| Commercial real estate |
218,234 | 12,522 | 10,840 | — | 241,596 | |||||||||||||||
| Construction and land |
48,748 | 3,056 | 496 | — | 52,300 | |||||||||||||||
| Multi-family residential |
19,644 | 636 | 158 | — | 20,438 | |||||||||||||||
| Commercial and industrial |
56,635 | 2,998 | 2,321 | — | 61,954 | |||||||||||||||
| Consumer |
21,172 | 69 | 161 | — | 21,402 | |||||||||||||||
|
|
|
|
|
|
|
|
|
|
|
|||||||||||
| Total acquired loans |
$ | 673,180 | $ | 22,413 | $ | 20,280 | $ | — | $ | 715,873 | ||||||||||
|
|
|
|
|
|
|
|
|
|
|
|||||||||||
| Total loans: |
||||||||||||||||||||
| One- to four-family first mortgage |
$ | 465,347 | $ | 3,815 | $ | 8,049 | $ | — | $ | 477,211 | ||||||||||
| Home equity loans and lines |
92,095 | 590 | 1,760 | — | 94,445 | |||||||||||||||
| Commercial real estate |
574,254 | 17,602 | 19,502 | — | 611,358 | |||||||||||||||
| Construction and land |
170,824 | 5,099 | 1,340 | — | 177,263 | |||||||||||||||
| Multi-family residential |
50,184 | 636 | 158 | — | 50,978 | |||||||||||||||
| Commercial and industrial |
161,732 | 7,638 | 15,914 | — | 185,284 | |||||||||||||||
| Consumer |
60,507 | 189 | 560 | — | 61,256 | |||||||||||||||
|
|
|
|
|
|
|
|
|
|
|
|||||||||||
| Total loans |
$ | 1,574,943 | $ | 35,569 | $ | 47,283 | $ | — | $ | 1,657,795 | ||||||||||
|
|
|
|
|
|
|
|
|
|
|
|||||||||||
| December 31, 2016 | ||||||||||||||||||||
| (dollars in thousands) |
Pass | Special Mention |
Substandard | Doubtful | Total | |||||||||||||||
| Originated loans: |
||||||||||||||||||||
| One- to four-family first mortgage |
$ | 175,045 | $ | 276 | $ | 1,323 | $ | — | $ | 176,644 | ||||||||||
| Home equity loans and lines |
46,536 | 331 | 998 | — | 47,865 | |||||||||||||||
| Commercial real estate |
311,517 | 822 | 9,484 | — | 321,823 | |||||||||||||||
| Construction and land |
138,000 | 22 | 933 | — | 138,955 | |||||||||||||||
| Multi-family residential |
26,941 | — | — | — | 26,941 | |||||||||||||||
| Commercial and industrial |
114,962 | 5,979 | 10,694 | — | 131,635 | |||||||||||||||
| Consumer |
40,369 | 98 | 360 | — | 40,827 | |||||||||||||||
|
|
|
|
|
|
|
|
|
|
|
|||||||||||
| Total originated loans |
$ | 853,370 | $ | 7,528 | $ | 23,792 | $ | — | $ | 884,690 | ||||||||||
|
|
|
|
|
|
|
|
|
|
|
|||||||||||
| Acquired loans: |
||||||||||||||||||||
| One- to four-family first mortgage |
$ | 162,037 | $ | 245 | $ | 2,957 | $ | — | $ | 165,239 | ||||||||||
| Home equity loans and lines |
40,812 | 47 | 97 | — | 40,956 | |||||||||||||||
| Commercial real estate |
101,546 | 2,758 | 1,388 | — | 105,692 | |||||||||||||||
| Construction and land |
1,537 | 71 | 604 | — | 2,212 | |||||||||||||||
| Multi-family residential |
19,250 | — | 178 | — | 19,428 | |||||||||||||||
| Commercial and industrial |
4,843 | — | 3,332 | — | 8,175 | |||||||||||||||
| Consumer |
1,401 | 38 | 2 | — | 1,441 | |||||||||||||||
|
|
|
|
|
|
|
|
|
|
|
|||||||||||
| Total acquired loans |
$ | 331,426 | $ | 3,159 | $ | 8,558 | $ | — | $ | 343,143 | ||||||||||
|
|
|
|
|
|
|
|
|
|
|
|||||||||||
65
Table of Contents
| December 31, 2016 | ||||||||||||||||||||
| (dollars in thousands) |
Pass | Special Mention |
Substandard | Doubtful | Total | |||||||||||||||
| Total loans: |
||||||||||||||||||||
| One- to four-family first mortgage |
$ | 337,082 | $ | 521 | $ | 4,280 | $ | — | $ | 341,883 | ||||||||||
| Home equity loans and lines |
87,348 | 378 | 1,095 | — | 88,821 | |||||||||||||||
| Commercial real estate |
413,063 | 3,580 | 10,872 | — | 427,515 | |||||||||||||||
| Construction and land |
139,537 | 93 | 1,537 | — | 141,167 | |||||||||||||||
| Multi-family residential |
46,191 | — | 178 | — | 46,369 | |||||||||||||||
| Commercial and industrial |
119,805 | 5,979 | 14,026 | — | 139,810 | |||||||||||||||
| Consumer |
41,770 | 136 | 362 | — | 42,268 | |||||||||||||||
|
|
|
|
|
|
|
|
|
|
|
|||||||||||
| Total loans |
$ | 1,184,796 | $ | 10,687 | $ | 32,350 | $ | — | $ | 1,227,833 | ||||||||||
|
|
|
|
|
|
|
|
|
|
|
|||||||||||
The above classifications follow regulatory guidelines and can generally be described as follows:
| • | Pass loans are of satisfactory quality. |
| • | Special mention loans have an existing weakness that could cause future impairment, including the deterioration of financial ratios, past due status, questionable management capabilities and possible reduction in the collateral values. |
| • | Substandard loans have an existing specific and well defined weakness that may include poor liquidity and deterioration of financial ratios. The loan may be past due and related deposit accounts experiencing overdrafts. Immediate corrective action is necessary. |
| • | Doubtful loans have specific weaknesses that are severe enough to make collection or liquidation in full highly questionable and improbable. |
In addition, residential loans are classified using an inter-regulatory agency methodology that incorporates, among other factors, the extent of delinquencies and loan-to-value ratios. These classifications were the most current available as of December 31, 2017 and 2016, respectively, and were generally updated within the prior three months.
Age analysis of past due loans, as of the dates indicated is as follows.
| December 31, 2017 | ||||||||||||||||||||||||
| (dollars in thousands) |
30-59 Days Past Due |
60-89 Days Past Due |
Greater Than 90 Days Past Due |
Total Past Due |
Current Loans |
Total Loans |
||||||||||||||||||
| Originated loans: |
||||||||||||||||||||||||
| Real estate loans: |
||||||||||||||||||||||||
| One- to four-family first mortgage |
$ | 837 | $ | 131 | $ | 44 | $ | 1,012 | $ | 198,187 | $ | 199,199 | ||||||||||||
| Home equity loans and lines |
1,018 | — | 26 | 1,044 | 53,230 | 54,274 | ||||||||||||||||||
| Commercial real estate |
670 | — | — | 670 | 369,092 | 369,762 | ||||||||||||||||||
| Construction and land |
744 | — | 200 | 944 | 124,019 | 124,963 | ||||||||||||||||||
| Multi-family residential |
— | — | — | — | 30,540 | 30,540 | ||||||||||||||||||
|
|
|
|
|
|
|
|
|
|
|
|
|
|||||||||||||
| Total real estate loans |
3,269 | 131 | 270 | 3,670 | 775,068 | 778,738 | ||||||||||||||||||
|
|
|
|
|
|
|
|
|
|
|
|
|
|||||||||||||
| Other loans: |
||||||||||||||||||||||||
| Commercial and industrial |
882 | 825 | 1,641 | 3,348 | 119,982 | 123,330 | ||||||||||||||||||
| Consumer |
380 | 9 | 278 | 667 | 39,187 | 39,854 | ||||||||||||||||||
|
|
|
|
|
|
|
|
|
|
|
|
|
|||||||||||||
| Total other loans |
1,262 | 834 | 1,919 | 4,015 | 159,169 | 163,184 | ||||||||||||||||||
|
|
|
|
|
|
|
|
|
|
|
|
|
|||||||||||||
| Total originated loans |
$ | 4,531 | $ | 965 | $ | 2,189 | $ | 7,685 | $ | 934,237 | $ | 941,922 | ||||||||||||
|
|
|
|
|
|
|
|
|
|
|
|
|
|||||||||||||
66
Table of Contents
| December 31, 2017 | ||||||||||||||||||||||||
| (dollars in thousands) |
30-59 Days Past Due |
60-89 Days Past Due |
Greater Than 90 Days Past Due |
Total Past Due |
Current Loans |
Total Loans |
||||||||||||||||||
| Acquired loans: |
||||||||||||||||||||||||
| Real estate loans: |
||||||||||||||||||||||||
| One- to four-family first mortgage |
$ | 3,867 | $ | 2,087 | $ | 2,816 | $ | 8,770 | $ | 269,242 | $ | 278,012 | ||||||||||||
| Home equity loans and lines |
137 | 61 | 46 | 244 | 39,927 | 40,171 | ||||||||||||||||||
| Commercial real estate |
5,071 | 436 | 1,864 | 7,371 | 234,225 | 241,596 | ||||||||||||||||||
| Construction and land |
2,089 | 159 | 239 | 2,487 | 49,813 | 52,300 | ||||||||||||||||||
| Multi-family residential |
— | — | — | — | 20,438 | 20,438 | ||||||||||||||||||
|
|
|
|
|
|
|
|
|
|
|
|
|
|||||||||||||
| Total real estate loans |
11,164 | 2,743 | 4,965 | 18,872 | 613,645 | 632,517 | ||||||||||||||||||
|
|
|
|
|
|
|
|
|
|
|
|
|
|||||||||||||
| Other loans: |
||||||||||||||||||||||||
| Commercial and industrial |
809 | 678 | 185 | 1,672 | 60,282 | 61,954 | ||||||||||||||||||
| Consumer |
329 | 152 | 95 | 576 | 20,826 | 21,402 | ||||||||||||||||||
|
|
|
|
|
|
|
|
|
|
|
|
|
|||||||||||||
| Total other loans |
1,138 | 830 | 280 | 2,248 | 81,108 | 83,356 | ||||||||||||||||||
|
|
|
|
|
|
|
|
|
|
|
|
|
|||||||||||||
| Total acquired loans |
$ | 12,302 | $ | 3,573 | $ | 5,245 | $ | 21,120 | $ | 694,753 | $ | 715,873 | ||||||||||||
|
|
|
|
|
|
|
|
|
|
|
|
|
|||||||||||||
| Total loans: |
||||||||||||||||||||||||
| Real estate loans: |
||||||||||||||||||||||||
| One- to four-family first mortgage |
$ | 4,704 | $ | 2,218 | $ | 2,860 | $ | 9,782 | $ | 467,429 | $ | 477,211 | ||||||||||||
| Home equity loans and lines |
1,155 | 61 | 72 | 1,288 | 93,157 | 94,445 | ||||||||||||||||||
| Commercial real estate |
5,741 | 436 | 1,864 | 8,041 | 603,317 | 611,358 | ||||||||||||||||||
| Construction and land |
2,833 | 159 | 439 | 3,431 | 173,832 | 177,263 | ||||||||||||||||||
| Multi-family residential |
— | — | — | — | 50,978 | 50,978 | ||||||||||||||||||
|
|
|
|
|
|
|
|
|
|
|
|
|
|||||||||||||
| Total real estate loans |
14,433 | 2,874 | 5,235 | 22,542 | 1,388,713 | 1,411,255 | ||||||||||||||||||
|
|
|
|
|
|
|
|
|
|
|
|
|
|||||||||||||
| Other loans: |
||||||||||||||||||||||||
| Commercial and industrial |
1,691 | 1,503 | 1,826 | 5,020 | 180,264 | 185,284 | ||||||||||||||||||
| Consumer |
709 | 161 | 373 | 1,243 | 60,013 | 61,256 | ||||||||||||||||||
|
|
|
|
|
|
|
|
|
|
|
|
|
|||||||||||||
| Total other loans |
2,400 | 1,664 | 2,199 | 6,263 | 240,277 | 246,540 | ||||||||||||||||||
|
|
|
|
|
|
|
|
|
|
|
|
|
|||||||||||||
| Total loans |
$ | 16,833 | $ | 4,538 | $ | 7,434 | $ | 28,805 | $ | 1,628,990 | $ | 1,657,795 | ||||||||||||
|
|
|
|
|
|
|
|
|
|
|
|
|
|||||||||||||
| December 31, 2016 | ||||||||||||||||||||||||
| (dollars in thousands) |
30-59 Days Past Due |
60-89 Days Past Due |
Greater Than 90 Days Past Due |
Total Past Due |
Current Loans |
Total Loans |
||||||||||||||||||
| Originated loans: |
||||||||||||||||||||||||
| Real estate loans: |
||||||||||||||||||||||||
| One- to four-family first mortgage |
$ | 651 | $ | — | $ | 563 | $ | 1,214 | $ | 175,430 | $ | 176,644 | ||||||||||||
| Home equity loans and lines |
37 | 29 | — | 66 | 47,799 | 47,865 | ||||||||||||||||||
| Commercial real estate |
475 | — | 587 | 1,062 | 320,761 | 321,823 | ||||||||||||||||||
| Construction and land |
467 | — | 12 | 479 | 138,476 | 138,955 | ||||||||||||||||||
| Multi-family residential |
— | — | — | — | 26,941 | 26,941 | ||||||||||||||||||
|
|
|
|
|
|
|
|
|
|
|
|
|
|||||||||||||
| Total real estate loans |
1,630 | 29 | 1,162 | 2,821 | 709,407 | 712,228 | ||||||||||||||||||
|
|
|
|
|
|
|
|
|
|
|
|
|
|||||||||||||
| Other loans: |
||||||||||||||||||||||||
| Commercial and industrial |
656 | 706 | 650 | 2,012 | 129,623 | 131,635 | ||||||||||||||||||
| Consumer |
531 | 97 | 192 | 820 | 40,007 | 40,827 | ||||||||||||||||||
|
|
|
|
|
|
|
|
|
|
|
|
|
|||||||||||||
| Total other loans |
1,187 | 803 | 842 | 2,832 | 169,630 | 172,462 | ||||||||||||||||||
|
|
|
|
|
|
|
|
|
|
|
|
|
|||||||||||||
| Total originated loans |
$ | 2,817 | $ | 832 | $ | 2,004 | $ | 5,653 | $ | 879,037 | $ | 884,690 | ||||||||||||
|
|
|
|
|
|
|
|
|
|
|
|
|
|||||||||||||
67
Table of Contents
| December 31, 2016 | ||||||||||||||||||||||||
| (dollars in thousands) |
30-59 Days Past Due |
60-89 Days Past Due |
Greater Than 90 Days Past Due |
Total Past Due |
Current Loans |
Total Loans |
||||||||||||||||||
| Acquired loans: |
||||||||||||||||||||||||
| Real estate loans: |
||||||||||||||||||||||||
| One- to four-family first mortgage |
$ | 1,471 | $ | 969 | $ | 2,025 | $ | 4,465 | $ | 160,774 | $ | 165,239 | ||||||||||||
| Home equity loans and lines |
136 | 27 | 38 | 201 | 40,755 | 40,956 | ||||||||||||||||||
| Commercial real estate |
— | — | 1,164 | 1,164 | 104,528 | 105,692 | ||||||||||||||||||
| Construction and land |
21 | — | 30 | 51 | 2,161 | 2,212 | ||||||||||||||||||
| Multi-family residential |
19 | — | — | 19 | 19,409 | 19,428 | ||||||||||||||||||
|
|
|
|
|
|
|
|
|
|
|
|
|
|||||||||||||
| Total real estate loans |
1,647 | 996 | 3,257 | 5,900 | 327,627 | 333,527 | ||||||||||||||||||
|
|
|
|
|
|
|
|
|
|
|
|
|
|||||||||||||
| Other loans: |
||||||||||||||||||||||||
| Commercial and industrial |
— | — | — | — | 8,175 | 8,175 | ||||||||||||||||||
| Consumer |
2 | 8 | 2 | 12 | 1,429 | 1,441 | ||||||||||||||||||
|
|
|
|
|
|
|
|
|
|
|
|
|
|||||||||||||
| Total other loans |
2 | 8 | 2 | 12 | 9,604 | 9,616 | ||||||||||||||||||
|
|
|
|
|
|
|
|
|
|
|
|
|
|||||||||||||
| Total acquired loans |
$ | 1,649 | $ | 1,004 | $ | 3,259 | $ | 5,912 | $ | 337,231 | $ | 343,143 | ||||||||||||
|
|
|
|
|
|
|
|
|
|
|
|
|
|||||||||||||
| Total loans: |
||||||||||||||||||||||||
| Real estate loans: |
||||||||||||||||||||||||
| One- to four-family first mortgage |
$ | 2,122 | $ | 969 | $ | 2,588 | $ | 5,679 | $ | 336,204 | $ | 341,883 | ||||||||||||
| Home equity loans and lines |
173 | 56 | 38 | 267 | 88,554 | 88,821 | ||||||||||||||||||
| Commercial real estate |
475 | — | 1,751 | 2,226 | 425,289 | 427,515 | ||||||||||||||||||
| Construction and land |
488 | — | 42 | 530 | 140,637 | 141,167 | ||||||||||||||||||
| Multi-family residential |
19 | — | — | 19 | 46,350 | 46,369 | ||||||||||||||||||
|
|
|
|
|
|
|
|
|
|
|
|
|
|||||||||||||
| Total real estate loans |
3,277 | 1,025 | 4,419 | 8,721 | 1,037,034 | 1,045,755 | ||||||||||||||||||
|
|
|
|
|
|
|
|
|
|
|
|
|
|||||||||||||
| Other loans: |
||||||||||||||||||||||||
| Commercial and industrial |
656 | 706 | 650 | 2,012 | 137,798 | 139,810 | ||||||||||||||||||
| Consumer |
533 | 105 | 194 | 832 | 41,436 | 42,268 | ||||||||||||||||||
|
|
|
|
|
|
|
|
|
|
|
|
|
|||||||||||||
| Total other loans |
1,189 | 811 | 844 | 2,844 | 179,234 | 182,078 | ||||||||||||||||||
|
|
|
|
|
|
|
|
|
|
|
|
|
|||||||||||||
| Total loans |
$ | 4,466 | $ | 1,836 | $ | 5,263 | $ | 11,565 | $ | 1,216,268 | $ | 1,227,833 | ||||||||||||
|
|
|
|
|
|
|
|
|
|
|
|
|
|||||||||||||
As of December 31, 2017 and 2016, the Company did not have any loans greater than 90 days past due which were accruing interest.
An impaired loan generally is one for which it is probable, based on current information, that the lender will not collect all the amounts due under the contractual terms of the loan. The Company evaluates loans for impairment on an individual basis when it believes that there is a potential for loss. When a determination is made that a loan has deteriorated to the point of becoming a problem loan, updated valuations may be ordered to help determine if there is impairment, which may lead to a recommendation for partial charge off or appropriate allowance allocation. The following is a summary of information pertaining to the Company’s impaired loans, excluding Acquired Loans, as of the dates indicated.
68
Table of Contents
| For the Year Ended December 31, 2017 | ||||||||||||||||||||
| (dollars in thousands) |
Recorded Investment |
Unpaid Principal Balance |
Related Allowance |
Average Recorded Investment |
Interest Income Recognized |
|||||||||||||||
| With no related allowance recorded: |
||||||||||||||||||||
| One- to four-family first mortgage |
$ | — | $ | — | $ | — | $ | — | $ | — | ||||||||||
| Home equity loans and lines |
470 | 476 | — | 395 | 1 | |||||||||||||||
| Commercial real estate |
22 | 32 | — | 19 | — | |||||||||||||||
| Construction and land |
— | — | — | — | — | |||||||||||||||
| Multi-family residential |
— | — | — | — | — | |||||||||||||||
| Commercial and industrial |
428 | 434 | — | 2,849 | 2 | |||||||||||||||
| Consumer |
— | — | — | — | — | |||||||||||||||
|
|
|
|
|
|
|
|
|
|
|
|||||||||||
| Total |
$ | 920 | $ | 942 | $ | — | $ | 3,263 | $ | 3 | ||||||||||
|
|
|
|
|
|
|
|
|
|
|
|||||||||||
| With an allowance recorded: |
||||||||||||||||||||
| One- to four-family first mortgage |
$ | — | $ | — | $ | — | $ | 42 | $ | — | ||||||||||
| Home equity loans and lines |
455 | 461 | 348 | 383 | 1 | |||||||||||||||
| Commercial real estate |
— | — | — | 296 | — | |||||||||||||||
| Construction and land |
— | — | — | — | — | |||||||||||||||
| Multi-family residential |
— | — | — | — | — | |||||||||||||||
| Commercial and industrial |
2,084 | 2,157 | 1,625 | 1,985 | 52 | |||||||||||||||
| Consumer |
— | — | — | — | — | |||||||||||||||
|
|
|
|
|
|
|
|
|
|
|
|||||||||||
| Total |
$ | 2,539 | $ | 2,618 | $ | 1,973 | $ | 2,706 | $ | 53 | ||||||||||
|
|
|
|
|
|
|
|
|
|
|
|||||||||||
| Total impaired loans: |
||||||||||||||||||||
| One- to four-family first mortgage |
$ | — | — | $ | — | $ | 42 | — | ||||||||||||
| Home equity loans and lines |
925 | 937 | 348 | 778 | 2 | |||||||||||||||
| Commercial real estate |
22 | 32 | — | 315 | — | |||||||||||||||
| Construction and land |
— | — | — | — | — | |||||||||||||||
| Multi-family residential |
— | — | — | — | — | |||||||||||||||
| Commercial and industrial |
2,512 | 2,591 | 1,625 | 4,834 | 54 | |||||||||||||||
| Consumer |
— | — | — | — | — | |||||||||||||||
|
|
|
|
|
|
|
|
|
|
|
|||||||||||
| Total |
$ | 3,459 | $ | 3,560 | $ | 1,973 | $ | 5,969 | $ | 56 | ||||||||||
|
|
|
|
|
|
|
|
|
|
|
|||||||||||
| For the Year Ended December 31, 2016 | ||||||||||||||||||||
| (dollars in thousands) |
Recorded Investment |
Unpaid Principal Balance |
Related Allowance |
Average Recorded Investment |
Interest Income Recognized |
|||||||||||||||
| With no related allowance recorded: |
||||||||||||||||||||
| One- to four-family first mortgage |
$ | — | $ | — | $ | — | $ | — | $ | — | ||||||||||
| Home equity loans and lines |
— | — | — | — | — | |||||||||||||||
| Commercial real estate |
— | — | — | — | — | |||||||||||||||
| Construction and land |
— | — | — | — | — | |||||||||||||||
| Multi-family residential |
— | — | — | — | — | |||||||||||||||
| Commercial and industrial |
3,144 | 3,178 | — | 262 | 166 | |||||||||||||||
| Consumer |
— | — | — | — | — | |||||||||||||||
|
|
|
|
|
|
|
|
|
|
|
|||||||||||
| Total |
$ | 3,144 | $ | 3,178 | $ | — | $ | 262 | $ | 166 | ||||||||||
|
|
|
|
|
|
|
|
|
|
|
|||||||||||
| With an allowance recorded: |
||||||||||||||||||||
| One- to four-family first mortgage |
$ | 252 | $ | 260 | $ | 39 | $ | 93 | $ | 13 | ||||||||||
| Home equity loans and lines |
— | — | — | — | — | |||||||||||||||
| Commercial real estate |
462 | 483 | 19 | 423 | 14 | |||||||||||||||
| Construction and land |
— | — | — | — | — | |||||||||||||||
| Multi-family residential |
— | — | — | — | — | |||||||||||||||
| Commercial and industrial |
1,700 | 1,737 | 737 | 1,635 | 87 | |||||||||||||||
| Consumer |
— | — | — | — | — | |||||||||||||||
|
|
|
|
|
|
|
|
|
|
|
|||||||||||
| Total |
$ | 2,414 | $ | 2,480 | $ | 795 | $ | 2,151 | $ | 114 | ||||||||||
|
|
|
|
|
|
|
|
|
|
|
|||||||||||
69
Table of Contents
| For the Year Ended December 31, 2016 | ||||||||||||||||||||
| (dollars in thousands) |
Recorded Investment |
Unpaid Principal Balance |
Related Allowance |
Average Recorded Investment |
Interest Income Recognized |
|||||||||||||||
| Total impaired loans: |
||||||||||||||||||||
| One- to four-family first mortgage |
$ | 252 | 260 | $ | 39 | $ | 93 | 13 | ||||||||||||
| Home equity loans and lines |
— | — | — | — | — | |||||||||||||||
| Commercial real estate |
462 | 483 | 19 | 423 | 14 | |||||||||||||||
| Construction and land |
— | — | — | — | — | |||||||||||||||
| Multi-family residential |
— | — | — | — | — | |||||||||||||||
| Commercial and industrial |
4,844 | 4,915 | 737 | 1,897 | 253 | |||||||||||||||
| Consumer |
— | — | — | — | — | |||||||||||||||
|
|
|
|
|
|
|
|
|
|
|
|||||||||||
| Total |
$ | 5,558 | $ | 5,658 | $ | 795 | $ | 2,413 | $ | 280 | ||||||||||
|
|
|
|
|
|
|
|
|
|
|
|||||||||||
The Company reviews its significant nonaccrual loans for specific impairment in accordance with its allowance for loan loss methodology. If it is determined that losses are probable when other credit quality indicators are considered, the loan is considered impaired and the Company specifically allocates a portion of the allowance for loan losses to these loans. A summary of information pertaining to the Company’s nonaccrual loans as of December 31, 2017 and 2016 is as follows.
| December 31, 2017 | December 31, 2016 | |||||||||||||||||||||||
| (dollars in thousands) |
Originated | Acquired(1) | Total | Originated | Acquired(1) | Total | ||||||||||||||||||
| Nonaccrual loans: |
||||||||||||||||||||||||
| One- to four-family first mortgage |
$ | 2,006 | $ | 1,167 | $ | 3,173 | $ | 891 | $ | 833 | $ | 1,724 | ||||||||||||
| Home equity loans and lines |
1,434 | 108 | 1,542 | 998 | 90 | 1,088 | ||||||||||||||||||
| Commercial real estate |
8,662 | 95 | 8,757 | 1,799 | 164 | 1,963 | ||||||||||||||||||
| Construction and land |
200 | 249 | 449 | 12 | 63 | 75 | ||||||||||||||||||
| Multi-family residential |
— | — | — | — | — | — | ||||||||||||||||||
| Commercial and industrial |
9,678 | 932 | 10,610 | 8,230 | 312 | 8,542 | ||||||||||||||||||
| Consumer |
399 | 103 | 502 | 360 | 1 | 361 | ||||||||||||||||||
|
|
|
|
|
|
|
|
|
|
|
|
|
|||||||||||||
| Total |
$ | 22,379 | $ | 2,654 | $ | 25,033 | $ | 12,290 | $ | 1,463 | $ | 13,753 | ||||||||||||
|
|
|
|
|
|
|
|
|
|
|
|
|
|||||||||||||
| (1) | Table excludes Acquired Loans which were being accounted for under ASC 310-30 because they continue to earn interest from accretable yield regardless of their status as past due or otherwise not in compliance with their contractual terms. Acquired Loans with deteriorated credit quality, which were being accounting for under ASC 310-30 and which were 90 days or more past due totaled $4.3 million and $2.7 million as of December 31, 2017 and 2016, respectively. |
As of December 31, 2017, the Company was not committed to lend additional funds to any customer whose loan was classified as impaired.
As of December 31, 2017 and 2016, the Company had accrued interest receivable for loans of $6,593,000 and $3,897,000, respectively.
Troubled Debt Restructurings
During the course of its lending operations, the Company periodically grants concessions to its customers in an attempt to protect as much of its investment as possible and to minimize risk of loss. These concessions may include restructuring the terms of a customer loan to alleviate the burden of the customer’s near-term cash requirements. The Company must conclude that the restructuring of a loan to a borrower who is experiencing financial difficulties constitutes a “concession”. The Company defines a concession as a modification of existing terms granted to a borrower for economic or legal reasons related to the borrower’s financial difficulties that the Company would otherwise not consider. The concession is either granted through an agreement with the customer or is imposed by a court or by a law. Concessions include modifying original loan terms to reduce or defer cash payments required as part of the loan agreement, including but not limited to:
| • | a reduction of the stated interest rate for the remaining original life of the debt, |
70
Table of Contents
| • | an extension of the maturity date or dates at an interest rate lower than the current market rate for new debt with similar risk characteristics, |
| • | a reduction of the face amount or maturity amount of the debt, or |
| • | a reduction of accrued interest receivable on the debt. |
In its determination of whether the customer is experiencing financial difficulties, the Company considers numerous indicators, including, but not limited to:
| • | whether the customer is currently in default on its existing loan, or is in an economic position where it is probable the customer will be in default on its loan in the foreseeable future without a modification, |
| • | whether the customer has declared or is in the process of declaring bankruptcy, |
| • | whether there is substantial doubt about the customer’s ability to continue as a going concern, |
| • | whether, based on its projections of the customer’s current capabilities, the Company believes the customer’s future cash flows will be insufficient to service the debt, including interest, in accordance with the contractual terms of the existing agreement for the foreseeable future, and |
| • | whether, without modification, the customer cannot obtain sufficient funds from other sources at an effective interest rate equal to the current market rate for similar debt for a non-troubled debtor. |
If the Company concludes that both a concession has been granted and the concession was granted to a customer experiencing financial difficulties, the Company identifies the loan as a TDR. For purposes of the determination of an allowance for loan losses on TDRs, such loans are reviewed for specific impairment in accordance with the Company’s allowance for loan loss methodology. If it is determined that losses are probable on such TDRs, either because of delinquency or other credit quality indicators, the Company specifically allocates a portion of the allowance for loan losses to these loans.
Information about the Company’s TDRs is presented in the following tables.
| As of December 31, 2017 | ||||||||||||||||
| (dollars in thousands) |
Current | Past Due Greater Than 30 Days |
Nonaccrual TDRs |
Total TDRs |
||||||||||||
| Originated loans: |
||||||||||||||||
| Real estate loans: |
||||||||||||||||
| One- to four-family first mortgage |
$ | 306 | $ | 274 | $ | 473 | $ | 1,053 | ||||||||
| Home equity loans and lines |
275 | 64 | 316 | 655 | ||||||||||||
| Commercial real estate |
96 | 332 | 1,942 | 2,370 | ||||||||||||
| Construction and land |
169 | — | — | 169 | ||||||||||||
| Multi-family residential |
— | — | — | — | ||||||||||||
|
|
|
|
|
|
|
|
|
|||||||||
| Total real estate loans |
846 | 670 | 2,731 | 4,247 | ||||||||||||
|
|
|
|
|
|
|
|
|
|||||||||
| Other loans: |
||||||||||||||||
| Commercial and industrial |
— | — | 4,581 | 4,581 | ||||||||||||
| Consumer |
— | — | 178 | 178 | ||||||||||||
|
|
|
|
|
|
|
|
|
|||||||||
| Total other loans |
— | — | 4,759 | 4,759 | ||||||||||||
|
|
|
|
|
|
|
|
|
|||||||||
| Total loans |
$ | 846 | $ | 670 | $ | 7,490 | $ | 9,006 | ||||||||
|
|
|
|
|
|
|
|
|
|||||||||
| Acquired loans: |
||||||||||||||||
| Real estate loans: |
||||||||||||||||
| One- to four-family first mortgage |
$ | 214 | $ | 3 | $ | 59 | $ | 276 | ||||||||
| Home equity loans and lines |
— | — | 91 | 91 | ||||||||||||
| Commercial real estate |
— | 803 | — | 803 | ||||||||||||
| Construction and land |
— | — | — | — | ||||||||||||
| Multi-family residential |
— | — | — | — | ||||||||||||
|
|
|
|
|
|
|
|
|
|||||||||
| Total real estate loans |
214 | 806 | 150 | 1,170 | ||||||||||||
|
|
|
|
|
|
|
|
|
|||||||||
71
Table of Contents
| As of December 31, 2017 | ||||||||||||||||
| (dollars in thousands) |
Current | Past Due Greater Than 30 Days |
Nonaccrual TDRs |
Total TDRs |
||||||||||||
| Other loans: |
||||||||||||||||
| Commercial and industrial |
— | — | 203 | 203 | ||||||||||||
| Consumer |
— | — | — | — | ||||||||||||
|
|
|
|
|
|
|
|
|
|||||||||
| Total other loans |
— | — | 203 | 203 | ||||||||||||
|
|
|
|
|
|
|
|
|
|||||||||
| Total loans |
$ | 214 | $ | 806 | $ | 353 | $ | 1,373 | ||||||||
|
|
|
|
|
|
|
|
|
|||||||||
| Total loans: |
||||||||||||||||
| Real estate loans: |
||||||||||||||||
| One- to four-family first mortgage |
$ | 520 | $ | 277 | $ | 532 | $ | 1,329 | ||||||||
| Home equity loans and lines |
275 | 64 | 407 | 746 | ||||||||||||
| Commercial real estate |
96 | 1,135 | 1,942 | 3,173 | ||||||||||||
| Construction and land |
169 | — | — | 169 | ||||||||||||
| Multi-family residential |
— | — | — | — | ||||||||||||
|
|
|
|
|
|
|
|
|
|||||||||
| Total real estate loans |
1,060 | 1,476 | 2,881 | 5,417 | ||||||||||||
|
|
|
|
|
|
|
|
|
|||||||||
| Other loans: |
||||||||||||||||
| Commercial and industrial |
— | — | 4,784 | 4,784 | ||||||||||||
| Consumer |
— | — | 178 | 178 | ||||||||||||
|
|
|
|
|
|
|
|
|
|||||||||
| Total other loans |
— | — | 4,962 | 4,962 | ||||||||||||
|
|
|
|
|
|
|
|
|
|||||||||
| Total loans |
$ | 1,060 | $ | 1,476 | $ | 7,843 | $ | 10,379 | ||||||||
|
|
|
|
|
|
|
|
|
|||||||||
| As of December 31, 2016 | ||||||||||||||||
| (dollars in thousands) |
Current | Past Due Greater Than 30 Days |
Nonaccrual TDRs |
Total TDRs |
||||||||||||
| Originated loans: |
||||||||||||||||
| Real estate loans: |
||||||||||||||||
| One- to four-family first mortgage |
$ | 276 | $ | — | $ | 327 | $ | 603 | ||||||||
| Home equity loans and lines |
331 | — | 988 | 1,319 | ||||||||||||
| Commercial real estate |
102 | — | 1,717 | 1,819 | ||||||||||||
| Construction and land |
562 | — | — | 562 | ||||||||||||
| Multi-family residential |
— | — | — | — | ||||||||||||
|
|
|
|
|
|
|
|
|
|||||||||
| Total real estate loans |
1,271 | — | 3,032 | 4,303 | ||||||||||||
|
|
|
|
|
|
|
|
|
|||||||||
| Other loans: |
||||||||||||||||
| Commercial and industrial |
— | — | 6,775 | 6,775 | ||||||||||||
| Consumer |
— | — | 168 | 168 | ||||||||||||
|
|
|
|
|
|
|
|
|
|||||||||
| Total other loans |
— | — | 6,943 | 6,943 | ||||||||||||
|
|
|
|
|
|
|
|
|
|||||||||
| Total loans |
$ | 1,271 | $ | — | $ | 9,975 | $ | 11,246 | ||||||||
|
|
|
|
|
|
|
|
|
|||||||||
| Acquired loans: |
||||||||||||||||
| Real estate loans: |
||||||||||||||||
| One- to four-family first mortgage |
$ | 292 | $ | 86 | $ | 60 | $ | 438 | ||||||||
| Home equity loans and lines |
— | — | 62 | 62 | ||||||||||||
| Commercial real estate |
288 | 860 | — | 1,148 | ||||||||||||
| Construction and land |
— | — | — | — | ||||||||||||
| Multi-family residential |
— | — | — | — | ||||||||||||
|
|
|
|
|
|
|
|
|
|||||||||
| Total real estate loans |
580 | 946 | 122 | 1,648 | ||||||||||||
|
|
|
|
|
|
|
|
|
|||||||||
72
Table of Contents
| As of December 31, 2016 | ||||||||||||||||
| (dollars in thousands) |
Current | Past Due Greater Than 30 Days |
Nonaccrual TDRs |
Total TDRs |
||||||||||||
| Other loans: |
||||||||||||||||
| Commercial and industrial |
1,853 | — | 313 | 2,166 | ||||||||||||
| Consumer |
— | — | — | — | ||||||||||||
|
|
|
|
|
|
|
|
|
|||||||||
| Total other loans |
1,853 | — | 313 | 2,166 | ||||||||||||
|
|
|
|
|
|
|
|
|
|||||||||
| Total loans |
$ | 2,433 | $ | 946 | $ | 435 | $ | 3,814 | ||||||||
|
|
|
|
|
|
|
|
|
|||||||||
| Total loans: |
||||||||||||||||
| Real estate loans: |
||||||||||||||||
| One- to four-family first mortgage |
$ | 568 | $ | 86 | $ | 387 | $ | 1,041 | ||||||||
| Home equity loans and lines |
331 | — | 1,050 | 1,381 | ||||||||||||
| Commercial real estate |
390 | 860 | 1,717 | 2,967 | ||||||||||||
| Construction and land |
562 | — | — | 562 | ||||||||||||
| Multi-family residential |
— | — | — | — | ||||||||||||
|
|
|
|
|
|
|
|
|
|||||||||
| Total real estate loans |
1,851 | 946 | 3,154 | 5,951 | ||||||||||||
|
|
|
|
|
|
|
|
|
|||||||||
| Other loans: |
||||||||||||||||
| Commercial and industrial |
1,853 | — | 7,088 | 8,941 | ||||||||||||
| Consumer |
— | — | 168 | 168 | ||||||||||||
|
|
|
|
|
|
|
|
|
|||||||||
| Total other loans |
1,853 | — | 7,256 | 9,109 | ||||||||||||
|
|
|
|
|
|
|
|
|
|||||||||
| Total loans |
$ | 3,704 | $ | 946 | $ | 10,410 | $ | 15,060 | ||||||||
|
|
|
|
|
|
|
|
|
|||||||||
A summary of information pertaining to loans modified as of the periods indicated is as follows.
| For the Years Ended December 31, | ||||||||||||||||||||||||
| 2017 | 2016 | |||||||||||||||||||||||
| (dollars in thousands) |
Number of Contracts |
Pre- modification Outstanding Recorded Investment |
Post- modification Outstanding Recorded Investment |
Number of Contracts |
Pre- modification Outstanding Recorded Investment |
Post- modification Outstanding Recorded Investment |
||||||||||||||||||
| Troubled debt restructurings: |
||||||||||||||||||||||||
| One- to four-family first mortgage |
6 | $ | 465 | $ | 456 | 8 | $ | 1,113 | $ | 656 | ||||||||||||||
| Home equity loans and lines |
2 | 38 | 36 | 7 | 1,062 | 1,049 | ||||||||||||||||||
| Commercial real estate |
5 | 1,433 | 1,427 | 4 | 924 | 856 | ||||||||||||||||||
| Construction and land |
— | — | — | 2 | 702 | 562 | ||||||||||||||||||
| Multi-family residential |
— | — | — | — | — | — | ||||||||||||||||||
| Commercial and industrial |
1 | 1,423 | 1,030 | 20 | 8,512 | 8,154 | ||||||||||||||||||
| Other consumer |
2 | 59 | 57 | 1 | 50 | 36 | ||||||||||||||||||
|
|
|
|
|
|
|
|
|
|
|
|
|
|||||||||||||
| Total |
16 | $ | 3,418 | $ | 3,006 | 42 | $ | 12,363 | $ | 11,313 | ||||||||||||||
|
|
|
|
|
|
|
|
|
|
|
|
|
|||||||||||||
None of the performing troubled debt restructurings as of December 31, 2017 had defaulted subsequent to the restructuring through the date the financial statements were available to be issued.
73
Table of Contents
6. Loan Servicing
Mortgage loans sold to and serviced for others are not included in the accompanying statements of financial condition. The unpaid principal balances of these loans as of December 31 of the years indicated are summarized as follows:
| (dollars in thousands) |
2017 | 2016 | ||||||
| Mortgage loans sold to Federal Home Loan Mortgage Corporation without recourse |
$ | 5,653 | $ | 6,772 | ||||
| Mortgage loans sold to Federal National Mortgage Association without recourse |
158,235 | 180,596 | ||||||
| Mortgage loans sold to Federal Home Loan Bank without recourse |
434 | 735 | ||||||
|
|
|
|
|
|||||
| Balance, end of period |
$ | 164,322 | $ | 188,103 | ||||
|
|
|
|
|
|||||
The Company records servicing assets related to mortgage loans sold and serviced at fair value and will amortize these servicing assets over the period of estimated net servicing income associated with each loan. Management assesses servicing assets for potential impairment annually. Activity related to servicing assets for the years ended December 31, 2017, 2016 and 2015 is summarized as follows.
| (dollars in thousands) |
2017 | 2016 | 2015 | |||||||||
| Balance at the beginning of the year |
$ | 622 | $ | 876 | $ | 356 | ||||||
| Recognition of servicing assets from the transfer of financial assets |
— | — | 18 | |||||||||
| Acquired from LABC, at fair value |
— | — | 682 | |||||||||
| Amortization |
(200 | ) | (254 | ) | (180 | ) | ||||||
|
|
|
|
|
|
|
|||||||
| Balance, end of period |
422 | 622 | 876 | |||||||||
|
|
|
|
|
|
|
|||||||
| Fair value, end of period |
$ | 1,141 | $ | 1,050 | $ | 1,561 | ||||||
|
|
|
|
|
|
|
|||||||
Custodial and escrow account balances maintained in connection with the foregoing loan servicing arrangements were $2,725,000 and $1,620,000 as of December 31, 2017 and 2016, respectively.
7. Office Properties and Equipment
Office properties and equipment consisted of the following as of December 31 of the years indicated.
| (dollars in thousands) |
2017 | 2016 | ||||||
| Land |
$ | 14,322 | $ | 12,662 | ||||
| Buildings and improvements |
35,362 | 31,491 | ||||||
| Furniture and equipment |
10,744 | 9,864 | ||||||
|
|
|
|
|
|||||
| Total office properties and equipment |
60,428 | 54,017 | ||||||
| Less accumulated depreciation |
14,823 | 14,450 | ||||||
|
|
|
|
|
|||||
| Total office properties and equipment, net |
$ | 45,605 | $ | 39,567 | ||||
|
|
|
|
|
|||||
Depreciation expense for the years ended December 31, 2017, 2016 and 2015 was $1,959,000, $1,795,000 and $1,807,000, respectively.
74
Table of Contents
8. Goodwill and Intangibles
Goodwill and other intangible assets are presented in the table below. Changes in carrying amount of the Company’s goodwill and core deposit intangible (“CDI”) for the years ended December 31, 2017, 2016 and 2015 were as follows.
| (dollars in thousands) |
Goodwill | CDI | ||||||
| Balance as of December 31, 2014 |
$ | 899 | $ | 3,367 | ||||
| Louisiana Bancorp, Inc. acquisition |
10,196 | 1,586 | ||||||
| Amortization of intangibles |
— | (744 | ) | |||||
|
|
|
|
|
|||||
| Balance as of December 31, 2015 |
11,095 | 4,209 | ||||||
| Louisiana Bancorp, Inc. acquisition |
(1,742 | ) | — | |||||
| Amortization of intangibles |
— | (800 | ) | |||||
|
|
|
|
|
|||||
| Balance as of December 31, 2016 |
9,353 | 3,409 | ||||||
| SMB acquisition |
49,268 | 6,766 | ||||||
| Amortization of intangibles |
— | (763 | ) | |||||
|
|
|
|
|
|||||
| Balance as of December 31, 2017 |
$ | 58,621 | $ | 9,412 | ||||
|
|
|
|
|
|||||
The carrying amount of the Company’s mortgage servicing asset as of December 31, 2017, 2016 and 2015 was $422,000, $622,000 and $876,000, respectively.
9. Deposits
The Company’s deposits consisted of the following major classifications as of December 31 of the years indicated.
| (dollars in thousands) |
2017 | 2016 | ||||||
| Demand deposit accounts |
$ | 461,999 | $ | 296,519 | ||||
| Savings |
217,639 | 109,414 | ||||||
| Money market accounts |
306,509 | 264,784 | ||||||
| NOW accounts |
490,924 | 305,092 | ||||||
| Certificates of deposit |
389,156 | 272,263 | ||||||
|
|
|
|
|
|||||
| Total deposits |
$ | 1,866,227 | $ | 1,248,072 | ||||
|
|
|
|
|
|||||
As of December 31, 2017, the scheduled maturities of the Company’s certificates of deposit were as follows.
| (dollars in thousands) |
Amount | |||
| 2018 |
$ | 260,701 | ||
| 2019 |
75,485 | |||
| 2020 |
28,931 | |||
| 2021 |
12,528 | |||
| 2022 |
9,460 | |||
| Thereafter |
2,051 | |||
|
|
|
|||
| Total certificates of deposit |
$ | 389,156 | ||
|
|
|
|||
As of December 31, 2017 and 2016, the aggregate amount of certificates of deposit with balances of $250,000 or more was $58,744,000 and $33,740,000, respectively.
75
Table of Contents
10. Short-term FHLB Advances
As of December 31, 2017, the Company’s short-term FHLB advances totaled $3,642,000, compared to $40,000,000 as of December 31, 2016. For the years ended December 31, 2017 and 2016, the average volume of short-term FHLB advances carried by the Company was $13,869,000 and $44,184,000, respectively.
Collateral for short and long-term FHLB advances is secured through a blanket lien evidenced by the Bank’s pledge of first mortgage collateral, demand deposit accounts, capital stock and certain other assets pursuant to the “Advances, Collateral Pledge and Security Agreement.” Under this collateral pledge agreement, the Bank must meet all statutory and regulatory capital standards and must meet all FHLB credit underwriting standards. Management believes that the Bank was in compliance with all such requirements as of December 31, 2017 and 2016.
As of December 31, 2017 and 2016, the Bank had $519,967,000 and $494,894,000, respectively, of additional FHLB advances available. As of December 31, 2017, the Company had $715,339,000 of loans pledged through the Bank’s blanket lien.
11. Long-term FHLB Advances
As of December 31, 2017 and 2016, the Company’s long-term FHLB advances totaled $68,183,000 and $78,533,000, respectively. The following table summarizes long-term advances as of December 31, 2017.
| (dollars in thousands) |
Amount | Weighted Average Rate |
||||||
| Fixed rate advances maturing in: |
||||||||
| 2018 |
$ | 6,000 | 1.32 | % | ||||
| 2019 |
15,357 | 1.70 | ||||||
| 2020 |
31,158 | 1.70 | ||||||
| 2021 |
1,861 | 1.98 | ||||||
| 2022 |
7,712 | 2.07 | ||||||
| Thereafter |
6,095 | 2.27 | ||||||
|
|
|
|
|
|||||
| Total long-term FHLB advances |
$ | 68,183 | 1.77 | % | ||||
|
|
|
|
|
|||||
12. Income Taxes
In December 2017, the Tax Cuts and Jobs Act (the “2017 Tax Act”) was enacted. The 2017 Tax Act includes a number of changes to existing U.S. tax laws that impact the Company, most notably a reduction of the U.S. corporate income tax rate from 35% to 21% for tax years beginning after December 31, 2017. The 2017 Tax Act required a re-measurement of the Company’s deferred tax asset (“DTA”) in the fourth quarter of 2017. As a result, the Company recorded a charge of $2.7 million to write down the DTA during the fourth quarter of 2017.
The Company files federal income tax returns on a calendar year basis. Income tax (benefit) expense for the years indicated is summarized as follows:
| (dollars in thousands) |
2017 | 2016 | 2015 | |||||||||
| Current |
$ | 7,260 | $ | 7,889 | $ | 6,040 | ||||||
| Deferred |
2,512 | (321 | ) | 631 | ||||||||
| Impact of Tax Cuts and Jobs Act |
2,721 | — | — | |||||||||
|
|
|
|
|
|
|
|||||||
| Total income tax expense |
$ | 12,493 | $ | 7,568 | $ | 6,671 | ||||||
|
|
|
|
|
|
|
|||||||
76
Table of Contents
The components of the Company’s net deferred tax asset as of December 31 of the years indicated are as follows:
| (dollars in thousands) |
2017 | 2016 | ||||||
| Deferred tax assets: |
||||||||
| Provision for loan losses |
$ | 3,110 | $ | 4,378 | ||||
| Discount on purchased loans |
4,055 | 514 | ||||||
| Salary continuation plan |
657 | 978 | ||||||
| Mortgage servicing rights |
132 | — | ||||||
| Deferred compensation |
98 | 141 | ||||||
| Stock-based compensation |
316 | 697 | ||||||
| Unrealized loss on securities available for sale |
308 | — | ||||||
| Real estate owned |
— | 359 | ||||||
| Other |
176 | 1,251 | ||||||
|
|
|
|
|
|||||
| Deferred tax assets |
$ | 8,852 | $ | 8,318 | ||||
|
|
|
|
|
|||||
| Deferred tax liabilities: |
||||||||
| FHLB stock dividends |
$ | (136 | ) | $ | (88 | ) | ||
| Accumulated depreciation |
(1,717 | ) | (2,418 | ) | ||||
| Intangible assets |
(1,467 | ) | (677 | ) | ||||
| Unrealized gain on securities available for sale |
— | (6 | ) | |||||
| Mortgage servicing rights |
(16 | ) | (49 | ) | ||||
| Real estate owned |
(1 | ) | — | |||||
| Premium on investment securities acquired |
(151 | ) | (950 | ) | ||||
| Other |
(118 | ) | (125 | ) | ||||
|
|
|
|
|
|||||
| Deferred tax liabilities |
(3,606 | ) | (4,313 | ) | ||||
|
|
|
|
|
|||||
| Net deferred tax asset |
$ | 5,246 | $ | 4,005 | ||||
|
|
|
|
|
|||||
For the years ended December 31, 2017, 2016 and 2015, the Company’s provision for federal income taxes differed from the amount computed by applying the federal income tax statutory rate of 35% on income from operations as indicated in the following analysis:
| (dollars in thousands) |
2017 | 2016 | 2015 | |||||||||
| Federal tax based on statutory rate |
$ | 10,242 | $ | 8,232 | $ | 6,706 | ||||||
| State tax based on statutory rate |
54 | 55 | 60 | |||||||||
| (Decrease) increase resulting from: |
||||||||||||
| Effect of tax-exempt income |
(234 | ) | (228 | ) | (242 | ) | ||||||
| Changes in the cash surrender value of bank owned life insurance |
(173 | ) | (169 | ) | (176 | ) | ||||||
| Nondeductible merger-related expenses |
129 | 4 | 261 | |||||||||
| Nondeductible share based compensation expense |
374 | 246 | 178 | |||||||||
| Exercise of stock options |
(656 | ) | (606 | ) | (105 | ) | ||||||
| DTA write down – impact of Tax Act |
2,721 | — | — | |||||||||
| Other |
36 | 34 | (11 | ) | ||||||||
|
|
|
|
|
|
|
|||||||
| Income tax expense |
$ | 12,493 | $ | 7,568 | $ | 6,671 | ||||||
|
|
|
|
|
|
|
|||||||
| Effective tax rate |
42.6 | % | 32.1 | % | 34.7 | % | ||||||
|
|
|
|
|
|
|
|||||||
Retained earnings as of December 31, 2017 and 2016, included $5,837,000 for which no deferred federal income tax liability has been recognized. This amount represents an allocation of income to bad debt deductions for tax purposes only. Reductions of amounts so allocated for purposes other than bad debt losses would create income for
77
Table of Contents
tax purposes only, which would be subject to the then-current federal statutory income tax rate. The unrecorded deferred income tax liability on the above amount was $1,985,000 as of December 31, 2017 and 2016. Current accounting standards do not require the accrual of this deferred tax amount to be recorded unless it is probable that the reserve (for tax purposes) will be significantly depleted by loan losses deductible for tax purposes in the future. Based on current estimates of losses within the Company’s loan portfolio, accrual of the deferred tax liability associated with this reserve was not required as of December 31, 2017 and 2016.
13. Commitments and Contingencies
Standby letters of credit represent commitments by the Bank to meet the obligations of certain customers if called upon. The Bank normally secures its outstanding standby letters of credit with deposits from the customer. Additionally, in the normal course of business, there were various other commitments and contingent liabilities which are not reflected in the financial statements. Loan commitments are single-purpose commitments to lend which will be funded and reduced according to specified repayment schedules. Most of these commitments have maturities of less than one year. The following table summarizes our outstanding commitments to originate loans and to advance additional amounts pursuant to outstanding letters of credit, lines of credit and the undisbursed portion of construction loans as of December 31 of the years indicated.
| Contract Amount | ||||||||
| (dollars in thousands) |
2017 | 2016 | ||||||
| Standby letters of credit |
$ | 6,620 | $ | 5,233 | ||||
| Available portion of lines of credit |
203,367 | 141,968 | ||||||
| Undisbursed portion of loans in process |
78,578 | 62,791 | ||||||
| Commitments to originate loans |
96,183 | 98,714 | ||||||
The Bank uses the same credit policies in making commitments as it does for on-balance-sheet instruments. The Bank evaluates each customer’s creditworthiness on a case-by-case basis. The amount of collateral obtained, if deemed necessary by the Bank upon extension of credit, is based on management’s credit evaluation of the customer. Collateral held varies but may include certificates of deposit, property, plant and equipment and income-producing properties. There are no commitments which present an unusual risk to the Bank, and no material losses are anticipated as a result of these transactions.
14. Regulatory Matters
The Bank is subject to regulatory capital requirements administered by the OCC. Failure to meet minimum capital requirements can initiate certain mandatory and possibly additional discretionary actions by regulators that, if undertaken, could have a direct material effect on the Company’s financial statements. Under capital adequacy guidelines and the regulatory framework for prompt corrective action, the Bank must meet specific capital guidelines that involve quantitative measures of its assets, liabilities and certain off-balance sheet items as calculated under regulatory accounting practices. The Company and the Bank’s capital amounts and classification are also subject to qualitative judgments by the regulators about components, risk weightings and other factors.
In July 2013, the Federal bank regulatory agencies issued a final rule that revised their risk-based capital requirements and the method for calculating components of capital and of computing risk-weighted assets to make them consistent with agreements that were reached by the Basel Committee on Banking Supervision and certain provisions of the Dodd-Frank Act. The final rule applies to all depository institutions and top-tier bank holding companies with total consolidated assets of $1.0 billion or more. The rule establishes a new common equity Tier 1 minimum capital requirement, increases the minimum capital ratios and assigns a higher risk weight to certain assets based on the risk associated with these assets. The final rule includes transition periods that generally implement the new regulations over a five year period. Beginning January 1, 2016, minimum Common equity tier 1, Tier 1 risk-based capital and Total risk-based are subject to a capital conservation buffer of 0.625%. This capital buffer will increase in subsequent years by 0.625% annually until it is fully phased in on January 1, 2019 at 2.5%.
Dividends paid by the Bank are the primary source of funds available to the Company. Banking regulations limit the amount of dividends that may be paid without prior approval of the regulatory authorities.
78
Table of Contents
Quantitative measures established by regulation to ensure capital adequacy require the Company and the Bank to maintain minimum amounts and ratios (set forth in the table below) of total and Tier 1 capital (as defined) to average assets and risk-weighted assets (as defined). Management believes, as of December 31, 2017 and 2016, that the Company and the Bank met all capital adequacy requirements to which it was subject.
As of December 31, 2017 and 2016, the most recent notification from the OCC categorized the Bank as “well capitalized” under the OCC regulatory classification framework. To be categorized as “well capitalized,” the Bank must maintain minimum Total risk-based, Tier 1 risk-based, Tier 1 leverage and tangible capital ratios as set forth in the following table. There are no conditions or events since that notification that management believes have changed the Bank’s category.
The following table presents actual and required capital ratios for the Company and the Bank under the Basel III Capital Rules. The minimum required capital amounts presented include the minimum required capital levels as of December 31, 2017 based on the phase-in provisions of the Basel III Capital Rules and the minimum required capital levels as of January 1, 2019 when the Basel III Capital Rules have been fully phased-in. Capital levels required to be considered well capitalized are based upon prompt corrective action regulations, as amended to reflect the changes under the Basel III Capital Rules.
| Actual | Minimum Capital Required – Basel III Phase-In Schedule |
Minimum Capital Required – Basel III Fully Phased-In |
To Be Well Capitalized Under Prompt Corrective Action Provisions |
|||||||||||||||||||||||||||||
| (dollars in thousands) |
Amount | Ratio | Amount | Ratio | Amount | Ratio | Amount | Ratio | ||||||||||||||||||||||||
| December 31, 2017 |
||||||||||||||||||||||||||||||||
| Company: |
||||||||||||||||||||||||||||||||
| Tier 1 risk-based capital |
$ | 212,675 | 13.46 | % | $ | 114,547 | 7.25 | % | $ | 134,297 | 8.50 | % | N/A | N/A | ||||||||||||||||||
| Total risk-based capital |
227,482 | 14.40 | 146,146 | 9.25 | 165,896 | 10.50 | N/A | N/A | ||||||||||||||||||||||||
| Tier 1 leverage capital |
212,675 | 12.51 | 67,978 | 4.00 | 67,978 | 4.00 | N/A | N/A | ||||||||||||||||||||||||
| Bank: |
||||||||||||||||||||||||||||||||
| Common equity Tier 1 capital (to risk-weighted assets) |
$ | 197,900 | 12.54 | % | $ | 90,720 | 5.75 | % | $ | 110,442 | 7.00 | % | $ | 102,553 | 6.50 | % | ||||||||||||||||
| Tier 1 risk-based capital |
197,900 | 12.54 | 114,386 | 7.25 | 134,108 | 8.50 | 126,219 | 8.00 | ||||||||||||||||||||||||
| Total risk-based capital |
212,708 | 13.48 | 145,941 | 9.25 | 166,663 | 10.50 | 157,774 | 10.00 | ||||||||||||||||||||||||
| Tier 1 leverage capital |
197,900 | 11.66 | 67,902 | 4.00 | 67,902 | 4.00 | 84,877 | 5.00 | ||||||||||||||||||||||||
| Actual | Minimum Capital Required – Basel III Phase-In Schedule |
Minimum Capital Required – Basel III Fully Phased-In |
To Be Well Capitalized Under Prompt Corrective Action Provisions |
|||||||||||||||||||||||||||||
| (dollars in thousands) |
Amount | Ratio | Amount | Ratio | Amount | Ratio | Amount | Ratio | ||||||||||||||||||||||||
| December 31, 2016 |
||||||||||||||||||||||||||||||||
| Company: |
||||||||||||||||||||||||||||||||
| Tier 1 risk-based capital |
$ | 168,433 | 14.24 | % | $ | 78,363 | 6.625 | % | $ | 100,541 | 8.50 | % | N/A | N/A | ||||||||||||||||||
| Total risk-based capital |
180,943 | 15.30 | 102,020 | 8.625 | 124,198 | 10.50 | N/A | N/A | ||||||||||||||||||||||||
| Tier 1 leverage capital |
168,433 | 10.98 | 61,377 | 4.00 | 61,377 | 4.00 | N/A | N/A | ||||||||||||||||||||||||
| Bank: |
||||||||||||||||||||||||||||||||
| Common equity Tier 1 capital (to risk-weighted assets) |
$ | 152,512 | 12.91 | % | $ | 60,564 | 5.125 | % | $ | 82,721 | 7.00 | % | $ | 76,813 | 6.50 | % | ||||||||||||||||
| Tier 1 risk-based capital |
152,512 | 12.91 | 78,290 | 6.625 | 100,447 | 8.50 | 94,539 | 8.00 | ||||||||||||||||||||||||
| Total risk-based capital |
165,022 | 13.96 | 101,924 | 8.625 | 124,082 | 10.50 | 118,173 | 10.00 | ||||||||||||||||||||||||
| Tier 1 leverage capital |
152,512 | 9.94 | 61,376 | 4.00 | 61,376 | 4.00 | 76,720 | 5.00 | ||||||||||||||||||||||||
79
Table of Contents
15. Benefit Plans
401(k) and Profit Sharing Plan
The Company’s 401(k) defined contribution plan allows its participants to contribute up to 75% of their pretax earnings on a tax-deferred basis up to the statutory limit. Beginning January 1, 2017, the Company’s matching contributions changed from 4% of the employees’ salaries for the years ended December 31, 2016 and 2015 to a matching contribution of 100% of the employee’s contributions up to 2%, plus 50% of the employees’ contributions over 2% but not over 6% of the employees pay. For the years ended December 31, 2017, 2016 and 2015, the Company made contributions of $701,000, $657,000 and $596,000, respectively, in connection with the plan, which is included in compensation and benefits expense in the accompanying statements of income.
Employee Stock Ownership Plan
In 2008, the Company established an employee stock ownership plan (“ESOP”) for the benefit of all eligible employees of the Company. The leveraged ESOP is accounted for in accordance with the requirements of ASC 718, Compensation – Stock Compensation.
Employees of the Bank who have been employed for a six-month period and who have attained age 21 are eligible to participate in the ESOP. It is anticipated that contributions will be made to the plan in amounts necessary to amortize the debt to the Company over a period of 20 years.
Under ASC 718, unearned ESOP shares are not considered outstanding and are shown as a reduction of shareholders’ equity as unearned compensation. Dividends on unallocated ESOP shares are considered to be compensation expense. The Company recognizes compensation cost equal to the fair value of the ESOP shares during the periods in which they are committed to be released. To the extent that the fair value of the Company’s ESOP shares differ from the cost of such shares, the differential is credited to shareholders’ equity. The Company receives a tax deduction equal to the cost of the shares released. As the loan is internally leveraged, the loan receivable from the ESOP to the Company is not reported as an asset nor is the debt of the ESOP shown as a Company liability.
Compensation cost related to the ESOP was $1.3 million, $928,000 and $795,000 for the years ended December 31, 2017, 2016 and 2015, respectively. The fair value of the unearned ESOP shares, using the closing quoted market price per share as of year-end, was approximately $16,590,000 and $16,199,000 as of December 31, 2017 and 2016, respectively. A summary of the ESOP share allocation as of December 31, 2017 and 2016 follows.
| 2017 | 2016 | |||||||
| Shares allocated, beginning of year |
235,060 | 219,415 | ||||||
| Shares allocated during the year |
35,708 | 35,708 | ||||||
| Shares distributed during the year |
(11,448 | ) | (20,063 | ) | ||||
|
|
|
|
|
|||||
| Allocated shares held by ESOP trust as of year end |
259,320 | 235,060 | ||||||
| Unallocated shares |
383,856 | 419,563 | ||||||
|
|
|
|
|
|||||
| Total ESOP shares |
643,176 | 654,623 | ||||||
|
|
|
|
|
|||||
Salary Continuation Agreements
As a supplement to its 401(k) retirement plan, the Bank has entered into nonqualified salary continuation agreements with two executive officers of the Bank. Under his salary continuation agreement, the Chief Executive Officer (“CEO”) will be entitled to a stated annual benefit for a period of ten years upon retirement from the Bank after attaining age 62. Benefits under the agreement vest over ten years, with 50% of this benefit having vested in 2007. In the event of early retirement, the Bank shall pay the CEO his vested benefits in 120 equal monthly installments upon his attaining age 62. Upon death during active service, the Bank shall distribute to the executive’s beneficiary an amount equal to two times his fully vested normal retirement benefit, payable in monthly installments over five years.
80
Table of Contents
In the event of a separation from service within 24 months following a change in control but prior to normal retirement age, the Bank shall distribute to the CEO his fully vested annual benefit in 12 equal monthly installments for ten years beginning the earlier of 24 months after separation from service or age 62. If separation from service occurs more than 24 months following a change in control, the annual benefit shall be distributed beginning at age 62.
The Bank’s nonqualified salary continuation agreement with its Chief Credit Officer provides that the executive will be entitled to a stated annual benefit for a period of ten years upon retirement from the Bank after attaining age 65, distributed monthly. In the event of early retirement, the Bank shall pay the executive his vested benefits in 120 equal monthly installments upon attaining age 65. Upon death during active service, the Bank shall distribute the fully vested normal retirement benefit to the executive’s beneficiary in 120 monthly installments. In the event of a separation from service within 24 months following a change in control but prior to normal retirement age, the Bank shall distribute to the executive the vested portion of the annual benefit in a lump sum on the first day of the month following the separation from service. Benefits are subject to a six-month delay to the extent required by applicable law.
Britton & Koontz had two salary continuation agreements funded in the amount of $465,000 at the time of acquisition in February 2014. The Bank will pay former executives of Britton & Koontz or their beneficiary over the next 15 years. Louisiana Bancorp also had two salary continuation agreements funded in the amount of $1,200,000 at the time of acquisition in September 2015. The Bank will pay former executives of Louisiana Bancorp or their beneficiary within the next 10 years. SMB had six salary continuation agreements funded in the amount of $2.5 million at the time of acquisition. The agreements were terminated after the effective date of the acquisition and paid out to the six officers of SMB prior to December 31, 2017. SMB also had a salary continuation agreement for an executive officer related to its acquisition of American Bank in 2007. The Bank will pay the former executive of American Bank or their beneficiary $358,000 over the next 14 years. The Company had an outstanding liability totaling $3,129,000 and $2,795,000 as of December 31, 2017 and 2016, respectively, in connection with the agreements.
16. Stock-based Payment Arrangements
The Company’s shareholders approved the 2009 Stock Option Plan (the “SOP”) and the 2009 Recognition and Retention Plan (the “RRP”) on May 12, 2009 to provide incentives and awards for directors, officers and other key employees of the Company and its subsidiary. A maximum of 892,687 shares of Company common stock were reserved for issuance upon the exercise of options granted under the SOP. A total of 357,075 shares of the Company’s outstanding common stock, or 4% of total shares outstanding at the time the RRP was implemented, were approved for restricted stock awards under the RRP. On May 6, 2014, the Company’s shareholders approved the 2014 Equity Incentive Plan (the “2014 Plan”). The 2014 Plan authorizes the granting of stock options, restricted stock units, and other awards to directors, officers and other key employees. The aggregate number of shares of our common stock reserved and available for issuance pursuant to awards granted under the 2014 Plan is 350,000. These plans are administered by a committee appointed by the Board of Directors, which selects persons eligible to receive awards and determines the number of shares and/or options subject to each award, the terms, conditions and other provisions of the awards. In accordance with ASC 718, the Company adopted a fair value based method of accounting for employee stock compensation plans, whereby compensation cost is measured as of the grant date based on the fair value of the award and is recognized over the service period, which is usually the vesting period.
Stock Option Plans
The Company issues stock options under the SOP and the 2014 Plan to directors, officers and other key employees. The option exercise price cannot be less than the fair value of the underlying common stock as of the date of the option grant and the maximum option term cannot exceed ten years. All stock options granted have been issued with vesting periods of five years with accelerated vesting provided under certain circumstances. As of December 31, 2017, options to acquire an aggregate of 408,478 shares were outstanding under the SOP and the 2014 Plan.
81
Table of Contents
The fair value of each option granted is estimated on the grant date using the Black-Scholes option pricing model. This model requires management to make certain assumptions, including the expected life of the option, the risk-free rate of interest, the expected volatility and the expected dividend yield. The following assumptions were made in estimating 2017 fair values:
| Expected dividends |
1.59 | % | ||
| Expected volatility |
21.15 | % | ||
| Risk-free interest rate |
2.1 | % | ||
| Expected term (in years) |
6.5 |
As of December 31, 2017, there was $418,000 of unrecognized compensation cost related to stock options which is expected to be recognized over a period of 3.5 years.
For the years ended December 31, 2017, 2016 and 2015, the Company recognized $162,000, $132,000 and $70,000, respectively, in compensation cost related to stock options, which is included in compensation and benefits expense in the accompanying consolidated statements of income.
The following table represents stock option activity for the year ended December 31, 2017.
| Options |
Number of Options |
Weighted- Average Exercise Price |
Weighted- Average Grant Date Fair Value |
Weighted- Average Remaining Contractual Term (Years) |
||||||||||||
| Outstanding as of January 1, 2017 |
484,688 | $ | 14.55 | $ | 4.17 | |||||||||||
| Granted |
28,290 | 35.25 | 7.14 | |||||||||||||
| Exercised |
(103,240 | ) | 11.73 | 3.81 | ||||||||||||
| Forfeited |
(1,260 | ) | 30.56 | 5.95 | ||||||||||||
|
|
|
|||||||||||||||
| Outstanding as of December 31, 2017 |
408,478 | $ | 16.64 | $ | 4.46 | 3.7 | ||||||||||
|
|
|
|||||||||||||||
| Exercisable as of December 31, 2017 |
315,912 | $ | 13.23 | $ | 4.09 | 2.3 | ||||||||||
|
|
|
|||||||||||||||
Restricted Stock Plans
The Company has issued restricted stock under the RRP to directors, officers and other key employees. During 2009, the Company purchased in the open market all shares required to fund the RRP at an average cost of $11.81 per share. As of December 31, 2017, the cost of such shares held by the RRP totaled $83,903, which is included in the Company’s unallocated common stock held by the RRP in the consolidated statements of financial condition. Under the 2014 Plan, the Company may issue restricted stock units, restricted stock awards, options and other awards.
Awards under the RRP and the 2014 Plan may not be sold or otherwise transferred until certain restrictions have lapsed. The unearned compensation related to these awards is amortized to compensation expense over the five-year vesting period. The total share-based compensation expense for these awards is determined based on the market price of the Company’s common stock as of the date of grant applied to the total number of shares granted and is amortized over the vesting period. As of December 31, 2017, unearned share-based compensation associated with these awards totaled $1,365,000.
For the years ended December 31, 2017, 2016 and 2015, the Company recognized $354,000, $239,000 and $51,000, respectively, in compensation cost related to restricted stock and restricted stock units, which is included in compensation and benefits expense in the accompanying consolidated statements of income.
82
Table of Contents
The following table represents unvested restricted stock activity in for the year ended December 31, 2017.
| Number of Shares |
Weighted-Average Grant Date Fair Value |
|||||||
| Balance, beginning of year |
48,557 | $ | 24.89 | |||||
| Granted |
18,660 | 37.02 | ||||||
| Forfeited |
(400 | ) | 28.84 | |||||
| Released |
(12,182 | ) | 23.76 | |||||
|
|
|
|
|
|||||
| Balance, end of period |
54,635 | $ | 29.26 | |||||
|
|
|
|
|
|||||
17. Earnings Per Share
Earnings per common share was computed based on the following:
| Years Ended December 31, | ||||||||||||
| (in thousands, except per share data) |
2017 | 2016 | 2015 | |||||||||
| Numerator: |
||||||||||||
| Income applicable to common shares |
$ | 16,824 | $ | 16,008 | $ | 12,550 | ||||||
|
|
|
|
|
|
|
|||||||
| Denominator: |
||||||||||||
| Weighted average common shares outstanding |
7,117 | 6,842 | 6,708 | |||||||||
| Effect of dilutive securities: |
||||||||||||
| Restricted stock |
8 | 4 | 4 | |||||||||
| Stock options |
265 | 261 | 289 | |||||||||
|
|
|
|
|
|
|
|||||||
| Weighted average common shares outstanding—assuming dilution |
7,390 | 7,107 | 7,001 | |||||||||
|
|
|
|
|
|
|
|||||||
| Earnings per common share |
$ | 2.36 | $ | 2.34 | $ | 1.87 | ||||||
|
|
|
|
|
|
|
|||||||
| Earnings per common share—assuming dilution |
$ | 2.28 | $ | 2.25 | $ | 1.79 | ||||||
|
|
|
|
|
|
|
|||||||
Options on 50,356, 70,522 and 45,877 shares of common stock were not included in computing diluted earnings per share for the years ended December 31, 2017, 2016 and 2015, respectively, because the effect of these shares were anti-dilutive.
18. Related Party Transactions
Certain directors and officers of the Company are customers of the Company. Loan transactions with directors, officers and employees are made on the same terms as those prevailing at the time for comparable loans to other persons. A summary of related party loan activity during 2017 follows.
| (dollars in thousands) |
||||
| Balance, beginning of year |
$ | 1,491 | ||
| New loans |
4,539 | |||
| Repayments, net |
(371 | ) | ||
|
|
|
|||
| Balance, end of year |
$ | 5,659 | ||
|
|
|
|||
None of the related party loans were identified as impaired or exceeded 5% of shareholders’ equity for the years ended 2017 or 2016.
Related party deposits totaled $15,544,000 and $14,252,000 as of December 31, 2017 and 2016, respectively.
83
Table of Contents
19. Fair Value Disclosures
The Company values its financial assets and liabilities measured at fair value in three levels as required by ASC 820, Fair Value Measurements and Disclosures. Under this guidance, fair value should be based on the assumptions market participants would use when pricing the asset or liability and establishes a fair value hierarchy that prioritizes the inputs used to develop those assumptions and measure fair value. The hierarchy requires companies to maximize the use of observable inputs and minimize the use of unobservable inputs. The three levels of inputs used to measure fair value are as follows:
| • | Level 1 – Quoted prices in active markets for identical assets or liabilities. |
| • | Level 2 – Observable inputs other than quoted prices included in Level 1, such as quoted prices for similar assets and liabilities in active markets; quoted prices for identical or similar assets and liabilities in markets that are not active; or other inputs that are observable or can be corroborated by observable market data. |
| • | Level 3 – Unobservable inputs that are supported by little or no market activity and that are significant to the fair value of the assets or liabilities. This includes certain pricing models, discounted cash flow methodologies and similar techniques that use significant unobservable inputs. |
An asset’s or liability’s categorization within the fair value hierarchy is based upon the lowest level of input that is significant to the fair value measurement. Management reviews and updates the fair value hierarchy classifications of the Company’s assets and liabilities on a quarterly basis.
Recurring Basis
Investment Securities Available for Sale
Fair values of investment securities available for sale are primarily measured using information from a third-party pricing service. This pricing service provides pricing information by utilizing evaluated pricing models supported with market data information. Standard inputs include benchmark yields, reported trades, broker/dealer quotes, issuer spreads, benchmark securities, bids, offers and reference data from market research publications. If quoted prices are available in an active market, investment securities are classified as Level 1 measurements. If quoted prices are not available in an active market, fair values were estimated primarily by the use of pricing models. Level 2 investment securities were primarily comprised of mortgage-backed securities issued by government agencies and U.S. government-sponsored enterprises. In certain cases, where there is limited or less transparent information provided by the Company’s third-party pricing service, fair value is estimated by the use of secondary pricing services or through the use of non-binding third-party broker quotes. Investment securities are classified within Level 3 when little or no market activity supports the fair value.
Management primarily identifies investment securities which may have traded in illiquid or inactive markets by identifying instances of a significant decrease in the volume and frequency of trades, relative to historical levels, as well as instances of a significant widening of the bid-ask spread in the brokered markets. Investment securities that are deemed to have been trading in illiquid or inactive markets may require the use of significant unobservable inputs. For example, management may use quoted prices for similar investment securities in the absence of a liquid and active market for the investment securities being valued. As of December 31, 2017, management did not make adjustments to prices provided by the third-party pricing service as a result of illiquid or inactive markets.
84
Table of Contents
The following tables present the balances of assets and liabilities measured on a recurring basis as of December 31, 2017 and 2016 aggregated by the level in the fair value hierarchy in which these measurements fall.
| (dollars in thousands) |
December 31, 2017 | Level 1 | Level 2 | Level 3 | ||||||||||||
| Available for sale securities: |
||||||||||||||||
| U.S. agency mortgage-backed |
$ | 87,758 | $ | — | $ | 87,758 | $ | — | ||||||||
| Collateralized mortgage obligations |
113,735 | — | 113,735 | — | ||||||||||||
| Municipal bonds |
25,521 | — | 25,521 | — | ||||||||||||
| U.S. government agency |
7,980 | — | 7,980 | — | ||||||||||||
|
|
|
|
|
|
|
|
|
|||||||||
| Total |
$ | 234,994 | $ | — | $ | 234,994 | $ | — | ||||||||
|
|
|
|
|
|
|
|
|
|||||||||
| (dollars in thousands) |
December 31, 2016 | Level 1 | Level 2 | Level 3 | ||||||||||||
| Available for sale securities: |
||||||||||||||||
| U.S. agency mortgage-backed |
$ | 78,931 | $ | — | $ | 78,931 | $ | — | ||||||||
| Collateralized mortgage obligations |
74,330 | — | 74,330 | — | ||||||||||||
| Municipal bonds |
21,428 | — | 21,428 | — | ||||||||||||
| U.S. government agency |
9,041 | — | 9,041 | — | ||||||||||||
|
|
|
|
|
|
|
|
|
|||||||||
| Total |
$ | 183,730 | $ | — | $ | 183,730 | $ | — | ||||||||
|
|
|
|
|
|
|
|
|
|||||||||
The Company did not record any liabilities at fair value for which measurement of the fair value was made on a recurring basis.
Nonrecurring Basis
In accordance with the provisions of ASC 310, Receivables, the Company records loans considered impaired at their fair value. A loan is considered impaired if it is probable the Company will be unable to collect all amounts due according to the contractual terms of the loan agreement. Fair value is measured at the fair value of the collateral for collateral-dependent loans. For non-collateral-dependent loans, fair value is measured by present valuing expected future cash flows. Impaired loans are classified as Level 3 assets when measured using appraisals from external parties of the collateral less any prior liens. Repossessed assets are initially recorded at fair value less estimated costs to sell. The fair value of repossessed assets is based on property appraisals and an analysis of similar properties available. As such, the Company classifies repossessed assets as Level 3 assets.
The Company has segregated all financial assets and liabilities that are measured at fair value on a nonrecurring basis into the most appropriate level within the fair value hierarchy based on the inputs used to determine the fair value at the measurement date in the table below.
| Fair Value Measurements Using | ||||||||||||||||
| (dollars in thousands) |
December 31, 2017 | Level 1 | Level 2 | Level 3 | ||||||||||||
| Assets |
||||||||||||||||
| Impaired loans |
$ | 1,486 | $ | — | $ | — | $ | 1,486 | ||||||||
| Repossessed assets |
728 | — | — | 728 | ||||||||||||
|
|
|
|
|
|
|
|
|
|||||||||
| Total |
$ | 2,214 | $ | — | $ | — | $ | 2,214 | ||||||||
|
|
|
|
|
|
|
|
|
|||||||||
85
Table of Contents
| Fair Value Measurements Using | ||||||||||||||||
| (dollars in thousands) |
December 31, 2016 | Level 1 | Level 2 | Level 3 | ||||||||||||
| Assets |
||||||||||||||||
| Impaired loans |
$ | 4,763 | $ | — | $ | — | $ | 4,763 | ||||||||
| Repossessed assets |
2,893 | — | — | 2,893 | ||||||||||||
|
|
|
|
|
|
|
|
|
|||||||||
| Total |
$ | 7,656 | $ | — | $ | — | $ | 7,656 | ||||||||
|
|
|
|
|
|
|
|
|
|||||||||
The following table shows significant unobservable inputs used in the fair value measurement of Level 3 assets.
| (dollars in thousands) |
Fair Value |
Valuation Technique |
Unobservable Inputs |
Range of Discounts |
Weighted Average Discount |
|||||||||||
| As of December 31, 2017: |
||||||||||||||||
| Impaired loans |
$ | 1,486 | Third party appraisals and discounted cash flows | Collateral discounts and discount rates | 0% - 100% | 57 | % | |||||||||
| Repossessed assets |
$ | 728 | Third party appraisals, sales contracts, Broker price opinions | Collateral discounts and estimated costs to sell | 6% - 100% | 28 | % | |||||||||
| (dollars in thousands) |
Fair Value |
Valuation Technique |
Unobservable Inputs |
Range of Discounts |
Weighted Average Discount |
|||||||||||
| As of December 31, 2016: |
||||||||||||||||
| Impaired loans |
$ | 4,763 | Third party appraisals and discounted cash flows | Collateral discounts and discount rates | 0% - 100% | 15 | % | |||||||||
| Repossessed assets |
$ | 2,893 | Third party appraisals, sales contracts, Broker price opinions |
Collateral discounts and estimated costs to sell | 6% - 96% | 19 | % | |||||||||
ASC 820, Fair Value Measurements and Disclosures, requires the disclosure of each class of financial instruments for which it is practicable to estimate. The fair value of a financial instrument is the current amount that would be exchanged between willing parties, other than in a forced liquidation. Fair value is best determined based upon quoted market prices. However, in many instances, there are no quoted market prices for the Company’s various financial instruments. In cases where quoted market prices are not available, fair values are based on estimates using present value or other valuation techniques. Those techniques are significantly affected by the assumptions used, including the discount rate and estimates of future cash flows. Accordingly, the fair value estimates may not be realized in an immediate settlement of the instrument. ASC 820 excludes certain financial instruments and all non-financial instruments from its disclosure requirements. Accordingly, the aggregate fair value amounts presented may not necessarily represent the underlying fair value of the Company.
Fair value estimates are made at a specific point in time, based on relevant market information and information about the financial statement element. These estimates are subjective in nature and involve uncertainties and matters of significant judgment and therefore cannot be determined with precision. Changes in assumptions could significantly affect the estimates.
86
Table of Contents
Fair value estimates included herein are based on existing on- and off-balance-sheet financial instruments without attempting to estimate the value of anticipated future business and the fair value of assets and liabilities that are not required to be recorded or disclosed at fair value like premises and equipment. In addition, the tax ramifications related to the realization of the unrealized gains and losses can have a significant effect on fair value estimates and have not been considered in the estimates.
The following methods and assumptions were used to estimate the fair value of each class of financial instruments for which it is practicable to estimate that value:
The carrying value of cash and cash equivalents and interest-bearing deposits in banks approximate their fair value.
The fair value for investment securities is determined from quoted market prices when available. If a quoted market price is not available, fair value is estimated using third party pricing services or quoted market prices of securities with similar characteristics.
The carrying value of mortgage loans held for sale are recorded at the lower of aggregate cost or market value, which is a reasonable estimate of fair value.
The fair value of loans are estimated by discounting the future cash flows using the current rates at which similar loans would be made to borrowers with similar credit ratings and for the same remaining maturity.
The cash surrender value of bank-owned life insurance (“BOLI”) approximates its fair value.
The fair value of demand deposits, savings and interest-bearing demand deposits is the amount payable on demand. The fair value of fixed-maturity certificates of deposit is estimated by discounting the future cash flows using the rates currently offered for deposits of similar remaining maturities.
The carrying amount of the FHLB advances is estimated using the rates currently offered for advances of similar maturities.
The carrying value of the securities sold under repurchase agreement is its fair value.
The fair value of off-balance sheet financial instruments as of December 31, 2017 and 2016 was immaterial.
| Fair Value Measurements at December 31, 2017 | ||||||||||||||||||||
| (dollars in thousands) |
Carrying Amount |
Total | Level 1 | Level 2 | Level 3 | |||||||||||||||
| Financial Assets |
||||||||||||||||||||
| Cash and cash equivalents |
$ | 150,418 | $ | 150,418 | $ | 150,418 | $ | — | $ | — | ||||||||||
| Interest-bearing deposits in banks |
2,421 | 2,421 | 2,421 | — | — | |||||||||||||||
| Investment securities available for sale |
234,993 | 234,993 | — | 234,993 | — | |||||||||||||||
| Investment securities held to maturity |
13,034 | 13,055 | — | 13,055 | — | |||||||||||||||
| Mortgage loans held for sale |
5,873 | 5,873 | — | 5,873 | — | |||||||||||||||
| Loans, net |
1,642,987 | 1,642,634 | — | 1,641,148 | 1,486 | |||||||||||||||
| Cash surrender value of BOLI |
28,904 | 28,904 | 28,904 | — | — | |||||||||||||||
| Financial Liabilities |
||||||||||||||||||||
| Deposits |
$ | 1,866,227 | $ | 1,864,735 | $ | — | $ | 1,864,735 | $ | — | ||||||||||
| Short-term FHLB advances |
3,642 | 3,642 | 3,642 | — | — | |||||||||||||||
| Long-term FHLB advances |
68,183 | 67,143 | — | 67,143 | — | |||||||||||||||
87
Table of Contents
| Fair Value Measurements at December 31, 2016 | ||||||||||||||||||||
| (dollars in thousands) |
Carrying Amount |
Total | Level 1 | Level 2 | Level 3 | |||||||||||||||
| Financial Assets |
||||||||||||||||||||
| Cash and cash equivalents |
$ | 29,315 | $ | 29,315 | $ | 29,315 | $ | — | $ | — | ||||||||||
| Interest-bearing deposits in banks |
1,884 | 1,884 | 1,884 | — | — | |||||||||||||||
| Investment securities available for sale |
183,730 | 183,730 | — | 183,730 | — | |||||||||||||||
| Investment securities held to maturity |
13,365 | 13,362 | — | 13,362 | — | |||||||||||||||
| Mortgage loans held for sale |
4,156 | 4,156 | — | 4,156 | — | |||||||||||||||
| Loans, net |
1,215,323 | 1,205,538 | — | 1,200,775 | 4,763 | |||||||||||||||
| Cash surrender value of BOLI |
20,150 | 20,150 | 20,150 | — | — | |||||||||||||||
| Financial Liabilities |
||||||||||||||||||||
| Deposits |
$ | 1,248,072 | $ | 1,247,526 | $ | — | $ | 1,247,526 | $ | — | ||||||||||
| Short-term FHLB advances |
40,000 | 40,000 | 40,000 | — | — | |||||||||||||||
| Long-term FHLB advances |
78,533 | 78,039 | — | 78,039 | — | |||||||||||||||
20. Condensed Parent Company Only Financial Statements
Condensed financial statements of Home Bancorp, Inc. (parent company only) are shown below. The parent company has no significant operating activities.
Condensed Balance Sheets
December 31, 2017 and 2016
| (dollars in thousands) |
2017 | 2016 | ||||||
| Assets |
||||||||
| Cash in bank |
$ | 12,531 | $ | 14,924 | ||||
| Investment in subsidiary |
263,097 | 163,922 | ||||||
| Other assets |
2,322 | 1,102 | ||||||
|
|
|
|
|
|||||
| Total assets |
$ | 277,950 | $ | 179,948 | ||||
|
|
|
|
|
|||||
| Liabilities |
$ | 79 | $ | 105 | ||||
| Shareholders’ equity |
277,871 | 179,843 | ||||||
|
|
|
|
|
|||||
| Total liabilities and shareholders’ equity |
$ | 277,950 | $ | 179,948 | ||||
|
|
|
|
|
|||||
88
Table of Contents
Condensed Statements of Operations
For the Years Ended December 31, 2017, 2016 and 2015
| (dollars in thousands) |
2017 | 2016 | 2015 | |||||||||
| Operating income |
||||||||||||
| Interest income |
$ | — | $ | — | $ | — | ||||||
| Dividend from subsidiary |
— | — | 72,500 | |||||||||
|
|
|
|
|
|
|
|||||||
| Total operating income |
— | — | 72,500 | |||||||||
|
|
|
|
|
|
|
|||||||
| Operating expenses |
||||||||||||
| Other expenses |
217 | 192 | 142 | |||||||||
|
|
|
|
|
|
|
|||||||
| Total operating expenses |
217 | 192 | 142 | |||||||||
|
|
|
|
|
|
|
|||||||
| (Loss) income before income tax benefit and equity in undistributed earnings of subsidiary |
(217 | ) | (192 | ) | 72,358 | |||||||
| Income tax benefit |
87 | 77 | 57 | |||||||||
|
|
|
|
|
|
|
|||||||
| (Loss) income before equity in undistributed earnings of subsidiary |
(130 | ) | (115 | ) | 72,415 | |||||||
| Undistributed earnings of subsidiary (Dividends received in excess of earnings of subsidiary) |
16,954 | 16,123 | (59,865 | ) | ||||||||
|
|
|
|
|
|
|
|||||||
| Net income |
$ | 16,824 | $ | 16,008 | $ | 12,550 | ||||||
|
|
|
|
|
|
|
|||||||
Condensed Statements of Cash Flows
For the Years Ended December 31, 2017, 2016 and 2015
| (dollars in thousands) |
2017 | 2016 | 2015 | |||||||||
| Cash Flows from Operating Activities |
||||||||||||
| Net income |
$ | 16,824 | $ | 16,008 | $ | 12,550 | ||||||
| Adjustments to reconcile net income to net cash provided by (used in) operating activities: |
||||||||||||
| Non-cash compensation |
1,619 | 1,200 | 999 | |||||||||
| Decrease (increase) in accrued interest and other assets |
(877 | ) | 135 | (624 | ) | |||||||
| Dividends received in excess of earnings from subsidiary (undistributed earnings in subsidiary) |
(16,954 | ) | (16,123 | ) | 59,865 | |||||||
| (Decrease) Increase in accrued expenses and other liabilities |
(26 | ) | (3,865 | ) | 3,855 | |||||||
|
|
|
|
|
|
|
|||||||
| Net Cash Provided by (Used in) Operating Activities |
586 | (2,645 | ) | 76,645 | ||||||||
|
|
|
|
|
|
|
|||||||
| Cash Flows from Investing Activities |
||||||||||||
| Net cash paid in acquisitions |
— | — | (57,455 | ) | ||||||||
|
|
|
|
|
|
|
|||||||
| Net Cash Used in Investing Activities |
— | — | (57,455 | ) | ||||||||
|
|
|
|
|
|
|
|||||||
| Cash Flows from Financing Activities |
||||||||||||
| Proceeds from exercise of stock options |
1,194 | 1,416 | 3,282 | |||||||||
| Payment of dividends on common stock |
(4,070 | ) | (2,988 | ) | (2,162 | ) | ||||||
| Issuance of stock under incentive plan |
(32 | ) | (14 | ) | — | |||||||
| Purchase of Company’s common stock |
(71 | ) | (357 | ) | (3,466 | ) | ||||||
|
|
|
|
|
|
|
|||||||
| Net Cash Used in Financing Activities |
(2,979 | ) | (1,943 | ) | (2,346 | ) | ||||||
|
|
|
|
|
|
|
|||||||
| Net Increase (Decrease) in Cash and Cash Equivalents |
(2,393 | ) | (4,588 | ) | 16,844 | |||||||
| Cash and Cash Equivalents as of Beginning of Period |
14,924 | 19,512 | 2,668 | |||||||||
|
|
|
|
|
|
|
|||||||
| Cash and Cash Equivalents as of End of Period |
$ | 12,531 | $ | 14,924 | $ | 19,512 | ||||||
|
|
|
|
|
|
|
|||||||
89
Table of Contents
21. Consolidated Quarterly Results of Operations (unaudited)
| (dollars in thousands, except per share data) |
First Quarter |
Second Quarter |
Third Quarter |
Fourth Quarter |
||||||||||||
| Year Ended December 31, 2017 |
||||||||||||||||
| Total interest income |
$ | 17,363 | $ | 17,399 | $ | 17,666 | $ | 21,970 | ||||||||
| Total interest expense |
1,394 | 1,501 | 1,709 | 1,944 | ||||||||||||
|
|
|
|
|
|
|
|
|
|||||||||
| Net interest income |
15,969 | 15,898 | 15,957 | 20,026 | ||||||||||||
| Provision for loan losses |
307 | 150 | 660 | 1,200 | ||||||||||||
|
|
|
|
|
|
|
|
|
|||||||||
| Net interest income after provision for loan losses |
15,662 | 15,748 | 15,297 | 18,826 | ||||||||||||
| Noninterest income |
2,826 | 2,164 | 2,293 | 2,679 | ||||||||||||
| Noninterest expense |
11,031 | 11,051 | 11,341 | 12,755 | ||||||||||||
|
|
|
|
|
|
|
|
|
|||||||||
| Income before income taxes |
7,457 | 6,861 | 6,249 | 8,750 | ||||||||||||
| Income tax expense |
2,452 | 2,375 | 2,159 | 5,508 | ||||||||||||
|
|
|
|
|
|
|
|
|
|||||||||
| Net income |
$ | 5,005 | $ | 4,486 | $ | 4,090 | $ | 3,242 | ||||||||
|
|
|
|
|
|
|
|
|
|||||||||
| Earnings per share – basic |
$ | 0.72 | $ | 0.64 | $ | 0.58 | $ | 0.43 | ||||||||
|
|
|
|
|
|
|
|
|
|||||||||
| Earnings per share – diluted |
$ | 0.69 | $ | 0.62 | $ | 0.56 | $ | 0.41 | ||||||||
|
|
|
|
|
|
|
|
|
|||||||||
| (dollars in thousands, except per share data) |
First Quarter |
Second Quarter |
Third Quarter |
Fourth Quarter |
||||||||||||
| Year Ended December 31, 2016 |
||||||||||||||||
| Total interest income |
$ | 17,049 | $ | 16,866 | $ | 16,847 | $ | 16,923 | ||||||||
| Total interest expense |
1,326 | 1,313 | 1,308 | 1,321 | ||||||||||||
|
|
|
|
|
|
|
|
|
|||||||||
| Net interest income |
15,723 | 15,553 | 15,539 | 15,602 | ||||||||||||
| Provision for loan losses |
850 | 1,050 | 800 | 500 | ||||||||||||
|
|
|
|
|
|
|
|
|
|||||||||
| Net interest income after provision for loan losses |
14,873 | 14,503 | 14,739 | 15,102 | ||||||||||||
| Noninterest income |
2,567 | 3,448 | 2,515 | 2,628 | ||||||||||||
| Noninterest expense |
12,341 | 11,856 | 10,643 | 11,957 | ||||||||||||
|
|
|
|
|
|
|
|
|
|||||||||
| Income before income taxes |
5,099 | 6,095 | 6,611 | 5,773 | ||||||||||||
| Income tax expense |
1,749 | 2,079 | 2,251 | 1,491 | ||||||||||||
|
|
|
|
|
|
|
|
|
|||||||||
| Net income |
$ | 3,350 | $ | 4,016 | $ | 4,360 | $ | 4,282 | ||||||||
|
|
|
|
|
|
|
|
|
|||||||||
| Earnings per share – basic |
$ | 0.49 | $ | 0.59 | $ | 0.63 | $ | 0.62 | ||||||||
|
|
|
|
|
|
|
|
|
|||||||||
| Earnings per share – diluted |
$ | 0.47 | $ | 0.57 | $ | 0.61 | $ | 0.60 | ||||||||
|
|
|
|
|
|
|
|
|
|||||||||
Item 9. Changes in and Disagreements with Accountants on Accounting and Financial Disclosure.
Not applicable.
Item 9A. Controls and Procedures.
Evaluation of Disclosure Controls and Procedures
Our management evaluated, with the participation of our Chief Executive Officer and Chief Financial Officer, the effectiveness of our disclosure controls and procedures (as defined in Rules 13a-15(e) and 15d-15(e) under the Securities Exchange Act of 1934) as of December 31, 2017. Based on such evaluation, our Chief Executive Officer and Chief Financial Officer have concluded that our disclosure controls and procedures are designed to ensure that information required to be disclosed by us in the reports that we file or submit under the Securities Exchange Act of 1934 is recorded, processed, summarized and reported within the time periods specified in the SEC’s rules and regulations and are operating in an effective manner.
90
Table of Contents
Management’s Report on Internal Control over Financial Reporting
The management of Home Bancorp, Inc. is responsible for establishing and maintaining adequate internal control over financial reporting. The Company’s internal control over financial reporting is a process designed under the supervision of the Company’s Chief Executive Officer and the Chief Financial Officer to provide reasonable assurance regarding the reliability of financial reporting and the preparation of the Company’s financial statements for external purposes in accordance with the accounting principles generally accepted in the United States of America. Internal control over financial reporting is defined in Rules 13a-15(f) and 15d-15(f) promulgated under the Securities Exchange Act of 1934, as amended.
On December 6, 2017, the merger of St. Martin Bancshares, Inc. (“SMB”) with the Company was completed with Home Bancorp, Inc. being the surviving entity. As permitted by guidance issued by the SEC, companies are allowed to exclude certain acquisitions from their assessment of internal control over financial reporting during the first year following an acquisition. Accordingly, Management’s Report on Internal Control over Financial Reporting excludes SMB, and the subsidiaries of SMB, from management’s assessment of the Company’s internal control over financial reporting as of December 31, 2017. The proximity of the closing date of the SMB acquisition to year-end necessitated the exclusion of SMB from management’s assessment. As of the date of acquisition, SMB had approximately 27% of the Company’s total assets, and SMB’s 2017 net income constituted approximately 6% of the Company’s net income for the year ended December 31, 2017.
The Company’s internal control systems are designed to ensure that transactions are properly authorized and recorded in the financial records and to safeguard assets from material loss or misuse. Such assurance cannot be absolute because of inherent limitations in any internal control system.
Management assessed the effectiveness of the Company’s internal control over financial reporting as of December 31, 2017 based on the criteria for effective internal control established in Internal Control – Integrated Framework issued by the Committee of Sponsoring Organizations of the Treadway Commission in 2013. Based on the assessment, management determined that the Company maintained effective internal control over financial reporting as of December 31, 2017. Our independent registered public accountants have issued an audit report on the Company’s internal control over financial reporting. This report appears on pages 40 and 41.
Changes in Internal Control over Financial Reporting
No change in our internal control over financial reporting (as defined in Rules 13a-15(f) and 15(d)-15(f) under the Securities Exchange Act of 1934) occurred during the fourth fiscal quarter of 2017 that has materially affected, or is reasonably likely to materially affect, our internal control over financial reporting.
Not applicable.
PART III
Item 10. Directors, Executive Officers and Corporate Governance.
The information required herein is incorporated by reference from the information contained in the sections captioned “Information with Respect to Nominees for Director, Continuing Directors and Executive Officers” and “Beneficial Ownership of Common Stock by Certain Beneficial Owners and Management – Section 16(a) Beneficial Ownership Reporting Compliance” in the Company’s definitive proxy statement to be filed with the SEC for the 2018 Annual Meeting of Shareholders to be held in May 2018 (the “Proxy Statement”).
The Company has adopted a Code of Conduct and Ethics that applies to its principal executive officer and principal financial officer, as well as other officers and employees of the Company and the Bank. A copy of the Code of Ethics is available on the Company’s website at www.home24bank.com.
91
Table of Contents
Item 11. Executive Compensation.
The information required herein with respect to the security ownership of certain beneficial owners and management is incorporated by reference from the information contained in the sections captioned “Management Compensation” in the Proxy Statement.
Item 12. Security Ownership of Certain Beneficial Owners and Management and Related Stockholder Matters.
Equity Compensation Plan Information. The following table provides information as of December 31, 2017 with respect to shares of common stock that may be issued under our existing equity compensation plans, which consist of the 2009 Stock Option Plan, 2009 Recognition and Retention Plan and the 2014 Equity Incentive Plan, each of which was approved by our shareholders.
| Plan Category |
Number of securities to be issued upon exercise of outstanding options, warrants and rights (a) |
Weighted-average exercise price of outstanding options, warrants and rights (b) |
Number of securities remaining available for future issuance under equity compensation plans (excluding securities reflected in column (a)) (c) |
|||||||||
| Equity compensation plans approved by security holders |
463,111 | (1) | $ | 16.64 | (1) | 197,027 | ||||||
| Equity compensation plans not approved by security holders |
— | — | — | |||||||||
|
|
|
|
|
|
|
|||||||
| Total |
463,111 | $ | 16.64 | 197,027 | ||||||||
|
|
|
|
|
|
|
|||||||
| (1) | Includes 3,598 shares subject to restricted stock grants and 51,035 restricted share units which were not vested as of December 31, 2017. The weighted-average exercise price excludes such restricted stock grants. |
The information required herein is incorporated by reference from the information contained in the section captioned “Beneficial Ownership of Common Stock by Certain Beneficial Owners and Management” in the Proxy Statement.
Item 13. Certain Relationships and Related Transactions and Director Independence.
The information required herein is incorporated by reference from the information contained in the sections captioned “Management Compensation – Related Party Transactions” and “Information with Respect to Nominees for Director, Continuing Directors and Executive Officers” in the Proxy Statement.
Item 14. Principal Accounting Fees and Services.
The information required herein is incorporated by reference from the information contained in the sections captioned “Ratification of Appointment of Independent Registered Public Accounting Firm” in the Proxy Statement.
92
Table of Contents
PART IV
Item 15. Exhibits and Financial Statement Schedules.
| (a) | (1) The following financial statements are incorporated by reference from Item 8 hereof: |
| Report of Independent Registered Public Accounting Firm |
| Consolidated Statements of Financial Condition |
| Consolidated Statements of Income |
| Consolidated Statements of Comprehensive Income |
| Consolidated Statements of Changes in Shareholders’ Equity |
| Consolidated Statements of Cash Flows |
| Notes to Consolidated Financial Statements |
(2) All schedules are omitted because they are not required or applicable, or the required information is shown in the consolidated financial statements or the notes thereto.
(3) Exhibits
The following exhibits are filed as part of this Form 10-K and this list includes the Exhibit Index.
93
Table of Contents
| No. |
Description |
Location | ||
| 10.19 | Employment Agreement between Home Bank, N.A. and Jason P. Freyou* | (9) | ||
| 10.20 | Amendment to the Employment Agreement between Home Bank, N.A. and Jason P. Freyou* | (8) | ||
| 23.1 | Consent of Porter Keadle Moore, LLC | Filed herewith | ||
| 31.1 | Rule 13(a)-14(a) Certification of the Chief Executive Officer | Filed herewith | ||
| 31.2 | Rule 13(a)-14(a) Certification of the Chief Financial Officer | Filed herewith | ||
| 32.0 | Section 1350 Certification | Filed herewith | ||
| 101.INS | XBRL Instance Document | |||
| 101.SCH | XBRL Taxonomy Extension Schema Document | |||
| 101.CAL | XBRL Taxonomy Extension Calculation Linkbase Document | |||
| 101.LAB | XBRL Taxonomy Extension Label Linkbase Document | |||
| 101.PRE | XBRL Taxonomy Extension Presentation Linkbase Document | |||
| 101.DEF | XBRL Taxonomy Extension Definitions Linkbase Document | |||
| * | Denotes a management contract or compensatory plan or arrangement. |
| (1) | Incorporated by reference from the like-numbered exhibit included in Home Bancorp’s registration statement on Form S-1, filed June 6, 2008 (SEC File No. 333-151492). |
| (2) | Incorporated by reference from the exhibit included in the Company’s Current Report on Form 8-K, dated as of March 23, 2009 and filed March 27, 2009 (SEC File No. 001-34190). |
| (3) | Incorporated by reference from the exhibit included in the Company’s Current Report on Form 8-K, dated as of December 22, 2008 and filed December 29, 2008 (SEC File No. 001-34190). |
| (4) | Incorporated by reference from the exhibit included in the Company’s Current Report on Form 8-K, dated as of March 28, 2011 and filed March 30, 2011 (SEC File No. 001-34190). |
| (5) | Incorporated by reference from Appendix A to Home Bancorp’s definitive proxy statement filed April 1, 2009 (SEC File No. 001-34190) and included in Form S-8, filed June 23, 2009 (SEC File No. 333-160155). |
| (6) | Incorporated by reference from Appendix B to Home Bancorp’s definitive proxy statement filed April 1, 2009 (SEC File No. 001-34190). |
| (7) | Incorporated by reference from the exhibit included in the Company’s Current Report on Form 8-K, dated as of January 27, 2014 and filed January 31, 2014 (SEC File No. 001-34190). |
| (8) | Incorporated by reference from the exhibit included Home Bancorp’s Current Report on Form 8-K, dated as of May 22, 2017 and filed on May 24, 2017 (SEC File No. 001-34190). |
| (9) | Incorporated by reference from the exhibit included in the Company’s Current Report on Form 8-K, dated as of April 27, 2015 and filed April 30, 2015 (SEC File No. 001-34190). |
| (b) | Exhibits |
The exhibits listed under (a)(3) of this Item 15 are filed herewith.
| (c) | Reference is made to (a)(2) of this Item 15. |
94
Table of Contents
Pursuant to the requirements of Section 13 or 15(d) of the Securities Exchange Act of 1934, the Registrant has duly caused this report to be signed on its behalf by the undersigned, thereunto duly authorized.
| HOME BANCORP, INC. | ||||||
| March 14, 2018 | By: | /s/ John W. Bordelon | ||||
| John W. Bordelon | ||||||
| President and Chief Executive Officer | ||||||
Pursuant to the requirements of the Securities Exchange Act of 1934, this report has been signed below by the following persons on behalf of the Registrant and in the capacities and on the date indicated.
| Name |
Title |
Date | ||
| /s/ John W. Bordelon John W. Bordelon |
President, Chief Executive Officer and Director |
March 14, 2018 | ||
| /s/ Michael P. Maraist Michael P. Maraist |
Chairman of the Board | March 14, 2018 | ||
| /s/ Paul J. Blanchet, III Paul J. Blanchet, III |
Director, Chairman of Audit Committee |
March 14, 2018 | ||
| /s/ Kathy J. Bobbs Kathy J. Bobbs |
Director | March 14, 2018 | ||
| /s/ Richard J. Bourgeois Richard J. Bourgeois |
Director | March 14, 2018 | ||
| /s/ Mark A. Cole Mark A. Cole |
Director | March 14, 2018 | ||
| /s/ Daniel G. Guidry Daniel G. Guidry |
Director | March 14, 2018 | ||
| /s/ John A. Hendry John A. Hendry |
Director | March 14, 2018 | ||
| /s/ Marc W. Judice Marc W. Judice |
Director | March 14, 2018 | ||
| /s/ Chris P. Rader Chris P. Rader |
Director | March 14, 2018 | ||
| /s/ Donald W. Washington Donald W. Washington |
Director | March 14, 2018 | ||
| /s/ Joseph B. Zanco Joseph B. Zanco |
Executive Vice President and Chief Financial Officer |
March 14, 2018 | ||
| /s/ Mary H. Hopkins Mary H. Hopkins |
Home Bank First Vice President and Director of Financial Management |
March 14, 2018 | ||
95