Attached files
| file | filename |
|---|---|
| EX-32 - EXHIBIT 32 - HOME BANCORP, INC. | dex32.htm |
| EX-23.1 - EXHIBIT 23.1 - HOME BANCORP, INC. | dex231.htm |
| EX-23.2 - EXHIBIT 23.2 - HOME BANCORP, INC. | dex232.htm |
| EX-31.2 - EXHIBIT 31.2 - HOME BANCORP, INC. | dex312.htm |
| EX-31.1 - EXHIBIT 31.1 - HOME BANCORP, INC. | dex311.htm |
Table of Contents
UNITED STATES
SECURITIES AND EXCHANGE COMMISSION
Washington, D.C. 20549
FORM 10-K
(Mark One)
| x | Annual report pursuant to Section 13 or 15(d) of the Securities Exchange Act of 1934 |
For the fiscal year ended: December 31, 2009
or
| ¨ | Transition report pursuant to Section 13 or 15(d) of the Securities Exchange Act of 1934 |
For the transition period from to
Commission File Number: 001-34190
HOME BANCORP, INC.
(Exact name of Registrant as specified in its charter)
| Louisiana | 71-1051785 | |
| (State or Other Jurisdiction of Incorporation or Organization) |
(I.R.S. Employer Identification Number) | |
| 503 Kaliste Saloom Road, Lafayette, Louisiana | 70508 | |
| (Address of Principal Executive Offices) | (Zip Code) | |
Registrant’s telephone number, including area code: (337) 237-1960
Securities registered pursuant to Section 12(b) of the Act:
| Title of each class | Name of each exchange on which registered | |
| Common Stock, $0.01 par value per share | The Nasdaq Stock Market, LLC |
Securities registered pursuant to Section 12(g) of the Act: none
Indicate by check mark if the registrant is a well-known seasoned issuer, as defined in Rule 405 of the Securities Act. YES ¨ NO x
Indicate by check mark if the registrant is not required to file reports pursuant to Section 13 or Section 15(d) of the Act. YES ¨ NO x
Indicate by check mark whether the Registrant (1) has filed all reports required to be filed by Section 13 or 15(d) of the Securities Exchange Act of 1934 during the preceding 12 months and (2) has been subject to such filing requirements for the past 90 days. YES x NO ¨
Indicate by check mark if disclosure of delinquent filers pursuant to Item 405 of Regulation S-K is not contained herein, and will not be contained, to the best of the Registrant’s knowledge in definitive proxy or information statements incorporated by reference in Part III of this Form 10-K or any amendment to this Form 10-K. x
Indicate by check mark whether the registrant has submitted electronically and posted on its corporate Web site, if any, every Interactive Date File required to be submitted and posted pursuant to Rule 405 of Regulation S-T (§232.405 of this chapter) during the preceding 12 months (or for such shorter period that the registrant was require to submit and post such files). YES ¨ NO ¨
Indicate by check mark whether the registrant is a large accelerated filer, an accelerated filer, a non-accelerated filer, or a smaller reporting company. See the definitions of “large accelerated filer,” “accelerated filer” and “smaller reporting company” in Rule 12b-2 of the Exchange Act. (Check one):
| Large accelerated filer | ¨ | Accelerated filer | x | |||||||
| Non-accelerated filer | ¨ | Smaller reporting company | ¨ | |||||||
| (Do not check if a smaller reporting company) | ||||||||||
Indicate by check mark whether the registrant is a shell company (as defined in Rule 12b-2 of the Act). YES ¨ NO x
The aggregate market value of the 7,118,579 shares of the Registrant’s common stock held by non-affiliates, based upon the closing price of $11.94 for the common stock on June 30, 2009, as reported by the Nasdaq Stock Market, was approximately $85.0 million. Shares of common stock held by the registrant’s executive officers, directors and certain benefit plans have been excluded since such persons may be deemed to be affiliates. This determination of affiliate status is not necessarily a conclusive determination for other purposes.
Number of shares of common stock outstanding as of March 12, 2010: 8,682,700
DOCUMENTS INCORPORATED BY REFERENCE
Set forth below are the documents incorporated by reference and the part of the Form 10-K into which the document is incorporated:
Portions of the definitive Proxy Statement for the 2010 Annual Meeting of Stockholders are incorporated by reference into Part III, Items 10-14 of this Form 10-K.
Table of Contents
2009 ANNUAL REPORT ON FORM 10-K
TABLE OF CONTENTS
| Page | ||||
| PART I | ||||
| Item 1. |
1 | |||
| Item 1A. |
12 | |||
| Item 1B. |
15 | |||
| Item 2. |
16 | |||
| Item 3. |
16 | |||
| Item 4. |
16 | |||
| PART II | ||||
| Item 5. |
17 | |||
| Item 6. |
18 | |||
| Item 7. |
Management’s Discussion and Analysis of Financial Condition and Results of Operations |
20 | ||
| Item 7A. |
39 | |||
| Item 8. |
40 | |||
| Item 9. |
Changes in and Disagreements with Accountants on Accounting and Financial Disclosure |
71 | ||
| Item 9A(T). |
71 | |||
| Item 9B. |
71 | |||
| PART III | ||||
| Item 10. |
72 | |||
| Item 11. |
72 | |||
| Item 12. |
Security Ownership of Certain Beneficial Owners and Management and Related Stockholder Matters |
72 | ||
| Item 13. |
Certain Relationships and Related Transactions, and Director Independence |
72 | ||
| Item 14. |
72 | |||
| PART IV | ||||
| Item 15. |
73 | |||
| 75 | ||||
Table of Contents
Forward-Looking Statements
This Annual Report on Form 10-K contains certain forward looking statements (as defined in the Securities Exchange Act of 1934 and the regulations hereunder). Forward looking statements are not historical facts but instead represent only the beliefs, expectations or opinions of Home Bancorp, Inc. and its management regarding future events, many of which, by their nature, are inherently uncertain. Forward looking statements may be identified by the use of such words as: “believe”, “expect”, “anticipate”, “intend”, “plan”, “estimate”, or words of similar meaning, or future or conditional terms such as “will”, “would”, “should”, “could”, “may”, “likely”, “probably”, or “possibly.” Forward looking statements include, but are not limited to, financial projections and estimates and their underlying assumptions; statements regarding plans, objectives and expectations with respect to future operations, products and services; and statements regarding future performance. Such statements are subject to certain risks, uncertainties and assumption, many of which are difficult to predict and generally are beyond the control of Home Bancorp, Inc. and its management, that could cause actual results to differ materially from those expressed in, or implied or projected by, forward looking statements. The following factors, among others, could cause actual results to differ materially from the anticipated results or other expectations expressed in the forward looking statements: (1) economic and competitive conditions which could affect the volume of loan originations, deposit flows and real estate values; (2) the levels of noninterest income and expense and the amount of loan losses; (3) competitive pressure among depository institutions increasing significantly; (4) changes in the interest rate environment causing reduced interest margins; (5) general economic conditions, either nationally or in the markets in which Home Bancorp, Inc. is or will be doing business, being less favorable than expected;(6) political and social unrest, including acts of war or terrorism; or (7) legislation or changes in regulatory requirements adversely affecting the business of Home Bancorp, Inc. Home Bancorp, Inc. undertakes no obligation to update these forward looking statements to reflect events or circumstances that occur after the date on which such statements were made.
As used in this report, unless the context otherwise requires, the terms “we,” “our,” “us,” or the “Company” refer to Home Bancorp, Inc., a Louisiana corporation, and the term the “Bank” refers to Home Bank, a federally chartered savings bank and wholly owned subsidiary of the Company. In addition, unless the context otherwise requires, references to the operations of the Company include the operations of the Bank.
| Item 1. | Business. |
General. Home Bancorp, Inc. is a Louisiana corporation that became the holding company for Home Bank in October 2008 upon the Bank’s mutual to stock conversion. Home Bank is a federally chartered community-oriented savings bank which was originally organized in 1908 and is headquartered in Lafayette, Louisiana. The Bank currently conducts business from its main office as well as eight additional full-service banking offices in the Lafayette metropolitan area and two full-service banking offices in Baton Rouge, Louisiana. The Bank also maintains a loan production office in Baton Rouge, Louisiana. The Bank opened an additional full-service banking office in the Baton Rouge area in March 2010.
The Bank is primarily engaged in attracting deposits from the general public and using those funds to invest in loans and securities. Our principal sources of funds are customer deposits, repayments of loans, repayments of investments and funds borrowed from outside sources such as the Federal Home Loan Bank (“FHLB”) of Dallas. These funds are primarily used for the origination of loans, including single-family residential first mortgage loans, commercial real estate mortgage loans, commercial business loans, home equity loans and lines of credit, construction and land loans and other loans. The Bank derives its income principally from interest earned on loans and investment securities and, to a lesser extent, from fees received in connection with the origination of loans, service charges on deposit accounts and for other services. The Bank’s primary expenses are interest expense on deposits and borrowings and general operating expenses.
1
Table of Contents
We are an active originator of residential home mortgage loans in our market area. Historically, Home Bank was a traditional thrift institution with an emphasis on fixed-rate long-term single-family residential first mortgage loans. Approximately eight years ago, we shifted our emphasis on the loan products we offer and increased our efforts to originate commercial real estate loans and commercial business loans. Commercial real estate loans and commercial business loans were deemed attractive due to their generally higher yields and shorter anticipated lives compared to single-family residential mortgage loans. In addition, the Bank views commercial real estate and commercial business loans as attractive lending products because the Bank’s commercial borrowers typically are required to maintain deposit accounts at the Bank, increasing the Bank’s core deposits. At December 31, 2009, 58.4% of the Bank’s total deposits were considered to be core deposits, as defined by the Bank to include demand deposit, money market and savings accounts. The Bank intends to continue its efforts to increase its core deposits, which have increased from 45.2% of total deposits at December 31, 2005, as a cost efficient source of funds for continued loan growth.
In recent years, the Bank has focused on increasing and diversifying its loan portfolio, growing its core deposit base, and on transitioning from a traditional thrift institution to a commercial bank model. The Bank’s net loan portfolio totaled $333.3 million at December 31, 2009, an increase of $87.1 million, or 35.4%, compared to December 31, 2005. The Bank’s deposits totaled $371.6 million at December 31, 2009, an increase of $63.2 million, or 20.5%, compared to December 31, 2005. At December 31, 2009, the Bank had 11 full-service banking offices and one loan production office compared to eight banking offices at December 31, 2005. The Bank intends to continue its growth by our expansion into the Baton Rouge market area as well as increasing our market penetration in the Lafayette market area. In addition, we will consider opportunities to expand our banking franchise into other market areas in southern Louisiana. Reflecting the Bank’s loan diversification efforts, its commercial real estate loans, including multi-family residential, have grown from $61.5 million, or 24.8% of the total loan portfolio, at December 31, 2005, to $101.6 million, or 30.2% of the total portfolio, at December 31, 2009. During this period, the Bank’s other commercial business loans have increased from $19.5 million, or 7.9% of the loan portfolio, at December 31, 2005, to $38.3 million, or 11.4% of the loan portfolio, at December 31, 2009. In its efforts to become more like a commercial bank, the Bank has strengthened its infrastructure and technological capabilities in order to facilitate its ability to compete with other financial institutions and offer additional products and services. The Bank offers internet banking, bank debit cards, corporate cash management, remote deposit recapture, and merchant bank card services. Previously, the Bank also provided cash to fund remote, third-party ATMs throughout the United States. The Bank served as a source of funds for these ATMs, which were located in convenience stores and other public locations, for a fee, which is included in interest income. The Bank’s remaining contracts with its ATM counterparties expired during 2009. The Bank did not renew the contracts and received all cash invested at other ATMs locations back from the counterparties during 2009. At December 31, 2008, such cash at other ATMs amounted to $24.2 million, and the Bank recognized interest income of $925,000 and $1.1 million, respectively, for the years ended December 31, 2009 and 2008, respectively, with respect to such financing of remote ATMs.
The Company’s headquarters office is located at 503 Kaliste Saloom Road, Lafayette, Louisiana, and our telephone number is (337) 237-1960. We maintain a website at www.home24bank.com, and we provide our customers with on-line banking services. Information on our website should not be considered a part of this Annual Report on Form 10-K.
Market Area and Competition
The Bank’s primary market area is south central Louisiana, particularly the Lafayette, Louisiana metropolitan area. With its June 2006 acquisition of Crowley Building and Loan Association, the Bank expanded its branch office network into Crowley, Louisiana, which is located in Acadia Parish, approximately 20 miles west of Lafayette. In 2007, the Bank again expanded its operations by opening a loan production office in Baton Rouge, Louisiana, which is approximately 55 miles northeast of Lafayette. In 2008, the Bank opened two full-service branch locations in Baton Rouge and plans to open a third full-service location in Baton Rouge in 2010.
2
Table of Contents
We face significant competition in originating loans and attracting deposits. This competition stems primarily from commercial banks, other savings banks and savings associations and mortgage-banking companies. Many of the financial service providers operating in our market area are significantly larger, and have greater financial resources, than us. We face additional competition for deposits from short-term money market funds and other corporate and government securities funds, mutual funds and from other non-depository financial institutions such as brokerage firms and insurance companies.
Regulation
Set forth below is a brief description of certain laws relating to the regulation of Home Bancorp, Inc. and Home Bank. This description does not purport to be complete and is qualified in its entirety by reference to applicable laws and regulations.
General. Home Bank, as a federally chartered savings bank, is subject to federal regulation and oversight by the Office of Thrift Supervision (“OTS”) extending to all aspects of its operations. The Bank is also subject to regulation and examination by the Federal Deposit Insurance Corporation (“FDIC”), which insures the deposits of the Bank to the maximum extent permitted by law, and requirements established by the Federal Reserve Board. Federally chartered savings institutions are required to file periodic reports with the OTS and are subject to periodic examinations by the OTS and the FDIC. The investment and lending authority of savings institutions are prescribed by federal laws and regulations, and such institutions are prohibited from engaging in any activities not permitted by such laws and regulations. Such regulation and supervision primarily is intended for the protection of depositors and not for the purpose of protecting shareholders.
Federal law provides the federal banking regulators, including the OTS and FDIC, with substantial enforcement powers. The OTS’s enforcement authority over all savings institutions and their holding companies includes, among other things, the ability to assess civil money penalties, to issue cease and desist or removal orders and to initiate injunctive actions. In general, these enforcement actions may be initiated for violations of laws and regulations and unsafe or unsound practices. Other actions or inactions may provide the basis for enforcement action, including misleading or untimely reports filed with the OTS. Any change in such regulations, whether by the FDIC, OTS or Congress, could have a material adverse impact on the Company and the Bank and their operations.
Regulation of Home Bancorp, Inc.
Holding Company Acquisitions. Upon completion of the conversion, the Company became a savings and loan holding company under the Home Owners’ Loan Act, as amended, and was required to register with the OTS. Federal law generally prohibits a savings and loan holding company, without prior OTS approval, from acquiring the ownership or control of any other savings institution or savings and loan holding company, or all, or substantially all, of the assets or more than 5% of the voting shares of the savings institution or savings and loan holding company. These provisions also prohibit, among other things, any director or officer of a savings and loan holding company, or any individual who owns or controls more than 25% of the voting shares of such holding company, from acquiring control of any savings institution not a subsidiary of such savings and loan holding company, unless the acquisition is approved by the OTS.
The OTS may not approve any acquisition that would result in a multiple savings and loan holding company controlling savings institutions in more than one state, subject to two exceptions: (1) the approval of interstate supervisory acquisitions by savings and loan holding companies; and (2) the acquisition of a savings institution in another state if the laws of the state of the target savings institution specifically permit such acquisitions. The states vary in the extent to which they permit interstate savings and loan holding company acquisitions.
Holding Company Activities. The Company is a unitary savings and loan holding company and is permitted to engage only in the activities permitted for financial holding companies under Federal Reserve Board regulations
3
Table of Contents
or for multiple savings and loan holding companies. Multiple savings and loan holding companies are permitted to engage in the following activities: (i) activities permitted for a bank holding company under section 4(c) of the Bank Holding Company Act (unless the Director of the OTS prohibits or limits such 4(c) activities); (ii) furnishing or performing management services for a subsidiary savings association; (iii) conducting any insurance agency or escrow business; (iv) holding, managing, or liquidating assets owned by or acquired from a subsidiary savings association; (v) holding or managing properties used or occupied by a subsidiary savings association; (vi) acting as trustee under deeds of trust; or (vii) activities authorized by regulation as of March 5, 1987, to be engaged in by multiple savings and loan holding companies. Although savings and loan holding companies are not subject to specific capital requirements or specific restrictions on the payment of dividends or other capital distributions, federal regulations do prescribe such restrictions on subsidiary savings institutions, as described below. The Bank is required to notify the OTS 30 days before declaring any dividend. In addition, the financial impact of a holding company on its subsidiary institution is a matter that is evaluated by the OTS and the agency has authority to order cessation of activities or divestiture of subsidiaries deemed to pose a threat to the safety and soundness of the institution.
Federal Securities Laws. We have registered our common stock with the Securities and Exchange Commission (“SEC”) under Section 12(b) of the Securities Exchange Act of 1934. Accordingly, the Company is subject to the proxy and tender offer rules, insider trading reporting requirements and restrictions, and certain other requirements under the Securities Exchange Act of 1934. Pursuant to OTS regulations and the plan of conversion, we agreed to maintain such registration for a minimum of three years following the Bank’s mutual-to-stock conversion.
The Sarbanes-Oxley Act of 2002. As a public company, the Company is subject to the Sarbanes-Oxley Act of 2002, which implements a broad range of corporate governance and accounting measures for public companies designed to promote honesty and transparency in corporate America and better protect investors from corporate wrongdoing. The Sarbanes-Oxley Act’s principal legislation and the derivative regulation and rule-making promulgated by the SEC include:
| • | the creation of an independent accounting oversight board; |
| • | auditor independence provisions that restrict non-audit services that accountants may provide to their audit clients; |
| • | additional corporate governance and responsibility measures, including the requirement that the chief executive officer and chief financial officer certify financial statements; |
| • | a requirement that companies establish and maintain a system of internal control over financial reporting and that a company’s management provide an annual report regarding its assessment of the effectiveness of such internal control over financial reporting to the company’s independent accountants and that such accountants provide an attestation report with respect to management’s assessment of the effectiveness of the company’s internal control over financial reporting; |
| • | the forfeiture of bonuses or other incentive-based compensation and profits from the sale of an issuer’s securities by directors and senior officers in the twelve month period following initial publication of any financial statements that later require restatement; |
| • | an increase in the oversight of, and enhancement of certain requirements relating to audit committees of public companies and how they interact with the company’s independent auditors; |
| • | the requirement that audit committee members must be independent and are absolutely barred from accepting consulting, advisory or other compensatory fees from the issuer; |
| • | the requirement that companies disclose whether at least one member of the audit committee is a “financial expert” (as such term is defined by the SEC) and if not, why not; |
| • | expanded disclosure requirements for corporate insiders, including accelerated reporting of stock transactions by insiders and a prohibition on insider trading during pension blackout periods; |
4
Table of Contents
| • | a prohibition on personal loans to directors and officers, except certain loans made by insured financial institutions; |
| • | disclosure of a code of ethics and the requirement of filing of a Form 8-K for a change or waiver of such code; |
| • | mandatory disclosure by analysts of potential conflicts of interest; and |
| • | a range of enhanced penalties for fraud and other violations. |
Regulation of Home Bank
General. As the primary federal regulator of Home Bank, the OTS has extensive authority over the operations of federally-chartered savings institutions. As part of this authority, Home Bank is required to file periodic reports with the OTS and is subject to periodic examinations by the OTS and the FDIC. The investment and lending authorities of savings institutions are prescribed by federal laws and regulations, and such institutions are prohibited from engaging in any activities not permitted by such laws and regulations. Such regulation and supervision is primarily intended for the protection of depositors and the Deposit Insurance Fund, administered by the FDIC.
The OTS’s enforcement authority over all savings institutions and their holding companies includes, among other things, the ability to assess civil money penalties, to issue cease and desist or removal orders and to initiate injunctive actions. In general, these enforcement actions may be initiated for violations of laws and regulations and unsafe or unsound practices. Other actions or inactions may provide the basis for enforcement action, including misleading or untimely reports filed with the OTS.
Emergency Economic Stabilization Act of 2008. The U.S. Congress adopted, and on October 3, 2008, President George W. Bush signed, the Emergency Economic Stabilization Act of 2008 (“EESA”) which authorized the United States Department of the Treasury, to purchase from financial institutions and their holding companies up to $700 billion in mortgage loans, mortgage-related securities and certain other financial instruments, including debt and equity securities issued by financial institutions and their holding companies in a troubled asset relief program. The purpose of the troubled asset relief program is to restore confidence and stability to the U.S. banking system and to encourage financial institutions to increase their lending to customers and to each other. The troubled asset relief program is also expected to include direct purchases or guarantees of troubled assets of financial institutions. The Treasury Department has allocated $250 billion towards a capital purchase program. Under the capital purchase program, the Treasury Department purchased debt or equity securities from participating institutions. We have elected not to participate in the capital purchase program.
The FDIC increased deposit insurance on most accounts from $100,000 to $250,000 until the end of 2013. In addition, pursuant to Section 13(c)(4)(G) of the Federal Deposit Insurance Act, the FDIC has implemented two temporary programs to provide deposit insurance for the full amount of most noninterest bearing transaction deposit accounts through the end of 2013 and to guarantee certain unsecured debt of financial institutions and their holding companies through December 2012. For noninterest bearing transaction deposit accounts, including accounts swept from a noninterest bearing transaction account into a noninterest bearing savings deposit account, a 10 basis point annual rate surcharge is applied to deposit amounts in excess of $250,000. The Company did not participate in the temporary liquidity guarantee program.
Insurance of Accounts. The deposits of Home Bank are insured to the maximum extent permitted by the Deposit Insurance Fund and are backed by the full faith and credit of the U.S. Government. As insurer, the FDIC is authorized to conduct examinations of, and to require reporting by, insured institutions. It also may prohibit any insured institution from engaging in any activity determined by regulation or order to pose a serious threat to the FDIC. The FDIC also has the authority to initiate enforcement actions against savings institutions, after giving the OTS an opportunity to take such action.
The FDIC implemented a risk-based premium system that provides for quarterly assessments based on an insured institution’s ranking in one of four risk categories based upon supervisory and capital evaluations. Well-
5
Table of Contents
capitalized institutions (generally those with CAMELS composite ratings of 1 or 2) are grouped in Risk Category I and assessed for deposit insurance at an annual rate of between five and seven basis points. The assessment rate for an individual institution is determined according to a formula based on a weighted average of the institution’s individual CAMELS component ratings plus either five financial ratios or, in the case of an institution with assets of $10.0 billion or more, the average ratings of its long-term debt. Institutions in Risk Categories II, III and IV are assessed at annual rates of 22, 32 and 45 basis points, respectively.
In addition, all institutions with deposits insured by the FDIC are required to pay assessments to fund interest payments on bonds issued by the Financing Corporation, a mixed-ownership government corporation established to recapitalize the predecessor to the Deposit Insurance Fund. The annual assessment rate set for the fourth quarter of 2009 was 0.00255% of insured deposits and is adjusted quarterly. These assessments will continue until the Financing Corporation bonds mature in 2019.
The FDIC may terminate the deposit insurance of any insured depository institution, including Home Bank, if it determines after a hearing that the institution has engaged or is engaging in unsafe or unsound practices, is in an unsafe or unsound condition to continue operations, or has violated any applicable law, regulation, order or any condition imposed by an agreement with the FDIC. It also may suspend deposit insurance temporarily during the hearing process for the permanent termination of insurance, if the institution has no tangible capital. If insurance of accounts is terminated, the accounts at the institution at the time of the termination, less subsequent withdrawals, shall continue to be insured for a period of six months to two years, as determined by the FDIC. Management is aware of no existing circumstances which would result in termination of Home Bank’s deposit insurance.
On February 27, 2009, the FDIC adopted an interim final regulation providing for a restoration plan designed to replenish the Deposit Insurance Fund over a period of seven years and to increase the deposit insurance reserve ratio, which decreased to 0.40% of insured deposits on December 31, 2008, to the statutory minimum of 1.15% of insured deposits by December 31, 2015. In order to implement the restoration plan, the FDIC proposes to change both its risk-based assessment system and its base assessment rates. Assessment rates would increase by seven basis points across the range of risk weightings of depository institutions. Changes to the risk-based assessment system would include increasing premiums for institutions that rely significantly on excessive amounts of brokered deposits, including CDARS, increasing premiums for excessive use of secured liabilities, including FHLB advances, lowering premiums for smaller institutions with very high capital levels, and adding financial ratios and debt issuer ratings to the premium calculations for banks with over $10 billion in assets, while providing a reduction for their unsecured debt.
On May 22, 2009, the FDIC also adopted a final rule imposing a five basis point special assessment on assets less Tier 1 capital of insured institutions as of June 30, 2009. The special assessment, which amounted to $200,000 in the case of the Bank, was paid in the quarter ended September 30, 2009. The final rule also permits the FDIC to impose an additional special assessment after June 30, 2009, of up to five basis points if necessary to maintain public confidence in federal deposit insurance.
On November 12, 2009, the FDIC adopted a final rule to require insured institutions to prepay their estimated quarterly risk-based assessments for the fourth quarter of 2009, and for all of 2010, 2011 and 2012. The prepaid assessment was collected on December 30, 2009 along with each institution’s regular quarterly risk-based deposit insurance assessment for the third quarter of 2009. For purposes of calculating the prepaid assessment, each institution’s assessment rate was its total base assessment rate in effect on September 30, 2009. The FDIC increased annual assessment rates uniformly by three basis points beginning in 2011. The projected assessment base for each quarter represents the September 30, 2009, assessment base increased quarterly by a five percent annual growth rate. The prepayment amount will be used to offset future FDIC premiums beginning with the March 2010 invoice. On December 30, 2009, the Bank paid $1.2 million for the total prepaid assessment.
6
Table of Contents
Regulatory Capital Requirements. Federally insured savings institutions are required to maintain minimum levels of regulatory capital. The OTS has established capital standards consisting of a “tangible capital requirement,” a “leverage capital requirement” and “a risk-based capital requirement.” The OTS also is authorized to impose capital requirements in excess of these standards on individual institutions on a case-by-case basis.
Current OTS capital standards require savings institutions to satisfy the following capital requirements:
| • | tangible capital requirement – “tangible” capital equal to at least 1.5% of adjusted total assets; |
| • | leverage capital requirement – “core” capital equal to at least 4.0% of adjusted total assets; and |
| • | risk-based capital requirement – “total” capital (a combination of core and “supplementary” capital) equal to at least 8.0% of “risk-weighted” assets. |
Core capital generally consists of common stockholders’ equity (including retained earnings). Tangible capital generally equals core capital minus intangible assets, with only a limited exception for purchased mortgage servicing rights. Both core and tangible capital are further reduced by an amount equal to a savings institution’s debt and equity investments in subsidiaries engaged in activities not permissible to national banks (other than subsidiaries engaged in activities undertaken as agent for customers or in mortgage banking activities and subsidiary depository institutions or their holding companies). These adjustments do not affect Home Bank’s regulatory capital.
In determining compliance with the risk-based capital requirement, a savings institution is allowed to include both core capital and supplementary capital in its total capital, provided that the amount of supplementary capital included does not exceed the savings institution’s core capital. Supplementary capital generally consists of general allowances for loan losses up to a maximum of 1.25% of risk-weighted assets, together with certain other items. In determining the required amount of risk-based capital, total assets, including certain off-balance sheet items, are multiplied by a risk weight based on the risks inherent in the type of assets. The risk weights range from 0% for cash and securities issued by the U.S. Government or unconditionally backed by the full faith and credit of the U.S. Government to 100% for loans (other than qualifying residential loans weighted at 80%) and repossessed assets.
Savings institutions must value securities available for sale at amortized cost for regulatory capital purposes. This means that in computing regulatory capital, savings institutions should add back any unrealized losses and deduct any unrealized gains, net of income taxes, on debt securities reported as a separate component of capital as defined by the generally accepted accounting principles (“GAAP”).
At December 31, 2009, Home Bank exceeded all of its regulatory capital requirements, with tangible, core and risk-based capital ratios of 20.24%, 20.24% and 30.74%, respectively.
Any savings institution that fails any of the capital requirements is subject to possible enforcement actions by the OTS or the FDIC. Such actions could include a capital directive, a cease and desist order, civil money penalties, the establishment of restrictions on the institution’s operations, termination of federal deposit insurance and the appointment of a conservator or receiver. The OTS’s capital regulation provides that such actions, through enforcement proceedings or otherwise, could require one or more of a variety of corrective actions.
Prompt Corrective Action. The following table shows the amount of capital associated with the different capital categories set forth in the prompt corrective action regulations.
| Capital Category |
Total Risk-based Capital |
Tier 1 Risk-based Capital |
Tier 1 Leverage Capital | |||
| Well capitalized |
10% or more | 6% or more | 5% or more | |||
| Adequately capitalized |
8% or more | 4% or more | 4% or more | |||
| Undercapitalized |
Less than 8% | Less than 4% | Less than 4% | |||
| Significantly undercapitalized |
Less than 6% | Less than 3% | Less than 3% |
7
Table of Contents
In addition, an institution is “critically undercapitalized” if it has a ratio of tangible equity to total assets that is equal to or less than 2.0%. Under specified circumstances, a federal banking agency may reclassify a well capitalized institution as adequately capitalized and may require an adequately capitalized institution or an undercapitalized institution to comply with supervisory actions as if it were in the next lower category (except that the FDIC may not reclassify a significantly undercapitalized institution as critically undercapitalized).
An institution generally must file a written capital restoration plan which meets specified requirements within 45 days of the date that the institution receives notice or is deemed to have notice that it is undercapitalized, significantly undercapitalized or critically undercapitalized. A federal banking agency must provide the institution with written notice of approval or disapproval within 60 days after receiving a capital restoration plan, subject to extensions by the agency. An institution which is required to submit a capital restoration plan must concurrently submit a performance guaranty by each company that controls the institution. In addition, undercapitalized institutions are subject to various regulatory restrictions, and the appropriate federal banking agency also may take any number of discretionary supervisory actions.
At December 31, 2009, Home Bank was deemed a well capitalized institution for purposes of the above regulations and as such is not subject to the above mentioned restrictions.
Capital Distributions. OTS regulations govern capital distributions by savings institutions, which include cash dividends, stock repurchases and other transactions charged to the capital account of a savings institution to make capital distributions. A savings institution must file an application for OTS approval of the capital distribution if either (1) the total capital distributions for the applicable calendar year exceed the sum of the institution’s net income for that year to date plus the institution’s retained net income for the preceding two years, (2) the institution would not be at least adequately capitalized following the distribution, (3) the distribution would violate any applicable statute, regulation, agreement or OTS-imposed condition, or (4) the institution is not eligible for expedited treatment of its filings. If an application is not required to be filed, savings institutions which are a subsidiary of a savings and loan holding company (as well as certain other institutions) must still file a notice with the OTS at least 30 days before the board of directors declares a dividend or approves a capital distribution.
Qualified Thrift Lender Test. All savings institutions are required to meet a qualified thrift lender, or QTL, test to avoid certain restrictions on their operations. A savings institution can comply with the QTL test by either qualifying as a domestic building and loan association as defined in the Internal Revenue Code or meeting the OTS QTL test.
Currently, the OTS QTL test requires that 65% of an institution’s “portfolio assets” (as defined) consist of certain housing and consumer-related assets on a monthly average basis in nine out of every 12 months. To be a qualified thrift lender under the IRS test, the savings institution must meet a “business operations test” and a “60 percent assets test,” each defined in the Internal Revenue Code.
If the savings institution fails to maintain its QTL status, the holding company’s activities are restricted. In addition, it must discontinue any non-permissible business, although the OTS may grant a grace period up to two years for good cause. Nonetheless, any company that controls a savings institution that is not a qualified thrift lender must register as a bank holding company within one year of the savings institution’s failure to meet the QTL test.
Statutory penalty provisions require an institution that fails to remain a QTL to either become a national bank or be prohibited from the following:
| • | Making any new investments or engaging in any new activity not allowed for both a national bank and a savings association; |
| • | Establishing any new branch office unless allowable for a national bank; and |
| • | Paying dividends unless allowable for a national bank. |
8
Table of Contents
Three years from the date a savings association should have become or ceases to be a QTL, by failing to meet either QTL test, the institution must dispose of any investment or not engage in any activity unless the investment or activity is allowed for both a national bank and a savings association.
At December 31, 2009, Home Bank met the requirements to be deemed a QTL.
Limitations on Transactions with Affiliates. Transactions between savings associations and any affiliate are governed by Sections 23A and 23B of the Federal Reserve Act as made applicable to savings associations by Section 11 of the Home Owners’ Loan Act. An affiliate of a savings association is any company or entity which controls, is controlled by or is under common control with the savings association. In a holding company context, the holding company of a savings association (such as Home Bancorp) and any companies which are controlled by such holding company are affiliates of the savings association. Generally, Section 23A limits the extent to which the savings association or its subsidiaries may engage in “covered transactions” with any one affiliate to an amount equal to 10% of such association’s capital stock and surplus, and contain an aggregate limit on all such transactions with all affiliates to an amount equal to 20% of such capital stock and surplus. Section 23B applies to “covered transactions” as well as certain other transactions and requires that all transactions be on terms substantially the same, or at least as favorable, to the savings association as those provided to a non-affiliate. The term “covered transaction” includes the making of loans to, purchase of assets from and issuance of a guarantee to an affiliate and similar transactions. Section 23B transactions also include the provision of services and the sale of assets by a savings association to an affiliate. In addition to the restrictions imposed by Sections 23A and 23B, Section 11 of the Home Owners’ Loan Act prohibits a savings association from (i) making a loan or other extension of credit to an affiliate, except for any affiliate which engages only in certain activities which are permissible for bank holding companies, or (ii) purchasing or investing in any stocks, bonds, debentures, notes or similar obligations of any affiliate, except for affiliates which are subsidiaries of the savings association.
In addition, Sections 22(g) and (h) of the Federal Reserve Act as made applicable to savings associations by Section 11 of the Home Owners’ Loan Act, place restrictions on loans to executive officers, directors and principal shareholders of the savings association and its affiliates. Under Section 22(h), loans to a director, an executive officer and to a greater than 10% shareholder of a savings association, and certain affiliated interests of either, may not exceed, together with all other outstanding loans to such person and affiliated interests, the savings association’s loans to one borrower limit (generally equal to 15% of the association’s unimpaired capital and surplus). Section 22(h) also requires that loans to directors, executive officers and principal shareholders be made on terms substantially the same as offered in comparable transactions to other persons unless the loans are made pursuant to a benefit or compensation program that (i) is widely available to employees of the association and (ii) does not give preference to any director, executive officer or principal shareholder, or certain affiliated interests of either, over other employees of the savings association. Section 22(h) also requires prior board approval for certain loans. In addition, the aggregate amount of extensions of credit by a savings association to all insiders cannot exceed the association’s unimpaired capital and surplus. Furthermore, Section 22(g) places additional restrictions on loans to executive officers. Home Bank currently is subject to Sections 22(g) and (h) of the Federal Reserve Act and at December 31, 2009, was in compliance with the above restrictions.
Anti-Money Laundering. All financial institutions, including savings and loan associations, are subject to federal laws that are designed to prevent the use of the U.S. financial system to fund terrorist activities. Financial institutions operating in the United States must develop anti-money laundering compliance programs, due diligence policies and controls to ensure the detection and reporting of money laundering. Such compliance programs are intended to supplement compliance requirements, also applicable to financial institutions, under the Bank Secrecy Act and the Office of Foreign Assets Control Regulations. Home Bank has established policies and procedures to ensure compliance with these provisions.
Federal Home Loan Bank System. Home Bank is a member of the FHLB of Dallas, which is one of 12 regional FHLBs that administers the home financing credit function of savings institutions. Each FHLB serves as a
9
Table of Contents
reserve or central bank for its members within its assigned region. It is funded primarily from proceeds derived from the sale of consolidated obligations of the FHLB System. It makes loans to members (i.e., advances) in accordance with policies and procedures established by the board of directors of the FHLB. At December 31, 2009, Home Bank had $16.8 million of FHLB advances and $205.7 million available on its line of credit with the FHLB.
As a member, Home Bank is required to purchase and maintain stock in the FHLB of Dallas in an amount equal to at least 1.0% of its aggregate unpaid residential mortgage loans or similar obligations at the beginning of each year. At December 31, 2009, Home Bank had $1.6 million in FHLB stock, which was in compliance with this requirement.
The FHLBs are required to provide funds for the resolution of troubled savings institutions and to contribute to affordable housing programs through direct loans or interest subsidies on advances targeted for community investment and low- and moderate-income housing projects. These contributions have adversely affected the level of FHLB dividends paid in the past and could do so in the future. These contributions also could have an adverse effect on the value of FHLB stock in the future.
Federal Reserve System. The Federal Reserve Board requires all depository institutions to maintain reserves against their transaction accounts (primarily NOW and Super NOW checking accounts) and non-personal time deposits. The required reserves must be maintained in the form of vault cash or an account at a Federal Reserve Bank. At December 31, 2009, Home Bank had met its reserve requirement.
Federal Taxation
General. Home Bancorp, Inc. and Home Bank are subject to federal income taxation in the same general manner as other corporations with some exceptions listed below. The following discussion of federal, state and local income taxation is only intended to summarize certain pertinent income tax matters and is not a comprehensive description of the applicable tax rules. Home Bank’s federal and state income tax returns for taxable years through December 31, 2005 have been closed for purposes of examination by the Internal Revenue Service.
Home Bancorp will file a consolidated federal income tax return with Home Bank. Accordingly, it is anticipated that any cash distributions made by Home Bancorp to its shareholders would be treated as cash dividends and not as a non-taxable return of capital to shareholders for federal and state tax purposes.
Method of Accounting. For federal income tax purposes, we report income and expenses on the accrual method of accounting and file our federal income tax return on a fiscal year basis.
Bad Debt Reserves. The Small Business Job Protection Act of 1996 eliminated the use of the reserve method of accounting for bad debt reserves by savings institutions, effective for taxable years beginning after 1995. Prior to that time, Home Bank was permitted to establish a reserve for bad debts and to make additions to the reserve. These additions could, within specified formula limits, be deducted in arriving at taxable income. As a result of the Small Business Job Protection Act of 1996, savings associations must use the specific charge-off method in computing their bad debt deduction beginning with their 1996 federal tax return. In addition, federal legislation required the recapture over a six year period of the excess of tax bad debt reserves at December 31, 1995 over those established as of December 31, 1987.
Taxable Distributions and Recapture. Prior to the Small Business Job Protection Act of 1996, bad debt reserves created prior to January 1, 1988 were subject to recapture into taxable income if Home Bank failed to meet certain thrift asset and definitional tests. New federal legislation eliminated these savings association related recapture rules. However, under current law, pre-1988 reserves remain subject to recapture should Home Bank make certain non-dividend distributions or cease to maintain a bank charter.
10
Table of Contents
At December 31, 2009, the total federal pre-1988 reserve was approximately $1.2 million. The reserve reflects the cumulative effects of federal tax deductions by Home Bank for which no federal income tax provisions have been made.
Alternative Minimum Tax. The Internal Revenue Code imposes an alternative minimum tax at a rate of 20% on a base of regular taxable income plus certain tax preferences. The alternative minimum tax is payable to the extent such alternative minimum tax income is in excess of the regular income tax. Net operating losses, of which the Company has none, can offset no more than 90% of alternative minimum taxable income. Certain payments of alternative minimum tax may be used as credits against regular tax liabilities in future years. The Company has not been subject to the alternative minimum tax or any such amounts available as credits for carryover.
Net Operating Loss Carryovers. For net operating losses in tax years beginning before August 6, 1997, the Company may carry back net operating losses to the three years preceding the loss year and then forward to fifteen years following the loss years. For net operating losses in years beginning after August 5, 1997, net operating losses can be carried back to the two years preceding the loss year and forward to the 20 years following the loss year. At December 31, 2009, the Company had no net operating loss carry forwards for federal income tax purposes.
Corporate Dividends-Received Deduction. Home Bancorp may exclude from its income 100% of dividends received from Home Bank as a member of the same affiliated group of corporations. The corporate dividends received deduction is 80% in the case of dividends received from corporations which a corporate recipient owns less than 80%, but at least 20% of the distribution corporation. Corporations which own less than 20% of the stock of a corporation distributing a dividend may deduct only 70% of dividends received.
State and Local Taxation
State Taxation. Beginning in 2008, the Company is subject to the Louisiana Corporation Income Tax based on our Louisiana taxable income. The Corporation Income Tax applies at graduated rates from 4% upon the first $25,000 of Louisiana taxable income to 8% on all Louisiana taxable income in excess of $200,000. For these purposes, “Louisiana taxable income” means net income which is earned by us within or derived from sources within the State of Louisiana, after adjustments permitted under Louisiana law, including a federal income tax deduction. In addition, beginning in 2009, the Bank is subject to the Louisiana Shares Tax which is imposed on the assessed value of the Bank’s capital. The formula for deriving the assessed value is to apply the applicable rate to the sum of:
(a) 20% of our capitalized earnings, plus
(b) 80% of our taxable stockholders’ equity, minus
(c) 50% of our real and personal property assessment.
Various items may also be subtracted in calculating a company’s capitalized earnings.
11
Table of Contents
| Item 1A. | Risk Factors. |
In analyzing whether to make or to continue an investment in our securities, investors should consider, among other factors, the following risk factors.
Risks Related to Our Business
There are increased risks involved with commercial real estate, including multi-family residential, commercial and construction and land lending activities.
Our lending activities include loans secured by commercial real estate and commercial business loans. We have increased our emphasis on originating commercial real estate loans, including multi-family residential, and commercial business loans in recent years, and such loans have increased as a proportion of our loan portfolio from 32.6% in the aggregate at December 31, 2005 to an aggregate of 41.6% at December 31, 2009. Commercial real estate lending, multi-family residential lending and commercial business lending generally are considered to involve a higher degree of risk than single-family residential lending due to a variety of factors. As a result of the larger loan balances typically involved in these loans, an adverse development with respect to one loan or one credit relationship can expose us to greater risk of loss compared to an adverse development with respect to a one- to four-family residential mortgage loan. At December 31, 2009, the largest outstanding balances of commercial real estate loan and commercial business loan were $5.6 million and $3.1 million, respectively. While we have had relatively nominal charge-offs of commercial real estate loans and commercial business loans in recent years, if one of these large loans were to become non-performing, it could have a significant impact on our results of operations. In addition, our relatively recent emphasis on increasing our originations of commercial real estate and commercial business loans means that our portfolio of these loans is significantly weighted with loans which are not well seasoned and are generally perceived to be more susceptible to adverse economic conditions than older loans.
In addition to commercial real estate and commercial business loans, Home Bank holds a significant portfolio of construction and land loans. At December 31, 2009, Home Bank’s construction and land loans amounted to $35.4 million, or 10.5% of our loan portfolio. Construction and land loans generally have a higher risk of loss than single-family residential mortgage loans due primarily to the critical nature of the initial estimates of a property’s value upon completion of construction compared to the estimated costs, including interest, of construction as well as other assumptions. If the estimates upon which construction loans are made prove to be inaccurate, we may be confronted with projects that, upon completion, have values which are below the loan amounts. While we are not aware of any specific, material impediments impacting any of our builder/developer borrowers at this time, there continues to be nationwide reports of significant problems which have adversely affected many property developers and builders as well as the institutions that have provided them with loans. If any of the builder/developers to which we have extended construction and land loans experience the type of difficulties that are being reported, it could have adverse consequences upon our future results of operations.
Our allowance for loans losses may not be adequate to cover probable losses.
We have established an allowance for loan losses based upon various assumptions and judgments about the collectibility of our loan portfolio which we believe is adequate to offset probable losses on our existing loans. While we are not aware of any specific factors indicating a deficiency in the amount of our allowance for loan losses, in light of the current economic slowdown, the increased number of foreclosures and lower real estate values, one of the most pressing current issues faced by financial institutions is the adequacy of their allowance for loan losses. Federal bank regulators have increased their scrutiny of the level of the allowance for losses maintained by regulated institutions. Many banks and other lenders are reporting significantly higher provisions to their allowance for loan losses, which are materially impacting their earnings. In the event that we have to increase our allowance for loan losses beyond current levels, it would have an adverse effect on our results in future periods. At December 31, 2009, our allowance for loan losses amounted to $3.4 million, while our total loan portfolio was $336.6 million at such date.
12
Table of Contents
Other than temporary declines in the value of our investment securities may require us to take additional charges to earnings.
We evaluate our securities portfolio for other-than-temporary impairment throughout the year. Each investment that has a fair value less than book value is reviewed quarterly. An impairment charge is recorded against individual securities if management’s review concludes that the decline in value is other than temporary. During the years ended December 31, 2009 and 2008, the Company recorded charges of $1.9 million and $2.8 million, respectively, for the other-than-temporary impairment of certain non-agency mortgage-backed securities. As of December 31, 2009, our investment securities portfolio included 24 non-agency mortgage-backed securities with an aggregate amortized cost of $39.7 million, an aggregate fair value of $37.9 million and gross unrealized losses of $2.1 million at such date. The unrealized losses on such securities primarily relate to increasing levels of delinquencies and defaults in the mortgage loans underlying such securities. 11 of the 24 securities in this portfolio had been in a continuous loss position for over 12 months at December 31, 2009. Additional delinquencies and defaults in the mortgage loans underlying these securities may adversely affect the cash flows received by us and may result in a conclusion in future periods that the securities are other-than-temporarily impaired. Such a conclusion of other-than-temporary impairment would require us to take additional charges to earnings to write down the value of these securities.
We may not succeed in our plan to grow which could reduce future profitability.
We intend to grow our branch system by opening additional offices. We opened two new full-service banking offices in 2008 and an additional full-service banking office in Baton Rouge, Louisiana in March 2010. Typically, it takes several years for a new banking office to become profitable, and this could adversely affect our earnings in future periods. There also is a risk that, as we geographically expand our lending area, we may not be as successful in assessing the credit risks which are inherent in different markets.
In addition, we may seek to either acquire other financial institutions and/or branch offices. Our ability to successfully acquire other institutions depends on our ability to identify, acquire and integrate such institutions into our franchise. Our experience in mergers is limited to one acquisition in 2006 of a one branch building and loan association located in Crowley, Louisiana, approximately 20 miles west of Lafayette. If we were to acquire another institution in the future, our results of operations could be adversely affected if our analysis of the acquisition of such institution was not complete and correct or our integration efforts were not successful. Currently, we have no agreements or understandings with anyone regarding an acquisition.
Our business is geographically concentrated in south central Louisiana, which makes us vulnerable to downturns in the local economy.
Most of our loans are to individuals and businesses located generally in south central Louisiana. Regional economic conditions affect the demand for our products and services as well as the ability of our customers to repay loans. While economic conditions in south central Louisiana have been stronger than many areas of the U.S. in recent periods, the concentration of our business operations in south central Louisiana makes us vulnerable to downturns in the local economy. Declines in local real estate values could adversely affect the value of property used as collateral for the loans we make. Historically, the oil and gas industry has constituted a significant component of the local economy in south central Louisiana. The oil and gas industry remains an important factor in the local economy in the markets that Home Bank operates in and downturns in the local oil and gas industry could adversely affect Home Bank.
The current economic environment poses significant challenges and could adversely affect the Company’s financial condition and results of operations.
Although the economy in south central Louisiana continues to be relatively strong, particularly in comparison to many other areas of the country and the United States as a whole, there has been some recent softening of certain economic indicators in our markets. In addition, recessionary conditions in the broader economy could adversely
13
Table of Contents
affect the financial capacity of businesses and individuals in the Company’s market areas. In particular, adverse developments in the national or international markets in the oil and gas industries could have an adverse impact on economic conditions in the Company’s market areas. The impact of current economic conditions on the Company’s financial results could also include increased levels of nonperforming loans, provisions for loan losses, and expense associated with loan collection efforts. Additions to the allowance for loan losses will result in a decrease in net earnings and capital and could hinder the Company’s ability to grow.
The loss of our President and Chief Executive Officer could hurt our operations.
We rely heavily on our President and Chief Executive Officer, John W. Bordelon. Mr. Bordelon has served as President of the Bank for 16 years. The loss of Mr. Bordelon could have an adverse effect on us, as he is central to many aspects of our business operations and management.
Changes in interest rates could have a material adverse effect on our operations.
The operations of financial institutions are dependent to a large extent on net interest income, which is the difference between the interest income earned on interest-earning assets such as loans and investment securities and the interest expense paid on interest-bearing liabilities such as deposits and borrowings. Changes in the general level of interest rates can affect our net interest income by affecting the difference between the weighted average yield earned on our interest-earning assets and the weighted average rate paid on our interest-bearing liabilities, or interest rate spread, and the average life of our interest-earning assets and interest-bearing liabilities. If general market rates of interest increase, our interest expense on deposits and borrowings would likely increase which would adversely affect our interest rate spread and net interest income. Changes in interest rates also can affect our ability to originate loans; the value of our interest-earning assets and our ability to realize gains from the sale of such assets; our ability to obtain and retain deposits in competition with other available investment alternatives; and the ability of our borrowers to repay adjustable or variable rate loans. Changes in interest rates also affect the Bank’s net portfolio value. Net portfolio value is the discounted present value of expected cash flows from assets, liabilities and off-balance sheet contracts. Interest rates are highly sensitive to many factors, including governmental monetary policies, domestic and international economic and political conditions and other factors beyond our control.
We are subject to extensive regulation which could adversely affect our business and operations.
We are subject to extensive federal governmental supervision and regulation, which are intended primarily for the protection of depositors. In addition, we are subject to changes in federal and state laws, as well as changes in regulations, governmental policies and accounting principles. The effects of any such potential changes cannot be predicted but could adversely affect the business and our operations in the future.
We face strong competition which may adversely affect our profitability.
We are subject to vigorous competition in all aspects and areas of our business from banks and other financial institutions, including savings and loan associations, savings banks, finance companies, credit unions and other providers of financial services, such as money market mutual funds, brokerage firms, consumer finance companies and insurance companies. We are significantly smaller than the larger depository institutions operating in our market areas. The financial resources of these larger competitors may permit them to pay higher interest rates on their deposits and to be more aggressive in new loan originations. We also compete with non-financial institutions, including retail stores that maintain their own credit programs and governmental agencies that make available low cost or guaranteed loans to certain borrowers. Some of our competitors are larger financial institutions with substantially greater resources, more advanced technological capabilities, lending limits, larger branch systems and a wider array of commercial banking services. Vigorous competition from both bank and non-bank organizations is expected to continue.
14
Table of Contents
Any future Federal Deposit Insurance Corporation insurance premiums or special assessments will adversely impact our earnings.
On May 22, 2009, the Federal Deposit Insurance Corporation adopted a final rule levying a five basis point special assessment on each insured depository institution’s assets minus Tier 1 capital as of June 30, 2009. We recorded an expense of $200,000 during the year ended December 31, 2009, to reflect the special assessment. Any further special assessments that the Federal Deposit Insurance Corporation levies will be recorded as an expense during the appropriate period. In addition, the Federal Deposit Insurance Corporation increased the general assessment rate and, therefore, our Federal Deposit Insurance Corporation general insurance premium expense will increase compared to prior periods.
On November 12, 2009, the FDIC adopted regulations that require insured depository institutions to prepay on December 30, 2009 their estimated assessments for the fourth calendar quarter of 2009, and for all of 2010, 2011 and 2012. The new regulations base the assessment rate for the fourth calendar quarter of 2009 and for 2010 on each institution’s total base assessment rate for the third quarter of 2009, modified to assume that the assessment rate in effect on September 30, 2009 had been in effect for the entire third quarter, and the assessment rate for 2011 and 2012 on the modified third quarter assessment base, adjusted quarterly for an estimated 5% annual growth rate in the assessment base through the end of 2012. Under the prepaid assessment rule, we made a payment of $1.2 million to the Federal Deposit Insurance Corporation on December 30, 2009, and recorded the payment as a prepaid expense, which will be amortized to expense over three years.
Proposed regulatory reform may have a material impact on our operations.
The Obama Administration has published a comprehensive regulatory reform plan that is intended to modernize and protect the integrity of the United States financial system and has offered proposed legislation to accomplish these reforms. The President’s plan contains several elements that would have a direct effect on the Company and the Bank. Under the proposed legislation, the federal thrift charter and the Office of Thrift Supervision would be eliminated and all companies that control an insured depository institution, such as the Company and the Mutual Holding Company, will be required to register as bank holding companies. An existing federal thrift, such as Malvern Federal Savings, would become a national bank or could choose to adopt a state charter. Registration as a bank holding company would represent a significant change, as there currently exist significant differences between savings and loan holding company and bank holding company supervision and regulation. For example, the Federal Reserve imposes leverage and risk-based capital requirements on bank holding companies whereas the Office of Thrift Supervision does not impose any capital requirements on savings and loan holding companies. The Administration has also proposed the creation of a new federal agency, the Consumer Financial Protection Agency, that would be dedicated to protecting consumers in the financial products and services market. The creation of this agency could result in new regulatory requirements and raise the cost of regulatory compliance. In addition, legislation stemming from the reform plan could require changes in regulatory capital requirements, loan loss provisioning practices, and compensation practices. If implemented, the foregoing regulatory reforms may have a material impact on our operations. However, because the final legislation may differ significantly from the reform plan proposed by the President, we cannot determine the specific impact of any regulatory reform at this time.
| Item 1B. | Unresolved Staff Comments. |
Not applicable.
15
Table of Contents
| Item 2. | Properties. |
We currently conduct business from our main office, eleven additional full-service banking offices, and one loan production office. The following table sets forth the net book value of the land, building and leasehold improvements and certain other information with respect to our offices at December 31, 2009.
| Description/Address |
Leased/ Owned |
Date of Lease Expiration |
Net Book Value of Property |
Amount of Deposits | ||||||
| (In Thousands) | ||||||||||
| Main Office: |
||||||||||
| 503 Kaliste Saloom Road, Lafayette, LA |
Owned | N/A | $ | 5,055 | $ | 166,536 | ||||
| Branches: |
||||||||||
| 1020 Coolidge Boulevard., Lafayette, LA |
Owned | N/A | 191 | 40,265 | ||||||
| 5543 Cameron Street, Scott, LA |
Owned | N/A | 696 | 16,454 | ||||||
| 4202 Johnston Street, Lafayette, LA |
Owned | N/A | 644 | 31,966 | ||||||
| 523 Jefferson Street, Lafayette, LA |
Owned | N/A | 347 | 31,850 | ||||||
| 5028 Ambassador Caffery Parkway, Lafayette, LA |
Owned | N/A | 680 | 11,962 | ||||||
| 1219 Albertson Parkway, Broussard, LA |
Owned | N/A | 878 | 15,337 | ||||||
| 806 Veterans Boulevard, Carencro, LA |
Owned | N/A | 682 | 22,388 | ||||||
| 204 N. Parkerson Boulevard, Crowley, LA |
Owned | N/A | 734 | 25,891 | ||||||
| 10563 Glenstone Place, Baton Rouge, LA |
Owned | N/A | 3,179 | 5,288 | ||||||
| 16969 Jefferson Highway, Baton Rouge, LA |
Owned | N/A | 1,113 | 3,656 | ||||||
| 5302 Corporate Boulevard, Baton Rouge, LA |
Owned | N/A | 1,960 | — | ||||||
| (under construction at December 31, 2009) |
||||||||||
| Loan Production Office: |
||||||||||
| 9035 Bluebonnet Boulevard, Baton Rouge, LA |
Leased | 3/31/2010 | 28 | — | ||||||
| Total |
$ | 16,187 | $ | 371,593 | ||||||
| Item 3. | Legal Proceedings. |
We are not presently involved in any legal proceedings of a material nature. Home Bank has been named as a defendant or co-defendant in 12 lawsuits, commencing in early 2007, alleging that the claimants incurred losses during 2006 as a result of the Bank accepting deposits with forged endorsements from a former customer. The Bank notified its insurance carrier of the potential claims and expensed the $100,000 insurance claim deductible in 2006. The Bank does not expect to incur any material expense as a result of the lawsuits filed. From time to time, we are a party to legal proceedings incidental to our business to enforce our security interest in collateral pledged to secure loans made by the Bank.
| Item 4. | Reserved. |
Not applicable.
16
Table of Contents
| Item 5. | Market for the Registrant’s Common Equity, Related Stockholder Matters and Issuer Purchases of Equity Securities. |
(a) Home Bancorp, Inc.’s common stock is listed on the Nasdaq Global Market under the symbol “HBCP”. The common stock commenced trading on the Nasdaq Stock Market on October 3, 2008. As of the close of business on December 31, 2009, there were 8,774,975 shares of common stock outstanding, held by approximately 1,000 stockholders of record, not including the number of persons or entities whose stock is held in nominee or “street” name through various brokerage firms and banks.
The following table sets forth the high and low prices of the Company’s common stock as reported by the Nasdaq Stock Market and cash dividends declared per share for the periods indicated.
| For The Quarter Ended |
High | Low | Cash Dividends Declared | ||||||
| December 31, 2008 |
$ | 11.00 | $ | 9.50 | $ | — | |||
| March 31, 2009 |
$ | 10.00 | $ | 9.00 | $ | — | |||
| June 30, 2009 |
$ | 12.56 | $ | 9.71 | $ | — | |||
| September 30, 2009 |
$ | 12.65 | $ | 11.80 | $ | — | |||
| December 31, 2009 |
$ | 12.50 | $ | 11.91 | $ | — | |||
The following graph demonstrates comparison of the cumulative total returns for the common stock of Home Bancorp, the NASDAQ Composite Index and the SNL Securities Bank and Thrift Index for the periods indicated. The graph assumes that an investor originally purchased shares on October 3, 2008, the first day that our shares were traded. The graph below represents $100 invested in our common stock at its closing price on October 3, 2008.
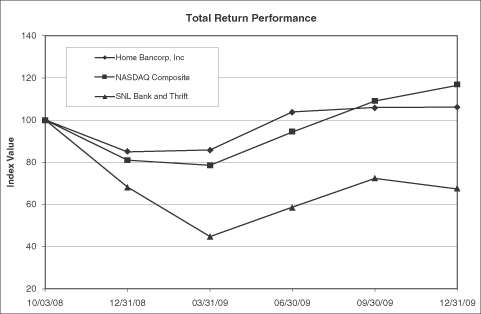
| Period Ending | ||||||||||||
| Index |
10/03/08 | 12/31/08 | 3/31/09 | 6/30/09 | 9/30/09 | 12/31/09 | ||||||
| Home Bancorp, Inc. |
100.00 | 84.86 | 85.73 | 103.92 | 105.92 | 106.09 | ||||||
| NASDAQ Composite |
100.00 | 80.98 | 78.49 | 94.23 | 108.99 | 116.52 | ||||||
| SNL Bank and Thrift |
100.00 | 68.16 | 44.67 | 58.59 | 72.28 | 67.25 | ||||||
17
Table of Contents
The stock price information shown above is not necessarily indicative of future price performance. Information used was obtained from SNL Financial LC, Charlottesville, Virginia. The Company assumes no responsibility for any errors or omissions in such information.
The Company did not sell any of its equity securities during 2009 that were not registered under the Securities Act of 1933.
For information regarding the Company’s equity compensation plans, see Item 12.
(b) Not applicable.
(c) The Company’s purchases of its common stock made during the quarter consisted of stock repurchases under the Company’s approved plan and purchases to fund the 2009 Recognition and Retention Plan and Trust, which is an affiliate of the Company.
| Period |
Total Number of Shares Purchased |
Average Price Paid per Share |
Total Number of Shares Purchased as Part of Publicly Announced Plans or Programs |
Maximum Number of Shares that May Yet be Purchased Under the Plan or Programs(1) (2) | |||||
| October 1—October 31, 2009 |
12,975 | $ | 12.42 | 357,075 | 446,344 | ||||
| November 1—November 30, 2009 |
142,300 | 12.16 | 499,375 | 304,044 | |||||
| December 1—December 31, 2009 |
9,600 | 12.28 | 508,975 | 294,444 | |||||
| Total |
164,875 | $ | 12.19 | 508,975 | 294,444 | ||||
| (1) | On May 12, 2009, shareholders of the Company approved the 2009 Recognition and Retention Plan and Trust Agreement (“2009 RRP”) authorizing the purchase of up to 357,075 shares of the Company’s common stock. Purchases of an aggregate of 12,975 shares of common stock were made to fund the 2009 RRP in October 2009 when the 2009 RRP was fully funded. |
| (2) | On October 26, 2009, the Company’s Board of Directors approved a share repurchase program. Under the plan, the Company can repurchase up to 446,344 shares, or 5% of its common stock outstanding, through open market or privately negotiated transactions. The repurchase program does not have an expiration date. |
| Item 6. | Selected Financial Data. |
Set forth below is selected summary historical financial and other data of the Company. When you read this summary historical financial data, it is important that you also read the historical financial statements and related notes contained in Item 8 of this Form 10-K, as well as “Management’s Discussion and Analysis of Financial Condition and Results of Operations.”
| At December 31, | |||||||||||||||
| (dollars in thousands) |
2009 | 2008 | 2007 | 2006 | 2005 | ||||||||||
| Selected Financial Condition Data: |
|||||||||||||||
| Total assets |
$ | 524,636 | $ | 528,397 | $ | 422,351 | $ | 400,484 | $ | 370,413 | |||||
| Cash and cash equivalents |
25,710 | 20,150 | 11,746 | 27,399 | 16,213 | ||||||||||
| Interest-bearing deposits in banks |
3,529 | 1,685 | 3,267 | 3,169 | 4,060 | ||||||||||
| Cash invested at other ATM locations |
— | 24,244 | 17,143 | 13,714 | 14,526 | ||||||||||
| Investment securities: |
|||||||||||||||
| Available for sale |
106,752 | 114,235 | 56,995 | 53,800 | 68,457 | ||||||||||
| Held to maturity |
13,099 | 4,089 | 4,693 | 5,541 | 6,621 | ||||||||||
| Loans receivable, net |
333,296 | 332,962 | 306,268 | 281,258 | 246,225 | ||||||||||
| Deposits |
371,593 | 354,145 | 353,536 | 346,250 | 308,396 | ||||||||||
| FHLB advances |
16,774 | 44,421 | 16,883 | 5,435 | 17,484 | ||||||||||
| Shareholders’ equity |
132,749 | 126,963 | 49,383 | 45,856 | 41,487 | ||||||||||
18
Table of Contents
| For the Years Ended December 31, | |||||||||||||||
| (dollars in thousands, except per share data) |
2009 | 2008 | 2007 | 2006 | 2005 | ||||||||||
| Selected Operating Data: |
|||||||||||||||
| Interest income |
$ | 29,897 | $ | 27,429 | $ | 25,425 | $ | 23,200 | $ | 19,652 | |||||
| Interest expense |
6,337 | 8,747 | 9,908 | 8,215 | 6,340 | ||||||||||
| Net interest income |
23,560 | 18,682 | 15,517 | 14,985 | 13,312 | ||||||||||
| Provision for loan losses |
865 | 459 | 420 | 260 | 252 | ||||||||||
| Net interest income after provision for |
22,695 | 18,223 | 15,097 | 14,725 | 13,060 | ||||||||||
| Noninterest income |
2,102 | 398 | 2,516 | 1,906 | 2,261 | ||||||||||
| Noninterest expense |
17,808 | 14,735 | 12,903 | 10,535 | 9,990 | ||||||||||
| Income before income taxes |
6,989 | 3,886 | 4,710 | 6,096 | 5,331 | ||||||||||
| Income taxes |
2,309 | 1,170 | 1,387 | 2,073 | 1,808 | ||||||||||
| Net income |
$ | 4,680 | $ | 2,716 | $ | 3,323 | $ | 4,023 | $ | 3,523 | |||||
| Earnings per share—basic |
0.58 | 1.32 | N/A | N/A | N/A | ||||||||||
| Earnings per share—diluted |
0.58 | 1.32 | N/A | N/A | N/A | ||||||||||
| At or For the Years Ended December 31, | |||||||||||||||
| 2009 | 2008 | 2007 | 2006 | 2005 | |||||||||||
| Selected Operating Ratios: (1) |
|||||||||||||||
| Average yield on interest-earnings assets |
5.99 | % | 6.35 | % | 6.73 | % | 6.31 | % | 5.83 | % | |||||
| Average rate on interest-bearing liabilities |
1.93 | 2.69 | 3.30 | 2.80 | 2.26 | ||||||||||
| Average interest rate spread (2) |
4.06 | 3.66 | 3.43 | 3.51 | 3.57 | ||||||||||
| Net interest margin (3) |
4.72 | 4.31 | 4.09 | 4.08 | 3.94 | ||||||||||
| Average interest-earning assets to average interest-bearing liabilities |
152.02 | 133.63 | 126.29 | 125.23 | 120.33 | ||||||||||
| Noninterest expense to average assets |
3.36 | 3.18 | 3.19 | 2.83 | 2.78 | ||||||||||
| Efficiency ratio (4) |
69.39 | 77.23 | 71.55 | 63.46 | 64.16 | ||||||||||
| Return on average assets |
0.88 | 0.59 | 0.82 | 1.03 | 0.98 | ||||||||||
| Return on average equity |
3.58 | 4.12 | 6.90 | 9.18 | 8.80 | ||||||||||
| Average equity to average assets |
24.68 | 14.20 | 11.90 | 11.25 | 11.14 | ||||||||||
| Asset Quality Ratios: (5) |
|||||||||||||||
| Non-performing loans as a percent of total loans |
0.38 | % | 0.43 | % | 0.42 | % | 0.33 | % | 0.34 | % | |||||
| Non-performing assets as a percent of total assets (6) |
0.32 | 0.28 | 0.32 | 0.24 | 0.21 | ||||||||||
| Allowance for loan losses to as a percent of non-performing loans at end of period |
262.2 | 182.6 | 178.7 | 213.2 | 216.3 | ||||||||||
| Allowance for loan losses as a percent of net loans at end of period |
1.00 | 0.78 | 0.76 | 0.71 | 0.74 | ||||||||||
| Capital Ratios: (5) (7) |
|||||||||||||||
| Tangible capital ratio |
20.24 | % | 19.10 | % | 11.68 | % | 11.48 | % | 11.31 | % | |||||
| Core capital ratio |
20.24 | 19.10 | 11.68 | 11.48 | 11.31 | ||||||||||
| Total risk-based capital ratio |
30.74 | 33.35 | 19.36 | 19.05 | 20.32 | ||||||||||
| (1) | With the exception of end-of-period ratios, all ratios are based on average monthly balances during the respective periods. |
| (2) | Average interest rate spread represents the difference between the average yield on interest-earning assets and the average rate paid on interest-bearing liabilities. |
| (3) | Net interest margin represents net interest income as a percentage of average interest-earning assets. |
| (4) | The efficiency ratio represents noninterest expense as a percentage of total revenues. Total revenues is the sum of net interest income and noninterest income. |
| (5) | Asset quality and capital ratios are end of period ratios. |
| (6) | Nonperforming loans consist of nonaccruing loans and loans 90 days or more past due. Nonperforming assets consist of nonperforming loans and repossessed assets. It is our policy to cease accruing interest on all loans 90 days or more past due. Repossessed assets consist of assets acquired through foreclosure or acceptance of title in-lieu of foreclosure. |
| (7) | Capital ratios are for Home Bank only. |
19
Table of Contents
| Item 7. | Management’s Discussion and Analysis of Financial Condition and Results of Operations. |
MANAGEMENT’S DISCUSSION AND ANALYSIS OF FINANCIAL CONDITION AND RESULTS OF OPERATIONS
The purpose of this discussion and analysis is to focus on significant changes and events in the financial condition and results of operations of Home Bancorp and its subsidiary, Home Bank. Home Bancorp, Inc. was newly organized and owned no assets during any period prior to October 2, 2008. Therefore, the financial information for any period prior to October 2, 2008 presented in this report is that of Home Bank only. This discussion and analysis is intended to highlight and supplement data and information presented elsewhere in this report, including the consolidated financial statements and related notes.
EXECUTIVE OVERVIEW
The Company completed its initial public stock offering (“IPO”) on October 2, 2008, and began trading on the Nasdaq Global Market on October 3, 2008. The Company issued 8,926,875 shares of its common stock in the IPO for an aggregate of $89,268,750 in total offering proceeds.
Net income for 2009 totaled $4.7 million, an increase of 72.3% from the $2.7 million earned in 2008. Diluted earnings per share were $0.58 and $1.32 for 2009 and 2008, respectively. Since the Company completed its IPO in the fourth quarter of 2008, the denominator used in the earnings per share calculations for 2008 is lower than it would have been had the shares been outstanding for a full year. Key components of the Company’s performance in 2009 are summarized below.
| • | Total assets at December 31, 2009 were $524.6 million, down $3.8 million, or 0.7%, from December 31, 2008. Increases in investment securities, loans and bank-owned life insurance were offset by a decrease in cash invested at other ATM locations. |
| • | Net loans at December 31, 2009 were $333.3 million, an increase of $333,000, or 0.1%, from December 31, 2008. The Company’s loan mix continued to change as commercial loans increased, while one- to four-family mortgage loan balances decreased. Commercial loans (including commercial real estate, construction and land, multi-family residential, and other commercial loans) increased by an aggregate of $14.2 million, or 8.8%, during 2009. One- to four-family mortgage loans decreased by $18.1 million, or 13.1%, during 2009. |
| • | The Company did not have any cash invested at other ATM locations at December 31, 2009, a $24.2 million decrease from December 31, 2008. The Company decided not to renew contracts with counterparties to invest cash at other ATM locations. |
| • | Cash surrender value of bank-owned life insurance was $15.3 million at December 31, 2009, a $10.0 million, or 189.7%, increase from December 31, 2008. The Company purchased $9.7 million of bank-owned life insurance policies in December 2009. |
| • | Total customer deposits were $371.6 million at December 31, 2009, an increase of $17.4 million, or 4.9%, from December 31, 2008. Core deposits (e.g., demand deposit, money market and savings accounts) experienced strong growth in 2009, increasing $19.3 million, or 9.8%. |
| • | Shareholders’ equity increased $5.8 million, or 4.6%, from $127.0 million at December 31, 2008 to $132.7 million at December 31, 2009. During 2009, the Company’s shareholders approved the 2009 Recognition and Retention Plan, which resulted in the purchase of 357,075 shares of the Company’s common stock in order to fund such plan, and the Company’s Board of Directors approved the repurchase of 446,344 shares, or 5% of the Company’s common stock issued. |
| • | Interest income increased $2.5 million, or 9.0%, in 2009 compared to 2008. The increase was primarily due to increases in the average balances of interest-earnings assets, particularly loans and investment securities, which more than offset decreases in the average yields earned on interest-earning assets. |
20
Table of Contents
| • | Interest expense decreased $2.4 million, or 27.6%, in 2009 compared to 2008. The average rate paid on interest-bearing liabilities decreased 76 basis points in 2009 compared to 2008 due to lower market rates and an increase in lower-cost core deposits. |
| • | The provision for loan losses totaled $865,000 in 2009, an increase of $406,000, or 88.3%, compared to 2008. The Company increased its ratio of allowance for loan losses to total loans due to, among other factors, consideration of the unemployment rate in the Company’s markets and general economic conditions. As of December 31, 2009, the allowance for loan losses as a percentage of total loans was 1.00%, compared to 0.78% at December 31, 2008. Net charge-offs for 2009 were $119,000, or 0.04%, of average loans, compared to $167,000, or 0.05%, in 2008. |
| • | Noninterest income increased $1.7 million, or 427.9%, in 2009 compared to 2008. The Company experienced increased gains on the sale of mortgage loans and higher levels of bank card fees and service fees and charges on deposit accounts. Additionally, the Company incurred a charge of $1.9 million in 2009 for the other-than-temporary impairment (“OTTI”) of investment securities compared to a $2.8 million OTTI charge in 2008. |
| • | Noninterest expense increased $3.1 million, or 20.9%, in 2009 compared to 2008. Noninterest expense levels have increased over the past year due primarily to increased compensation and benefits expense resulting from our Baton Rouge expansion, where two full-service banking offices were opened during the second half of 2008, as well as expense related to the employee stock ownership plan (“ESOP”) and the stock option and recognition and retention plans. Additionally, noninterest expense for 2009 includes the Federal Depository Insurance Corporation’s (“FDIC”) special assessment of $200,000 recorded in the second quarter. |
CRITICAL ACCOUNTING POLICIES
The accounting and financial reporting policies of the Company conform to accounting principles generally accepted in the United States of America and to general practices within the banking industry. Accordingly, the financial statements require certain estimates, judgments, and assumptions, which are believed to be reasonable, based upon the information available. These estimates and assumptions affect the reported amounts of assets and liabilities at the date of the financial statements and the reported amounts of income and expenses during the periods presented. The following accounting policies comprise those that management believes are the most critical to aid in fully understanding and evaluating our reported financial results. These policies require numerous estimates or economic assumptions that may prove inaccurate or may be subject to variations which may significantly affect our reported results and financial condition for the period or in future periods.
Allowance for Loan Losses. The allowance for loan losses is established through a provision for loan losses charged to expense. Loans are charged against the allowance for loan losses when management believes that the collectibility of the principal is unlikely. Subsequent recoveries are added to the allowance. The allowance is an amount that represents the amount of probable and reasonably estimable known and inherent losses in the loan portfolio, based on evaluations of the collectability of loans. The evaluations take into consideration such factors as changes in the types and amount of loans in the loan portfolio, historical loss experience, adverse situations that may affect the borrower’s ability to repay, estimated value of any underlying collateral, estimated losses relating to specifically identified loans, and current economic conditions. This evaluation is inherently subjective as it requires material estimates including, among others, exposure at default, the amount and timing of expected future cash flows on impacted loans, value of collateral, estimated losses on our commercial and residential loan portfolios as well as consideration of general loss experience. All of these estimates may be susceptible to significant change.
While management uses the best information available to make loan loss allowance evaluations, adjustments to the allowance may be necessary based on changes in economic and other conditions or changes in accounting guidance. The Office of Thrift Supervision (“OTS”), as an integral part of its examination processes, periodically reviews our allowance for loan losses. The OTS may require the recognition of adjustments to the allowance for loan losses based on their judgment of information available to them at the time of their examinations. To the
21
Table of Contents
extent that actual outcomes differ from management’s estimates, additional provisions to the allowance for loan losses may be required that would adversely impact earnings in future periods.
Income Taxes. We make estimates and judgments to calculate some of our tax liabilities and determine the recoverability of some of our deferred tax assets, which arise from temporary differences between the tax and financial statement recognition of revenues and expenses. We also estimate a valuation allowance for deferred tax assets if, based on the available evidence, it is more likely than not that some portion or all of the recorded deferred tax assets will not be realized in future periods. These estimates and judgments are inherently subjective. Historically, our estimates and judgments to calculate our deferred tax accounts have not required significant revision to our initial estimates.
In evaluating our ability to recover deferred tax assets, we consider all available positive and negative evidence, including our past operating results, recent cumulative losses and our forecast of future taxable income. In determining future taxable income, we make assumptions for the amount of taxable income, the reversal of temporary differences and the implementation of feasible and prudent tax planning strategies. These assumptions require us to make judgments about our future taxable income and are consistent with the plans and estimates we use to manage our business. Any reduction in estimated future taxable income may require us to record a valuation allowance against our deferred tax assets. An increase in the valuation allowance would result in additional income tax expense in the period and could have a significant impact on our future earnings.
Other-than-temporary Impairment of Investment Securities. Securities are evaluated periodically to determine whether a decline in their value is other-than-temporary. The term “other-than-temporary” is not intended to indicate a permanent decline in value. Rather, it means that the prospects for near term recovery of value are not necessarily favorable, or that there is a lack of evidence to support fair values equal to, or greater than, the carrying value of the investment. Management reviews criteria such as the magnitude and duration of the decline, the reasons for the decline, and the performance and valuation of the underlying collateral, when applicable, to predict whether the loss in value is other-than-temporary. Once a decline in value is determined to be other-than-temporary, the carrying value of the security is reduced to its fair value and a corresponding charge to earnings is recognized.
Stock-based Compensation. The Company accounts for its stock options in accordance with Accounting Standards Codification (“ASC”) topic on stock-based compensation. The ASC requires companies to expense the fair value of employee stock options and other forms of stock-based compensation. Management utilizes the Black-Scholes option valuation model to estimate the fair value of stock options. The option valuation model requires the input of highly subjective assumptions, including expected stock price volatility and option life. These subjective input assumptions materially affect the fair value estimate.
FINANCIAL CONDITION
Loans, Loan Quality and Allowance for Loan Losses
Loans – The types of loans originated by the Company are subject to federal and state law and regulations. Interest rates charged on loans are affected principally by the demand for such loans and the supply of money available for lending purposes and the rates offered by our competitors. These factors are, in turn, affected by general and economic conditions, the monetary policy of the federal government, including the Federal Reserve Board, legislative tax policies and governmental budgetary matters.
The Company’s lending activities are subject to underwriting standards and loan origination procedures established by our board of directors and management. Loan originations are obtained through a variety of sources, primarily existing customers as well as new customers obtained from referrals and local advertising and promotional efforts. Single-family residential mortgage loan applications and consumer loan applications are taken at any of the Bank’s branch offices. Applications for other loans typically are taken personally by one of our loan officers, although they may be received by a branch office initially and then referred to a loan officer. All loan applications are processed and underwritten centrally at the Bank’s main office.
22
Table of Contents
The following table shows the composition of the Company’s loan portfolio as of the dates indicated.
| December 31, | |||||||||||||||
| (dollars in thousands) |
2009 | 2008 | 2007 | 2006 | 2005 | ||||||||||
| Real estate loans: |
|||||||||||||||
| One- to four-family first mortgage |
$ | 120,044 | $ | 138,173 | $ | 134,264 | $ | 119,369 | $ | 112,468 | |||||
| Home equity loans and lines |
24,678 | 23,127 | 23,065 | 19,604 | 18,672 | ||||||||||
| Commercial real estate |
97,513 | 84,096 | 71,964 | 66,125 | 53,321 | ||||||||||
| Construction and land |
35,364 | 35,399 | 25,769 | 32,390 | 24,532 | ||||||||||
| Multi-family residential |
4,089 | 7,142 | 7,242 | 7,694 | 8,157 | ||||||||||
| Total real estate loans |
281,688 | 287,937 | 262,304 | 245,182 | 217,150 | ||||||||||
| Other loans: |
|||||||||||||||
| Commercial |
38,340 | 34,434 | 32,968 | 25,885 | 19,508 | ||||||||||
| Consumer |
16,619 | 13,197 | 13,310 | 12,199 | 11,388 | ||||||||||
| Total other loans |
54,959 | 47,631 | 46,278 | 38,084 | 30,896 | ||||||||||
| Total loans |
$ | 336,647 | $ | 335,568 | $ | 308,582 | $ | 283,266 | $ | 248,046 | |||||
The loan portfolio increased $1.1 million, or 0.3%, during 2009. Commercial real estate loan growth during 2009 was primarily driven by loans on owner-occupied office buildings in the Bank’s market areas. Non-real-estate commercial loan growth in 2009 relates primarily to equipment and accounts receivable financing provided to businesses in the Bank’s market areas. Consumer loan growth in 2009 relates primarily to mobile home loans, which increased $3.5 million, or 111.3%, during 2009. One- to four-family first mortgage loans paid down during the year as customers took advantage of attractive refinance rates. The Company sells the majority of its newly originated one- to four-family conforming mortgage loan originations in the secondary market and recognizes the associated fee income rather than assume the interest rate risk associated with these longer term assets.
The following table reflects contractual loan maturities as of December 31, 2009, unadjusted for scheduled principal reductions, prepayments or repricing opportunities. Of the $259.6 million of our loans which have contractual maturity dates subsequent to December 31, 2010, $217.1 million have fixed interest rates and $42.5 million have floating or adjustable interest rates.
| Due In | ||||||||||||
| (dollars in thousands) |
One year or less |
One through five years |
More than five years |
Total | ||||||||
| One- to four-family first mortgage |
$ | 9,087 | $ | 14,481 | $ | 96,476 | $ | 120,044 | ||||
| Home equity loans and lines |
3,248 | 15,340 | 6,090 | 24,678 | ||||||||
| Commercial real estate |
15,799 | 66,830 | 14,884 | 97,513 | ||||||||
| Construction and land |
30,727 | 4,027 | 610 | 35,364 | ||||||||
| Multi-family residential |
— | 4,089 | — | 4,089 | ||||||||
| Commercial |
14,240 | 21,008 | 3,092 | 38,340 | ||||||||
| Consumer |
3,914 | 5,887 | 6,818 | 16,619 | ||||||||
| Total |
$ | 77,015 | $ | 131,662 | $ | 127,970 | $ | 336,647 | ||||
Loan Quality – One of management’s key objectives has been, and continues to be, maintaining a high level of asset quality. In addition to maintaining credit standards for new loan originations, we proactively monitor loans and collection and workout processes of delinquent or problem loans. When a borrower fails to make a scheduled payment, we attempt to cure the deficiency by making personal contact with the borrower. Initial contacts are generally made within 10 days after the date the payment is due. In most cases, deficiencies are promptly
23
Table of Contents
resolved. If the delinquency continues, late charges are assessed and additional efforts are made to collect the deficiency. All loans which are designated as “special mention,” classified or which are delinquent 90 days or more are reported to the Board of Directors of the Bank monthly. For loans where the collection of principal or interest payments is doubtful, the accrual of interest income ceases. It is our policy, with certain limited exceptions, to discontinue accruing interest and reverse any interest accrued on any loan which is 90 days or more past due. On occasion, this action may be taken earlier if the financial condition of the borrower raises significant concern with regard to his/her ability to service the debt in accordance with the terms of the loan agreement. Interest income is not accrued on these loans until the borrower’s financial condition and payment record demonstrate an ability to service the debt.
Real estate which is acquired as a result of foreclosure is classified as real estate owned until sold. Real estate owned is recorded at the lower of cost or fair value less estimated selling costs. Costs associated with acquiring and improving a foreclosed property are usually capitalized to the extent that the carrying value does not exceed fair value less estimated selling costs. Holding costs are charged to expense. Gains and losses on the sale of real estate owned are charged to operations, as incurred.
An impaired loan generally is one for which it is probable, based on current information, that the lender will not collect all the amounts due under the contractual terms of the loan. Large groups of smaller balance, homogeneous loans are collectively evaluated for impairment. Loans collectively evaluated for impairment include smaller balance commercial real estate loans, residential real estate loans and consumer loans. These loans are evaluated as a group because they have similar characteristics and performance experience. Larger commercial real estate, multi-family residential, construction and land loans and commercial business loans are individually evaluated for impairment. As of December 31, 2009 and December 31, 2008, impaired loans amounted to $2.8 million and $1.8 million, respectively. The amount of the allowance for loan losses allocated to impaired loans totaled $472,000 and $122,000 as of December 31, 2009 and December 31, 2008, respectively.
Federal regulations and our policies require that we utilize an internal asset classification system as a means of reporting problem and potential problem assets. We have incorporated an internal asset classification system, substantially consistent with Federal banking regulations, as a part of our credit monitoring system. Federal banking regulations set forth a classification scheme for problem and potential problem assets as “substandard,” “doubtful” or “loss” assets. An asset is considered “substandard” if it is inadequately protected by the current net worth and paying capacity of the obligor or of the collateral pledged, if any. “Substandard” assets include those characterized by the “distinct possibility” that the insured institution will sustain “some loss” if the deficiencies are not corrected. Assets classified as “doubtful” have all of the weaknesses inherent in those classified “substandard” with the added characteristic that the weaknesses present make “collection or liquidation in full,” on the basis of currently existing facts, conditions, and values, “highly questionable and improbable.” Assets classified as “loss” are those considered “uncollectible” and of such little value that their continuance as assets without the establishment of a specific loss reserve is not warranted.
A savings institution’s determination as to the classification of its assets and the amount of its valuation allowances is subject to review by Federal bank regulators which can order the establishment of additional general or specific loss allowances. The Federal banking agencies have adopted an interagency policy statement on the allowance for loan and lease losses. The policy statement provides guidance for financial institutions on both the responsibilities of management for the assessment and establishment of allowances and guidance for banking agency examiners to use in determining the adequacy of general valuation guidelines. Generally, the policy statement recommends that institutions have effective systems and controls to identify, monitor and address asset quality problems; that management analyze all significant factors that affect the collectability of the portfolio in a reasonable manner; and that management establish acceptable allowance evaluation processes that meet the objectives set forth in the policy statement. Our management believes that, based on information currently available, our allowance for loan losses is maintained at a level which covers all known and inherent losses that are both probable and reasonably estimable at each reporting date. However, actual losses are dependent upon future events and, as such, further additions to the level of allowances for loan losses may become necessary.
24
Table of Contents
We review and classify assets monthly. The Board of Directors is provided with monthly reports on our classified assets. We classify assets in accordance with the management guidelines described above. As of December 31, 2009, the Company had $2.8 million in assets classified as substandard, compared to $1.7 million as of December 31, 2008.
Nonperforming assets, defined as nonaccrual loans, accruing loans past due 90 days or more and foreclosed property, amounted to $1.7 million, or 0.3% of total assets at December 31, 2009, compared to $1.5 million, or 0.3% of total assets at December 31, 2008. The following table sets forth the composition of the Company’s nonperforming assets as of the dates indicated.
| December 31, | ||||||||||||||||||||
| (dollars in thousands) |
2009 | 2008 | 2007 | 2006 | 2005 | |||||||||||||||
| Nonaccrual loans: |
||||||||||||||||||||
| Real estate loans: |
||||||||||||||||||||
| One- to four-family first mortgage |
$ | 864 | $ | 871 | $ | 775 | $ | 238 | $ | 541 | ||||||||||
| Home equity loans and lines |
362 | 156 | 12 | — | 16 | |||||||||||||||
| Commercial real estate and multi-family |
— | 362 | 318 | 476 | 43 | |||||||||||||||
| Construction and land |
— | — | — | — | — | |||||||||||||||
| Other loans: |
||||||||||||||||||||
| Commercial |
38 | 9 | 173 | 199 | 114 | |||||||||||||||
| Consumer |
15 | 29 | 17 | 29 | 47 | |||||||||||||||
| Total nonaccrual loans |
1,279 | 1,427 | 1,295 | 942 | 761 | |||||||||||||||
| Accruing loans 90 days or more past due |
— | — | — | — | 81 | |||||||||||||||
| Total nonperforming loans |
1,279 | 1,427 | 1,295 | 942 | 842 | |||||||||||||||
| Foreclosed property |
417 | 37 | 47 | 25 | 38 | |||||||||||||||
| Total nonperforming assets |
1,696 | 1,464 | 1,342 | 967 | 880 | |||||||||||||||
| Performing troubled debt restructurings |
556 | 449 | — | — | — | |||||||||||||||
| Total nonperforming assets and troubled debt restructurings |
$ | 2,252 | $ | 1,913 | $ | 1,342 | $ | 967 | $ | 880 | ||||||||||
| Nonperforming loans to total loans |
0.38 | % | 0.43 | % | 0.42 | % | 0.34 | % | 0.34 | % | ||||||||||
| Nonperforming loans to total assets |
0.24 | % | 0.27 | % | 0.31 | % | 0.24 | % | 0.23 | % | ||||||||||
| Nonperforming assets to total assets |
0.32 | % | 0.28 | % | 0.32 | % | 0.24 | % | 0.24 | % | ||||||||||
Net charge-offs for 2009 were $119,000, or 0.04%, of average loans, compared to $167,000, or 0.05%, in 2008.
Allowance for Loan Losses – The allowance for loan losses is established through a provision for loan losses. We maintain the allowance at a level believed, to the best of management’s knowledge, to cover all known and inherent losses in the portfolio that are both probable and reasonable to estimate at each reporting date. Management reviews the allowance for loan losses at least quarterly in order to identify those inherent losses and to assess the overall collection probability for the loan portfolio. Our evaluation process includes, among other things, an analysis of delinquency trends, non-performing loan trends, the level of charge-offs and recoveries, prior loss experience, total loans outstanding, the volume of loan originations, the type, size and geographic concentration of our loans, the value of collateral securing loans, the borrower’s ability to repay and repayment performance, the number of loans requiring heightened management oversight, general economic conditions and industry experience. Based on this evaluation, management assigns risk rankings to segments of the loan portfolio. Such risk ratings are periodically reviewed by management and revised as deemed appropriate. The establishment of the allowance for loan losses is significantly affected by management judgment and uncertainties and there is likelihood that different amounts would be reported under different conditions or assumptions. The OTS, as an integral part of their examination process, periodically reviews our allowance for loan losses. The OTS may require management to make additional provisions for estimated loan losses based upon judgments different from those of management.
25
Table of Contents
We will continue to monitor and modify our allowance for loan losses as conditions dictate. No assurance can be given that our level of allowance for loan losses will cover all of the inherent losses on our loans or that future adjustments to the allowance for loan losses will not be necessary if economic and other conditions differ substantially from the conditions used by management to determine the current level of the allowance for loan losses.
The following table presents the activity in the allowance for loan losses for the years indicated.
| For the Years Ended December 31, | |||||||||||||||
| (dollars in thousands) |
2009 | 2008 | 2007 | 2006 | 2005 | ||||||||||
| Balance, beginning of year |
$ | 2,606 | $ | 2,314 | $ | 2,008 | $ | 1,821 | $ | 1,625 | |||||
| Provision charged to operations |
865 | 459 | 420 | 260 | 252 | ||||||||||
| Loans charged off: |
|||||||||||||||
| One- to four-family first mortgage |
— | — | 17 | 20 | 18 | ||||||||||
| Home equity loans and lines |
66 | 30 | 52 | 16 | — | ||||||||||
| Commercial real estate and multi-family |
— | — | — | — | 20 | ||||||||||
| Construction and land |
— | — | — | — | — | ||||||||||
| Commercial |
21 | 88 | 16 | — | — | ||||||||||
| Consumer |
54 | 94 | 40 | 54 | 28 | ||||||||||
| Recoveries on charged off loans |
22 | 45 | 11 | 17 | 10 | ||||||||||
| Balance, end of year |
$ | 3,352 | $ | 2,606 | $ | 2,314 | $ | 2,008 | $ | 1,821 | |||||
The allowance for loan losses amounted to 1.00% of total loans and 262.2% of total nonperforming loans at December 31, 2009, compared to 0.78% and 182.6%, respectively, at December 31, 2008. The increase in the allowance for loan losses during 2009 was the result of a change in the loan mix with increasing levels of commercial loans, which generally are considered to have a higher degree of risk than single-family residential mortgage loans, as well as the Company’s consideration of, among other factors, unemployment rates in its markets and general economic conditions.
The following table presents the allocation of the allowance for loan losses as of December 31 of the years indicated.
| December 31, | ||||||||||||||||||||||||||||||
| (dollars in thousands) |
2009 | 2008 | 2007 | 2006 | 2005 | |||||||||||||||||||||||||
| Amount | % Loans | Amount | % Loans | Amount | % Loans | Amount | % Loans | Amount | % Loans | |||||||||||||||||||||
| One- to four-family first mortgage |
$ | 383 | 35.66 | % | $ | 399 | 41.18 | % | $ | 387 | 43.51 | % | $ | 344 | 42.14 | % | $ | 335 | 45.34 | % | ||||||||||
| Home equity loans and lines |
351 | 7.33 | 345 | 6.89 | 302 | 7.48 | 209 | 6.92 | 212 | 7.53 | ||||||||||||||||||||
| Commercial real estate and multi-family |
999 | 30.18 | 1,175 | 27.19 | 925 | 25.67 | 541 | 26.06 | 414 | 24.79 | ||||||||||||||||||||
| Construction and land |
670 | 10.50 | 212 | 10.55 | 201 | 8.35 | 125 | 11.43 | 106 | 9.89 | ||||||||||||||||||||
| Commercial |
738 | 11.39 | 327 | 10.26 | 316 | 10.68 | 621 | 9.14 | 503 | 7.86 | ||||||||||||||||||||
| Consumer |
211 | 4.94 | 148 | 3.93 | 183 | 4.31 | 168 | 4.31 | 231 | 4.59 | ||||||||||||||||||||
| Unallocated |
— | — | — | — | — | — | — | — | 20 | — | ||||||||||||||||||||
| Total |
$ | 3,352 | 100.00 | % | $ | 2,606 | 100.00 | % | $ | 2,314 | 100.00 | % | $ | 2,008 | 100.00 | % | $ | 1,821 | 100.00 | % | ||||||||||
Investment Securities
The Company invests in securities pursuant to our Investment Policy, which has been approved by our Board of Directors. The Investment Policy is designed primarily to manage the interest rate sensitivity of our assets and liabilities, to generate a favorable return without incurring undue interest rate or credit risk, to complement our
26
Table of Contents
lending activities and to provide and maintain liquidity. The Asset-Liability Committee (“ALCO”), comprised of the Chief Executive Officer, Chief Financial Officer, Chief Lending Officer, Chief Operations Officer and Controller, monitors investment activity and ensures that investments are consistent with the Investment Policy. The Board of Directors of the Company reviews investment activity monthly.
The investment securities portfolio increased by an aggregate of $1.5 million, or 1.3%, during 2009. Securities available for sale made up the vast majority of the investment securities portfolio at December 31, 2009. The following table sets forth the amortized cost and market value of our investment securities portfolio as of the dates indicated.
| December 31, | ||||||||||||||||||
| (dollars in thousands) |
2009 | 2008 | 2007 | |||||||||||||||
| Amortized Cost |
Market Value |
Amortized Cost |
Market Value |
Amortized Cost |
Market Value | |||||||||||||
| Available for sale: |
||||||||||||||||||
| U.S. agency mortgage-backed |
$ | 60,338 | $ | 62,092 | $ | 71,175 | $ | 71,480 | $ | 33,487 | $ | 33,578 | ||||||
| Non-U.S. agency mortgage-backed |
39,707 | 37,853 | 51,108 | 42,755 | 21,443 | 21,418 | ||||||||||||
| U.S. government agency |
6,840 | 6,807 | — | — | — | — | ||||||||||||
| Other bonds |
— | — | — | — | 1,999 | 1,999 | ||||||||||||
| Total available for sale |
106,885 | 106,752 | 122,283 | 114,235 | 56,929 | 56,995 | ||||||||||||
| Held to maturity: |
||||||||||||||||||
| U.S. agency mortgage-backed |
5,736 | 5,781 | 2,545 | 2,570 | 3,553 | 3,492 | ||||||||||||
| Municipal bonds |
1,363 | 1,439 | 1,544 | 1,564 | 1,140 | 1,166 | ||||||||||||
| U.S. government agency |
6,000 | 5,957 | — | — | — | — | ||||||||||||
| Total held to maturity |
13,099 | 13,177 | 4,089 | 4,134 | 4,693 | 4,658 | ||||||||||||
| Total investment securities |
$ | 119,984 | $ | 119,929 | $ | 126,372 | $ | 118,369 | $ | 61,622 | $ | 61,653 | ||||||
The following table sets forth the fixed versus adjustable rate profile of the investment securities portfolio as of the dates indicated. All amounts are shown at amortized cost.
| December 31, | |||||||||
| (dollars in thousands) |
2009 | 2008 | 2007 | ||||||
| Fixed rate: |
|||||||||
| Available for sale |
$ | 30,023 | $ | 36,307 | $ | 13,831 | |||
| Held to maturity |
7,099 | 4,089 | 4,693 | ||||||
| Total fixed rate |
37,122 | 40,396 | 18,524 | ||||||
| Adjustable rate: |
|||||||||
| Available for sale |
76,862 | 85,976 | 43,098 | ||||||
| Held to maturity |
6,000 | — | — | ||||||
| Total adjustable rate |
82,862 | 85,976 | 43,098 | ||||||
| Total investment securities |
$ | 119,984 | $ | 126,372 | $ | 61,622 | |||
27
Table of Contents
The following table sets forth the amount of investment securities which mature during each of the periods indicated and the weighted average yields for each range of maturities at December 31, 2009. No tax-exempt yields have been adjusted to a tax-equivalent basis. All amounts are shown at amortized cost.
| Amounts at December 31, 2009 which mature in: | ||||||||||||||||
| (dollars in thousands) |
One Year to Five Years |
Five to Ten Years |
Over Ten Years |
Total | ||||||||||||
| Available for sale: |
||||||||||||||||
| U.S. agency mortgage-backed |
$ | 4,569 | $ | 3,761 | $ | 52,008 | $ | 60,338 | ||||||||
| Non-U.S. agency mortgage-backed |
— | 3,488 | 36,219 | 39,707 | ||||||||||||
| U.S. government agency |
— | — | 6,840 | 6,840 | ||||||||||||
| Total available for sale |
4,569 | 7,249 | 95,067 | 106,885 | ||||||||||||
| Weighted average yield |
4.03 | % | 3.80 | % | 4.78 | % | 4.68 | % | ||||||||
| Held to maturity: |
||||||||||||||||
| U.S. agency mortgage-backed |
3,726 | 2,009 | — | 5,735 | ||||||||||||
| Municipal bonds |
605 | 759 | — | 1,364 | ||||||||||||
| U.S. government agency |
3,000 | 3,000 | — | 6,000 | ||||||||||||
| Total held to maturity |
7,331 | 5,768 | — | 13,099 | ||||||||||||
| Weighted average yield |
2.00 | % | 3.27 | % | — | % | 2.56 | % | ||||||||
| Total investment securities |
$ | 11,900 | $ | 13,017 | $ | 95,067 | $ | 119,984 | ||||||||
The following table summarizes activity in the Company’s investment securities portfolio during 2009.
| (dollars in thousands) |
Available for Sale | Held to Maturity | ||||||
| Balance, December 31, 2008 |
$ | 114,235 | $ | 4,089 | ||||
| Purchases |
20,561 | 13,150 | ||||||
| Sales |
— | — | ||||||
| Principal maturities, prepayments and calls |
(36,074 | ) | (4,135 | ) | ||||
| Amortization of premiums and accretion of discounts |
938 | (5 | ) | |||||
| Increase in market value |
7,915 | — | ||||||
| Other-than-temporary impairment |
(1,888 | ) | — | |||||
| Cumulative effect adjustment (1) |
1,065 | — | ||||||
| Balance, December 31, 2009 |
$ | 106,752 | $ | 13,099 | ||||
| (1) | See Note 4 of the Notes to Consolidated Financial Statements included in Item 8. |
At December 31, 2009, the Company had a net unrealized loss on its available for sale investment securities portfolio of $133,000, compared to a net unrealized loss of $8.0 million at December 31, 2008. The net unrealized losses relate primarily to the Company’s non-agency (or private-label) mortgage-backed securities holdings. The non-agency mortgage-backed securities portfolio totaled $39.7 million, or 7.6% of total assets, at December 31, 2009.
Due to increasing delinquencies and defaults in the mortgage loans underlying certain non-agency mortgage-backed securities we own, the Company recorded OTTI charges of $1.9 million and $2.8 million during 2009 and 2008, respectively. The amortized cost of this portfolio decreased from $51.1 million at December 31, 2008 to $39.7 million at December 31, 2009 primarily as a result of principal paydowns and the $1.9 million OTTI charge. Based on management’s review of the remaining investment portfolio, no other declines in the market value of the Company’s investment securities are deemed to be other-than-temporary at December 31, 2009.
28
Table of Contents
The following table summarizes the Company’s non-agency mortgage-backed securities portfolio as of December 31, 2009 (dollars in thousands).
| Collateral |
Tranche | S&P Rating |
Amortized Cost | Unrealized Gain/(Loss) |
|||||||
| Prime |
Super senior | AAA | $ | 10,189 | $ | 130 | |||||
| Prime |
Senior | AAA (1) | 18,743 | (1,462 | ) | ||||||
| Prime |
Senior | Below investment grade | 3,113 | — | |||||||
| Prime |
Senior support | Below investment grade | 2,719 | (545 | ) | ||||||
| Alt-A |
Super senior | Below investment grade | 2,202 | — | |||||||
| Alt-A |
Senior | AAA | 771 | 23 | |||||||
| Alt-A |
Senior | Below investment grade (2) | 1,774 | — | |||||||
| Alt-A |
Senior support | Below investment grade | 196 | — | |||||||
| Total non-agency mortgage-backed securities |
$ | 39,707 | $ | (1,854 | ) | ||||||
| (1) | Includes one security with an amortized cost of $1.9 million and an unrealized loss of $56,000 not rated by S&P. This security is rated “Aaa” by Moody’s. |
| (2) | This security is not rated by S&P. This security is rated “Caa2” by Moody’s. |
The Company holds no Federal National Mortgage Association (“Fannie Mae”) or Federal Home Loan Mortgage Corporation (“Freddie Mac”) preferred stock, equity securities, corporate bonds, trust preferred securities, hedge fund investments, collateralized debt obligations or structured investment vehicles.
Cash Invested at Other ATM Locations
The Bank previously entered into contracts with various counterparties to provide cash for ATMs at various locations throughout the United States. Under the terms of these agreements, the Bank retained ownership of the cash in the ATMs at all times. These contracts expired during 2009 and were not renewed by the Bank. All cash invested at these ATM locations was collected prior to December 31, 2009. The balance of cash invested at other ATM locations was $24.2 million at December 31, 2008.
In September 2008, one of the Bank’s ATM counterparties discontinued operations. To date, the cash returned to the Bank by the counterparty is $867,000 less than the balance due to the Bank. Given the uncertainty of collecting the balance due, the Company assumed no recovery and recorded a charge of $867,000 during 2008. The Company is currently pursuing collection options, including recovery under the counterparty’s insurance policy for which Home Bank is a named insured. The Company has filed a claim with its insurance company under its fidelity bond.
Funding Sources
General – Deposits, loan repayments and prepayments, proceeds from investment securities sales, calls, maturities and pay-downs, cash flows generated from operations and Federal Home Loan Bank (“FHLB”) advances are our primary, ongoing sources of funds for use in lending, investing and for other general purposes. In 2008, our IPO provided approximately $87.2 million in net proceeds to the Company.
Deposits – The Company offers a variety of deposit accounts with a range of interest rates and terms. Our deposits consist of checking, both interest-bearing and noninterest-bearing, money market, savings and certificate of deposit accounts.
The flow of deposits is influenced significantly by general economic conditions, changes in market interest rates and competition. Our deposits are obtained predominantly from the areas where our branch offices are located.
29
Table of Contents
We have historically relied primarily on a high level of customer service and long-standing relationships with customers to attract and retain deposits; however, market interest rates and rates offered by competitors significantly affect our ability to attract and retain deposits.
The Company uses traditional means of advertising its deposit products, including broadcast and print media. The Company generally does not solicit deposits from outside our market area.
Total deposits were $371.6 million at December 31, 2009, an increase of $17.4 million, or 4.9%, compared to $354.1 million at December 31, 2008. The Company’s continued focus is on growing our core deposits (i.e., demand deposit, savings and money market accounts), which increased $19.3 million, or 9.8%, in 2009.
The following table sets forth the composition of the Company’s deposits at the dates indicated.
| December 31, | Increase(Decrease) | ||||||||||||
| (dollars in thousands) |
2009 | 2008 | Amount | Percent | |||||||||
| Demand deposit |
$ | 66,956 | $ | 67,047 | $ | (91 | ) | (0.1 | )% | ||||
| Savings |
21,009 | 19,741 | 1,268 | 6.4 | |||||||||
| Money market |
80,810 | 68,850 | 11,960 | 17.4 | |||||||||
| NOW |
48,384 | 42,200 | 6,184 | 14.7 | |||||||||
| Certificates of deposit |
154,434 | 156,307 | (1,873 | ) | (1.2 | ) | |||||||
| Total deposits |
$ | 371,593 | $ | 354,145 | $ | 17,448 | 4.9 | % | |||||
The following table shows the average balance and average rate paid for each type of deposit for the periods indicated.
| For the Years Ended December 31, | |||||||||||||||||||||||||||
| (dollars in thousands) |
2009 | 2008 | 2007 | ||||||||||||||||||||||||
| Average Balance |
Interest Expense |
Average Rate Paid |
Average Balance |
Interest Expense |
Average Rate Paid |
Average Balance |
Interest Expense |
Average Rate Paid |
|||||||||||||||||||
| Savings, checking and money market |
$ | 143,231 | $ | 1,056 | 0.74 | % | $ | 129,377 | $ | 1,657 | 1.28 | % | $ | 119,801 | $ | 2,140 | 1.79 | % | |||||||||
| Certificates of deposit |
159,928 | 4,473 | 2.80 | 167,254 | 6,246 | 3.73 | 174,225 | 7,486 | 4.30 | ||||||||||||||||||
| Total interest-bearing deposits |
$ | 303,159 | $ | 5,529 | 1.82 | % | $ | 296,631 | $ | 7,903 | 2.66 | % | $ | 294,026 | $ | 9,626 | 3.27 | % | |||||||||
Certificates of deposit $100,000 and over increased $3.6 million, or 6.0%, from $60.4 million at December 31, 2008 to $64.0 million at December 31, 2009. The following table details the remaining maturity of large-denomination certificates of deposit of $100,000 and over.
| December 31, | |||||||||
| (dollars in thousands) |
2009 | 2008 | 2007 | ||||||
| 3 months or less |
$ | 15,112 | $ | 9,951 | $ | 11,443 | |||
| 3 – 6 months |
14,828 | 8,328 | 17,547 | ||||||
| 6 – 12 months |
13,520 | 17,277 | 29,359 | ||||||
| 12 – 36 months |
18,973 | 22,937 | 10,533 | ||||||
| More than 36 months |
1,589 | 1,928 | 2,262 | ||||||
| Total certificates of deposit |
$ | 64,022 | $ | 60,421 | $ | 71,144 | |||
Federal Home Loan Bank Advances – Advances from the FHLB of Dallas (“FHLB”) may be obtained by the Company upon the security of the common stock it owns in the FHLB and certain of its real estate loans and investment securities, provided certain standards related to creditworthiness have been met. Such advances are made pursuant to several credit programs, each of which has its own interest rate and range of maturities. Advances from the FHLB may be either short-term, maturities of one year or less, or long-term, maturities in excess of one year.
30
Table of Contents
At December 31, 2009, the Company had no short-term FHLB advances, compared to $21.5 million at December 31, 2008. The average rates paid on short-term FHLB advances were 1.8% and 2.2% for 2009 and 2008, respectively.
Long-term FHLB advances totaled $16.8 million at December 31, 2009, a decrease of $6.1 million, or 26.8%, compared to December 31, 2008. The average rates paid on long-term FHLB advances were 3.6% and 4.0% for 2009 and 2008, respectively.
Shareholders’ Equity – Shareholders’ equity provides a source of permanent funding, allows for future growth and provides the Company with a cushion to withstand unforeseen adverse developments. At December 31, 2009, shareholders’ equity totaled $132.7 million, an increase of $5.8 million, or 4.6%, compared to $127.0 million at December 31, 2008. The $5.2 million increase in accumulated other comprehensive income (loss) and $5.4 million increase in retained earnings were partially offset by purchases of common stock during 2009 in aggregate amounts of $4.2 million and $1.8 million, respectively, for the Retention and Recognition Plan and treasury stock. Retained earnings increased in 2009 partially due to a $703,000 cumulative effect adjustment as the result of the Financial Accounting Standards Board (“FASB”), which allowed the Company to recover the non-credit related portions of investment securities deemed other than temporarily impaired in the fourth quarter of 2008.
RESULTS OF OPERATIONS
The Company reported net income of $4.7 million, $2.7 million, and $3.3 million for the years ended December 31, 2009, 2008, and 2007, respectively. Diluted earnings per share were $0.58 and $1.32 in 2009 and 2008, respectively. The Company completed its initial public offering of common stock in October 2008. Hence, the weighted average number of common shares outstanding during 2008 was lower than it would have been had the shares been outstanding for a full year. No shares were outstanding during 2007.
Net Interest Income – Net interest income is the difference between the interest income earned on interest-earning assets, such as loans and investment securities, and the interest expense paid on interest-bearing liabilities, such as deposits and borrowings. Our net interest income is largely determined by our net interest spread, which is the difference between the average yield earned on interest-earning assets and the average rate paid on interest bearing liabilities, and the relative amounts of interest-earning assets and interest-bearing liabilities. The Company’s net interest spread was 4.06%, 3.66% and 3.43% during the years ended December 31, 2009, 2008 and 2007, respectively. The Company’s net interest margin, which is net interest income as a percentage of average interest-earning assets, was 4.72%, 4.31% and 4.09% during the years ended December 31, 2009, 2008 and 2007, respectively. The net interest spread and margin ratios increased in 2009 compared to 2008 primarily due to the fall in short-term interest rates during the year and the associated repricing of the Company’s assets and liabilities and changes in the mix of the Company’s assets and liabilities.
Net interest income increased $4.9 million, or 26.1%, in 2009 to $23.6 million compared to $18.7 million in 2008. This increase was due to a $2.5 million, or 9.0%, increase in interest income and a $2.4 million, or 27.6%, decrease in interest expense. The improvement in net interest income in 2009 compared to 2008 was the result of increased volumes of interest-earning assets, lower average rates paid on interest-bearing deposits, and an improved mix of interest-earning assets and interest-bearing deposits.
In 2008, net interest income increased $3.2 million, or 20.4%, to $18.7 million, compared to $15.5 million in 2007. This increase was due to a $2.0 million, or 7.9%, increase in interest income and a $1.2 million, or 11.7%, decrease in interest expense. The improvement in net interest income in 2008 compared to 2007 was the result of increased volumes of interest-earning assets and an improved mix of interest-earnings assets and interest-bearing deposits.
31
Table of Contents
The following table sets forth, for the periods indicated, information regarding (i) the total dollar amount of interest income to the Company from interest-earning assets and the resultant average yields; (ii) the total dollar amount of interest expense on interest-bearing liabilities and the resultant average rate; (iii) net interest income; (iv) net interest spread; and (v) net interest margin. Information is based on average monthly balances during the indicated periods.
| For the Years Ended December 31, | |||||||||||||||||||||||||||
| (dollars in thousands) |
2009 | 2008 | 2007 | ||||||||||||||||||||||||
| Average Balance |
Interest | Average Yield/ Rate (1) |
Average Balance |
Interest | Average Yield/ Rate |
Average Balance |
Interest | Average Yield/ Rate |
|||||||||||||||||||
| Earning assets: |
|||||||||||||||||||||||||||
| Loans receivable(1) |
$ | 341,986 | $ | 22,321 | 6.53 | % | $ | 317,362 | $ | 21,790 | 6.90 | % | $ | 293,289 | $ | 20,809 | 7.14 | % | |||||||||
| Investment securities |
121,612 | 6,570 | 5.40 | 80,747 | 4,284 | 5.31 | 55,224 | 2,668 | 4.83 | ||||||||||||||||||
| Other interest-earning assets |
35,434 | 1,005 | 2.84 | 35,730 | 1,355 | 3.79 | 30,925 | 1,948 | 6.30 | ||||||||||||||||||
| Total earning assets |
499,032 | 29,896 | 5.99 | 433,839 | 27,429 | 6.35 | 379,438 | 25,425 | 6.73 | ||||||||||||||||||
| Noninterest-earning assets |
30,957 | 30,080 | 24,979 | ||||||||||||||||||||||||
| Total assets |
$ | 529,989 | $ | 463,919 | $ | 404,417 | |||||||||||||||||||||
| Interest-bearing liabilities: |
|||||||||||||||||||||||||||
| Deposits: |
|||||||||||||||||||||||||||
| Savings, checking and money market |
$ | 143,231 | $ | 1,056 | 0.74 | % | $ | 129,377 | $ | 1,657 | 1.28 | % | $ | 119,801 | $ | 2,140 | 1.79 | % | |||||||||
| Certificates of deposit |
159,928 | 4,473 | 2.80 | 167,254 | 6,246 | 3.73 | 174,225 | 7,486 | 4.30 | ||||||||||||||||||
| Total interest-bearing deposits |
303,159 | 5,529 | 1.82 | 296,631 | 7,903 | 2.66 | 294,026 | 9,626 | 3.27 | ||||||||||||||||||
| FHLB advances |
25,117 | 807 | 3.21 | 28,014 | 844 | 3.01 | 6,422 | 282 | 4.39 | ||||||||||||||||||
| Total interest-bearing liabilities |
328,276 | 6,336 | 1.93 | 324,645 | 8,747 | 2.69 | 300,448 | 9,908 | 3.30 | ||||||||||||||||||
| Noninterest-bearing liabilities |
70,913 | 73,384 | 55,839 | ||||||||||||||||||||||||
| Total liabilities |
399,189 | 398,029 | 356,287 | ||||||||||||||||||||||||
| Shareholders’ equity |
130,800 | 65,890 | 48,130 | ||||||||||||||||||||||||
| Total liabilities and shareholders’ equity |
$ | 529,989 | $ | 463,919 | $ | 404,417 | |||||||||||||||||||||
| Net interest-earning assets |
$ | 170,756 | $ | 109,194 | $ | 78,990 | |||||||||||||||||||||
| Net interest income; net interest spread |
$ | 23,560 | 4.06 | % | $ | 18,682 | 3.66 | % | $ | 15,517 | 3.43 | % | |||||||||||||||
| Net interest margin(2) |
4.72 | % | 4.31 | % | 4.09 | % | |||||||||||||||||||||
| (1) | Includes nonaccrual loans during the respective periods. Calculated net of deferred fees and discounts, and loans in process. |
| (2) | Equals net interest income divided by average interest-earning assets. |
32
Table of Contents
The following table displays the dollar amount of changes in interest income and interest expense for major components of earning assets and interest-bearing liabilities. The table distinguishes between (i) changes attributable to volume (changes in average volume between periods times prior year rate), (ii) changes attributable to rate (changes in average rate between periods times prior year volume), and (iii) total increase (decrease).
| 2009 / 2008 Change Attributable To |
2008 / 2007 Change Attributable To |
|||||||||||||||||||||||
| (dollars in thousands) |
Rate | Volume | Total Increase (Decrease) |
Rate | Volume | Total Increase (Decrease) |
||||||||||||||||||
| Interest income: |
||||||||||||||||||||||||
| Loans receivable |
$ | (1,171 | ) | $ | 1,702 | $ | 531 | $ | (722 | ) | $ | 1,703 | $ | 981 | ||||||||||
| Investment securities |
98 | 2,188 | 2,286 | 323 | 1,293 | 1,616 | ||||||||||||||||||
| Other interest-earning assets |
(340 | ) | (10 | ) | (350 | ) | (836 | ) | 243 | (593 | ) | |||||||||||||
| Total interest income |
(1,413 | ) | 3,880 | 2,467 | (1,235 | ) | 3,239 | 2,004 | ||||||||||||||||
| Interest expense: |
||||||||||||||||||||||||
| Savings, checking and money market accounts |
(741 | ) | 140 | (601 | ) | (630 | ) | 147 | (483 | ) | ||||||||||||||
| Certificates of deposit |
(1,533 | ) | (240 | ) | (1,773 | ) | (961 | ) | (279 | ) | (1,240 | ) | ||||||||||||
| FHLB advances |
53 | (90 | ) | (37 | ) | (238 | ) | 800 | 562 | |||||||||||||||
| Total interest expense |
(2,221 | ) | (190 | ) | (2,411 | ) | (1,829 | ) | 668 | (1,161 | ) | |||||||||||||
| Increase (decrease) in net interest income |
$ | 808 | $ | 4,070 | $ | 4,878 | $ | 594 | $ | 2,571 | $ | 3,165 | ||||||||||||
Interest income includes interest income earned on earning assets as well as applicable loan fees earned. Interest income that would have been earned on nonaccrual loans had they been on accrual status is not included in the data reported above.
Provision for Loan Losses – We have identified the evaluation of the allowance for loan losses as a critical accounting policy where amounts are sensitive to material variation. This policy is significantly affected by our judgment and uncertainties. There is likelihood that materially different amounts would be reported under different, but reasonably plausible, conditions or assumptions. Our activity in the provision for loan losses, which are charges or recoveries to operating results, is undertaken in order to maintain a level of total allowance for loan losses that management believes covers all known and inherent losses that are both probable and reasonably estimable at each reporting date. Our evaluation process typically includes, among other things, an analysis of delinquency trends, non-performing loan trends, the level of charge-offs and recoveries, prior loss experience, total loans outstanding, the volume of loan originations, the type, size and geographic concentration of our loans, the value of collateral securing the loan, the borrower’s ability to repay and repayment performance, the number of loans requiring heightened management oversight, general economic conditions and industry experience. The OTS, as an integral part of its examination process, periodically reviews our allowance for loan losses. The OTS may require the Bank to make additional provisions for estimated loan losses based upon judgments different from those of management.
For the year ended December 31, 2009, the Company recorded a provision for loan losses of $865,000, compared to provisions of $459,000 and $420,000 for 2008 and 2007, respectively. The amount of provision for loan losses for 2009 was the result of the continuing change in our loan mix with increasing levels of commercial loans, which generally are considered to have a higher degree of risk than single-family residential mortgage loans, as well as the Company’s consideration of, among other factors, unemployment rates in its markets and general economic conditions.
Net charge-offs were $119,000 for 2009, compared to $167,000 and $114,000 for 2008 and 2007, respectively. The allowance for loan losses as a percentage of outstanding loans, net of unearned income, was 1.00% at December 31, 2009, compared to 0.78% at December 31, 2008.
33
Table of Contents
Noninterest Income – The following table illustrates the primary components of noninterest income for the years indicated.
| Percent Increase |
Percent Increase |
|||||||||||||||||
| (dollars in thousands) |
2009 | 2008 | (Decrease) | 2007 | (Decrease) | |||||||||||||
| Noninterest income: |
||||||||||||||||||
| Service fees and charges |
$ | 1,850 | $ | 1,669 | 10.8 | % | $ | 1,513 | 10.3 | % | ||||||||
| Bank card fees |
1,090 | 934 | 16.7 | 584 | 59.9 | |||||||||||||
| Income from bank-owned life insurance |
292 | 262 | 11.4 | 7 | 3,863.7 | |||||||||||||
| Gain on sale of loans, net |
611 | 254 | 140.1 | 312 | (18.4 | ) | ||||||||||||
| Gain (loss) on sale of real estate owned, net |
39 | (16 | ) | 346.5 | (4 | ) | (277.7 | ) | ||||||||||
| Impairment of investment securities |
(1,888 | ) | (2,833 | ) | 33.3 | — | — | |||||||||||
| Other income |
108 | 128 | (14.5 | ) | 104 | 21.8 | ||||||||||||
| Total noninterest income |
$ | 2,102 | $ | 398 | 427.9 | % | $ | 2,516 | (84.2 | )% | ||||||||
2009 compared to 2008
The Company’s noninterest income was $2.1 million for the year ended December 31, 2009, $1.7 million, or 427.9%, higher than the $398,000 in noninterest income earned in 2008.
Service fees and charges and bank card fees increased $181,000 and $156,000, respectively, from 2008 to 2009 due to a higher volume of transactions processed. Income from bank-owned life insurance increased $30,000 due to the Company’s purchase of $9.7 million of additional policies in the fourth quarter of 2009. Gain on sale of mortgage loans increased $356,000 due to increased mortgage refinancing prompted by the current low interest rate environment.
Due to the deteriorating credit performance of the mortgage loans underlying the Company’s non-agency mortgage-backed securities, the Company recorded non-cash OTTI charges of $1.9 million and $2.8 million during the fourth quarters of 2009 and 2008, respectively. This charge is reflected in noninterest income as an “Impairment of investment securities”.
2008 compared to 2007
The Company’s noninterest income totaled $398,000 at December 31, 2008, a decrease of $2.1 million, or 84.2%, compared to December 31, 2007.
Service fees and charges and bank card fees increased $155,000 and $350,000, respectively, primarily due to increased core deposit accounts and merchant service fees. Income from bank owned life insurance increased $256,000 due to a full year of income recognized on policies purchased in the fourth quarter of 2007.
The increases in noninterest income were offset by $2.8 million in non-cash OTTI charge recorded in 2008. Additionally, gain on sale of mortgage loans decreased $57,000 as a result of fewer mortgage loan sales.
34
Table of Contents
Noninterest Expense – The following table illustrates the primary components of noninterest expense for the years indicated.
| Percent Increase |
Percent Increase |
||||||||||||||
| (dollars in thousands) |
2009 | 2008 | (Decrease) | 2007 | (Decrease) | ||||||||||
| Noninterest expense: |
|||||||||||||||
| Compensation and benefits |
$ | 10,827 | $ | 8,834 | 22.6 | % | $ | 8,030 | 10.0 | % | |||||
| Occupancy |
1,297 | 1,208 | 7.4 | 1,248 | (3.2 | ) | |||||||||
| Marketing and advertising |
634 | 608 | 4.3 | 665 | (8.6 | ) | |||||||||
| Data processing and communication |
1,402 | 1,370 | 2.3 | 1,229 | 11.5 | ||||||||||
| Professional services |
897 | 410 | 118.5 | 297 | 38.2 | ||||||||||
| Forms, printing and supplies |
378 | 358 | 5.5 | 377 | (4.9 | ) | |||||||||
| Franchise and shares tax |
610 | — | — | — | — | ||||||||||
| Regulatory fees |
596 | 154 | 286.2 | 140 | 10.2 | ||||||||||
| ATM losses |
— | 867 | (100 | ) | — | — | |||||||||
| Other expenses |
1,167 | 926 | 26.1 | 917 | 0.9 | ||||||||||
| Total noninterest expense |
$ | 17,808 | $ | 14,735 | 20.9 | % | $ | 12,903 | 14.2 | % | |||||
2009 compared to 2008
The Company’s noninterest expense was $17.8 million for the year ended December 31, 2009, $3.1 million, or 20.9%, higher than the $14.7 million incurred for the same period in 2008.
Compensation and benefits expense increased $2.0 million primarily due to three factors: 1) the Bank’s expansion into Baton Rouge, where two full-service banking offices were opened during the second half of 2008; 2) the ESOP, which commenced during the fourth quarter of 2008; and 3) award grants under the stock option and recognition and retention plans approved by the Company’s shareholders in May 2009. The Company’s compensation expense from the ESOP was $405,000 in 2009 compared to $90,000 in 2008. The Company recognized an aggregate of $857,000 in compensation expense in 2009 from its stock option plan and recognition and retention plan with no corresponding expense from such plans in 2008. Compensation expense related to these two plans is expected to increase in 2010 as the plans will be in place for the entire year in 2010. Occupancy expense increased $89,000 primarily due to a full year of depreciation recorded on the two branches that opened in the second half of 2008.
Professional services increased $486,000 due to the increased cost of operating as a public company after the Company’s completion of its IPO in October 2008. Franchise and shares tax increased $610,000 due to the Company owing Louisiana bank shares taxes and franchise taxes as a public company.
Regulatory fees increased $442,000 primarily as the result of the FDIC increasing the base insurance premium assessment on deposits and its special assessment of $200,000 in 2009. The Company did not incur additional shortfall in cash at other ATM locations resulting in a decrease in ATM losses of $867,000 in 2009. Other expenses increased $242,000 due to increased insurance costs and expenses associated with the Company’s product lines.
2008 compared to 2007
The Company’s noninterest expense totaled $14.7 million for the year ended December 31, 2008, an increase of $1.8 million or 14.2%, compared to December 31, 2007.
Compensation and benefits increased $804,000 due to staffing two new branches in Baton Rouge and the addition of new executives. Data processing and communication expense increased $142,000 as the result of
35
Table of Contents
technology costs associated with the expansion into Baton Rouge. Professional fees and services increased $113,000 primarily due to increased costs of operating as a public company. In 2008, a shortfall in cash invested at other ATMs resulted in charge of $867,000 for ATM losses.
Income Taxes – For the years ended December 31, 2009, 2008 and 2007, the Company incurred income tax expense of $2.3 million, $1.2 million and $1.4 million, respectively. The Company’s effective tax rate amounted to 33.0%, 30.1% and 29.5% during 2009, 2008 and 2007, respectively. The difference between the effective tax rate and the statutory tax rate primarily related to variances in items that are non-taxable or non-deductible, primarily the effect of tax-exempt income and various tax credits taken.
LIQUIDITY AND CAPITAL RESOURCES
Our primary sources of funds are from deposits, amortization of loans, loan prepayments and the maturity of loans, investment securities and other investments, and other funds provided from operations. While scheduled payments from the amortization of loans and investment securities and maturing investment securities are relatively predictable sources of funds, deposit flows and loan prepayments can be greatly influenced by general interest rates, economic conditions and competition. We also maintain excess funds in short-term, interest-bearing assets that provide additional liquidity. At December 31, 2009, our cash and cash equivalents totaled $25.7 million. In addition, at such date, our available for sale investment securities totaled $106.8 million.
We use our liquidity to fund existing and future loan commitments, to fund maturing certificates of deposit and demand deposit withdrawals, to invest in other interest-earning assets, and to meet operating expenses. At December 31, 2009, we had certificates of deposit maturing within the next 12 months totaling $99.9 million. Based upon historical experience, we anticipate that the majority of the maturing certificates of deposit will be redeposited with us.
In addition to cash flow from loan and securities payments and prepayments as well as from sales of available for sale securities, we have significant borrowing capacity available to fund liquidity needs. In recent years we have utilized borrowings as a cost efficient addition to deposits as a source of funds. Our borrowings consist of advances from the FHLB, of which we are a member. Under terms of the collateral agreement with the FHLB, we may pledge residential mortgage loans and mortgage-backed securities as well as our stock in the FHLB as collateral for such advances. For the year ended December 31, 2009, the average balance of our outstanding FHLB advances was $25.1 million. At December 31, 2009, we had $16.8 million in outstanding FHLB advances and had $205.7 million in additional FHLB advances available to us.
Liquidity management is both a daily and long-term function of business management. Excess liquidity is generally invested in short-term investments such as overnight deposits. On a longer-term basis, the Company maintains a strategy of investing in various lending and investment security products. The Company uses its sources of funds primarily to meet its ongoing commitments and fund loan commitments. The Company has been able to generate sufficient cash through its deposits, as well as borrowings, and anticipates it will continue to have sufficient funds to meet its liquidity requirements.
ASSET/ LIABILITY MANAGEMENT AND MARKET RISK
The objective of asset/liability management is to implement strategies for the funding and deployment of the Company’s financial resources that are expected to maximize soundness and profitability over time at acceptable levels of risk. Interest rate sensitivity is the potential impact of changing rate environments on both net interest income and cash flows. The Company measures its interest rate sensitivity over the near term primarily by running net interest income simulations.
36
Table of Contents
Our interest rate sensitivity also is monitored by management through the use of models which generate estimates of the change in its net interest income over a range of interest rate scenarios. Based on the Company’s interest rate risk model, the table below sets forth the results of immediate and sustained changes in interest rate as of December 31, 2009.
| Shift in Interest Rates (in bps) |
% Change in Projected Net Interest Income | |
| +200 |
5.0% | |
| +100 |
2.9 | |
| - 100 |
(2.3) | |
| - 200 |
N/A |
The actual impact of changes in interest rates will depend on many factors. These factors include the Company’s ability to achieve expected growth in interest-earning assets and maintain a desired mix of interest-earning assets and interest-bearing liabilities, the actual timing of asset and liability repricings, the magnitude of interest rate changes and corresponding movement in interest rate spreads, and the level of success of asset/liability management strategies.
Market risk is the risk of loss from adverse changes in market prices and rates. Our market risk arises primarily from the interest rate risk which is inherent in our lending and deposit taking activities. To that end, management actively monitors and manages interest rate risk exposure. In addition to market risk, our primary risk is credit risk on our loan portfolio. We attempt to manage credit risk through our loan underwriting and oversight policies.
The principal objective of our interest rate risk management function is to evaluate the interest rate risk embedded in certain balance sheet accounts, determine the level of risk appropriate given our business strategy, operating environment, capital and liquidity requirements, performance objectives and interest rate environment, and manage the risk consistent with approved guidelines. We seek to manage our exposure to risks from changes in interest rates while at the same time trying to improve our net interest spread. We monitor interest rate risk as such risk relates to our operating strategies. We have established an Asset/Liability Committee, which is comprised of our Chief Executive Officer, Chief Financial Officer, Chief Lending Officer, Chief Operations Officer and Controller. The ALCO is responsible for reviewing our asset/liability and investment policies and interest rate risk position. The ALCO meets at least monthly. The extent of the movement of interest rates is an uncertainty that could have a negative impact on future earnings.
In recent years, we primarily have utilized the following strategies in our efforts to manage interest rate risk:
| • | we have increased our originations of shorter term loans, particularly commercial real estate and commercial business loans; |
| • | we generally sell our conforming long-term (30-year) fixed-rate single-family residential mortgage loans into the secondary market; and |
| • | we have invested in securities, consisting primarily of mortgage-backed securities, with relatively short anticipated lives, generally three to five years, and we maintain adequate amounts of liquid assets. |
OFF-BALANCE SHEET ACTIVITIES
To meet the financing needs of its customers, the Company issues financial instruments which represent conditional obligations that are not recognized, wholly or in part, in the statements of financial condition. These financial instruments include commitments to extend credit and standby letters of credit. Such instruments expose the Company to varying degrees of credit and interest rate risk in much the same way as funded loans. The same credit policies are used in these commitments as for on-balance sheet instruments. The Company’s exposure to credit losses from these financial instruments is represented by their contractual amounts.
37
Table of Contents
The following table summarizes our outstanding commitments to originate loans, to fund additional amounts of cash at other ATM locations pursuant to existing agreements and to advance additional amounts pursuant to outstanding letters of credit, lines of credit and the undisbursed portion of construction loans at December 31 of the years indicated.
| Contract Amount | ||||||
| (dollars in thousands) |
2009 | 2008 | ||||
| Standby letters of credit |
$ | 730 | $ | 1,034 | ||
| Lines of credit |
28,161 | 24,493 | ||||
| Cash invested in other ATM locations |
— | 6,761 | ||||
| Undisbursed portion of loans in process |
29,598 | 18,851 | ||||
| Commitments to originate loans |
15,468 | 34,520 | ||||
Commitments to extend credit are agreements to lend to a customer as long as there is no violation of any condition established in the contract. Commitments generally have fixed expiration dates or other termination clauses and may require payment of a fee. Since many of the commitments are expected to be drawn upon, the total commitment amounts generally represent future cash requirements.
Unfunded commitments under commercial lines-of-credit, revolving credit lines and overdraft protection agreements are commitments for possible future extensions of credit to existing customers. These lines-of-credit usually do not contain a specified maturity date and may not be drawn upon to the total extent to which the Company is committed.
The Company is subject to certain claims and litigation arising in the ordinary course of business. In the opinion of management, after consultation with legal counsel, the ultimate disposition of these matters is not expected to have a material effect on the financial position or results of operations of the Company.
The following table summarizes our outstanding commitments to originate loans and to advance additional amounts pursuant to outstanding letters of credit, lines of credit and the undisbursed portion of construction loans at December 31, 2009.
| (dollars in thousands) |
Less Than One Year |
One to Three Years |
Three to Five Years |
Over Five Years |
Total | ||||||||||
| Unused commercial lines of credit |
$ | 15,187 | $ | 10 | $ | — | $ | — | $ | 15,197 | |||||
| Unused personal lines of credit |
2,704 | 10,218 | 42 | — | 12,964 | ||||||||||
| Undisbursed portion of loans in process |
29,598 | — | — | — | 29,598 | ||||||||||
| Standby letters of credit |
730 | — | — | — | 730 | ||||||||||
| Total |
$ | 48,219 | $ | 10,228 | $ | 42 | $ | — | $ | 58,489 | |||||
The Company has entered into a leasing arrangement to support the ongoing activities of the Company. The required payments under such commitments and other contractual cash commitments at December 31, 2009 are shown in the following table.
| (dollars in thousands) |
2010 | 2011 | 2012 | 2013 | 2014 | Thereafter | Total | ||||||||||||||
| Operating leases |
$ | 5 | $ | — | $ | — | $ | — | $ | — | $ | — | $ | 5 | |||||||
| Certificates of deposit |
99,865 | 40,388 | 7,459 | 3,876 | 1,518 | 1,328 | 154,434 | ||||||||||||||
| Long-term FHLB advances |
5,774 | — | 1,000 | — | — | 10,000 | 16,774 | ||||||||||||||
| Total |
$ | 105,644 | $ | 40,388 | $ | 8,459 | $ | 3,876 | $ | 1,518 | $ | 11,328 | $ | 171,213 | |||||||
38
Table of Contents
IMPACT OF INFLATION AND CHANGING PRICES
The financial statements, accompanying notes, and related financial data of the Company presented herein have been prepared in accordance with generally accepted accounting principles, which require the measurement of financial position and operating results in terms of historical dollars without considering the changes in purchasing power of money over time due to inflation. The impact of inflation is reflected in the increased cost of operations. Most of our assets and liabilities are monetary in nature; therefore, the impact of interest rates has a greater impact on its performance than the effects of general levels of inflation. Interest rates do not necessarily move in the same direction or to the same extent as the prices of goods and services.
| Item 7A. | Quantitative and Qualitative Disclosures about Market Risk. |
The information contained in the section captioned “Management’s Discussion and Analysis of Financial Condition and Results of Operations – Asset/Liability Management and Market Risk” in Item 7 hereof is incorporated herein by reference.
39
Table of Contents
| Item 8. | Financial Statements and Supplementary Data. |
To the Board of Directors
Home Bancorp, Inc.
Lafayette, Louisiana
We have audited the accompanying consolidated balance sheet of Home Bancorp, Inc. and subsidiary (“the Company”) as of December 31, 2009, and the related consolidated statements of income, shareholders’ equity and cash flows for the year then ended. These financial statements are the responsibility of the Company’s management. Our responsibility is to express an opinion on these financial statements based on our audit.
We conducted our audit in accordance with the standards of the Public Company Accounting Oversight Board (United States). Those standards require that we plan and perform the audit to obtain reasonable assurance about whether the financial statements are free of material misstatement. An audit includes examining, on a test basis, evidence supporting the amounts and disclosures in the financial statements. An audit also includes assessing the accounting principles used and significant estimates made by management, as well as evaluating the overall financial statement presentation. We believe that our audit provides a reasonable basis for our opinion.
In our opinion, the 2009 consolidated financial statements referred to above present fairly, in all material respects, the financial position of Home Bancorp, Inc. and subsidiary as of December 31, 2009, and the results of their operations and their cash flows for the year then ended in conformity with accounting principles generally accepted in the United States of America.
We have also audited, in accordance with the standards of the Public Company Accounting Oversight Board (United States), Home Bancorp, Inc. and subsidiary’s internal control over financial reporting as of December 31, 2009, based on criteria established in Internal Control—Integrated Framework issued by the Committee of Sponsoring Organizations of the Treadway Commission and our report dated March 12, 2010, expressed an unqualified opinion on the effectiveness of the Company’s internal control over financial reporting.
/s/ Porter Keadle Moore LLP
Atlanta, Georgia
March 12, 2010
40
Table of Contents
To the Board of Directors
Home Bancorp, Inc.
Lafayette, Louisiana
We have audited Home Bancorp, Inc. and subsidiary’s (the “Company”) internal control over financial reporting as of December 31, 2009, based on criteria established in Internal Control—Integrated Framework issued by the Committee of Sponsoring Organizations of the Treadway Commission (“COSO”). The Company’s management is responsible for maintaining effective internal control over financial reporting and for its assessment of the effectiveness of internal control over financial reporting included in the accompanying Management’s Report on Internal Controls over Financial Reporting. Our responsibility is to express an opinion on the Company’s internal control over financial reporting based on our audit.
We conducted our audit in accordance with the standards of the Public Company Accounting Oversight Board (United States). Those standards require that we plan and perform the audit to obtain reasonable assurance about whether effective internal control over financial reporting was maintained in all material respects. Our audit included obtaining an understanding of internal control over financial reporting, assessing the risk that a material weakness exists, and testing and evaluating the design and operating effectiveness of internal control based on the assessed risk. Our audit also included performing such other procedures as we considered necessary in the circumstances. We believe that our audit provides a reasonable basis for our opinion.
A company’s internal control over financial reporting is a process designed to provide reasonable assurance regarding the reliability of financial reporting and the preparation of financial statements for external purposes in accordance with generally accepted accounting principles. A company’s internal control over financial reporting includes those policies and procedures that (1) pertain to the maintenance of records that, in reasonable detail, accurately and fairly reflect the transactions and dispositions of the assets of the Company; (2) provide reasonable assurance that transactions are recorded as necessary to permit preparation of financial statements in accordance with generally accepted accounting principles, and that receipts and expenditures of the Company are being made only in accordance with authorizations of management and directors of the Company; and (3) provide reasonable assurance regarding prevention or timely detection of unauthorized acquisition, use, or disposition of the Company’s assets that could have a material effect on the financial statements.
Because of its inherent limitations, internal control over financial reporting may not prevent or detect misstatements. Also, projections of any evaluation of effectiveness to future periods are subject to the risk that controls may become inadequate because of changes in conditions, or that the degree of compliance with the policies or procedures may deteriorate.
In our opinion, Home Bancorp, Inc. and subsidiary maintained effective internal control over financial reporting as of December 31, 2009, based on criteria established in Internal Control—Integrated Framework issued by COSO.
We have also audited, in accordance with the standards of the Public Company Accounting Oversight Board (United States), the consolidated balance sheet of Home Bancorp, Inc. and subsidiary as of December 31, 2009, and the related statements of income, shareholders’ equity and cash flows for the year then ended, and our report dated March 12, 2010, expressed an unqualified opinion on those consolidated financial statements.
/s/ Porter Keadle Moore LLP
Atlanta, Georgia
March 12, 2010
41
Table of Contents
The Board of Directors and Shareholders
Home Bancorp, Inc.
We have audited the accompanying consolidated balance sheets of Home Bancorp, Inc. as of December 31, 2008, and the related consolidated statements of income, shareholders’ equity, and cash flows for the years ended December 31, 2008 and 2007. These financial statements are the responsibility of the Company’s management. Our responsibility is to express an opinion on these financial statements based on our audits.
We conducted our audits in accordance with the standards of the Public Company Accounting Oversight Board (United States). Those standards require that we plan and perform the audit to obtain reasonable assurance about whether the financial statements are free of material misstatement. We were not engaged to perform an audit of the Company’s internal control over financial reporting. Our audits included consideration of internal control over financial reporting as a basis for designing audit procedures that are appropriate in the circumstances, but not for the purpose of expressing an opinion on the effectiveness of the Company’s internal control over financial reporting. Accordingly, we express no such opinion. An audit also includes examining, on a test basis, evidence supporting the amounts and disclosures in the financial statements, assessing the accounting principles used and significant estimates made by management, and evaluating the overall financial statement presentation. We believe that our audits provide a reasonable basis for our opinion.
In our opinion, the financial statements referred to above present fairly, in all material respects, the consolidated financial position of Home Bancorp, Inc. at December 31, 2008, and the consolidated results of its operations and its cash flows for each of the years ended December 31, 2008 and 2007, in conformity with U.S. generally accepted accounting principles.
/s/ Ernst & Young LLP
New Orleans, Louisiana
March 27, 2009
42
Table of Contents
HOME BANCORP, INC. AND SUBSIDIARY
CONSOLIDATED BALANCE SHEETS
| December 31, | ||||||||
| 2009 | 2008 | |||||||
| Assets |
||||||||
| Cash and cash equivalents |
$ | 25,709,597 | $ | 20,150,248 | ||||
| Interest-bearing deposits in banks |
3,529,000 | 1,685,000 | ||||||
| Cash invested at other ATM locations |
— | 24,243,780 | ||||||
| Investment securities available for sale, at fair value |
106,752,131 | 114,235,261 | ||||||
| Investment securities held to maturity (fair values of $13,176,934 and $4,134,153, respectively) |
13,098,847 | 4,089,466 | ||||||
| Mortgage loans held for sale |
719,350 | 996,600 | ||||||
| Loans, net of unearned income |
336,647,292 | 335,568,071 | ||||||
| Allowance for loan losses |
(3,351,688 | ) | (2,605,889 | ) | ||||
| Loans, net |
333,295,604 | 332,962,182 | ||||||
| Office properties and equipment, net |
16,186,690 | 15,325,997 | ||||||
| Cash surrender value of bank-owned life insurance |
15,262,645 | 5,268,817 | ||||||
| Accrued interest receivable and other assets |
10,081,885 | 9,439,637 | ||||||
| Total Assets |
$ | 524,635,749 | $ | 528,396,988 | ||||
| Liabilities |
||||||||
| Deposits: |
||||||||
| Noninterest-bearing |
$ | 66,955,475 | $ | 67,047,799 | ||||
| Interest-bearing |
304,637,272 | 287,097,306 | ||||||
| Total deposits |
371,592,747 | 354,145,105 | ||||||
| Short-term Federal Home Loan Bank advances |
— | 21,500,000 | ||||||
| Long-term Federal Home Loan Bank advances |
16,773,802 | 22,920,795 | ||||||
| Accrued interest payable and other liabilities |
3,519,896 | 2,868,362 | ||||||
| Total Liabilities |
391,886,445 | 401,434,262 | ||||||
| Shareholders’ Equity |
||||||||
| Preferred stock, $0.01 par value—10,000,000 shares authorized; none issued |
— | — | ||||||
| Common stock, $0.01 par value—40,000,000 shares authorized; 8,926,875 shares issued; 8,774,975 and 8,926,875 shares outstanding, respectively |
89,270 | 89,270 | ||||||
| Additional paid-in capital |
88,072,884 | 87,182,281 | ||||||
| Treasury stock at cost—151,900 shares at December 31, 2009 |
(1,848,862 | ) | — | |||||
| Unallocated common stock held by: |
||||||||
| Employee Stock Ownership Plan (ESOP) |
(6,695,150 | ) | (7,052,230 | ) | ||||
| Recognition and Retention Plan (RRP) |
(4,218,320 | ) | — | |||||
| Retained earnings |
57,437,444 | 52,055,071 | ||||||
| Accumulated other comprehensive loss |
(87,962 | ) | (5,311,666 | ) | ||||
| Total Shareholders’ Equity |
132,749,304 | 126,962,726 | ||||||
| Total Liabilities and Shareholders’ Equity |
$ | 524,635,749 | $ | 528,396,988 | ||||
The accompanying Notes are an integral part of these Financial Statements.
43
Table of Contents
HOME BANCORP, INC. AND SUBSIDIARY
CONSOLIDATED STATEMENTS OF INCOME
| Years Ended December 31, | ||||||||||||
| 2009 | 2008 | 2007 | ||||||||||
| Interest Income |
||||||||||||
| Loans, including fees |
$ | 22,321,209 | $ | 21,790,163 | $ | 20,809,447 | ||||||
| Investment securities |
6,569,756 | 4,283,960 | 2,667,979 | |||||||||
| Other investments and deposits |
1,005,353 | 1,354,627 | 1,947,548 | |||||||||
| Total interest income |
29,896,318 | 27,428,750 | 25,424,974 | |||||||||
| Interest Expense |
||||||||||||
| Deposits |
5,529,181 | 7,903,313 | 9,626,217 | |||||||||
| Short-term borrowings |
37,799 | 331,387 | 78,045 | |||||||||
| Long-term debt |
769,700 | 512,550 | 204,054 | |||||||||
| Total interest expense |
6,336,680 | 8,747,250 | 9,908,316 | |||||||||
| Net interest income |
23,559,638 | 18,681,500 | 15,516,658 | |||||||||
| Provision for loan losses |
864,880 | 459,212 | 419,872 | |||||||||
| Net interest income after provision for loan losses |
22,694,758 | 18,222,288 | 15,096,786 | |||||||||
| Noninterest Income |
||||||||||||
| Service fees and charges |
1,849,746 | 1,668,757 | 1,513,299 | |||||||||
| Bank card fees |
1,089,811 | 933,788 | 583,813 | |||||||||
| Gain on sale of loans, net |
610,952 | 254,456 | 311,744 | |||||||||
| Income from bank-owned life insurance |
292,125 | 262,202 | 6,615 | |||||||||
| Gain (loss) on sale of real estate owned, net |
38,538 | (15,635 | ) | (4,140 | ) | |||||||
| Impairment of investment securities |
(1,888,381 | ) | (2,832,920 | ) | — | |||||||
| Other income |
109,069 | 127,525 | 104,687 | |||||||||
| Total noninterest income |
2,101,860 | 398,173 | 2,516,018 | |||||||||
| Noninterest Expense |
||||||||||||
| Compensation and benefits |
10,827,537 | 8,834,026 | 8,030,392 | |||||||||
| Occupancy |
1,296,592 | 1,207,675 | 1,248,221 | |||||||||
| Marketing and advertising |
633,530 | 607,550 | 664,502 | |||||||||
| Data processing and communication |
1,402,290 | 1,370,101 | 1,228,576 | |||||||||
| Professional services |
896,552 | 410,377 | 297,005 | |||||||||
| Forms, printing and supplies |
378,097 | 358,236 | 376,749 | |||||||||
| Franchise and shares tax |
609,689 | — | — | |||||||||
| Regulatory fees |
596,305 | 154,407 | 140,173 | |||||||||
| ATM losses |
— | 867,389 | — | |||||||||
| Other expenses |
1,167,157 | 925,256 | 917,122 | |||||||||
| Total noninterest expense |
17,807,749 | 14,735,017 | 12,902,740 | |||||||||
| Income before income tax expense |
6,988,869 | 3,885,444 | 4,710,064 | |||||||||
| Income tax expense |
2,309,268 | 1,169,852 | 1,387,359 | |||||||||
| Net Income |
$ | 4,679,601 | $ | 2,715,592 | $ | 3,322,705 | ||||||
| Earnings per share: |
||||||||||||
| Basic |
$ | 0.58 | $ | 1.32 | N/A | |||||||
| Diluted |
$ | 0.58 | $ | 1.32 | N/A | |||||||
The accompanying Notes are an integral part of these Financial Statements.
44
Table of Contents
HOME BANCORP, INC. AND SUBSIDIARY
CONSOLIDATED STATEMENTS OF CHANGES IN SHAREHOLDERS’ EQUITY
| Common Stock |
Additional Paid-in Capital |
Treasury Stock |
Unallocated Common Stock Held by ESOP |
Unallocated Common Stock Held by RRP |
Retained Earnings |
Accumulated Other Comprehensive Income (Loss) |
Total | |||||||||||||||||||||||
| Balance, December 31, 2006 |
$ | — | $ | — | $ | — | $ | — | $ | — | $ | 46,016,774 | $ | (160,469 | ) | $ | 45,856,305 | |||||||||||||
| Comprehensive income: |
||||||||||||||||||||||||||||||
| Net income |
3,322,705 | 3,322,705 | ||||||||||||||||||||||||||||
| Change in unrealized gain (loss) on securities available for sale, net of taxes |
204,110 | 204,110 | ||||||||||||||||||||||||||||
| Total comprehensive income |
3,526,815 | |||||||||||||||||||||||||||||
| Balance, December 31, 2007 |
$ | — | $ | — | $ | — | $ | — | $ | — | $ | 49,339,479 | $ | 43,641 | $ | 49,383,120 | ||||||||||||||
| Comprehensive income: |
||||||||||||||||||||||||||||||
| Net income |
2,715,592 | 2,715,592 | ||||||||||||||||||||||||||||
| Change in unrealized gain (loss) on securities available for sale, net of taxes (see Note 17) |
(5,355,307 | ) | (5,355,307 | ) | ||||||||||||||||||||||||||
| Total comprehensive income |
(2,639,715 | ) | ||||||||||||||||||||||||||||
| Issuance of common stock for initial public offering, net |
89,270 | 87,181,799 | 87,271,069 | |||||||||||||||||||||||||||
| Shares purchased for ESOP |
(7,141,500 | ) | (7,141,500 | ) | ||||||||||||||||||||||||||
| ESOP shares released for allocation |
482 | 89,270 | 89,752 | |||||||||||||||||||||||||||
| Balance, December 31, 2008 |
$ | 89,270 | $ | 87,182,281 | $ | — | $ | (7,052,230 | ) | $ | — | $ | 52,055,071 | $ | (5,311,666 | ) | $ | 126,962,726 | ||||||||||||
| Comprehensive income: |
||||||||||||||||||||||||||||||
| Net income |
4,679,601 | 4,679,601 | ||||||||||||||||||||||||||||
| Change in unrealized gain (loss) on securities available for sale, net of taxes (see Note 17) |
5,223,704 | 5,223,704 | ||||||||||||||||||||||||||||
| Total comprehensive income |
9,903,305 | |||||||||||||||||||||||||||||
| Cumulative effect adjustment (see Note 4) |
702,772 | 702,772 | ||||||||||||||||||||||||||||
| Cost of issuance of common stock |
(13,895 | ) | (13,895 | ) | ||||||||||||||||||||||||||
| Common stock purchased for Recognition and Retention Plan |
(4,218,320 | ) | (4,218,320 | ) | ||||||||||||||||||||||||||
| Treasury stock acquired at cost, 151,900 shares |
(1,848,862 | ) | (1,848,862 | ) | ||||||||||||||||||||||||||
| ESOP shares released for allocation |
47,917 | 357,080 | 404,997 | |||||||||||||||||||||||||||
| Stock-based compensation cost |
856,581 | 856,581 | ||||||||||||||||||||||||||||
| Balance, December 31, 2009 |
$ | 89,270 | $ | 88,072,884 | $ | (1,848,862 | ) | $ | (6,695,150 | ) | $ | (4,218,320 | ) | $ | 57,437,444 | $ | (87,962 | ) | $ | 132,749,304 | ||||||||||
The accompanying Notes are an integral part of these Financial Statements.
45
Table of Contents
HOME BANCORP, INC. AND SUBSIDIARY
CONSOLIDATED STATEMENTS OF CASH FLOWS
| Years Ended December 31, | ||||||||||||
| 2009 | 2008 | 2007 | ||||||||||
| Cash flows from operating activities: |
||||||||||||
| Net income |
$ | 4,679,601 | $ | 2,715,592 | $ | 3,322,705 | ||||||
| Adjustments to reconcile net income to net cash provided by operating activities: |
||||||||||||
| Provision for loan losses |
864,880 | 459,212 | 419,872 | |||||||||
| Depreciation |
885,967 | 813,916 | 867,603 | |||||||||
| Mortgage servicing amortization |
30,971 | 22,344 | 53,399 | |||||||||
| Provision for mortgage servicing amortization |
— | 1,187 | 3,464 | |||||||||
| Federal Home Loan Bank stock dividends |
(4,500 | ) | (36,000 | ) | (38,800 | ) | ||||||
| Net amortization of premium/discount on investments |
(934,484 | ) | 1,981,079 | 34,255 | ||||||||
| Impairment of investment securities |
1,888,381 | 2,832,920 | — | |||||||||
| (Gain) loss on sale of real estate owned, net |
(38,538 | ) | 15,635 | 4,140 | ||||||||
| Gain on loans sold, net |
(610,952 | ) | (254,456 | ) | (311,744 | ) | ||||||
| Proceeds, including principal payments, from loans held for sale |
74,114,660 | 36,055,638 | 32,827,942 | |||||||||
| Originations of loans held for sale |
(73,226,458 | ) | (35,623,132 | ) | (32,085,398 | ) | ||||||
| Non-cash compensation |
1,261,578 | 89,752 | — | |||||||||
| Deferred income tax provision (benefit) |
(1,553,290 | ) | (1,161,779 | ) | (435,351 | ) | ||||||
| Increase in interest receivable and other assets |
(3,099,741 | ) | (46,793 | ) | (795,095 | ) | ||||||
| Increase in cash surrender value of bank-owned life insurance |
(292,125 | ) | (262,202 | ) | (6,615 | ) | ||||||
| (Increase) decrease in accrued interest payable and other liabilities |
477,655 | 320,510 | (62,550 | ) | ||||||||
| Net cash provided by operating activities |
4,443,605 | 7,923,423 | 3,797,827 | |||||||||
| Cash flows from investing activities: |
||||||||||||
| Purchases of securities available for sale |
(20,560,805 | ) | (88,859,623 | ) | (20,454,451 | ) | ||||||
| Purchases of securities held to maturity |
(13,150,000 | ) | (400,000 | ) | (1,020,000 | ) | ||||||
| Proceeds from payments on securities available for sale |
36,074,241 | 16,694,391 | 17,528,988 | |||||||||
| Proceeds from maturities and calls of securities available for sale |
— | 2,000,000 | 9,315 | |||||||||
| Proceeds from payments on securities held to maturity |
955,927 | 1,000,978 | 1,863,339 | |||||||||
| Proceeds from maturities and calls of securities held to maturity |
3,180,000 | — | — | |||||||||
| (Increase) decrease in cash invested at other ATM locations |
24,243,780 | (7,101,029 | ) | (3,428,664 | ) | |||||||
| Net increase in loans |
(1,198,302 | ) | (27,153,375 | ) | (25,430,225 | ) | ||||||
| (Increase) decrease in certificates of deposit in other institutions |
(1,844,000 | ) | 1,582,000 | (98,000 | ) | |||||||
| Proceeds from sale of real estate owned |
695,908 | — | 17,360 | |||||||||
| Purchases of office properties and equipment |
(1,748,074 | ) | (4,452,333 | ) | (2,160,557 | ) | ||||||
| Purchases of bank-owned life insurance |
(9,701,703 | ) | — | (5,000,000 | ) | |||||||
| Purchases of Federal Home Loan Bank stock |
(206,700 | ) | (2,624,100 | ) | (718,300 | ) | ||||||
| Proceeds from redemption of Federal Home Loan Bank stock |
655,900 | 1,518,200 | 705,500 | |||||||||
| Net cash provided by (used in) investing activities |
17,396,172 | (107,794,891 | ) | (38,185,695 | ) | |||||||
| Cash flows from financing activities: |
||||||||||||
| Increase in deposits |
17,447,642 | 608,706 | 7,286,080 | |||||||||
| Proceeds from Federal Home Loan Bank advances |
576,600,000 | 726,688,000 | 98,004,304 | |||||||||
| Payments on Federal Home Loan Bank advances |
(604,246,993 | ) | (699,150,641 | ) | (86,555,693 | ) | ||||||
| Proceeds from issuance of common stock |
— | 89,268,751 | — | |||||||||
| Cost of issuance of common stock |
(13,895 | ) | (1,997,682 | ) | — | |||||||
| Repurchase of common stock for recognition and retention plan |
(4,218,320 | ) | — | — | ||||||||
| Purchase of treasury stock |
(1,848,862 | ) | — | — | ||||||||
| Stock purchased for employee stock ownership plan |
— | (7,141,500 | ) | — | ||||||||
| Net cash provided by (used in) financing activities |
(16,280,428 | ) | 108,275,634 | 18,734,691 | ||||||||
| Net change in cash and cash equivalents |
5,559,349 | 8,404,166 | (15,653,177 | ) | ||||||||
| Cash and cash equivalents at beginning of year |
20,150,248 | 11,746,082 | 27,399,259 | |||||||||
| Cash and cash equivalents at end of year |
$ | 25,709,597 | $ | 20,150,248 | $ | 11,746,082 | ||||||
| Supplementary cash flow information: |
||||||||||||
| Interest paid on deposits and borrowed funds |
$ | 6,359,280 | $ | 8,757,929 | $ | 9,896,398 | ||||||
| Income taxes paid |
3,770,158 | 2,449,279 | 2,123,793 | |||||||||
The accompanying Notes are an integral part of these Financial Statements.
46
Table of Contents
HOME BANCORP, INC. AND SUBSIDIARY
NOTES TO CONSOLIDATED FINANCIAL STATEMENTS
1. Description of Business
Home Bancorp, Inc., a Louisiana Corporation (“Company”), was organized by Home Bank (“Bank”) in May 2008 to facilitate the conversion of the Bank from the mutual to the stock form (“Conversion”) of ownership. The Conversion was completed on October 2, 2008, at which time the Company became the holding company for the Bank, with the Company owning all of the issued and outstanding shares of the Bank’s common stock. Shares of the Company’s common stock were issued and sold in an offering to certain depositors of the Bank. As a result of the offering, the Company issued 8,926,875 shares of its common stock and raised $87,168,000 in net proceeds. The Company was newly organized and owned no assets during any period prior to October 2, 2008. Therefore, the financial information for any period prior to October 2, 2008 presented in this report is that of the Bank only.
Home Bank is a federally chartered stock savings bank. The Bank was officially chartered in 1908 as a Louisiana state chartered savings association. The Bank converted to a federal mutual savings bank charter in 1993. The Bank currently conducts business from its main office as well as eleven additional full-service banking offices in the Lafayette metropolitan area and Baton Rouge, Louisiana.
The Bank is primarily engaged in attracting deposits from the general public and using those funds to invest in loans and securities. The Bank’s principal sources of funds are customer deposits, repayments of loans, repayments of investments and funds borrowed from outside sources such as the Federal Home Loan Bank (“FHLB”) of Dallas. The Bank derives its income principally from interest earned on loans and investment securities and, to a lesser extent, from fees received in connection with the origination of loans, service charges on deposit accounts and for other services. The Bank’s primary expenses are interest expense on deposits and borrowings and general operating expenses.
The Bank is regulated by the Office of Thrift Supervision (“OTS”) and its deposits are insured to the maximum amount permissible under federal law by the Federal Deposit Insurance Corporation (“FDIC”).
2. Summary of Significant Accounting Policies
Principles of Consolidation
The consolidated financial statements include the accounts of Home Bancorp, Inc. and its wholly-owned subsidiary, Home Bank. All significant intercompany balances and transactions have been eliminated in consolidation.
Use of Estimates
The preparation of financial statements in conformity with accounting principles generally accepted in the United States requires management to make estimates and assumptions that affect the reported amounts of assets and liabilities and disclosure of contingent assets and liabilities at the date of the financial statements and the reported amounts of revenues and expenses during the reporting period. Actual results could differ from those estimates. Material estimates that are particularly susceptible to significant change in the near term include, but are not limited to, the determination of the allowance for loan losses, income taxes, valuation of investments with other-than-temporary impairment and valuation of share-based compensation.
Cash and Cash Equivalents
For purposes of reporting cash flows, cash and cash equivalents include cash on hand, due from banks, and interest-bearing deposits with the FHLB. The Company considers all highly liquid debt instruments with original maturities of three months or less (excluding interest-bearing deposits in banks) to be cash equivalents.
47
Table of Contents
The Bank is required to maintain reserve requirements with the Federal Reserve Bank. The requirement is dependent upon the Bank’s cash on hand or noninterest-bearing balances. The reserve requirements at December 31, 2009 and December 31, 2008 were $3,711,000 and $1,953,000, respectively.
Investment Securities
The Company follows the guidance under the topic of investments – debt and equity securities issued by the Financial Accounting Standards Board (“FASB”) Accounting Standards Codification (“ASC”). This standard addresses the accounting and reporting for investments in equity securities that have readily determinable fair values and for all investments in debt securities. Under the topic, investment securities, which the Company both positively intends and has the ability to hold to maturity, are carried at amortized cost.
Investment securities that are acquired with the intention of being resold in the near term are classified under the ASC topic on trading securities and are carried at fair value, with unrealized holding gains and losses recognized in current earnings. The Company does not currently hold any securities for trading purposes.
Securities not meeting the criteria of either trading securities or held to maturity are classified as available for sale and are carried at fair value. Unrealized holding gains and losses for these securities are recognized, net of related income tax effects, as a separate component of the Company’s shareholders’ equity.
Interest income earned on securities either held to maturity or available for sale is included in current earnings, including the amortization of premiums and the accretion of discounts using the interest method. Premiums and discounts are amortized or accreted over the life of the related security as an adjustment to the yield. The gain or loss realized on the sale of securities classified as available for sale and held to maturity, as determined using the specific identification method for determining the cost of the securities sold, is computed with reference to its amortized cost and is also included in current earnings.
The Company reviews investment securities for other-than-temporary impairment on a quarterly basis. Impairment is considered to be other-than-temporary if it is likely that all amounts contractually due will not be received for debt securities and when there is no positive evidence indicating that an investment’s carrying amount is recoverable in the near term for equity securities. When a decline in the fair value of available for sale and held to maturity securities below cost is deemed to be credit related, a charge for other-than-temporary impairment is included in earnings as “Impairment of investment securities”. The decline in value attributed to non-credit related factors is recognized in other comprehensive income and a new cost basis for the security is established. The new cost basis is not changed for subsequent recoveries in fair value. Increases in fair value above cost on available for sale securities are reflected net of tax in shareholders’ equity and are included in other comprehensive income. In evaluating whether impairment is temporary or other-than-temporary, the Company considers, among other things, the time period the security has been in an unrealized loss position; the financial condition of the issuer and its industry; recommendations of investment advisors; economic forecasts; market or industry trends; changes in tax laws, regulations, or other governmental policies significantly affecting the issuer; any downgrades from rating agencies; and any reduction or elimination of dividends. The Company’s intent and ability to hold a security for a period of time sufficient to allow for any anticipated recovery in fair value is also considered.
Loans Held for Sale
The Company sells mortgage loans and loan participations for an amount equal to the principal amount of loans or participations with yields to investors based upon the current market rate. Realized gains and losses related to loan sales are included in noninterest income.
For financial reporting purposes, the Company classifies a portion of its loan portfolio as “Mortgage loans held for sale.” Included in this category are loans which the Company has the current intent to sell and loans which are available to be sold in the event that the Company determines that loans should be sold to support the Company’s
48
Table of Contents
investment and liquidity objectives, as well as to support its overall asset and liability management strategies. Loans included in this category for which the Company has the current intention to sell are recorded at the lower of aggregate cost or fair value. As of December 31, 2009 and December 31, 2008, the Company had $719,000 and $997,000, respectively, in loans classified as “Mortgage loans held for sale.”
As of December 31, 2009 and December 31, 2008, the Company had $24,047,000 and $15,970,000, respectively, outstanding in loans sold to government agencies that it was servicing.
Loans
Discounts on loan originations and purchased loans are amortized using the level yield interest method over the remaining contractual life of the loan.
Nonrefundable loan origination fees, net of direct loan origination costs, are deferred and recognized over the life of the loan as an adjustment of yield using the interest method.
The Company allocates the cost to acquire or originate a mortgage loan between the loan and the right to service the loan if it intends to sell or securitize the loan and retain the servicing rights. In addition, the Company periodically assesses capitalized mortgage servicing rights for impairment based on the fair value of such rights. To the extent that temporary impairment exists, write-downs are recognized in current earnings as an adjustment to the corresponding valuation allowance. Permanent impairment is recognized through a write-down of the asset with a corresponding reduction in the valuation allowance. For purposes of performing its impairment evaluation, the portfolio is stratified on the basis of certain risk characteristics, including loan type and interest rates. Capitalized servicing rights are amortized over the period of, and in proportion to, estimated net servicing income, which considers appropriate prepayment assumptions.
The amount of capitalized mortgage servicing rights for the years ended December 31, 2009 and December 31, 2008 was not material.
Interest on loans receivable is accrued as earned. Interest on loans deemed uncollectible is excluded from income. The accrual of interest is discontinued and reversed against current income once loans become at least 90 days past due. The past due status of loans is determined based on the contractual terms. Loans are returned to accrual status when all past due payments are received in full and future payments are probable.
Allowance for Loan Losses
The allowance for loan losses is maintained at an amount which management deems adequate to cover estimated probable losses on loans receivable. The allowance for loan losses is comprised of specific and general reserves. The Company determines specific reserves based on the provisions of ASC Topic on Receivables. The Company’s allowance for loan losses includes a measure of impairment related to those loans identified for evaluation under the topic. This measurement is based on a comparison of the recorded investment in the loan with either the expected cash flows discounted using the loan’s original effective interest rate, observable market price for the loan or the fair value of the collateral underlying certain collateral-dependent loans. General reserves are based on management’s evaluation of many factors, including current economic trends, industry experience, historical loss experience, industry loan concentrations, the borrowers’ abilities to repay and repayment performance, probability of foreclosure, and estimated collateral values. As these factors change, adjustments to the loan loss reserve are charged to current operations. Loans and related accrued interest that are determined to be uncollectible are charged-off against the allowance for loan losses once that determination is made.
While management uses available information to make loan loss allowance evaluations, adjustments to the allowance may be necessary based on changes in economic and other conditions or changes in accounting guidance. The OTS, as an integral part of its examination processes, periodically reviews the allowance for loan losses. The OTS may require the recognition of adjustments to the allowance for loan losses based on their
49
Table of Contents
judgment of information available to them at the time of their examinations. To the extent that actual outcomes differ from management’s estimates, additional provisions to the allowance for loan losses may be required at the time of their examination.
Other Real Estate Owned
Other real estate owned (“OREO”) property is carried at the lower of book value or fair value less estimated selling costs. Costs relating to the development and improvement of OREO property are capitalized, and costs relating to holding and maintaining the property are expensed. Write-downs from cost to fair value at the dates of foreclosure are charged against the allowance for loan losses. Valuations are periodically performed and an allowance for loss is established by a charge to operations if the carrying value of a property exceeds its fair value less selling costs. As of December 31, 2009, and December 31, 2008, the Company had $417,000 and $37,000 of OREO, respectively.
Federal Home Loan Bank Stock
As a member of the FHLB, the Bank is required to maintain a minimum level of investment in capital stock of the FHLB based on specific percentages of its outstanding FHLB advances, total assets, and mortgages. The Bank’s investment in FHLB stock is carried at par value ($100 per share), which reasonably approximates its fair value, as excess stock amounts held are redeemed quarterly at par by the FHLB. As of December 31, 2009, and December 31, 2008, the Company had $1,641,000 and $2,085,000 of FHLB stock, respectively.
Office Properties and Equipment
Office properties and equipment are stated at cost less accumulated depreciation. Depreciation is computed using the straight-line method with rates based on the estimated useful lives of the individual assets, which range from 3 to 40 years. Expenditures which substantially increase the useful lives of existing property and equipment are capitalized while routine expenditures for repairs and maintenance are expensed as incurred.
Cash Surrender Value of Bank-Owned Life Insurance
Life insurance contracts represent single premium life insurance contracts on the lives of certain officers of the Bank. The Bank is the beneficiary of these policies. These contracts are reported at their cash surrender value and changes in the cash surrender value are included in other noninterest income.
Salary Continuation Agreements
The Company records the expense associated with its salary continuation agreements over the service periods of the persons covered under these agreements.
Income Taxes
The Company accounts for income taxes under the liability method. Deferred tax assets and liabilities are established for the temporary differences between the financial reporting basis and the tax basis of the Company’s assets and liabilities using enacted tax rates expected to be in effect during the year in which the differences in basis reverse.
The Company does not believe it has any material unrecognized tax benefits included in its financial statements. The Company has not had any settlements in the current period with taxing authorities, nor has it recognized tax benefits as a result of a lapse of the applicable statute of limitations.
The Company recognizes interest and penalties accrued related to unrecognized tax benefits, if applicable, in noninterest expense. During the years ended December 31, 2009, December 31, 2008, and December 31, 2007, the Company did not recognize any interest or penalties in its financial statements, nor has it recorded an accrued liability for interest or penalty payments.
50
Table of Contents
Stock-based Compensation Plans
The Company issues stock options under the 2009 Stock Option Plan to directors, officers and other key employees. In accordance with the requirements of the ASC topic on Stock-based Compensation, the Company has adopted a fair value based method of accounting for employee stock compensation plans, whereby compensation cost is measured at the grant date based on the value of the award and is recognized over the service period, which is usually the vesting period.
The Company issues restricted stock under the 2009 Recognition and Retention Plan (“RRP”) for directors, officers and other key employees. The RRP allows for the issuance of restricted stock awards that may not be sold or otherwise transferred until certain restrictions have lapsed. The holders of the restricted stock have the right to vote the shares as awards are earned. The unearned compensation related to these awards is amortized to compensation expense over the service period, which is usually the vesting period. The total share-based compensation expense for these awards is determined based on the market price of the Company’s common stock at the date of grant applied to the total number of shares granted and is amortized over the vesting period.
Earnings Per Share
Earnings per share represent income available to common shareholders divided by the weighted-average number of common shares outstanding during the period. Diluted earnings per share reflect additional common shares that would have been outstanding if dilutive potential common shares had been issued, as well as any adjustment to income that would result from the assumed issuance.
Comprehensive Income (Loss)
Generally accepted accounting principles (“GAAP”) generally require that recognized revenues, expenses, gains, and losses be included in net earnings. Although certain changes in assets and liabilities, such as unrealized gains and losses on available for sale securities, are reported as a separate component of the equity section of the balance sheets, such items, along with net earnings, are components of comprehensive income. The Company presents comprehensive income in its statements of shareholders’ equity.
Reclassifications
Certain reclassifications have been made to prior period balances to conform to the current period presentation.
Recent Accounting Pronouncements
In June 2009, the FASB issued Accounting Standards Update (“ASU”) No. 2009-01, Topic 105 – Generally Accepted Accounting Principles amendments based on Statement of Financial Accounting Standards No. 168 – The FASB Accounting Standards Codification and the Hierarchy of Generally Accepted Accounting Principles. ASU 2009-01 amends the ASC for the issuance of FASB Statement (“SFAS”) No. 168, The FASB Accounting Standards Codification and the Hierarchy of Generally Accepted Accounting Principles. ASU 2009-1 includes SFAS 168 in its entirety, including the accounting standards update instructions contained in Appendix B of the Statement. The ASC became the source of authoritative U.S. generally accepted accounting principles (“GAAP”) recognized by the FASB to be applied by nongovernmental entities. Rules and interpretive releases of the Securities Exchange Committee (“SEC”) under authority of federal securities laws are also sources of authoritative GAAP for SEC registrants. As of the effective date of this Statement, September 15, 2009, the ASC supersedes all then-existing non-SEC accounting and reporting standards. All other non-grandfathered non-SEC accounting literature not included in the ASC is no longer authoritative. This Statement became effective for the Company’s financial statements beginning in the interim period ended September 30, 2009.
In April 2009, the FASB issued guidance under ASC topic 825. The guidance requires disclosures about fair value of financial instruments for interim reporting periods of publicly traded companies as well as in annual financial statements. This guidance was adopted for interim reporting periods ending after June 15, 2009.
51
Table of Contents
In April 2009, the FASB issued guidance under ASC topic 320 on Investments – Debt and Equity Securities that provides additional guidance designed to create greater clarity and consistency in accounting for and presenting impairment losses on securities. Upon adoption at April 1, 2009, the Company recognized a cumulative effect adjustment in retained earnings from accumulated other comprehensive income to reclassify other-than-temporary impairments previously taken under the former authoritative accounting guidance for securities held as of April 1, 2009. In accordance with the guidance, the Company determined that of the $2,833,000 in other-than-temporary impairments previously recorded in earnings on investments available for sale held as of April 1, 2009, $1,065,000 of these impairments were not considered other-than-temporary impairments under the guidance. As a result, the Company increased the amortized cost basis of these investments available for sale by $1,065,000. The cumulative effect adjustment resulted in a decrease in accumulated other comprehensive income and an increase in retained earnings totaling $703,000 (net of tax). The cumulative effect adjustment had no net effect on the Company’s shareholders’ equity or previously reported net income (loss).
In April 2009, the FASB issued authoritative guidance under ASC topic 805 on Consolidation that provides additional guidance regarding the recognition, measurement and disclosure of assets and liabilities arising from contingencies in a business combination. This guidance is effective for assets or liabilities arising from contingencies in business combinations for which the acquisition date is on or after the beginning of the first annual reporting period beginning on or after December 15, 2008. The impact of adopting this guidance will depend on the timing of future acquisitions, as well as the nature and existence of contingencies associated with such acquisitions, if any.
In May 2009, the FASB issued guidance under ASC topic 855 on Subsequent Events that establishes general standards of accounting for and disclosures of events that occur after the balance sheet date but before financial statements are issued or are available to be issued. It requires entities to disclose the date through which it has evaluated subsequent events and the basis for that date. Topic 855 sets forth (i) the period after the balance sheet date during which management of a reporting entity should evaluate events or transactions that may occur for potential recognition or disclosure in the financial statements, (ii) the circumstances under which an entity should recognize events or transactions occurring after the balance sheet date in its financial statements and (iii) the disclosures that an entity should make about events or transactions that occurred after the balance sheet date. This guidance was effective for interim and annual periods ending after June 15, 2009.
In June 2009, the FASB issued guidance under ASC topic 860 on Transfers and Servicing to improve the relevance, representational faithfulness, and comparability of the information that a reporting entity provides in its financial reports about a transfer of financial assets; the effects of a transfer on its financial position, financial performance, and cash flows; and a transferor’s continuing involvement in transferred financial assets. The most significant change is the elimination of the concept of a qualifying special-purpose entity. Therefore, formerly qualifying special-purpose entities (as defined under previous accounting standards) should be evaluated for consolidation by reporting entities on and after the effective date in accordance with the applicable consolidation guidance. The guidance is effective on January 1, 2010. The Company does not anticipate that the guidance will have a material impact on its consolidated financial statements.
The FASB will no longer issue new standards in the form of Statements, FASB Staff Positions, or Emerging Issues Task Force (“EITF”) Abstracts. Instead, it now issues Accounting Standards Updates. The FASB does not consider Accounting Standards Updates as authoritative in their own right. Accounting Standards Updates serve only to update the ASC, provide background information about the guidance, and provide the bases for conclusions on the change(s) in the ASC. FASB Statement No. 162, The Hierarchy of Generally Accepted Accounting Principles, which became effective on November 13, 2008, identified the sources of accounting principles and the framework for selecting the principles used in preparing the financial statements of nongovernmental entities that are presented in conformity with GAAP. SFAS 162 arranged these sources of GAAP in a hierarchy for users to apply accordingly. Upon becoming effective, all of the content of the ASC carries the same level of authority, effectively superseding SFAS 162. In other words, the GAAP hierarchy has been modified to include only two levels of GAAP: authoritative and non-authoritative. As a result, this
52
Table of Contents
Statement replaces SFAS 162 to indicate this change to the GAAP hierarchy. The adoption of the ASC and ASU 2009-01 did not have any effect on the Company’s results of operations or financial position. All references to accounting literature included in the notes to the financial statements have been changed to reference the appropriate sections of the ASC.
In June 2009, the FASB issued Accounting Standards Update No. 2009-02, Omnibus Update – Amendments to Various Topics for Technical Corrections. The adoption of ASU 2009-02 did not have a material effect on the Company’s results of operations, financial position or disclosures.
In August 2009, the FASB issued Accounting Standards Update No. 2009-03, SEC Update – Amendments to Various Topics Containing SEC Staff Accounting Bulletins. ASU 2009-03 represents technical corrections to various topics containing SEC Staff Accounting Bulletins to update cross-references to ASC text. This ASU did not have a material effect on the Company’s results of operations, financial position or disclosures.
In August 2009, the FASB issued Accounting Standards Update No. 2009-04, Accounting for Redeemable Equity Instruments – Amendment to Section 480-10-S99. ASU 2009-04 represents an update to Section 480-10-S99, Distinguishing Liabilities from Equity, per Emerging Issues Task Force Topic D-98, Classification and Measurement of Redeemable Securities. ASU 2009-04 did not have a material effect on the Company’s results of operations, financial position or disclosures.
In August 2009, the FASB issued Accounting Standards Update No. 2009-05, Fair Value Measurements and Disclosures (Topic 820) – Measuring Liabilities at Fair Value. ASU 2009-05 applies to all entities that measure liabilities at fair value within the scope of ASC Topic 820. ASU 2009-05 provides clarification that in circumstances in which a quoted price in an active market for the identical liability is not available, a reporting entity is required to measure fair value using one or more of the following techniques:
| 1) | A valuation technique that uses: |
| a. | The quoted price of the identical liability when traded as an asset |
| b. | Quoted prices for similar liabilities or similar liabilities when traded as assets. |
| 2) | Another valuation technique that is consistent with the principles of ASC Topic 820. An example would be an income approach, such as a technique that is based on the amount at the measurement date that the reporting entity would pay to transfer the identical liability or would receive to enter into the identical liability. |
The amendments in ASU 2009-5 also clarify that when estimating the fair value of a liability, a reporting entity is not required to include a separate input or adjustment to other inputs relating to the existence of a restriction that prevents the transfer of the liability. It also clarifies that both a quoted price in an active market for the identical liability at the measurement date and the quoted price for the identical liability when traded as an asset in an active market when no adjustments to the quoted price of the asset are required are Level 1 fair value measurements. The guidance provided in ASU 2009-5 became effective for the Company in the fourth quarter of 2009. Because the Company does not currently have any liabilities that are recorded at fair value, the adoption of this guidance did not have any impact on the Company’s results of operations, financial position or disclosures.
In January 2010, the FASB issued Accounting Standards Update No. 2010-06, Fair Value Measurements and Disclosures (Topic 820) – Improving Disclosures about Fair Value Measurements. ASU 2010-06 amends Subtopic 820-10 with new disclosure requirements and clarification of existing disclosure requirements. New disclosures required include the amount of significant transfers in and out of levels 1 and 2 fair value measurements and the reasons for the transfers. In addition, the reconciliation for level 3 activity will be required on a gross rather than net basis. The ASU provides additional guidance related to the level of disaggregation in determining classes of assets and liabilities and disclosures about inputs and valuation techniques. The amendments are effective for annual or interim reporting periods beginning after December 15, 2009, except for the requirement to provide the reconciliation for level 3 activity on a gross basis which will be effective for fiscal years beginning after December 15, 2010.
53
Table of Contents
3. Cash Invested at ATM Locations
The Bank previously entered into contracts with various counterparties to provide cash for ATMs at approximately 1,200 locations throughout the United States. The contracts ranged in terms up to two years and contained options to extend the contracts for certain periods. During the year ended December 31, 2009, the Bank allowed these contracts to expire. The Bank collected all cash invested in the ATMs except for an $867,000 cash shortfall, which was recognized as a loss in the year ended December 31, 2008. The maximum amounts outstanding under these agreements were $28,729,000 and $31,937,000 during 2009 and 2008, respectively. Under the terms of these agreements, the Bank retained ownership of the cash in the ATM at all times. The Bank had accrued receivables associated with these contracts of approximately $104,000 as of December 31, 2008.
4. Investment Securities
Summary information regarding investment securities classified as available for sale and held to maturity as of December 31, 2009 and December 31, 2008 follows.
| (dollars in thousands) |
Amortized Cost |
Gross Unrealized Gains |
Gross Unrealized Losses |
Fair Value | |||||||||||
| Less Than 1 Year |
Over 1 Year |
||||||||||||||
| December 31, 2009 |
|||||||||||||||
| Available for sale: |
|||||||||||||||
| U.S. agency mortgage-backed |
$ | 60,338 | $ | 1,786 | $ | 31 | $ | 1 | $ | 62,092 | |||||
| Non-U.S. agency mortgage-backed |
39,707 | 262 | — | 2,116 | 37,853 | ||||||||||
| U.S. government agency |
6,840 | — | — | 33 | 6,807 | ||||||||||
| Total available for sale |
$ | 106,885 | $ | 2,048 | $ | 31 | $ | 2,150 | $ | 106,752 | |||||
| Held to maturity: |
|||||||||||||||
| U.S. agency mortgage-backed |
$ | 5,735 | $ | 46 | $ | — | $ | — | $ | 5,781 | |||||
| Municipal bonds |
1,364 | 75 | — | — | 1,439 | ||||||||||
| U.S. government agency |
6,000 | — | 43 | — | 5,957 | ||||||||||
| Total held to maturity |
$ | 13,099 | $ | 121 | $ | 43 | $ | — | $ | 13,177 | |||||
| (dollars in thousands) |
Amortized Cost |
Gross Unrealized Gains |
Gross Unrealized Losses |
Fair Value | |||||||||||
| Less Than 1 Year |
Over 1 Year |
||||||||||||||
| December 31, 2008 |
|||||||||||||||
| Available for sale: |
|||||||||||||||
| U.S. agency mortgage-backed |
$ | 71,175 | $ | 613 | $ | 307 | $ | 1 | $ | 71,480 | |||||
| Non-U.S. agency mortgage-backed |
51,108 | 56 | 8,339 | 70 | 42,755 | ||||||||||
| Total available for sale |
$ | 122,283 | $ | 669 | $ | 8,646 | $ | 71 | $ | 114,235 | |||||
| Held to maturity: |
|||||||||||||||
| U.S. agency mortgage-backed |
$ | 2,545 | $ | 25 | $ | — | $ | — | $ | 2,570 | |||||
| Municipal bonds |
1,544 | 25 | 5 | — | 1,564 | ||||||||||
| Total held to maturity |
$ | 4,089 | $ | 50 | $ | 5 | $ | — | $ | 4,134 | |||||
Management evaluates securities for other-than-temporary impairment at least quarterly, and more frequently when economic and market conditions warrant such evaluations. Consideration is given to (1) the extent and
54
Table of Contents
length of time the fair value has been below cost; (2) the reasons for the decline in value; (3) the Company’s intent to sell a security or whether it is more likely than not we will be required to sell the security before the recovery of its amortized cost, which may extend to maturity and our ability and intent to hold the security for a period of time that allows for the recovery in value in the case of equity securities.
The Company developed a process to identify securities that could potentially have a credit impairment that is other-than-temporary. This process involves evaluating each security for impairment by monitoring credit performance, collateral type, collateral geography, bond credit support, loan-to-value ratios, credit scores, loss severity levels, pricing levels, downgrades by rating agencies, cash flow projections and other factors as indicators of potential credit issues. The Company performs a credit analysis based on different credit scenarios at least quarterly to detect impairment on its investment securities. When the Company determines that a security is deemed to be other than temporarily impaired, an impairment loss is recognized.
During the years ended December 31, 2009 and December 31, 2008, management’s assessment of its investment securities concluded the decline in the fair values of certain non-agency (or private-label) mortgage-back securities were other-than-temporary. During 2009 and 2008, the Company recorded pre-tax impairment charges of $1,888,000 and $2,833,000, respectively, associated with the credit deterioration of those securities. Additionally, management concluded that the unrealized losses of its investment securities summarized in the table above are not deemed to be other-than-temporary.
The FASB’s ASC topic on debt and equity securities was updated to provide additional guidance designed to create greater clarity and consistency in accounting for and presenting impairment losses on securities. Upon adoption of the new guidance on April 1, 2009, the Company recognized a cumulative effect adjustment in retained earnings from accumulated other comprehensive income to reclassify other-than-temporary impairments previously taken under the former authoritative accounting guidance for securities held as of April 1, 2009. In accordance with the guidance, the Company determined that of the $2,833,000 in other-than-temporary impairments recorded in 2008 on investments available for sale as of April 1, 2009, $1,065,000 of these impairments were no longer considered other-than-temporary. As a result, the Company increased the amortized cost basis of these investments available for sale by $1,065,000. The cumulative effect adjustment resulted in a decrease in accumulated other comprehensive income and an increase in retained earnings totaling $703,000 (net of tax). The cumulative effect adjustment had no net effect on the Company’s shareholders’ equity or previously reported net income.
At December 31, 2009, 27 debt securities had unrealized losses of 5.6% of the securities’ amortized cost basis and 1.9% of the Company’s total amortized cost basis. The unrealized losses for the 27 securities primarily relate to increasing delinquencies and defaults in the mortgage loans underlying certain non-agency mortgage-backed securities. 18 of the 27 securities have been in a continuous loss position for over twelve months. The 18 securities have an aggregate amortized cost basis and unrealized loss of $21,567,000 and $2,117,000 respectively. As management has the intent and ability to hold debt securities until maturity, or until anticipated recovery if classified as available for sale, except as noted above, no declines in these 18 securities are deemed to be other-than-temporary.
At December 31, 2008, 80 debt securities had unrealized losses of 12.1% of the securities’ amortized cost basis and 7.1% of the Company’s total amortized cost basis. The unrealized losses for the 80 securities primarily relate to increasing delinquencies and defaults in the mortgage loans underlying certain non-agency mortgage-backed securities. Nine of the 80 securities have been in a continuous loss position for over twelve months. The nine securities have an aggregate amortized cost basis and unrealized loss of $6,823,000 and $1,457,000 respectively. As management has the intent and ability to hold debt securities until maturity, or until anticipated recovery if classified as available for sale, except as noted above, no declines in these 80 securities are deemed to be other-than-temporary.
55
Table of Contents
The amortized cost and estimated fair value by maturity of investment securities at December 31, 2009 are shown in the following table. Securities are classified according to their contractual maturities without consideration of principal amortization, potential prepayments or call options. The expected maturity of a security, in particular certain U.S. agency securities and obligations of states and political subdivisions, may differ from its contractual maturity because of the exercise of call options and potential paydowns. Accordingly, actual maturities may differ from contractual maturities.
| (dollars in thousands) |
After One Year through Five Years |
After Five Years through Ten Years |
After Ten Years |
Total | ||||||||
| Fair Value |
||||||||||||
| Securities available for sale: |
||||||||||||
| U.S. agency mortgage-backed |
$ | 4,690 | $ | 3,836 | $ | 53,566 | $ | 62,092 | ||||
| Non-U.S. agency mortgage-backed |
— | 3,531 | 34,322 | 37,853 | ||||||||
| U.S. government agency |
— | — | 6,807 | 6,807 | ||||||||
| Total securities available for sale |
$ | 4,690 | $ | 7,367 | $ | 94,695 | $ | 106,752 | ||||
| Securities held to maturity: |
||||||||||||
| U.S. agency mortgage-backed |
$ | 3,766 | $ | 2,015 | $ | — | $ | 5,781 | ||||
| Municipal bonds |
636 | 803 | — | 1,439 | ||||||||
| U.S. government agency |
2,981 | 2,976 | — | 5,957 | ||||||||
| Total securities held to maturity |
$ | 7,383 | $ | 5,794 | $ | — | $ | 13,177 | ||||
| (dollars in thousands) |
After One Year through Five Years |
After Five Years through Ten Years |
After Ten Years |
Total | ||||||||
| Amortized Cost |
||||||||||||
| Securities available for sale: |
||||||||||||
| U.S. agency mortgage-backed |
$ | 4,569 | $ | 3,761 | $ | 52,008 | $ | 60,338 | ||||
| Non-U.S. agency mortgage-backed |
— | 3,488 | 36,219 | 39,707 | ||||||||
| U.S. government agency |
— | — | 6,840 | 6,840 | ||||||||
| Total securities available for sale |
$ | 4,569 | $ | 7,249 | $ | 95,067 | $ | 106,885 | ||||
| Securities held to maturity: |
||||||||||||
| U.S. agency mortgage-backed |
$ | 3,726 | $ | 2,009 | $ | — | $ | 5,735 | ||||
| Municipal bonds |
605 | 759 | — | 1,364 | ||||||||
| U.S. government agency |
3,000 | 3,000 | — | 6,000 | ||||||||
| Total securities held to maturity |
$ | 7,331 | $ | 5,768 | $ | — | $ | 13,099 | ||||
At December 31, 2009 and December 31, 2008, the Company had accrued interest receivable for investment securities of $450,000 and $639,000, respectively.
At December 31, 2009 and December 31, 2008, the Company had $7,793,000 and $6,447,000, respectively, of securities pledged against public deposits.
56
Table of Contents
5. Loans
Loans consisted of the following as of December 31 of the years indicated.
| (dollars in thousands) |
2009 | 2008 | ||||
| Real estate loans: |
||||||
| One- to four-family first mortgage |
$ | 120,044 | $ | 138,173 | ||
| Home equity loans and lines |
24,678 | 23,127 | ||||
| Commercial real estate |
97,513 | 84,096 | ||||
| Construction and land |
35,364 | 35,399 | ||||
| Multi-family residential |
4,089 | 7,142 | ||||
| Total real estate loans |
281,688 | 287,937 | ||||
| Other loans: |
||||||
| Commercial |
38,340 | 34,434 | ||||
| Consumer |
16,619 | 13,197 | ||||
| Total other loans |
54,959 | 47,631 | ||||
| Total loans |
$ | 336,647 | $ | 335,568 | ||
A summary of activity in the allowance for loan losses for the years ended December 31, 2009, 2008 and 2007 is as follows.
| (dollars in thousands) |
2009 | 2008 | 2007 | |||||||||
| Balance, beginning of period |
$ | 2,606 | $ | 2,314 | $ | 2,008 | ||||||
| Provision |
865 | 459 | 420 | |||||||||
| Loans charged-off |
(141 | ) | (212 | ) | (125 | ) | ||||||
| Recoveries |
22 | 45 | 11 | |||||||||
| Balance, end of period |
$ | 3,352 | $ | 2,606 | $ | 2,314 | ||||||
The following is a summary of information pertaining to impaired loans as of December 31:
| (dollars in thousands) |
2009 | 2008 | 2007 | ||||||
| Impaired loans without a valuation allowance |
$ | 1,829 | $ | 1,050 | $ | 1,101 | |||
| Impaired loans with a valuation allowance |
958 | 443 | 241 | ||||||
| Total impaired loans |
2,787 | 1,493 | 1,342 | ||||||
| Valuation allowance related to impaired loans |
472 | 122 | 44 | ||||||
| Average investment in impaired loans |
$ | 2,142 | $ | 1,360 | $ | 1,077 | |||
| Interest income recognized on impaired loans |
116 | 62 | 8 | ||||||
| Nonaccrual loans |
1,278 | 1,427 | 1,295 | ||||||
| Accruing loans more than 90 days past due |
— | — | — | ||||||
As of December 31, 2009, the Company was not committed to lend additional funds to any customer whose loan was classified as impaired.
At December 31, 2009 and December 31, 2008, the Company had accrued interest receivable for loans of $1,584,000 and $1,667,000, respectively.
57
Table of Contents
6. Loan Servicing
Mortgage loans sold to and serviced for others are not included in the accompanying statements of financial condition. The unpaid principal balances of these loans as of December 31 of the years indicated are summarized as follows.
| (dollars in thousands) |
2009 | 2008 | 2007 | ||||||
| Mortgage loans sold to Federal Home Loan Mortgage Corporation without recourse |
$ | 10,566 | $ | 13,409 | $ | 16,124 | |||
| Mortgage loans sold to Federal National Mortgage Association without recourse |
13,481 | 2,561 | 1,663 | ||||||
| Balance, end of period |
$ | 24,047 | $ | 15,970 | $ | 17,787 | |||
Custodial and escrow account balances maintained in connection with the foregoing loan servicing arrangements were $104,000 and $84,000 as of December 31, 2009 and December 31, 2008, respectively.
7. Office Properties and Equipment
Office properties and equipment consisted of the following as of December 31 of the years indicated.
| (dollars in thousands) |
2009 | 2008 | ||||
| Land |
$ | 4,544 | $ | 4,568 | ||
| Buildings and improvements |
13,157 | 12,102 | ||||
| Furniture and equipment |
6,568 | 5,871 | ||||
| Total office properties and equipment |
24,269 | 22,541 | ||||
| Less accumulated depreciation |
8,082 | 7,215 | ||||
| Total office properties and equipment, net |
$ | 16,187 | $ | 15,326 | ||
Depreciation expense for the years ended December 31, 2009, 2008 and 2007 was $886,000, $814,000, and $868,000, respectively.
8. Deposits
Deposits consisted of the following major classifications as of December 31 of the years indicated.
| (dollars in thousands) |
2009 | 2008 | ||||
| Demand deposit accounts |
$ | 66,956 | $ | 67,047 | ||
| Savings |
21,009 | 19,741 | ||||
| Money market accounts |
80,810 | 68,850 | ||||
| NOW accounts |
48,384 | 42,200 | ||||
| Certificates of deposit |
154,434 | 156,307 | ||||
| Total deposits |
$ | 371,593 | $ | 354,145 | ||
At December 31, 2009, the scheduled maturities of certificates of deposit are as follows.
| (dollars in thousands) |
Amount | ||
| 2010 |
$ | 99,865 | |
| 2011 |
40,388 | ||
| 2012 |
7,459 | ||
| 2013 |
3,876 | ||
| 2014 |
1,518 | ||
| Thereafter |
1,328 | ||
| Total certificates of deposit |
$ | 154,434 | |
58
Table of Contents
At December 31, 2009 and December 31, 2008, the aggregate amount of certificates of deposit with balances of $100,000 or more was $64,022,000 and $60,421,000, respectively.
9. Short-term Advances
The Company did not have any short-term advances outstanding at December 31, 2009. Short-term advances totaling $21,500,000 at December 31, 2008 consisted of advances from the FHLB. These advances, which mature within one year, had a weighted average rate of 0.80% for the year ended December 31, 2008.
Collateral for short and long-term FHLB advances is secured through a blanket lien evidenced by the Bank’s pledge of first mortgage collateral, demand deposit accounts, capital stock, and certain other assets pursuant to the “Advances, Collateral Pledge and Security Agreement.” Under this collateral pledge agreement, the Bank must meet all statutory and regulatory capital standards and must meet all FHLB credit underwriting standards. Management believes that the Bank is in compliance with all such requirements as of December 31, 2009 and December 31, 2008.
As of December 31, 2009 and December 31, 2008, the Bank had $205,712,000 and $176,600,000, respectively, of additional FHLB advances available.
10. Long-term Advances
At December 31, 2009 and December 31, 2008, long-term advances consisted of advances from the FHLB totaling $16,774,000 and $22,921,000, respectively. The following table summarizes this debt as of December 31, 2009.
| (dollars in thousands) |
Amount | Weighted Average Rate |
||||
| Fixed rate advances maturing in: |
||||||
| 2010 |
$ | 5,774 | 4.34 | % | ||
| 2011 |
— | — | ||||
| 2012 |
1,000 | 2.75 | ||||
| 2013 |
— | — | ||||
| 2014 and thereafter |
10,000 | 3.22 | ||||
| Total long-term advances |
$ | 16,774 | 3.58 | % | ||
11. Income Taxes
The Company files federal income tax returns on a calendar year basis. Income tax expense for the years indicated is summarized as follows.
| (dollars in thousands) |
2009 | 2008 | 2007 | |||||||||
| Current |
$ | 3,405 | $ | 2,332 | $ | 1,823 | ||||||
| Deferred |
(1,096 | ) | (1,162 | ) | (436 | ) | ||||||
| Total income tax expense |
$ | 2,309 | $ | 1,170 | $ | 1,387 | ||||||
59
Table of Contents
The components of the Company’s net deferred tax asset at December 31 of the years indicated are as follows.
| (dollars in thousands) |
2009 | 2008 | ||||||
| Deferred tax assets (liabilities): |
||||||||
| FHLB stock dividends |
$ | (26 | ) | $ | (34 | ) | ||
| Loan loss reserves |
720 | 347 | ||||||
| Accumulated depreciation |
(446 | ) | (404 | ) | ||||
| Unrealized (gain) loss on securities available for sale |
45 | 2,736 | ||||||
| Mortgage servicing rights |
(26 | ) | (6 | ) | ||||
| Deferred compensation |
184 | 158 | ||||||
| Stock-based compensation |
291 | — | ||||||
| Other-than-temporary impairment of securities |
1,414 | 963 | ||||||
| Other |
53 | (51 | ) | |||||
| Deferred tax asset |
$ | 2,209 | $ | 3,709 | ||||
For the years ended December 31, 2009, 2008 and 2007, the provision for federal income taxes differed from the amount computed by applying the federal income tax statutory rate of 34% on income from operations as indicated in the following analysis:
| (dollars in thousands) |
2009 | 2008 | 2007 | |||||||||
| Federal tax based on statutory rate |
$ | 2,376 | $ | 1,321 | $ | 1,601 | ||||||
| State tax based on statutory rate |
84 | — | — | |||||||||
| Decrease resulting from: |
||||||||||||
| Effect of tax-exempt income |
(19 | ) | (48 | ) | (9 | ) | ||||||
| Tax credits |
(23 | ) | (91 | ) | (138 | ) | ||||||
| Other |
(109 | ) | (12 | ) | (67 | ) | ||||||
| Income tax expense |
$ | 2,309 | $ | 1,170 | $ | 1,387 | ||||||
| Effective tax rate |
33.0 | % | 30.1 | % | 29.5 | % | ||||||
Retained earnings at December 31, 2009, December 31, 2008 and December 31, 2007, included $5,837,000 for which no deferred federal income tax liability has been recognized. This amount represents an allocation of income to bad debt deductions for tax purposes only. Reductions of amounts so allocated for purposes other than bad debt losses would create income for tax purposes only, which would be subject to the then-current federal statutory income tax rate. The unrecorded deferred income tax liability on the above amount was $1,985,000 at December 31, 2009, 2008, and 2007. Current accounting standards do not require the accrual of this deferred tax amount to be recorded unless it is probable that the reserve (for tax purposes) will be significantly depleted by loan losses deductible for tax purposes in the future. Based on current estimates of losses within the Company’s loan portfolio, accrual of the deferred tax liability associated with this reserve was not required as of December 31, 2009, 2008, and 2007.
12. Commitments and Contingencies
Standby letters of credit represent commitments by the Bank to meet the obligations of certain customers if called upon. As of December 31, 2009 and December 31, 2008, outstanding standby letters of credit were approximately $730,000 and $1,034,000, respectively.
Additionally, in the normal course of business, there were various other commitments and contingent liabilities which are not reflected in the financial statements. Loan commitments are single-purpose commitments to lend which will be funded and reduced according to specified repayment schedules. Most of these commitments have maturities of less than one year. Loan commitments outstanding were approximately $45,100,000 and $53,400,000 as of December 31, 2009 and December 31, 2008, respectively. Unused availability under
60
Table of Contents
outstanding lines-of-credit was approximately $28,161,000 and $24,493,000 as of December 31, 2009 and December 31, 2008, respectively. The Bank uses the same credit policies in making commitments as it does for on-balance-sheet instruments. The Bank normally secures its outstanding standby letters of credit with deposits from the customer. The Bank evaluates each customer’s creditworthiness on a case-by-case basis. The amount of collateral obtained, if deemed necessary by the Bank upon extension of credit, is based on management’s credit evaluation of the customer. Collateral held varies but may include certificates of deposit, property, plant and equipment, and income-producing properties. There are no commitments which present an unusual risk to the Bank, and no material losses are anticipated as a result of these transactions.
In early 2007, various lawsuits were filed against the Bank alleging the claimants incurred losses during 2006 as a result of the Bank accepting deposits with forged endorsements from a customer. The Bank’s Fidelity Bond insurance policy includes a deductible of $100,000. This deductible was recorded as an expense in 2006. The Bank, its legal representative, and its insurer are collaborating to resolve by settlement all cases associated with this matter based on the individual facts and circumstances of all interested parties. Settlements are being funded by the insurer. If the Bank’s insurer were not funding these settlements, the effect on the Bank’s financial position and results of operations could be material.
13. Regulatory Matters
The Bank is subject to regulatory capital requirements administered by the OTS. Failure to meet minimum capital requirements can initiate certain mandatory and possibly additional discretionary actions by regulators that, if undertaken, could have a direct material effect on the Company’s financial statements. Under capital adequacy guidelines and the regulatory framework for prompt corrective action, the Bank must meet specific capital guidelines that involve quantitative measures of its assets, liabilities, and certain off-balance sheet items as calculated under regulatory accounting practices. The Bank’s capital amounts and classification are also subject to qualitative judgments by the regulators about components, risk weightings, and other factors.
Quantitative measures established by regulation to ensure capital adequacy require the Bank to maintain minimum amounts and ratios (set forth in the table below) of total and Tier 1 capital (as defined) to average assets (as defined). Management believes, as of December 31, 2009, that the Bank meets all capital adequacy requirements to which it is subject.
As of December 31, 2009, the most recent notification from the OTS categorized the Bank as “well capitalized” under the OTS regulatory classification framework. To be categorized as “well capitalized,” the Bank must maintain minimum total risk-based, Tier 1 risk-based, Tier 1 leverage, and tangible capital ratios as set forth in the following table. There are no conditions or events since that notification that management believes have changed the Bank’s category.
61
Table of Contents
The Bank’s actual capital amounts and ratios are also presented in the following table.
| (dollars in thousands) |
Actual | Minimum For Capital Adequacy Purposes |
To Be Well Capitalized Under Prompt Corrective Action Provisions |
|||||||||||||||
| December 31, 2009 |
||||||||||||||||||
| Tier 1 risk-based capital |
$ | 101,520 | 29.86 | % | $ | 12,972 | 4.0 | % | $ | 19,457 | 6.0 | % | ||||||
| Total risk-based capital |
99,697 | 30.74 | 25,943 | 8.0 | 32,429 | 10.0 | ||||||||||||
| Tier 1 leverage capital |
101,520 | 20.24 | 20,067 | 4.0 | 25,084 | 5.0 | ||||||||||||
| Tangible capital |
101,520 | 20.24 | 7,525 | 1.5 | N/A | N/A | ||||||||||||
| (dollars in thousands) |
Actual | Minimum For Capital Adequacy Purposes |
To Be Well Capitalized Under Prompt Corrective Action Provisions |
|||||||||||||||
| December 31, 2008 |
||||||||||||||||||
| Tier 1 risk-based capital |
$ | 95,915 | 32.50 | % | $ | 11,803 | 4.0 | % | $ | 17,705 | 6.0 | % | ||||||
| Total risk-based capital |
98,399 | 33.35 | 23,607 | 8.0 | 29,508 | 10.0 | ||||||||||||
| Tier 1 leverage capital |
95,915 | 19.10 | 20,086 | 4.0 | 25,107 | 5.0 | ||||||||||||
| Tangible capital |
95,915 | 19.10 | 7,532 | 1.5 | N/A | N/A | ||||||||||||
14. Benefit Plans
401(k) Match and Profit Sharing Plan
The Company’s 401(k) defined contribution plan allows its participants to contribute up to 75% of their pretax earnings on a tax-deferred basis up to the statutory limit, and the Company contributes a matching contribution on behalf of plan participants limited to 4% of the employees’ salaries. Additionally in 2007, the Company contributed an amount equal to 7% of each employee’s salary to the plan on their behalf regardless of whether such employees made individual contributions to the plan. During 2008, the Company contributed an amount equal to 5.25% of each eligible employee’s salary, on their behalf, to the profit sharing plan. No such contribution was made in 2009 due to the establishment of the employee stock ownership plan (“ESOP”). For the years ended December 31, 2009, December 31, 2008, and December 31, 2007, the Company made contributions of $217,000, $469,000, and $403,000, respectively, in connection with the plans, which is included in compensation and benefits expense in the accompanying statements of income.
Employee Stock Ownership Plan
In 2008, the Company established an ESOP for the benefit of all eligible employees of the Company. The leveraged ESOP is accounted for in accordance with the requirements of the FASB ASC Topic on Stock-based Compensation.
Employees of the Bank who have been employed for a six-month period and who have attained age 21 are eligible to participate in the ESOP. It is anticipated that contributions will be made to the plan in amounts necessary to amortize the debt to the Company over a period of 20 years.
Under the FASB ASC Topic guidance, unearned ESOP shares are not considered outstanding and are shown as a reduction of shareholders’ equity as unearned compensation. Dividends on unallocated ESOP shares are considered to be compensation expense. The Company recognizes compensation cost equal to the fair value of the ESOP shares during the periods in which they are committed to be released. To the extent that the fair value of the Company’s ESOP shares differ from the cost of such shares, the differential is credited to shareholders’ equity. The Company receives a tax deduction equal to the cost of the shares released. As the loan is internally leveraged, the loan receivable from the ESOP to the Company is not reported as an asset nor is the debt of the ESOP shown as a Company liability.
62
Table of Contents
Compensation cost related to the ESOP was $405,000 and $90,000 for the years ended December 31, 2009 and December 31, 2008, respectively. The fair value of the unearned ESOP shares, using the closing quoted market price per share at year end was approximately $8,161,000 and $6,876,000 at December 31, 2009 and December 31, 2008, respectively. A summary of the ESOP share allocation as of December 31, 2009 follows.
| Shares allocated, beginning of year |
8,927 | |
| Shares allocated during the year |
35,708 | |
| Shares distributed during the year |
— | |
| Allocated shares held by ESOP trust at year end |
44,635 | |
| Unallocated shares |
669,515 | |
| Total ESOP shares |
714,150 | |
Salary Continuation Agreement
As a supplement to its 401(k) retirement plan, the Bank has entered into nonqualified salary continuation agreements with two executive officers of the Bank. Under his salary continuation agreement, the Chief Executive Officer (“CEO”) will be entitled to a stated annual benefit for a period of ten years upon retirement from the Bank after attaining age 62. Benefits under the agreement vest over ten years, with 50% of this benefit having vested in 2007. In the event of early retirement, the Bank shall pay the CEO his vested benefits in 120 equal monthly installments upon his attaining age 62. Upon death during active service, the Bank shall distribute to the executive’s beneficiary an amount equal to two times his fully vested normal retirement benefit, payable in monthly installments over five years.
In the event of a separation from service within 24 months following a change in control but prior to normal retirement age, the Bank shall distribute to the CEO his fully vested annual benefit in 12 equal monthly installments for ten years beginning the earlier of 24 months after separation from service or age 62. If separation from service occurs more than 24 months following a change in control, the annual benefit shall be distributed beginning at age 62.
The Bank’s nonqualified salary continuation agreement with its Chief Lending Officer provides that the executive will be entitled to a stated annual benefit for a period of ten years upon retirement from the Bank after attaining age 65, distributed monthly. In the event of early retirement, the Bank shall pay the executive his vested benefits in 120 equal monthly installments upon attaining age 65. Upon death during active service, the Bank shall distribute the fully vested normal retirement benefit to the executive’s beneficiary in 120 monthly installments. In the event of a separation from service within 24 months following a change in control but prior to normal retirement age, the Bank shall distribute to the executive the vested portion of the annual benefit in a lump sum on the first day of the month following the separation from service. Benefits are subject to a six-month delay to the extent required by applicable law. The Company had an outstanding liability totaling $542,000 and $465,000 at December 31, 2009 and December 31, 2008, respectively, in connection with the agreements.
15. Stock-based Payment Arrangements
The Company’s shareholders approved the 2009 Stock Option Plan (“SOP”) and the 2009 Recognition and Retention Plan on May 12, 2009 to provide incentives and awards for directors, officers, and other key employees of the Company and its subsidiary. These plans are administered by a committee appointed by the Board of Directors, which selects persons eligible to receive awards and determines the number of shares and/or options subject to each award, the terms, conditions and other provisions of the awards. In accordance with the requirements of the FASB ASC Topic on Stock-based Compensation, the Company adopted a fair value based method of accounting for employee stock compensation plans, whereby compensation cost is measured at the grant date based on the value of the award and is recognized over the service period, which is usually the vesting period.
63
Table of Contents
Stock Option Plan
The Company issues stock options under the SOP to directors, officers and other key employees. The option exercise price cannot be less than the fair value of the underlying common stock as of the date of the option grant and the maximum option term cannot exceed ten years. The stock options granted were issued with vesting periods of five years. The maximum number of shares issuable under the SOP is 892,687, subject to adjustment. As of December 31, 2009, 815,080 options were granted under SOP.
The fair value of each option granted is estimated on the grant date using the Black-Scholes option pricing model. This model requires management to make certain assumptions, including the expected life of the option, the risk-free rate of interest, the expected volatility, and the expected dividend yield. The following assumptions were made in estimating 2009 fair values:
| Expected dividends |
1.5 | % | |
| Expected volatility |
34.3 | % | |
| Risk-free interest rate |
2.5 | % | |
| Expected term (in years) |
6.5 |
At December 31, 2009, there was $2,476,000 of unrecognized compensation cost related to stock options which is expected to be recognized over a period of 4.4 years.
For the year ended December 31, 2009, the Company recognized $364,000 in compensation cost related to stock options, which is included in compensation and benefits expense in the accompanying consolidated statements of income.
The following table represents stock option activity for the year ended December 31, 2009.
| Options |
Number of Shares |
Weighted- Average Exercise Price |
Weighted-Average Remaining Contractual Term (Years) |
Aggregate Intrinsic Value (in thousands) | ||||||
| Outstanding at January 1, 2009 |
— | $ | — | — | $ | — | ||||
| Granted |
815,080 | 11.45 | 603,000 | |||||||
| Outstanding at December 31, 2009 |
815,080 | $ | 11.45 | 9.4 | $ | 603,000 | ||||
| Exercisable at December 31, 2009 |
— | $ | — | — | $ | — | ||||
Recognition and Retention Plan
The Company issues restricted stock under RRP to directors, officers and other key employees. A total of 357,075 shares of the Company’s outstanding common stock, or 4% of total shares outstanding, were approved for restricted stock awards under the RRP. During 2009, the Company purchased in the open market all shares required to fund the RRP at an average cost of $11.81 per share. At December 31, 2009, the cost of such shares held by the RRP totaled $4,218,000, which is included in the Company’s unallocated common stock held by the RRP in the consolidated statements of financial condition.
The RRP allows for the issuance of restricted stock awards that may not be sold or otherwise transferred until certain restrictions have lapsed. The holders of the restricted stock have the right to vote the shares as awards are earned. The unearned compensation related to these awards is amortized to compensation expense over the five-year vesting period. The total share-based compensation expense for these awards is determined based on the market price of the Company’s common stock at the date of grant applied to the total number of shares granted and is amortized over the vesting period. As of December 31, 2009, unearned share-based compensation associated with these awards totaled $3,350,000.
64
Table of Contents
For the year ended December 31, 2009, the Company recognized $493,000 in compensation cost related to restricted stock grants, which is included in compensation and benefits expense in the accompanying consolidated financial statements.
The following table represents unvested restricted stock activity for the periods indicated:
| Years Ended December 31, | ||||
| 2009 | 2008 | |||
| Balance, beginning of year |
— | — | ||
| Granted |
335,600 | — | ||
| Balance, end of period |
335,600 | — | ||
16. Earnings Per Share
Earnings per common share was computed based on the following:
| Years Ended December 31, | |||||||||
| (in thousands, except per share data) |
2009 | 2008 | 2007 | ||||||
| Numerator: |
|||||||||
| Income applicable to common shares |
$ | 4,680 | $ | 2,716 | $ | 3,323 | |||
| Denominator: |
|||||||||
| Weighted average common shares outstanding |
8,031 | 2,054 | N/A | ||||||
| Effect of dilutive securities |
21 | — | N/A | ||||||
| Weighted average common shares outstanding—assuming dilution |
8,052 | 2,054 | N/A | ||||||
| Earnings per common share |
0.58 | 1.32 | N/A | ||||||
| Earnings per common share—assuming dilution |
0.58 | 1.32 | N/A | ||||||
The Company completed its initial public stock offering on October 2, 2008; thus, the denominator used in the earnings per share calculations for 2008 is lower than it would have been had the shares been outstanding for a full year.
17. Other Comprehensive Income (Loss)
The following is a summary of the changes in the components of other comprehensive income (loss):
| Years Ended December 31, | ||||||||||||
| (dollars in thousands) |
2009 | 2008 | 2007 | |||||||||
| Balance at beginning of year , net |
$ | (5,312 | ) | $ | 44 | $ | (160 | ) | ||||
| Change in unrealized gain (loss) on securities available for sale |
7,092 | (10,948 | ) | 309 | ||||||||
| Reclassification adjustment for net losses realized in net income |
1,888 | 2,833 | — | |||||||||
| Reclassification adjustment for cumulative effect adjustment |
(1,065 | ) | — | — | ||||||||
| Change in net unrealized gain (loss) |
7,915 | (8,115 | ) | 309 | ||||||||
| Tax effect |
(2,691 | ) | 2,759 | (105 | ) | |||||||
| Net of tax change |
5,224 | (5,356 | ) | 204 | ||||||||
| Balance in other comprehensive income (loss), net of income taxes |
$ | (88 | ) | $ | (5,312 | ) | $ | 44 | ||||
18. Related Party Transactions
Certain directors and officers of the Company have been customers of the Company for several years. Loan transactions with directors, officers, and employees are made on the same terms as those prevailing at the time for comparable loans to other persons. Loans outstanding to directors, officers, and employees totaled $2,227,000 and $3,332,000 as of December 31, 2009 and December 31, 2008, respectively. During 2009, new loans made to related parties totaled $1,204,000 and net repayments totaled $2,309,000. None of the related party loans were
65
Table of Contents
identified as impaired or exceeded 5% of shareholders’ equity for the years ended 2009 or 2008. Related party deposit accounts totaled $9,318,000 and $10,725,000 as of December 31, 2009 and December 31, 2008, respectively.
19. Fair Value Disclosures
The Company groups its financial assets and liabilities measured at fair value in three levels as required by the Fair Value Measurements and Disclosures Topic of the FASB ASC. The ASC defines the principle that fair value should be based on the assumptions market participants would use when pricing the asset or liability and establishes a fair value hierarchy that prioritizes the inputs used to develop those assumptions and measure fair value. The hierarchy requires companies to maximize the use of observable inputs and minimize the use of unobservable inputs. The three levels of inputs used to measure fair value are as follows:
| • | Level 1 – Quoted prices in active markets for identical assets or liabilities. |
| • | Level 2 – Observable inputs other than quoted prices included in Level 1, such as quoted prices for similar assets and liabilities in active markets; quoted prices for identical or similar assets and liabilities in markets that are not active; or other inputs that are observable or can be corroborated by observable market data. |
| • | Level 3 – Unobservable inputs that are supported by little or no market activity and that are significant to the fair value of the assets or liabilities. This includes certain pricing models, discounted cash flow methodologies, and similar techniques that use significant unobservable inputs. |
A description of the valuation methodologies used for instruments measured at fair value follows, as well as the classification of such instruments within the valuation hierarchy.
Securities are classified within Level 1 where quoted market prices are available in an active market. Inputs include securities that have quoted prices in active markets for identical assets. If quoted market prices are unavailable, fair value is estimated using pricing models or quoted prices of securities with similar characteristics, at which point the securities would be classified within Level 2 of the hierarchy. Examples may include certain collateralized mortgage obligations. Securities are classified within Level 3 when little or no market activity supports the fair value of the assets or liabilities.
The Company has segregated all financial assets and liabilities that are measured at fair value on a recurring basis into the most appropriate level within the fair value hierarchy based on the inputs used to determine the fair value at the measurement date in the table below.
| Fair Value Measurements Using | ||||||||||||
| (dollars in thousands) |
December 31, 2009 |
Quoted Prices in Active Markets for Identical Assets (Level 1) |
Significant Other Observable Inputs (Level 2) |
Significant Unobservable Inputs (Level 3) | ||||||||
| Available for sale securities: |
||||||||||||
| U.S. agency mortgage-backed |
$ | 62,092 | $ | — | $ | 62,092 | $ | — | ||||
| Non-U.S. agency mortgage-backed |
37,853 | — | 28,744 | 9,109 | ||||||||
| U.S. government agency |
6,807 | — | 6,807 | — | ||||||||
| Fair Value Measurements Using | ||||||||||||
| (dollars in thousands) |
December 31, 2008 |
Quoted Prices in Active Markets for Identical Assets (Level 1) |
Significant Other Observable Inputs (Level 2) |
Significant Unobservable Inputs (Level 3) | ||||||||
| Available for sale securities: |
||||||||||||
| U.S. agency mortgage-backed |
$ | 71,480 | $ | — | $ | 71,480 | $ | — | ||||
| Non-U.S. agency mortgage-backed |
42,755 | — | 42,755 | — | ||||||||
66
Table of Contents
The Company did not record any liabilities at fair value for which measurement of the fair value was made on a recurring basis.
The following table reconciles assets measured at fair value on a recurring basis using significant unobservable inputs (Level 3):
| (dollars in thousands) |
Non-U.S. agency mortgage-backed securities |
|||
| Balance at beginning of year |
$ | — | ||
| Total gains or losses (realized/unrealized) |
||||
| Included in earnings |
(1,888 | ) | ||
| Included in other comprehensive income |
— | |||
| Purchases, sales, issuances and settlements, net |
— | |||
| Transfers in and/or out of Level 3 |
10,997 | |||
| Balance at end of year |
$ | 9,109 | ||
| The amount of total gains or losses for the period included in earnings attributable to the change in unrealized gains or losses relating to assets still held at December 31, 2009 |
$ | (1,888 | ) | |
Certain assets and liabilities are measured at fair value on a non-recurring basis and therefore are not included in the table above. Impaired loans are level 2 assets measured using appraisals from external parties of the collateral less any prior liens. As of December 31, 2009 and December 31, 2008, the fair value of impaired loans was $2,315,000 and $1,371,000, respectively.
The FASB ASC topic on financial instruments requires the disclosure of each class of financial instruments for which it is practicable to estimate. The fair value of a financial instrument is the current amount that would be exchanged between willing parties, other than in a forced liquidation. Fair value is best determined based upon quoted market prices. However, in many instances, there are no quoted market prices for the Company’s various financial instruments. In cases where quoted market prices are not available, fair values are based on estimates using present value or other valuation techniques. Those techniques are significantly affected by the assumptions used, including the discount rate and estimates of future cash flows. Accordingly, the fair value estimates may not be realized in an immediate settlement of the instrument. The topic on financial instruments excludes certain financial instruments and all non-financial instruments from its disclosure requirements. Accordingly, the aggregate fair value amounts presented may not necessarily represent the underlying fair value of the Company.
The following methods and assumptions were used to estimate the fair value of each class of financial instruments for which it is practicable to estimate that value:
The carrying value of cash and cash equivalents, interest-bearing deposits in banks, and cash invested at ATM locations approximate their fair value.
The fair value for investment securities is determined from quoted market prices. If a quoted market price is not available, fair value is estimated using pricing models or quoted market prices of securities with similar characteristics.
The fair value of mortgage loans held for sale and loans are estimated by discounting the future cash flows using the current rates at which similar loans would be made to borrowers with similar credit ratings and for the same remaining maturity.
The fair value of demand deposits, savings, and interest-bearing demand deposits is the amount payable on demand. The fair value of fixed-maturity certificates of deposit is estimated by discounting the future cash flows using the rates currently offered for deposits of similar remaining maturities.
67
Table of Contents
The carrying amount of the FHLB advances is estimated using the rates currently offered for advances of similar maturities.
The fair value of off-balance sheet financial instruments as of December 31, 2009 and December 31, 2008 was immaterial.
| December 31, 2009 | December 31, 2008 | |||||||||||
| (dollars in thousands) |
Carrying Amount |
Fair Value |
Carrying Amount |
Fair Value | ||||||||
| Financial Assets: |
||||||||||||
| Cash and cash equivalents |
$ | 25,710 | $ | 25,710 | $ | 20,150 | $ | 20,150 | ||||
| Interest-bearing deposits in banks |
3,529 | 3,529 | 1,685 | 1,685 | ||||||||
| Cash invested at other ATM locations |
— | — | 24,244 | 24,244 | ||||||||
| Investment securities available for sale |
106,752 | 106,752 | 114,235 | 114,235 | ||||||||
| Investment securities held to maturity |
13,099 | 13,177 | 4,090 | 4,134 | ||||||||
| Mortgage loans held for sale |
719 | 699 | 997 | 1,042 | ||||||||
| Loans, net |
333,296 | 340,795 | 332,962 | 342,251 | ||||||||
| Financial Liabilities: |
||||||||||||
| Deposits |
$ | 371,593 | $ | 373,624 | $ | 354,145 | $ | 356,865 | ||||
| Short-term FHLB advances |
— | — | 21,500 | 21,500 | ||||||||
| Long-term FHLB advances |
16,774 | 17,011 | 22,921 | 22,921 | ||||||||
20. Condensed Parent Company Only Financial Statements
Condensed financial statements of Home Bancorp, Inc. (parent company only) are shown below. The parent company has no significant operating activities. The parent company was created October 2, 2008; thus, the statement of operations and statement of cash flows for the period October 2, 2008 to December 31, 2008 are shown.
Condensed Balance Sheet
December 31, 2009 and 2008
| (dollars in thousands) |
2009 | 2008 | ||||
| Assets |
||||||
| Cash in bank |
$ | 8,397 | $ | 1,998 | ||
| Investment securities |
23,777 | 34,594 | ||||
| Investment in subsidiary |
100,906 | 90,418 | ||||
| Other assets |
108 | 121 | ||||
| Total assets |
$ | 133,188 | $ | 127,131 | ||
| Liabilities |
$ | 439 | $ | 168 | ||
| Shareholders’ equity |
132,749 | 126,963 | ||||
| Total liabilities and shareholders’ equity |
$ | 133,188 | $ | 127,131 | ||
68
Table of Contents
Condensed Statement of Operations
For the Year Ended December 31, 2009 and the Period from October 2, 2008 to December 31, 2008
| (dollars in thousands) |
2009 | 2008 | |||||
| Operating income |
|||||||
| Interest income |
$ | 1,359 | $ | 221 | |||
| Total operating income |
1,359 | 221 | |||||
| Operating expenses |
|||||||
| Interest expense |
— | — | |||||
| Other expenses |
315 | 8 | |||||
| Total operating expenses |
315 | 8 | |||||
| Income before income tax expense and increase in equity in undistributed earnings of subsidiary |
1,044 | 213 | |||||
| Income tax expense |
410 | 72 | |||||
| Income before increase in equity in undistributed earnings of subsidiary |
634 | 141 | |||||
| Increase (decrease) in equity in undistributed earnings of subsidiary |
4,046 | (940 | ) | ||||
| Net income (loss) |
$ | 4,680 | $ | (799 | ) | ||
Condensed Statement of Cash Flows
For the Year Ended December 31, 2009 and the Period from October 2, 2008 to December 31, 2008
| (dollars in thousands) |
2009 | 2008 | ||||||
| Cash Flows from Operating Activities |
||||||||
| Net income (loss) |
$ | 4,680 | $ | (799 | ) | |||
| Adjustments to reconcile net income (loss) to net cash provided by operating activities: |
||||||||
| Net amortization of premium/discount on investments |
(59 | ) | 138 | |||||
| Non-cash compensation |
405 | 90 | ||||||
| Increase (decrease) in accrued interest and other assets |
12 | (120 | ) | |||||
| Increase (decrease) in equity in net income of subsidiary |
(4,045 | ) | 940 | |||||
| Increase in accrued expenses and other liabilities |
96 | 72 | ||||||
| Net Cash Provided by Operating Activities |
1,089 | 321 | ||||||
| Cash Flows from Investing Activities |
||||||||
| Capital contributed to subsidiary |
— | (44,000 | ) | |||||
| Purchases of available for sale securities |
— | (34,878 | ) | |||||
| Proceeds from payment on available for sale securities |
11,391 | 426 | ||||||
| Stock purchased for ESOP |
— | (7,142 | ) | |||||
| Net Cash Provided by (Used in) Investing Activities |
11,391 | (85,594 | ) | |||||
| Cash Flows from Financing Activities |
||||||||
| Common stock issued |
— | 89 | ||||||
| Proceeds from common stock in excess of par |
— | 89,179 | ||||||
| Purchase of treasury stock |
(1,849 | ) | — | |||||
| Repurchase shares for RRP |
(4,218 | ) | — | |||||
| Costs of issuance of common stock |
(14 | ) | (1,997 | ) | ||||
| Net Cash Provided by (Used in) Financing Activities |
(6,081 | ) | 87,271 | |||||
| Net Increase in Cash and Cash Equivalents |
6,399 | 1,998 | ||||||
| Cash and Cash Equivalents at Beginning of Period |
1,998 | — | ||||||
| Cash and Cash Equivalents at End of Period |
$ | 8,397 | $ | 1,998 | ||||
69
Table of Contents
21. Consolidated Quarterly Results of Operations (unaudited)
| (dollars in thousands, except per share data) |
First Quarter |
Second Quarter |
Third Quarter |
Fourth Quarter |
|||||||||
| Year Ended December 31, 2009 |
|||||||||||||
| Total interest income |
$ | 7,537 | $ | 7,734 | $ | 7,636 | $ | 6,990 | |||||
| Total interest expense |
1,670 | 1,631 | 1,558 | 1,478 | |||||||||
| Net interest income |
5,867 | 6,103 | 6,078 | 5,512 | |||||||||
| Provision for loan losses |
174 | 248 | 287 | 156 | |||||||||
| Net interest income after provision for loan losses |
5,693 | 5,855 | 5,791 | 5,356 | |||||||||
| Noninterest income |
959 | 1,006 | 949 | (813 | ) | ||||||||
| Noninterest expense |
4,007 | 4,642 | 4,669 | 4,490 | |||||||||
| Income before income taxes |
2,645 | 2,219 | 2,071 | 53 | |||||||||
| Income tax expense |
921 | 782 | 574 | 31 | |||||||||
| Net income |
$ | 1,724 | $ | 1,437 | $ | 1,497 | $ | 22 | |||||
| Earnings per share – basic |
$ | 0.21 | $ | 0.18 | $ | 0.18 | $ | — | |||||
| Earnings per share – diluted |
$ | 0.21 | $ | 0.18 | $ | 0.17 | $ | — | |||||
| (dollars in thousands, except per share data) |
First Quarter |
Second Quarter |
Third Quarter |
Fourth Quarter |
||||||||||
| Year Ended December 31, 2008 |
||||||||||||||
| Total interest income |
$ | 6,533 | $ | 6,668 | $ | 6,897 | $ | 7,331 | ||||||
| Total interest expense |
2,549 | 2,307 | 2,156 | 1,736 | ||||||||||
| Net interest income |
3,984 | 4,361 | 4,741 | 5,595 | ||||||||||
| Provision for (reversal of) loan losses |
(30 | ) | 99 | 93 | 298 | |||||||||
| Net interest income after provision for loan losses |
4,014 | 4,262 | 4,648 | 5,297 | ||||||||||
| Noninterest income |
766 | 834 | 812 | (2,014 | ) | |||||||||
| Noninterest expense |
3,236 | 3,424 | 3,352 | 4,721 | ||||||||||
| Income (loss) before income taxes |
1,544 | 1,672 | 2,108 | (1,438 | ) | |||||||||
| Income tax expense (benefit) |
525 | 568 | 716 | (639 | ) | |||||||||
| Net income (loss) |
$ | 1,019 | $ | 1,104 | $ | 1,392 | $ | (799 | ) | |||||
| Earnings (loss) per share – basic |
N/A | N/A | N/A | ($ | 0.10 | ) | ||||||||
| Earnings (loss) per share – diluted |
N/A | N/A | N/A | ($ | 0.10 | ) | ||||||||
22. Subsequent Events
On March 12, 2010, Home Bank entered into a purchase and assumption agreement with loss share arrangements with the Federal Deposit Insurance Corporation (“FDIC”) to purchase certain assets and to assume certain deposits and other liabilities of Statewide Bank, a full service community bank headquartered in Covington, Louisiana.
As a result of the transaction, Home Bank will expand its market area through Statewide Bank’s six banking offices which are located in Covington, Madisonville, Mandeville, Abita Springs, Slidell and Folsom, Louisiana. Under the terms of the agreement with the FDIC, Home Bank will acquire approximately $225 million of assets, including approximately $150 million of loans (before loan discounts). Home Bank will assume approximately $225 million in deposits and certain other liabilities. The loss sharing agreement between the FDIC and Home Bank covers substantially all acquired loans and foreclosed real estate.
70
Table of Contents
Home Bank assumed the outstanding deposits of Statewide Bank for no premium and acquired the assets at an $11.9 million discount. The FDIC will cover 80% of the losses on the disposition of loans and foreclosed real estate up to $41.0 million and it will cover 95% of the losses that exceed $41.0 million. The Company will determine the valuation and purchase price of acquired assets and liabilities upon completion of adequate valuation appraisals.
| Item 9. | Changes in and Disagreements With Accountants on Accounting and Financial Disclosure. |
Not applicable.
| Item 9A(T). | Controls and Procedures. |
Evaluation of Disclosure Controls and Procedures
Our management evaluated, with the participation of our Chief Executive Officer and Chief Financial Officer, the effectiveness of our disclosure controls and procedures (as defined in Rules 13a-15(e) and 15d-15(e) under the Securities Exchange Act of 1934) as of December 31, 2009. Based on such evaluation, our Chief Executive Officer and Chief Financial Officer have concluded that our disclosure controls and procedures are designed to ensure that information required to be disclosed by us in the reports that we file or submit under the Securities Exchange Act of 1934 is recorded, processed, summarized and reported within the time periods specified in the SEC’s rules and regulations and are operating in an effective manner.
Internal Control over Financial Reporting
The management of Home Bancorp, Inc. is responsible for establishing and maintaining adequate internal control over financial reporting. The Company’s internal control over financial reporting is a process designed under the supervision of the Company’s Chief Executive Officer and the Chief Financial Officer to provide reasonable assurance regarding the reliability of financial reporting and the preparation of the Company’s financial statements for external purposes in accordance with the accounting principles generally accepted in the United States of America. Internal control over financial reporting is defined in Rules 13a-15(f) and 15d-15(f) promulgated under the Securities Exchange Act of 1934, as amended.
The Company’s internal control systems are designed to ensure that transactions are properly authorized and recorded in the financial records and to safeguard assets from material loss or misuse. Such assurance cannot be absolute because of inherent limitations in any internal control system.
Management assessed the effectiveness of the Company’s internal control over financial reporting as of December 31, 2009 based on the criteria for effective internal control established in Internal Control – Integrated Framework issued by the Committee of Sponsoring Organizations of the Treadway Commission. Based on the assessment, management determined that the Company maintained effective internal control over financial reporting as of December 31, 2009. Our independent registered public accountants have issued an audit report on the Company’s internal control over financial reporting. This report appears on page 41.
Changes in Internal Control over Financial Reporting
No change in our internal control over financial reporting (as defined in Rules 13a-15(f) and 15(d)-15(f) under the Securities Exchange Act of 1934) occurred during the fourth fiscal quarter of 2009 that has materially affected, or is reasonably likely to materially affect, our internal control over financial reporting.
| Item 9B. | Other Information. |
Not applicable.
71
Table of Contents
| Item 10. | Directors, Executive Officers and Corporate Governance. |
The information required herein is incorporated by reference from the information contained in the sections captioned “Information with Respect to Nominees for Director, Continuing Directors and Executive Officers” and “Beneficial Ownership of Common Stock by Certain Beneficial Owners and Management – Section 16(a) Beneficial Ownership Reporting Compliance” in the Company’s definitive proxy statement for the 2010 Annual Meeting of Stockholders to be held in May 2010 (the “Proxy Statement”).
The Company has adopted a Code of Conduct and Ethics that applies to its principal executive officer and principal financial officer, as well as other officers and employees of the Company and the Bank. A copy of the Code of Ethics is available on the Company’s website at www.home24bank.com.
| Item 11. | Executive Compensation. |
The information required herein with respect to the security ownership of certain beneficial owners and management is incorporated by reference from the information contained in the sections captioned “Management Compensation” in the Proxy Statement.
Equity Compensation Plan Information. The following table provides information as of December 31, 2009 with respect to shares of common stock that may be issued under our existing equity compensation plans, which consist of the 2009 Stock Option Plan and 2009 Recognition and Retention Plan, both of which were approved by our shareholders.
| Plan Category |
Number of securities to be issued upon exercise of outstanding options, warrants and rights (a) |
Weighted-average exercise price of outstanding options, warrants and rights (b) |
Number of securities remaining available for future issuance under equity compensation plans (excluding securities reflected in column (a)) (c) | ||||||
| Equity compensation plans approved by security holders |
1,150,680 | (1) | $ | 11.45 | (1) | 99,082 | |||
| Equity compensation plans not approved by security holders |
— | — | — | ||||||
| Total |
1,150,680 | $ | 11.45 | 99,082 | |||||
| (1) | Includes 357,075 shares subject to restricted stock grants which were not vested as of December 31, 2009. The weighted-average exercise price excludes such restricted stock grants. |
| Item 12. | Security Ownership of Certain Beneficial Owners and Management and Related Stockholder Matters. |
The information required herein is incorporated by reference from the information contained in the section captioned “Beneficial Ownership of Common Stock by Certain Beneficial Owners and Management” in the Proxy Statement.
| Item 13. | Certain Relationships and Related Transactions, and Director Independence. |
The information required herein is incorporated by reference from the information contained in the sections captioned “Management Compensation – Related Party Transactions” and “Information with Respect to Nominees for Director, Continuing Directors and Executive Officers” in the Proxy Statement.
| Item 14. | Principal Accounting Fees and Services. |
The information required herein is incorporated by reference from the information contained in the sections captioned “Ratification of Appointment of Independent Registered Public Accounting Firm” in the Proxy Statement.
72
Table of Contents
| Item 15. | Exhibits and Financial Statement Schedules. |
| (a)(1) | The following financial statements are incorporated by reference from Item 8 hereof: |
Report of Independent Registered Public Accounting Firm
Consolidated Statements of Financial Condition
Consolidated Statements of Income
Consolidated Statements of Changes in Shareholders’ Equity
Consolidated Statements of Cash Flows
Notes to Consolidated Financial Statements
| (2) | All schedules are omitted because they are not required or applicable, or the required information is shown in the consolidated financial statements or the notes thereto. |
| (3) | Exhibits |
The following exhibits are filed as part of this Form 10-K and this list includes the Exhibit Index.
| No. |
Description |
Location | ||
| 3.1 | Articles of Incorporation of Home Bancorp, Inc. | (1) | ||
| 3.2 | Amended and Restated Bylaws of Home Bancorp, Inc. | (2) | ||
| 4.0 | Form of Stock Certificate of Home Bancorp, Inc. | (1) | ||
| 10.1 | Salary Continuation Agreement by and between Home Bank and John W. Bordelon* | (1) | ||
| 10.2 | Salary Continuation Agreement by and between Home Bank and Darren E. Guidry* | (1) | ||
| 10.3 | Amendment No. 1 to the Salary Continuation Agreement by and between Home Bank and John W. Bordelon* |
(3) | ||
| 10.4 | Amendment No. 1 to the Salary Continuation Agreement by and between Home Bank and Darren E. Guidry* |
(3) | ||
| 10.5 | Amended and Restated Employment Agreement between Home Bank and L.J. Dailey* | (4) | ||
| 10.6 | 2005 Directors’ Deferral Plan* | (3) | ||
| 10.7 | Employment agreement by and between Home Bank and John W. Bordelon* | (5) | ||
| 10.8 | Employment agreement by and between Home Bancorp, Inc. and John W. Bordelon* | (5) | ||
| 10.9 | Employment Agreement by and between Home Bank and Darren E. Guidry* | (5) | ||
| 10.10 | Employment Agreement by and between Home Bank and Scott T. Sutton* | (5) | ||
| 10.11 | Employment Agreement by and between Home Bank and Joseph B. Zanco* | (5) | ||
| 10.12 | Home Bancorp, Inc. 2009 Stock Option Plan* | (6) | ||
| 10.13 | Home Bancorp, Inc. 2009 Recognition and Retention Plan and Trust Agreement* | (7) | ||
| 23.1 | Consent of Ernst & Young LLP | Filed herewith | ||
73
Table of Contents
| No. |
Description |
Location | ||
| 23.2 | Consent of Porter Keadle Moore LLP | Filed herewith | ||
| 31.1 | Rule 13(a)-14(a) Certification of the Chief Executive Officer | Filed herewith | ||
| 31.2 | Rule 13(a)-14(a) Certification of the Chief Financial Officer | Filed herewith | ||
| 32.0 | Section 1350 Certification | Filed herewith | ||
| * | Denotes a management contract or compensatory plan or arrangement. |
| (1) | Incorporated by reference from the like-numbered exhibit included in Home Bancorp’s registration statement on Form S-1, filed June 6, 2008 (SEC File No. 333-151492). |
| (2) | Incorporated by reference from the exhibit included in the Company’s Current Report on Form 8-K, dated as of March 23, 2009 and filed March 27, 2009 (SEC File No. 001-34190). |
| (3) | Incorporated by reference from the exhibit included in the Company’s Current Report on Form 8-K, dated as of December 22, 2008 and filed December 29, 2008 (SEC File No. 001-34190). |
| (4) | Incorporated by reference from the exhibit included in the Company’s Current Report on Form 8-K, dated as of June 30, 2009, and filed July 1, 2009 (SEC File No. 001-34190). |
| (5) | Incorporated by reference from the exhibit included in the Company’s Current Report on Form 8-K, dated as of June 22, 2009 and filed June 23, 2009 (SEC File No. 001-34190). |
| (6) | Incorporated by reference from Appendix A to Home Bancorp’s definitive proxy statement filed April 1, 2009 (SEC File No. 001-34190) and included in Form S-8, filed June 23, 2009 (SEC File No. 333-160155). |
| (7) | Incorporated by reference from Appendix B to Home Bancorp’s definitive proxy statement filed April 1, 2009 (SEC File No. 001-34190). |
(b) Exhibits
The exhibits listed under (a)(3) of this Item 15 are filed herewith.
(c) Reference is made to (a)(2) of this Item 15.
74
Table of Contents
Pursuant to the requirements of Section 13 or 15(d) of the Securities Exchange Act of 1934, the Registrant has duly caused this report to be signed on its behalf by the undersigned, thereunto duly authorized.
| HOME BANCORP, INC. | ||||||
| March 15, 2010 | By: | /s/ John W. Bordelon | ||||
| John W. Bordelon | ||||||
| President and Chief Executive Officer | ||||||
Pursuant to the requirements of the Securities Exchange Act of 1934, this report has been signed below by the following persons on behalf of the Registrant and in the capacities and on the date indicated.
| Name |
Title |
Date | ||
| /s/ John W. Bordelon John W. Bordelon |
President and Chief Executive Officer | March 15, 2010 | ||
| /s/ Michael P. Maraist Michael P. Maraist |
Chairman of the Board | March 15, 2010 | ||
| /s/ Paul J. Blanchet, III Paul J. Blanchet, III |
Director | March 15, 2010 | ||
| /s/ Richard J. Bourgeois Richard J. Bourgeois |
Director | March 15, 2010 | ||
| /s/ Henry W. Busch, Jr. Henry William Busch, Jr. |
Director | March 15, 2010 | ||
| /s/ Lester J. Dailey Lester James Dailey |
Director | March 15, 2010 | ||
| /s/ John A. Hendry John A. Hendry |
Director | March 15, 2010 | ||
| /s/ Marc W. Judice Marc W. Judice |
Director | March 15, 2010 | ||
| /s/ Joseph B. Zanco Joseph B. Zanco |
Executive Vice President and Chief Financial Officer |
March 15, 2010 | ||
| /s/ Mary H. Hopkins Mary H. Hopkins |
Home Bank First Vice President and Controller | March 15, 2010 | ||
75