Attached files
| file | filename |
|---|---|
| EX-99.1 - EXHIBIT 99.1 - GMS Inc. | tm2120550d1_ex99-1.htm |
| 8-K - FORM 8-K - GMS Inc. | tm2120550d1_8k.htm |
Exhibit 99.2

Q4 FY 2021 Earnings Conference Call June 24, 2021
2 Forward - Looking Statement Safe Harbor — This presentation includes “forward - looking statements” within the meaning of the Private Securities Litigation Reform Act of 1995. You can generally identify forward - looking statements by the Company’s use of forward - looking terminology such as “anticipate,” “bel ieve,” “confident,” “continue,” “could,” “estimate,” “expect,” “intend,” “may,” “might,” “plan,” “potential,” “predict,” “seek,” or “should,” or the negative thereof or other variations th ere on or comparable terminology. In particular, statements about the markets in which GMS operates, including potential growth in those markets, the economy generally, actions taken to optimize our operations and align our business consistent with demand, our ability to continue successfully navigating the evolving operating environment, strategic initiatives and priorit ies and growth potential across the Company’s business, our efforts in response to COVID - 19, future financial performance and liquidity, the ability of the Company to grow stronger, and th e ability to deliver growth, value creation and long - term success contained in this presentation may be considered forward - looking statements. Statements about our expectations, beliefs, plans, strategies, objectives, prospects, assumptions or future events or performance may be considered forward - looking statements. The Company has based forward - looking statements o n its current expectations, assumptions, estimates and projections. While the Company believes these expectations, assumptions, estimates and projections are reasonable, such f orw ard - looking statements are only predictions and involve known and unknown risks and uncertainties, many of which are beyond its control, including current public health issu es that may affect the Company’s business. Forward - looking statements involve risks and uncertainties, including, but not limited to, those described in the “Risk Factors” section in t he Company’s most recent Annual Report on Form 10 - K, and in its other periodic reports filed with the SEC. In addition, the statements in this release are made as of June 24, 2021. The Com pany undertakes no obligation to update any of the forward - looking statements made herein, whether as a result of new information, future events, changes in expectation or otherwi se. These forward - looking statements should not be relied upon as representing the Company’s views as of any date subsequent to June 24, 2021. Use of Non - GAAP and Adjusted Financial Information — To supplement GAAP financial information, we use adjusted measures of operating results which are non - GAAP measures. This non - GAAP adjusted financial information is provided as additional information for investors. These adjusted results exclude certain costs, expenses, gains and losses, and we believe their exclusion can enhance an overall understanding of our past financial performance and also our prospects for the fu ture. These adjustments to our GAAP results are made with the intent of providing both management and investors a more complete understanding of our operating performance by excl udi ng non - recurring, infrequent or other non - cash charges that are not believed to be material to the ongoing performance of our business. The presentation of this additional inf ormation is not meant to be considered in isolation or as a substitute for GAAP measures of net income, diluted earnings per share or net cash provided by (used in) operating activities pr epared in accordance with generally accepted accounting principles in the United States. Please see the Appendix to this presentation for a further discussion on these non - GAAP measure s and a reconciliation of these non - GAAP measures to the most directly comparable GAAP measures. Safe Harbor and Basis of Presentation
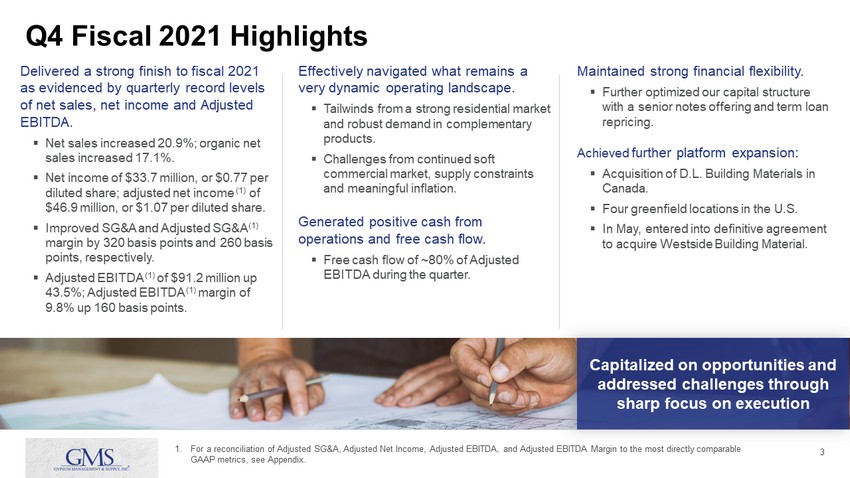
3 Q4 Fiscal 2021 Highlights Delivered a strong finish to fiscal 2021 as evidenced by quarterly record levels of net sales, net income and Adjusted EBITDA. ▪ Net sales increased 20.9%; organic net sales increased 17.1%. ▪ Net income of $33.7 million, or $0.77 per diluted share; adjusted net income (1) of $46.9 million, or $1.07 per diluted share. ▪ Improved SG&A and Adjusted SG&A (1) margin by 320 basis points and 260 basis points, respectively. ▪ Adjusted EBITDA (1) of $91.2 million up 43.5%; Adjusted EBITDA (1) margin of 9.8% up 160 basis points. Effectively navigated what remains a very dynamic operating landscape. ▪ Tailwinds from a strong residential market and robust demand in complementary products. ▪ Challenges from continued soft commercial market, supply constraints and meaningful inflation. Generated positive cash from operations and free cash flow. ▪ Free cash flow of ~80% of Adjusted EBITDA during the quarter. Maintained strong financial flexibility. ▪ Further optimized our capital structure with a senior notes offering and term loan repricing. Achieved further platform expansion: ▪ Acquisition of D.L. Building Materials in Canada. ▪ Four greenfield locations in the U.S. ▪ In May, entered into definitive agreement to acquire Westside Building Material. 1. For a reconciliation of Adjusted SG&A, Adjusted Net Income, Adjusted EBITDA, and Adjusted EBITDA Margin to the most directly com parable GAAP metrics, see Appendix. Capitalized on opportunities and addressed challenges through sharp focus on execution
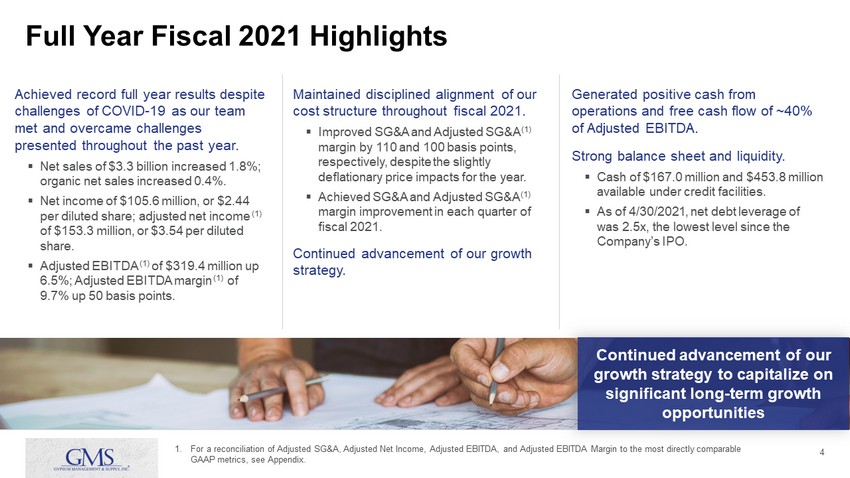
4 Full Year Fiscal 2021 Highlights Achieved record full year results despite challenges of COVID - 19 as our team met and overcame challenges presented throughout the past year. ▪ Net sales of $3.3 billion increased 1.8%; organic net sales increased 0.4%. ▪ Net income of $105.6 million, or $2.44 per diluted share; adjusted net income (1) of $153.3 million, or $3.54 per diluted share. ▪ Adjusted EBITDA (1) of $319.4 million up 6.5%; Adjusted EBITDA margin (1) of 9.7% up 50 basis points. Maintained disciplined alignment of our cost structure throughout fiscal 2021. ▪ Improved SG&A and Adjusted SG&A (1) margin by 110 and 100 basis points, respectively, despite the slightly deflationary price impacts for the year. ▪ Achieved SG&A and Adjusted SG&A (1) margin improvement in each quarter of fiscal 2021. Continued advancement of our growth strategy. Generated positive cash from operations and free cash flow of ~40% of Adjusted EBITDA. Strong balance sheet and liquidity. ▪ Cash of $167.0 million and $453.8 million available under credit facilities. ▪ As of 4/30/2021, net debt leverage of was 2.5x, the lowest level since the Company’s IPO. 1. For a reconciliation of Adjusted SG&A, Adjusted Net Income, Adjusted EBITDA, and Adjusted EBITDA Margin to the most directly com parable GAAP metrics, see Appendix. Continued advancement of our growth strategy to capitalize on significant long - term growth opportunities
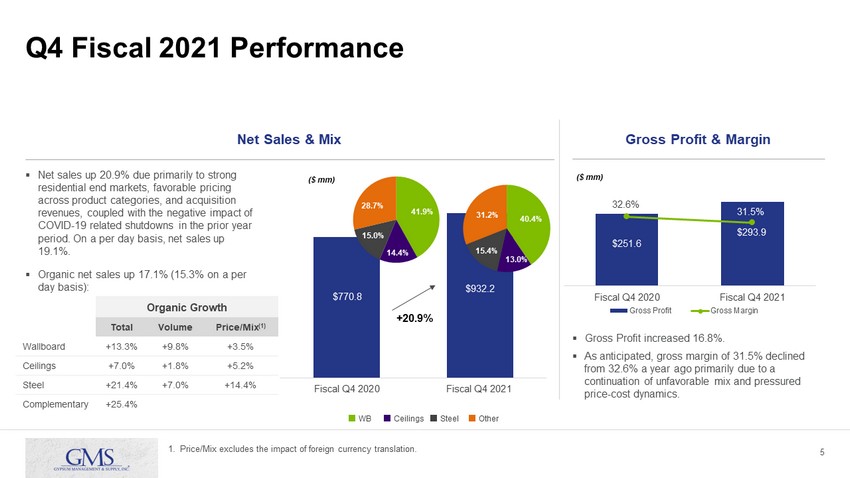
5 $251.6 $293.9 32.6% 31.5% 20.0% 20.5% 21.0% 21.5% 22.0% 22.5% 23.0% 23.5% 24.0% 24.5% 25.0% 25.5% 26.0% 26.5% 27.0% 27.5% 28.0% 28.5% 29.0% 29.5% 30.0% 30.5% 31.0% 31.5% 32.0% 32.5% 33.0% 33.5% 34.0% 34.5% 35.0% 35.5% 36.0% 36.5% 37.0% $0 $50 $100 $150 $200 $250 $300 Fiscal Q4 2020 Fiscal Q4 2021 Gross Profit Gross Margin Q4 Fiscal 2021 Performance Net Sales & Mix Gross Profit & Margin ▪ Gross Profit increased 16.8%. ▪ As anticipated, gross margin of 31.5% declined from 32.6% a year ago primarily due to a continuation of unfavorable mix and pressured price - cost dynamics. ▪ Net sales up 20.9% due primarily to strong residential end markets, favorable pricing across product categories, and acquisition revenues, coupled with the negative impact of COVID - 19 related shutdowns in the prior year period. On a per day basis, net sales up 19.1%. ▪ Organic net sales up 17.1% (15.3% on a per day basis): Organic Growth Total Volume Price/Mix (1) Wallboard +13.3% +9.8% +3.5% Ceilings +7.0% +1.8% +5.2% Steel +21.4% +7.0% +14.4% Complementary +25.4% $770.8 $932.2 Fiscal Q4 2020 Fiscal Q4 2021 +20.9% 41.9% 14.4% 15.0% 28.7% 40.4% 13.0% 15.4% 31.2% WB Ceilings Steel Other ($ mm) ($ mm) 1. Price/Mix excludes the impact of foreign currency translation.
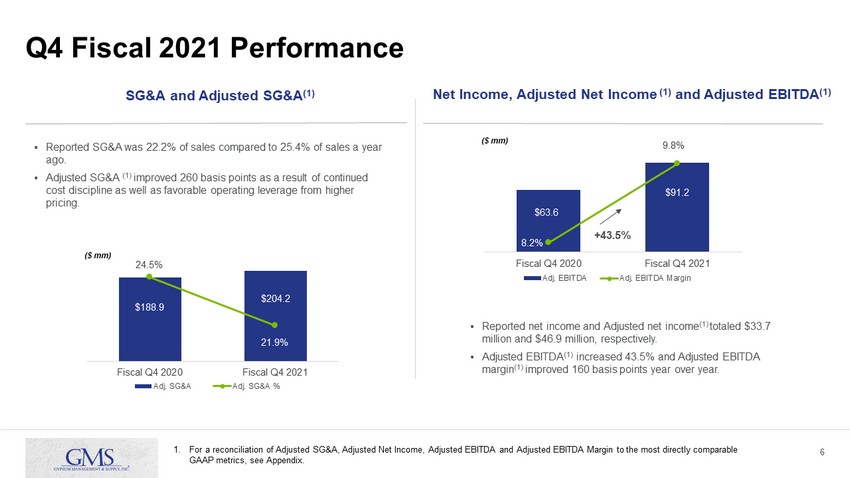
6 Q4 Fiscal 2021 Performance 1. For a reconciliation of Adjusted SG&A, Adjusted Net Income, Adjusted EBITDA and Adjusted EBITDA Margin to the most directly c omp arable GAAP metrics, see Appendix. SG&A and Adjusted SG&A (1) ▪ Reported SG&A was 22.2% of sales compared to 25.4% of sales a year ago. ▪ Adjusted SG&A (1) improved 260 basis points as a result of continued cost discipline as well as favorable operating leverage from higher pricing. $188.9 $204.2 24.5% 21.9% 20.0% 20.5% 21.0% 21.5% 22.0% 22.5% 23.0% 23.5% 24.0% 24.5% 25.0% $0 $50 $100 $150 $200 Fiscal Q4 2020 Fiscal Q4 2021 Adj. SG&A Adj. SG&A % ($ mm) Net Income, Adjusted Net Income (1) and Adjusted EBITDA (1) ▪ Reported net income and Adjusted net income (1) totaled $33.7 million and $46.9 million, respectively. ▪ Adjusted EBITDA (1) increased 43.5% and Adjusted EBITDA margin (1) improved 160 basis points year over year. $89.9 $82.5 $89.9 $82.5 $63.6 $91.2 8.2% 9.8% 8.0% 8.5% 9.0% 9.5% 10.0% $0 $50 $100 Fiscal Q4 2020 Fiscal Q4 2021 Adj. EBITDA Adj. EBITDA Margin ($ mm) +43.5%
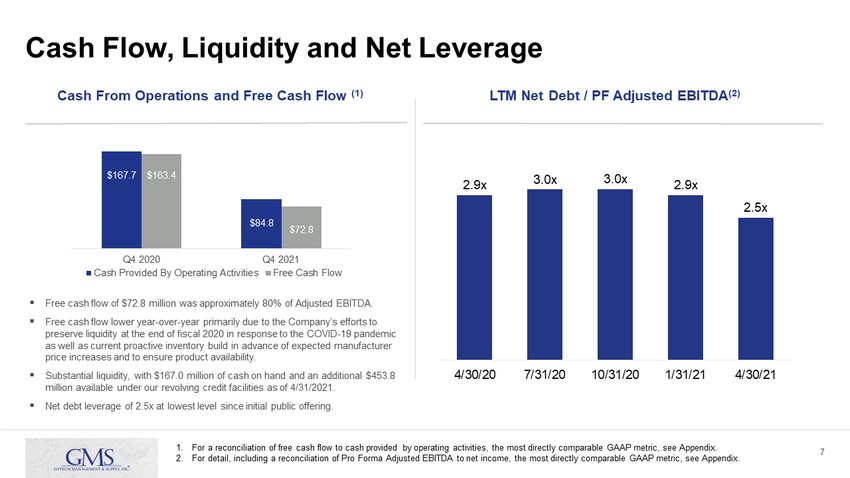
7 Cash Flow, Liquidity and Net Leverage Cash From Operations and Free Cash Flow (1) LTM Net Debt / PF Adjusted EBITDA (2) $89.9 $82.5 ▪ Free cash flow of $72.8 million was approximately 80% of Adjusted EBITDA. ▪ Free cash flow lower year - over - year primarily due to the Company’s efforts to preserve liquidity at the end of fiscal 2020 in response to the COVID - 19 pandemic as well as current proactive inventory build in advance of expected manufacturer price increases and to ensure product availability. ▪ Substantial liquidity, with $167.0 million of cash on hand and an additional $453.8 million available under our revolving credit facilities as of 4/31/2021. ▪ Net debt leverage of 2.5x at lowest level since initial public offering. 1. For a reconciliation of free cash flow to cash provided by operating activities, the most directly comparable GAAP metric, se e A ppendix. 2. For detail, including a reconciliation of Pro Forma Adjusted EBITDA to net income, the most directly comparable GAAP metric, see Appendix. 2.9 x 3.0x 3.0 x 2.9 x 2.5 x 4/30/20 7/31/20 10/31/20 1/31/21 4/30/21 $167.7 $84.8 $163.4 $72.8 Q4 2020 Q4 2021 Cash Provided By Operating Activities Free Cash Flow
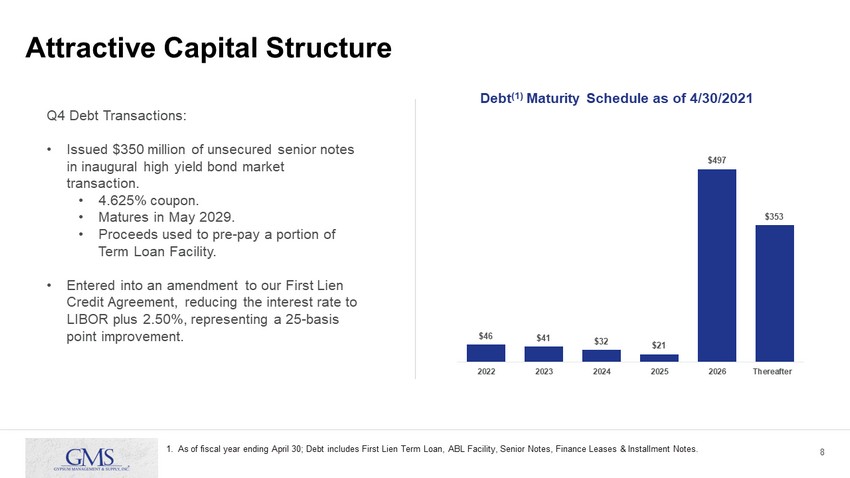
8 Attractive Capital Structure Debt (1) Maturity Schedule as of 4/30/2021 $89.9 $82.5 1. As of fiscal year ending April 30; Debt includes First Lien Term Loan, ABL Facility, Senior Notes, Finance Leases & Insta llm ent Notes. $46 $41 $32 $21 $497 $353 2022 2023 2024 2025 2026 Thereafter Q4 Debt Transactions: • Issued $350 million of unsecured senior notes in inaugural high yield bond market transaction. • 4.625% coupon. • Matures in May 2029. • Proceeds used to pre - pay a portion of Term Loan Facility. • Entered into an amendment to our First Lien Credit Agreement, reducing the interest rate to LIBOR plus 2.50%, representing a 25 - basis point improvement.
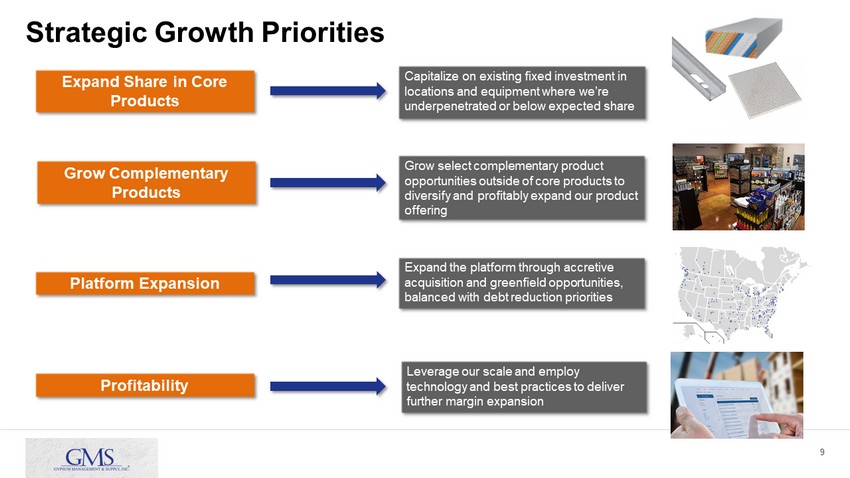
9 Strategic Growth Priorities Expand Share in Core Products Grow Complementary Products Platform Expansion Capitalize on existing fixed investment in locations and equipment where we’re underpenetrated or below expected share Grow select complementary product opportunities outside of core products to diversify and profitably expand our product offering Expand the platform through accretive acquisition and greenfield opportunities, balanced with debt reduction priorities Profitability Leverage our scale and employ technology and best practices to deliver further margin expansion
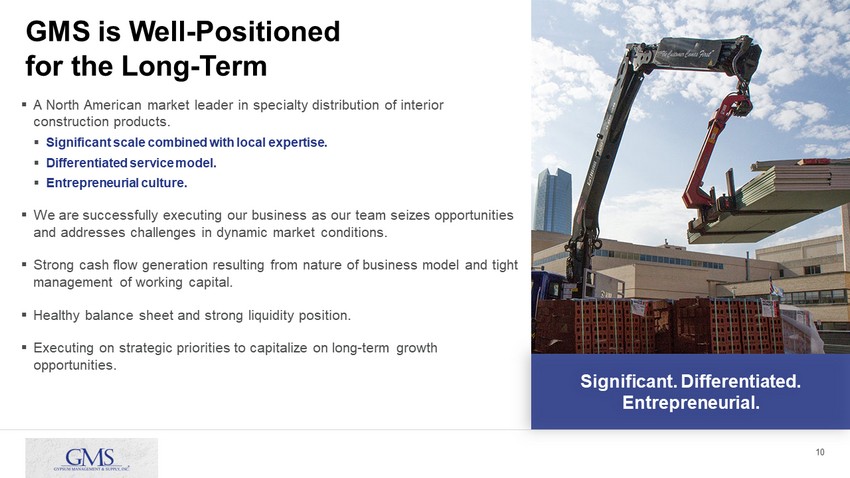
10 GMS is Well - Positioned for the Long - Term ▪ A North American market leader in specialty distribution of interior construction products. ▪ Significant scale combined with local expertise. ▪ Differentiated service model. ▪ Entrepreneurial culture. ▪ We are successfully executing our business as our team seizes opportunities and addresses challenges in dynamic market conditions. ▪ Strong cash flow generation resulting from nature of business model and tight management of working capital. ▪ Healthy balance sheet and strong liquidity position. ▪ Executing on strategic priorities to capitalize on long - term growth opportunities. Significant. Differentiated. Entrepreneurial.
11 Q4 FY 2021 Earnings Conference Call
12 Appendix
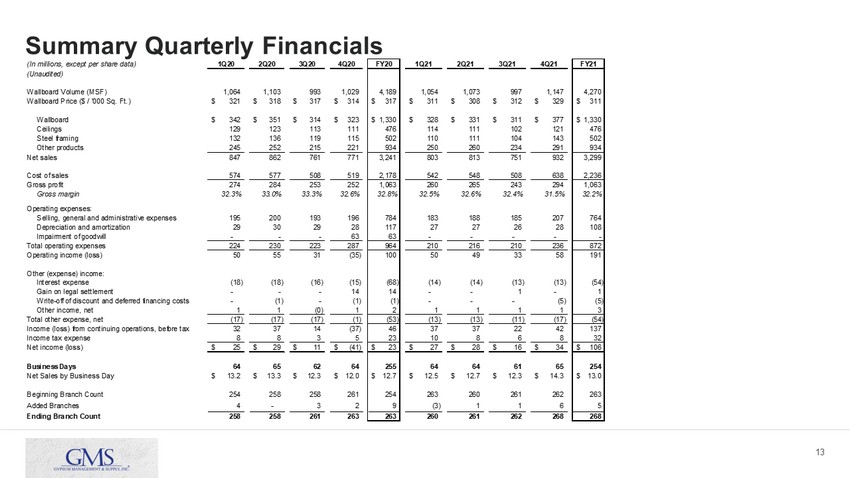
13 Summary Quarterly Financials (In millions, except per share data) 1Q20 2Q20 3Q20 4Q20 FY20 1Q21 2Q21 3Q21 4Q21 FY21 (Unaudited) Wallboard Volume (MSF) 1,064 1,103 993 1,029 4,189 1,054 1,073 997 1,147 4,270 Wallboard Price ($ / '000 Sq. Ft.) 321$ 318$ 317$ 314$ 317$ 311$ 308$ 312$ 329$ 311$ Wallboard 342$ 351$ 314$ 323$ 1,330$ 328$ 331$ 311$ 377$ 1,330$ Ceilings 129 123 113 111 476 114 111 102 121 476 Steel framing 132 136 119 115 502 110 111 104 143 502 Other products 245 252 215 221 934 250 260 234 291 934 Net sales 847 862 761 771 3,241 803 813 751 932 3,299 Cost of sales 574 577 508 519 2,178 542 548 508 638 2,236 Gross profit 274 284 253 252 1,063 260 265 243 294 1,063 Gross margin 32.3% 33.0% 33.3% 32.6% 32.8% 32.5% 32.6% 32.4% 31.5% 32.2% Operating expenses: Selling, general and administrative expenses 195 200 193 196 784 183 188 185 207 764 Depreciation and amortization 29 30 29 28 117 27 27 26 28 108 Impairment of goodwill - - - 63 63 - - - - - Total operating expenses 224 230 223 287 964 210 216 210 236 872 Operating income (loss) 50 55 31 (35) 100 50 49 33 58 191 Other (expense) income: Interest expense (18) (18) (16) (15) (68) (14) (14) (13) (13) (54) Gain on legal settlement - - - 14 14 - - 1 - 1 Write-off of discount and deferred financing costs - (1) - (1) (1) - - - (5) (5) Other income, net 1 1 (0) 1 2 1 1 1 1 3 Total other expense, net (17) (17) (17) (1) (53) (13) (13) (11) (17) (54) Income (loss) from continuing operations, before tax 32 37 14 (37) 46 37 37 22 42 137 Income tax expense 8 8 3 5 23 10 8 6 8 32 Net income (loss) 25$ 29$ 11$ (41)$ 23$ 27$ 28$ 16$ 34$ 106$ Business Days 64 65 62 64 255 64 64 61 65 254 Net Sales by Business Day 13.2$ 13.3$ 12.3$ 12.0$ 12.7$ 12.5$ 12.7$ 12.3$ 14.3$ 13.0$ Beginning Branch Count 254 258 258 261 254 263 260 261 262 263 Added Branches 4 - 3 2 9 (3) 1 1 6 5 Ending Branch Count 258 258 261 263 263 260 261 262 268 268
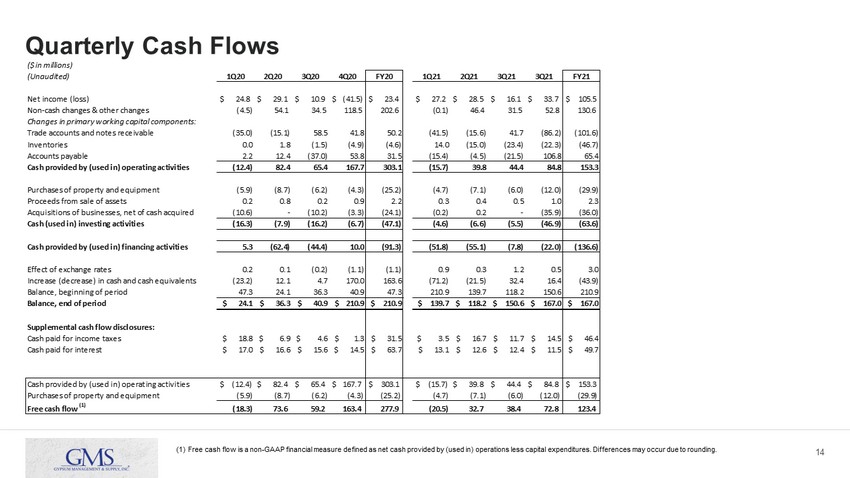
14 Quarterly Cash Flows (1) Free cash flow is a non - GAAP financial measure defined as net cash provided by (used in) operations less capital expenditures. D ifferences may occur due to rounding. ($ in millions) (Unaudited) 1Q20 2Q20 3Q20 4Q20 FY20 1Q21 2Q21 3Q21 3Q21 FY21 Net income (loss) $ 24.8 $ 29.1 $ 10.9 $ (41.5) $ 23.4 $ 27.2 $ 28.5 $ 16.1 $ 33.7 $ 105.5 Non-cash changes & other changes (4.5) 54.1 34.5 118.5 202.6 (0.1) 46.4 31.5 52.8 130.6 Changes in primary working capital components: Trade accounts and notes receivable (35.0) (15.1) 58.5 41.8 50.2 (41.5) (15.6) 41.7 (86.2) (101.6) Inventories 0.0 1.8 (1.5) (4.9) (4.6) 14.0 (15.0) (23.4) (22.3) (46.7) Accounts payable 2.2 12.4 (37.0) 53.8 31.5 (15.4) (4.5) (21.5) 106.8 65.4 Cash provided by (used in) operating activities (12.4) 82.4 65.4 167.7 303.1 (15.7) 39.8 44.4 84.8 153.3 Purchases of property and equipment (5.9) (8.7) (6.2) (4.3) (25.2) (4.7) (7.1) (6.0) (12.0) (29.9) Proceeds from sale of assets 0.2 0.8 0.2 0.9 2.2 0.3 0.4 0.5 1.0 2.3 Acquisitions of businesses, net of cash acquired (10.6) - (10.2) (3.3) (24.1) (0.2) 0.2 - (35.9) (36.0) Cash (used in) investing activities (16.3) (7.9) (16.2) (6.7) (47.1) (4.6) (6.6) (5.5) (46.9) (63.6) Cash provided by (used in) financing activities 5.3 (62.4) (44.4) 10.0 (91.3) (51.8) (55.1) (7.8) (22.0) (136.6) Effect of exchange rates 0.2 0.1 (0.2) (1.1) (1.1) 0.9 0.3 1.2 0.5 3.0 Increase (decrease) in cash and cash equivalents (23.2) 12.1 4.7 170.0 163.6 (71.2) (21.5) 32.4 16.4 (43.9) Balance, beginning of period 47.3 24.1 36.3 40.9 47.3 210.9 139.7 118.2 150.6 210.9 Balance, end of period $ 24.1 $ 36.3 $ 40.9 $ 210.9 $ 210.9 $ 139.7 $ 118.2 $ 150.6 $ 167.0 $ 167.0 Supplemental cash flow disclosures: Cash paid for income taxes $ 18.8 $ 6.9 $ 4.6 $ 1.3 $ 31.5 $ 3.5 $ 16.7 $ 11.7 $ 14.5 $ 46.4 Cash paid for interest $ 17.0 $ 16.6 $ 15.6 $ 14.5 $ 63.7 $ 13.1 $ 12.6 $ 12.4 $ 11.5 $ 49.7 Cash provided by (used in) operating activities $ (12.4) $ 82.4 $ 65.4 $ 167.7 $ 303.1 $ (15.7) $ 39.8 $ 44.4 $ 84.8 $ 153.3 Purchases of property and equipment (5.9) (8.7) (6.2) (4.3) (25.2) (4.7) (7.1) (6.0) (12.0) (29.9) Free cash flow (1) (18.3) 73.6 59.2 163.4 277.9 (20.5) 32.7 38.4 72.8 123.4
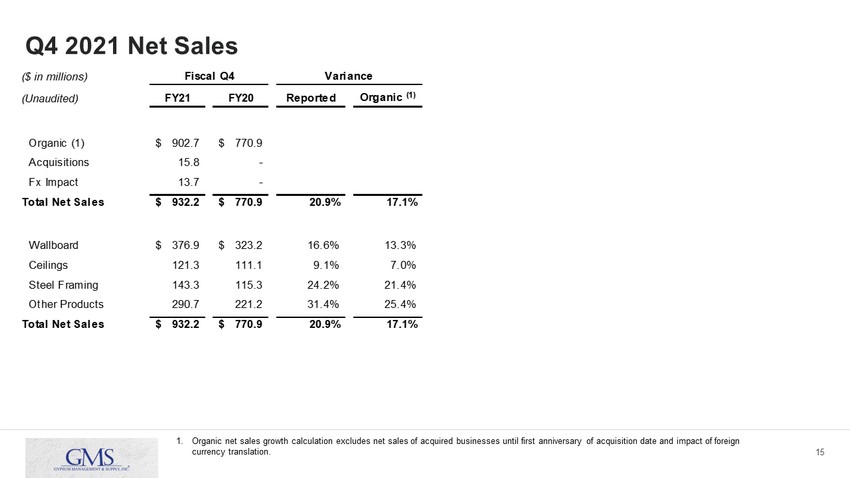
15 Q4 2021 Net Sales 1. Organic net sales growth calculation excludes net sales of acquired businesses until first anniversary of acquisition date an d i mpact of foreign currency translation. ($ in millions) (Unaudited) FY21 FY20 Reported Organic (1) Organic (1) 902.7$ 770.9$ Acquisitions 15.8 - Fx Impact 13.7 - Total Net Sales 932.2$ 770.9$ 20.9% 17.1% Wallboard 376.9$ 323.2$ 16.6% 13.3% Ceilings 121.3 111.1 9.1% 7.0% Steel Framing 143.3 115.3 24.2% 21.4% Other Products 290.7 221.2 31.4% 25.4% Total Net Sales 932.2$ 770.9$ 20.9% 17.1% Fiscal Q4 Variance
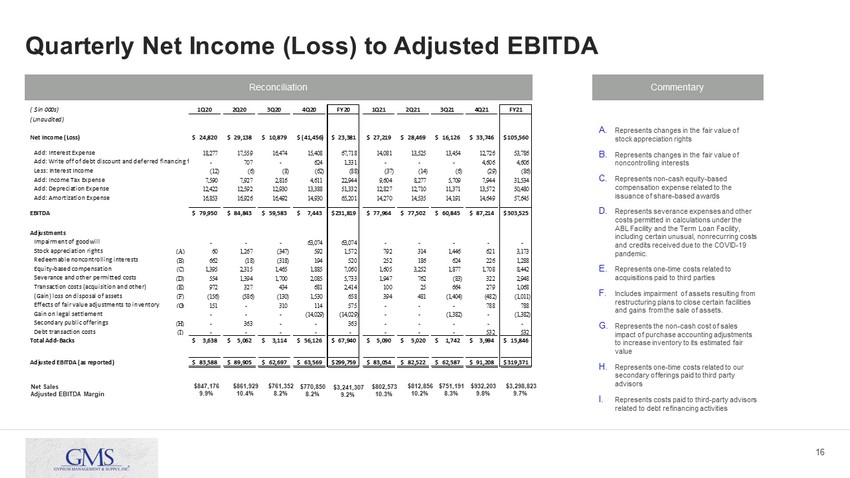
16 Quarterly Net Income (Loss) to Adjusted EBITDA Reconciliation Commentary A. Represents changes in the fair value of stock appreciation rights B. Represents changes in the fair value of noncontrolling interests C. Represents non - cash equity - based compensation expense related to the issuance of share - based awards D. Represents severance expenses and other costs permitted in calculations under the ABL Facility and the Term Loan Facility, including certain unusual, nonrecurring costs and credits received due to the COVID - 19 pandemic. E. Represents one - time costs related to acquisitions paid to third parties F. Includes impairment of assets resulting from restructuring plans to close certain facilities and gains from the sale of assets. G. Represents the non - cash cost of sales impact of purchase accounting adjustments to increase inventory to its estimated fair value H. Represents one - time costs related to our secondary offerings paid to third party advisors I. Represents costs paid to third - party advisors related to debt refinancing activities ( $ in 000s) 1Q20 2Q20 3Q20 4Q20 FY20 1Q21 2Q21 3Q21 4Q21 FY21 (Unaudited) Net Income (Loss) 24,820$ 29,138$ 10,879$ (41,456)$ 23,381$ 27,219$ 28,469$ 16,126$ 33,746$ 105,560$ Add: Interest Expense 18,277 17,559 16,474 15,408 67,718 14,081 13,525 13,454 12,726 53,786 Add: Write off of debt discount and deferred financing fees - 707 - 624 1,331 - - - 4,606 4,606 Less: Interest Income (12) (6) (8) (62) (88) (37) (14) (6) (29) (86) Add: Income Tax Expense 7,590 7,927 2,816 4,611 22,944 9,604 8,277 5,709 7,944 31,534 Add: Depreciation Expense 12,422 12,592 12,930 13,388 51,332 12,827 12,710 11,371 13,572 50,480 Add: Amortization Expense 16,853 16,926 16,492 14,930 65,201 14,270 14,535 14,191 14,649 57,645 EBITDA 79,950$ 84,843$ 59,583$ 7,443$ 231,819$ 77,964$ 77,502$ 60,845$ 87,214$ 303,525$ Adjustments Impairment of goodwill - - - 63,074 63,074 - - - - - Stock appreciation rights (A) 60 1,267 (347) 592 1,572 792 314 1,446 621 3,173 Redeemable noncontrolling interests (B) 662 (18) (318) 194 520 252 186 624 226 1,288 Equity-based compensation (C) 1,395 2,315 1,465 1,885 7,060 1,605 3,252 1,877 1,708 8,442 Severance and other permitted costs (D) 554 1,394 1,700 2,085 5,733 1,947 762 (83) 322 2,948 Transaction costs (acquisition and other) (E) 972 327 434 681 2,414 100 25 664 279 1,068 (Gain) loss on disposal of assets (F) (156) (586) (130) 1,530 658 394 481 (1,404) (482) (1,011) Effects of fair value adjustments to inventory (G) 151 - 310 114 575 - - - 788 788 Gain on legal settlement - - - (14,029) (14,029) - - (1,382) - (1,382) Secondary public offerings (H) - 363 - - 363 - - - - - Debt transaction costs (I) - - - - - - - - 532 532 Total Add-Backs 3,638$ 5,062$ 3,114$ 56,126$ 67,940$ 5,090$ 5,020$ 1,742$ 3,994$ 15,846$ Adjusted EBITDA (as reported) 83,588$ 89,905$ 62,697$ 63,569$ 299,759$ 83,054$ 82,522$ 62,587$ 91,208$ 319,371$ Net Sales Adjusted EBITDA Margin $932,203 9.8% $761,352 8.2% $770,850 8.2% $3,241,307 9.2% $802,573 10.3% $812,856 10.2% $751,191 8.3% $3,298,823 9.7% $847,176 9.9% $861,929 10.4%
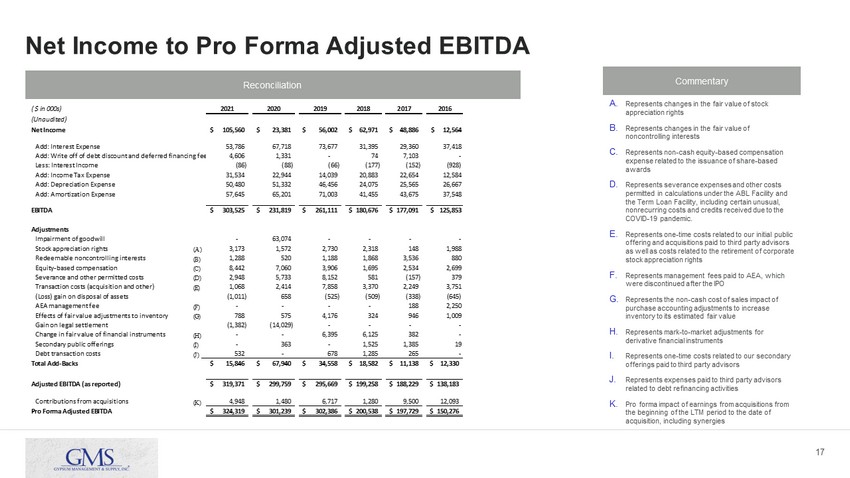
17 Net Income to Pro Forma Adjusted EBITDA Reconciliation Commentary A. Represents changes in the fair value of stock appreciation rights B. Represents changes in the fair value of noncontrolling interests C. Represents non - cash equity - based compensation expense related to the issuance of share - based awards D. Represents severance expenses and other costs permitted in calculations under the ABL Facility and the Term Loan Facility, including certain unusual, nonrecurring costs and credits received due to the COVID - 19 pandemic. E. Represents one - time costs related to our initial public offering and acquisitions paid to third party advisors as well as costs related to the retirement of corporate stock appreciation rights F. Represents management fees paid to AEA, which were discontinued after the IPO G. Represents the non - cash cost of sales impact of purchase accounting adjustments to increase inventory to its estimated fair value H. Represents mark - to - market adjustments for derivative financial instruments I. Represents one - time costs related to our secondary offerings paid to third party advisors J. Represents expenses paid to third party advisors related to debt refinancing activities K. Pro forma impact of earnings from acquisitions from the beginning of the LTM period to the date of acquisition, including synergies ( $ in 000s) 2021 2020 2019 2018 2017 2016 (Unaudited) Net Income 105,560$ 23,381$ 56,002$ 62,971$ 48,886$ $ 12,564 Add: Interest Expense 53,786 67,718 73,677 31,395 29,360 37,418 Add: Write off of debt discount and deferred financing fees 4,606 1,331 - 74 7,103 - Less: Interest Income (86) (88) (66) (177) (152) (928) Add: Income Tax Expense 31,534 22,944 14,039 20,883 22,654 12,584 Add: Depreciation Expense 50,480 51,332 46,456 24,075 25,565 26,667 Add: Amortization Expense 57,645 65,201 71,003 41,455 43,675 37,548 EBITDA 303,525$ 231,819$ 261,111$ 180,676$ 177,091$ $ 125,853 Adjustments Impairment of goodwill - 63,074 - - - - Stock appreciation rights (A) 3,173 1,572 2,730 2,318 148 1,988 Redeemable noncontrolling interests (B) 1,288 520 1,188 1,868 3,536 880 Equity-based compensation (C) 8,442 7,060 3,906 1,695 2,534 2,699 Severance and other permitted costs (D) 2,948 5,733 8,152 581 (157) 379 Transaction costs (acquisition and other) (E) 1,068 2,414 7,858 3,370 2,249 3,751 (Loss) gain on disposal of assets (1,011) 658 (525) (509) (338) (645) AEA management fee (F) - - - - 188 2,250 Effects of fair value adjustments to inventory (G) 788 575 4,176 324 946 1,009 Gain on legal settlement (1,382) (14,029) - - - - Change in fair value of financial instruments (H) - - 6,395 6,125 382 - Secondary public offerings (I) - 363 - 1,525 1,385 19 Debt transaction costs (J) 532 - 678 1,285 265 - Total Add-Backs 15,846$ 67,940$ 34,558$ 18,582$ 11,138$ 12,330$ Adjusted EBITDA (as reported) 319,371$ 299,759$ 295,669$ 199,258$ 188,229$ 138,183$ Contributions from acquisitions (K) 4,948 1,480 6,717 1,280 9,500 12,093 Pro Forma Adjusted EBITDA 324,319$ 301,239$ 302,386$ 200,538$ 197,729$ 150,276$
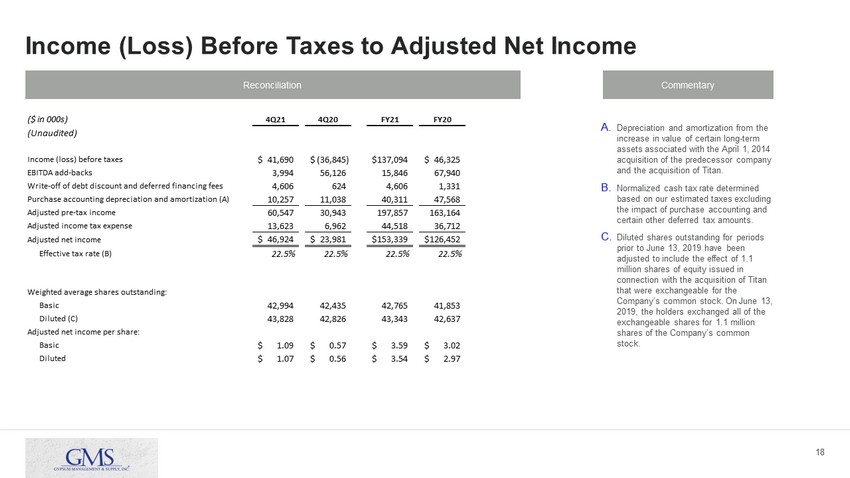
18 Income (Loss) Before Taxes to Adjusted Net Income Reconciliation Commentary A. Depreciation and amortization from the increase in value of certain long - term assets associated with the April 1, 2014 acquisition of the predecessor company and the acquisition of Titan. B. Normalized cash tax rate determined based on our estimated taxes excluding the impact of purchase accounting and certain other deferred tax amounts. C. Diluted shares outstanding for periods prior to June 13, 2019 have been adjusted to include the effect of 1.1 million shares of equity issued in connection with the acquisition of Titan that were exchangeable for the Company’s common stock. On June 13, 2019, the holders exchanged all of the exchangeable shares for 1.1 million shares of the Company’s common stock. ($ in 000s) 4Q21 4Q20 FY21 FY20 (Unaudited) Income (loss) before taxes 41,690$ (36,845)$ 137,094$ 46,325$ EBITDA add-backs 3,994 56,126 15,846 67,940 Write-off of debt discount and deferred financing fees 4,606 624 4,606 1,331 Purchase accounting depreciation and amortization (A) 10,257 11,038 40,311 47,568 Adjusted pre-tax income 60,547 30,943 197,857 163,164 Adjusted income tax expense 13,623 6,962 44,518 36,712 Adjusted net income 46,924$ 23,981$ 153,339$ 126,452$ Effective tax rate (B) 22.5% 22.5% 22.5% 22.5% Weighted average shares outstanding: Basic 42,994 42,435 42,765 41,853 Diluted (C) 43,828 42,826 43,343 42,637 Adjusted net income per share: Basic 1.09$ 0.57$ 3.59$ 3.02$ Diluted 1.07$ 0.56$ 3.54$ 2.97$
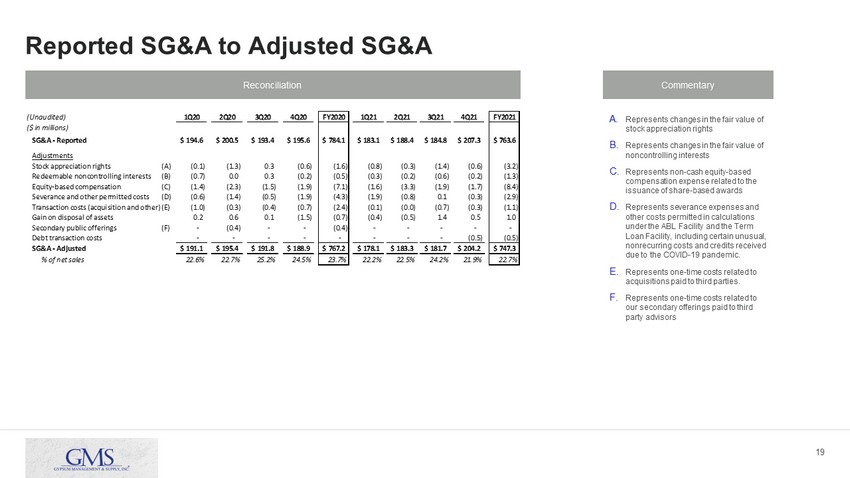
19 Reported SG&A to Adjusted SG&A Reconciliation Commentary A. Represents changes in the fair value of stock appreciation rights B. Represents changes in the fair value of noncontrolling interests C. Represents non - cash equity - based compensation expense related to the issuance of share - based awards D. Represents severance expenses and other costs permitted in calculations under the ABL Facility and the Term Loan Facility, including certain unusual, nonrecurring costs and credits received due to the COVID - 19 pandemic. E. Represents one - time costs related to acquisitions paid to third parties. F. Represents one - time costs related to our secondary offerings paid to third party advisors (Unaudited) 1Q20 2Q20 3Q20 4Q20 FY2020 1Q21 2Q21 3Q21 4Q21 FY2021 ($ in millions) SG&A - Reported 194.6$ 200.5$ 193.4$ 195.6$ 784.1$ 183.1$ 188.4$ 184.8$ 207.3$ 763.6$ Adjustments Stock appreciation rights (A) (0.1) (1.3) 0.3 (0.6) (1.6) (0.8) (0.3) (1.4) (0.6) (3.2) Redeemable noncontrolling interests (B) (0.7) 0.0 0.3 (0.2) (0.5) (0.3) (0.2) (0.6) (0.2) (1.3) Equity-based compensation (C) (1.4) (2.3) (1.5) (1.9) (7.1) (1.6) (3.3) (1.9) (1.7) (8.4) Severance and other permitted costs (D) (0.6) (1.4) (0.5) (1.9) (4.3) (1.9) (0.8) 0.1 (0.3) (2.9) Transaction costs (acquisition and other)(E) (1.0) (0.3) (0.4) (0.7) (2.4) (0.1) (0.0) (0.7) (0.3) (1.1) Gain on disposal of assets 0.2 0.6 0.1 (1.5) (0.7) (0.4) (0.5) 1.4 0.5 1.0 Secondary public offerings (F) - (0.4) - - (0.4) - - - - - Debt transaction costs - - - - - - - - (0.5) (0.5) SG&A - Adjusted 191.1$ 195.4$ 191.8$ 188.9$ 767.2$ 178.1$ 183.3$ 181.7$ 204.2$ 747.3$ % of net sales 22.6% 22.7% 25.2% 24.5% 23.7% 22.2% 22.5% 24.2% 21.9% 22.7%
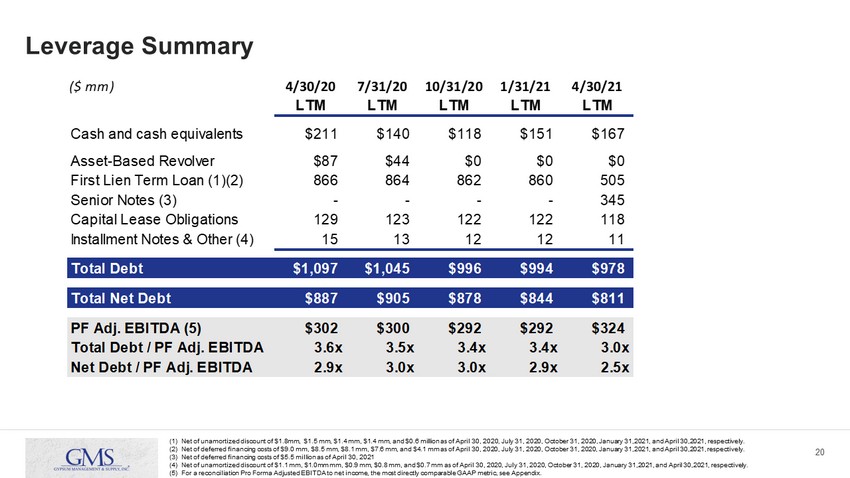
20 Leverage Summary (1) Net of unamortized discount of $1.8mm, $1.5 mm, $1.4 mm, $1.4 mm, and $0.6 million as of April 30, 2020, July 31, 2020, Octo ber 31, 2020, January 31,2021, and April 30,2021, respectively. (2) Net of deferred financing costs of $9.0 mm, $8.5 mm, $8.1 mm, $7.6 mm, and $4.1 mm as of April 30, 2020, July 31, 2020, Octob er 31, 2020, January 31,2021, and April 30,2021, respectively. (3) Net of deferred financing costs of $5.5 million as of April 30, 2021 (4) Net of unamortized discount of $1.1 mm, $1.0mm mm, $0.9 mm, $0.8 mm, and $0.7 mm as of April 30, 2020, July 31, 2020, October 31 , 2020, January 31,2021, and April 30,2021, respectively. (5) For a reconciliation Pro Forma Adjusted EBITDA to net income, the most directly comparable GAAP metric, see Appendix. ($ mm) 4/30/20 7/31/20 10/31/20 1/31/21 4/30/21 LTM LTM LTM LTM LTM Cash and cash equivalents $211 $140 $118 $151 $167 Asset-Based Revolver $87 $44 $0 $0 $0 First Lien Term Loan (1)(2) 866 864 862 860 505 Senior Notes (3) - - - - 345 Capital Lease Obligations 129 123 122 122 118 Installment Notes & Other (4) 15 13 12 12 11 Total Debt $1,097 $1,045 $996 $994 $978 Total Net Debt $887 $905 $878 $844 $811 PF Adj. EBITDA (5) $302 $300 $292 $292 $324 Total Debt / PF Adj. EBITDA 3.6x 3.5x 3.4x 3.4x 3.0x Net Debt / PF Adj. EBITDA 2.9x 3.0x 3.0x 2.9x 2.5x