Attached files
| file | filename |
|---|---|
| EX-32.2 - EX-32.2 - GMS Inc. | gms-20180430ex322dd0cc4.htm |
| EX-32.1 - EX-32.1 - GMS Inc. | gms-20180430ex3218383a2.htm |
| EX-31.2 - EX-31.2 - GMS Inc. | gms-20180430ex3125a49b4.htm |
| EX-31.1 - EX-31.1 - GMS Inc. | gms-20180430ex3110cae69.htm |
| EX-23.2 - EX-23.2 - GMS Inc. | gms-20180430ex2327ad459.htm |
| EX-23.1 - EX-23.1 - GMS Inc. | gms-20180430ex23155840e.htm |
| EX-21.1 - EX-21.1 - GMS Inc. | gms-20180430ex2113150f7.htm |
UNITED STATES
SECURITIES AND EXCHANGE COMMISSION
Washington, D.C. 20549
FORM 10‑K
|
☒ |
Annual Report Pursuant to Section 13 or 15(d) of the Securities Exchange Act of 1934 |
|
|
|
|
For the Fiscal Year Ended April 30, 2018 |
|
|
|
|
|
or |
|
|
☐ |
Transition Report Pursuant to Section 13 or 15(d) of the Securities Exchange Act of 1934 |
Commission File Number: 001‑37784
GMS INC.
(Exact name of registrant as specified in its charter)
|
Delaware |
46‑2931287 |
|
(State or other jurisdiction of incorporation or organization) |
(I.R.S. Employer Identification No.) |
|
|
|
|
100 Crescent Centre Parkway, Suite 800, Tucker, Georgia |
30084 |
|
(Address of principal executive offices) |
(Zip code) |
(800) 392‑4619
(Registrant’s telephone number, including area code)
SECURITIES REGISTERED PURSUANT TO SECTION 12(b) OF THE ACT:
|
Title of each class: |
|
Name of each exchanged on which registered: |
|
Common Stock, par value $0.01 per share |
|
New York Stock Exchange |
SECURITIES REGISTERED PURSUANT TO SECTION 12(g) OF THE ACT: None
Indicate by check mark if the registrant is a well‑known seasoned issuer, as defined in Rule 405 of the Securities Act. Yes ☒ No ☐
Indicate by check mark if the registrant is not required to file reports pursuant to Section 13 or Section 15(d) of the Act. Yes ☐ No ☒
Indicate by check mark whether the registrant (1) has filed all reports required to be filed by Section 13 or 15(d) of the Securities Exchange Act of 1934 during the preceding 12 months (or for such shorter period that the registrant was required to file such reports), and (2) has been subject to such filing requirements for the past 90 days. Yes ☒ No ☐
Indicate by check mark whether the registrant has submitted electronically and posted on its corporate Web site, if any, every Interactive Data File required to be submitted and posted pursuant to Rule 405 of Regulation S‑T (§ 232.405 of this chapter) during the preceding 12 months (or for such shorter period that the registrant was required to submit and post such files). Yes ☒ No ☐
Indicate by check mark if disclosure of delinquent filers pursuant to Item 405 of Regulation S‑K is not contained herein, and will not be contained, to the best of registrant’s knowledge, in definitive proxy or information statements incorporated by reference in Part III of this Form 10‑K or any amendment to this Form 10‑K. ☒
Indicate by check mark whether the registrant is a large accelerated filer, an accelerated filer, a non‑accelerated filer, a smaller reporting company or an emerging growth company. See the definitions of “large accelerated filer”, “accelerated filer”, “smaller reporting company” and “emerging growth company” in Rule 12b‑2 of the Exchange Act.
|
Large accelerated filer ☒ |
Accelerated filer ☐ |
Non‑accelerated filer ☐ |
Smaller reporting company ☐ |
Emerging growth company ☐ |
If an emerging growth company, indicate by check mark if the registrant has elected not to use the extended transition period for complying with any new or revised financial accounting standards provided pursuant to Section 13(a) of the Exchange Act. ☐
Indicate by check mark whether the registrant is a shell company (as defined in Rule 12b‑2 of the Exchange Act). Yes ☐ No ☒
The aggregate market value of the common stock of the Registrant held by non‑affiliates of the Registrant on October 31, 2017, the last business day of the Registrant’s most recently completed second fiscal quarter, was $953.7 million (based on the closing sale price of the Registrant’s common stock on that date as reported on the New York Stock Exchange).
There were 41,068,954 shares of the registrant’s common stock, par value $0.01 per share, outstanding as of May 31, 2018.
DOCUMENTS INCORPORATED BY REFERENCE:
Portions of the Registrant’s Definitive Proxy Statement for its Annual Meeting of Stockholders are incorporated by reference into Part III of this Annual Report for Form 10-K.
FORM 10‑K
BASIS OF PRESENTATION
Our fiscal year ends on April 30 of each year. References in this Annual Report on Form 10‑K to a fiscal year mean the year in which that fiscal year ends.
CAUTIONARY NOTE REGARDING FORWARD‑LOOKING STATEMENTS
This Annual Report on Form 10‑K contains “forward‑looking statements” within the meaning of the Private Securities Litigation Reform Act of 1995, Section 27A of the Securities Act of 1933, as amended (the “Securities Act”) and Section 21E of the Securities Exchange Act of 1934, as amended (the “Exchange Act”). You can generally identify forward‑looking statements by our use of forward‑looking terminology such as “anticipate,” “believe,” “continue,” “could,” “estimate,” “expect,” “intend,” “may,” “might,” “plan,” “potential,” “predict,” “seek,” or “should,” or the negative thereof or other variations thereon or comparable terminology. In particular, statements about the markets in which we operate, including growth of our various markets, and statements about our expectations, beliefs, plans, strategies, objectives, prospects, assumptions or future events or performance contained in this Annual Report on Form 10‑K in Item 1A, “Risk Factors,” Item 7, “Management’s Discussion and Analysis of Financial Condition and Results of Operations,” and Item 1, “Business” are forward‑looking statements.
We have based these forward‑looking statements on our current expectations, assumptions, estimates and projections. While we believe these expectations, assumptions, estimates and projections are reasonable, such forward‑looking statements are only predictions and involve known and unknown risks and uncertainties, many of which are beyond our control. These and other important factors, including those discussed in this Annual Report on Form 10‑K in Item 1A, “Risk Factors,” Item 7, “Management’s Discussion and Analysis of Financial Condition and Results of Operations,” and Item 1, “Business,” may cause our actual results, performance or achievements to differ materially from any future results, performance or achievements expressed or implied by these forward‑looking statements. Some of the factors that could cause actual results to differ materially from those expressed or implied by the forward‑looking statements include:
|
· |
general economic and financial conditions; |
|
· |
our dependency upon the commercial and residential construction and residential repair and remodeling, or R&R, markets; |
|
· |
competition in our highly fragmented industry and the markets in which we operate; |
|
· |
the fluctuations in prices of the products we distribute; |
|
· |
the consolidation of our industry; |
|
· |
our inability to pursue strategic transactions and open new branches; |
|
· |
our inability to expand into new geographic markets; |
|
· |
our ability to successfully integrate acquisitions; |
|
· |
product shortages and potential loss of relationships with key suppliers; |
|
· |
the seasonality of the commercial and residential construction markets; |
|
· |
the potential loss of any significant customers; |
|
· |
exposure to product liability and various other claims and litigation; |
|
· |
our inability to attract and retain key employees; |
1
|
· |
rising health care costs; |
|
· |
the reduction of the quantity of products our customers purchase; |
|
· |
the credit risk from our customers; |
|
· |
our inability to renew leases for our facilities; |
|
· |
our inability to effectively manage our inventory as our sales volume increases or the prices of the products we distribute fluctuate; |
|
· |
an impairment of our goodwill or intangible assets; |
|
· |
the impact of federal, state and local regulations; |
|
· |
the cost of compliance with environmental, health and safety laws and other regulations; |
|
· |
significant increases in fuel costs or shortages in the supply of fuel; |
|
· |
a disruption or cybersecurity breach in our IT systems; |
|
· |
natural or man‑made disruptions to our facilities; |
|
· |
our exposure to greater than anticipated tax liabilities; |
|
· |
the risk of our foreign operations; |
|
· |
our inability to engage in activities that may be in our best long‑term interests because of restrictions in our debt agreements; |
|
· |
our current level of indebtedness and our potential to incur additional indebtedness; |
|
· |
our inability to obtain additional financing on acceptable terms, if at all; |
|
· |
our holding company structure; |
|
· |
AEA’s influence of us; and |
|
· |
other risks and uncertainties, including those listed in Item 1A, “Risk Factors.” |
Given these risks and uncertainties, you are cautioned not to place undue reliance on such forward‑looking statements. The forward‑looking statements contained in this Annual Report on Form 10‑K are not guarantees of future performance and our actual results of operations, financial condition and liquidity, and the development of the industry in which we operate, may differ materially from the forward‑looking statements contained in this Annual Report on Form 10‑K. In addition, even if our results of operations, financial condition and liquidity, and events in the industry in which we operate, are consistent with the forward‑looking statements contained in this Annual Report on Form 10‑K, they may not be predictive of results or developments in future periods.
Any forward‑looking statement that we make in this Annual Report on Form 10‑K speaks only as of the date of such statement. Except as required by law, we do not undertake any obligation to update or revise, or to publicly announce any update or revision to, any of the forward‑looking statements, whether as a result of new information, future events or otherwise, after the date of this Annual Report on Form 10‑K. You should, however, review the factors and risks we describe in the reports we will file from time to time with the Securities and Exchange Commission, or the SEC, after the date of the filing of this Annual Report on Form 10‑K.
2
History and Company Overview
Founded in 1971, GMS Inc. (“we,” “our,” “us,” or the “Company”) is a leading North American distributor of wallboard and suspended ceilings systems, or ceilings. Our core customer is the interior contractor, who typically installs wallboard, ceilings and our other interior construction products in commercial and residential buildings. As a leading specialty distributor, we serve as a critical link between our suppliers and a highly fragmented customer base of over 20,000 contractors. Our operating model combines a national platform with a local go‑to‑market strategy through 214 branches across the country. We believe this combination enables us to generate economies of scale while maintaining the high service levels, entrepreneurial culture and customer intimacy of a local business.
Acquisition of Titan
On June 1, 2018, we acquired all of the outstanding equity interests of WSB Titan (“Titan”), a distributer of drywall, lumber, commercial and residential building materials. Titan is Canada’s largest gypsum specialty distributer with 30 locations across five provinces in Canada. The aggregate purchase price was $627.0 million (subject to a working capital and certain other adjustments as set forth in the securities purchase agreement). As part of the consideration, certain members of existing Titan management converted $35.0 million of their ownership position in Titan into equity that is exchangeable for the Company’s stock. The transaction extends our leadership position in North America with expanded scale and footprint, expands our geographic coverage into the Canadian market and creates opportunities for product expansion in both the United States and Canada.
To finance this transaction, on June 1, 2018, we entered into a Third Amendment to our First Lien Credit Agreement (the “Third Amendment”) that provides for a new first lien term loan facility under the credit agreement in the aggregate principal amount of $996.8 million due in June 2025 that bears interest at a floating rate based on LIBOR plus 2.75%, representing a 25 basis point improvement compared to the interest rate of the existing first lien term loan facility under the credit agreement immediately prior to giving effect to the Third Amendment. We also drew down $143.0 million under our asset backed revolving credit facility. The net proceeds from the new first lien term loan facility, asset backed revolving credit facility and cash on hand were used to repay our existing first lien term loan facility of approximately $571.8 million and to finance the Titan acquisition.
Initial and Secondary Public Offerings
On June 1, 2016, we completed our initial public offering (“IPO”) of 8.1 million shares of common stock at a price of $21.00 per share, including 1.1 million shares of common stock that were issued as a result of the exercise in full by the underwriters of an option to purchase additional shares to cover over‑allotments. Our common stock began trading on the New York Stock Exchange (“NYSE”) on May 26, 2016 under the ticker symbol “GMS”. After underwriting discounts and commissions, but before expenses, we received net proceeds from the IPO of $156.9 million. We used these proceeds together with cash on hand to repay $160.0 million principal amount of our term loan debt outstanding under our senior secured second lien term loan facility, which was a payment in full of the entire loan balance due under our senior secured second lien term loan facility.
On February 28, 2017, certain of our stockholders completed a secondary public offering of 8.0 million shares of the Company’s common stock at a price to the public of $29.25 per share, including 1.0 million shares of common stock that were sold as a result of the exercise in full by the underwriters of an option to purchase additional shares that was granted by the selling stockholders. We did not receive any proceeds from the sale of our common stock by the selling stockholders.
On June 7, 2017, certain of our stockholders completed an additional secondary public offering of 5.8 million shares of the Company’s common stock at a price to the public of $33.00 per share, including 0.8 million shares of common stock that were sold as a result of the exercise in full by the underwriters of an option to purchase additional shares that was granted by the selling stockholders. As a result of such offering, the control group consisting of certain affiliates of AEA Investors LP (“AEA”) and certain other of our stockholders no longer controls a majority of the voting
3
power of our outstanding common stock. Accordingly, we are no longer a “controlled company” within the meaning of the NYSE corporate governance standards. We did not receive any proceeds from the sale of our common stock by the selling stockholders.
On December 14, 2017, certain of our stockholders completed an additional secondary public offering of 5.0 million shares of the Company’s common stock at a price to the public of $38.25 per share. We did not receive any proceeds from the sale of our common stock by the selling stockholders.
Products
We provide a comprehensive product offering of over 20,000 stock-keeping-units, or SKUs, of wallboard, ceilings and complementary interior construction products for interior contractors. By carrying a full line of wallboard and ceilings along with steel framing and ancillary products, we are able to serve as a one-stop-shop for our customers.
Wallboard
Wallboard is one of the most widely used building products for interior and exterior walls and ceilings in residential and commercial structures due to its low cost, ease of installation and superior performance in providing comfort, fire resistance, thermal insulation, sound insulation, mold and moisture resistance, impact resistance, aesthetics and design elements. Wallboard is sold in panels of various dimensions, suited to various applications. In commercial and institutional construction projects, architectural specifications and building codes provide requirements related to the thickness of the panels and, in some cases, other characteristics, including fire resistance. In addition, there are wallboard products that provide some additional value in use. These include lighter weight panels, panels with additional sound insulation, and panels coated to provide mold and moisture resistance. In addition to the interior wallboard products described above, exterior sheathing is a water-resistant wallboard product designed for attachment to exterior side-wall framing as an underlayment for various exterior siding materials. These panels are manufactured with a treated, water-resistant core faced with water-repellent paper on both face and back surfaces and long edges.
While highly visible and essential, wallboard typically comprises only 3% to 5% of a new home's total cost. Given its low price point relative to other materials, we believe that there is no economical substitute for wallboard in either residential or commercial applications. We believe wallboard demand is driven by a balanced mix of both residential and commercial new construction as well as repair and remodeling (“R&R”) activity.
Ceilings
Our ceilings product line consists of suspended mineral fiber, soft fiber and metal ceiling systems primarily used in offices, hotels, hospitals, retail facilities, schools and a variety of other commercial and institutional buildings. The principal components of our ceiling systems are typically square mineral fiber tiles and the metal grid that holds the tile in place. The systems vary by acoustical performance characteristics, reflectivity, color, fire protection and aesthetic appeal. In addition to these systems, we have expanded our ceilings product offering to include architectural specialty ceilings. This product line consists of a variety of specialty shapes that provide a room with a unique visual effect as well as enhanced acoustical performance. As a result of the specified, often customized nature of these products, architectural specialty ceilings are a growing, high margin component of our product offering.
Our ceilings product line is almost exclusively sold into commercial and institutional applications. Because interior contractors who purchase ceilings frequently buy wallboard from the same distributor, carrying our ceilings product line helps increase our sales of wallboard and other complementary products, which are often delivered together with ceilings to the same worksite as part of a commercial package.
In the ceilings market, brand is highly valued and often specified by the architect of a commercial building. Because of our strong market position, we have exclusive access to the leading ceilings brand in many of our local markets. Where we have exclusivity, these specifications help us drive sales of ceilings products as well as all of the complementary products we sell as part of our commercial package. In effect, our exclusivity on the leading ceiling tile brand creates a cycle which helps reinforce our market position in our other products. In addition, because ceiling tile systems differ in size, shape and aesthetic appeal between manufacturers, they are often replaced with the same brand for R&R projects. As a result, the leading brand's installed base of product generates built in demand for replacement
4
product over time. Because we have exclusive access to that brand in certain markets, we benefit from these recurring sales.
Steel Framing
Our steel framing product line consists of steel track, studs and the various other steel products used to frame the interior walls of a commercial or institutional building. Typically the contractor who installs the steel framing also installs the wallboard, and the two products, along with ceilings, insulation and other products are sold together as part of a commercial package. Nearly all of our steel framing products are sold for use in commercial buildings.
Other Products
In addition to our three main product lines, we supply our customers with complementary products, including insulation, ready-mix joint compound and various other interior construction products. We also supply our customers with the ancillary products they need to complete the job including tools and safety products. We partner with leading branded vendors for many of these products and merchandise these products in showrooms that are adjacent to many of our warehouses.
Our Industry
As the U.S. construction market evolved during the second half of the 20th century, contractors began to specialize in specific trades within the construction process, and specialty distributors emerged to supply them. One of these trades was wallboard and ceilings installation, and we, along with other specialty distributors, tailored our product offerings and service capabilities to meet the unique needs of that trade. Today, specialty distributors comprise the preferred distribution channel for wallboard and ceilings in both the commercial and residential construction markets.
We believe the success of the specialty distribution model in wallboard and ceilings is driven by the strong value proposition provided to our customers. Given the logistical complexity of the distribution services we provide, the expertise needed to execute effectively, and the special equipment required, we believe specialty distributors focused on wallboard and ceilings are best suited to meet contractors’ needs. The main drivers for our products are commercial new construction, commercial R&R, residential new construction and residential R&R.
Commercial
Our addressable commercial construction market is comprised of a variety of commercial and institutional sub-segments with varying demand drivers. Our commercial markets include offices, hotels, retail stores and other commercial buildings, while our institutional markets include educational facilities, healthcare facilities, government buildings and other institutional facilities. The principal demand drivers across these markets include the overall economic outlook, the general business cycle, government spending, vacancy rates, employment trends, interest rates, availability of credit and demographic trends.
We believe commercial R&R spending is typically more stable than new commercial construction activity. Commercial R&R spending is driven by a number of factors, including commercial real estate prices and rental rates, office vacancy rates, government spending and interest rates. Commercial R&R spending is also driven by commercial lease expirations and renewals, as well as tenant turnover. Such events often result in repair, reconfiguration and/or upgrading of existing commercial space.
Residential
Residential construction activity is driven by a number of factors, including the overall economic outlook, employment, income growth, home prices, availability of mortgage financing, interest rates and consumer confidence, among others.
5
We believe residential R&R activity is typically more stable than new residential construction activity. The primary drivers of residential R&R spending include changes in existing home prices, existing home sales, the average age of the housing stock, consumer confidence and interest rates.
Our Growth Strategy
Our growth strategy entails taking market share within our existing footprint, expanding into new markets by opening new branches and strategic acquisitions. We expect to continue to capture profitable market share in our existing footprint by delivering industry-leading customer service. Our strategy for opening new branches is to further penetrate markets that are adjacent to our existing operations. Typically, we have pre-existing customer relationships in these markets but need a new location to fully capitalize on those relationships. Since May 1, 2013, we have opened 28 new branches and we currently expect to open several new branches each year depending on market conditions. In addition, we will continue to selectively pursue tuck-in acquisitions and have a dedicated team of professionals to manage the process. Due to the large, highly fragmented nature of our market and our reputation throughout the industry, we believe we have the potential to access a robust acquisition pipeline that will continue to supplement our organic growth. We use a rigorous targeting process to identify acquisition candidates that will fit our culture and business model. As a result of our scale, purchasing power and ability to improve operations through implementing best practices, we believe we can achieve substantial synergies and drive earnings accretion from our acquisition strategy.
Customers
Our diverse customer base consists of more than 20,000 contractors as well as homebuilders. We maintain local relationships with our contractors through our network of branches and our extensive salesforce. We also serve our large homebuilder customers through our local branches, but are able to coordinate the relationships on a national basis through our Yard Support Center in Tucker, Georgia. Our ability to serve multi-regional homebuilders across their footprints provides value to them and differentiates us from most of our competitors. During fiscal 2018 and 2017, our single largest customer accounted for 1.9% of our net sales and our top ten customers accounted for 8.5% and 8.7% of our net sales, respectively.
Suppliers
Our leading market position, national footprint and superior service capabilities have allowed us to develop strong relationships with our suppliers. We maintain exceptional, long-term relationships with all seven major North American wallboard manufacturers, as well as the three major ceilings manufacturers: Armstrong World Industries, Inc., or Armstrong, CertainTeed Corporation and USG Corporation, or USG. Because we account for a meaningful portion of their volumes and provide them with an extensive salesforce to market their products, we are viewed by our suppliers as a key channel partner. We believe this position provides us with advantaged procurement.
Sales and Marketing
Our sales and marketing strategy is to provide a comprehensive suite of high-quality products and superior services to contractors and builders reliably, safely, accurately and on-time. We have a highly experienced sales force who manage our customer relationships and grow our customer base. We have strategies to increase our customer base at both the corporate and local branch levels, which focus on building and growing strong relationships with our customers, whether they serve a small local market, or a national footprint. We believe that the experience and expertise of our salesforce differentiates us from our competition particularly in the commercial market, which requires a highly technical and specialized product knowledge and a sophisticated delivery plan.
Competition
We compete against other specialty distributors as well as big box retailers and lumberyards. Among specialty distributors, we compete against a small number of large distributors and many small, local, privately-owned distributors. Our largest competitors include: Allied Building Products (a subsidiary of Beacon Roofing Supply, Inc.), Foundation Building Materials and L&W Supply Co. Inc (a subsidiary of ABC Supply Company). However, we believe smaller, regional or local competitors still comprise approximately half of the North American specialty distribution market. The principal competitive factors in our business include, but are not limited to, availability of materials and
6
supplies; technical product knowledge and expertise; advisory or other service capabilities; delivery capabilities; pricing of products; and availability of credit.
Seasonality
In a typical year, our operating results are impacted by seasonality. Historically, sales of our products have been slightly higher in the first and second quarters of each fiscal year due to favorable weather and longer daylight conditions during these periods. Seasonal variations in operating results may be impacted by inclement weather conditions, such as cold or wet weather, which can delay construction projects.
Intellectual Property
We own United States trademark registrations for approximately 36 trademarks that we use in our business. Generally, registered trademarks have a perpetual life, provided that they are renewed on a timely basis and continue to be used properly as trademarks. We intend to maintain these trademark registrations as long as they remain valuable to our business. Other than certain of our local brands, the retention of which we believe helps maintain customer loyalty, we do not believe our business is dependent to a material degree on trademarks, patents, copyrights or trade secrets. In addition, other than commercially available software licenses, we do not believe that any of our licenses for third-party intellectual property are material to our business, taken as a whole.
Employees
As of April 30, 2018, we had over 4,600 employees. We do not have a significant amount of employees affiliated with labor unions. We believe that we have good relations with our employees. Additionally, we believe that the training provided through our employee development programs and our entrepreneurial, performance-based culture provides significant benefits to our employees.
Government Regulation
While we are not engaged in a “regulated industry,” we are subject to various federal, state and local government regulations applicable to the business in the jurisdictions in which we operate, including laws and regulations relating to our relationships with our employees, public health and safety, workplace safety, transportation, zoning and fire codes. We strive to operate each of our branches in accordance with applicable laws, codes and regulations. We believe we are in compliance in all material respects with existing applicable environmental laws and regulations and, in addition, that our employment, workplace health and workplace safety practices comply with related regulations.
Our operations in domestic interstate commerce are subject to the regulatory jurisdiction of the Department of Transportation, or DOT, which has broad administrative powers with respect to our transportation operations. We are subject to safety requirements governing interstate operations prescribed by the DOT. Vehicle dimension and driver hours of service also are subject to both federal and state regulations. See Item 1A, “Risk Factors—Risks Relating to Our Business and Industry—Federal, state, local and other regulations could impose substantial costs and restrictions on our operations that would reduce our net income.” Our operations are also subject to the regulatory jurisdiction of the Occupational Safety and Health Administration, or OSHA, which has broad administrative powers with respect to workplace and jobsite safety.
Environmental, Health and Safety
We are subject to various federal, state and local environmental, health and safety laws and regulations, including laws and regulations governing the investigation and cleanup of contaminated properties, air emissions, water discharges, waste management and disposal, product safety and workplace health and safety. These laws and regulations impose a variety of requirements and restrictions on our operations and the products we distribute. The failure by us to comply with these laws and regulations could result in fines, penalties, enforcement actions, third party claims, damage to property or natural resources and personal injury, requirements to investigate or clean up property or to pay for the costs of investigation or cleanup, or regulatory or judicial orders requiring corrective measures, including the installation
7
of pollution control equipment or remedial actions and could negatively impact our reputation with customers. Environmental, health and safety laws and regulations applicable to our business, the products we distribute and the business of our customers, and the interpretation or enforcement of these laws and regulations, are constantly evolving and it is impossible to predict accurately the effect that changes in these laws and regulations, or their interpretation or enforcement, may have upon our business, financial condition or results of operations. Should environmental, health and safety laws and regulations, or their interpretation or enforcement, become more stringent, our costs, or the costs of our customers, could increase, which may have an adverse effect on our business, financial position, results of operations or cash flows.
Under certain laws and regulations, such as the U.S. federal Superfund law or its state equivalents, the obligation to investigate, remediate, monitor and clean up contamination at a facility may be imposed on current and former owners, lessees or operators or on persons who may have sent waste to that facility for disposal. Liability under these laws and regulations may be imposed without regard to fault or to the legality of the activities giving rise to the contamination. Moreover, we may incur liabilities in connection with environmental conditions currently unknown to us relating to our prior, existing or future owned or leased sites or operations or those of predecessor companies whose liabilities we may have assumed or acquired.
Available Information
We are subject to the informational requirements of the Securities Exchange Act of 1934, as amended, and in accordance therewith, we file reports, proxy and information statements and other information with the Securities and Exchange Commission (“SEC”). Our Annual Report on Form 10-K, Quarterly Reports on Form 10-Q, Current Reports on Form 8-K, and any amendments to these reports filed or furnished pursuant to Section 13(a) or 15(d) of the Exchange Act are available through the investor relations section of our website at www.gms.com. Reports are available free of charge as soon as reasonably practicable after we electronically file them with, or furnish them to, the SEC. The information contained on our website is not incorporated by reference into this Annual Report on Form 10-K.
In addition to our website, you may read and copy public reports we file with or furnish to the SEC at the SEC's Public Reference Room at 100 F Street, NE, Washington, DC 20549. You may obtain information on the operation of the Public Reference Room by calling the SEC at 1-800-SEC-0330. The SEC maintains an Internet site that contains our reports, proxy and information statements, and other information that we file electronically with the SEC at www.sec.gov.
8
The following risk factors may be important to understanding any statement in this Annual Report on Form 10-K or elsewhere. Our business, financial condition and operating results can be affected by a number of factors, whether currently known or unknown, including but not limited to those described below. Any one or more of such factors could directly or indirectly cause our actual results of operations and financial condition to vary materially from past or anticipated future results of operations and financial condition. Any of these factors, in whole or in part, could materially and adversely affect our business, financial condition, results of operations and stock price.
Risks Related to our Business and Industry
Our business is affected by general business, financial market and economic conditions, which could adversely affect our results of operations.
Our business and results of operations are significantly affected by general business, financial market and economic conditions. General business, financial market and economic conditions that could impact the level of activity in the commercial and residential construction and the R&R markets include, among others, interest rate fluctuations, inflation, unemployment levels, tax rates, capital spending, bankruptcies, volatility in both the debt and equity capital markets, liquidity of the global financial markets, the availability and cost of credit, investor and consumer confidence, global economic growth, local, state and federal government regulation and the strength of regional and local economies in which we operate.
There was a significant decline in economic growth, both in the United States and worldwide, that began in the second half of 2007 and continued through 2011. During this period, the U.S. construction markets we serve experienced unprecedented declines since the post-World War II era. Since that time economic growth has recovered. However, there can be no guarantee that improvement in these markets will be sustained or continue.
Our sales are in part dependent upon the commercial new construction market and the commercial R&R market.
The downturn from 2007 to 2011 in the U.S. commercial new construction market was one of the most severe of the last 40 years. Previously, such downturns in the construction industry have typically lasted about 2 to 3 years, resulting in market declines of approximately 20% to 40%, while the 2007 to 2011 downturn in the commercial construction market lasted over 4 years, resulting in a market decline of approximately 60%. According to Dodge Data & Analytics, commercial construction put in place began to recover in 2013 and continued to increase in 2017. However, 2017 levels of new commercial construction square footage put in place, measured by square footage of construction, are still well below the historical market average of 1.3 billion square feet annually since 1970. We cannot predict the duration of the current market conditions or the timing or strength of any future recovery of commercial construction activity in our markets. Continued weakness in the commercial construction market and the commercial R&R market, would have a significant adverse effect on our business, financial condition and operating results. Continued uncertainty about current economic conditions will continue to pose a risk to our business that serves the commercial construction and R&R markets as participants in this industry may postpone spending in response to tighter credit, negative financial news and/or declines in income or asset values, which could have a continued material negative effect on the demand for our products and services.
Our sales are also in part dependent upon the residential new construction market and home R&R activity.
The distribution of our products, particularly wallboard, to contractors serving the residential market represents a significant portion of our business. Though its cyclicality has historically been somewhat moderated by R&R activity, wallboard demand is highly correlated with housing starts. Housing starts and R&R activity, in turn, are dependent upon a number of factors, including housing demand, housing inventory levels, housing affordability, foreclosure rates, geographical shifts in the population and other changes in demographics, the availability of land, local zoning and permitting processes, the availability of construction financing and the health of the economy and mortgage markets. Unfavorable changes in any of these factors beyond our control could adversely affect consumer spending, result in decreased demand for homes and adversely affect our business.
9
The homebuilding industry experienced a significant downturn from 2007 to 2011. This decrease in homebuilding activity led to a steep decline in wallboard demand which, in turn, had a significant adverse effect on our business during this time. Since that time U.S. housing starts have recovered and, according to the U.S. Census Bureau, reached 1.2 million in 2017. Despite the growth over this period, U.S. housing start activity remains below their long-term historical averages. In addition, some analysts project that the demand for residential construction may be negatively impacted as the number of renting households has increased in recent years and a shortage in the supply of affordable housing is expected to result in lower home ownership rates. The timing and extent of the continued recovery in homebuilding and the resulting impact on demand for our products are uncertain. Further, even if homebuilding activity fully recovers, the impact of such recovery on our business may be suppressed if, for example, the average selling price or average size of new single family homes decreases, which could cause homebuilders to decrease spending on our services and the products we distribute.
Beginning in 2007, the mortgage markets were also substantially disrupted as a result of increased defaults, primarily due to weakened credit quality of homeowners. In reaction to the disruption in the mortgage markets, stricter regulations and financial requirements were adopted and the availability of mortgages for potential homebuyers was significantly reduced as a result of a limited credit market and stricter standards to qualify for mortgages. Mortgage financing and commercial credit for smaller homebuilders, as well as for the development of new residential lots, continue to be constrained. If the residential construction industry continues to experience weakness and a reduction in activity, our business, financial condition and operating results will be significantly and adversely affected.
We also rely, in part, on home R&R activity. High unemployment levels, high mortgage delinquency and foreclosure rates, lower home prices, limited availability of mortgage and home improvement financing and significantly lower housing turnover may restrict consumer spending, particularly on discretionary items such as home improvement projects, and affect consumer confidence levels leading to reduced spending in the R&R end markets. We cannot predict the timing or strength of a significant recovery in R&R activity, if any. Furthermore, consumer preferences and purchasing practices and the strategies of our customers may adjust in a manner that could result in changes to the nature and prices of products demanded by the end consumer and our customers and could adversely affect our business and results of operations.
Our industry and the markets in which we operate are highly fragmented and competitive, and increased competitive pressure may adversely affect our results.
We currently compete in the wallboard, ceilings and complementary interior construction products distribution markets primarily with smaller distributors, but we also face competition from a number of national and multi-regional distributors of building materials, some of which are larger and have greater financial resources than us.
Competition varies depending on product line, type of customer and geographic area. If our competitors have greater financial resources, they may be able to offer higher levels of service or a broader selection of inventory than we can. As a result, we may not be able to continue to compete effectively with our competitors. Any of our competitors may (i) foresee the course of market development more accurately than we do, (ii) provide superior service and sell or distribute superior products, (iii) have the ability to supply or deliver similar products and services at a lower cost, (iv) develop stronger relationships with our customers and other consumers in the industry in which we operate, (v) adapt more quickly to evolving customer requirements than we do, (vi) develop a superior network of distribution centers in our markets or (vii) access financing on more favorable terms than we can obtain. As a result, we may not be able to compete successfully with our competitors.
Competition can also reduce demand for our products, negatively affect our product sales or cause us to lower prices. The consolidation of homebuilders may result in increased competition for their business. Certain product manufacturers that sell and distribute their products directly to homebuilders may increase the volume of such direct sales. Our suppliers may also elect to enter into exclusive supplier arrangements with other distributors.
Our customers consider the performance of the products we distribute, our customer service and price when deciding whether to use our services or purchase the products we distribute. Excess industry capacity for certain products in several geographic markets could lead to increased price competition. We may be unable to maintain our operating costs or product prices at a level that is sufficiently low for us to compete effectively. If we are unable to
10
compete effectively with our existing competitors or new competitors enter the markets in which we operate, our financial condition, operating results and cash flows may be adversely affected.
We are subject to significant pricing pressures.
Large contractors and homebuilders in both the commercial and residential industries have historically been able to exert significant pressure on their outside suppliers and distributors to keep prices low in the highly fragmented building products supply and services industry. The downturn from 2007 to 2011 in the construction industry significantly increased the pricing pressures from homebuilders and other customers. In addition, continued consolidation in the commercial and residential industries and changes in builders’ purchasing policies and payment practices could result in even further pricing pressure. A decline in the prices of the products we distribute could adversely impact our operating results. When the prices of the products we distribute decline, customer demand for lower prices could result in lower sales prices and, to the extent that our inventory at the time was purchased at higher costs, lower margins. Alternatively, due to the rising market price environment, our suppliers may increase prices or reduce discounts on the products we distribute and we may be unable to pass on any cost increase to our customers, thereby resulting in reduced margins and profits. Overall, these pricing pressures may adversely affect our operating results and cash flows.
The trend toward consolidation in our industry may negatively impact our business.
Customer demands and supplier capabilities have resulted in consolidation in our industry, which could cause markets to become more competitive as greater economies of scale are achieved by distributors that are able to efficiently expand their operations. We believe these customer demands could result in fewer overall distributors operating multiple locations. There can be no assurance that we will be able to effectively take advantage of this trend toward consolidation which may make it more difficult for us to maintain operating margins and could also increase the competition for acquisition targets in our industry, resulting in higher acquisition costs and prices.
We may be unable to successfully implement our growth strategy, which includes pursuing strategic acquisitions and opening new branches.
Our long-term business strategy depends in part on increasing our sales and growing our market share through strategic acquisitions and opening new branches. If we fail to identify and acquire suitable acquisition targets on appropriate terms, our growth strategy may be materially and adversely affected. Further, if our operating results decline as a result of reduced activity in the residential or commercial construction markets, we may be unable to obtain the capital required to effect new acquisitions or open new branches.
In addition, we may not be able to integrate the operations of future acquired businesses in an efficient and cost-effective manner or without significant disruption to our existing operations. Moreover, acquisitions involve significant risks and uncertainties, including uncertainties as to the future financial performance of the acquired business, difficulties integrating acquired personnel and corporate cultures into our business, the potential loss of key employees, customers or suppliers, difficulties in integrating different computer and accounting systems, exposure to unknown or unforeseen liabilities of acquired companies, difficulties implementing disclosure controls and procedures and internal control over financial reporting for the acquired businesses, and the diversion of management attention and resources from existing operations. We may be unable to successfully complete potential acquisitions due to multiple factors, such as issues related to regulatory review of the proposed transactions. We may also be required to incur additional debt in order to consummate acquisitions in the future, which debt may be substantial and may limit our flexibility in using our cash flow from operations. Our failure to integrate future acquired businesses effectively or to manage other consequences of our acquisitions, including increased indebtedness, could prevent us from remaining competitive and, ultimately, could adversely affect our financial condition, operating results and cash flows.
In addition, if we finance acquisitions by issuing our equity securities or securities convertible into our equity securities, our existing stockholders would be diluted, which, in turn, could adversely affect the market price of our common stock. We could also finance an acquisition with debt, resulting in higher leverage and interest costs relating to the acquisition. As a result, if we fail to evaluate and execute acquisitions efficiently, we may not ultimately experience the anticipated benefits of the acquisitions, and we may incur costs that exceed our expectations.
11
We may not be able to expand into new geographic markets, which may impact our ability to grow our business.
We intend to continue to pursue our growth strategy to expand into new geographic markets for the foreseeable future. Our expansion into new geographic markets may present competitive, distribution and other challenges that differ from the challenges we currently face. In addition, we may be less familiar with the customers in these markets and may ultimately face different or additional risks, as well as increased or unexpected costs, compared to those we experience in our existing markets. Expansion into new geographic markets may also expose us to direct competition with companies with whom we have limited or no past experience as competitors. To the extent we rely upon expanding into new geographic markets and do not meet, or are unprepared for, any new challenges posed by such expansion, our future sales growth could be negatively impacted, our operating costs could increase, and our business operations and financial results could be negatively affected.
We may be unable to fully realize expected benefits from our recent acquisition of Titan.
On June 1, 2018, we acquired all of the outstanding equity interests of WSB Titan (“Titan”), a distributer of drywall, lumber, commercial and residential building materials. Titan is Canada’s largest gypsum specialty distributer with 30 locations across five provinces in Canada. We expect to achieve operating and capital synergies as a result of our acquisition of Titan. If we are unable to successfully integrate the business, or integrate them in a timely fashion, we may face material adverse effects including, but not limited to the diversion of the attention of management and key personnel and potential disruption of our ongoing businesses; customer losses; the loss of quality employees; adverse developments in vendor relationships; declines in our results of operations and financial condition; and a decline in the market price of our common stock. Even if we successfully integrate the businesses, there can be no assurance that the integration will result in the realization of the full benefit of the anticipated synergies and cost savings or that these benefits will be realized within the expected time frames.
Product shortages, loss of key suppliers or failure to develop relationships with qualified suppliers, and our dependence on third-party suppliers and manufacturers could affect our financial health.
We distribute wallboard, ceilings and related specialty building materials that are manufactured by a number of major suppliers. Our ability to offer a wide variety of products to our customers is dependent upon our ability to obtain adequate product supply from manufacturers and other suppliers. Generally, the products we distribute are obtainable from various sources and in sufficient quantities. Any disruption in our sources of supply, particularly of the most commonly sold items, could result in a loss of revenues, reduced margins and damage to our relationships with customers. Supply shortages may occur as a result of unanticipated increases in demand, shortage of raw materials, including the availability of synthetic gypsum, or difficulties in production or delivery. When shortages occur, our suppliers often allocate products among distributors. The loss of, or a substantial decrease in the availability of, products from our suppliers or the loss of key supplier arrangements, such as those whereby we are afforded exclusive distribution rights in certain geographic areas, could adversely impact our financial condition, operating results and cash flows. For example, if our relationship with Armstrong were to be damaged or lost, our financial condition, operating results and cash flows may suffer.
Our ability to maintain relationships with qualified suppliers who can satisfy our high standards for quality and our need to be supplied with products in a timely and efficient manner is a significant challenge. Our suppliers' ability to provide us with products can also be adversely affected in the event they become financially unstable, particularly in light of continuing economic difficulties in various regions of the United States and the world, fail to comply with applicable laws, encounter supply disruptions, shipping interruptions or increased costs, or they become faced with other factors beyond our control.
Although in some instances we have agreements with our suppliers, these agreements are generally terminable by either party on limited notice. If market conditions change, suppliers may stop offering us favorable terms. Failure by our suppliers to continue to supply us with products on favorable terms, commercially reasonable terms, or at all, could put pressure on our operating margins or have a material adverse effect on our financial condition, operating results and cash flows.
12
The commercial and residential construction markets are seasonal.
The markets in which we operate are seasonal. Although weather patterns affect our operating results throughout the year, the months of November through February have historically been, and are generally expected to continue to be, adversely affected by weather patterns in some of our markets, causing reduced commercial and residential construction activity. We experience seasonal variation as a result of our customers' dependence on suitable weather to engage in construction, R&R projects. For example, during the winter months, construction activity generally declines due to inclement weather and shorter daylight hours. In addition, to the extent that hurricanes, severe storms, earthquakes, floods, fires, other natural disasters or similar events occur in the markets in which we operate, our business may be adversely affected. As a result, our operating results have historically varied significantly between fiscal quarters, and we anticipate that we will continue to experience these quarterly fluctuations in the future.
The loss of any of our significant customers or a reduction in the quantity of products they purchase could affect our financial health.
Our ten largest customers generated approximately 8.5%, 8.7% and 9.0% of our net sales in the aggregate for fiscal 2018, 2017 and 2016, respectively. We cannot guarantee that we will maintain or improve our relationships with these customers, or successfully assume the customer relationships of any businesses that we acquire, or that we will continue to supply these customers at historical levels. Due to the weak housing market in recent years in comparison to long-term averages, many of our homebuilder customers substantially reduced their construction activity. Some of our homebuilder customers exited or severely curtailed building activity in certain of our markets.
In addition, professional homebuilders, commercial builders and other customers may: (i) purchase some of the products that we currently sell and distribute directly from manufacturers; (ii) elect to establish their own building products manufacturing and distribution facilities; or (iii) give advantages to manufacturing or distribution intermediaries in which they have an economic stake. Continued consolidation among professional homebuilders and commercial builders could also result in a loss of some of our present customers to our competitors. The loss of one or more of our significant customers or deterioration in our existing relationships with any of our customers could adversely affect our financial condition, operating results and cash flows. Furthermore, our customers typically are not required to purchase any minimum amount of products from us. Should our customers purchase the products we distribute in significantly lower quantities than they have in the past, or should the customers of any businesses that we acquire purchase products from us in significantly lower quantities than they had prior to our acquisition of the business, such decreased purchases could have a material adverse effect on our financial condition, operating results and cash flows.
We are exposed to product liability, warranty, casualty, construction defect, contract, tort, employment and other claims and legal proceedings related to our business, the products we distribute, the services we provide and services provided for us by third parties.
In the ordinary course of business, we are subject to various claims and litigation. Any such claims, whether with or without merit, could be time consuming and expensive to defend and could divert management's attention and resources. The building materials industry has been subject to personal injury and property damage claims arising from alleged exposure to raw materials contained in building products as well as claims for incidents of catastrophic loss, such as building fires. As a distributor of building materials, we face an inherent risk of exposure to product liability claims in the event that the use of the products we have distributed in the past or may in the future distribute is alleged to have resulted in economic loss, personal injury or property damage or violated environmental, health or safety or other laws. Such product liability claims have included and may in the future include allegations of defects in manufacturing, defects in design, a failure to warn of dangers inherent in the product, negligence, strict liability or a breach of warranties. In particular, certain of our subsidiaries have been the subject of claims related to alleged exposure to asbestos-containing products they distributed prior to 1979, which have not materially impacted our financial condition or operating results. See “Item 3, Legal Proceedings.” We are also from time to time subject to casualty, contract, tort and other claims relating to our business, the products we have distributed in the past or may in the future distribute, and the services we have provided in the past or may in the future provide, either directly or through third parties. If any such claim were adversely determined, our financial condition, operating results and cash flows could be adversely affected if we were unable to seek indemnification for such claims or were not adequately insured for such claims. We rely on manufacturers and other suppliers to provide us with the products we sell or distribute. Since we do not have direct
13
control over the quality of products that are manufactured or supplied to us by third-parties, we are particularly vulnerable to risks relating to the quality of such products. In addition, we are exposed to potential claims arising from the conduct of our employees, builders and their subcontractors, and third-party installers for which we may be liable. We and they are subject to regulatory requirements and risks applicable to general contractors, which include management of licensing, permitting and quality of third-party installers. As they apply to our business, if we fail to manage these processes effectively or provide proper oversight of these services, we could suffer lost sales, fines and lawsuits, as well as damage to our reputation, which could adversely affect our business and the results of our operations.
In addition, claims and investigations may arise related to distributor relationships, commercial contracts, antitrust or competition law requirements, employment matters, employee benefits issues and other compliance and regulatory matters, including anti-corruption and anti-bribery matters. While we have processes and policies designed to mitigate these risks and to investigate and address such claims as they arise, we cannot predict or, in some cases, control the costs to defend or resolve such claims.
Although we believe we currently maintain suitable and adequate insurance in excess of our self-insured amounts, there can be no assurance that we will be able to maintain such insurance on acceptable terms or that such insurance will provide adequate protection against potential liabilities, and the cost of any product liability, warranty, casualty, construction defect, contract, tort, employment or other litigation or other proceeding, even if resolved in our favor, could be substantial. Additionally, we do not carry insurance for all categories of risk that our business may encounter. Any significant uninsured liability may require us to pay substantial amounts. There can be no assurance that any current or future claims will not adversely affect our financial position, cash flows or results of operations.
Our operations are subject to various hazards that may cause personal injury or property damage and increase our operating costs, and which may exceed the coverage of our insurance.
There are inherent risks to our operations. Our delivery employees are subject to the usual hazards associated with providing services on construction sites, while our distribution center personnel are subject to the hazards associated with moving and storing large quantities of heavy materials. In addition, we employ drivers in connection with our distribution operations and, from time to time, these drivers are involved in accidents which may cause injuries and in which goods carried by these drivers may be lost or damaged. Our trucks with articulating boom loaders, particularly when loaded, expose our drivers and others to traffic hazards.
Operating hazards can cause personal injury and loss of life, damage to or destruction of property, building and equipment and environmental damage, and we cannot eliminate these risks. We maintain vehicle and commercial insurance to cover property damages and personal injuries resulting from traffic accidents, and rely on state mandated social insurance for work-related injuries of our employees. Nevertheless, any claim that exceeds the scope of our insurance coverage, if successful and of sufficient magnitude, could result in the incurrence of substantial costs and the diversion of resources, which could have a material adverse effect on us. A material increase in the frequency or severity of accidents, claims for lost or damaged goods, liability claims, workers’ compensation claims, or unfavorable resolutions of any such claims could also adversely affect our results of operations to the extent such claims are not covered by our insurance or such losses exceed our reserves. Further, significant increases in insurance costs or the inability to purchase insurance as a result of these claims could reduce our profitability and have an adverse effect on our results of operations. The timing of the incurrence of these costs could significantly and adversely impact our operating results compared to prior periods.
Failure to attract and retain key employees could have a significant adverse effect on our business.
Our success depends to a large extent on our ability to attract, hire, train and retain qualified managerial, operational, sales and other personnel. We face significant competition for qualified and experienced employees in our industry and from other industries and, as a result, we may be unable to attract and retain the personnel needed to successfully conduct and grow our operations. Additionally, key personnel, including members of management and our sales team with key customer relationships, may leave and compete against us.
Our continued success also depends to a significant degree on the continued service of our senior management team. With an average of over 25 years of experience in the building products distribution sector, our senior
14
management team has been integral to our successful acquisition and integration of businesses to grow our market share. The loss of any member of our senior management team or other experienced, senior employees or sales team members could significantly impair our ability to execute our business plan, cause us to lose customers and reduce our net sales, or lead to challenges with employee morale and the loss of other key employees. In any such event, our financial condition, operating results and cash flows could be adversely affected.
Additionally, the downturn from 2007 to 2011 in the general economy and the markets we serve resulted in a reduction of the workforce in the construction industry. There can be no assurance that we or our customers will be able to efficiently attract employees as activity in the markets we serve returns to historical levels. As a result, we and our customers may experience higher costs in attracting and retaining such employees. Any significant increases in these costs may have an adverse effect on our financial position, cash flows or results of operations.
Higher health care costs and labor costs could adversely affect our business.
As a result of the passage in 2010 of the U.S. Patient Protection and Affordable Care Act, or the ACA, we are required to provide affordable coverage, as defined in the ACA, to all employees, or otherwise be subject to a payment per employee based on the affordability criteria in the ACA. Additionally, some states and localities have passed state and local laws mandating the provision of certain levels of health benefits by some employers. Efforts to modify, repeal or otherwise invalidate all, or certain provisions of, the ACA and/or adopt a replacement healthcare reform law may impact our employee healthcare costs. At this time, there is uncertainty concerning whether the ACA will be repealed or what requirements will be included in a new law, if enacted. Increased health care and insurance costs as well as other changes in federal or state workplace regulations could have a material adverse effect on our business, financial condition and results of operations.
Various federal and state labor laws govern our relationships with our employees and affect our operating costs. These laws include employee classifications as exempt or non-exempt, minimum wage requirements, unemployment tax rates, workers' compensation rates, overtime, family leave, safety standards, payroll taxes, citizenship requirements and other wage and benefit requirements for employees classified as non-exempt. As our employees may be paid at rates that relate to the applicable minimum wage, further increases in the minimum wage could increase our labor costs. Significant additional government regulations could materially affect our business, financial condition and results of operations.
In addition, we compete with other companies for many of our employees in hourly positions, and we invest significant resources to train and motivate our employees to maintain a high level of job satisfaction. Our hourly employment positions have historically had high turnover rates, which can lead to increased spending on training and retention and, as a result, increased labor costs. If we are unable to effectively retain highly qualified employees in the future, it could adversely impact our operating results.
The majority of our net sales are credit sales that are made primarily to customers whose ability to pay is dependent, in part, upon the economic strength of the industry and geographic areas in which they operate, and the failure to collect or timely collect monies owed from customers could adversely affect our financial condition.
The majority of our net sales volume is facilitated through the extension of credit to our customers whose ability to pay is dependent, in part, upon the economic strength of the industry in the areas where they operate. We offer credit to customers, either through unsecured credit that is based solely upon the creditworthiness of the customer, or secured credit for materials sold for a specific construction project where we establish a security interest in the material used in the project. The type of credit we offer depends both on the customer's financial strength and the nature of the business in which the customer is involved. End users, resellers and other non-contractor customers typically purchase more on unsecured credit than secured credit. If any of our customers are unable to repay credit that we have extended in a timely manner, or at all, our financial condition, operating results and cash flows would be adversely affected. Further, our collections efforts with respect to non-paying or slow-paying customers could negatively impact our customer relations going forward.
Because we depend on certain of our customers to repay extensions of credit, if the financial condition of our customers declines, our credit risk could increase as a result. Significant contraction in the commercial and residential construction markets, coupled with limited credit availability and stricter financial institution underwriting standards,
15
could adversely affect the operations and financial stability of certain of our customers. Should one or more of our larger customers declare bankruptcy, it could adversely affect the collectability of our accounts receivable, bad debt reserves and net income.
We occupy many of our facilities under long-term non-cancellable leases, and we may be unable to renew our leases at the end of their terms.
Many of our facilities and distribution centers are located on leased premises subject to non-cancellable leases. Typically, our leases have initial terms ranging from three to five years, with options to renew for specified periods of time. We believe that our future leases will likely also be long-term and non-cancellable and have similar renewal options. If we close or stop fully utilizing a facility, we will most likely remain obligated to perform under the applicable lease, which would include, among other things, making the base rent payments, and paying insurance, taxes and other expenses on the leased property for the remainder of the lease term. Our future minimum aggregate rental commitments for leases for our facilities and distribution centers, as of April 30, 2018, was $113.6 million, of which $112.6 million is currently not reflected as liabilities on our consolidated balance sheet. Our inability to terminate a lease when we stop fully utilizing a facility or exit a geographic market can have a significant adverse impact on our financial condition, operating results and cash flows.
In addition, at the end of the lease term and any renewal period for a facility, we may be unable to renew the lease without substantial additional cost, if at all. If we are unable to renew our facility leases, we may close or relocate a facility, which could subject us to construction and other costs and risks, which in turn could have a material adverse effect on our business and operating results. Further, we may not be able to secure a replacement facility in a location that is as commercially viable, including access to rail service, as the lease we are unable to renew. Having to close a facility, even briefly to relocate, would reduce the sales that such facility would have contributed to our revenues. Additionally, a relocated facility may generate less revenue and profit, if any, than the facility it was established to replace.
We may be unable to effectively manage our inventory and working capital as our sales volume increases or the prices of the products we distribute fluctuate, which could have a material adverse effect on our business, financial condition and operating results.
We purchase certain products, including wallboard, ceilings, steel framing and other specialty building materials, from manufacturers which are then sold and distributed to customers. We must maintain, and have adequate working capital to purchase, sufficient inventory to meet customer demand. Due to the lead times required by our suppliers, we order products in advance of expected sales. As a result, we are required to forecast our sales and purchase accordingly. In periods characterized by significant changes in economic growth and activity in the commercial and residential building and home R&R industries, it can be especially difficult to forecast our sales accurately. We must also manage our working capital to fund our inventory purchases. Excessive increases in the market prices of certain building products, such as wallboard, ceilings and steel framing, can put negative pressure on our operating cash flows by requiring us to invest more in inventory. In the future, if we are unable to effectively manage our inventory and working capital as we attempt to expand our business, our cash flows may be negatively affected, which could have a material adverse effect on our business, financial condition and operating results.
An impairment of goodwill could have a material adverse effect on our financial condition and results of operations.
As April 30, 2018, we had $427.6 million of goodwill. We perform an impairment test of our goodwill annually during the fourth quarter of our fiscal year or when events occur or circumstances change that would more-likely-than-not indicate that goodwill might be impaired. Factors that may be considered a change in circumstances, indicating that the carrying value of our goodwill may not be recoverable, include a decline in stock price and market capitalization, reduced future cash flow estimates and slower growth rates in our industry. Our annual impairment tests resulted in no impairment of goodwill during fiscal 2018, 2017 and 2016. However, deterioration in estimated future cash flows in our reporting units could result in future goodwill impairment. Changes to our business strategy, changes in industry or market conditions, changes in operating performance or other indicators of impairment could cause us to record a significant impairment charge during the period in which the impairment is determined, negatively impacting our results of operations and financial position.
16
Federal, state, local and other regulations could impose substantial costs and restrictions on our operations that would reduce our net income.
We are subject to various federal, state, local and other laws and regulations, including, among other things, transportation regulations promulgated by the U.S. Department of Transportation, or the DOT, work safety regulations promulgated by the Occupational Safety and Health Administration, or OSHA, employment regulations promulgated by the U.S. Equal Employment Opportunity Commission, regulations of the U.S. Department of Labor, accounting standards issued by the Financial Accounting Standards Board or similar entities, and state and local zoning restrictions, building codes and contractors' licensing regulations. More burdensome regulatory requirements in these or other areas may increase our general and administrative costs and adversely affect our financial condition, operating results and cash flows. Moreover, failure to comply with the regulatory requirements applicable to our business could expose us to litigation and substantial fines and penalties that could adversely affect our financial condition, operating results and cash flows.
Our transportation operations, upon which we depend to distribute products from our distribution centers, are subject to the regulatory jurisdiction of the DOT, which has broad administrative powers with respect to our transportation operations. Vehicle dimensions and driver hours of service also are subject to both federal and state regulation. More restrictive limitations on vehicle weight and size, trailer length and configuration, or driver hours of service would increase our costs, which, if we are unable to pass these cost increases on to our customers, may increase our selling, general and administrative expenses and adversely affect our financial condition, operating results and cash flows. If we fail to comply adequately with the DOT regulations or regulations become more stringent, we could experience increased inspections, regulatory authorities could take remedial action including imposing fines or shutting down our operations or we could be subject to increased audit and compliance costs. If any of these events were to occur, our financial condition, operating results and cash flows would be adversely affected.
In addition, the commercial and residential construction industries are subject to various local, state and federal statutes, ordinances, codes, rules and regulations concerning zoning, building design and safety, construction, contractor licensing, energy conservation and similar matters, including regulations that impose restrictive zoning and density requirements on the residential new construction industry or that limit the number of homes or other buildings that can be built within the boundaries of a particular area. Regulatory restrictions may increase our operating expenses and limit the availability of suitable building lots for our customers, any of which could negatively affect our business, financial condition and results of operations.
Compliance with environmental, health and safety laws and regulations could be expensive. Failure to comply with environmental, health and safety laws and regulations could subject us to significant liability.
We are subject to various federal, state and local environmental, health and safety laws and regulations, including laws and regulations governing the investigation and cleanup of contaminated properties, air emissions, water discharges, waste management and disposal, product safety and the health and safety of our employees and customers. These laws and regulations impose a variety of requirements and restrictions on our operations and the products we distribute. Our failure to comply with these laws and regulations could result in fines, penalties, enforcement actions, third party claims, damage to property or natural resources and personal injury, requirements to investigate or cleanup property or to pay for the costs of investigation or cleanup, or regulatory or judicial orders requiring corrective measures, including the installation of pollution control equipment or remedial actions and could negatively impact our reputation with customers. Environmental, health and safety laws and regulations applicable to our business, the products we distribute and the business of our customers, and the interpretation or enforcement of these laws and regulations, are constantly evolving and it is difficult to accurately predict the effect that changes in these laws and regulations, or their interpretation or enforcement, may have upon our business, financial condition or results of operations. Should environmental, health and safety laws and regulations, or their interpretation or enforcement, become more stringent, our costs, or the costs of our customers, could increase, which may have an adverse effect on our business, financial position, results of operations or cash flows.
Under certain environmental laws and regulations, such as the U.S. federal Superfund law or its state equivalents, the obligation to investigate, remediate, monitor and clean up contamination at a facility may be imposed on current and former owners, lessees or operators or on persons who may have sent waste to that facility for disposal. Liability under these laws and regulations may be imposed without regard to fault or to the legality of the activities
17
giving rise to the contamination. Contamination has been identified at several of our current and former facilities, and we have incurred and will continue to incur costs to investigate, remediate, monitor and otherwise address these conditions. Moreover, we may incur liabilities in connection with environmental conditions currently unknown to us relating to our prior, existing or future owned or leased sites or operations or those of predecessor companies whose liabilities we may have assumed or acquired.
Any significant fuel cost increases or shortages in the supply of fuel could disrupt our ability to distribute products to our customers, which could adversely affect our results of operations.
We currently use our own fleet of owned and leased delivery vehicles to service customers in the regions in which we operate. As a result, we are inherently dependent upon energy to operate and are impacted by changes in fuel prices. The cost of fuel is largely unpredictable and has a significant impact on our results of operations. Fuel availability, as well as pricing, is also impacted by political, economic and market factors that are outside our control. It is difficult to predict the future availability of fuel due to the following factors, among others:
|
· |
dependency on foreign imports of crude oil and the potential for hostilities or other conflicts in oil producing areas; |
|
· |
limited refining capacity; and |
|
· |
the possibility of changes in governmental policies on fuel production, transportation and marketing. |
Significant increases in the cost of fuel or disruptions in the supply of fuel could adversely affect our financial condition and results of operations.
Cybersecurity breaches could harm our business.
In the ordinary course of our business, we collect and store sensitive data, including our proprietary business information and that of our customers, suppliers and business partners, and personally identifiable information of our customers and employees, in our data centers and on our networks. The secure processing, maintenance and transmission of this information is critical to our operations. We have incurred costs and may incur significant additional costs in order to implement the security measures that we feel are appropriate to protect our IT systems. Our security measures are focused on the prevention, detection and remediation of damage from computer viruses, natural or man-made disasters, unauthorized access, cyber attacks and other similar disruptions. Despite our security measures, our IT systems and infrastructure may be vulnerable to attacks by hackers or breached due to employee error, malfeasance or other disruptions. To date, we have not experienced a material breach of our IT systems. Any attacks on our IT systems could result in our systems or data being breached or damaged by computer viruses or unauthorized physical or electronic access. Such a breach could result in not only business disruption, but also theft of our intellectual property or other competitive information or unauthorized access to controlled data and any personal information stored in our IT systems. To the extent that any data is lost or destroyed or any confidential information is inappropriately disclosed or used, it could adversely affect our competitive position or customer relationships. In addition, any such access, disclosure or other loss of information could result in legal claims or proceedings, liability under laws that protect the privacy of personal information, damage our reputation and cause a loss of confidence in our business, products and services, which could adversely affect our business, financial condition, profitability and cash flows.
A disruption of our IT systems could adversely impact our business and operations.
We rely on the accuracy, capacity and security of our IT systems, some of which are managed or hosted by third parties, and our ability to continually update these systems in response to the changing needs of our business. Our IT systems and those of our third-party service providers are vulnerable to damage or interruption from fires, earthquakes, hurricanes, tornados, floods and other natural disasters, terrorist attacks, power loss, capacity limitations, telecommunications failures, software and hardware defects or malfunctions, break-ins, sabotage and vandalism, human error and other disruptions that are beyond our control. We continue to invest capital to enhance, expand and increase the reliability of our network, but these capital expenditures may not achieve the results we expect. The occurrence of any disruption or system failure or other significant disruption to business continuity may result in a loss of business, increase expenses, damage our reputation or expose us to litigation and possible financial losses, any of which could adversely affect our business, results of operations and cash flows.
18
Natural or man-made disruptions to our facilities may adversely affect our business and operations.
We currently maintain a broad network of distribution facilities throughout the United States and Canada, as well as our corporate headquarters in Tucker, Georgia, which supports our branches with various back office functions. In the event any of our facilities are damaged or operations are disrupted from fire, earthquake, hurricanes and other weather-related events, an act of terrorism or any other cause, a significant portion of our inventory could be damaged and our ability to distribute products to customers could be materially impaired. Moreover, we could incur significantly higher costs and experience longer lead times associated with distributing products to our customers during the time that it takes for us to reopen or replace a damaged facility. Disruptions to the national or local transportation infrastructure systems, including those related to a domestic terrorist attack, may also affect our ability to keep our operations and services functioning properly. If any of these events were to occur, our financial condition, results of operations and cash flows could be materially adversely affected.
Anti-terrorism measures and other disruptions to the transportation network could impact our distribution system and our operations.
Our ability to efficiently distribute products to our customers is an integral component of our overall business strategy. In the aftermath of terrorist attacks in the United States, federal, state and local authorities have implemented and continue to implement various security measures that affect many parts of the transportation network in the United States. Our customers typically need quick delivery and rely on our on-time delivery capabilities. If security measures disrupt or impede the timing of our deliveries, we may fail to meet the needs of our customers, or may incur increased expenses to do so.
We may have exposure to greater than anticipated tax liabilities and we may be limited in the use of our net operating losses in the future.
Our future income taxes could be adversely affected by changes in tax laws, regulations, accounting principles or interpretations thereof. Our determination of our tax liability is always subject to review by applicable tax authorities. Any adverse outcome of such a review could have a negative effect on our operating results and financial condition. In addition, the determination of our provision for income taxes and other tax liabilities requires significant judgment, and there are many transactions and calculations where the ultimate tax determination is uncertain. Although we believe our estimates are reasonable, the ultimate tax outcome may differ from the amounts recorded in our financial statements and may materially affect our financial results in the period or periods for which such determination is made.
Our Canadian operations could have a material adverse effect on us.
On June 1, 2018, we acquired Titan, a distributer of drywall, lumber, commercial and residential building materials. Titan is Canada’s largest gypsum specialty distributer with 30 locations across five provinces in Canada. We are now subject to a number of risks specific to this country. We may also become subject to risks specific to other countries where we may complete acquisitions. These risks include social, political and economic instability, unexpected changes in regulatory requirements, tariffs and other trade barriers, currency exchange fluctuations, acts of war or terrorism and import/export requirements. Our financial statements are reported in U.S. dollars with international transactions being translated into U.S. dollars. Our exposure to currency rate fluctuations could be material in fiscal year 2019 and future years to the extent that currency rate changes are significant or that our international operations comprise a larger percentage of our consolidated results. We do not currently hedge the net investments in our foreign operations. There can be no assurances that any of these factors will not materially impact our production cost or otherwise have a material adverse effect on our business, financial condition and results of operations.
19
Risks Relating to Our Liquidity and Capital Resources
The agreements that govern our indebtedness contain various financial covenants that could limit our ability to engage in activities that may be in our best long-term interests.
The agreements that govern our indebtedness include covenants that, among other things, may impose significant operating and financial restrictions, including restrictions on our ability to engage in activities that may be in our best long-term interests. These covenants may restrict our ability to:
|
· |
incur additional indebtedness; |
|
· |
create or maintain liens on property or assets; |
|
· |
make investments, loans and advances; |
|
· |
sell certain assets or engage in acquisitions, mergers or consolidations; |
|
· |
redeem debt; |
|
· |
pay dividends and distributions; and |
|
· |
enter into transactions with affiliates. |
In addition, under the terms of our senior secured asset based revolving credit facility (the “ABL Facility”), we may at times be required to comply with a specified fixed charge coverage ratio. Our ability to meet this ratio could be affected by events beyond our control, and we cannot assure that we will meet this ratio.
A breach of any of the covenants under any of our debt agreements would result in a default under such agreement. If any such default occurs, the administrative agent under the agreement would be entitled to take various actions, including the acceleration of amounts due under the agreement and all actions permitted to be taken by a secured creditor. This could have serious adverse consequences on our financial condition and could cause us to become insolvent.
Our current indebtedness, degree of leverage and any future indebtedness we may incur, may adversely affect our cash flow, limit our operational and financing flexibility and negatively impact our business and our ability to make payments on our indebtedness and declare dividends and make other distributions.
As of June 1, 2018, after giving effect to the debt financing for our Titan acquisition, $996.8 million was outstanding under our senior secured first lien term loan facility (“the First Lien Facility”) and $172.2 million was available for future borrowings under our ABL Facility. We may incur substantial additional debt in the future. The ABL Facility, First Lien Facility and other debt instruments we may enter into in the future, may have significant consequences to our business and, as a result, may impact our stockholders, including:
|
· |
impairing our ability to obtain additional financing for working capital, capital expenditures, acquisitions or general corporate purposes; |
|
· |
requiring us to dedicate a significant portion of our cash flows from operations to pay interest on any outstanding indebtedness, which would reduce the funds available to us for operations and other purposes; |
|
· |
limiting our flexibility in planning for, or reacting to, changes in our business, the industries in which we operate; |
|
· |
making it more difficult for us to satisfy our obligations with respect to our indebtedness; |
|
· |
making us more vulnerable to adverse changes in general economic, industry and competitive conditions and adverse changes in government regulation; |
|
· |
placing us at a competitive disadvantage compared to our competitors that are less leveraged and, therefore, more able to take advantage of opportunities that our leverage prevents us from exploiting; |
|
· |
impairing our ability to refinance existing indebtedness or borrow additional amounts for working capital, capital expenditures, acquisitions, debt service requirements, execution of our business strategy or other purposes; |
|
· |
restricting our ability to pay dividends and make other distributions; and |
|
· |
adversely affecting our credit ratings. |
Any of the above listed factors could materially adversely affect our financial condition, liquidity or results of
20
operations.
Furthermore, we expect that we will depend primarily on cash generated by our operations in order to pay our expenses and any amounts due under our existing indebtedness and any future indebtedness we may incur. As a result, our ability to repay our indebtedness depends on the future performance of our business, which will be affected by financial, business, economic and other factors, many of which we cannot control. Our business may not generate sufficient cash flows from operations in the future and we may not achieve our currently anticipated growth in revenues and cash flows, either or both of which could result in our being unable to repay indebtedness or to fund other liquidity needs. If we do not have enough funds, we may be required to refinance all or part of our then existing indebtedness, sell assets or borrow additional funds, in each case on terms that may not be acceptable to us, if at all. In addition, the terms of existing or future debt agreements, including our existing ABL Facility, may restrict us from engaging in any of these alternatives. Our ability to recapitalize and incur additional debt in the future could also delay or prevent a change in control of our Company, make certain transactions more difficult to complete or impose additional financial or other covenants on us.
Despite our current level of indebtedness, we may still be able to incur substantially more debt.
We may be able to incur significant additional indebtedness in the future, including secured debt. Although the agreements governing our indebtedness contain restrictions on the incurrence of additional indebtedness, these restrictions are subject to a number of qualifications and exceptions, and the additional indebtedness incurred in compliance with these restrictions could be substantial. These restrictions also will not prevent us from incurring obligations that do not constitute indebtedness, including obligations under lease arrangements that are currently recorded as operating leases even if operating leases were to be treated as debt under GAAP. In addition, the ABL Facility provides a commitment of up to $345.0 million, subject to a borrowing base. As of June 1, 2018, we were able to borrow an additional $172.2 million under the ABL Facility. If new debt is added to our current debt levels, the related risks that we now face could intensify.
An increase in interest rates would increase the cost of servicing our debt and could reduce our profitability.
Our First Lien Facility and ABL Facility bear interest at variable rates. We have entered into interest rate caps with the objective of minimizing the risks associated with our First Lien Facility. However, increases in interest rates with respect to any amount of our debt not covered by the interest rate cap could increase the cost of servicing our debt and could materially reduce our profitability and cash flows. Excluding the effect of the interest rate caps and the interest rate floor on the First Lien Facility, each 1% increase in interest rates on the First Lien Facility would increase our annual interest expense by $10.0 million based on balances outstanding under the First Lien Facility as of June 1, 2018. Assuming the ABL Facility was fully drawn up to the $345.0 million maximum commitment, each 1% increase in interest rates would result in a $3.5 million increase in annual interest expense on the ABL Facility. The impact of increases in interest rates could be more significant for us than it would be for some other comparable companies because of our substantial indebtedness.
We may have future capital needs that require us to incur additional debt and may be unable to obtain additional financing on acceptable terms, if at all.
We rely substantially on the liquidity provided by our existing ABL Facility and cash on hand to provide working capital and fund our operations. Our working capital and capital expenditure requirements are likely to grow as the commercial and residential construction markets improve and we execute our strategic growth plan. Economic and credit market conditions, the performance of the commercial and residential construction markets, and our financial performance, as well as other factors, may constrain our financing abilities. Our ability to secure additional financing, if available, and to satisfy our financial obligations under indebtedness outstanding from time to time will depend upon our future operating performance, the availability of credit, economic conditions and financial, business and other factors, many of which are beyond our control. The prolonged continuation or worsening of current housing market conditions and the macroeconomic factors that affect our industry could require us to seek additional capital and have a material adverse effect on our ability to secure such capital on favorable terms, if at all.
We may be unable to secure additional financing or financing on favorable terms or our operating cash flow may be insufficient to satisfy our financial obligations under our outstanding indebtedness. If additional funds are raised
21
through the issuance of additional equity or convertible debt securities, our stockholders may experience significant dilution. We may also incur additional indebtedness in the future, including secured debt, subject to the restrictions contained in the ABL Facility and the First Lien Facility. If new debt is added to our current debt levels, the related risks that we now face could intensify.
Because we are a holding company with no operations of our own, we are financially dependent on receiving distributions from our subsidiaries and we could be harmed if such distributions could not be made in the future.
We are a holding company and all of our operations are conducted through subsidiaries. Consequently, we rely on payments or distributions from our subsidiaries. We do not currently expect to declare or pay dividends on our common stock for the foreseeable future; however, to the extent that we determine in the future to pay dividends on our common stock, we will be dependent on our subsidiaries to make funds available to us for the payment of such dividends. The ability of such subsidiaries to pay dividends or make other payments or distributions to us is subject to applicable local law. Such laws and restrictions could limit the payment of dividends and distributions to us, which would restrict our ability to continue operations. In addition, the terms of the agreements governing the ABL Facility and the First Lien Facility restrict the ability of our subsidiaries to pay dividends, make loans or otherwise transfer assets to us. Furthermore, our subsidiaries are permitted under the terms of the ABL Facility and the First Lien Facility to incur additional indebtedness that may restrict or prohibit the making of distributions, the payment of dividends or the making of loans by such subsidiaries to us.
Some of our subsidiaries sponsor deferred compensation arrangements that entitle selected employees of those subsidiaries to participate in increases in the adjusted book value of a specified number of shares of common stock of those subsidiaries. Employees participate in these arrangements through cash-based stock appreciation rights, by holding common stock of the applicable subsidiary and/or through deferred compensation programs. As of April 30, 2018, we have reflected an aggregate fair value of $40.3 million of liabilities related to these compensation arrangements on our consolidated balance sheet, of which $0.9 million is classified as a current liability and the remainder is classified as a long-term liability. Upon termination of employment of those with whom we have these arrangements, these subsidiaries are required to make payments to these individuals. Settlements of these awards are typically made with cash or through execution of an installment note payable to the employee over a period of four to five years. Any requirement to make payments to employees pursuant to these deferred compensation arrangements could impact the cash flows of these subsidiaries and their ability to make funds available to us.
Risks Relating to Ownership of Our Common Stock
The market price of our common stock may be highly volatile.
The trading price of our common stock could be volatile. A significant drop in our stock price could also expose us to the risk of securities class action lawsuits, which could result in substantial costs and divert management’s attention and resources, which could adversely affect our business. Finally, volatility or a lack of positive performance in our stock price may adversely affect our ability to retain key employees, many of whom have been granted stock incentive awards. The following events and factors, in addition to other factors described in this “Risk Factors” section and elsewhere in this Annual Report on Form 10-K, may have a significant impact on the market price of our common stock:
|
· |
announcements of innovations or new products or services by us or our competitors; |
|
· |
any adverse changes to our relationship with our customers, manufacturers or suppliers; |
|
· |
variations in the costs of products that we distribute; |
|
· |
any legal actions in which we may become involved; |
|
· |
announcements concerning our competitors or the building supply industry in general; |
|
· |
achievement of expected product sales and profitability; |
|
· |
manufacture, supply or distribution shortages; |
|
· |
adverse actions taken by regulatory agencies with respect to our services or the products we distribute; |
|
· |
actual or anticipated fluctuations in our quarterly or annual operating results; |
|
· |
changes in financial estimates; |
|
· |
changes in recommendations or reduced coverage by securities analysts; |
|
· |
trading volume of our common stock; |
22
|
· |
sales of our common stock by us, our executive officers and directors or our stockholders (including certain affiliates of AEA) in the future; |
|
· |
changes in accounting principles; |
|
· |
the loss of any of our management or key personnel; |
|
· |
market trends unelated to our performance; and |
|
· |
general economic and market conditions and overall fluctuations in the U.S. equity markets. |
We may be subject to securities litigation, which is expensive and could divert management attention.
Our share price may be volatile and, in the past, companies that have experienced volatility in the market price of their stock have been subject to securities class action litigation. We may be the target of this type of litigation in the future. Litigation of this type could result in substantial costs and diversion of management's attention and resources, which could adversely impact our business. Any adverse determination in litigation could also subject us to significant liabilities.
AEA may influence major corporate decisions or their interests may conflict with the interests of other holders of our common stock.
Certain affiliates of AEA beneficially own approximately 16.6% of the voting power of our outstanding common stock. As a result of this control, AEA is able to influence matters requiring approval by our stockholders and/or our board of directors, including the election of directors and the approval of business combinations or dispositions and other extraordinary transactions. AEA may also have interests that differ from yours and may vote in a way with which you disagree and which may be adverse to your interests. The concentration of ownership may have the effect of delaying, preventing or deterring a change of control of our Company, could deprive our stockholders of an opportunity to receive a premium for their common stock as part of a sale of our Company and may materially and adversely affect the market price of our common stock. In addition, AEA may in the future own businesses that directly compete with ours.
Sales of a substantial number of shares of our common stock in the public market could cause our stock price to fall.
Sales of a substantial number of shares of our common stock in the public market or the perception that these sales might occur, could depress the market price of our common stock and could impair our ability to raise capital through the sale of additional equity securities.
As of April 30, 2018, we had 2.5 million shares authorized for issuance under the GMS Inc. Equity Incentive Plan, of which approximately 2.4 million shares were still available for grant. In addition, as of April 30, 2018, there were 2.0 million outstanding options to purchase our common stock at a weighted average exercise price of $14.37 per share and 21,766 outstanding restricted stock units. The exercise and vesting of equity awards will result in dilution of the value of our common stock and could also depress the market price of our common stock. Sales of stock by these stockholders could have a material adverse effect on the trading price of our common stock.
Moreover, certain holders of our common stock have rights, subject to certain conditions, to require us to file registration statements covering their shares or to include their shares in registration statements that we may file for ourselves or other stockholders. Registration of these shares under the Securities Act would result in the shares becoming freely tradable without restriction under the Securities Act, except for shares held by our affiliates as defined in Rule 144 under the Securities Act. Any sales of securities by these stockholders could have a material adverse effect on the trading price of our common stock.
We do not intend to pay dividends on our common stock in the foreseeable future.
We currently anticipate that we will retain future earnings for the development, operation and expansion of our business and do not anticipate declaring or paying any cash dividends in the foreseeable future. In addition, the terms of the ABL Facility, the First Lien Facility and any future debt agreements may preclude our subsidiaries from paying dividends to us which, in turn, may preclude us from paying dividends to our stockholders. As a result, we expect that only appreciation of the price of our common stock, if any, will provide a return to investors in our common stock for the foreseeable future.
23
The requirements of being a public company, including compliance with the reporting requirements of the Exchange Act and the requirements of the Sarbanes-Oxley Act and the New York Stock Exchange, may strain our resources, increase our costs and distract management, and we may be unable to comply with these requirements in a timely or cost-effective manner.
As a public company, we are subject to the reporting requirements of the Exchange Act and the corporate governance standards of the Sarbanes-Oxley Act of 2002, or the Sarbanes-Oxley Act, and the New York Stock Exchange. These requirements place a strain on our management, systems and resources and we will continue to incur significant legal, accounting, insurance and other expenses. Furthermore, as we grow our business both organically and through acquisitions, our disclosure controls and procedures and internal control over financial reporting will become more complex, and we may require significantly more resources to ensure that these controls and procedures remain effective. To maintain and improve the effectiveness of our disclosure controls and procedures and internal controls over financial reporting and comply with the Exchange Act and the New York Stock Exchange requirements, significant resources and management oversight will be required. This may divert management's attention from other business concerns and lead to significant costs associated with compliance, which could have a material adverse effect on us and the price of our common stock.
These requirements and standards could be difficult and will be significantly more expensive to obtain directors’ and officers’ liability insurance, and we may be required to accept reduced policy limits and coverage or incur substantially higher costs to obtain the same or similar coverage available to a non-public company. As a result, it may be more difficult for us to attract and retain qualified persons to serve on our board of directors or as executive officers. Advocacy efforts by shareholders and third parties may also prompt even more changes in governance and reporting requirements. We cannot predict or estimate the amount of additional costs we may incur or the timing of these costs.
If we experience material weaknesses in the future or otherwise fail to maintain an effective system of internal controls in the future, we may not be able to accurately or timely report our financial condition or results of operations, which may adversely affect investor confidence in us and, as a result, the value of our common stock.
We are required to comply with the SEC’s rules implementing Section 302 and 404 of the Sarbanes-Oxley Act, which require management to certify financial and other information in our quarterly and annual reports and provide an annual management report on the effectiveness of internal control over financial reporting, as well as a statement that our independent registered public accounting firm has issued an opinion on our internal control over financial reporting.
We have identified material weaknesses in our internal control over financial reporting in the past, which have since been remediated. However, there can be no assurance that we will not identify additional material weaknesses in our internal control over financial reporting in the future. If we identify future material weaknesses in our internal controls over financial reporting or if we are unable to comply with the requirements of the Sarbanes-Oxley Act in a timely manner, we may be unable to accurately report our financial results, or report them within the timeframes required by the SEC. We also could become subject to sanctions or investigations by the New York Stock Exchange, the SEC or other regulatory authorities. In addition, if we are unable to assert that our internal control over financial reporting is effective, or if our independent registered public accounting firm is unable to express an opinion as to the effectiveness of our internal control over financial reporting, investors may lose confidence in the accuracy and completeness of our financial reports, we may face restricted access to the capital markets and our stock price may be adversely affected.
Some provisions of our charter documents and Delaware law may have anti-takeover effects that could discourage an acquisition of us by others, even if an acquisition would be beneficial to our stockholders, and may prevent attempts by our stockholders to replace or remove our current management.
Provisions in our second amended and restated certificate of incorporation and our amended and restated bylaws, as well as provisions of the Delaware General Corporation Law, or DGCL, could make it more difficult for a third party to acquire us or increase the cost of acquiring us, even if doing so would benefit our stockholders, including transactions in which stockholders might otherwise receive a premium for their shares. These provisions include:
|
· |
establishing a classified board of directors such that not all members of the board are elected at one time; |
24
|
· |
allowing the total number of directors to be determined exclusively (subject to the rights of holders of any series of preferred stock to elect additional directors) by resolution of our board of directors and granting to our board the sole power (subject to the rights of holders of any series of preferred stock or rights granted pursuant to the stockholders’ agreement) to fill any vacancy on the board; |
|
· |
limiting the ability of stockholders to remove directors without cause; |
|
· |
authorizing the issuance of "blank check" preferred stock by our board of directors, without further shareholder approval, to thwart a takeover attempt; |
|
· |
prohibiting stockholder action by written consent (and, thus, requiring that all stockholder actions be taken at a meeting of our stockholders); |
|
· |
eliminating the ability of stockholders to call a special meeting of stockholders; |
|
· |
establishing advance notice requirements for nominations for election to the board of directors or for proposing matters that can be acted upon at annual stockholder meetings; and |
|
· |
requiring the approval of the holders of at least two-thirds of the voting power of all outstanding stock entitled to vote thereon, voting together as a single class, to amend or repeal our amended and restated certificate of incorporation or bylaws if AEA. |
In addition, while we have opted out of Section 203 of the DGCL, our second amended and restated certificate of incorporation contains similar provisions providing that we may not engage in certain “business combinations” with any “interested stockholder” for a three-year period following the time that the stockholder became an interested stockholder, unless:
|
· |
prior to such time, our board of directors approved either the business combination or the transaction that resulted in the stockholder becoming an interested stockholder; |
|
· |
upon consummation of the transaction that resulted in the stockholder becoming an interested stockholder, the interested stockholder owned at least 85% of our voting stock outstanding at the time the transaction commenced, excluding certain shares; or |
|
· |
at or subsequent to that time, the business combination is approved by our board of directors and by the affirmative vote of holders of at least two-thirds of our outstanding voting stock that is not owned by the interested stockholder. |
Generally, a “business combination” includes a merger, asset or stock sale or other transaction provided for or through our Company resulting in a financial benefit to the interested stockholder. Subject to certain exceptions, an “interested stockholder” is a person who owns 15% or more of our outstanding voting stock and the affiliates and associates of such person. For purposes of this provision, “voting stock” means any class or series of stock entitled to vote generally in the election of directors.
Under certain circumstances, this provision will make it more difficult for a person who would be an “interested stockholder” to effect certain business combinations with us for a three-year period. This provision may encourage companies interested in acquiring us to negotiate in advance with our board of directors in order to avoid the stockholder approval requirement if our board of directors approves either the business combination or the transaction that results in the stockholder becoming an interested stockholder. These provisions also may have the effect of preventing changes in our board of directors and may make it more difficult to accomplish transactions that stockholders may otherwise deem to be in their best interests.
These anti-takeover defenses could discourage, delay or prevent a transaction involving a change in control of our Company. These provisions could also discourage proxy contests and make it more difficult for stockholders to elect directors of their choosing and cause us to take corporate actions other than those our stockholders desire.
Our second amended and restated certificate of incorporation designates the Court of Chancery of the State of Delaware as the exclusive forum for certain litigation that may be initiated by our stockholders, which could limit our stockholders’ ability to obtain a favorable judicial forum for disputes with us.
Our second amended and restated certificate of incorporation provides that the Court of Chancery of the State of Delaware will be the sole and exclusive forum for (i) any derivative action or proceeding brought on our behalf, (ii) any action asserting a claim of breach of a fiduciary duty owed to us or our stockholders by any of our directors, officers, employees or agents, (iii) any action asserting a claim against us arising under the DGCL or (iv) any action
25
asserting a claim against us that is governed by the internal affairs doctrine. Any person or entity purchasing or otherwise acquiring any interest in shares of our common stock is deemed to have notice of and have consented to the provisions of our second amended and restated certificate of incorporation related to choice of forum. The choice of forum provision in our second amended and restated certificate of incorporation may limit our stockholders’ ability to obtain a favorable judicial forum for disputes with us.
Item 1B. Unresolved Staff Comments
None.
Our corporate headquarters is in Tucker, Georgia. As of April 30, 2018, we operated our business through 214 branches, across 42 states and the District of Columbia. As of April 30, 2018, we owned 78 of our facilities, some of which were used as collateral to secure the First Lien Facility. We believe that substantially all of our property and equipment is in good condition, subject to normal wear and tear.
As of April 30, 2018, we operated 214 branches, a few with multiple facilities, located in the following locations:
|
|
|
Number of |
|
|
|
Number of |
|
Location |
|
Branches |
|
Location |
|
Branches |
|
Alabama |
|
5 |
|
Minnesota |
|
6 |
|
Alaska |
|
1 |
|
Missouri |
|
5 |
|
Arizona |
|
4 |
|
Montana |
|
2 |
|
Arkansas |
|
3 |
|
Nebraska |
|
3 |
|
California |
|
6 |
|
Nevada |
|
1 |
|
Colorado |
|
7 |
|
New Jersey |
|
2 |
|
Connecticut |
|
1 |
|
New Mexico |
|
5 |
|
Delaware |
|
2 |
|
North Carolina |
|
10 |
|
District of Columbia |
|
1 |
|
North Dakota |
|
3 |
|
Florida |
|
14 |
|
Ohio |
|
5 |
|
Georgia |
|
16 |
|
Oklahoma |
|
2 |
|
Hawaii |
|
1 |
|
Oregon |
|
5 |
|
Idaho |
|
3 |
|
Pennsylvania |
|
3 |
|
Illinois |
|
4 |
|
South Carolina |
|
11 |
|
Iowa |
|
1 |
|
South Dakota |
|
1 |
|
Indiana |
|
1 |
|
Tennessee |
|
4 |
|
Kansas |
|
1 |
|
Texas |
|
16 |
|
Kentucky |
|
3 |
|
Virginia |
|
12 |
|
Louisiana |
|
1 |
|
Washington |
|
11 |
|
Maryland |
|
7 |
|
Wisconsin |
|
5 |
|
Massachusetts |
|
4 |
|
Wyoming |
|
1 |
|
Michigan |
|
15 |
|
|
|
|
|
|
|
|
|
Total |
|
214 |
From time to time, we are involved in lawsuits that are brought against us in the normal course of business. We are not currently a party to any legal proceedings that would be expected, either individually or in the aggregate, to have a material adverse effect on our business or financial condition.
The building materials industry has been subject to personal injury and property damage claims arising from alleged exposure to raw materials contained in building products as well as claims for incidents of catastrophic loss, such as building fires. As a distributor of building materials, we face an inherent risk of exposure to product liability claims in the event that the use of the products we have distributed in the past or may in the future distribute is alleged to have
26
resulted in economic loss, personal injury or property damage or violated environmental, health or safety or other laws. Such product liability claims have included and may in the future include allegations of defects in manufacturing, defects in design, a failure to warn of dangers inherent in the product, negligence, strict liability or a breach of warranties. In particular, certain of our subsidiaries have been the subject of claims related to alleged exposure to asbestos‑containing products they distributed prior to 1979. Since 2002 and as of April 30, 2018, approximately 970 asbestos‑related personal injury lawsuits have been filed and we vigorously defend against them. Of these, 925 have been dismissed without any payment by us, 37 are pending and only 8 have been settled, which settlements have not materially impacted our financial condition or operating results. See Item 1A, “Risk Factors—Risks Relating to Our Business and Industry—We are exposed to product liability, warranty, casualty, construction defect, contract, tort, employment and other claims and legal proceedings related to our business, the products we distribute, the services we provide and services provided for us by third parties.”
Item 4. Mine Safety Disclosures
None.
Item 5. Market for Registrant’s Common Equity, Related Stockholder Matters and Issuer Purchases of Equity Securities
Market Information
The Company’s common stock began trading on the NYSE under the symbol “GMS” on May 26, 2016. Before then, there was no public market for the Company’s common stock. The following table presents the high and low sale prices for our common stock for the periods indicated, as reported by the NYSE.
|
|
|
Stock Price |
||||
|
|
|
High |
|
Low |
||
|
Fiscal 2017 |
|
|
|
|
|
|
|
First Quarter (starting May 26, 2016) |
|
$ |
26.42 |
|
$ |
19.28 |
|
Second Quarter |
|
|
25.25 |
|
|
20.23 |
|
Third Quarter |
|
|
31.62 |
|
|
20.51 |
|
Fourth Quarter |
|
|
36.76 |
|
|
28.22 |
|
Fiscal 2018 |
|
|
|
|
|
|
|
First Quarter |
|
|
36.99 |
|
|
27.21 |
|
Second Quarter |
|
|
36.08 |
|
|
27.83 |
|
Third Quarter |
|
|
39.98 |
|
|
32.97 |
|
Fourth Quarter |
|
|
34.52 |
|
|
29.16 |
As of the close of business on May 31, 2018, there were 23 holders of record of the Company’s common stock, which does not reflect those shares held beneficially or those shares held in “street” name. Accordingly, the number of beneficial owners of our common stock exceeds this number.
Dividend Policy
No dividends were paid to stockholders during the years ended April 30, 2018 or 2017. The Company currently intends to retain all of its future earnings, if any, to finance operations, development and growth of its business and repay indebtedness. Most of the Company’s indebtedness contains restrictions on the Company’s activities, including paying dividends on its capital stock. See Note 6, “Long-Term Debt” of Part II, Item 8 of this Annual Report on Form 10-K. Any future determination relating to our dividend policy will be made at the discretion of the Company’s board of directors and will depend on a number of factors, including future earnings, capital requirements, financial conditions, future prospects, contractual restrictions and covenants and other factors that the board of directors may deem relevant.
27
Performance Graph
The following graph shows a comparison of cumulative total return to holders of shares of GMS Inc.’s common stock against the cumulative total return of S&P 500 Index and Industrial Select Sector SPDR® Fund (XLI) from May 26, 2016 (the date our common stock commenced trading on the NYSE) through April 30, 2018 (the last trading day in fiscal 2018). The comparison of the cumulative total returns for each investment assumes that $100 was invested in GMS Inc. common stock and the respective indices on May 26, 2016 through April 30, 2018 including reinvestment of any dividends. Historical share price performance should not be relied upon as an indication of future share price performance.
This performance graph and related information shall not be deemed “soliciting material” or to be “filed” for purposes of Section 18 of the Exchange Act or otherwise subject to the liabilities under that Section, and shall not be deemed to be incorporated by reference into any future filing under the Securities Act or Exchange Act, except to the extent that we specifically incorporate it by reference into such filing. The points on the graph represent stock prices at the date of the IPO and the last trading days in fiscal 2017 and 2018.
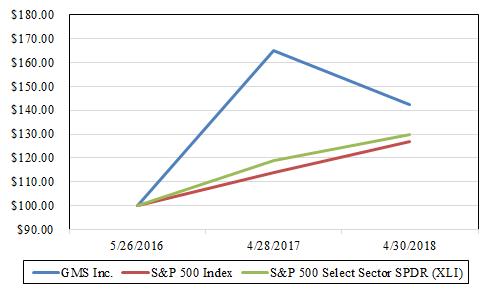
|
|
|
5/26/2016 |
|
4/28/2017 |
|
4/30/2018 |
|||
|
GMS Inc |
|
$ |
100.00 |
|
$ |
165.04 |
|
$ |
142.22 |
|
S&P 500 Index |
|
|
100.00 |
|
|
114.07 |
|
|
126.69 |
|
S&P 500 Select Sector SPDR (XLI) |
|
|
100.00 |
|
|
119.06 |
|
|
129.61 |
28
Item 6. Selected Financial Data
The following selected consolidated financial data was derived from our consolidated financial statements. The data should be read in conjunction with “Management's Discussion and Analysis of Financial Condition and Results of Operations” and the consolidated financial statements and notes thereto included elsewhere in this Annual Report on Form 10-K.
|
|
|
Successor |
|
Predecessor(1) |
||||||||||||||
|
|
|
|
|
|
|
|
|
|
|
|
|
Eleven |
||||||
|
|
|
Year |
|
Year |
|
Year |
|
Year |
|
Month |
|
Months |
||||||
|
|
|
Ended |
|
Ended |
|
Ended |
|
Ended |
|
Ended |
|
Ended |
||||||
|
|
|
April 30, |
|
April 30, |
|
April 30, |
|
April 30, |
|
April 30, |
|
March 31, |
||||||
|
|
|
2018 |
|
2017 |
|
2016 |
|
2015 |
|
2014 |
|
2014 |
||||||
|
|
|
(in thousands, except per share data) |
||||||||||||||||
|
Statement of Operations Data: |
|
|
|
|
|
|
|
|
|
|
|
|
|
|
|
|
|
|
|
Net sales |
|
$ |
2,511,469 |
|
$ |
2,319,146 |
|
$ |
1,858,182 |
|
$ |
1,570,085 |
|
$ |
127,332 |
|
$ |
1,226,008 |
|
Gross profit |
|
|
818,576 |
|
|
758,571 |
|
|
593,164 |
|
|
478,971 |
|
|
29,377 |
|
|
372,988 |
|
Operating income (loss) |
|
|
119,169 |
|
|
104,253 |
|
|
58,914 |
|
|
18,651 |
|
|
(23,011) |
|
|
7,805 |
|
Income (loss) before taxes |
|
|
83,854 |
|
|
71,540 |
|
|
25,148 |
|
|
(18,323) |
|
|
(25,816) |
|
|
(194,238) |
|
Net income (loss) |
|
|
62,971 |
|
|
48,886 |
|
|
12,564 |
|
|
(11,697) |
|
|
(18,953) |
|
|
(200,861) |
|
Weighted average shares outstanding: |
|
|
|
|
|
|
|
|
|
|
|
|
|
|
|
|
|
|
|
Basic |
|
|
41,015 |
|
|
40,260 |
|
|
32,799 |
|
|
32,450 |
|
|
32,342 |
|
|
— |
|
Diluted |
|
|
42,163 |
|
|
41,070 |
|
|
33,125 |
|
|
32,450 |
|
|
32,342 |
|
|
— |
|
Net income (loss) per share: |
|
|
|
|
|
|
|
|
|
|
|
|
|
|
|
|
|
|
|
Basic |
|
$ |
1.54 |
|
$ |
1.21 |
|
$ |
0.38 |
|
$ |
(0.36) |
|
$ |
(0.59) |
|
$ |
— |
|
Diluted |
|
$ |
1.49 |
|
$ |
1.19 |
|
$ |
0.38 |
|
$ |
(0.36) |
|
$ |
(0.59) |
|
$ |
— |
|
|
|
April 30, |
|
April 30, |
|
April 30, |
|
April 30, |
|
April 30, |
|||||
|
|
|
2018 |
|
2017 |
|
2016 |
|
2015 |
|
2014 |
|||||
|
|
|
(in thousands) |
|||||||||||||
|
Balance Sheet Data: |
|
|
|
|
|
|
|
|
|
|
|
|
|
|
|
|
Cash and cash equivalents |
|
$ |
36,437 |
|
$ |
14,561 |
|
$ |
19,072 |
|
$ |
12,284 |
|
$ |
32,662 |
|
Total assets |
|
|
1,454,511 |
|
|
1,393,265 |
|
|
1,240,814 |
|
|
1,160,976 |
|
|
1,122,351 |
|
Total debt(2) |
|
|
595,886 |
|
|
594,920 |
|
|
644,610 |
|
|
556,984 |
|
|
538,785 |
|
Total stockholders’ equity |
|
|
579,451 |
|
|
514,606 |
|
|
311,160 |
|
|
299,572 |
|
|
299,434 |
|
|
|
Year Ended |
||||||||
|
|
|
April 30, |
|
April 30, |
|
April 30, |
|
April 30, |
|
April 30, |
|
|
|
2018 |
|
2017 |
|
2016 |
|
2015 |
|
2014 |
|
Selected Operating Data: |
|
|
|
|
|
|
|
|
|
|
|
Branches (at period end) |
|
214 |
|
205 |
|
186 |
|
156 |
|
140 |
|
Employees (at period end) |
|
4,642 |
|
4,464 |
|
3,934 |
|
3,088 |
|
2,621 |
|
Wallboard volume (million square feet) |
|
3,548 |
|
3,457 |
|
2,843 |
|
2,328 |
|
2,088 |
|
(1) |
On April 1, 2014, GYP Holdings I Corp. (the “Successor”) acquired, through its wholly-owned entities, GYP Holdings II Corp. and GYP Holdings III Corp., all of the capital stock of Gypsum Management and Supply, Inc. (the "Predecessor"). We were previously known as GYP Holdings I Corp. and changed our name to GMS Inc. on July 6, 2015. Weighted average shares outstanding and income (loss) per share information is not required for these periods. |
|
(2) |
Includes debt and capital lease obligations, net of unamortized discount and debt issuance costs. |
29
Item 7. Management’s Discussion and Analysis of Financial Condition and Results of Operations
Overview
Founded in 1971, GMS Inc. (“we,” “our,” “us,” or the “Company”) is a leading North American distributor of wallboard and ceilings. Our core customer is the interior contractor, who typically installs wallboard, ceilings and our other interior construction products in commercial and residential buildings. As a leading specialty distributor, we serve as a critical link between our suppliers and a highly fragmented customer base of over 20,000 contractors. Our operating model combines a national platform with a local go‑to‑market strategy through 214 branches across the country. We believe this combination enables us to generate economies of scale while maintaining the high service levels, entrepreneurial culture and customer intimacy of a local business.
Business Strategy
Our growth strategy entails taking market share within our existing footprint, expanding into new markets by opening new branches and acquiring competitors. We expect to continue to capture profitable market share in our existing footprint by delivering industry‑leading customer service. Our strategy for opening new branches is to further penetrate markets that are adjacent to our existing operations. Typically, we have pre‑existing customer relationships in these markets but need a new location to fully capitalize on those relationships. Since May 1, 2013, we have opened 28 new greenfield branches and we currently expect to open several new branches each year depending on market conditions. In addition, we will continue to selectively pursue acquisitions and have a dedicated team of professionals to manage the process. Due to the large, highly fragmented nature of our market and our reputation throughout the industry, we believe we have the potential to access a robust acquisition pipeline that will continue to supplement our organic growth. We use a rigorous targeting process to identify acquisition candidates that will fit our culture and business model. As a result of our scale, purchasing power and ability to improve operations through implementing best practices, we believe we can achieve substantial synergies and drive earnings accretion from our acquisition strategy.
Fiscal 2018 Highlights
Key developments in our business during fiscal 2018 are described below:
|
· |
Generated net sales of $2,511.5 million in fiscal 2018, an 8.3% increase from the prior year due to an increase in sales across all product categories driven by organic sales, sales from acquired businesses and sales from new greenfield branches. |
|
· |
Generated net income of $63.0 million in fiscal 2018, compared to $48.9 million in the prior year, primarily due to an increase in Adjusted EBITDA as described below and a decrease in depreciation and amortization expense, partially offset by an increase in other (expense) income and increase in income tax expense. |
|
· |
Generated Adjusted EBITDA (a non-GAAP measure, see “Non-GAAP Financial Measures” in this Item 7) of $199.3 million in fiscal 2018, an increase from $188.2 million in the prior year, primarily due to higher net sales during the fiscal year ended April 30, 2018, which was partially offset by increases in variable costs to support the increased sales volumes. These variable costs include warehouse and delivery costs and variable compensation costs. |
|
· |
Acquired five businesses totaling seven branches for approximately $24.4 million of cash. |
Acquisition of Titan
On June 1, 2018, we acquired all of the outstanding equity interests of WSB Titan (“Titan”), a distributer of drywall, lumber, commercial and residential building materials. Titan is Canada’s largest gypsum specialty distributer with 30 locations across five provinces in Canada. The aggregate purchase price was $627.0 million (subject to a working capital and certain other adjustments as set forth in the securities purchase agreement). As part of the consideration, certain members of existing Titan management converted $35.0 million of their ownership position in Titan into equity that is exchangeable for the Company’s stock. The transaction extends our leadership position in North
30
America with expanded scale and footprint, expands our geographic coverage into the Canadian market and creates opportunities for product expansion in both the United States and Canada.
To finance this transaction, on June 1, 2018, we entered into the Third Amendment to our First Lien Credit Agreement (the “Third Amendment”) as detailed under the heading “Term Loan Amendments.”
Term Loan Amendments
On June 7, 2017, we entered into a Second Amendment to our First Lien Credit Agreement (the “Second Amendment”) that provided for a new first lien term loan facility under the credit agreement in the aggregate principal amount of $577.6 million due in April 2023 that bears interest at a floating rate based on LIBOR, with a 1.00% floor, plus 3.00%, representing a fifty basis point improvement compared to the interest rate of the existing first lien term loan facility under the credit agreement immediately prior to giving effect to the Second Amendment. Net proceeds from the new first lien term loan facility and cash on hand were used to repay our existing first lien term loan facility of $477.6 million under the credit agreement at the time and approximately $94.0 million of loans under our revolving credit facility as well as to pay related expenses.
On June 1, 2018, we entered into the Third Amendment that provides for a new first lien term loan facility under the credit agreement in the aggregate principal amount of approximately $996.8 million due in June 2025 that bears interest at a floating rate based on LIBOR plus 2.75%, representing a 25 basis point improvement compared to the interest rate of the existing first lien term loan facility under the credit agreement immediately prior to giving effect to the Third Amendment. We also drew down $143.0 million under our asset backed revolving credit facility. The net proceeds from the new first lien term loan facility, asset backed revolving credit facility and cash on hand were used to repay our existing first lien term loan facility of $571.8 million and to finance the Titan acquisition.
Secondary Public Offerings
On June 7, 2017, certain of our stockholders completed an additional secondary public offering of 5.8 million shares of the Company’s common stock at a price to the public of $33.00 per share, including 0.8 million shares of common stock that were sold as a result of the exercise in full by the underwriters of an option to purchase additional shares that was granted by the selling stockholders. As a result of such offering, the control group consisting of certain affiliates of AEA Investors LP (“AEA”) and certain other of our stockholders no longer controls a majority of the voting power of our outstanding common stock. Accordingly, we are no longer a “controlled company” within the meaning of the New York Stock Exchange corporate governance standards. We did not receive any proceeds from the sale of our common stock by the selling stockholders.
On December 14, 2017, certain of our stockholders completed an additional secondary public offering of 5.0 million shares of the Company’s common stock at a price to the public of $38.25 per share. We did not receive any proceeds from the sale of our common stock by the selling stockholders.
Operating Lease Amendments
During the first quarter of fiscal year 2019, the Company amended certain of its operating lease agreements for equipment. The amendments resulted the Company classifying these operating leases as capital leases upon the date of the modification. As a result, the Company recorded $73.6 million of capital lease assets and capital lease liabilities during the first quarter of fiscal year 2019. In addition, the Company intends to finance the purchase of new equipment under capital leases. The Company expects a reduction in selling, general and administrative expenses and increases in depreciation expense and interest expense beginning in the first quarter of fiscal year 2019 related to these changes.
Factors and Trends Affecting our Operating Results
General Economic Conditions and Outlook
Our business is sensitive to changes in general economic conditions, including, in particular, conditions in the North American commercial construction and housing markets. The markets we serve are broadly categorized as
31
commercial new construction, commercial R&R, residential new construction and residential R&R. We believe all four end markets are currently in an extended period of expansion following a deep and prolonged downturn.
Our addressable commercial construction market is composed of a variety of commercial and institutional sub‑segments with varying demand drivers. Our commercial markets include offices, hotels, retail stores and other commercial buildings, while our institutional markets include educational facilities, healthcare facilities, government buildings and other institutional facilities. The principal demand drivers across these markets include the overall economic outlook, the general business cycle, government spending, vacancy rates, employment trends, interest rates, availability of credit and demographic trends. Given the extreme depth of the last recession, despite the growth to date, activity in the commercial construction market remains well below average historical levels. According to Dodge Data & Analytics, new commercial construction put in place was 1,146 million square feet during the 2017 calendar year, which is an increase of 47% from 781 million square feet during the 2012 calendar year. However, new commercial construction activity remains well below historical levels. New commercial construction square footage put in place of 1,146 million square feet in 2017 would have needed to increase by 11% in order to achieve the historical market average of 1.3 billion square feet annually since 1970. We believe this represents a significant growth opportunity as activity continues to improve.
We believe commercial R&R spending is typically more stable than new commercial construction activity. Commercial R&R spending is driven by a number of factors, including commercial real estate prices and rental rates, office vacancy rates, government spending and interest rates. Commercial R&R spending is also driven by commercial lease expirations and renewals, as well as tenant turnover. Such events often result in repair, reconfiguration and/or upgrading of existing commercial space. As such, the commercial R&R market has historically been less volatile than commercial new construction. While there is very limited third party data for commercial R&R spending, we believe spending in this end market is in a period of expansion.
Residential construction activity is driven by a number of factors, including the overall economic outlook, employment, income growth, home prices, availability of mortgage financing, interest rates and consumer confidence, among others. According to the U.S. Census Bureau, U.S. housing starts reached 1.2 million in the 2017 calendar year. While housing starts have recovered in recent years, activity in the market remains well below historical levels. New residential housing starts of 1.2 million in 2017 would have needed to increase by 20% in order to reach their historical market average of 1.4 million annually since 1970.
While residential R&R activity is typically more stable than new construction activity, we believe the prolonged period of under‑investment during the recent downturn will result in above‑average growth for the next several years. The primary drivers of residential R&R spending include changes in existing home prices, existing home sales, the average age of the housing stock, consumer confidence and interest rates.
Seasonality and Inflation
Our operating results are typically impacted by seasonality. Historically, sales of our products have been slightly higher in the first and second quarters of each fiscal year (covering the calendar months of May through October) due to favorable weather and longer daylight conditions during these periods. Seasonal variations in operating results may be impacted by inclement weather conditions, such as cold or wet weather, which can delay construction projects.
We believe that our results of operations are not materially impacted by moderate changes in the economic inflation rate. In general, we have historically been successful in passing on price increases from our vendors to our customers in a timely manner, although there is no assurance that we can successfully do so in the future.
Acquisitions
We complement our organic growth strategy with selective acquisitions. Over the past three years, since the beginning of fiscal year 2016 through April 30, 2018, we completed 20 strategic acquisitions totaling 48 branches. We believe that significant opportunities exist to expand our geographic footprint by executing additional strategic acquisitions and we consistently strive to maintain an extensive and active acquisition pipeline. We are often evaluating several acquisition opportunities at any given time.
32
Since the beginning of fiscal year 2016 through April 30, 2018, we have completed the following acquisitions:
|
Acquired Company |
|
Acquisition Date |
|
Branches Acquired |
|
Tri-Cities Drywall & Supply Co. (WA) |
|
September 29, 2015 |
|
1 |
|
Badgerland Supply, Inc. (WI, IL) |
|
November 2, 2015 |
|
6 |
|
Hathaway & Sons, Inc. (CA) |
|
November 9, 2015 |
|
1 |
|
Gypsum Supply Company (MI, OH) |
|
January 1, 2016 |
|
11 |
|
Robert N. Karpp Company, Inc. (MA) |
|
February 1, 2016 |
|
3 |
|
Professional Handling & Distribution, Inc. (IL) |
|
February 1, 2016 |
|
2 |
|
M.R. Lee Building Materials, Inc. (IL) |
|
April 4, 2016 |
|
1 |
|
Wall & Ceiling Supply Co., Inc. (WA) |
|
May 2, 2016 |
|
1 |
|
Rockwise, LLC (AZ, CO) |
|
July 5, 2016 |
|
3 |
|
Steven F. Kempf Building Materials, Inc. (PA) |
|
August 29, 2016 |
|
1 |
|
Olympia Building Supplies, LLC (FL) |
|
September 1, 2016 |
|
3 |
|
United Building Materials, Inc. (OH) |
|
October 3, 2016 |
|
3 |
|
Ryan Building Materials, Inc. (MI) |
|
October 31, 2016 |
|
3 |
|
Interior Products Supply (IN) |
|
December 5, 2016 |
|
1 |
|
Hawaii-based distribution business of Grabber Construction Products, Inc. (HI) |
|
February 1, 2017 |
|
1 |
|
ASI Building Products, LLC (MI) |
|
August 1, 2017 |
|
3 |
|
Washington Builders Supply, Inc. (PA) |
|
October 2, 2017 |
|
1 |
|
Southwest Building Materials, Ltd. (TX) |
|
December 4, 2017 |
|
1 |
|
California-based distribution business of Grabber Construction Products, Inc. (CA) |
|
April 2, 2018 |
|
1 |
|
CMH Distributing, Inc. (NE) |
|
April 2, 2018 |
|
1 |
Our Products
The following is a summary of our net sales by product group for the years ended April 30, 2018, 2017 and 2016:
|
|
|
Year Ended |
|
|
|
Year Ended |
|
|
|
Year Ended |
|
|
|||
|
|
|
April 30, |
|
% of |
|
April 30, |
|
% of |
|
April 30, |
|
% of |
|||
|
|
|
2018 |
|
Total |
|
2017 |
|
Total |
|
2016 |
|
Total |
|||
|
|
|
(dollars in thousands) |
|||||||||||||
|
Wallboard |
|
$ |
1,109,552 |
|
44.2% |
|
$ |
1,058,400 |
|
45.7% |
|
$ |
870,952 |
|
46.9% |
|
Ceilings |
|
|
387,360 |
|
15.4% |
|
|
341,007 |
|
14.7% |
|
|
297,110 |
|
16.0% |
|
Steel framing |
|
|
411,630 |
|
16.4% |
|
|
374,151 |
|
16.1% |
|
|
281,340 |
|
15.1% |
|
Other products |
|
|
602,927 |
|
24.0% |
|
|
545,588 |
|
23.5% |
|
|
408,780 |
|
22.0% |
|
Total net sales |
|
$ |
2,511,469 |
|
|
|
$ |
2,319,146 |
|
|
|
$ |
1,858,182 |
|
|
33
Results of Operations
Fiscal Years Ended April 30, 2018 and 2017
The following table summarizes key components of our results of operations for the fiscal years ended April 30, 2018 and 2017:
|
|
|
Year Ended |
|
||||
|
|
|
April 30, |
|
||||
|
|
|
2018 |
|
2017 |
|
||
|
|
|
(dollars in thousands) |
|
||||
|
Statement of operations data: |
|
|
|
|
|
|
|
|
Net sales |
|
$ |
2,511,469 |
|
$ |
2,319,146 |
|
|
Cost of sales (exclusive of depreciation and amortization shown separately below) |
|
|
1,692,893 |
|
|
1,560,575 |
|
|
Gross profit |
|
|
818,576 |
|
|
758,571 |
|
|
Operating expenses: |
|
|
|
|
|
|
|
|
Selling, general and administrative expenses |
|
|
633,877 |
|
|
585,078 |
|
|
Depreciation and amortization |
|
|
65,530 |
|
|
69,240 |
|
|
Total operating expenses |
|
|
699,407 |
|
|
654,318 |
|
|
Operating income |
|
|
119,169 |
|
|
104,253 |
|
|
Other (expense) income: |
|
|
|
|
|
|
|
|
Interest expense |
|
|
(31,395) |
|
|
(29,360) |
|
|
Change in fair value of financial instruments |
|
|
(6,125) |
|
|
(382) |
|
|
Write-off of discount and deferred financing fees |
|
|
(74) |
|
|
(7,103) |
|
|
Other income, net |
|
|
2,279 |
|
|
4,132 |
|
|
Total other expense, net |
|
|
(35,315) |
|
|
(32,713) |
|
|
Income before tax |
|
|
83,854 |
|
|
71,540 |
|
|
Income tax expense |
|
|
20,883 |
|
|
22,654 |
|
|
Net income |
|
$ |
62,971 |
|
$ |
48,886 |
|
|
Non-GAAP measures: |
|
|
|
|
|
|
|
|
Adjusted EBITDA(1) |
|
$ |
199,258 |
|
$ |
188,229 |
|
|
Adjusted EBITDA margin(1) |
|
|
7.9 |
% |
|
8.1 |
% |
|
(1) |
Adjusted EBITDA and Adjusted EBITDA margin are non‑GAAP measures. See “Non-GAAP Measures” in this Item 7 for how we define and calculate Adjusted EBITDA and Adjusted EBITDA margin, reconciliations thereof to net income and a description of why we believe these measures are important. |
Net Sales
Net sales of $2,511.5 million during the year ended April 30, 2018 increased $192.3 million, or 8.3%, from the year ended April 30, 2017. Net sales during the year ended April 30, 2018 increased across all product categories. During the year ended April 30, 2018, our wallboard sales, which are impacted by both commercial and residential construction activity, increased by $51.1 million, or 4.8%, compared to the year ended April 30, 2017. The increase in wallboard sales was a result of a 2.6% increase in unit volume primarily driven by greater end market demand, the impact of acquisitions and a 2.2% increase in pricing. In addition, during the year ended April 30, 2018, our ceilings sales increased $46.3 million, or 13.6%, from the year ended April 30, 2017, and steel framing sales increased $37.5 million, or 10.0%. The increases in ceilings and steel framing sales are primarily driven by commercial construction activity and higher ceilings prices. For the year ended April 30, 2018, our other products sales category, which includes tools, insulation, joint treatment and various other specialty products, increased $57.4 million, or 10.5%, compared to the year ended April 30, 2017. Other products net sales benefitted from increased net sales in wallboard, ceilings and steel framing, further supplemented by pricing improvements, targeted acquisitions and other strategic initiatives.
From February 2, 2016 through April 30, 2018, we completed 14 acquisitions, totaling 24 branches. Recently acquired net sales contributed $239.9 million and $145.7 million to our net sales in fiscal 2018 and fiscal 2017, respectively. Excluding recently acquired net sales, for fiscal 2018 and fiscal 2017, our base business net sales increased
34
$98.1 million, or 4.5%, compared to the fiscal year ended April 30, 2017. The overall increase in our base business net sales reflected the increase in demand for our products as a result of the improvement in new housing starts, R&R activity and commercial construction, coupled with market share gains. In addition, our base business net sales improved through the addition of new greenfield branches opened from February 2, 2016 through April 30, 2018, which contributed $60.3 million to our base business net sales in the fiscal year ended April 30, 2018 and $22.0 million to our base business net sales for the fiscal year ended April 30, 2018.
The following table breaks out our consolidated net sales into base business net sales and recently acquired net sales:
|
|
|
Year Ended |
||||
|
|
|
April 30, |
||||
|
(Unaudited) |
|
2018 |
|
2017 |
||
|
|
|
(in thousands) |
||||
|
Base business net sales |
|
$ |
2,271,568 |
|
$ |
2,173,456 |
|
Recently acquired net sales (excluded from base business) |
|
|
239,901 |
|
|
145,690 |
|
Total net sales |
|
$ |
2,511,469 |
|
$ |
2,319,146 |
When calculating our “base business” results, we exclude any branches that were acquired in the current fiscal year, prior fiscal year and three months prior to the start of the prior fiscal year. Therefore, any acquisition occurring between February 2, 2016 and April 30, 2018 have been excluded from base business net sales for the fiscal year ended April 30, 2018. In addition, our acquisitions of Washington Builders Supply, Inc., the California-based distribution business of Grabber Construction Products, Inc. and CMH Distributing, Inc. have been treated as new greenfield branches and are included in base business net sales for purposes of calculating our base business results.
We have excluded the following acquisitions from the base business for the periods identified:
|
|
|
|
|
Branches |
|
|
|
Acquisition(1) |
|
Acquisition Date |
|
Acquired |
|
Periods Excluded |
|
M.R. Lee Building Materials, Inc. (IL) |
|
April 4, 2016 |
|
1 |
|
April 4, 2016 - April 30, 2018 |
|
Wall & Ceiling Supply Co., Inc. (WA) |
|
May 2, 2016 |
|
1 |
|
May 2, 2016 - April 30, 2018 |
|
Rockwise, LLC (AZ, CO) |
|
July 5, 2016 |
|
3 |
|
July 5, 2016 - April 30, 2018 |
|
Steven F. Kempf Building Materials, Inc. (PA) |
|
August 29, 2016 |
|
1 |
|
August 29, 2016 - April 30, 2018 |
|
Olympia Building Supplies, LLC (FL) |
|
September 1, 2016 |
|
3 |
|
September 1, 2016 - April 30, 2018 |
|
United Building Materials, Inc. (OH) |
|
October 3, 2016 |
|
3 |
|
October 3, 2016 - April 30, 2018 |
|
Ryan Building Materials, Inc. (MI) |
|
October 31, 2016 |
|
3 |
|
October 31, 2016 - April 30, 2018 |
|
Interior Products Supply (IN) |
|
December 5, 2016 |
|
1 |
|
December 5, 2016 - April 30, 2018 |
|
Hawaii-based distribution business of Grabber Construction Products, Inc. (HI) |
|
February 1, 2017 |
|
1 |
|
February 1, 2017 - April 30, 2018 |
|
ASI Building Products, LLC (MI) |
|
August 1, 2017 |
|
3 |
|
August 1, 2017 - April 30, 2018 |
|
Southwest Building Materials, Ltd. (TX) |
|
December 4, 2017 |
|
1 |
|
December 4, 2017 - April 30, 2018 |
|
(1) |
Our acquisitions of Washington Builders Supply, Inc. (PA) on October 2, 2017, the California-based distribution business of Grabber Construction Products, Inc. (CA) on April 2, 2018 and CMH Distributing, Inc. (NE) on April 2, 2018 have been treated as new greenfield branches and are included in base business net sales for purposes of calculating our base business results. |
35
Gross Profit and Gross Margin
Gross profit of $818.6 million for the year ended April 30, 2018 increased $60.0 million, or 7.9%, from the year ended April 30, 2017. The increase in gross profit was due to $192.3 million in additional sales, partially offset by a $132.3 million increase in cost of sales. Gross margin on net sales was 32.6% for the year ended April 30, 2018, compared to 32.7% for the year ended April 30, 2017.
Selling, General and Administrative Expenses
Selling, general and administrative expenses consist of warehouse, delivery and general and administrative expenses. Selling, general and administrative expenses of $633.9 million during the year ended April 30, 2018 increased $48.8 million, or 8.3%, from the year ended April 30, 2017. The increase was due to a $23.0 million increase in delivery expenses, a $7.0 million increase in warehouse expense and an $18.8 million increase in branch and corporate general and administrative expenses. The increase in delivery expenses was primarily due to a $11.4 million increase in payroll costs, a $5.4 million increase in equipment rental costs and a $3.0 million increase in fuel costs. The increase in warehouse expenses was primarily due to a $2.8 million increase in payroll costs and a $3.0 million increase in facility costs. The increase in branch and corporate general and administrative expenses was primarily due to an $8.9 million increase in payroll and payroll related costs, a $2.3 million increase in costs for acquisitions and other non-recurring costs and other increases. The increases in payroll and payroll related costs were primarily due to pay increases and increased headcount, which in turn were due to the increase in delivered volume from base business and acquisitions. Selling, general and administrative expenses were 25.2% of our net sales during the years ended April 30, 2018 and 2017.
Depreciation and Amortization Expense
Depreciation and amortization includes depreciation of property and equipment and amortization of definite-lived intangible assets acquired in purchases of businesses and purchases of assets from other companies. Depreciation and amortization expense of $65.5 million during the year ended April 30, 2018 decreased $3.7 million, or 5.4%, from the year ended April 30, 2017. The decrease was due to a $1.5 million decrease in depreciation expense and a $2.2 million decrease in amortization of acquired definite-lived intangible assets.
Interest Expense
Interest expense consists primarily of interest expense incurred on our debt and capital leases and amortization of deferred financing fees and debt discounts. Interest expense of $31.4 million during the year ended April 30, 2018 increased $2.0 million, or 6.9%, from the year ended April 30, 2017. The increase was primarily due to a slight increase in the outstanding amount of debt and increased amortization of deferred financing costs, partially offset by a reduction in interest rates due to the refinancing of our first lien term loan facility.
Change in Fair Value of Financial Instruments
Change in fair value of financial instruments includes changes in fair value of our derivative instruments that are recognized in earnings. During the year ended April 30, 2018, we recognized a $5.1 million loss on the change in fair value of a foreign currency forward contract. The foreign currency forward contract was entered into to mitigate foreign currency exchange risk associated with the purchase price of Titan that was denominated in Canadian dollars during the time between signing the agreement and closing the transaction. The foreign currency forward contract effectively fixed the amount we paid for the purchase price by contracting us to pay U.S. dollars and receive Canadian dollars on the notional amount.
Write-Off of Debt Discount and Deferred Financing Fees
Write-off of debt discount and deferred financing fees of $0.1 million during the year ended April 30, 2018 related to the refinancing of our first lien term loan facility. Write-off of debt discount and deferred financing fees of $7.1 million during the year ended April 30, 2017 included $5.4 million in connection with the repayment of the $160.0 million principal amount of our second lien term loan facility, $1.5 million in connection with the refinancing our first lien term loan facility and $0.2 million in connection with the second amendment of our revolving credit facility. For
36
more information regarding our debt transactions, see Note 6 of the Notes to Consolidated Financial Statements included in this Annual Report on Form 10-K.
Income Tax Expense
Income tax expense was $20.9 million during the year ended April 30, 2018 compared to income tax expense of $22.7 million during the year ended April 30, 2017. The decrease in income tax expense was primarily due to an increase in taxable income due to higher profitability, partially offset by the impact of the Tax Cuts and Jobs Act (the “Tax Act”). More specifically, we recognized a provisional income tax benefit of $6.7 million related to the re-measurement of net deferred tax liabilities in connection with enactment of the Tax Act. For more information regarding the Tax Act and its impact on us, see Note 8 of the Notes to Consolidated Financial Statements included in this Annual Report on Form 10-K. Our effective tax rate was 24.9% and 31.7% for the years ended April 30, 2018 and 2017, respectively. The decrease in the effective tax rate from the year ended April 30, 2017 to the year ended April 30, 2018 was primarily due to the impact of the Tax Act, partially offset by the prior year election under section 338 (h)(10) of the Internal Revenue Code. As a result of this election, the Company decreased its deferred tax liabilities and tax expense in the year ended April 30, 2017 by $6.9 million.
Fiscal Years Ended April 30, 2017 and 2016
The following table summarizes key components of our results of operations for the fiscal years ended April 30, 2017 and 2016:
|
|
|
Year Ended |
|
||||
|
|
|
April 30, |
|
||||
|
|
|
2017 |
|
2016 |
|
||
|
|
|
(dollars in thousands) |
|
||||
|
Statement of operations data: |
|
|
|
|
|
|
|
|
Net sales |
|
$ |
2,319,146 |
|
$ |
1,858,182 |
|
|
Cost of sales (exclusive of depreciation and amortization shown separately below) |
|
|
1,560,575 |
|
|
1,265,018 |
|
|
Gross profit |
|
|
758,571 |
|
|
593,164 |
|
|
Operating expenses: |
|
|
|
|
|
|
|
|
Selling, general and administrative expenses |
|
|
585,078 |
|
|
470,035 |
|
|
Depreciation and amortization |
|
|
69,240 |
|
|
64,215 |
|
|
Total operating expenses |
|
|
654,318 |
|
|
534,250 |
|
|
Operating income |
|
|
104,253 |
|
|
58,914 |
|
|
Other (expense) income: |
|
|
|
|
|
|
|
|
Interest expense |
|
|
(29,360) |
|
|
(37,418) |
|
|
Change in fair value of financial instruments |
|
|
(382) |
|
|
(19) |
|
|
Write-off of discount and deferred financing fees |
|
|
(7,103) |
|
|
— |
|
|
Other income, net |
|
|
4,132 |
|
|
3,671 |
|
|
Total other expense, net |
|
|
(32,713) |
|
|
(33,766) |
|
|
Income before tax |
|
|
71,540 |
|
|
25,148 |
|
|
Income tax expense |
|
|
22,654 |
|
|
12,584 |
|
|
Net income |
|
$ |
48,886 |
|
$ |
12,564 |
|
|
Non-GAAP measures: |
|
|
|
|
|
|
|
|
Adjusted EBITDA(1) |
|
$ |
188,229 |
|
$ |
138,183 |
|
|
Adjusted EBITDA margin(1) |
|
|
8.1 |
% |
|
7.4 |
% |
|
(1) |
Adjusted EBITDA and Adjusted EBITDA margin are non‑GAAP measures. See “Non-GAAP Measures” in this Item 7 for how we define and calculate Adjusted EBITDA and Adjusted EBITDA margin, reconciliations thereof to net income and a description of why we believe these measures are important. |
37
Net Sales
Net sales of $2,319.1 million for the fiscal year ended April 30, 2017 increased $460.9 million, or 24.8%, from $1,858.2 million for the fiscal year ended April 30, 2016. Our performance in the fiscal year ended April 30, 2017 was strong as our sales increased across all product categories. In the fiscal year ended April 30, 2017, our wallboard sales, which are impacted by both commercial and residential construction activity, increased by $187.4 million, or 21.5%, compared to the fiscal year ended April 30, 2016. The increase in wallboard sales was a result of a 21.6% increase in unit volume primarily driven by greater end market demand, market share gains and the impact of acquisitions, partially offset by a 0.1% decrease in pricing. In the fiscal year ended April 30, 2017, our ceiling sales increased $43.9 million, or 14.8%, from the fiscal year ended April 30, 2016, and steel framing sales increased $92.8 million, or 33.0%. Ceiling and steel framing sales increased primarily as a result of acquisitions and increases in commercial construction activity and pricing. For the year ended April 30, 2017, our other products sales category, which includes tools, insulation, joint treatment and various other specialty products, increased $136.8 million, or 33.5%, compared to the year ended April 30, 2016. Other products net sales benefitted from the significant pull through factor of our core product offerings, further supplemented by pricing improvements, retail showrooms resets, targeted acquisitions and other strategic initiatives.
From February 1, 2015 through April 30, 2017, we have completed 18 acquisitions, totaling 48 branches. These acquisitions contributed $459.2 million and $168.1 million to our net sales in fiscal 2017 and fiscal 2016, respectively. Excluding these acquired sites, for fiscal 2017 and fiscal 2016, our base business net sales increased $169.8 million, or 10.0%, compared to the fiscal year ended April 30, 2016. The overall increase in our base business net sales reflected the increase in demand for our products as a result of the improvement in new housing starts, R&R activity and commercial construction, coupled with market share gains.
When calculating our “base business” results, we exclude any branches that were acquired in the current fiscal year, the prior fiscal year and three months prior to the start of the prior fiscal year. Therefore, any acquisition occurring between February 1, 2015 and April 30, 2017 will be excluded from base business net sales for any period during fiscal 2017.
In addition, our base business improved through the addition of 9 new greenfield branches opened from February 1, 2015 through April 30, 2017, which contributed $44.8 million to our base business net sales in the fiscal year ended April 30, 2017 and $8.4 million to our base business net sales for the fiscal year ended April 30, 2016.
The following table breaks out our consolidated net sales into the base business component and the excluded component, which consist of recently acquired branches, as shown below:
|
|
|
Year Ended |
||||
|
|
|
April 30, |
||||
|
(Unaudited) |
|
2017 |
|
2016 |
||
|
|
|
(in thousands) |
||||
|
Base business net sales |
|
$ |
1,859,902 |
|
$ |
1,690,098 |
|
Recently acquired net sales (excluded from base business) |
|
|
459,244 |
|
|
168,084 |
|
Total net sales |
|
$ |
2,319,146 |
|
$ |
1,858,182 |
38
We have excluded the following acquisitions from the base business for the periods identified:
|
|
|
Acquisition |
|
Branches |
|
|
|
Acquisition |
|
Date |
|
Acquired |
|
Periods Excluded |
|
Serrano Supply, Inc. (IA) |
|
February 2, 2015 |
|
1 |
|
February 2, 2015 - April 30, 2017 |
|
Ohio Valley Building Products, LLC (WV) |
|
February 16, 2015 |
|
1 |
|
February 16, 2015 - April 30, 2017 |
|
J&B Materials, Inc. (CA, HI) |
|
March 16, 2015 |
|
5 |
|
March 16, 2015 - April 30, 2017 |
|
Tri-Cities Drywall & Supply Co. (WA) |
|
September 29, 2015 |
|
1 |
|
September 29, 2015 - April 30, 2017 |
|
Badgerland Supply, Inc. (WI, IL) |
|
November 2, 2015 |
|
6 |
|
November 2, 2015 - April 30, 2017 |
|
Hathaway & Sons, Inc. (CA) |
|
November 9, 2015 |
|
1 |
|
November 9, 2015 - April 30, 2017 |
|
Gypsum Supply Company (MI, OH) |
|
January 1, 2016 |
|
11 |
|
January 1, 2016 - April 30, 2017 |
|
Robert N. Karpp Company, Inc. (MA) |
|
February 1, 2016 |
|
3 |
|
February 1, 2016 - April 30, 2017 |
|
Professional Handling & Distribution, Inc. (IL) |
|
February 1, 2016 |
|
2 |
|
February 1, 2016 - April 30, 2017 |
|
M.R. Lee Building Materials, Inc. (IL) |
|
April 4, 2016 |
|
1 |
|
April 4, 2016 - April 30, 2017 |
|
Wall & Ceiling Supply Co., Inc. (WA) |
|
May 2, 2016 |
|
1 |
|
May 2, 2016 - April 30, 2017 |
|
Rockwise, LLC (AZ, CO) |
|
July 5, 2016 |
|
3 |
|
July 5, 2016 - April 30, 2017 |
|
Steven F. Kempf Building Materials, Inc. (PA) |
|
August 29, 2016 |
|
1 |
|
August 29, 2016 - April 30, 2017 |
|
Olympia Building Supplies, LLC (FL) |
|
September 1, 2016 |
|
3 |
|
September 1, 2016 - April 30, 2017 |
|
United Building Materials, Inc. (OH) |
|
October 3, 2016 |
|
3 |
|
October 3, 2016 - April 30, 2017 |
|
Ryan Building Materials, Inc. (MI) |
|
October 31, 2016 |
|
3 |
|
October 31, 2016 - April 30, 2017 |
|
Interior Products Supply (IN) |
|
December 5, 2016 |
|
1 |
|
December 5, 2016 - April 30, 2017 |
|
Hawaii-based distribution assets of Grabber Construction Products, Inc. (HI) |
|
February 1, 2017 |
|
1 |
|
February 1, 2017 - April 30, 2017 |
Gross Profit and Gross Margin
Gross profit was $758.6 million for the fiscal year ended April 30, 2017 compared to $593.2 million for the fiscal year ended April 30, 2016. The increase in gross profit was due to $460.9 million in additional sales, partially offset by a $295.5 million increase in cost of sales. Gross margin on net sales increased to 32.7% for the fiscal year ended April 30, 2017 from 31.9% for the fiscal year ended April 30, 2016 as the result of improved product margins and mix.
Selling, General and Administrative Expenses
Selling, general and administrative expenses increased $115.0 million, or 24.5%, to $585.1 million for the fiscal year ended April 30, 2017 from $470.0 million for the fiscal year ended April 30, 2016. This increase was due to increases in warehouse expense of $15.2 million, of which $7.2 million was related to payroll; and $4.6 million was related to facility costs; delivery expense of $45.9 million, of which $27.0 million was related to payroll, $8.3 million was related to equipment rental cost increases and $3.6 million was related to maintenance and repairs for our delivery fleet; and increases in branch and corporate general and administrative expenses of $54.0 million, of which $26.5 million was related to payroll, $10.6 million was related to employee benefits, and $6.0 million was related to increases in real estate rental expense. The increases in payroll and payroll related costs were primarily due to increased headcount, which was due to the increase in delivered volume, acquisitions and the expansion of the Yard Support Center. Selling, general and administrative expenses were 25.2% and 25.3% of our net sales for the fiscal years ended April 30, 2017 and 2016, respectively.
Depreciation and Amortization Expense
Depreciation and amortization expense was $69.2 million for the fiscal year ending April 30, 2017 as compared to $64.2 million as of April 30, 2016. Depreciation expense decreased by $1.1 million, due to assets becoming fully depreciated; however, this decrease was more than fully offset by an increase in amortization of acquired definite lived intangible assets of $6.1 million. The definite lived intangible assets consist of customer relationships and tradenames acquired during fiscal 2017 and 2016.
39
Interest Expense
Interest expense was $29.3 million for the fiscal year ended April 30, 2017, a decrease of $8.1 million from the fiscal year ended April 30, 2016. The decrease was primarily due to a decrease in the outstanding principal amount of our term loan facilities and the refinancing of our first lien term loan facility in September 2016, which improved the interest rate by twenty-five basis points. The decrease in outstanding principal amount of our term loan facilities was due to the repayment of $160.0 million outstanding principal amount our second term loan facility in June 2016 using net proceeds from our initial public offering (“IPO”), partially offset by an amendment to our first lien term loan facility that increased the outstanding principal amount of our first lien term loan facility by $100.0 million. Our revolving credit facility had a $103.4 million and $101.9 million outstanding balance as of April 30, 2017 and 2016, respectively, and interest expense of $4.1 million and $2.0 million for fiscal 2017 and 2016, respectively. Other interest expense incurred in fiscal 2017 and fiscal 2016 was $3.4 million and $4.1 million, respectively, primarily consisting of interest expense related to capitalized leases and deferred financing costs and discounts amortized to interest expense. For more information regarding our debt transactions, see Note 6 of the Notes to Consolidated Financial Statements included in this Annual Report on Form 10-K for the fiscal year ended April 30, 2018.
Write-Off of Debt Discount and Deferred Financing Fees
Write-off of debt discount and deferred financing fees of $7.1 million for the fiscal year ended April 30, 2017 includes $5.4 million written off in connection with the repayment of the $160.0 million principal amount of our Second Lien Facility, $1.5 million in connection with refinancing the First Lien Facility and $0.2 million in connection with our amendment of the ABL Facility. No write-off of debt discount and deferred financing fees was recorded during the year ended April 30, 2016.
Income Tax Expense
Income tax expense was $22.7 million for the fiscal year ended April 30, 2017 compared to $12.6 million for the fiscal year ended April 30, 2016. This $10.1 million increase in income tax expense was primarily the result of an increase in taxable income. Our effective tax rate was 31.7% and 50.0% for the fiscal years ended April 30, 2017 and 2016, respectively. The decrease in the rate from the fiscal year ended April 30, 2016 to the fiscal year ended April 30, 2017 is due primarily to a discrete item of $6.9 million in fiscal 2017 related to the 338(h)(10) election of one of our recently acquired subsidiaries.
Liquidity and Capital Resources
Summary
We depend on cash flow from operations, cash on hand and funds available under our Asset Based Lending Credit Facility (“ABL Facility”) to finance working capital needs and capital expenditures. We believe that these sources of funds will be adequate to fund debt service requirements and provide cash, as required, to support our growth strategies, ongoing operations, capital expenditures, lease obligations and working capital for at least the next 12 months.
As of April 30, 2018, we had available borrowing capacity of approximately $333.7 million under our $345.0 million ABL Facility. The ABL Facility will mature on November 18, 2021 unless the individual affected lenders agree to extend the maturity of their respective loans under the ABL Facility upon the Company’s request and without the consent of any other lender. On June 1, 2018, we drew down $163.0 million under our ABL Facility, which included $143.0 million used for the Titan acquisition and $20.0 million for general corporate purposes. Subsequent to these transactions on June 1, 2018, we had available borrowing capacity of approximately $172.2 million under our $345.0 million ABL Facility.
On June 7, 2017, we entered into the Second Amendment that provided for a new first lien term loan facility under the Credit Agreement in the aggregate principal amount of $577.6 million due in April 2023 that bears interest at a floating rate based on LIBOR, with a 1.00% floor, plus 3.00%, representing a fifty basis point improvement compared to the interest rate of the existing first lien term loan facility under the credit agreement immediately prior to giving effect to the Second Amendment. Net proceeds from the new first lien term loan facility and cash on hand were used to repay
40
our existing first lien term loan facility of approximately $477.6 million and approximately $94.0 million of loans under our asset based revolving credit facility as well as related expenses.
On June 1, 2018, we entered into the Third Amendment that provides for a new first lien term loan facility under the Credit Agreement in the aggregate principal amount of $996.8 million due in June 2025 that bears interest at a floating rate based on LIBOR plus 2.75%, representing a 25 basis point improvement compared to the interest rate of the existing first lien term loan facility under the credit agreement immediately prior to giving effect to the Third Amendment. The net proceeds from the new first lien term loan facility, asset backed revolving credit facility and cash on hand were used to repay our existing first lien term loan facility of approximately $571.8 million under the credit agreement and to finance the Titan acquisition.
For more information regarding our ABL Facility and other indebtedness, see Note 6 of the Notes to Consolidated Financial Statements included in this Annual Report on Form 10-K for the fiscal year ended April 30, 2018.
Cash Flows
The following table sets forth summarized cash flow data for the years ended April 30, 2018, 2017 and 2016:
|
|
|
Year Ended April 30, |
|||||||
|
|
|
2018 |
|
2017 |
|
2016 |
|||
|
|
|
(in thousands) |
|||||||
|
Cash provided by operating activities |
|
$ |
88,616 |
|
$ |
66,708 |
|
$ |
47,747 |
|
Cash used in investing activities |
|
|
(49,209) |
|
|
(157,516) |
|
|
(118,040) |
|
Cash (used in) provided by financing activities |
|
|
(17,531) |
|
|
86,297 |
|
|
77,081 |
|
Increase (decrease) in cash and cash equivalents |
|
$ |
21,876 |
|
$ |
(4,511) |
|
$ |
6,788 |
Operating Activities
The increase in cash provided by operating activities during the year ended April 30, 2018 compared to the prior year was primarily due to a $12.8 million increase in net income after adjustments for non-cash items and $9.1 million increase in cash resulting from changes to our net working capital.
The increase in cash provided by operating activities during the year ended April 30, 2017 compared to the prior year was primarily due to a $46.2 million increase in net income after adjustments for non-cash items, partially offset by a $27.2 million of cash outflow resulting from changes to our net working capital.
Investing Activities
The decrease in cash used in investing activities during the year ended April 30, 2018 compared to the prior year was primarily due to a $122.1 million decrease in cash used for acquisitions, as we acquired five businesses during the year ended April 30, 2018 compared to eight during the year ended April 30, 2017. The decrease was partially offset by a $12.7 million increase in capital expenditures.
The increase in cash used in investing activities during the year ended April 30, 2017 compared to the prior year was primarily due to a $30.2 million increase in cash used for acquisitions, as we acquired eight business during the year ended April 30, 2017 compared to seven during the year ended April 30, 2016. Also contributing to the increase was a $3.4 million increase in capital expenditures and a $5.9 million decrease in proceeds from asset sales.
Capital expenditures during the years ended April 30, 2018, 2017 and 2016 consisted of building and leasehold improvements and vehicles. Capital expenditures vary depending on prevailing business factors, including current and anticipated market conditions. Historically, capital expenditures have for the most part remained at relatively low levels in comparison to the net sales generated during the corresponding periods. We expect our fiscal 2019 capital expenditures to be approximately $12.0 million to $14.0 million (excluding acquisitions) primarily related to building facilities and IT investments to support our operations.
41
Financing Activities
Net cash used in financing activities was $17.5 million for the year ended April 30, 2018, consisting primarily of an increase on the First Lien Facility of $100.0 million offset by net repayments for the ABL Facility of $103.4 million and principal payments on long‑term debt and capital lease obligations of $11.9 million.
Net cash provided by financing activities was $86.3 million for the year ended April 30, 2017, consisting primarily of proceeds from the IPO of $156.9 million, an increase on the First Lien Facility of $100.0 million and net borrowings from the ABL Facility of $1.4 million, offset by the repayment of the Second Lien Facility of $160.0 million and principal payments on long-term debt and capital lease obligations of $9.8 million.
Net cash provided by financing activities was $77.1 million for the year ended April 30, 2016, consisting primarily of net borrowings from the ABL Facility of $85.0 million and proceeds from stock option exercises of $5.4 million, offset by principal payments on long‑term debt and capital lease obligations of $8.2 million, stock repurchases of $4.7 million after giving effect to the exercise of certain options and the repurchase of the related shares and debt issuance costs of $0.4 million incurred in connection with the exercise of the accordion feature of the ABL Facility.
Adjusted Working Capital
Adjusted working capital is an important measurement that we use in determining the efficiencies of our operations and our ability to readily convert assets into cash. Adjusted working capital represents current assets, excluding cash and cash equivalents, minus current liabilities, excluding current maturities of long‑term debt. The material components of adjusted working capital for us include accounts receivable, inventory and accounts payable. Management of our adjusted working capital helps to ensure we can maximize our return and continue to invest in our operations for future growth. Comparing our adjusted working capital to that of other companies in our industry may be difficult, as other companies may calculate adjusted working capital differently than we do. Adjusted working capital is a non-GAAP measure. See “—Non-GAAP Financial Measures—Adjusted Working Capital,” for how we define and calculate Adjusted Working Capital, a reconciliation thereof to working capital and a description of why we believe this measure is important.
The following table presents a summary of working capital and adjusted working capital as of April 30, 2018 and 2017:
|
|
|
April 30, |
|
April 30, |
||
|
|
|
2018 |
|
2017 |
||
|
|
|
(in thousands) |
||||
|
Trade accounts and notes receivable, net of allowances |
|
$ |
346,450 |
|
$ |
328,988 |
|
Inventories, net |
|
|
239,223 |
|
|
200,234 |
|
Accounts payable |
|
|
(116,168) |
|
|
(102,688) |
|
|
|
|
469,505 |
|
|
426,534 |
|
Other current assets |
|
|
48,163 |
|
|
25,964 |
|
Other current liabilities |
|
|
(117,753) |
|
|
(107,814) |
|
Working capital |
|
|
399,915 |
|
|
344,684 |
|
Cash and cash equivalents |
|
|
(36,437) |
|
|
(14,561) |
|
Current maturities of long-term debt |
|
|
16,284 |
|
|
11,530 |
|
Adjusted working capital |
|
$ |
379,762 |
|
$ |
341,653 |
Our adjusted working capital increased by $38.1 million from April 30, 2017 to April 30, 2018 as a result of an increase in working capital of $55.3 million and an increase of $4.8 million in current maturities of long term debt, offset partially by an increase in cash and cash equivalents of $21.9 million. Working capital increased as a result of an increase of inventories, net of $39.0 million, an increase in trade accounts and notes receivable of $17.5 million and an increase in other current assets of $22.2 million, partially offset by an increase in accounts payable of $13.5 million and an increase in other current liabilities of $9.9 million.
42
Contractual Obligations
The following table sets forth our contractual obligations and commitments as of April 30, 2018:
|
|
|
|
Year |
|
Year |
|
Year |
|
Year |
|
Year |
|
|
|
||||||
|
|
|
|
Ending |
|
Ending |
|
Ending |
|
Ending |
|
Ending |
|
|
|
||||||
|
|
|
|
April 30, |
|
April 30, |
|
April 30, |
|
April 30, |
|
April 30, |
|
|
|
||||||
|
|
Total |
|
2019 |
|
2020 |
|
2021 |
|
2022 |
|
2023 |
|
Thereafter |
|||||||
|
|
(in thousands) |
|||||||||||||||||||
|
Long-term debt(1) |
$ |
587,517 |
|
$ |
9,824 |
|
$ |
9,068 |
|
$ |
8,765 |
|
$ |
8,329 |
|
$ |
551,257 |
|
$ |
274 |
|
Interest on long-term debt(2) |
|
115,680 |
|
|
24,271 |
|
|
23,745 |
|
|
23,432 |
|
|
23,174 |
|
|
21,058 |
|
|
— |
|
Capital leases(3) |
|
20,491 |
|
|
7,289 |
|
|
5,665 |
|
|
3,882 |
|
|
1,937 |
|
|
1,147 |
|
|
571 |
|
Facility operating leases(4) |
|
110,046 |
|
|
26,283 |
|
|
24,478 |
|
|
21,116 |
|
|
14,932 |
|
|
11,015 |
|
|
12,222 |
|
Equipment operating leases(4) |
|
106,138 |
|
|
33,246 |
|
|
28,337 |
|
|
22,004 |
|
|
14,367 |
|
|
6,805 |
|
|
1,379 |
|
Total |
$ |
939,872 |
|
|
100,913 |
|
$ |
91,293 |
|
$ |
79,199 |
|
$ |
62,739 |
|
$ |
591,282 |
|
$ |
14,446 |
|
(1) |
Long-term debt includes principal payments on outstanding debt obligations. Long-term debt excludes unamortized discounts and deferred financing fees. As of April 30, 2018, we had $587.5 million aggregate amount of debt outstanding, consisting of $571.8 million of our first lien term loan due 2023 and $15.7 million of installment notes due in monthly and annual installments through 2023. |
|
(2) |
Interest payments on long-term debt includes interest due on outstanding debt obligations and commitment and borrowing cost under our ABL facility. |
|
(3) |
Represents remaining payments under capital leases, including interest on capital lease obligations. |
|
(4) |
Represents base rent payments under non-cancellable operating leases. |
We may, from time to time, repurchase or otherwise retire or extend our debt and/or take other steps to reduce our debt or otherwise improve our financial position. These actions may include open market debt repurchases, negotiated repurchases, other retirements of outstanding debt and/or opportunistic refinancing of debt. The amount of debt that may be repurchased or otherwise retired or refinanced, if any, will depend on market conditions, trading levels of our debt, our cash position, compliance with debt covenants and other considerations. Our affiliates may also purchase our debt from time to time, through open market purchases or other transactions. In such cases, our debt may not be retired, in which case we would continue to pay interest in accordance with the terms of the debt, and we would continue to reflect the debt as outstanding in our consolidated balance sheets.
We lease certain office and warehouse facilities and equipment, some of which provide renewal options. Rent expense for operating leases, which may have escalating rents over the terms of the leases, is recorded on a straight-line basis over the minimum lease terms. Rent expense under operating leases approximated $63.9 million, $56.2 million, and $41.7 million for the fiscal years ended April 30, 2018, 2017 and 2016, respectively. As existing leases expire, we anticipate such leases will be renewed or replaced with other leases that are substantially similar in terms, which are consistent with market rates at the time of renewal.
During fiscal 2019, we expect to enter into capital lease obligations for the purchase of approximately $30.0 to $35.0 million of capital lease assets.
Debt Covenants
The ABL Facility contains certain affirmative covenants, including financial and other reporting requirements. We were in compliance with all such covenants as of April 30, 2018.
The First Lien Facility contains a number of covenants that limit our ability and the ability of our restricted subsidiaries, as described in the First Lien Credit Agreement, to: incur more indebtedness; pay dividends, redeem stock or make other distributions; make investments; create restrictions on the ability of our restricted subsidiaries to pay dividends to us or make other intercompany transfers; create liens securing indebtedness; transfer or sell assets; merge or consolidate; enter into certain transactions with our affiliates; and prepay or amend the terms of certain indebtedness. We were in compliance with all restrictive covenants as of April 30, 2018.
43
Off Balance Sheet Arrangements
As of April 30, 2018, we did not have any relationships with unconsolidated entities or financial partnerships for the purpose of facilitating off‑balance sheet arrangements or for other contractually narrow or limited purposes.
Critical Accounting Policies
Our discussion and analysis of operating results and financial condition are based upon our audited financial statements included elsewhere in this Annual Report on Form 10‑K. The preparation of our financial statements, in accordance with Generally Accepted Accounting Principles (“GAAP”), requires us to make estimates and assumptions that affect the reported amounts of assets, liabilities, net sales, expenses and related disclosures of contingent assets and liabilities. We base our estimates on past experience and other assumptions that we believe are reasonable under the circumstances, and we evaluate these estimates on an ongoing basis. Our critical accounting policies are those that materially affect our consolidated financial statements and involve difficult, subjective or complex judgments by management. Although these estimates are based on management’s best knowledge of current events and actions that may impact us in the future, actual results may be materially different from the estimates.
We believe the following critical accounting policies are affected by significant judgments and estimates used in the preparation of our consolidated financial statements and that the judgments and estimates are reasonable.
Sales Returns
Description. We recognize revenue at the point of sale or upon delivery to the customer’s site when persuasive evidence of an arrangement exists, delivery has occurred or services have been rendered, the price to the buyer is fixed or determinable and collectability is reasonably assured. Revenue, net of estimated returns and allowances, is recognized when sales transactions occur and title is passed, the related product is delivered, and includes any applicable shipping and handling costs invoiced to the customer. The Company’s estimates for sales returns are based on an analysis of historical information.
Judgments and Uncertainties. The determination of our sales returns allowances contain uncertainties because they require management to make assumptions and apply judgment about the amount and timing of customer returns.
Effect if Actual Results Differ From Assumptions. Management believes the allowance amounts recorded represent its best estimate of future outcomes. A 10% difference in our sales returns allowance as of April 30, 2018 would have affected net income by approximately $0.4 million as of April 30, 2018.
Allowance for Doubtful Accounts
Description. We maintain an allowance for doubtful accounts for estimated losses due to the failure of our customers to make required payments. The Company’s estimate of the allowance for doubtful accounts is based on an assessment of individual past due accounts, historical write‑off experience, accounts receivable aging and the current economic trends. Account balances are written off when the potential for recovery is considered remote.
Judgments and Uncertainties. The determination of our allowance for doubtful accounts contains uncertainties because it requires management to make assumptions and apply judgment about our customers’ ability to pay.
Effect if Actual Results Differ From Assumptions. Management believes the allowance amounts recorded, in each instance, represent its best estimate of future outcomes. If there is a deterioration of a major customer's financial condition, if we become aware of additional information related to the creditworthiness of a major customer, or if future actual default rates on trade receivables in general differ from those currently anticipated, we may have to adjust our allowance for doubtful accounts, which would affect earnings in the period the adjustments were made. Based on our evaluation, we record reserves to reduce the related receivables to amounts we reasonably believe are collectible. A 10% difference in our allowance for doubtful accounts as of April 30, 2018 would have affected net income by approximately $0.5 million as of April 30, 2018.
44
Inventories
Description. Inventories consist of materials purchased for resale and include wallboard, ceilings, steel framing and other specialty building products. Inventories are valued at the lower of cost or market (net realizable value). The cost of inventories is determined by the moving average cost method. We monitor our inventory levels and record provisions for excess inventories based on slower moving inventory. In addition, at the end of each year, we evaluate our inventory at each branch and write off and dispose of obsolete products. Our inventories are generally not susceptible to technological obsolescence.
Judgments and Uncertainties. Provisions for excess inventories contain uncertainties because the calculations require management to make assumptions and apply judgment regarding forecasted consumer demand, liquidation value and other factors.
Effect if Actual Results Differ From Assumptions. Management believes the provisions recorded, in each instance, represent its best estimate of future outcomes. However, if actual outcomes are different than we anticipated, we may be exposed to losses or gains that could be material. A 10% change in our inventory reserves as of April 30, 2018, would have affected net income by approximately $2.8 million as of April 30, 2018.
Goodwill
Description. We perform an impairment test of our goodwill annually during the fourth quarter of our fiscal year (February 1) or when events and circumstances indicate goodwill might be impaired. Impairment testing of goodwill is required at the reporting unit level and involves a two-step process. However, we may first assess the qualitative factors to determine whether it is necessary to perform the two-step quantitative goodwill impairment test. The first step of the impairment test involves comparing the estimated fair value of our reporting units with the reporting unit's carrying amount, including goodwill. If we determine that the carrying value of a reporting unit exceeds its estimated fair value, we perform a second step to compare the carrying amount of goodwill to the implied fair value of that goodwill. The implied fair value of goodwill is determined in the same manner as utilized to recognize goodwill in a business combination. If the carrying amount of goodwill exceeds the implied fair value of that goodwill, an impairment loss would be recognized in an amount equal to the excess. We evaluate our reporting units on an annual basis or when events or circumstances indicate our reporting units might change.
Judgments and Uncertainties. Application of the goodwill impairment test requires judgment, including the identification of reporting units, assigning assets and liabilities to reporting units and determining the fair values of reporting units. We estimate the fair values of our reporting units based on weighting of a discounted cash flow analysis, a market comparable method and a market transaction approach. These models use significant unobservable inputs, or Level 3 inputs, as defined by the fair value hierarchy. Significant estimates and assumptions inherent in the valuations include the amount and timing of future cash flows (including expected growth rates and profitability), the discount rate applied to the cash flows and the selection of guideline companies. The assumptions with the most significant impact on the fair value of the reporting unit are those related to the discount rate, the terminal value, future operating cash flows and the growth rate.
Effect if Actual Results Differ From Assumptions. As of April 30, 2018, we had approximately $427.6 million of goodwill. Our fiscal 2018, 2017 and 2016 annual impairment tests indicated the estimated fair value of our reporting units exceeded their carrying values. However, changes in management intentions, market events or conditions, projected future net sales, operating results, cash flows of our reporting units and other similar circumstances could affect the assumptions used in the impairment tests. Although management currently believes that the estimates used in the evaluation of goodwill are reasonable, differences between actual and expected net sales, operating results and cash flow could cause goodwill to be impaired.
45
Long-Lived Assets
Description. We depreciate property and equipment and amortize intangible assets over the estimated useful lives of the assets. Estimates of useful lives are based on the nature of the underlying assets as well as our experience with similar assets and intended use. We periodically review estimated useful lives for reasonableness. We evaluate recoverability of long-lived assets, including property and equipment and intangible assets, when events or changes in circumstances indicate that the carrying amount may not be recoverable. Recoverability of assets to be held and used is measured by a comparison of the carrying amount of an asset to the estimated undiscounted future cash flow expected to be generated by the assets. If the carrying amount of an asset exceeds its estimated future cash flows, an impairment charge is recognized by the amount by which the carrying amount of the asset exceeds the estimated fair value of the asset.
Judgments and Uncertainties. Determining the useful life of an intangible asset requires judgment. Estimates of useful lives can differ from actual useful lives due to the inherent uncertainty in making these estimates. Our impairment tests contain uncertainties because they require management to make assumptions and apply judgment regarding the amount and timing of future cash flows (including expected growth rates and profitability) and the discount rate applied to the cash flows.
Effect if Actual Results Differ. As of April 30, 2018, we had $163.6 million of property and equipment and $222.7 million of intangible assets. We did not recognize any material impairment charges for our long-lived assets during the past three years. We did not have any material changes in useful lives for our long-lived assets during the past three years. However, changes in management intentions, market events or conditions, projected future net sales, operating results and other similar circumstances could affect the assumptions used in the impairment tests. Although management currently believes that the estimates used in the evaluation of long-lived assets are reasonable, differences between actual and expected net sales, operating results and cash flow could cause these assets to be impaired.
Equity-Based Compensation
Description. We measure compensation cost for all share‑based awards at fair value on the grant date (or measurement date if different) and recognize compensation expense, net of estimated forfeitures, over the requisite service period for awards expected to vest. We estimate the fair value of stock options using the Black-Scholes valuation model and determine the fair value of restricted stock units based on the quoted price of GMS’s common stock on the date of grant. We estimate forfeitures based on historical analysis of actual forfeitures and employee turnover. Actual forfeitures are recorded when incurred and estimated forfeitures are reviewed at least annually.
Judgments and Uncertainties. Calculating stock-based compensation expense using the Black-Scholes valuation model requires the input of assumptions, including the expected term of the stock-based awards, expected volatility, risk-free rate, expected dividend yield and the fair value of the underlying common stock at the date of grant. The assumptions used in calculating the fair value of stock-based awards represent our best estimates, but these estimates involve inherent uncertainties and the application of management judgment. We estimate the expected life of options granted based on historical exercise patterns, which we believe are representative of future behavior. We estimate expected volatility based on the average volatility of peer public entities that are similar in size and industry since prior to our IPO we did not have sufficient history to estimate the expected volatility of our common stock price. Prior to our IPO, fair value of the underlying common stock at the date of grant was determined using a weighted combination of various methodologies, including the income approach and the market approach.
Effect if Actual Results Differ From Assumptions. We recorded $1.7 million, $2.4 million and $2.7 million of equity-based compensation expense during the years ended April 30, 2018, 2017 and 2016, respectively. The amounts recorded in the financial statements for equity-based compensation expense could vary significantly if we were to use different assumptions. In addition, if our actual forfeiture rate is materially different from our estimate, the equity-based compensation expense could be significantly different from what we have recorded in the current period.
46
Subsidiary Equity-Based Deferred Compensation Arrangements
Description. Certain subsidiaries have equity-based compensation agreements with the subsidiary’s employees and minority shareholders. These agreements are stock appreciation rights, deferred compensation agreements and liabilities to noncontrolling interest holders. The agreements entitle selected employees of those subsidiaries to participate in increases in the adjusted book value of a specified number of shares of common stock of those subsidiaries. Adjusted book value for this purpose generally means the book value of the relevant shares, as increased, or decreased, to reflect those shares’ ratable portion of any annual earnings, or losses, of the relevant subsidiary (based on the total number of outstanding shares of the relevant subsidiary). Since these agreements are typically settled in cash or notes, they are accounted for as liability awards and measured at fair value. For more information regarding these agreements, see Note 11 of the Notes to Consolidated Financial Statements included in this Annual Report on Form 10-K for the fiscal year ended April 30, 2018.
Judgments and Uncertainties. The determination of fair value is a significant estimate, which is based on assumptions including the expected book value of the subsidiary per share at the time of redemption and the expected termination date of each award holder. To determine the expected book value of the subsidiary at redemption date, we have used a lognormal binomial method. Significant inputs to this estimate include historical book values of the subsidiaries, our expected incremental borrowing rate, the expected retirement age of certain individuals and the expected volatility of the underlying book values of the subsidiary’s equity. This estimate is, by its nature, subjective and involves a high degree of judgment and assumptions.
Effect if Actual Results Differ From Assumptions. As of April 30, 2018, we had total liabilities for stock appreciation rights, deferred compensation agreements and liabilities to noncontrolling interest holders of $40.3 million. The amounts recorded in the financial statements for these agreements could vary significantly if we were to use different assumptions. The assumptions used may have a significant effect on our estimates of fair value, and the use of different assumptions, as well as changes in market conditions, could have a material effect on our results of operations or financial condition.
Income Taxes
Description. Income taxes are accounted for using the asset and liability method. Deferred tax assets and liabilities are recognized based on the difference between the financial statement carrying amounts of existing assets and liabilities and their respective tax bases. Inherent in the measurement of deferred balances are certain judgments and interpretations of existing tax law and published guidance as applicable to our operations.
We evaluate our deferred tax assets to determine if valuation allowances are required. In assessing the realizability of deferred tax assets, we consider both positive and negative evidence in determining whether it is more likely than not that some portion or all of the deferred tax assets will not be realized. The primary negative evidence considered includes the cumulative operating losses generated in prior periods. The primary positive evidence considered includes the reversal of deferred tax liabilities related to depreciation and amortization that would occur within the same jurisdiction and during the carry-forward period necessary to absorb the federal and state net operating losses and other deferred tax assets. The reversal of such liabilities would utilize the federal and state net operating losses and other deferred tax assets.
We record amounts for uncertain tax positions that management believes are supportable, but are potentially subject to successful challenge by the applicable taxing authority. Consequently, changes in our assumptions and judgments could materially affect amounts recognized related to income tax uncertainties and may affect our results of operations or financial position. We believe our assumptions for estimates continue to be reasonable, although actual results may have a positive or negative material impact on the balances of such tax positions. Historically, the variation of estimates to actual results is immaterial and material variation is not expected in the future.
Judgments and Uncertainties. We consider the probability of future taxable income and our historical profitability, among other factors, in assessing the amount of the valuation allowance. Significant judgment is involved in this determination, including projections of future taxable income. Our liability for unrecognized tax benefits contains uncertainties because management is required to make assumptions and to apply judgment to estimate the exposures associated with our various filing positions. Our effective income tax rate is also affected by changes in tax law, our
47
level of earnings and the results of tax audits. The Company recorded of a provisional income tax benefit of $6.7 million during the year ended April 30, 2018 reflecting reasonable estimates for the re-measurement of net deferred tax liabilities as of April 30, 2018 in connection with the Tax Act.
Effect if Actual Results Differ From Assumptions. Although we believe that the judgments and estimates used are reasonable, the ultimate impact of the Tax Act may differ materially from our provisional amounts due to, among other things, changes in interpretations of the Tax Act, any legislative action to address questions that arise because of the Tax Act or any updates or changes to estimates the Company has utilized to calculate the impacts. Additionally, the Company continues to analyze additional information and guidance related to certain aspects of the Tax Act, such as limitations on the deductibility of executive compensation, conformity or changes by state taxing authorities in response to The Act, and the deductibility of other expenses impacted by the Tax Act. The Company will complete its accounting for the Tax Act once the Company has obtained, prepared and analyzed all information needed (including computations) for its analysis, but no later than one year from the enactment date of the Tax Act. All items related to the Tax Act remain provisional as of April 30, 2018.
Vendor Rebates
Description. Typical arrangements with our vendors provide for us to receive a rebate of a specified amount after we achieve any of a number of measures generally related to the volume of our purchases over a period of time. We reserve these rebates to effectively reduce our cost of sales in the period in which we sell the product. Throughout the year, we estimate the amount of rebates receivable for the periodic programs based upon the expected level of purchases. We continually revise these estimates to reflect actual rebates earned based on actual and projected purchase levels. If we fail to achieve a measure which is required to obtain a vendor rebate, we will have to record a charge in the period in which we determine the criteria or measurement for the vendor rebate will not be met to the extent the vendor rebate was estimated and included as a reduction to cost of sales.
Judgments and Uncertainties. Our estimate of vendor rebates contains uncertainties because it requires management to make assumptions and apply judgment regarding projected purchase levels.
Effect if Actual Results Differ From Assumptions. Historically, our actual rebates have been within our expectations used for our estimates. However, amounts accrued could require adjustment if actual purchase volumes differ from projected purchase volumes.
Derivative Instruments
Description. We have entered into derivative instruments to manage our exposure to certain financial risks. Our derivative financial instruments are recognized as either assets or liabilities in the Consolidated Balance Sheets and measured at fair value. Derivative instruments that do not qualify as a hedge or are not designated as a hedge are adjusted to estimated fair value in earnings. Derivative instruments that meet hedge criteria are formally designated as hedges. For a derivative instrument designated as a cash flow hedge, we recognize the change in fair value, net of taxes, on the effective portion of the derivative to accumulated other comprehensive income (loss) in the Consolidated Balance Sheets, and an amount is reclassified out of accumulated other comprehensive income (loss) into earnings to offset the earnings impact that is attributable to the risk being hedged. For a derivative instrument designated as a fair value hedge, we recognize the loss or gain attributable to the risk being hedged in earnings in the period of change with a corresponding offset recorded to the item for which the risk is being hedged. We perform the effectiveness testing of our designated hedges on a quarterly basis and the changes in ineffective portions of the derivatives, if any, are recognized immediately in earnings.
Judgments and Uncertainties. The valuation of derivative instruments was determined using valuation techniques including a discounted cash flow analysis on the expected cash flows of each derivative. This analysis reflected the contractual terms of the derivatives, including the period to maturity, and used observable market-based inputs, including interest rate curves, implied volatilities and forward rates in active markets.
Effect if Actual Results Differ From Assumptions. The amounts recorded in the financial statements for derivative instruments could vary significantly if we were to use different assumptions.
48
Newly Issued Accounting Pronouncements
See Note 1 of the Notes to Consolidated Financial Statements included in this Annual Report on Form 10-K for information regarding recently adopted and recently issued accounting pronouncements.
Non‑GAAP Financial Measures
Adjusted EBITDA
Adjusted EBITDA and Adjusted EBITDA margin are non-GAAP measures. We report our financial results in accordance with GAAP. However, we present Adjusted EBITDA and Adjusted EBITDA margin, which are not recognized financial measures under GAAP, because we believe they assist investors and analysts in comparing our operating performance across reporting periods on a consistent basis by excluding items that we do not believe are indicative of our core operating performance. Management believes Adjusted EBITDA and Adjusted EBITDA margin are helpful in highlighting trends in our operating results, while other measures can differ significantly depending on long‑term strategic decisions regarding capital structure, the tax jurisdictions in which companies operate and capital investments.
In addition, we utilize Adjusted EBITDA in certain calculations under the ABL Facility and the First Lien Facility. The ABL Facility and the First Lien Facility permit us to make certain additional adjustments in calculating Consolidated EBITDA, such as projected net cost savings, which are not reflected in the Adjusted EBITDA data presented in this Annual Report on Form 10‑K. We may in the future reflect such permitted adjustments in our calculations of Adjusted EBITDA.
We believe that Adjusted EBITDA and Adjusted EBITDA margin are frequently used by analysts, investors and other interested parties in their evaluation of companies, many of which present an Adjusted EBITDA or Adjusted EBITDA margin measure when reporting their results. Our presentation of Adjusted EBITDA should not be construed as an inference that our future results will be unaffected by unusual or non‑recurring items. In addition, Adjusted EBITDA may not be comparable to similarly titled measures used by other companies in our industry or across different industries.
We also include information concerning Adjusted EBITDA margin, which is calculated as Adjusted EBITDA divided by net sales. We present Adjusted EBITDA margin because it is used by management as a performance measure to judge the level of Adjusted EBITDA that is generated from net sales.
Adjusted EBITDA and Adjusted EBITDA margin have their limitations as analytical tools and should not be considered in isolation, or as a substitute for analysis of our results as reported under GAAP. Some of these limitations include:
|
· |
Adjusted EBITDA and Adjusted EBITDA margin do not reflect every expenditure, future requirements for capital expenditures or contractual commitments; |
|
· |
Adjusted EBITDA does not reflect changes in our working capital needs; |
|
· |
Adjusted EBITDA does not reflect the significant interest expense, or the amounts necessary to service interest or principal payments, on our outstanding debt; |
|
· |
Adjusted EBITDA does not reflect income tax expense and, because the payment of taxes is part of our operations, tax expense is a necessary element of our costs and ability to operate; |
|
· |
although depreciation and amortization are eliminated in the calculation of Adjusted EBITDA, the assets being depreciated and amortized will often have to be replaced in the future, and Adjusted EBITDA does not reflect any costs of such replacements; |
|
· |
non‑cash compensation is and will remain a key element of our overall long‑term incentive compensation package, although we exclude it as an expense when evaluating our ongoing operating performance for a particular period; and |
49
|
· |
Adjusted EBITDA does not reflect the impact of earnings or charges resulting from matters we consider not to be indicative of our ongoing operations. |
We compensate for these limitations by relying primarily on our GAAP results and using Adjusted EBITDA and Adjusted EBITDA margin only as supplemental information.
The following is a reconciliation of our net income to Adjusted EBITDA for the years ended April 30, 2018, 2017 and 2016:
|
|
|
|
|||||||
|
|
|
Year Ended April 30, |
|||||||
|
|
|
2018 |
|
2017 |
|
2016 |
|||
|
|
|
|
|
|
|
|
|
|
|
|
Net income |
|
$ |
62,971 |
|
$ |
48,886 |
|
$ |
12,564 |
|
Interest expense |
|
|
31,395 |
|
|
29,360 |
|
|
37,418 |
|
Write-off of debt discount and deferred financing fees |
|
|
74 |
|
|
7,103 |
|
|
— |
|
Interest income |
|
|
(177) |
|
|
(152) |
|
|
(928) |
|
Income tax expense |
|
|
20,883 |
|
|
22,654 |
|
|
12,584 |
|
Depreciation expense |
|
|
24,075 |
|
|
25,565 |
|
|
26,667 |
|
Amortization expense |
|
|
41,455 |
|
|
43,675 |
|
|
37,548 |
|
Stock appreciation expense(a) |
|
|
2,318 |
|
|
148 |
|
|
1,988 |
|
Redeemable noncontrolling interests(b) |
|
|
1,868 |
|
|
3,536 |
|
|
880 |
|
Equity-based compensation(c) |
|
|
1,695 |
|
|
2,534 |
|
|
2,699 |
|
Severance and other permitted costs(d) |
|
|
581 |
|
|
(157) |
|
|
379 |
|
Transaction costs (acquisitions and other)(e) |
|
|
3,370 |
|
|
2,249 |
|
|
3,751 |
|
Gain on sale of assets |
|
|
(509) |
|
|
(338) |
|
|
(645) |
|
Management fee to related party(f) |
|
|
— |
|
|
188 |
|
|
2,250 |
|
Effects of fair value adjustments to inventory(g) |
|
|
324 |
|
|
946 |
|
|
1,009 |
|
Change in fair value of financial instruments(h) |
|
|
6,125 |
|
|
382 |
|
|
19 |
|
Secondary public offering costs(i) |
|
|
1,525 |
|
|
1,385 |
|
|
— |
|
Debt transaction costs(j) |
|
|
1,285 |
|
|
265 |
|
|
— |
|
Adjusted EBITDA |
|
$ |
199,258 |
|
$ |
188,229 |
|
$ |
138,183 |
|
(a) |
Represents non‑cash compensation expenses related to stock appreciation rights agreements. |
|
(b) |
Represents non‑cash compensation expense related to changes in the redemption values of noncontrolling interests. |
|
(c) |
Represents non‑cash equity‑based compensation expense related to the issuance of share-based awards. |
|
(d) |
Represents severance expenses and other costs permitted in calculations under the ABL Facility and the First Lien Facility. |
|
(e) |
Represents one‑time costs related to our IPO and acquisitions paid to third party advisors. |
|
(f) |
Represents management fees paid by us to AEA. Following our IPO, AEA no longer receives management fees from us. |
|
(g) |
Represents the non‑cash cost of sales impact of purchase accounting adjustments to increase inventory to its estimated fair value. |
|
(h) |
Represents the mark‑to‑market adjustments for derivative financial instruments. |
|
(i) |
Represents one-time costs related to our secondary offering paid to third party advisors. |
|
(j) |
Represents expenses paid to third party advisors related to debt refinancing activities. |
50
Adjusted Working Capital
Adjusted working capital is defined as current assets, excluding cash and cash equivalents, minus current liabilities, excluding current maturities of long‑term debt. Adjusted working capital is not a recognized term under GAAP and does not purport to be an alternative to working capital. Management believes that adjusted working capital is useful in analyzing the cash flow and working capital needs of the Company. We exclude cash and cash equivalents and current maturities of long‑term debt to evaluate the investment in working capital required to support our business.
The following is a reconciliation from working capital, the most directly comparable financial measure under GAAP, to adjusted working capital as of the dates presented:
|
|
|
April 30, |
|
April 30, |
||
|
|
|
2018 |
|
2017 |
||
|
|
|
(in thousands) |
||||
|
Current assets |
|
$ |
633,836 |
|
$ |
555,186 |
|
Current liabilities |
|
|
233,921 |
|
|
210,502 |
|
Working capital |
|
|
399,915 |
|
|
344,684 |
|
Cash and cash equivalents |
|
|
(36,437) |
|
|
(14,561) |
|
Current maturities of long-term debt |
|
|
16,284 |
|
|
11,530 |
|
Adjusted working capital |
|
$ |
379,762 |
|
$ |
341,653 |
51
Item 7A. Quantitative and Qualitative Disclosures About Market Risk
Interest Rate Risk
We are exposed to interest rate risk through fluctuations in interest rates on our debt obligations. A significant portion of our outstanding debt bears interest at variable rates. As a result, increases in interest rates could increase the cost of servicing our debt and could materially reduce our profitability and cash flows. However, we have entered into an interest rate cap on three-month U.S. dollar LIBOR based on a strike rate of 2.0%, which effectively caps the interest rate at 5.75% on an initial notional amount of $275.0 million of our variable rate debt obligation under the First Lien Facility, or any replacement facility with similar terms. Excluding the impact of this interest rate cap and the interest rate floor on the First Lien Facility, each 1% increase in interest rates on the First Lien Facility would increase our annual interest expense by approximately $5.7 million based on balances outstanding under the First Lien Facility as of April 30, 2018. Assuming the ABL Facility was fully drawn, each 1% increase in interest rates would result in a $3.5 million increase in our annual interest expense on the ABL Facility. We seek to manage exposure to adverse interest rate changes through our normal operating and financing activities, as well as through hedging activities, such as entering into interest rate derivative agreements. As of April 30, 2018, $571.8 million aggregate principal amount was outstanding under the First Lien Facility and no amounts were outstanding under the ABL Facility.
Foreign Currency Risk
On June 1, 2018, we acquired Titan pursuant to a securities purchase agreement entered into on April 5, 2018. Titan is a distributer of drywall, lumber, commercial and residential building materials with 30 locations across five provinces in Canada. As of April 30, 2018, we were exposed to foreign currency exchange risk associated with the purchase price that was denominated in Canadian dollars. To mitigate this foreign currency exchange risk, we entered into a foreign currency forward contract. The foreign currency forward contract effectively fixed the amount we paid for the purchase price by contracting the Company to pay U.S. dollars and receive Canadian dollars on the notional amount. The notional amount of the foreign currency forward contract was $569.2 million as of April 30, 2018. The foreign currency forward contract did not qualify for hedge accounting. We recognized a $5.1 million loss on the change in fair value of the foreign currency forward contract during the year ended April 30, 2018.
52
Item 8. Financial Statements and Supplementary Data
GMS Inc.
Index to Consolidated Financial Statements
53
Report of Independent Registered Public Accounting Firm
To the Board of Directors and Stockholders of GMS Inc.
Opinion on the Financial Statements
We have audited the accompanying consolidated balance sheet of GMS Inc. (the Company) as of April 30, 2018, the related consolidated statements of operations and comprehensive income, stockholders’ equity and cash flows for the year then ended, and the related notes (collectively referred to as the “consolidated financial statements”). In our opinion, the consolidated financial statements present fairly, in all material respects, the financial position of the Company at April 30, 2018, and the results of its operations and its cash flows for the year ended April 30, 2018, in conformity with U.S. generally accepted accounting principles.
We also have audited, in accordance with the standards of the Public Company Accounting Oversight Board (United States) (PCAOB), the Company's internal control over financial reporting as of April 30, 2018, based on criteria established in Internal Control-Integrated Framework issued by the Committee of Sponsoring Organizations of the Treadway Commission (2013 framework) and our report dated June 28, 2018 expressed an unqualified opinion thereon.
Basis for Opinion
These financial statements are the responsibility of the Company's management. Our responsibility is to express an opinion on the Company’s financial statements based on our audit. We are a public accounting firm registered with the PCAOB and are required to be independent with respect to the Company in accordance with the U.S. federal securities laws and the applicable rules and regulations of the Securities and Exchange Commission and the PCAOB.
We conducted our audit in accordance with the standards of the PCAOB. Those standards require that we plan and perform the audit to obtain reasonable assurance about whether the financial statements are free of material misstatement, whether due to error or fraud. Our audit included performing procedures to assess the risks of material misstatement of the financial statements, whether due to error or fraud, and performing procedures that respond to those risks. Such procedures included examining, on a test basis, evidence regarding the amounts and disclosures in the financial statements. Our audit also included evaluating the accounting principles used and significant estimates made by management, as well as evaluating the overall presentation of the financial statements. We believe that our audit provides a reasonable basis for our opinion.
/s/ Ernst & Young LLP
We have served as the Company’s auditor since 2017.
Atlanta, Georgia
June 28, 2018
54
Report of Independent Registered Public Accounting Firm
To the Board of Directors and Stockholders of GMS Inc.
Opinion on Internal Control over Financial Reporting
We have audited GMS Inc.’s internal control over financial reporting as of April 30, 2018, based on criteria established in Internal Control— Integrated Framework issued by the Committee of Sponsoring Organizations of the Treadway Commission (2013 framework) (the COSO criteria). In our opinion, GMS Inc. (the Company) maintained, in all material respects, effective internal control over financial reporting as of April 30, 2018, based on the COSO criteria.
We also have audited, in accordance with the standards of the Public Company Accounting Oversight Board (United States) (PCAOB), the consolidated balance sheet of GMS Inc. as of April 30, 2018, and the related consolidated statements of operations and comprehensive income, stockholders’ equity and cash flows for the year then ended, and the related notes of the Company and our report dated June 28, 2018 expressed an unqualified opinion thereon.
Basis for Opinion
The Company’s management is responsible for maintaining effective internal control over financial reporting and for its assessment of the effectiveness of internal control over financial reporting included in the accompanying Management’s Report on Internal Control over Financial Reporting. Our responsibility is to express an opinion on the Company’s internal control over financial reporting based on our audit. We are a public accounting firm registered with the PCAOB and are required to be independent with respect to the Company in accordance with the U.S. federal securities laws and the applicable rules and regulations of the Securities and Exchange Commission and the PCAOB.
We conducted our audit in accordance with the standards of the PCAOB. Those standards require that we plan and perform the audit to obtain reasonable assurance about whether effective internal control over financial reporting was maintained in all material respects.
Our audit included obtaining an understanding of internal control over financial reporting, assessing the risk that a material weakness exists, testing and evaluating the design and operating effectiveness of internal control based on the assessed risk, and performing such other procedures as we considered necessary in the circumstances. We believe that our audit provides a reasonable basis for our opinion.
Definition and Limitations of Internal Control Over Financial Reporting
A company’s internal control over financial reporting is a process designed to provide reasonable assurance regarding the reliability of financial reporting and the preparation of financial statements for external purposes in accordance with generally accepted accounting principles. A company’s internal control over financial reporting includes those policies and procedures that (1) pertain to the maintenance of records that, in reasonable detail, accurately and fairly reflect the transactions and dispositions of the assets of the company; (2) provide reasonable assurance that transactions are recorded as necessary to permit preparation of financial statements in accordance with generally accepted accounting principles, and that receipts and expenditures of the company are being made only in accordance with authorizations of management and directors of the company; and (3) provide reasonable assurance regarding prevention or timely detection of unauthorized acquisition, use, or disposition of the company’s assets that could have a material effect on the financial statements.
Because of its inherent limitations, internal control over financial reporting may not prevent or detect misstatements. Also, projections of any evaluation of effectiveness to future periods are subject to the risk that controls may become inadequate because of changes in conditions, or that the degree of compliance with the policies or procedures may deteriorate.
/s/ Ernst & Young LLP
Atlanta, Georgia
June 28, 2018
55
Report of Independent Registered Public Accounting Firm
To the Board of Directors and Stockholders of GMS Inc.
In our opinion, the consolidated balance sheet as of April 30, 2017 and the related consolidated statements of operations and comprehensive income, of stockholders’ equity, and of cash flows for each of the two years in the period ended April 30, 2017 present fairly, in all material respects, the financial position of GMS Inc. and its subsidiaries as of April 30, 2017, and the results of their operations and their cash flows for each of the two years in the period ended April 30, 2017, in conformity with accounting principles generally accepted in the United States of America. These financial statements are the responsibility of the Company's management. Our responsibility is to express an opinion on these financial statements based on our audits. We conducted our audits of these financial statements in accordance with the standards of the Public Company Accounting Oversight Board (United States). Those standards require that we plan and perform the audit to obtain reasonable assurance about whether the financial statements are free of material misstatement. An audit includes examining, on a test basis, evidence supporting the amounts and disclosures in the financial statements, assessing the accounting principles used and significant estimates made by management, and evaluating the overall financial statement presentation. We believe that our audits provide a reasonable basis for our opinion.
/s/ PricewaterhouseCoopers LLP
Atlanta, Georgia
June 30, 2017
56
GMS Inc.
(in thousands, except per share data)
|
|
|
April 30, |
|
April 30, |
||
|
|
|
2018 |
|
2017 |
||
|
Assets |
||||||
|
Current assets: |
|
|
|
|
|
|
|
Cash and cash equivalents |
|
$ |
36,437 |
|
$ |
14,561 |
|
Trade accounts and notes receivable, net of allowances of $9,633 and $9,851, respectively |
|
|
346,450 |
|
|
328,988 |
|
Inventories, net |
|
|
239,223 |
|
|
200,234 |
|
Prepaid expenses and other current assets |
|
|
11,726 |
|
|
11,403 |
|
Total current assets |
|
|
633,836 |
|
|
555,186 |
|
Property and equipment, net of accumulated depreciation of $85,761 and $71,409, respectively |
|
|
163,582 |
|
|
154,465 |
|
Goodwill |
|
|
427,645 |
|
|
423,644 |
|
Intangible assets, net |
|
|
222,682 |
|
|
252,293 |
|
Other assets |
|
|
6,766 |
|
|
7,677 |
|
Total assets |
|
$ |
1,454,511 |
|
$ |
1,393,265 |
|
Liabilities and Stockholders’ Equity |
||||||
|
Current liabilities: |
|
|
|
|
|
|
|
Accounts payable |
|
$ |
116,168 |
|
$ |
102,688 |
|
Accrued compensation and employee benefits |
|
|
56,323 |
|
|
58,393 |
|
Other accrued expenses and current liabilities |
|
|
45,146 |
|
|
37,891 |
|
Current portion of long-term debt |
|
|
16,284 |
|
|
11,530 |
|
Total current liabilities |
|
|
233,921 |
|
|
210,502 |
|
Non-current liabilities: |
|
|
|
|
|
|
|
Long-term debt, less current portion |
|
|
579,602 |
|
|
583,390 |
|
Deferred income taxes, net |
|
|
10,742 |
|
|
26,820 |
|
Other liabilities |
|
|
35,088 |
|
|
35,371 |
|
Liabilities to noncontrolling interest holders, less current portion |
|
|
15,707 |
|
|
22,576 |
|
Total liabilities |
|
|
875,060 |
|
|
878,659 |
|
Commitments and contingencies (See Note 14) |
|
|
|
|
|
|
|
Stockholders’ equity: |
|
|
|
|
|
|
|
Common stock, par value $0.01 per share, 500,000 shares authorized; 41,069 and 40,971 shares issued and outstanding as of April 30, 2018 and 2017, respectively |
|
|
411 |
|
|
410 |
|
Preferred stock, par value $0.01 per share, 50,000 shares authorized; 0 shares issued and outstanding as of April 30, 2018 and 2017 |
|
|
— |
|
|
— |
|
Additional paid-in capital |
|
|
489,007 |
|
|
488,459 |
|
Retained earnings |
|
|
89,592 |
|
|
26,621 |
|
Accumulated other comprehensive income (loss) |
|
|
441 |
|
|
(884) |
|
Total stockholders’ equity |
|
|
579,451 |
|
|
514,606 |
|
Total liabilities and stockholders’ equity |
|
$ |
1,454,511 |
|
$ |
1,393,265 |
The accompanying notes are an integral part of these consolidated financial statements.
57
GMS Inc.
Consolidated Statements of Operations and Comprehensive Income
(in thousands, except for per share data)
|
|
|
Year Ended April 30, |
|||||||
|
|
|
2018 |
|
2017 |
|
2016 |
|||
|
Net sales |
|
$ |
2,511,469 |
|
$ |
2,319,146 |
|
$ |
1,858,182 |
|
Cost of sales (exclusive of depreciation and amortization shown separately below) |
|
|
1,692,893 |
|
|
1,560,575 |
|
|
1,265,018 |
|
Gross profit |
|
|
818,576 |
|
|
758,571 |
|
|
593,164 |
|
Operating expenses: |
|
|
|
|
|
|
|
|
|
|
Selling, general and administrative |
|
|
633,877 |
|
|
585,078 |
|
|
470,035 |
|
Depreciation and amortization |
|
|
65,530 |
|
|
69,240 |
|
|
64,215 |
|
Total operating expenses |
|
|
699,407 |
|
|
654,318 |
|
|
534,250 |
|
Operating income |
|
|
119,169 |
|
|
104,253 |
|
|
58,914 |
|
Other (expense) income: |
|
|
|
|
|
|
|
|
|
|
Interest expense |
|
|
(31,395) |
|
|
(29,360) |
|
|
(37,418) |
|
Change in fair value of financial instruments |
|
|
(6,125) |
|
|
(382) |
|
|
(19) |
|
Write-off of debt discount and deferred financing fees |
|
|
(74) |
|
|
(7,103) |
|
|
— |
|
Other income, net |
|
|
2,279 |
|
|
4,132 |
|
|
3,671 |
|
Total other expense, net |
|
|
(35,315) |
|
|
(32,713) |
|
|
(33,766) |
|
Income before taxes |
|
|
83,854 |
|
|
71,540 |
|
|
25,148 |
|
Provision for income taxes |
|
|
20,883 |
|
|
22,654 |
|
|
12,584 |
|
Net income |
|
$ |
62,971 |
|
$ |
48,886 |
|
$ |
12,564 |
|
Weighted average common shares outstanding: |
|
|
|
|
|
|
|
|
|
|
Basic |
|
|
41,015 |
|
|
40,260 |
|
|
32,799 |
|
Diluted |
|
|
42,163 |
|
|
41,070 |
|
|
33,125 |
|
Net income per share: |
|
|
|
|
|
|
|
|
|
|
Basic |
|
$ |
1.54 |
|
$ |
1.21 |
|
$ |
0.38 |
|
Diluted |
|
$ |
1.49 |
|
$ |
1.19 |
|
$ |
0.38 |
|
Comprehensive income |
|
|
|
|
|
|
|
|
|
|
Net income |
|
$ |
62,971 |
|
$ |
48,886 |
|
$ |
12,564 |
|
Changes in other comprehensive income, net of tax |
|
|
1,325 |
|
|
264 |
|
|
(1,158) |
|
Comprehensive income |
|
$ |
64,296 |
|
$ |
49,150 |
|
$ |
11,406 |
The accompanying notes are an integral part of these consolidated financial statements.
58
GMS Inc.
Consolidated Statements of Stockholders’ Equity
(in thousands)
|
|
|
|
|
|
|
|
|
|
|
Retained |
|
Accumulated |
|
|
|
|
|
|
|
|
||
|
|
|
|
|
|
|
|
Additional |
|
Earnings |
|
Other |
|
|
|
|
|
|
Total |
||||
|
|
|
Common Stock |
|
Paid-in |
|
(Accumulated |
|
Comprehensive |
|
Treasury Stock |
|
Stockholders' |
||||||||||
|
|
|
Shares |
|
Amount |
|
Capital |
|
Deficit) |
|
Income (Loss) |
|
Shares |
|
Amount |
|
Equity |
||||||
|
Balances as of April 30, 2015 |
|
32,758 |
|
$ |
328 |
|
$ |
329,884 |
|
$ |
(30,650) |
|
$ |
10 |
|
— |
|
$ |
— |
|
$ |
299,572 |
|
Net income |
|
— |
|
|
— |
|
|
— |
|
|
12,564 |
|
|
— |
|
— |
|
|
— |
|
|
12,564 |
|
Change in accounting for liability awards |
|
— |
|
|
— |
|
|
— |
|
|
(3,208) |
|
|
— |
|
— |
|
|
— |
|
|
(3,208) |
|
Change in other comprehensive income, net of tax |
|
— |
|
|
— |
|
|
|
|
|
— |
|
|
(1,158) |
|
— |
|
|
— |
|
|
(1,158) |
|
Equity-based compensation |
|
— |
|
|
— |
|
|
2,699 |
|
|
— |
|
|
— |
|
— |
|
|
— |
|
|
2,699 |
|
Stock repurchases |
|
— |
|
|
— |
|
|
— |
|
|
— |
|
|
— |
|
395 |
|
|
(5,827) |
|
|
(5,827) |
|
Exercise of stock options |
|
135 |
|
|
1 |
|
|
1,661 |
|
|
(971) |
|
|
— |
|
(395) |
|
|
5,827 |
|
|
6,518 |
|
Balances as of April 30, 2016 |
|
32,893 |
|
|
329 |
|
|
334,244 |
|
|
(22,265) |
|
|
(1,148) |
|
— |
|
|
— |
|
|
311,160 |
|
Net income |
|
— |
|
|
— |
|
|
— |
|
|
48,886 |
|
|
— |
|
— |
|
|
— |
|
|
48,886 |
|
Change in other comprehensive income, net of tax |
|
— |
|
|
— |
|
|
— |
|
|
— |
|
|
264 |
|
— |
|
|
— |
|
|
264 |
|
Equity-based compensation |
|
— |
|
|
— |
|
|
2,370 |
|
|
— |
|
|
— |
|
— |
|
|
— |
|
|
2,370 |
|
Issuance of common stock in initial public offering, net of underwriting discounts and offering costs |
|
8,050 |
|
|
80 |
|
|
151,332 |
|
|
— |
|
|
— |
|
— |
|
|
— |
|
|
151,412 |
|
Exercise of stock options |
|
28 |
|
|
1 |
|
|
513 |
|
|
— |
|
|
— |
|
— |
|
|
— |
|
|
514 |
|
Balances as of April 30, 2017 |
|
40,971 |
|
|
410 |
|
|
488,459 |
|
|
26,621 |
|
|
(884) |
|
— |
|
|
— |
|
|
514,606 |
|
Net income |
|
— |
|
|
— |
|
|
— |
|
|
62,971 |
|
|
— |
|
— |
|
|
— |
|
|
62,971 |
|
Change in other comprehensive income, net of tax |
|
— |
|
|
— |
|
|
— |
|
|
— |
|
|
1,325 |
|
— |
|
|
— |
|
|
1,325 |
|
Equity-based compensation |
|
— |
|
|
— |
|
|
1,513 |
|
|
— |
|
|
— |
|
— |
|
|
— |
|
|
1,513 |
|
Tax withholding related to net share settlements of stock options |
|
— |
|
|
— |
|
|
(1,441) |
|
|
— |
|
|
— |
|
— |
|
|
— |
|
|
(1,441) |
|
Exercise of stock options |
|
98 |
|
|
1 |
|
|
476 |
|
|
— |
|
|
— |
|
— |
|
|
— |
|
|
477 |
|
Balances as of April 30, 2018 |
|
41,069 |
|
$ |
411 |
|
$ |
489,007 |
|
$ |
89,592 |
|
$ |
441 |
|
— |
|
$ |
— |
|
$ |
579,451 |
The accompanying notes are an integral part of these consolidated financial statements.
59
GMS Inc.
Consolidated Statements of Cash Flows
(in thousands)
|
|
|
Year Ended April 30, |
|||||||
|
|
|
2018 |
|
2017 |
|
2016 |
|||
|
Cash flows from operating activities: |
|
|
|
|
|
|
|
|
|
|
Net income |
|
$ |
62,971 |
|
$ |
48,886 |
|
$ |
12,564 |
|
Adjustments to reconcile net income to net cash provided by operating activities: |
|
|
|
|
|
|
|
|
|
|
Depreciation and amortization |
|
|
65,530 |
|
|
69,240 |
|
|
64,215 |
|
Write-off and amortization of debt discount and debt issuance costs |
|
|
2,851 |
|
|
9,793 |
|
|
3,438 |
|
Provision for losses on accounts and notes receivable |
|
|
(622) |
|
|
(122) |
|
|
(1,032) |
|
Provision for obsolescence of inventory |
|
|
106 |
|
|
425 |
|
|
80 |
|
Increase (decrease) in fair value of contingent consideration |
|
|
195 |
|
|
(1,484) |
|
|
— |
|
Equity-based compensation |
|
|
5,745 |
|
|
3,142 |
|
|
4,733 |
|
Gain on sale and disposal of assets |
|
|
(509) |
|
|
(336) |
|
|
(645) |
|
Change in fair value of financial instruments |
|
|
6,125 |
|
|
— |
|
|
— |
|
Changes in assets and liabilities net of effects of acquisitions: |
|
|
|
|
|
|
|
|
|
|
Trade accounts and notes receivable |
|
|
(11,752) |
|
|
(20,400) |
|
|
(27,338) |
|
Inventories |
|
|
(34,774) |
|
|
(18,390) |
|
|
(699) |
|
Prepaid expenses and other assets |
|
|
(1,926) |
|
|
(412) |
|
|
(4,682) |
|
Accounts payable |
|
|
11,365 |
|
|
(3,763) |
|
|
1,055 |
|
Accrued compensation and employee benefits |
|
|
(236) |
|
|
4,440 |
|
|
3,454 |
|
Other accrued expenses and current liabilities |
|
|
4,874 |
|
|
626 |
|
|
5,551 |
|
Deferred income taxes |
|
|
(16,224) |
|
|
(20,114) |
|
|
(20,499) |
|
Liabilities to noncontrolling interest holders |
|
|
(3,704) |
|
|
1,133 |
|
|
446 |
|
Income tax receivable / payable |
|
|
(1,399) |
|
|
(5,956) |
|
|
7,106 |
|
Cash provided by operating activities |
|
|
88,616 |
|
|
66,708 |
|
|
47,747 |
|
Cash flows from investing activities: |
|
|
|
|
|
|
|
|
|
|
Purchases of property and equipment |
|
|
(23,741) |
|
|
(11,083) |
|
|
(7,692) |
|
Proceeds from sale of assets |
|
|
2,865 |
|
|
3,995 |
|
|
9,847 |
|
Acquisition of businesses, net of cash acquired |
|
|
(28,333) |
|
|
(150,428) |
|
|
(120,195) |
|
Cash used in investing activities |
|
|
(49,209) |
|
|
(157,516) |
|
|
(118,040) |
|
Cash flows from financing activities: |
|
|
|
|
|
|
|
|
|
|
Repayments on the revolving credit facility |
|
|
(617,230) |
|
|
(1,011,925) |
|
|
(697,144) |
|
Borrowings from the revolving credit facility |
|
|
513,878 |
|
|
1,013,365 |
|
|
782,104 |
|
Payments of principal on long-term debt |
|
|
(5,776) |
|
|
(4,584) |
|
|
(3,931) |
|
Payments of principal on capital lease obligations |
|
|
(6,132) |
|
|
(5,208) |
|
|
(4,249) |
|
Proceeds from issuance of common stock in initial public offering, net of underwriting discounts |
|
|
— |
|
|
156,941 |
|
|
— |
|
Repayment of term loan |
|
|
— |
|
|
(160,000) |
|
|
— |
|
Borrowings from term loan amendments |
|
|
577,616 |
|
|
481,225 |
|
|
— |
|
Repayment of term loan amendments |
|
|
(477,616) |
|
|
(381,225) |
|
|
— |
|
Debt issuance costs |
|
|
(636) |
|
|
(2,637) |
|
|
(391) |
|
Stock repurchases |
|
|
— |
|
|
— |
|
|
(5,827) |
|
Payments for taxes related to net share settlement of equity awards |
|
|
(1,441) |
|
|
— |
|
|
— |
|
Proceeds from exercises of stock options |
|
|
477 |
|
|
345 |
|
|
6,519 |
|
Other financing activities |
|
|
(671) |
|
|
— |
|
|
— |
|
Cash (used in) provided by financing activities |
|
|
(17,531) |
|
|
86,297 |
|
|
77,081 |
|
Increase (decrease) in cash and cash equivalents |
|
|
21,876 |
|
|
(4,511) |
|
|
6,788 |
|
Cash and cash equivalents, beginning of year |
|
|
14,561 |
|
|
19,072 |
|
|
12,284 |
|
Cash and cash equivalents, end of year |
|
$ |
36,437 |
|
$ |
14,561 |
|
$ |
19,072 |
|
Supplemental cash flow disclosures: |
|
|
|
|
|
|
|
|
|
|
Cash paid for income taxes |
|
$ |
38,954 |
|
$ |
49,163 |
|
$ |
26,067 |
|
Cash paid for interest |
|
|
28,613 |
|
|
26,443 |
|
|
34,557 |
|
Supplemental schedule of noncash activities: |
|
|
|
|
|
|
|
|
|
|
Assets acquired under capital lease |
|
$ |
9,086 |
|
$ |
9,410 |
|
$ |
7,542 |
|
Issuance of installment notes associated with equity-based compensation liability awards |
|
|
12,433 |
|
|
5,352 |
|
|
1,557 |
|
Increase in other liabilities due to transition guidance |
|
|
— |
|
|
— |
|
|
3,208 |
|
(Decrease) increase in insurance claims payable and insurance recoverable |
|
|
(2,362) |
|
|
1,876 |
|
|
(25,715) |
The accompanying notes are an integral part of these consolidated financial statements.
60
1. Business, Basis of Presentation and Summary of Significant Accounting Policies
Business
Founded in 1971, GMS Inc. (“we,” “our,” “us,” or the “Company”), through its wholly-owned operating subsidiaries, is a distributor of specialty building products including wallboard, suspended ceilings systems, or ceilings, steel framing and other complementary specialty building products. We purchase products from a large number of manufacturers and then distribute these goods to a customer base consisting of wallboard and ceilings contractors and homebuilders and, to a lesser extent, general contractors and individuals. As of April 30, 2018, we had a national footprint with 214 branches across 42 states.
Initial and Secondary Public Offerings
On June 1, 2016, we completed an initial public offering (“IPO”) of 8.1 million shares of common stock at a price of $21.00 per share, including 1.1 million shares of common stock that were issued as a result of the exercise in full by the underwriters of an option to purchase additional shares to cover over‑allotments. After underwriting discounts and commissions, but before expenses, we received net proceeds from the IPO of approximately $156.9 million. We used these proceeds together with cash on hand to repay $160.0 million principal amount of our term loan debt outstanding under our senior secured second lien term loan facility, which was a payment in full of the entire loan balance due under our senior secured second lien term loan facility.
On February 28, 2017, certain of our stockholders completed a secondary public offering of 8.0 million shares of the Company’s common stock at a price to the public of $29.25 per share, including 1.0 million shares of common stock that were sold as a result of the exercise in full by the underwriters of an option to purchase additional shares that was granted by the selling stockholders. We did not receive any proceeds from the sale of our common stock by the selling stockholders.
On June 7, 2017, certain of our stockholders completed an additional secondary public offering of 5.8 million shares of the Company’s common stock at a price to the public of $33.00 per share, including 0.8 million shares of common stock that were sold as a result of the exercise in full by the underwriters of an option to purchase additional shares that was granted by the selling stockholders. As a result of such offering, the control group consisting of certain affiliates of AEA Investors LP (“AEA”) and certain other of our stockholders no longer controlled a majority of the voting power of our outstanding common stock. Accordingly, we are no longer a “controlled company” within the meaning of the New York Stock Exchange corporate governance standards. We did not receive any proceeds from the sale of our common stock by the selling stockholders.
On December 14, 2017, certain of our stockholders completed an additional secondary public offering of 5.0 million shares of the Company’s common stock at a price to the public of $38.25 per share. We did not receive any proceeds from the sale of our common stock by the selling stockholders.
Principles of Consolidation
The consolidated financial statements of the Company include the accounts of its wholly-owned subsidiaries. All material intercompany balances and transactions have been eliminated in consolidation.
Use of Estimates
The preparation of financial statements in conformity with U.S. generally accepted accounting principles (“GAAP”) requires management to make estimates and assumptions that affect the reported amounts of assets and liabilities and disclosure of contingent assets and liabilities at the date of the financial statements and the reported amounts of revenues and expenses during the reporting period. Actual results could differ from those estimates.
61
Reclassifications
Certain amounts in the prior year financial statements have been reclassified to conform to the current year presentation.
Cash and Cash Equivalents
The Company considers all highly liquid investments with a maturity of three months or less when purchased to be cash equivalents.
Trade Accounts Receivable
Accounts receivables are recorded at their net realizable value. The Company maintains an allowance for doubtful accounts for estimated losses due to the failure of customers to make required payments, as well as allowances for sales returns and cash discounts. The Company’s estimate of the allowance for doubtful accounts is based on an assessment of individual past due accounts, historical write‑off experience, accounts receivable aging and current economic trends. Account balances are written off when the potential for recovery is considered remote. The Company’s estimates of sales returns and cash discounts are based on an analysis of historical information.
Inventories
Inventories consist of finished goods purchased for resale and include wallboard, ceilings, steel framing and other specialty building products. Inventories are valued at the lower of cost or market (net realizable value). The cost of inventories is determined by the moving average cost method. We monitor our inventory levels and record provisions for excess inventories based on slower moving inventory. In addition, at the end of each year, we evaluate our inventory at each branch and write off and dispose of obsolete products. Our inventories are generally not susceptible to technological obsolescence.
Property and Equipment
Property and equipment is recorded at cost less accumulated depreciation. Property and equipment obtained through acquisition are stated at estimated fair value as of the acquisition date. Expenditures for improvements and betterments are capitalized, while the costs of maintenance and repairs are charged to operating expense as incurred. Gains and losses related to the sale of property and equipment are recorded in selling, general and administrative expenses in the Consolidated Statements of Operations and Comprehensive Income.
Depreciation expense is determined using the straight-line method over the estimated useful lives of the various asset classes. The estimated useful lives of property and equipment are as follows:
|
Buildings |
|
25 - 39 years |
|
Furniture, fixtures and automobiles |
|
3 - 5 years |
|
Warehouse and delivery equipment |
|
4 - 10 years |
|
Leasehold improvements |
|
Shorter of estimated useful life or lease term |
Goodwill
Goodwill is the excess of the purchase price over the fair value of identifiable net assets acquired in business combinations accounted for under the acquisition method of accounting. The Company does not amortize goodwill. The Company tests its goodwill annually during the fourth quarter of its fiscal year or when events and circumstances indicate that those assets might not be recoverable. Impairment testing of goodwill is required at the reporting unit level (operating segment or one level below operating segment) and involves a two-step process. Prior to performing the two-step impairment test, the Company may make a qualitative assessment of the likelihood of goodwill impairment in order to determine whether a detailed quantitative analysis is required. The first step of the impairment test involves comparing the estimated fair values of the Company’s reporting units with the reporting units’ carrying amounts,
62
including goodwill. If the carrying amount of the reporting unit exceeds its fair value, a second step is performed to compare the carrying amount of goodwill to the implied fair value of that goodwill. If the carrying amount of goodwill exceeds the implied fair value of that goodwill, an impairment loss is recognized in an amount equal to the excess.
Intangible Assets
Intangible assets consist of customer relationships, trade names and other assets acquired in conjunction with the purchases of businesses or purchases of assets from other companies. The Company typically uses an income method to estimate the fair value of intangible assets, which is based on forecasts of the expected future cash flows attributable to the respective assets. When management determines material intangible assets are acquired in conjunction with the purchase of a business, the Company determines the fair values of the identifiable intangible assets by taking into account management’s own analysis and an independent third-party valuation specialist’s appraisal. Intangible assets determined to have definite lives are amortized over their estimated useful lives.
Long-Lived Assets
The Company evaluates the recoverability of long-lived assets, including property and equipment and intangible assets, for impairment when events or changes in circumstances indicate that the carrying amount of an asset may not be recoverable. Conditions that would necessitate an impairment assessment include a significant decline in the observable market value of an asset, a significant change in the extent or manner in which an asset is used or a significant adverse change that would indicate the carrying amount of an asset or group of assets is not recoverable. For long-lived assets to be held and used, the Company recognizes an impairment loss if its carrying amount is not recoverable through its undiscounted cash flows and measures the impairment loss, if any, based on the difference between the carrying amount and fair value. Long-lived assets held for sale are reported at the lower of cost or fair value less costs to sell and are recorded within prepaid expenses and other current assets in the Consolidated Balance Sheets. The Company classifies assets as held for sale if it commits to a plan to sell the asset within one year and actively markets the asset in its current condition for a price that is reasonable in comparison to its estimated fair value.
Insurance Liabilities
The Company is self‑insured for certain losses related to medical claims. The Company has stop-loss coverage to limit the exposure arising from medical claims. The Company has deductible‑based insurance policies for certain losses related to general liability, workers’ compensation and automobile. The deductible amount per incident is $0.3 million, $0.5 million and $1.0 million for general liability, workers’ compensation and automobile, respectively. The coverage consists of a primary layer and an excess layer. The primary layer of coverage is from $0.5 million to $2.0 million and the excess layer covers claims from $2.0 million to $100.0 million. The expected ultimate cost for claims incurred as of the balance sheet date is not discounted and is recognized as a liability. Insurance losses for claims filed and claims incurred but not reported are accrued based upon estimates of the aggregate liability for uninsured claims using loss development factors and actuarial assumptions followed in the insurance industry and historical loss development experience.
As of April 30, 2018 and 2017, the aggregate liabilities for medical self‑insurance were $4.1 million and $3.4 million, respectively, and are included in other accrued expenses and current liabilities in the Consolidated Balance Sheets. As of April 30, 2018 and 2017, reserves for general liability, workers’ compensation and automobile totaled $14.7 million and $15.9 million, respectively, and are included in other accrued expenses and current liabilities and other liabilities in the Consolidated Balance Sheets. During the year ended April 30, 2016, an insured automobile claim related to prior years, subject to a $0.5 million deductible, was paid by our insurance carrier in the amount of $26.3 million. As of April 30, 2018 and 2017, expected recoveries for medical self‑insurance, general liability, automobile and workers’ compensation totaled $4.8 million and $6.7 million, respectively, and are included in prepaid expenses and other current assets and other assets in the Consolidated Balance Sheets.
63
Debt Issuance Costs
The Company capitalizes debt issuance costs and amortizes them over the term of the related debt. The Company uses the straight‑line method to amortize debt issuance costs for its revolving credit facility and uses the effective interest method to amortize debt issuance costs for its term loan facilities. Amortization of debt issuance costs is recorded in interest expense in the Consolidated Statements of Operations and Comprehensive Income. The Company classifies debt issuance costs for its revolving credit facility as an asset in the Consolidated Balance Sheets and classifies debt issuance costs for its term loan facilities as a reduction of the related debt in the Consolidated Balance Sheets.
Leases
The Company categorizes leases at their inception as either operating or capital leases depending on certain criteria. Leased property and equipment meeting capital lease criteria are capitalized at the lower of the present value of the related lease payments or the fair value of the leased asset at the inception of the lease. Certain of the Company’s operating lease agreements include scheduled rent escalations or rent holidays over the term of the lease. The Company recognizes rent expense on a straight-line basis over the term of the lease. The difference between rent expense and rent paid is recorded as deferred rent in the Consolidated Balance Sheets. Incentives granted under certain leases are treated as a reduction of the Company’s rent expense on a straight-line basis over the term of the related lease agreement.
Stock Appreciation Rights, Deferred Compensation and Liabilities to Noncontrolling Interest Holders
Certain subsidiaries have equity based compensation agreements with the subsidiary’s employees and minority shareholders. These agreements are stock appreciation rights, deferred compensation agreements and liabilities to noncontrolling interest holders. Since these agreements are typically settled in cash or notes, they are accounted for as liability awards and measured at fair value. See Note 11, “Stock Appreciation Rights, Deferred Compensation and Redeemable Noncontrolling Interests,” for additional information with respect to these agreements.
Derivative Instruments
The Company has entered into derivative instruments to manage its exposure to certain financial risks. The Company’s derivative financial instruments are recognized as either assets or liabilities in the Consolidated Balance Sheets and measured at fair value. Derivative instruments that do not qualify as a hedge or are not designated as a hedge are adjusted to estimated fair value in earnings. Derivative instruments that meet hedge criteria are formally designated as hedges. For derivative instruments designated as a cash flow hedge, the Company recognizes the change in fair value, net of taxes, on the effective portion of the derivative to accumulated other comprehensive income (loss) in the Consolidated Balance Sheets, and an amount is reclassified out of accumulated other comprehensive income (loss) into earnings to offset the earnings impact that is attributable to the risk being hedged. For derivative instruments designated as a fair value hedge, the Company recognizes the loss or gain attributable to the risk being hedged in earnings in the period of change with a corresponding offset recorded to the item for which the risk is being hedged. The Company performs the effectiveness testing of its designated hedges on a quarterly basis and the changes in ineffective portions of the derivatives, if any, are recognized immediately in earnings.
As of April 30, 2018 and 2017, the Company had an interest rate cap agreement with the objective of minimizing the risks and costs associated with its variable rate debt. This agreement is an interest rate cap on quarterly resetting 3‑month LIBOR, based on a strike rate of 2.0% and payable quarterly. This instrument effectively caps the interest rate at 5.75% on an initial notional amount of $275.0 million of the Company’s variable rate debt obligation under the First Lien Facility, or any replacement facility with similar terms. The interest rate cap expires on October 31, 2018. The Company believes there have been no material changes in the creditworthiness of the counterparty to this cap agreement and believes the risk of nonperformance by such party is minimal. The Company has designated the interest rate cap agreement as a cash flow hedge. This derivative instrument is classified in other assets in the Consolidated Balance Sheets.
In April 2018, in connection with the acquisition of WSB Titan (see Note 21, “Subsequent Events”), the Company entered into a foreign currency forward contract to mitigate the foreign currency exchange risk associated with
64
the purchase price that was denominated in Canadian dollars. The foreign currency forward contract effectively fixed the amount the Company paid for the purchase price denominated in Canadian dollars by contracting the Company to pay U.S. dollars and receive Canadian dollars on the notional amount. The notional amount of the foreign currency forward contract was $569.2 million as of April 30, 2018. The foreign currency forward contract was not eligible for hedge accounting. This derivative instrument is classified in other accrued expenses and current liabilities in the Consolidated Balance Sheet.
See Note 12, “Fair Value Measurements,” and Note 16, “Accumulated Other Comprehensive (Loss) Income,” for additional information with respect to the Company’s derivative instruments.
Revenue Recognition
The Company recognizes revenue at the point of sale or upon delivery to the customer’s site when persuasive evidence of an arrangement exists, delivery has occurred or services have been rendered, the price to the buyer is fixed or determinable and collectability is reasonably assured. Revenue, net of estimated returns and allowances, is recognized when sales transactions occur and title is passed and the related product is delivered. Revenue includes any applicable shipping and handling costs invoiced to the customer. The expense related to such costs is included in selling, general and administrative expenses in the Consolidated Statements of Operations and Comprehensive Income.
Cost of Sales
Cost of sales reflects the direct cost of goods purchased from third parties, rebates earned from vendors, adjustments for inventory reserves and the cost of inbound freight.
Vendor Rebates
Typical arrangements with our vendors provide for us to receive a rebate of a specified amount after we achieve any of a number of measures generally related to the volume of our purchases over a period of time. We record these rebates to effectively reduce our cost of sales in the period in which we sell the product. Throughout the year, we estimate the amount of rebates receivable for the periodic programs based upon the expected level of purchases. We accrue for the receipt of vendor rebates based on purchases and also reduce inventory to reflect the deferral of cost of sales.
Selling, General and Administrative Expenses
Selling, general and administrative expenses include expenses related to the delivery and warehousing of our products, as well as employee compensation and benefits expenses for employees in our branches and yard support center, as well as other administrative expenses, such as legal, accounting and IT costs. Selling, general and administrative expenses included delivery expenses of $228.0 million, $205.0 million and $159.1 million during the years ended April 30, 2018, 2017 and 2016, respectively.
Advertising Expense
The cost of advertising is expensed as incurred and included in selling, general and administrative expenses in the Consolidated Statements of Operations and Comprehensive Income. Advertising expense was $1.8 million, $2.3 million and $2.0 million during the years ended April 30, 2018, 2017 and 2016, respectively.
Equity‑Based Compensation
As of April 30, 2018, the Company had various stock-based compensation plans, which are more fully described in Note 10, “Equity-Based Compensation.” The Company measures compensation cost for all share‑based awards at fair value on the grant date (or measurement date if different) and recognizes compensation expense, net of estimated forfeitures, over the requisite service period for awards expected to vest. The Company estimates the fair value of stock options using the Black-Scholes valuation model and determines the fair value of restricted stock units based on
65
the quoted price of GMS’s common stock on the date of grant. The Company estimates forfeitures based on historical analysis of actual forfeitures and employee turnover. Actual forfeitures are recorded when incurred and estimated forfeitures are reviewed at least annually.
Income Taxes
Income taxes are accounted for using the asset and liability method. Deferred tax assets and liabilities are recognized based on the difference between the financial statement carrying amounts of existing assets and liabilities and their respective tax bases. Inherent in the measurement of deferred balances are certain judgments and interpretations of existing tax law and published guidance as applicable to our operations.
We evaluate our deferred tax assets to determine if valuation allowances are required. In assessing the realizability of deferred tax assets, we consider both positive and negative evidence in determining whether it is more likely than not that some portion or all of the deferred tax assets will not be realized. The primary negative evidence considered includes the cumulative operating losses generated in prior periods. The primary positive evidence considered includes the reversal of deferred tax liabilities related to depreciation and amortization that would occur within the same jurisdiction and during the carry‑forward period necessary to absorb the federal and state net operating losses and other deferred tax assets. The reversal of such liabilities would utilize the federal and state net operating losses and other deferred tax assets.
We record amounts for uncertain tax positions that management believes are supportable, but are potentially subject to successful challenge by the applicable taxing authority. Consequently, changes in our assumptions and judgments could materially affect amounts recognized related to income tax uncertainties and may affect our results of operations or financial position. We believe our assumptions for estimates are reasonable, although actual results may have a positive or negative material impact on the balances of such tax positions. Historically, the variation of estimates to actual results is not significant and material variation is not expected in the future.
Credit and Economic Risk
Financial instruments that potentially subject the Company to significant concentrations of credit risk consist principally of cash and cash equivalents and trade accounts and notes receivable. The Company assesses the credit standing of counterparties as considered necessary. The Company routinely assesses the financial strength of its customers and generally does not require collateral. Concentrations of credit risk with respect to trade accounts receivable are limited due to the large number of geographically diverse customers comprising the Company’s customer base. Additionally, the Company maintains allowances for potential credit losses. The Company does not enter into financial instruments for trading or speculative purposes. As of April 30, 2018 and 2017, no customer accounted for more than 10% of gross accounts receivable.
The Company purchases a majority of its inventories from a select group of vendors. Without these vendors, the Company’s ability to acquire inventory would be significantly impaired.
66
Fair Value of Financial Instruments
Fair value is defined as the price that would be received to sell an asset or paid to transfer a liability in an orderly transaction between market participants at the measurement date. Authoritative guidance for fair value measurements establishes a three‑level hierarchy that prioritizes the inputs to valuation models based upon the degree to which they are observable. The three levels of the fair value measurement hierarchy are as follows:
|
Level 1 |
Inputs are quoted prices (unadjusted) in active markets for identical assets or liabilities that the reporting entity can access at the measurement date. |
|
Level 2 |
Inputs are inputs other than quoted prices included within Level 1 that are observable for the asset or liability, either directly or indirectly. |
|
Level 3 |
Inputs are unobservable inputs for which little or no market data exists, therefore requiring an entity to develop its own assumptions. |
The carrying values of the Company’s cash, cash equivalents, trade receivables and trade payables approximate their fair values because of their nature and short‑term nature. Based on borrowing rates available to the Company for loans with similar terms, the carrying values of the Company’s debt instruments approximate fair value. See Note 12, “Fair Value Measurements,” for additional information with respect to the Company’s fair value measurements.
Earnings Per Share
Basic earnings per share is computed by dividing net income by the weighted average number of outstanding shares of common stock for the period. Diluted earnings per share reflects the potential dilution that could occur if securities or other contracts to issue common stock, including stock options and restricted stock units (collectively “Common Stock Equivalents”), were exercised or converted into common stock. The dilutive effect of outstanding stock options and restricted stock units is reflected in diluted earnings per share by application of the treasury stock method. In applying the treasury stock method for stock-based compensation arrangements, the assumed proceeds are computed as the sum of the amount the employee must pay upon exercise and the amount of compensation cost attributed to future services and not yet recognized. Diluted earnings per share is computed by increasing the weighted‑average number of outstanding shares of common stock computed in basic earnings per share to include the dilutive effect of Common Stock Equivalents for the period. In periods of net loss, the number of shares used to calculate diluted loss per share is the same as basic net loss per share.
Recently Adopted Accounting Pronouncements
Inventory—In July 2015, the Financial Accounting Standards Board (the “FASB”) issued authoritative guidance on accounting for inventory. The new guidance requires that inventory be measured at the lower of cost and net realizable value. The new guidance is limited to inventory measured using the first-in, first-out (“FIFO”) or average cost methods and excludes inventory measured using last-in, first-out (“LIFO”) or retail inventory methods. The new standard is effective for fiscal years, and interim periods, beginning after December 15, 2016. The Company adopted this guidance on May 1, 2017 (the first day of fiscal 2018) with no material impact to the Company’s financial position, results of operations or cash flows.
Stock Compensation—In March 2016, the FASB issued authoritative guidance that simplifies many key aspects of the accounting for and cash flow presentation of employee share-based compensation transactions, including accounting for income taxes, forfeitures and statutory withholding requirements. The Company adopted this guidance on May 1, 2017 (the first day of fiscal 2018) on a prospective basis. Effective May 1, 2017, the Company now records all excess tax benefits or tax deficiencies as a component of its provision for income taxes in the statement of operations. The Company recorded excess tax benefits of $1.3 million during the year ended April 30, 2018. Additionally, the Company now presents excess tax benefits or deficiencies as operating cash flows versus reclassifying the amount out of operating cash flows and presenting it in financing activities in the Consolidated Statement of Cash Flows.
Additional amendments from this guidance related to forfeitures and minimum statutory withholding tax requirements had no impact to our financial position, results of operations or cash flows. As permitted, we continue to
67
estimate forfeitures to determine the amount of compensation cost to be recognized each period rather than electing to account for forfeitures as they occur, and we continue to present the value of shares withheld for minimum statutory tax withholding requirements on the statements of cash flows as a financing activity. Another impact of the adoption is that the calculation of the effect of dilutive securities now excludes any derived excess tax benefits or deficiencies from assumed future proceeds.
Definition of a Business—In January 2017, the FASB authoritative guidance on the definition of a business. The new guidance clarifies the definition of a business to help companies evaluate whether acquisition or disposal transactions should be accounted for as assets groups or as businesses. The Company adopted this guidance on May 1, 2017 (the first day of fiscal 2018) on a prospective basis with no material impact to the Company’s financial position, results of operations or cash flows.
Recently Issued Accounting Pronouncements
Revenue recognition—In May 2014, the FASB issued authoritative guidance on revenue from contracts with customers. The new guidance supersedes most existing revenue recognition guidance and outlines a single comprehensive model for entities to use in accounting for revenue arising from contracts with customers. The core principle of the revenue model is that an entity recognizes revenue to depict the transfer of promised goods or services to customers in an amount that reflects the consideration to which the entity expects to be entitled in exchange for those goods or services. The new standard also requires disclosure of the nature, amount, timing, and uncertainty of revenue and cash flows arising from contracts with customers. In August 2015, the FASB issued guidance that deferred the effective date by one year. The standard is now required to be adopted by public business entities in annual periods beginning on or after December 15, 2017, and interim periods within those annual periods, and may be applied on a full retrospective or modified retrospective approach. Early adoption at the original effective date is permitted.
The Company adopted this guidance on May 1, 2018 (the first day of fiscal 2019) using the modified retrospective approach. The Company completed its assessment of the new revenue recognition guidance and concluded that the adoption of this standard did not have a material impact on its financial statements. The adoption of the new guidance will result in additional disclosures regarding the Company’s revenue recognition beginning with the Company’s Quarterly Report on Form 10-Q for the quarterly period ended July 31, 2018. The adoption of the new guidance will also result in a balance sheet reclassification for recording our estimate for customer returns.
Leases—In February 2016, the FASB issued authoritative guidance on accounting for leases. The new standard establishes a right-of-use (ROU) model that requires a lessee to record a ROU asset and a lease liability on the balance sheet for all leases with terms longer than 12 months. Leases will be classified as either finance or operating, with such classification affecting the pattern of expense recognition in the statement of operations. The new standard is effective for the Company’s fiscal year beginning May 1, 2019 (the first day of fiscal 2020), including interim reporting periods within that fiscal year. A modified transition approach is required for lessees for capital and operating leases existing at, or entered into after, the beginning of the earliest comparative period presented in the financial statements, with certain practical expedients available. While the Company is still evaluating the impact of its pending adoption of the new standard on its financial statements, the Company expects that upon adoption it will recognize material ROU assets and liabilities.
Statement of Cash Flows – In August 2016, the FASB issued new guidance to reduce diversity in practice related to certain cash receipts and payment in the statement of cash flows by adding or clarifying guidance on eight specific cash flow issues. The new guidance is effective for fiscal years, and interim periods within those fiscal years, beginning after December 15, 2017. Early adoption is permitted. The Company adopted this guidance on May 1, 2018 (the first day of fiscal 2019) with no material impact on its financial statements.
Income Taxes – In October 2016, the FASB issued new guidance intended to improve the accounting for intra-entity transfers of assets other than inventory by requiring recognition of income tax consequences of intra-entity transfers of assets other than inventory when the transfer occurs. The new guidance is effective for annual and interim periods beginning after December 15, 2017. Early adoption is permitted. The amendments in this update should be applied on a modified retrospective basis through a cumulative-effect adjustment directly to retained earnings as of the
68
beginning of the period of adoption. The Company adopted this guidance on May 1, 2018 (the first day of fiscal 2019) with no material impact on its financial statements.
Goodwill – In January 2017, the FASB issued authoritative guidance that simplifies the accounting for goodwill impairments by eliminating Step 2 from the goodwill impairment test. Under the new guidance, goodwill impairment will be the amount by which a reporting unit’s carrying value exceeds its fair value. The new standard is effective for annual and any interim impairment tests for periods beginning after December 15, 2019. Early adoption is permitted. The Company does not expect the adoption of this standard to have a material impact on its financial statements.
Accumulated Other Comprehensive Income – In February 2018, the FASB issued authoritative guidance which permits entities to reclassify, to retained earnings, the one-time income tax effects stranded in accumulated other comprehensive income arising from the change in the U.S. federal corporate tax rate as a result of the Tax Cuts and Jobs Act of 2017. An entity that elects to make this reclassification must consider all items in accumulated other comprehensive income that have tax effects stranded as a result of the tax rate change, and must disclose the reclassification of these tax effects as well as the entity’s policy for releasing income tax effects from accumulated other comprehensive income. The new guidance may be applied either retrospectively or as of the beginning of the period of adoption. The new guidance is effective for annual and interim periods beginning after December 15, 2018. Early adoption is permitted. The Company plans to adopt this guidance on May 1, 2019 (the first day of fiscal 2020). While this guidance will have no impact on the Company’s results of operations, the Company is currently assessing this standard’s impact on its consolidated financial position.
2. Business Acquisitions
The Company accounts for business combinations by recognizing the assets acquired and liabilities assumed at the acquisition date fair value. In valuing acquired assets and liabilities, fair value estimates use Level 3 inputs, including future expected cash flows and discount rates. Goodwill is measured as the excess of consideration transferred over the fair values of the assets acquired and the liabilities assumed. While the Company uses its best estimates and assumptions as a part of the purchase price allocation process to accurately value assets acquired and liabilities assumed at the acquisition date, the Company’s estimates are inherently uncertain and subject to refinement. As a result, during the measurement period, which may be up to one year from the acquisition date, the Company records adjustments to the assets acquired and liabilities assumed, with the corresponding offset to goodwill. Upon the conclusion of the measurement period, any subsequent adjustments arising from new facts and circumstances are recorded to the Consolidated Statements of Comprehensive Income. The results of operations of acquisitions are reflected in the Company’s Consolidated Financial Statements from the date of acquisition.
Fiscal 2018 Acquisitions
In fiscal 2018, the Company completed the following acquisitions, with an aggregate purchase price of $24.4 million of cash consideration, subject to finalization of certain working capital settlement amounts. The purpose of these acquisitions was to expand the geographical coverage of the Company and grow the business.
|
Company Name |
|
Form of Acquisition |
|
Date of Acquisition |
|
ASI Building Products, LLC |
|
Purchase of net assets |
|
August 1, 2017 |
|
Washington Builders Supply, Inc. |
|
Purchase of net assets |
|
October 2, 2017 |
|
Southwest Building Materials, Ltd. |
|
Purchase of net assets |
|
December 4, 2017 |
|
California-based distribution business of Grabber Construction Products, Inc. |
|
Purchase of net assets |
|
April 2, 2018 |
|
CMH Distributing, Inc. |
|
Purchase of net assets |
|
April 2, 2018 |
69
The preliminary allocation of consideration for these acquisitions is summarized as follows:
|
|
|
Preliminary |
|
|
|
|
Purchase Price |
|
|
|
|
Allocation |
|
|
|
|
|
(in thousands) |
|
Trade accounts and notes receivable |
|
$ |
4,872 |
|
Inventories |
|
|
4,321 |
|
Property and equipment |
|
|
1,081 |
|
Tradenames |
|
|
1,000 |
|
Vendor agreement |
|
|
1,000 |
|
Other intangible assets |
|
|
620 |
|
Customer relationships |
|
|
9,358 |
|
Goodwill |
|
|
4,145 |
|
Liabilities assumed |
|
|
(1,951) |
|
Purchase price |
|
$ |
24,446 |
Goodwill recognized is attributable to synergies achieved through the streamlining of operations combined with improved margins attainable through increased market presence and is all attributable to our one operating reportable segment. The goodwill and other intangible assets related to these acquisitions are expected to be deductible for U.S. federal income tax purposes. The Company believes that information gathered to date provides a reasonable basis for estimating the fair values of assets acquired and liabilities assumed, but the Company is waiting for additional information necessary to finalize certain of those fair values, specifically, the finalization of working capital settlements. Thus, the provisional measurements of certain fair values set forth above are preliminary. Such changes are not expected to be significant. The Company expects to complete the purchase price allocation as soon as practicable, but no later than one year from the applicable acquisition date. The pro forma impact of these acquisitions is not presented as it is not considered material to the Company’s Consolidated Financial Statements.
Fiscal 2017 Acquisitions
In fiscal 2017, the Company completed the following acquisitions, with an aggregate purchase price of $154.0 million, comprised of $148.7 million of cash consideration and $5.3 million of consideration related to working capital settlements and contingent consideration. The purpose of these acquisitions was to expand the geographical coverage of the Company and grow the business.
|
Company Name |
|
Form of Acquisition |
|
Date of Acquisition |
|
Wall & Ceiling Supply Co., Inc. |
|
Purchase of net assets |
|
May 2, 2016 |
|
Rockwise, LLC |
|
Purchase of net assets |
|
July 5, 2016 |
|
Steven F. Kempf Building Materials, Inc. |
|
Purchase of net assets |
|
August 29, 2016 |
|
Olympia Building Supplies, LLC/Redmill, Inc. |
|
Purchase of 100% of outstanding common stock |
|
September 1, 2016 |
|
United Building Materials, Inc. |
|
Purchase of net assets |
|
October 3, 2016 |
|
Ryan Building Materials, Inc. |
|
Purchase of net assets |
|
October 31, 2016 |
|
Interior Products Supply |
|
Purchase of net assets |
|
December 5, 2016 |
|
Hawaii-based distribution business of Grabber Construction Products, Inc. |
|
Purchase of net assets |
|
February 1, 2017 |
70
The allocation of consideration for these acquisitions is summarized as follows:
|
|
|
Preliminary |
|
|
|
|
Final |
||
|
|
|
Purchase Price |
|
Adjustments/ |
|
Purchase Price |
|||
|
|
|
Allocation |
|
Reclassifications |
|
Allocation |
|||
|
|
|
(in thousands) |
|||||||
|
Cash and cash equivalents |
|
$ |
1,558 |
|
$ |
— |
|
$ |
1,558 |
|
Trade accounts and notes receivable |
|
|
37,691 |
|
|
(63) |
|
|
37,628 |
|
Inventories |
|
|
16,504 |
|
|
— |
|
|
16,504 |
|
Other current assets |
|
|
657 |
|
|
14 |
|
|
671 |
|
Property and equipment |
|
|
8,357 |
|
|
— |
|
|
8,357 |
|
Tradenames |
|
|
9,490 |
|
|
— |
|
|
9,490 |
|
Customer relationships |
|
|
64,660 |
|
|
— |
|
|
64,660 |
|
Goodwill |
|
|
37,728 |
|
|
(144) |
|
|
37,584 |
|
Deferred tax liability |
|
|
(6,011) |
|
|
— |
|
|
(6,011) |
|
Liabilities assumed |
|
|
(16,958) |
|
|
560 |
|
|
(16,398) |
|
Purchase price |
|
$ |
153,676 |
|
$ |
367 |
|
$ |
154,043 |
During the year ended April 30, 2018, the Company recorded adjustments to working capital for fiscal 2017 acquisitions resulting in an increase in total consideration paid of $0.4 million. Goodwill recognized is attributable to synergies achieved through the streamlining of operations combined with improved margins attainable through increased market presence and is all attributable to our one operating reportable segment. Goodwill of $25.4 million and other intangible assets of $53.6 million related to these acquisitions are expected to be deductible for U.S. federal income tax purposes. Goodwill of $12.2 million and other intangibles of $20.6 million are nondeductible for U.S. federal income tax purposes.
Fiscal 2016 Acquisitions
In fiscal 2016, the Company completed the following acquisitions, with an aggregate purchase price of $117.2 million, comprised of $114.8 million of cash consideration and $2.4 million of contingent consideration. The purpose of these acquisitions was to expand the geographical coverage of the Company and grow the business.
|
Company Name |
|
Form of Acquisition |
|
Date of Acquisition |
|
Tri-Cities Drywall & Supply Co. |
|
Purchase of net assets |
|
September 29, 2015 |
|
Badgerland Supply, Inc. |
|
Purchase of net assets |
|
November 2, 2015 |
|
Hathaway & Sons, Inc. |
|
Purchase of net assets |
|
November 9, 2015 |
|
Gypsum Supply Company |
|
Purchase of 100% of outstanding common stock |
|
January 1, 2016 |
|
Robert N. Karpp Co., Inc. |
|
Purchase of net assets |
|
February 1, 2016 |
|
Professional Handling & Distribution, Inc. |
|
Purchase of net assets |
|
February 1, 2016 |
|
M.R. Lee Building Materials, Inc. |
|
Purchase of net assets |
|
April 4, 2016 |
71
The allocation of consideration for these acquisitions is summarized as follows:
|
|
|
Final |
|
|
|
|
Purchase Price |
|
|
|
|
Allocation |
|
|
|
|
(in thousands) |
|
|
Cash and cash equivalents |
|
$ |
953 |
|
Trade accounts and notes receivable |
|
|
26,988 |
|
Inventories |
|
|
17,703 |
|
Property and equipment |
|
|
9,236 |
|
Other assets |
|
|
808 |
|
Tradenames |
|
|
12,500 |
|
Below market leases |
|
|
2,020 |
|
Customer relationships |
|
|
29,055 |
|
Goodwill |
|
|
38,399 |
|
Deferred tax liability |
|
|
(6,676) |
|
Liabilities assumed |
|
|
(13,805) |
|
Purchase price |
|
$ |
117,181 |
Goodwill recognized is attributable to synergies achieved through the streamlining of operations combined with improved margins attainable through increased market presence and is all attributable to our one operating reportable segment. Goodwill of $13.4 million and other intangible assets of $26.3 million are expected to be deductible for U.S. federal income tax purposes. Goodwill of $25.0 million and other intangibles of $17.2 million are nondeductible for U.S. federal income tax purposes.
3. Property and Equipment
The Company’s property and equipment consisted of the following as of April 30, 2018 and 2017:
|
|
|
April 30, |
||||
|
|
|
2018 |
|
2017 |
||
|
|
|
(in thousands) |
||||
|
Land |
|
$ |
50,795 |
|
$ |
50,009 |
|
Buildings and leasehold improvements |
|
|
87,837 |
|
|
81,872 |
|
Machinery and equipment |
|
|
108,444 |
|
|
90,303 |
|
Construction in progress |
|
|
2,267 |
|
|
3,690 |
|
Total property and equipment |
|
|
249,343 |
|
|
225,874 |
|
Less: accumulated depreciation and amortization |
|
|
85,761 |
|
|
71,409 |
|
Total property and equipment, net of accumulated depreciation |
|
$ |
163,582 |
|
$ |
154,465 |
Depreciation expense for property and equipment, which includes amortization of property under capital leases, was $24.1 million, $25.6 million and $26.7 million during the years ended April 30, 2018, 2017 and 2016 respectively.
72
4. Goodwill and Intangible Assets
Goodwill
The following table presents changes in the carrying amount of goodwill during the years ended April 30, 2018 and 2017:
|
|
|
Carrying |
|
|
|
|
Amount |
|
|
|
|
(in thousands) |
|
|
Balance as of April 30, 2016 |
|
$ |
386,306 |
|
Goodwill acquired |
|
|
37,728 |
|
Purchase price adjustments |
|
|
(390) |
|
Balance as of April 30, 2017 |
|
|
423,644 |
|
Goodwill acquired |
|
|
4,145 |
|
Purchase price adjustments |
|
|
(144) |
|
Balance as of April 30, 2018 |
|
$ |
427,645 |
All goodwill relates to our geographic divisions reportable segment.
The annual impairment tests during the fourth quarters of fiscal 2018, 2017 and 2016 indicated that the fair value of the Company’s reporting units exceeded their carrying values. The Company identified six reporting units for evaluating goodwill for the fiscal 2018 annual impairment test, which were Central, Midwest, Northeast, Southern, Southeast and Western. Each of these reporting units constitutes a business for which discrete financial information is available and segment management regularly reviews the operating results. The Company evaluates its reporting units on an annual basis.
The Company estimated the fair values of its reporting units based on weighting of a discounted cash flow analysis, a market comparable method and a market transaction approach. These models use significant unobservable inputs, or Level 3 inputs, as defined by the fair value hierarchy. The significant assumptions used in the discounted cash flow method included internal forecasts and projections developed by management for planning purposes, available industry/market data, discount rates and the growth rate to calculate the terminal value. Under the market approach and market transaction approach, the fair value was estimated using the guideline company method. The Company selected guideline companies in the industry in which each reporting unit operates.
Intangible Assets
The following tables present the components of the Company’s definite-lived intangible assets as of April 30, 2018 and 2017:
|
|
|
Estimated |
|
Weighted |
|
April 30, 2018 |
|||||||
|
|
|
Useful |
|
Average |
|
Gross |
|
|
|
Net |
|||
|
|
|
Lives |
|
Amortization |
|
Carrying |
|
Accumulated |
|
Carrying |
|||
|
|
|
(years) |
|
Period |
|
Amount |
|
Amortization |
|
Value |
|||
|
|
|
(dollars in thousands) |
|||||||||||
|
Customer relationships |
|
5 - 13 |
|
10.9 |
|
$ |
282,547 |
|
$ |
150,081 |
|
$ |
132,466 |
|
Definite-lived tradenames |
|
5 - 20 |
|
18.0 |
|
|
26,250 |
|
|
3,578 |
|
|
22,672 |
|
Vendor agreements |
|
8 - 10 |
|
8.3 |
|
|
6,644 |
|
|
2,956 |
|
|
3,688 |
|
Leasehold interests |
|
7 - 15 |
|
9.0 |
|
|
2,866 |
|
|
832 |
|
|
2,034 |
|
Other |
|
5 |
|
5.0 |
|
|
521 |
|
|
66 |
|
|
455 |
|
Totals |
|
|
|
|
|
$ |
318,828 |
|
$ |
157,513 |
|
$ |
161,315 |
73
|
|
|
Estimated |
|
Weighted |
|
April 30, 2017 |
|||||||
|
|
|
Useful |
|
Average |
|
Gross |
|
|
|
Net |
|||
|
|
|
Lives |
|
Amortization |
|
Carrying |
|
Accumulated |
|
Carrying |
|||
|
|
|
(years) |
|
Period |
|
Amount |
|
Amortization |
|
Value |
|||
|
|
|
(dollars in thousands) |
|||||||||||
|
Customer relationships |
|
5 - 13 |
|
10.9 |
|
$ |
273,196 |
|
$ |
111,291 |
|
$ |
161,905 |
|
Definite-lived tradenames |
|
5 - 20 |
|
18.3 |
|
|
25,250 |
|
|
1,718 |
|
|
23,532 |
|
Vendor agreement |
|
8 |
|
8.0 |
|
|
5,644 |
|
|
2,176 |
|
|
3,468 |
|
Leasehold interests |
|
7 - 13 |
|
8.2 |
|
|
2,516 |
|
|
496 |
|
|
2,020 |
|
Totals |
|
|
|
|
|
$ |
306,606 |
|
$ |
115,681 |
|
$ |
190,925 |
Definite-lived intangible assets are amortized over their estimated useful lives. The Company amortizes its customer relationships using an accelerated method to match the estimated cash flow generated by such assets, and amortizes its other definite-lived intangibles using the straight-line method because a pattern to which the expected benefits will be consumed or otherwise used up could not be reliably determined. Amortization expense related to definite-lived intangible assets was $41.5 million, $43.7 million and $37.5 million during the years ended April 30, 2018, 2017 and 2016, respectively, and is recorded in depreciation and amortization expense in the Consolidated Statements of Operations and Comprehensive Income.
Based on the current amount of definite-lived intangible assets, the Company expects to record amortization expense of $34.8 million, $28.0 million, $22.6 million, $18.4 million, $14.2 million and $43.3 million during the years ending April 30, 2019, 2020, 2021, 2022, 2023 and thereafter, respectively. Actual amortization expense to be reported in future periods could differ materially from these estimates as a result of acquisitions, changes in useful lives and other relevant factors.
The Company’s indefinite-lived intangible assets, other than goodwill, consist of tradenames that had a carrying amount of $61.4 million as of April 30, 2018 and 2017.
5. Other Accrued Expenses and Current Liabilities
The Company’s other accrued expenses and current liabilities consisted of the following as of April 30, 2018 and 2017:
|
|
|
April 30, |
||||
|
|
|
2018 |
|
2017 |
||
|
|
|
(in thousands) |
||||
|
Insurance related liabilities |
|
$ |
11,432 |
|
$ |
11,027 |
|
Sales taxes payable |
|
|
9,864 |
|
|
8,920 |
|
Derivative liability |
|
|
5,108 |
|
|
— |
|
Accrued rebates |
|
|
3,640 |
|
|
3,041 |
|
Contingent consideration |
|
|
1,917 |
|
|
5,708 |
|
Real estate and personal property taxes |
|
|
1,823 |
|
|
1,686 |
|
Deferred revenue |
|
|
1,402 |
|
|
573 |
|
Other |
|
|
9,960 |
|
|
6,936 |
|
Total other accrued expenses and current liabilities |
|
$ |
45,146 |
|
$ |
37,891 |
74
6. Long‑Term Debt
The Company’s long‑term debt consisted of the following as of April 30, 2018 and 2017:
|
|
|
April 30, |
|
April 30, |
||
|
|
|
2018 |
|
2017 |
||
|
|
|
(in thousands) |
||||
|
First Lien Term Loan due 2023 (1) (2) |
|
$ |
563,179 |
|
$ |
470,245 |
|
ABL Facility |
|
|
— |
|
|
103,353 |
|
Capital lease obligations, at an annual rate of 5.50%, due in monthly installments through 2023 |
|
|
18,564 |
|
|
15,611 |
|
Installment notes at fixed rates up to 5.0%, due in monthly and annual installments through 2023 (3) |
|
|
14,143 |
|
|
5,711 |
|
Carrying value of debt |
|
|
595,886 |
|
|
594,920 |
|
Less current portion |
|
|
16,284 |
|
|
11,530 |
|
Long-term debt |
|
$ |
579,602 |
|
$ |
583,390 |
|
(1) |
Net of unamortized discount of $2,536 and $1,658 as of April 30, 2018 and 2017, respectively. |
|
(2) |
Net of deferred financing costs of $6,125 and $5,712 as of April 30, 2018 and 2017, respectively. |
|
(3) |
Net of unamortized discount of $1,534 and $751 as of April 30, 2018 and 2017, respectively. |
Term Loan Facilities
On April 1, 2014, the Company’s wholly‑owned subsidiaries, GYP Holdings II Corp., as parent guarantor (in such capacity, “Holdings”), and GYP Holdings III Corp., as borrower (in such capacity, the “Borrower” and, together with Holdings and the Subsidiary Guarantors (as defined below), the “Loan Parties”), entered into a senior secured first lien term loan facility (the “First Lien Facility”) and a senior secured second lien term loan facility (the “Second Lien Facility” and, together with the First Lien Facility, the “Term Loan Facilities”) in the aggregate amount of $550.0 million to acquire Gypsum Management and Supply, Inc.
The Term Loan Facility originally consisted of a First Lien Term Loan and a Second Lien Term Loan (respectively, the “First Term Loan” and “Second Term Loan”). The First Term Loan was issued in an original aggregate principal amount of $388.1 million (net of $2.0 million of original issue discount). The Second Term Loan was issued in an original aggregate principal amount of $158.4 million (net of $1.6 million of original issue discount) and is no longer outstanding. The First Lien Facility permits the Borrower to add one or more incremental term loans up to a fixed amount of $100.0 million plus a certain amount depending on a secured first lien leverage ratio test included in the First Lien Facility. As of April 30, 2018, the First Term Loan amortized in nominal quarterly installments of $1.4 million, or 0.25% of the aggregate principal amount of the First Term Loan and had a maturity date of April 1, 2023. Provided that the individual affected lenders agree accordingly, the maturities of the First Lien Term Loan may, upon the Borrower’s request and without the consent of any other lender, be extended.
On June 1, 2016, the Company used the IPO proceeds together with cash on hand to repay the $160.0 million principal amount of its term loan debt outstanding under our Second Lien Facility, which was a payment in full of the entire loan balance due under the Second Lien Facility. The Company recorded a write-off of debt discount and deferred financing fees of $5.4 million, which is included in write-off of discount and deferred financing fees in the Consolidated Statements of Operations and Comprehensive Income for the year ended April 30, 2017.
On September 27, 2016, the Company entered into an Incremental First Lien Term Commitments Amendment (the “First Amendment”) to the First Lien Credit Agreement, dated April 1, 2014, among GYP Holdings III Corp., as borrower, GYP Holdings II Corp., the financial institutions from time to time party thereto, as lenders, and Credit Suisse AG, as administrative agent and collateral agent. The First Amendment amended the First Lien Credit Agreement to,
75
among other things, provide for a new first lien term loan facility under the First Lien Credit Agreement in the aggregate principal amount of $481.2 million with an interest at a floating rate based on LIBOR, with a 1.00% floor, plus 3.50%, representing a twenty five basis point improvement compared to the interest rate of the existing First Lien Term Loan immediately prior to giving effect to the First Amendment. Net proceeds from the new First Lien Term Loan were used to repay the Company’s existing First Lien Term Loan of $381.2 million and a portion of the loans under the ABL Facility as well as to pay related expenses. The Company recorded a write-off of debt discount and deferred financing fees of $1.5 million, which is included in write-off of discount and deferred financing fees in the Consolidated Statements of Operations and Comprehensive Income for the year ended April 30, 2017.
On June 7, 2017, the Company entered into the Second Amendment to First Lien Credit Agreement (the “Second Amendment”), among the Borrower, Holdings, the other Loan Parties party thereto, Credit Suisse AG, as administrative agent and as 2017 incremental first lien lender, which amended the First Lien Credit Agreement (as amended by the First Amendment and as supplemented from time to time). The Second Amendment provided for a new first lien term loan facility under the First Lien Credit Agreement in the aggregate principal amount of $577.6 million due on April 1, 2023 with interest at a floating rate based on LIBOR, with a 1.00% floor, plus 3.00%, representing a fifty basis point improvement compared to the interest rate of the existing First Lien Facility immediately prior to giving effect to the Second Amendment. As of April 30, 2018, the applicable rate of interest was 5.36%. Net proceeds were used to repay the existing First Lien Loan outstanding balance of $477.6 million and approximately $94.0 million of loans under its asset based revolving credit facility as well as to pay related expenses. The Company recorded a write off of debt discount and deferred financing fees of $0.1 million, which is included in write-off of discount and deferred financing fees in the Consolidated Statements of Operations and Comprehensive Income for the year ended April 30, 2018.
Asset Based Lending Facility
The Company has an Asset Based Lending Credit Facility (the “ABL Facility”) that provides for aggregate revolving commitments of $345.0 million (including same day swing line borrowings of $34.5 million). GYP Holdings III Corp. is the lead borrower (in such capacity, the “Lead Borrower”). Extensions of credit under the ABL Facility are limited by a borrowing base calculated periodically based on specified percentages of the value of eligible inventory and eligible accounts receivable, subject to certain reserves and other adjustments.
At the Company’s option, the interest rates applicable to the loans under the ABL Facility are based at LIBOR or base rate plus, in each case, an applicable margin. The margins applicable for each elected interest rate are subject to a pricing grid, as defined in the ABL Facility agreement, based on average daily availability for the most recent fiscal quarter. The ABL Facility also contains an unused commitment fee subject to utilization, as included in the ABL Facility agreement.
As of April 30, 2018, the Company had available borrowing capacity of $333.7 million under the ABL Facility. The ABL Facility will mature on November 18, 2021 unless the individual affected lenders agree to extend the maturity of their respective loans under the ABL Facility upon the Company's request and without the consent of any other lender. The ABL Facility contains a cross default provision with the First Lien Facility.
Terms of the ABL Facility and Term Loan Facilities
Collateral
The ABL Facility is collateralized by (a) first priority perfected liens on the following assets of the Loan Parties: (i) accounts receivable; (ii) inventory; (iii) deposit accounts; (iv) cash and cash equivalents; (v) tax refunds and tax payments; (vi) chattel paper; and (vii) documents, instruments, general intangibles, securities accounts, books and records, proceeds and supporting obligations related to each of the foregoing, subject to certain exceptions (collectively, “ABL Priority Collateral”) and (b) second priority perfected liens on the remaining assets of the Loan Parties not constituting ABL Priority Collateral, subject to customary exceptions (collectively, “Term Priority Collateral”).
76
The First Lien Facility is collateralized by (a) first priority liens on the Term Priority Collateral and (b) second priority liens on the ABL Priority Collateral, subject to customary exceptions.
Prepayments
The Term Loans may be prepaid at any time. Under certain circumstances and subject to certain exceptions, the Term Loan Facilities will be subject to mandatory prepayments in the amount equal to:
|
· |
100% of the net proceeds of certain asset sales and issuances or incurrences of nonpermitted indebtedness; and |
|
· |
50% of annual excess cash flow for any fiscal year, such percentage to decrease to 25% or 0% depending on the attainment of certain total leverage ratio targets. |
As of April 30, 2018, there was no prepayment required related to excess cash flow.
The ABL Facility may be prepaid at the Company’s option at any time without premium or penalty and will be subject to mandatory prepayment if the outstanding ABL Facility exceeds the lesser of the (i) borrowing base and (ii) the aggregate amount of commitments. Mandatory prepayments do not result in a permanent reduction of the lenders’ commitments under the ABL Facility.
Guarantees
Holdings guarantees the payment obligations under the ABL Facility and the Term Loan Facilities. Certain of Holdings’ subsidiaries (i) guarantee the payment obligations under the Term Loan Facilities (in such capacity, the “Subsidiary Guarantors”) and (ii) are co‑borrowers under the ABL Facility.
Covenants
The ABL Facility contains certain affirmative covenants, including financial and other reporting requirements. The Company was in compliance with all such covenants as of April 30, 2018.
The First Lien Facility contains a number of covenants that limit the Company’s ability and the ability of the Company’s restricted subsidiaries, as described in the First Lien Credit Agreement, to: incur more indebtedness; pay dividends, redeem stock or make other distributions; make investments; create restrictions on the ability of our restricted subsidiaries to pay dividends to us or make other intercompany transfers; create liens securing indebtedness; transfer or sell assets; merge or consolidate; enter into certain transactions with our affiliates; and prepay or amend the terms of certain indebtedness. The Company was in compliance with all covenants as of April 30, 2018.
Events of Default
The ABL Facility and Term Loan Facilities also provide for customary events of default, including non‑payment of principal, interest or fees, violation of covenants, material inaccuracy of representations or warranties, specified cross default to other material indebtedness, certain bankruptcy events, certain ERISA events, material invalidity of guarantees or security interest, material judgments and changes of control.
Installment Notes
The Company’s installment notes of $14.1 million and $5.7 million as of April 30, 2018 and 2017, respectively, include notes for subsidiary stock repurchases from stockholders, notes for the payout of stock appreciation rights and a note to the seller of an acquired company. See Note 11, “Stock Appreciation Rights, Deferred Compensation and Redeemable Noncontrolling Interests.”
77
Debt Maturities
As of April 30, 2018, the maturities of long‑term debt were as follows:
|
|
|
First Lien |
|
|
Installment |
|
|
Capital |
|
|
|
|
|
|
|
Term Loan(1) |
|
|
Notes(2) |
|
|
Leases |
|
Total |
||
|
Years ending April 30, |
|
(in thousands) |
||||||||||
|
2019 |
|
$ |
5,776 |
|
$ |
4,048 |
|
$ |
6,460 |
|
$ |
16,284 |
|
2020 |
|
|
5,776 |
|
|
3,292 |
|
|
5,157 |
|
|
14,225 |
|
2021 |
|
|
5,776 |
|
|
2,989 |
|
|
3,574 |
|
|
12,339 |
|
2022 |
|
|
5,776 |
|
|
2,553 |
|
|
1,747 |
|
|
10,076 |
|
2023 |
|
|
548,736 |
|
|
2,521 |
|
|
1,070 |
|
|
552,327 |
|
Thereafter |
|
|
— |
|
|
274 |
|
|
556 |
|
|
830 |
|
|
|
$ |
571,840 |
|
$ |
15,677 |
|
$ |
18,564 |
|
$ |
606,081 |
(1)Gross of unamortized discount of $2,536 and deferred financing costs of $6,125 as of April 30, 2018.
(2)Gross of unamortized discount of $1,534 as of April 30, 2018.
7. Retirement Plan
The Company maintains a 401(k) defined contribution retirement plan for its employees. Participants are allowed to choose from a selection of mutual funds in order to designate how both employer and employee contributions are invested. Under the plan, the Company matches 50% of each employee’s contributions on the first 4% of the employee’s compensation contributed. The Company contributed $4.3 million, $3.7 million and $1.7 million, during the years ended April 30, 2018, 2017 and 2016, respectively.
8. Income Taxes
The following table presents the components of income tax expense for the years ended April 30, 2018, 2017 and 2016:
|
|
|
Year Ended April 30, |
|||||||
|
|
|
2018 |
|
2017 |
|
2016 |
|||
|
|
|
(in thousands) |
|||||||
|
Current federal |
|
$ |
30,827 |
|
$ |
37,164 |
|
$ |
28,043 |
|
Current state |
|
|
6,409 |
|
|
5,875 |
|
|
5,162 |
|
Total current |
|
|
37,236 |
|
|
43,039 |
|
|
33,205 |
|
Deferred federal |
|
|
(14,796) |
|
|
(19,011) |
|
|
(19,993) |
|
Deferred state |
|
|
(1,557) |
|
|
(1,374) |
|
|
(628) |
|
Total deferred |
|
|
(16,353) |
|
|
(20,385) |
|
|
(20,621) |
|
Total provision for income taxes |
|
$ |
20,883 |
|
$ |
22,654 |
|
$ |
12,584 |
78
The following table summarizes the significant differences between the U.S. federal statutory tax rate and the Company’s effective tax rate for financial statement for the years ended April 30, 2018, 2017 and 2016:
|
|
|
Year Ended April 30, |
|||||||
|
|
|
2018 |
|
2017 |
|
2016 |
|||
|
|
|
(in thousands) |
|||||||
|
Federal income taxes at statutory rate |
|
$ |
25,492 |
|
$ |
25,039 |
|
$ |
8,802 |
|
State income taxes, net of federal income tax benefit |
|
|
1,900 |
|
|
2,236 |
|
|
2,336 |
|
Net change in valuation allowance |
|
|
151 |
|
|
214 |
|
|
(60) |
|
Nondeductible meals & entertainment |
|
|
822 |
|
|
761 |
|
|
627 |
|
338(h)(10) election |
|
|
— |
|
|
(6,936) |
|
|
— |
|
Redeemable noncontrolling interests |
|
|
— |
|
|
1,053 |
|
|
291 |
|
Nondeductible transaction costs |
|
|
2 |
|
|
109 |
|
|
253 |
|
Net Deferred Benefit due to Tax Cuts and Jobs Act |
|
|
(6,763) |
|
|
— |
|
|
— |
|
Other |
|
|
(721) |
|
|
178 |
|
|
335 |
|
Total provision for income taxes |
|
$ |
20,883 |
|
$ |
22,654 |
|
$ |
12,584 |
The tax effects of temporary differences, which give rise to deferred income taxes as of April 30, 2018 and 2017 are as follows:
|
|
|
April 30, |
||||
|
|
|
2018 |
|
2017 |
||
|
Deferred income tax assets: |
|
(in thousands) |
||||
|
Allowances on accounts and notes receivable |
|
$ |
3,540 |
|
$ |
5,792 |
|
Accrued payroll and related costs |
|
|
1,138 |
|
|
1,651 |
|
Insurance reserves |
|
|
1,734 |
|
|
1,139 |
|
Inventory costs |
|
|
2,013 |
|
|
2,430 |
|
Deferred compensation |
|
|
6,662 |
|
|
9,293 |
|
Equity compensation |
|
|
2,361 |
|
|
3,424 |
|
Derivative instrument |
|
|
561 |
|
|
1,488 |
|
Acquisition related costs |
|
|
1,955 |
|
|
1,732 |
|
Net operating loss carry-forwards |
|
|
1,965 |
|
|
2,949 |
|
Deferred rent |
|
|
488 |
|
|
996 |
|
Noncompete agreements |
|
|
681 |
|
|
819 |
|
Other deferred tax assets, net |
|
|
946 |
|
|
2,576 |
|
Total deferred income tax assets |
|
|
24,044 |
|
|
34,289 |
|
Less: Valuation allowance |
|
|
(448) |
|
|
(297) |
|
Total deferred income tax assets, net of valuation allowance |
|
|
23,596 |
|
|
33,992 |
|
Deferred income tax liabilities: |
|
|
|
|
|
|
|
Amortization of intangible assets |
|
|
(28,641) |
|
|
(53,345) |
|
Rebates |
|
|
(253) |
|
|
(1,007) |
|
Depreciation |
|
|
(3,596) |
|
|
(3,808) |
|
Deferred financing costs |
|
|
(1,848) |
|
|
(2,652) |
|
Total deferred income tax liabilities |
|
|
(34,338) |
|
|
(60,812) |
|
Deferred income tax liabilities, net |
|
$ |
(10,742) |
|
$ |
(26,820) |
Tax Cuts and Job Act. On December 22, 2017, the Tax Cuts and Jobs Act of 2017 (the “Tax Act”) was signed into law. The Tax Act includes a number of provisions, including the lowering of the U.S. corporate income tax rate from 35% to 21% effective January 1, 2018. Because the Company’s fiscal 2018 ends April 30, 2018, the Company’s tax provision for the current fiscal year utilized a blended statutory federal rate of 30.4%, calculated by applying a prorated percentage of the number of days prior to and subsequent to the January 1, 2018 effective date of the Tax Act. In future fiscal years, the Company expects its statutory federal rate to be 21%. During the year ended April 30, 2018, the Company revised its estimated annual effective tax rate to reflect the change in the federal statutory rate.
79
In connection with the Tax Act, the SEC issued Staff Accounting Bulletin No. 118 (“SAB 118”) to provide guidance to companies that have not completed their accounting for the income tax effects of the Tax Act. Under SAB 118, provisional amounts can be recorded to the extent a reasonable estimate can be made. Additional tax effects and adjustments to previously recorded provisional amounts can be recorded upon obtaining, preparing, or analyzing additional information (including computations) within one year from the enactment date of the Tax Act.
As of April 30, 2018, the Company was still assessing the overall impact of the Tax Act on its financial statements and had not completed its accounting for the tax effects of the Tax Act. The Company has reported provisional amounts reflecting reasonable estimates for the re-measurement of net deferred tax liabilities as of April 30, 2018 due to the reduction in the corporate rate. The Company recorded a provisional income tax benefit of $6.7 million for this re-measurement for the year ended April 30, 2018, which is included in provision for income taxes in the Consolidated Statements of Operations and Comprehensive Income. This represents a $1.1 million decrease from the provisional amount recorded during the nine months ended January 31, 2018.
The estimated impact of the Tax Act was based on a preliminary review of the new law and is subject to revision due to, among other things, changes in interpretations of the Tax Act, any legislative action to address questions that arise because of the Tax Act or any updates or changes to estimates the Company has utilized to calculate the impacts. Additionally, the Company continues to analyze additional information and guidance related to certain aspects of the Tax Act, such as limitations on the deductibility of executive compensation, conformity or changes by state taxing authorities in response to The Act, and the deductibility of other expenses impacted by the Tax Act. The Company will complete its accounting for the Tax Act in the period in which the Company has obtained, prepared and analyzed all information needed (including computations) for its analysis, but no later than one year from the enactment date of the Tax Act. All items related to the Tax Act remain provisional as of April 30, 2018.
Effective tax rate. Income taxes for financial reporting purposes differ from the amount computed by applying the statutory federal rate primarily due to the effect of state income taxes, net of federal benefit, permanent differences, the change in the valuation allowance related to certain state net operating losses, and re-measurement of net deferred tax liabilities. In fiscal 2017, the Company made an election under Section 338 (h)(10) of the Internal Revenue Code which effectively changed the tax treatment of the Company’s acquisition of Gypsum Supply Company from a stock transaction to an asset transaction for tax purposes. As a result of this election, the Company decreased its deferred tax liabilities and tax expense by $6.9 million.
NOLs. During recent tax years, the Company generated certain state net operating loss carry‑forwards which are available for use against taxable income in each respective state. The Company had gross state net operating losses available for carry‑forward of $20.4 million and $21.1 million in fiscal 2018 and 2017, respectively, which expire through the fiscal year ending in 2038.
Valuation allowance. Deferred tax assets and liabilities are computed by applying the federal and state income tax rates in effect to the gross amounts of temporary differences and other tax attributes, such as net operating loss carry‑forwards. In assessing if the deferred tax assets will be realized, the Company considers whether it is more likely than not that some or all of these deferred tax assets will be realized. The ultimate realization of deferred tax assets is dependent upon the generation of future taxable income during the period in which these deductible temporary differences reverse. As of April 30, 2018, except as noted in the following paragraph, the Company believes that it is more likely than not that all of its deferred tax assets relating to separate company state return filings will be realized. The tax credits, carryforwards and net operating losses expire from 2019 to 2038.
Management makes an assessment to determine if its deferred tax assets are more likely than not to be realized. Valuation allowances are established in the event that management believes that it is more likely than not the related tax benefits will not be realized. The valuation allowance as of April 30, 2018 and 2017 was $0.4 million and $0.3 million, respectively, and primarily relates to state net operating loss carry forwards. During fiscal 2018, the valuation allowance increased by $0.1 million due to additional NOL carryforwards.
Uncertain tax positions. The Company recognizes the effect of income tax positions only if those positions are more likely than not to be sustained. The Company’s policy for recording penalties and interest associated with uncertain
80
tax positions is to record such items as a component of selling, general and administrative expense. The Company had no reserve for uncertain tax positions as of April 30, 2018 and 2017.
As of April 30, 2018, the tax years ended April 30, 2018, 2017, 2016 and 2015 remain subject to examination by the U.S. Internal Revenue Service. In states in which the Company conducts business, the statute of limitation periods for examination generally vary from three to four years. Net operating losses dating back to 2007 are still being carried forward and remain subject to examination by the taxing authorities. The Company regularly assesses the potential outcomes of future examinations to ensure the Company’s provision for income taxes is sufficient. The Company recognizes liabilities based on estimates of whether additional taxes will be due and believes that no liability for uncertain tax position is necessary as of April 30, 2018 and 2017.
9. Stockholders’ Equity
During the year ended April 30, 2016, the Company repurchased 0.4 million shares of its common stock at a cost of $5.8 million in connection with its separation agreement with a former employee. The Company then reissued these shares for proceeds of $4.9 million. The difference between the cost of the treasury stock and the proceeds from its reissuance was accounted for using the “cost” method as an increase to retained earnings of $1.0 million. The Company did not have any treasury stock activity during the years ended April 30, 2018 or 2017.
10. Equity‑Based Compensation
General
The Company has granted options to purchase the Company’s common stock under its 2014 GYP Holdings I Corp. Stock Option Plan. The stock options granted under this plan vest over a four-year period and have a 10-year term. In October 2017, the shareholders of the Company approved the GMS Inc. Equity Incentive Plan (the “Equity Incentive Plan”). Grants subsequent to October 2017 will be made from the Equity Incentive Plan. The Equity Incentive Plan is administered by a committee of the Board of Directors, which determines the terms of the awards granted. Under the Equity Incentive Plan, the committee may grant various forms of equity-based incentive compensation, including stock options, stock appreciation rights, restricted stock, restricted stock units and performance awards, among others. The Company’s Equity Incentive Plan provides for the issuance of a maximum of 2.5 million shares, of which approximately 2.4 million shares were still available for grant as of April 30, 2018. The Company intends to use authorized and unissued shares to satisfy share award exercises.
Share-based compensation expense related to stock options and restricted stock units was $1.7 million, $2.4 million and $2.7 million during the years ended April 30, 2018, 2017 and 2016, respectively, and is included in selling, general and administrative expenses in the Consolidated Statements of Operations and Comprehensive Income.
81
Stock Option Awards
The following table presents stock option activity as of and for the year ended April 30, 2018:
|
|
|
|
|
|
|
|
Weighted |
|
|
|
|
|
|
|
|
Weighted |
|
Average |
|
|
|
|
|
|
|
|
|
Average |
|
Remaining |
|
Aggregate |
||
|
|
|
Number of |
|
Exercise |
|
Contractual |
|
Intrinsic |
||
|
|
|
Options |
|
Price |
|
Life (years) |
|
Value |
||
|
|
|
(shares and dollars in thousands) |
||||||||
|
Outstanding as of April 30, 2017 |
|
2,088 |
|
$ |
13.49 |
|
7.23 |
|
$ |
47,336 |
|
Options granted |
|
63 |
|
|
37.49 |
|
|
|
|
|
|
Options exercised |
|
(199) |
|
|
12.53 |
|
|
|
|
|
|
Options forfeited |
|
— |
|
|
— |
|
|
|
|
|
|
Options expired |
|
— |
|
|
— |
|
|
|
|
|
|
Outstanding as of April 30, 2018 |
|
1,952 |
|
$ |
14.37 |
|
6.52 |
|
$ |
33,209 |
|
Exercisable as of April 30, 2018 |
|
1,682 |
|
$ |
12.97 |
|
6.31 |
|
$ |
30,599 |
|
Vested and expected to vest as of April 30, 2018 |
|
1,946 |
|
$ |
14.33 |
|
6.52 |
|
$ |
33,173 |
The aggregate intrinsic value represents the value of the Company’s closing stock price on the last trading day of the period in excess of the weighted average exercise price multiplied by the number of options outstanding, exercisable or expected to vest. Options expected to vest are unvested shares net of expected forfeitures. The total intrinsic value of options exercised during the years ended April 30, 2018, 2017 and 2016 was $4.3 million, $0.6 million and $8.9 million, respectively. As of April 30, 2018, there was $1.1 million of total unrecognized compensation cost related to stock options. That cost is expected to be recognized over a weighted-average period of 2.1 years.
There were no stock options granted during the year ended April 30, 2016. The fair value of stock options granted during the years ended April 30, 2018 and 2017 was estimated using the Black-Scholes option-pricing model with the following assumptions:
|
|
|
Year Ended |
||||
|
|
|
April 30, |
||||
|
|
|
2018 |
|
2017 |
||
|
Volatility |
|
30.86 |
% |
|
40.68 |
% |
|
Expected life (years) |
|
6.0 |
|
|
6.0 |
|
|
Risk-free interest rate |
|
2.18 |
% |
|
1.55 |
% |
|
Dividend yield |
|
— |
% |
|
— |
% |
The weighted average grant date fair value of options granted during the years ended April 30, 2018 and 2017 was $12.81 per share and $9.68 per share, respectively. The expected volatility was based on the average volatility of peer public entities that are similar in size and industry since prior to our IPO discussed in Note 1, “—Initial and Secondary Public Offerings,” we did not have sufficient history to estimate the expected volatility of our common stock price. The expected life of stock options was based on previous history of exercises. The risk‑free rate was based on the U.S. Treasury yield curve in effect at the time of grant for the expected term of the stock option. The expected dividend yield was 0% as we have not declared any common stock dividends to date and do not expect to declare common stock dividends in the near future. The fair value of the underlying common stock at the date of grant was determined based on the value of the Company’s closing stock price on the trading day immediately preceding the date of the grant.
Restricted Stock Units
During the year ended April 30, 2018, the Company granted 21,766 restricted stock units to employees pursuant to its Equity Incentive Plan. All of these awards were outstanding as of April 30, 2018. The restricted stock units vest ratably over three years and have a fair value of $37.49 per unit. The Company did not grant any restricted stock units during the years ended April 30, 2017 or 2016. As of April 30, 2018, there was $0.7 million of total unrecognized compensation cost related to nonvested restricted stock units. That cost is expected to be recognized over a weighted-average period of 2.6 years.
82
11. Stock Appreciation Rights, Deferred Compensation and Redeemable Noncontrolling Interests
The following table presents a summary of changes to the liabilities for stock appreciation rights, deferred compensation and redeemable noncontrolling interests for the years ended April 30, 2018 and 2017:
|
|
|
Stock |
|
|
|
|
|
||
|
|
|
Appreciation |
|
Deferred |
|
Noncontrolling |
|||
|
|
|
Rights |
|
Compensation |
|
Interests |
|||
|
|
|
(in thousands) |
|||||||
|
Balance as of April 30, 2016 |
|
$ |
20,533 |
|
$ |
3,270 |
|
$ |
26,585 |
|
Redemption notes |
|
|
(28) |
|
|
— |
|
|
(5,354) |
|
Change in fair value |
|
|
157 |
|
|
480 |
|
|
3,078 |
|
Balance as of April 30, 2017 |
|
|
20,662 |
|
|
3,750 |
|
|
24,309 |
|
Amounts redeemed |
|
|
(1,036) |
|
|
(1,733) |
|
|
(9,664) |
|
Change in fair value |
|
|
2,318 |
|
|
205 |
|
|
1,525 |
|
Balance as of April 30, 2018 |
|
$ |
21,944 |
|
$ |
2,222 |
|
$ |
16,170 |
|
|
|
|
|
|
|
|
|
|
|
|
Classified as current as of April 30, 2017 |
|
$ |
878 |
|
$ |
300 |
|
$ |
1,733 |
|
Classified as long-term as of April 30, 2017 |
|
|
19,784 |
|
|
3,450 |
|
|
22,576 |
|
|
|
|
|
|
|
|
|
|
|
|
Classified as current as of April 30, 2018 |
|
|
308 |
|
|
133 |
|
|
463 |
|
Classified as long-term as of April 30, 2018 |
|
|
21,636 |
|
|
2,089 |
|
|
15,707 |
Total expense related to these instruments was $4.0 million, $3.7 million and $2.9 million during the years ended April 30, 2018, 2017 and 2016, respectively, and was included in selling, general and administrative expenses in the Consolidated Statements of Operations and Comprehensive Income. During the year ended April 30, 2016, the Company recorded a $11.2 million increase to accumulated deficit, a $0.2 million decrease to accumulated deficit and a $3.7 million decrease to accumulated deficit in the Consolidated Balance Sheets for the stock appreciation rights, deferred compensation and redeemable noncontrolling interests, respectively, as a result of the change in value due to the transition guidance for share-based compensation.
Stock Appreciation Rights
Certain subsidiaries have granted stock appreciation rights to certain employees under which payments are dependent on the appreciation in the book value per share, adjusted for certain provisions, of the applicable subsidiary. Settlements of the awards can be made in a combination of cash or installment notes, generally paid over four years, upon a triggering event. As of April 30, 2018, all stock appreciation rights were vested.
Deferred Compensation
Subsidiaries’ stockholders have entered into other deferred compensation agreements that granted the stockholders a payment based on a percentage in excess of book value, adjusted for certain provisions, upon an occurrence as defined in the related agreements, which are called “Buy Sell” agreements. These instruments are redeemed in cash or installment notes, generally paid in annual installments generally over the five years following termination of employment.
Redeemable Noncontrolling Interests
Noncontrolling interests were issued to certain employees of the subsidiaries. All of the noncontrolling interest awards are subject to mandatory redemption on termination of employment for any reason. These instruments are redeemed in cash or installment notes, generally paid in annual installments over the five years following termination of employment. Liabilities related to these agreements are classified as share-based liability awards and are measured at intrinsic value. Intrinsic value is determined to be the stated redemption value of the shares. Under the terms of the
83
employee agreements, the redemption value is determined based on the book value of the subsidiary, as adjusted for certain items.
Upon the termination of employment or other triggering events including death or disability of the noncontrolling stockholders in the Company’s subsidiaries, we are obligated to purchase, or redeem, the noncontrolling interests at either an agreed upon price or a formula value provided in the stockholder agreements. This formula value is typically based on the book value per share of the subsidiary’s equity, including certain adjustments.
12. Fair Value Measurements
Assets and Liabilities Measured at Fair Value on a Recurring Basis
The following table presents the estimated carrying amount and fair value of the Company’s assets and liabilities measured at fair value on a recurring basis as of April 30, 2018 and 2017:
|
|
|
April 30, |
|
April 30, |
||
|
|
|
2018 |
|
2017 |
||
|
|
|
(in thousands) |
||||
|
Assets: |
|
|
|
|
|
|
|
Interest rate cap (Level 2) |
|
$ |
543 |
|
$ |
88 |
|
|
|
|
|
|
|
|
|
Liabilities: |
|
|
|
|
|
|
|
Forward currency forward (Level 2) |
|
$ |
5,108 |
|
$ |
— |
|
Stock appreciation rights (Level 3) |
|
|
21,944 |
|
|
20,662 |
|
Deferred Compensation (Level 3) |
|
|
2,222 |
|
|
3,750 |
|
Noncontrolling interest holders (Level 3) |
|
|
16,170 |
|
|
24,309 |
Derivative instruments. The fair value of derivative instruments is determined using Level 2 inputs. Generally, the Company obtains the Level 2 inputs from its counterparties. Substantially all of the inputs are observable in the marketplace throughout the full term of the instruments, which can be derived from observable data or are supported by observable levels at which transactions are executed in the marketplace. The fair value of the Company’s interest rate cap is determined using widely accepted valuation techniques including a discounted cash flow analysis on the expected cash flows of the derivative. This analysis reflected the contractual terms of the derivatives, including the period to maturity, and used observable market‑based inputs, including interest rate curves and implied volatilities. The fair value of the Company’s forward currency forward contract is based on observable market inputs, such as forward rates in active markets.
Stock appreciation rights, deferred compensation and redeemable noncontrolling interests. The fair values of stock appreciation rights, deferred compensation and redeemable noncontrolling interests are determined using Level 3 inputs. These inputs include a volatility rate based on comparable entities, a discount rate, the expected time to redemption of the liabilities, historical values of the book equity of certain subsidiaries and market information for comparable entities. The use of these inputs to derive the fair value of the liabilities at a point in time can result in volatility to the financial statements. See Note 11, “Stock Appreciation Rights, Deferred Compensation and Redeemable Noncontrolling Interests,” for a reconciliation of the beginning and ending balances.
Assets and Liabilities Measured at Fair Value on a Nonrecurring Basis
Disclosures are required for certain assets and liabilities that are measured at fair value on a nonrecurring basis in periods subsequent to initial recognition. Such measurements of fair value relate primarily to assets and liabilities measured at fair value in connection with business combinations and long-lived asset impairments. For more information on business combinations, see Note 2, “Business Acquisitions.” There were no material long-lived asset impairments during the years ended April 30, 2018, 2017 or 2016.
84
13. Transactions With Related Parties
The Company leases warehouse facilities from partnerships owned by certain stockholders of GMS Inc. and its subsidiaries. As of April 30, 2018, these leases had expiration dates through fiscal 2025. Rent expense related to these leases was $0.8 million, $0.8 million and $0.6 million during the years ended April 30, 2018, 2017 and 2016, respectively, and are included in selling, general and administrative expenses in the Consolidated Statements of Operations and Comprehensive Income. As of April 30, 2018, future minimum payments under the terms of the leases aggregated to $2.0 million.
The Company purchases inventories from Southern Wall Products, Inc. (“SWP”) on a continuing basis. Certain stockholders of the Company are stockholders of SWP. The Company purchased inventory from SWP for distribution in the amount of $14.0 million $13.0 million and $12.8 million during the years ended April 30, 2018, 2017 and 2016, respectively. Amounts due to SWP for purchases of inventory for distribution as of April 30, 2018 and 2017 were $1.2 million and $1.1 million, respectively, and are included in accounts payable in the Consolidated Balance Sheets.
In connection with the IPO, the Company terminated its management agreement with AEA. The agreement required the Company to pay AEA an annual management fee of $2.3 million per year following the Acquisition for advisory and consulting services. The fee was payable in quarterly installments of $0.6 million in advance of the upcoming calendar quarter on the first day, and is included in selling, general and administrative expenses in the Consolidated Statements of Operations and Comprehensive Income.
14. Commitments and Contingencies
Lease Commitments
The Company is obligated under certain capital leases covering its fleet of vehicles as well as one facility. The fleet vehicle leases have terms ranging from one to six years and the facility lease has a term of eleven years. The carrying value of property and equipment under capital leases was $17.9 million and $15.0 million as of April 30, 2018 and 2017, respectively, net of accumulated depreciation of $10.3 million and $8.3 million, respectively.
The Company also has certain noncancelable operating lease agreements, primarily office and warehouse facilities and equipment. These leases generally contain renewal options for periods ranging from one to five years. Rent expense for operating leases, which may have escalating rents over the terms of the leases, is recorded on a straight‑line basis over the minimum lease terms. Rent expense under operating leases, including amounts paid to affiliated partnerships, approximated $63.9 million, $56.2 million and $41.7 million during the years ended April 30, 2018, 2017 and 2016, respectively. As existing leases expire, the Company anticipates such leases will be renewed or replaced with other leases that are substantially similar in terms and rental amounts which are consistent with market rates at the time of renewal.
85
As of April 30, 2018, the approximate amounts of the annual future minimum lease payments under noncancelable operating leases, including amounts payable to affiliated partnerships, and future maturities of capital lease obligations are as follows (in thousands):
|
|
|
Capital |
|
Operating |
||
|
Year Ended April 30, |
|
|
|
|
|
|
|
2019 |
|
$ |
7,289 |
|
$ |
59,529 |
|
2020 |
|
|
5,665 |
|
|
52,815 |
|
2021 |
|
|
3,882 |
|
|
43,120 |
|
2022 |
|
|
1,937 |
|
|
29,299 |
|
2023 |
|
|
1,147 |
|
|
17,820 |
|
Thereafter |
|
|
571 |
|
|
13,601 |
|
|
|
$ |
20,491 |
|
$ |
216,184 |
|
Less: Interest |
|
|
1,927 |
|
|
|
|
Capitalized lease obligations |
|
$ |
18,564 |
|
|
|
Litigation, Claims and Assessment
The Company is a defendant in various lawsuits and administrative actions associated with personal injuries, claims of former employees, and other events arising in the normal course of business. As discussed in Note 1, “—Insurance Liabilities”, the Company records liabilities for these claims, as well as assets for amounts recoverable from the insurer, for these claims covered by insurance.
15. Segments
General
The Company has six operating segments based on geographic operations that it aggregates into one reportable segment. The Company defines operating segments as components of the organization for which discrete financial information is available and operating results are evaluated on a regular basis by the Chief Operating Decision Maker (“CODM”) in order to assess performance and allocate resources. The Company’s CODM is its Chief Executive Officer. The Company determined it has six operating segments based on the Company’s six geographic divisions, which are Central, Midwest, Northeast, Southern, Southeast and Western. On May 1, 2017, the Company combined the Southern and Southwest into the Southern operating segment, which resulted in a reduction (from seven to six) in the number of operating segments. The Company aggregates its operating segments into a single reportable segment based on similarities between the operating segments’ economic characteristics, nature of products sold, production process, type of customer and methods of distribution. The accounting policies of the operating segments are the same as those described in the summary of significant policies. In addition to the Company’s reportable segment, the Company’s consolidated results include both corporate activities and certain other activities. Corporate includes the Company’s corporate office building and support services provided to its subsidiaries. Other includes Tool Source Warehouse, Inc., which functions primarily as an internal distributor of tools. As of April 30, 2018, the Company did not earn revenues or have long‑lived assets located in foreign countries.
Segment Results
The CODM assesses the Company’s performance based on the periodic review of net sales, Adjusted EBITDA and certain other measures for each of the operating segments. Adjusted EBITDA is not a recognized financial measure under GAAP. However, we believe it assists investors and analysts in comparing our operating performance across reporting periods on a consistent basis by excluding items that we do not believe are indicative of our core operating performance. Management believes Adjusted EBITDA is helpful in highlighting trends in our operating results, while other measures can differ significantly depending on long‑term strategic decisions regarding capital structure, the tax jurisdictions in which companies operate and capital investments.
In addition, we utilize Adjusted EBITDA in certain calculations under the ABL Facility and the First Lien
86
Facility. The ABL Facility and the First Lien Facility permit us to make certain additional adjustments in calculating Consolidated EBITDA, such as projected net cost savings, which are not reflected in the Adjusted EBITDA data presented in this Annual Report on Form 10‑K.
The following tables present segment results for the years ended April 30, 2018, 2017 and 2016:
|
|
|
Year Ended April 30, 2018 |
|
April 30, 2018 |
|||||||||||
|
|
|
|
|
|
|
|
|
Depreciation and |
|
|
Adjusted |
|
Total |
||
|
|
|
Net Sales |
|
Gross Profit |
|
Amortization |
|
|
EBITDA |
|
Assets |
||||
|
|
|
(in thousands) |
|||||||||||||
|
Geographic divisions |
|
$ |
2,487,557 |
|
$ |
809,884 |
|
$ |
64,491 |
|
$ |
196,903 |
|
$ |
1,434,371 |
|
Other |
|
|
23,912 |
|
|
8,692 |
|
|
242 |
|
|
2,355 |
|
|
12,854 |
|
Corporate |
|
|
— |
|
|
— |
|
|
797 |
|
|
— |
|
|
7,286 |
|
|
|
$ |
2,511,469 |
|
$ |
818,576 |
|
$ |
65,530 |
|
$ |
199,258 |
|
$ |
1,454,511 |
|
|
|
Year Ended April 30, 2017 |
|
April 30, 2017 |
|||||||||||
|
|
|
|
|
|
|
|
|
Depreciation and |
|
|
Adjusted |
|
Total |
||
|
|
|
Net Sales |
|
Gross Profit |
|
Amortization |
|
|
EBITDA |
|
Assets |
||||
|
|
|
(in thousands) |
|||||||||||||
|
Geographic divisions |
|
$ |
2,298,871 |
|
$ |
750,564 |
|
$ |
68,001 |
|
$ |
186,155 |
|
$ |
1,376,655 |
|
Other |
|
|
20,275 |
|
|
8,007 |
|
|
310 |
|
|
2,074 |
|
|
11,916 |
|
Corporate |
|
|
— |
|
|
— |
|
|
929 |
|
|
— |
|
|
4,694 |
|
|
|
$ |
2,319,146 |
|
$ |
758,571 |
|
$ |
69,240 |
|
$ |
188,229 |
|
$ |
1,393,265 |
|
|
|
Year Ended April 30, 2016 |
|
April 30, 2016 |
|||||||||||
|
|
|
|
|
|
|
|
|
Depreciation and |
|
|
Adjusted |
|
Total |
||
|
|
|
Net Sales |
|
Gross Profit |
|
Amortization |
|
|
EBITDA |
|
Assets |
||||
|
|
|
(in thousands) |
|||||||||||||
|
Geographic divisions |
|
$ |
1,842,634 |
|
$ |
587,213 |
|
$ |
63,093 |
|
$ |
137,459 |
|
$ |
1,217,871 |
|
Other |
|
|
15,548 |
|
|
5,951 |
|
|
295 |
|
|
724 |
|
|
12,310 |
|
Corporate |
|
|
— |
|
|
— |
|
|
827 |
|
|
— |
|
|
10,633 |
|
|
|
$ |
1,858,182 |
|
$ |
593,164 |
|
$ |
64,215 |
|
$ |
138,183 |
|
$ |
1,240,814 |
87
The following table presents a reconciliation of net income to Adjusted EBITDA for the years ended April 30, 2018, 2017 and 2016:
|
|
|
Year Ended April 30, |
|||||||
|
|
|
2018 |
|
2017 |
|
2016 |
|||
|
|
|
(in thousands) |
|||||||
|
Net income |
|
$ |
62,971 |
|
$ |
48,886 |
|
$ |
12,564 |
|
Interest expense |
|
|
31,395 |
|
|
29,360 |
|
|
37,418 |
|
Write-off of debt discount and deferred financing fees |
|
|
74 |
|
|
7,103 |
|
|
— |
|
Interest income |
|
|
(177) |
|
|
(152) |
|
|
(928) |
|
Income tax expense |
|
|
20,883 |
|
|
22,654 |
|
|
12,584 |
|
Depreciation expense |
|
|
24,075 |
|
|
25,565 |
|
|
26,667 |
|
Amortization expense |
|
|
41,455 |
|
|
43,675 |
|
|
37,548 |
|
Stock appreciation expense(a) |
|
|
2,318 |
|
|
148 |
|
|
1,988 |
|
Redeemable noncontrolling interests(b) |
|
|
1,868 |
|
|
3,536 |
|
|
880 |
|
Equity-based compensation(c) |
|
|
1,695 |
|
|
2,534 |
|
|
2,699 |
|
Severance and other permitted costs(d) |
|
|
581 |
|
|
(157) |
|
|
379 |
|
Transaction costs (acquisitions and other)(e) |
|
|
3,370 |
|
|
2,249 |
|
|
3,751 |
|
Gain on sale of assets |
|
|
(509) |
|
|
(338) |
|
|
(645) |
|
Management fee to related party(f) |
|
|
— |
|
|
188 |
|
|
2,250 |
|
Effects of fair value adjustments to inventory(g) |
|
|
324 |
|
|
946 |
|
|
1,009 |
|
Change in fair value of financial instruments(h) |
|
|
6,125 |
|
|
382 |
|
|
19 |
|
Secondary public offering costs(i) |
|
|
1,525 |
|
|
1,385 |
|
|
— |
|
Debt transaction costs(j) |
|
|
1,285 |
|
|
265 |
|
|
— |
|
Adjusted EBITDA |
|
$ |
199,258 |
|
$ |
188,229 |
|
$ |
138,183 |
|
(a) |
Represents non‑cash expense related to stock appreciation rights agreements. |
|
(b) |
Represents non‑cash compensation expense related to changes in the redemption values of noncontrolling interests. |
|
(c) |
Represents non‑cash equity‑based compensation expense related to the issuance of share-based awards. |
|
(d) |
Represents severance expenses and other costs permitted in calculations under the ABL Facility and the First Lien Facility. |
|
(e) |
Represents one‑time costs related to our IPO and acquisitions paid to third party advisors. |
|
(f) |
Represents management fees paid by us to AEA. Following our IPO, AEA no longer receives management fees from us. |
|
(g) |
Represents the non‑cash cost of sales impact of purchase accounting adjustments to increase inventory to its estimated fair value. |
|
(h) |
Represents the mark‑to‑market adjustments for derivative financial instruments. |
|
(i) |
Represents one-time costs related to our secondary offering paid to third-party advisors. |
|
(j) |
Represents expenses paid to third party advisors related to debt refinancing activities. |
88
Revenues by Product
The following table presents Company’s net sales to external customers by main product lines for the years ended April 30, 2018, 2017 and 2016:
|
|
|
Year Ended April 30, |
|||||||
|
|
|
2018 |
|
2017 |
|
2016 |
|||
|
|
|
(in thousands) |
|||||||
|
Wallboard |
|
$ |
1,109,552 |
|
$ |
1,058,400 |
|
$ |
870,952 |
|
Ceilings |
|
|
387,360 |
|
|
341,007 |
|
|
297,110 |
|
Steel framing |
|
|
411,630 |
|
|
374,151 |
|
|
281,340 |
|
Other products |
|
|
602,927 |
|
|
545,588 |
|
|
408,780 |
|
Total net sales |
|
$ |
2,511,469 |
|
$ |
2,319,146 |
|
$ |
1,858,182 |
16. Accumulated Other Comprehensive (Loss) Income
The following table sets forth the changes to accumulated other comprehensive (loss) income, net of tax, by component for the years ended April 30, 2018, 2017 and 2016:
|
|
|
Gain (Loss) On |
|
|
|
|
Interest Rate Cap |
|
|
|
|
(in thousands) |
|
|
Accumulated other comprehensive income as of April 30, 2015 |
|
$ |
10 |
|
Other comprehensive loss before reclassification |
|
|
(1,177) |
|
Reclassification to earnings from accumulated other comprehensive (loss) income(1) |
|
|
19 |
|
Accumulated other comprehensive loss as of April 30, 2016 |
|
|
(1,148) |
|
Other comprehensive loss before reclassification |
|
|
(118) |
|
Reclassification to earnings from accumulated other comprehensive (loss) income(1) |
|
|
382 |
|
Accumulated other comprehensive loss as of April 30, 2017 |
|
|
(884) |
|
Other comprehensive gain before reclassification |
|
|
309 |
|
Reclassification to earnings from accumulated other comprehensive (loss) income(1) |
|
|
1,016 |
|
Accumulated other comprehensive income as of April 30, 2018 |
|
$ |
441 |
|
(1) |
Amounts are recorded as a component of change in other comprehensive income in the Consolidated Statements of Operations. |
(Decrease) increase in fair value of financial instruments, net of tax, recorded in accumulated other comprehensive income (loss) is reclassified to earnings as each of the hedged forecasted transactions occur. During the next twelve months, the Company expects to reclassify approximately $0.7 million, net of tax, to earnings.
89
17. Earnings Per Common Share
The following table sets forth the computation of basic and diluted earnings per share of common stock for the years ended April 30, 2018, 2017 and 2016:
|
|
|
Year Ended April 30, |
|||||||
|
|
|
2018 |
|
2017 |
|
2016 |
|||
|
|
|
(in thousands, except per share data) |
|||||||
|
Net income |
|
$ |
62,971 |
|
$ |
48,886 |
|
$ |
12,564 |
|
Basic earnings per common share: |
|
|
|
|
|
|
|
|
|
|
Basic weighted average common shares outstanding |
|
|
41,015 |
|
|
40,260 |
|
|
32,799 |
|
Basic earnings per common share |
|
$ |
1.54 |
|
$ |
1.21 |
|
$ |
0.38 |
|
Diluted earnings per common share: |
|
|
|
|
|
|
|
|
|
|
Basic weighted average common shares outstanding |
|
|
41,015 |
|
|
40,260 |
|
|
32,799 |
|
Add: Common Stock Equivalents |
|
|
1,148 |
|
|
810 |
|
|
326 |
|
Diluted weighted average common shares outstanding |
|
|
42,163 |
|
|
41,070 |
|
|
33,125 |
|
Diluted earnings per common share |
|
$ |
1.49 |
|
$ |
1.19 |
|
$ |
0.38 |
18. Condensed Parent Company Financial Information
On a standalone basis, the Company has no material assets or operations other than its ownership in GYP Holdings II Corp., which in turn has no material assets or operations other than its ownership in GYP Holdings III Corp. GYP Holdings III Corp. is the Lead Borrower under the ABL Facility and the Borrower under the Term Loan Facilities, all of which contain significant restrictions on the Company’s ability to obtain funds from GYP Holdings III Corp. or any of GYP Holdings III Corp.’s subsidiaries through dividends, loans or advances. Accordingly, the following condensed financial information has been presented on a “Parent‑only” basis.
Under a “Parent‑only” presentation, the Company’s investments in its consolidated subsidiaries are presented under the equity method of accounting using the same accounting principles and policies described in the notes to the Consolidated Financial Statements.
The following tables present the Parent Company’s financial position as of April 30, 2018 and 2017 and results of operations during the years ended April 30, 2018, 2017 and 2016:
GMS Inc.
Condensed Parent Company Balance Sheets
|
|
|
April 30, |
||||
|
|
|
2018 |
|
2017 |
||
|
|
|
(in thousands) |
||||
|
Investment in subsidiary |
|
$ |
579,451 |
|
$ |
514,606 |
|
Total assets |
|
|
579,451 |
|
|
514,606 |
|
Stockholders’ equity: |
|
|
|
|
|
|
|
Common stock, $0.01 par value, authorized 500,000 shares; 41,069 and 40,971 shares issued and outstanding as of April 30, 2018 and 2017, respectively |
|
|
411 |
|
|
410 |
|
Additional paid-in capital |
|
|
489,007 |
|
|
488,459 |
|
Accumulated deficit |
|
|
89,592 |
|
|
26,621 |
|
Accumulated other comprehensive income |
|
|
441 |
|
|
(884) |
|
Total stockholders’ equity |
|
$ |
579,451 |
|
$ |
514,606 |
90
GMS Inc.
Condensed Parent Company Statements of Operations and Comprehensive Income
|
|
|
Year Ended April 30, |
|||||||
|
|
|
2018 |
|
2017 |
|
2016 |
|||
|
|
|
(in thousands) |
|||||||
|
Net income in subsidiaries |
|
$ |
62,971 |
|
$ |
48,886 |
|
$ |
12,564 |
|
Net income |
|
|
62,971 |
|
|
48,886 |
|
|
12,564 |
|
Comprehensive income |
|
|
64,296 |
|
|
49,150 |
|
|
11,406 |
|
Weighted average shares outstanding: |
|
|
|
|
|
|
|
|
|
|
Basic |
|
|
41,015 |
|
|
40,260 |
|
|
32,799 |
|
Diluted |
|
|
42,163 |
|
|
41,070 |
|
|
33,125 |
|
Net income per share |
|
|
|
|
|
|
|
|
|
|
Basic |
|
$ |
1.54 |
|
$ |
1.21 |
|
$ |
0.38 |
|
Diluted |
|
$ |
1.49 |
|
$ |
1.19 |
|
$ |
0.38 |
There were no cash flows for GMS Inc. during the years ended April 30, 2018, 2017 and 2016 as there were no dividends, loans or advances between GMS Inc. and its subsidiaries.
As of April 30, 2018, restricted net assets of the Company’s consolidated subsidiaries was $578.0 million. During the years ended April 30, 2018, 2017 and 2016, the Company’s consolidated subsidiaries did not pay any cash dividends to the Company.
19. Valuation and Qualifying Accounts
Allowance for Doubtful Accounts Rollforward
|
|
|
Balance |
|
|
|
|
Charged to |
|
|
|
|
Balance |
|||
|
|
|
at Beginning |
|
|
|
|
Other |
|
|
|
|
at End of |
|||
|
|
|
of Period |
|
Provision |
|
Accounts(a) |
|
Deductions |
|
Period |
|||||
|
|
|
(in thousands) |
|||||||||||||
|
Fiscal Year Ended April 30, 2018 |
|
$ |
(9,851) |
|
$ |
(366) |
|
$ |
(596) |
|
$ |
1,180 |
|
$ |
(9,633) |
|
Fiscal Year Ended April 30, 2017 |
|
|
(8,607) |
|
|
(1,792) |
|
|
(819) |
|
|
1,367 |
|
|
(9,851) |
|
Fiscal Year Ended April 30, 2016 |
|
|
(8,633) |
|
|
(908) |
|
|
77 |
|
|
857 |
|
|
(8,607) |
|
(a) |
Charged to other accounts represents the net (increase) decrease for specifically reserved accounts, as well as the net change in reserves for sales discounts, service charges and sales returns. |
Valuation Allowance on Deferred Tax Assets Rollforward
|
|
|
Balance |
|
Additions |
|
|
|
Balance |
||||
|
|
|
at Beginning |
|
Charged to Costs |
|
|
|
at End of |
||||
|
|
|
of Period |
|
and Expenses |
|
Deductions |
|
Period |
||||
|
|
|
(in thousands) |
||||||||||
|
Fiscal Year Ended April 30, 2018 |
|
$ |
(297) |
|
$ |
(151) |
|
$ |
— |
|
$ |
(448) |
|
Fiscal Year Ended April 30, 2017 |
|
|
(83) |
|
|
(255) |
|
|
41 |
|
|
(297) |
|
Fiscal Year Ended April 30, 2016 |
|
|
(143) |
|
|
(38) |
|
|
98 |
|
|
(83) |
91
20. Selected Quarterly Financial Data (Unaudited)
The following table sets forth certain unaudited financial information for each quarter of the years ended April 30, 2018 and 2017. The unaudited quarterly information includes all adjustments (consisting of normal recurring adjustments) that, in the opinion of management, are necessary for the fair presentation of the information presented.
|
|
|
Year Ended April 30, 2018 |
||||||||||
|
|
|
First |
|
Second |
|
Third |
|
Fourth |
||||
|
|
|
Quarter |
|
Quarter |
|
Quarter |
|
Quarter |
||||
|
|
|
(in thousands, except per share data) |
||||||||||
|
Net sales |
|
$ |
642,157 |
|
$ |
648,004 |
|
$ |
585,508 |
|
$ |
635,800 |
|
Gross profit |
|
|
205,104 |
|
|
212,260 |
|
|
195,420 |
|
|
205,792 |
|
Net income(1) |
|
|
15,343 |
|
|
18,023 |
|
|
19,686 |
|
|
9,919 |
|
Per share data |
|
|
|
|
|
|
|
|
|
|
|
|
|
Weighted average shares outstanding(2): |
|
|
|
|
|
|
|
|
|
|
|
|
|
Basic |
|
|
40,971 |
|
|
41,006 |
|
|
41,036 |
|
|
41,048 |
|
Diluted |
|
|
42,128 |
|
|
42,146 |
|
|
42,228 |
|
|
42,151 |
|
Net income per share(2): |
|
|
|
|
|
|
|
|
|
|
|
|
|
Basic |
|
$ |
0.37 |
|
$ |
0.44 |
|
$ |
0.48 |
|
$ |
0.24 |
|
Diluted |
|
$ |
0.36 |
|
$ |
0.43 |
|
$ |
0.47 |
|
$ |
0.24 |
|
|
|
Year Ended April 30, 2017 |
||||||||||
|
|
|
First |
|
Second |
|
Third |
|
Fourth |
||||
|
|
|
Quarter |
|
Quarter |
|
Quarter |
|
Quarter |
||||
|
|
|
(in thousands, except per share data) |
||||||||||
|
Net sales |
|
$ |
549,800 |
|
$ |
591,846 |
|
$ |
562,523 |
|
$ |
614,977 |
|
Gross profit |
|
|
178,585 |
|
|
193,224 |
|
|
185,727 |
|
|
201,035 |
|
Net income |
|
|
9,163 |
|
|
17,224 |
|
|
8,226 |
|
|
14,273 |
|
Per share data |
|
|
|
|
|
|
|
|
|
|
|
|
|
Weighted average shares outstanding(2): |
|
|
|
|
|
|
|
|
|
|
|
|
|
Basic |
|
|
38,201 |
|
|
40,943 |
|
|
40,943 |
|
|
40,956 |
|
Diluted |
|
|
38,602 |
|
|
41,320 |
|
|
41,578 |
|
|
41,759 |
|
Net income per share(2): |
|
|
|
|
|
|
|
|
|
|
|
|
|
Basic |
|
$ |
0.24 |
|
$ |
0.42 |
|
$ |
0.20 |
|
$ |
0.35 |
|
Diluted |
|
$ |
0.24 |
|
$ |
0.42 |
|
$ |
0.20 |
|
$ |
0.33 |
|
(1) |
Net income for the third quarter of 2018 includes a $7.8 million provisional income tax benefit for the re-measurement of deferred tax assets and liabilities in connection with the Tax Act. Net income for the fourth quarter of 2018 includes a $5.1 million loss on change in fair value of financial instruments related to the Company’s foreign currency forward contract and a $1.1 million decrease to the provisional income tax benefit recorded during the third quarter of 2018. |
|
(2) |
Basic and diluted net income per share are computed independently for each of the quarters presented. Therefore, the sum of the quarterly basic and diluted net income per share amounts may not equal annual basic and diluted net income per share amounts. |
92
21. Subsequent Events
Acquisition of Titan
On June 1, 2018, we acquired all of the outstanding equity interests of WSB Titan (“Titan”), a distributer of drywall, lumber, commercial and residential building materials. Titan is Canada’s largest gypsum specialty distributer with 30 locations across five provinces in Canada. The aggregate purchase price was $627.0 million (subject to a working capital and certain other adjustments as set forth in the Securities Purchase Agreement). As part of the consideration, certain members of existing management converted $35.0 million of their ownership position in Titan into equity that is exchangeable for the Company’s stock. The purpose of the transaction is to extend the Company’s leadership position in North America with expanded scale and footprint, expand its geographic coverage into the Canadian market and create opportunities for product expansion in both the U.S. and Canada.
To finance this transaction, on June 1, 2018, the Company entered into a Third Amendment to its First Lien Credit Agreement (the “Third Amendment”) that provides for a new first lien term loan facility under the Credit Agreement in the aggregate principal amount of $996.8 million due in June 2025 that bears interest at a floating rate based on LIBOR plus 2.75%, representing a 25 basis point improvement compared to the interest rate of the existing first lien term loan facility under the Credit Agreement immediately prior to giving effect to the Third Amendment. The Company also drew down $143.0 million under its ABL facility. The net proceeds from the new first lien term loan facility, ABL facility and cash on hand were used to repay the Company’s existing first lien term loan facility of approximately $571.8 million under the Credit Agreement and to finance the Titan acquisition.
The assets acquired and liabilities assumed of Titan will be recognized at their acquisition date fair values. The allocation of the consideration transferred to the assets acquired and liabilities assumed of Titan (and the related estimated lives of depreciable tangible and identifiable intangible assets) will require a significant amount of judgment. As of the date of this filing, the accounting for the business combination was incomplete and a preliminary allocation of the consideration transferred could not be made due to complexities regarding the deferred tax liabilities. Such preliminary allocation of the purchase price is expected to be complete in the first quarter of fiscal year 2019 and will be determined taking into account analysis by an independent valuation firm.
If the Titan acquisition had occurred on May 1, 2017, the Company would have included net sales of Titan of $478.4 million for the year ended April 30, 2018 and net income of Titan of $11.9 million for the year ended April 30, 2018, resulting in pro forma net sales of $2,989.9 million and pro forma net income of $74.9 million for the year ended April 30, 2018.
Operating Lease Amendments
During the first quarter of fiscal year 2019, the Company amended certain of its operating lease agreements for equipment. The amendments resulted in the Company classifying these operating leases as capital leases as of the date of the modifications. As a result, the Company recorded $73.6 million of capital lease assets and capital lease liabilities in its Consolidated Balance Sheet during the first quarter of fiscal year 2019.
93
Item 9. Changes in and Disagreements With Accountants on Accounting and Financial Disclosure
None.
Item 9A. Controls and Procedures
Evaluation of Disclosure Controls and Procedures
The Company has established disclosure controls and procedures that are designed to ensure that information required to be disclosed in reports filed or submitted under the Securities Exchange Act of 1934, as amended (the "Exchange Act"), is recorded, processed, summarized and reported within the time periods specified in the rules and forms of the Securities and Exchange Commission and, as such, is accumulated and communicated to the Company's management, including our Chief Executive Officer and Chief Financial Officer, as appropriate to allow timely decisions regarding required disclosure. Management, together with our Chief Executive Officer and Chief Financial Officer, evaluated the effectiveness of the Company’s disclosure controls and procedures, as defined in Rule 13a-15(e) of the Exchange Act, as of April 30, 2018.
As disclosed in the Company’s Annual Report on Form 10-K for the fiscal year ended April 30, 2017, the Company had ineffective information technology, or IT, general computer controls and a lack of effective formal accounting policies, procedures, and controls that constituted material weaknesses. These material weaknesses contributed to certain immaterial revisions of previously issued Consolidated Financial Statements for the years ended April 30, 2016 and 2015 and previously resulted in material adjustments to correct the consolidated financial statements of our wholly owned subsidiary, GYP Holdings III Corp., that were issued for fiscal 2013 and 2014. These weaknesses could have resulted in material misstatements to our annual and interim consolidated financial statements that would not be prevented or detected.
As of the end of the period covered by this report, our management evaluated, with the participation of our Chief Executive Officer and Chief Financial Officer, the remediation efforts related to the material weaknesses previously noted along with the effectiveness of our disclosure controls and procedures. Based on this evaluation, our Chief Executive Officer and Chief Financial Officer concluded that, as of the end of the period covered by this report, our disclosure controls and procedures were effective to provide reasonable assurance that the objectives of disclosure controls and procedures are met.
Management’s Report on Internal Control over Financial Reporting
The Company’s management is responsible for establishing and maintaining adequate internal control over financial reporting, as such term is defined in Exchange Act Rules 13a-15(f) and 15d-15(f). Internal control over financial reporting is a process designed to provide reasonable assurance regarding the reliability of financial reporting and the preparation of financial statements for external purposes in accordance with generally accepted accounting principles.
Because of its inherent limitations, internal control over financial reporting may not prevent or detect misstatements. Also, projections of any evaluation of effectiveness to future periods are subject to the risk that controls may become inadequate because of changes in conditions, or that the degree of compliance with the policies or procedures may deteriorate.
Under the supervision and with the participation of our management, including the Chief Executive Officer and Chief Financial Officer, we conducted an evaluation of the effectiveness of our internal control over financial reporting as of April 30, 2018 based upon “Internal Control—Integrated Framework” (2013) issued by the Committee of Sponsoring Organizations of the Treadway Commission (“COSO”).
Based on criteria described in “Internal Control—Integrated Framework” (2013) issued by COSO, our management concluded that our internal control over financial reporting was effective as of April 30, 2018.
The effectiveness of the Company’s internal control over financial reporting as of April 30, 2018 has been audited by the Company’s independent registered public accounting firm, as stated in their report which is included herein.
94
Remediation of Previously Identified Material Weaknesses
In our annual report on Form 10-K for the year ended April 30, 2017, management concluded that internal control over financial reporting was not effective because of material weaknesses in our internal control over financial reporting.
Previously identified material weaknesses that have been remediated as of April 30, 2018 included ineffective IT general computer controls and a lack of effective formal accounting policies, procedures, and controls. These material weaknesses contributed to certain immaterial revisions of previously issued consolidated financial statements for the years ended April 30, 2016 and 2015 and previously resulted in material adjustments to correct the consolidated financial statements of our wholly owned subsidiary, GYP Holdings III Corp., that were issued for fiscal 2013 and 2014. These weaknesses could have resulted in material misstatements to our annual and interim consolidated financial statements that would not be prevented or detected.
As of April 30, 2018, management sufficiently completed its remediation of these two material weaknesses. This remediation consisted of the following:
To address the material weakness associated with ineffective IT general computer controls, management:
|
· |
Developed and implemented policies and procedures related to the management and approval of changes in our IT environment, including procedures to review changes in IT data and the configuration of systems. |
|
· |
Developed and implemented policies and procedures related to security access, including policies and procedures to set up or remove users to our IT systems. |
|
· |
Established policies and procedures for the performance of security access reviews of our key financial systems' users to ensure the appropriateness of their roles and security access levels. These access reviews will be performed on a periodic basis. |
|
· |
Increased IT resources, including the hiring of a Chief Information Officer with public company experience, and the engagement of third party resources with expertise in IT general controls. |
|
· |
Developed and implemented monitoring activities designed to mitigate lack of segregation of duties in IT development and production roles. These monitoring activities include a review of application and database change logs. |
|
· |
Performed testing related to the functioning of these controls, and continue to monitor these controls and make enhancements as needed. |
To address the material weakness in our accounting policies, procedures, and controls, we completed the following measures to ensure that our accounting policies, procedures, and controls are designed and operating sufficiently to prevent and detect misstatements:
|
· |
Developed and implemented formal accounting policies, procedures, and controls, including those designed to evaluate the impact of accounting pronouncements. |
|
· |
Provided training to our accounting organization in order to enhance the level of communication related to the understanding of internal controls. |
|
· |
Established a disclosure committee designed to strengthen the effectiveness of our disclosure controls and evaluate whether our financial statements and public filings include the appropriate disclosures. |
|
· |
Developed and implemented standardized checklists and working papers to ensure our accounting in complex areas is correct, and that review controls are designed and operating effectively. These areas include, but are not limited to, tax accounting, cash flows and acquisitions accounting. |
95
Changes in Internal Control Over Financial Reporting
Other than completing the remediation of the two previously identified material weaknesses as disclosed above, there were no changes in our internal control over financial reporting (as defined in the Exchange Act Rules 13a-15(f) and 15d-15(f)) that occurred during the three months ended April 30, 2018 that have materially affected, or are reasonably likely to materially affect, our internal control over financial reporting.
None.
Item 10. Directors, Executive Officers and Corporate Governance
The information required by this Item will be set forth in the Company’s Proxy Statement for the 2018 Annual Meeting of Stockholders, which information is hereby incorporated herein by reference.
Item 11. Executive Compensation
The information required by this Item will be set forth in the Company’s Proxy Statement for the 2018 Annual Meeting of Stockholders in the sections titled “Executive Compensation,” which information is hereby incorporated herein by reference.
Item 12. Security Ownership of Certain Beneficial Owners and Management and Related Stockholder Matters
Security Ownership of Certain Beneficial Owners and Management
The information regarding security ownership of certain beneficial owners and management of our voting securities will be set forth in the Company’s Proxy Statement for the 2018 Annual Meeting of Stockholders in the section titled “Security Ownership of Certain Beneficial Owners and Management,” which information is hereby incorporated herein by reference.
Securities Authorized for Issuance Under Equity Compensation Plans
The following table sets forth information as of April 30, 2018 concerning the shares of our common stock which are authorized for issuance under our equity compensation plans:
|
|
|
|
|
|
|
|
(c) |
|
|
|
|
|
|
|
|
Number of securities |
|
|
|
|
|
|
|
|
remaining available for |
|
|
|
(a) |
|
(b) |
|
future issuance under |
|
|
|
|
Number of securities to |
|
Weighted-average |
|
equity compensation |
|
|
|
|
be issued upon exercise |
|
exercise price of |
|
plans (excluding |
|
|
|
|
of outstanding options, |
|
outstanding options, |
|
securities reflected |
|
|
Plan Category |
|
warrants, and rights |
|
warrants and rights |
|
in column (a)) |
|
|
Equity compensation plans approved by security holders |
|
1,974,021 |
(1) |
$ |
14.37 |
(2) |
2,414,484 |
|
Equity compensation plans not approved by security holders |
|
— |
|
|
— |
|
— |
|
Total |
|
1,974,021 |
|
$ |
14.37 |
|
2,414,484 |
|
(1) |
Includes 1,952,255 shares of Common Stock issuable upon exercise of outstanding stock options and 21,766 shares of Common Stock issuable upon vesting of outstanding restricted stock units. |
|
(2) |
The weighted-average exercise price does not take into account the restricted stock units described in footnote (1) because the restricted stock units do not have an exercise price upon vesting. |
96
Item 13. Certain Relationships and Related Party Transactions and Director Independence
The information required by this Item will be set forth in the Company’s Proxy Statement for the 2018 Annual Meeting of Stockholders in the sections titled “Board of Directors’ Independence” and “Transactions with Related Persons,” which information is hereby incorporated herein by reference.
Item 14. Principal Accountant Fees and Services
The information required by this Item will be set forth in the Company’s Proxy Statement for the 2018 Annual Meeting of Stockholders in the section titled “Independent Registered Public Accounting Firm Fees and Services,” which information is hereby incorporated herein by reference.
Item 15. Exhibits and Financial Statements Schedules
(a) Documents filed as part of this Annual Report on Form 10-K
|
(1) |
Financial Statements |
|
· |
Reports of Independent Registered Public Accounting Firms |
|
· |
Consolidated Balance Sheets as of April 30, 2018 and 2017 |
|
· |
Consolidated Statements of Operations and Comprehensive Income for the years ended April 30, 2018, 2017 and 2016 |
|
· |
Consolidated Statements of Stockholders’ Equity for the years ended April 30, 2018, 2017 and 2016 |
|
· |
Consolidated Statements of Cash Flows for the years ended April 30, 2018, 2017 and 2016 |
|
· |
Notes to Consolidated Financial Statements |
|
(2) |
Financial Statement Schedules |
The Financial Statement Schedule(s) described in Regulation S-X are omitted from this Annual Report on Form 10-K because they are either not required under the related instructions or the information is otherwise included in the consolidated financial statements.
|
(3) |
Listing of Exhibits |
EXHIBIT INDEX
|
Exhibit No. |
|
Exhibit Description |
| 2.1 |
|
|
| 3.1 |
|
|
| 3.2 |
|
|
| 4.1 |
|
|
| 10.1 |
|
97
| 10.2 |
|
|
| 10.3 |
|
|
|
10.3.1 |
|
|
|
10.3.2 |
|
|
| 10.4 |
|
|
| 10.5 |
|
|
|
10.5.1 |
|
|
|
10.5.2 |
|
|
| 10.6 |
|
|
|
10.6.1 |
|
|
|
10.6.2 |
|
|
|
10.6.3 |
|
|
| 10.7 |
|
98
| 10.8 |
|
|
| 10.9 |
|
|
|
10.10† |
|
|
|
10.10.1† |
|
|
|
10.11† |
|
|
|
10.12† |
|
|
|
10.13† |
|
|
|
10.14† |
|
|
|
10.15† |
|
|
|
10.16† |
||
|
10.17† |
||
|
10.18† |
||
|
10.19† |
||
|
10.20† |
|
|
|
10.21† |
|
|
|
10.22† |
|
|
| 10.23 |
|
|
| 10.24 |
|
|
|
21.1* |
|
|
|
23.1* |
|
Consent of Ernst & Young LLP, independent registered public accounting firm. |
|
23.2* |
|
Consent of PricewaterhouseCoopers LLP, independent registered public accounting firm. |
99
|
24.1* |
|
Power of Attorney (included on signature page hereto). |
|
31.1* |
|
|
|
31.2* |
|
|
|
32.1* |
|
|
|
32.2* |
|
|
|
101 INS* |
|
XBRL Instance Document. |
|
101 SCH* |
|
XBRL Taxonomy Extension Schema Document. |
|
101 CAL* |
|
XBRL Taxonomy Extension Calculation Linkbase Document. |
|
101 DEF* |
|
XBRL Taxonomy Extension Definition Linkbase Document. |
|
101 LAB* |
|
XBRL Taxonomy Extension Label Linkbase Document. |
|
101 PRE* |
|
XBRL Taxonomy Extension Presentation Linkbase Document. |
†Indicates a management contract or compensatory plan or arrangement.
*Filed herewith.
Not applicable.
100
SIGNATURES
Pursuant to the requirements of Section 13 or 15(d) of the Securities Exchange Act of 1934, the registrant has duly caused this Annual Report on Form 10‑K to be signed on its behalf by the undersigned, thereunto duly authorized.
|
|
GMS INC. |
|
|
Date: June 28, 2018 |
By: |
/s/ G. Michael Callahan, Jr. |
|
|
|
|
|
|
|
G. Michael Callahan, Jr. |
|
|
|
President, Chief Executive Officer and Director |
|
|
|
(Principal Executive Officer) |
POWER OF ATTORNEY
KNOW ALL PERSONS BY THESE PRESENTS, that each person whose signature appears below constitutes and appoints G. Michael Callahan, Jr. and H. Douglas Goforth, jointly and severally, his attorney‑in‑fact, with the power of substitution, for him in any and all capacities, to sign any amendments to this Annual Report on Form 10‑K and to file the same, with exhibits thereto and other documents in connection therewith, with the Securities and Exchange Commission, hereby ratifying and confirming all that each of said attorneys‑in‑fact, or his substitute or substitutes, may do or cause to be done by virtue hereof.
Pursuant to the requirements of the Securities Exchange Act of 1934, this Annual Report on Form 10‑K has been signed by the following persons on behalf of the registrant and in the capacities and on the dates indicated.
|
Signature |
|
Title |
|
Date |
|
/s/ G. MICHAEL CALLAHAN, JR. |
|
President, Chief Executive Officer and Director |
|
June 28, 2018 |
|
G. Michael Callahan, Jr. |
|
(Principal Executive Officer) |
|
|
|
|
|
|
|
|
|
/s/ H. DOUGLAS GOFORTH |
|
Chief Financial Officer (Principal Financial Officer) |
|
June 28, 2018 |
|
H. Douglas Goforth |
|
|
|
|
|
|
|
|
|
|
|
/s/ LYNN ROSS |
|
Corporate Controller and Chief Accounting Officer |
|
June 28, 2018 |
|
Lynn Ross |
|
(Principal Accounting Officer) |
|
|
|
|
|
|
|
|
|
/s/ RICHARD K. MUELLER |
|
Chairman of the Board |
|
June 28, 2018 |
|
Richard K. Mueller |
|
|
|
|
|
|
|
|
|
|
|
/s/ PETER C. BROWNING |
|
Director |
|
June 28, 2018 |
|
Peter C. Browning |
|
|
|
|
|
|
|
|
|
|
|
/s/ JOHN J. GAVIN |
|
Director |
|
June 28, 2018 |
|
John J. Gavin |
|
|
|
|
|
|
|
|
|
|
|
/s/ THERON I. GILLIAM |
|
Director |
|
June 28, 2018 |
|
Theron I. Gilliam |
|
|
|
|
|
|
|
|
|
|
|
/s/ BRIAN R. HOESTEREY |
|
Director |
|
June 28, 2018 |
|
Brian R. Hoesterey |
|
|
|
|
|
|
|
|
|
|
|
/s/ RONALD R. ROSS |
|
Director |
|
June 28, 2018 |
|
Ronald R. Ross |
|
|
|
|
|
|
|
|
|
|
|
/s/ J. LOUIS SHARPE |
|
Director |
|
June 28, 2018 |
|
J. Louis Sharpe |
|
|
|
|
|
|
|
|
|
|
|
/s/ J. DAVID SMITH |
|
Director |
|
June 28, 2018 |
|
J. David Smith |
|
|
|
|
101